Center for Effective Global Action University of California, Berkeley Module 2.1: Causal Inference Contents 1. Introduction ........................................................................................................................... 2 2. Causal Inference and Impact Evaluation.................................................................................. 2 2.1 Counterfactual Analysis ............................................................................................................. 3 2.2 Not All Associations Are Causal ................................................................................................. 3 2.3 Approaches to Causal Inference in Impact Evaluation .............................................................. 5 2.4 Selection Bias............................................................................................................................. 5 3. Bibliography/Further Readings ............................................................................................... 7

Welcome message from author
This document is posted to help you gain knowledge. Please leave a comment to let me know what you think about it! Share it to your friends and learn new things together.
Transcript

Center for Effective Global Action University of California, Berkeley
Module 2.1: Causal Inference
Contents 1. Introduction ........................................................................................................................... 2
2. Causal Inference and Impact Evaluation .................................................................................. 2
2.1 Counterfactual Analysis ............................................................................................................. 3
2.2 Not All Associations Are Causal ................................................................................................. 3
2.3 Approaches to Causal Inference in Impact Evaluation .............................................................. 5
2.4 Selection Bias ............................................................................................................................. 5
3. Bibliography/Further Readings ............................................................................................... 7
Learning Guide: Causal Inference
Center for Effective Global Action University of California, Berkeley
Page | 2
1. INTRODUCTION
In the previous section, we reviewed some concepts relevant to empirical research. In section 2, we
will learn about the application of methods specific to evaluating impacts of a policy, program,
project, or any other form of intervention. But before we get into the specific methods and
econometric strategies that are commonly used to conduct impact evaluations, we need to go
through the background as to why these techniques are used.
In the next modules, we will train you in the implementation and analysis of different experimental
and quasi-experimental techniques to conduct rigorous impact evaluations. These different methods
will vary in how much we are able to control for selection bias, with a Randomized Control Trial
(RCT) being referred to as the “Gold Standard”, followed by quasi-experimental designs such as
Regression Discontinuity, Instrumental Variables, and Difference-in-Differences.
Before getting into the different impact evaluation methodologies, we should discuss two concepts
that are integral to the process of conducting accurate and reliable evaluations—Causal Inference
and Counterfactual Analysis. Thus, in this module, we will disentangle correlation with causation,
discuss selection bias that occurs when people can “self-select” into receiving/participating in a
program, and provide a simple theoretical framework to understand how counterfactual analysis
(and randomization) can eliminate these biases leading us to an accurate and reliable evaluation of
an intervention.
At the end of this module, you should be able to:
Understand what a counterfactual analysis is
Understand what selection bias and confounding mean
Understand what randomization buys us when conducting an impact evaluation
2. CAUSAL INFERENCE AND IMPACT EVALUATION
Causal inference and impact evaluation is all about attributing a change in an outcome of interest to
participation in the intervention that we want to study. Throughout this module, we use the terms
‘intervention’ and ‘treatment’ to mean the program, policy, project, product, marketing strategy,
advertisement campaign and other such intervention being studied. Therefore, we are interested in
proving the causal effects of interventions of outcomes of interest.
What is a cause of an event? Put simply, it is an event or intervention without which the outcome
would not have occurred. Outcomes follow from causes, and causes always precede outcomes.
However, many outcomes or impacts can be caused by multiple factors. For example, diarrhea can
be caused by ingesting pathogens through food or water. Would you prevent diarrhea entirely if
everyone in the population is given 100% pathogen-free water? No, because some people might still
get diarrhea from ingesting contaminated food! Nevertheless, treating individuals with pathogen-
free water might “cause” the population level of diarrhea (that is, the percent of people reporting
Learning Guide: Causal Inference
Center for Effective Global Action University of California, Berkeley
Page | 3
diarrhea, or the severity of their diarrhea, or both) to decline. How can we measure such a causal
effect or impact? We evaluate impacts or prove causal effects by answering the counterfactual:
Contrary to the actual state of the world, what would have happened in the absence of the
intervention?
2.1 Counterfactual Analysis
To understand counterfactual analysis, imagine the following theoretical experiment. Imagine that
we were able to create two parallel and identical universes which are exact replicas of each other in
all conceivable terms. Now, imagine that Universe 1 experiences the following intervention: every
member of the population receives and drinks only pathogen-free water.
The population in Universe 2, on the other hand, experiences no intervention, so they keep drinking
the same water as before (sometimes contaminated and sometimes not). After three years we
examine at the two universes and find that Universe 1 has 500 sick people whereas Universe 2 has
1200 sick people. What can explain this difference? Is there anything different between these two
universes except the pathogen-free water treatment? If not, then we can say with confidence that it
must be the clean water treatment that reduced the number of sick people in Universe 1. In our
imagined experiment, then, clean water saved at least (1200 – 500 =) 700 people from becoming
sick!
In the real world, it is impossible for us to create two parallel universes or populations, so our aim is
to create two groups which are highly similar to each other. A central feature of this ideal
experimental setting is that participants cannot select which of the two groups they are part of. If
we succeed in creating two such groups, then we can assign one group to receive a treatment. After
waiting a sufficient amount of time, we can compare these two groups to see if they are different in
terms of an outcome of interest. If they are, then the difference is the “impact” or the “causal
effect” caused by the treatment.
2.2 Not All Associations Are Causal
Correlation is a measure of the similarity between two variables, perhaps in how they vary together
in the same or opposite directions over time. In the previous two modules, we reviewed
multivariate regression analysis. The coefficients of a multivariate regression model describe how
the dependent variable varies for a unit change in a given predictor variable while all other variables
are held constant at their mean value (the ceteris paribus effect). Regression models provide the
“best linear approximation” of a complex system to help us infer associations under certain
assumptions.
However, an association identified in a statistical analysis is not guaranteed to be causal, regardless
of its strength (in magnitude or statistical significance). Consider the following hypothetical example.
Most people who smoked heavily in 1950s had a lighter or matchbox with them at all times; indeed,
a statistician observed that the correlation coefficient – which is a measure of correlation between 0
and 1 – was almost 0.98, suggesting a very strong correlation. Many doctors were very curious
about significantly higher lung cancer among a particular group of people – those who always carried

Learning Guide: Causal Inference
Center for Effective Global Action University of California, Berkeley
Page | 4
a matchbox or lighter in their person. Being smokers themselves, the doctors were hesitant to
believe that these cancers were caused by smoking itself, so they commissioned a study and found
that 70% of lung cancer patients always carried a matchbox or lighter. Regression analysis and t-
tests confirmed this very strong association. It is clear, of course, that these hypothetical doctors
were incorrect; –heavy smoking, not matchboxes, increases the chance of getting lung cancer. Why
would the doctors get this “causality” wrong?
Consider the following diagram:
The observed association between matchboxes and lung cancer was confounded by heavy smoking.
A confounder is a factor that is correlated with both the intervention and the outcome. In above
hypothetical example, if the doctors had conducted a study in which they gave matchboxes or
lighters to people who do not smoke, they would have found that there was no persistent
association between matchbox and lung cancer. There are many such examples of confounders. For
example, increased sale of antibacterial handwashing soap occurring simultaneously with an
advertisement campaign may be confounded by media coverage of a pandemic, and the correlation
between high-quality MBA degrees high salaries is confounded by the high intellect and experience
of the students who were accepted to the programs in the first place. It is important to note that
confounders do not necessarily eliminate the causal effect (if any) between the intervention under
study and the outcome but they make the estimation of those causal effects difficult for researchers
to isolate and quantify.
Studies can also be complicated by the presence of effect modifiers. These are factors that change
the strength of causal effects. For example, the probability of lung cancer will be higher for heavy
smokers who are also exposed to asbestos than for other heavy smokers.
Often we can measure confounder and effect modifiers and study their effect on the causal effects
of the treatments of interest. Such analysis can help us gain deeper understanding of the causal
relationship between the intervention and outcomes. However, unobservable or unmeasured /
unmeasurable factors can confound or moderate the causal relationship. In the setting of regression
analysis, these are called omitted variables. For example, innate health endowments cannot be
easily measured (or even quantified), but can determine whether (and how often) a person becomes
Match
box and
lighters
Lung
Cancer
Heavy Smoking

Learning Guide: Causal Inference
Center for Effective Global Action University of California, Berkeley
Page | 5
ill. The following section introduces theoretical approaches that allow us to infer causality despite
the frequent presence of omitted variables.
2.3 Approaches to Causal Inference in Impact Evaluation
In impact evaluation, there are two broad approaches to providing causality for causal claims:
the traditional structural equations approach (Haavelmo 1943, Heckman 2005); and
the modern potential outcomes framework or experimental approach, also known as the
Neyman-Rubin-Holland potential outcome model (Rubin 1974, Holland 1986 and Neyman
1923).
We use the potential outcomes framework approach in this class, though we will return to a
discussion of the merits of the structural equations approach in later modules. This framework is
most easily understood in the context of randomized experiments but can be applied in non- and
quasi-experimental observational data as well. Let’s go back to the theoretical experiment
presented in Section 2.1. In order to prove causality, we should observe the “same” (or similar)
individual in the treatment group and in the control group at some time after the treatment, and the
difference in outcomes between the treatment and control is understood to be the impact of the
treatment. This example provides an archetype of the potential outcome framework: the difference
in two “potential” outcomes conditional on some event is taken to be the causal impact of the
treatment. Since we cannot observe the outcome of interest for the treatment group as if they
hadn’t had a treatment (that is, in the counterfactual scenario), we are faced with a “missing data
problem”.
There are many strategies for finding the best possible replacement for the missing counterfactual
data. We have already discussed why randomized assignment is the best way to find such a
replacement: the measured and unmeasured confounders, covariates, and effect modifiers remain
balanced between the two groups being compared (in expectation), making them exchangeable.
However, the framework does not rule out non-randomized observational data, as long as we can
construct a counterfactual group or “replacement for missing data” that is plausibly “exchangeable”
with the treatment group. In practice, this is generally done by some sort of matching between the
treatment and control groups on observed data and assessing/discussing the effect of unobserved
confounders.
Keep in mind that no amount of good analysis can helps us resolve problems of poor data. In
randomized experiments, we may have a grossly imbalanced (poorly exchangeable) grouping, biased
measurement of outcomes in the treatment and control groups, and severe measurement errors.
No statistical design is a substitute for good quality of data and field work to generate such data.
2.4 Selection Bias
We have established that causal effect estimates are obtained by comparing outcome in a treatment
group to outcomes in the same group without that treatment. We further established that the
missing data problem forces us to find the best replacement for this impossible-to-collect data.
Learning Guide: Causal Inference
Center for Effective Global Action University of California, Berkeley
Page | 6
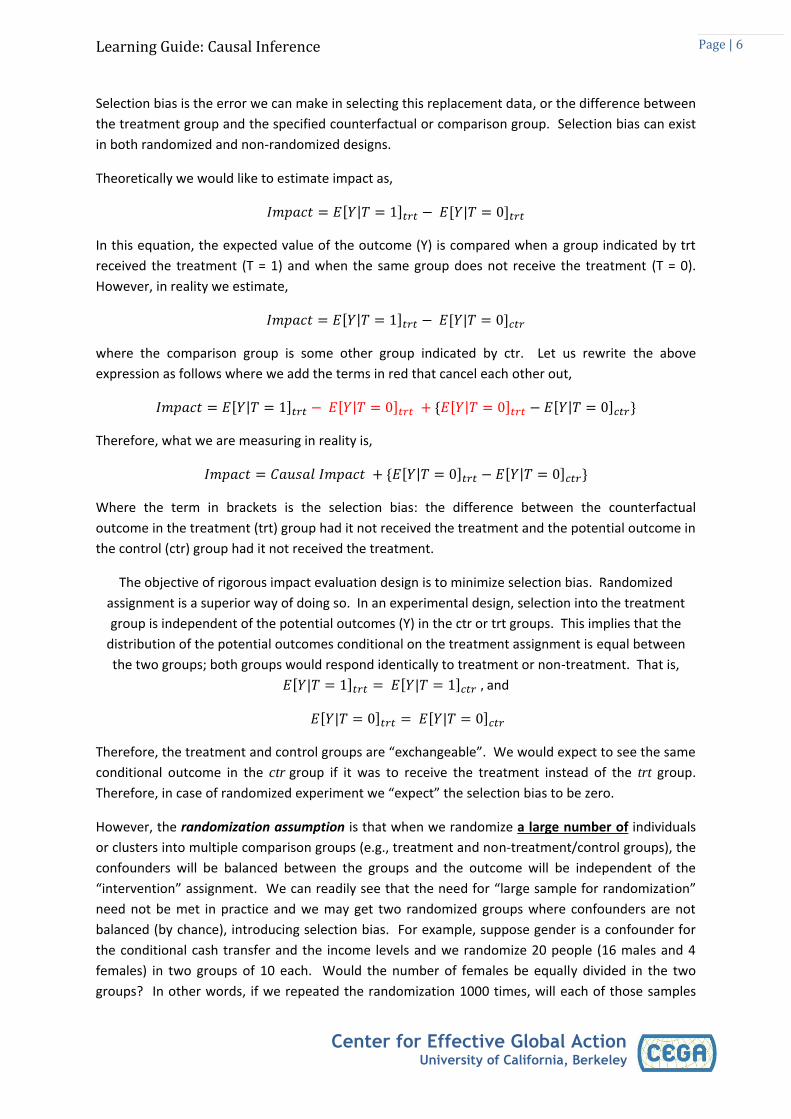
Selection bias is the error we can make in selecting this replacement data, or the difference between
the treatment group and the specified counterfactual or comparison group. Selection bias can exist
in both randomized and non-randomized designs.
Theoretically we would like to estimate impact as,
𝐼𝑚𝑝𝑎𝑐𝑡 = 𝐸[𝑌|𝑇 = 1]𝑡𝑟𝑡 − 𝐸[𝑌|𝑇 = 0]𝑡𝑟𝑡
In this equation, the expected value of the outcome (Y) is compared when a group indicated by trt
received the treatment (T = 1) and when the same group does not receive the treatment (T = 0).
However, in reality we estimate,
𝐼𝑚𝑝𝑎𝑐𝑡 = 𝐸[𝑌|𝑇 = 1]𝑡𝑟𝑡 − 𝐸[𝑌|𝑇 = 0]𝑐𝑡𝑟
where the comparison group is some other group indicated by ctr. Let us rewrite the above
expression as follows where we add the terms in red that cancel each other out,
𝐼𝑚𝑝𝑎𝑐𝑡 = 𝐸[𝑌|𝑇 = 1]𝑡𝑟𝑡 − 𝐸[𝑌|𝑇 = 0]𝑡𝑟𝑡 + {𝐸[𝑌|𝑇 = 0]𝑡𝑟𝑡 − 𝐸[𝑌|𝑇 = 0]𝑐𝑡𝑟}
Therefore, what we are measuring in reality is,
𝐼𝑚𝑝𝑎𝑐𝑡 = 𝐶𝑎𝑢𝑠𝑎𝑙 𝐼𝑚𝑝𝑎𝑐𝑡 + {𝐸[𝑌|𝑇 = 0]𝑡𝑟𝑡 − 𝐸[𝑌|𝑇 = 0]𝑐𝑡𝑟}
Where the term in brackets is the selection bias: the difference between the counterfactual
outcome in the treatment (trt) group had it not received the treatment and the potential outcome in
the control (ctr) group had it not received the treatment.
The objective of rigorous impact evaluation design is to minimize selection bias. Randomized
assignment is a superior way of doing so. In an experimental design, selection into the treatment
group is independent of the potential outcomes (Y) in the ctr or trt groups. This implies that the
distribution of the potential outcomes conditional on the treatment assignment is equal between
the two groups; both groups would respond identically to treatment or non-treatment. That is,
𝐸[𝑌|𝑇 = 1]𝑡𝑟𝑡 = 𝐸[𝑌|𝑇 = 1]𝑐𝑡𝑟 , and
𝐸[𝑌|𝑇 = 0]𝑡𝑟𝑡 = 𝐸[𝑌|𝑇 = 0]𝑐𝑡𝑟
Therefore, the treatment and control groups are “exchangeable”. We would expect to see the same
conditional outcome in the ctr group if it was to receive the treatment instead of the trt group.
Therefore, in case of randomized experiment we “expect” the selection bias to be zero.
However, the randomization assumption is that when we randomize a large number of individuals
or clusters into multiple comparison groups (e.g., treatment and non-treatment/control groups), the
confounders will be balanced between the groups and the outcome will be independent of the
“intervention” assignment. We can readily see that the need for “large sample for randomization”
need not be met in practice and we may get two randomized groups where confounders are not
balanced (by chance), introducing selection bias. For example, suppose gender is a confounder for
the conditional cash transfer and the income levels and we randomize 20 people (16 males and 4
females) in two groups of 10 each. Would the number of females be equally divided in the two
groups? In other words, if we repeated the randomization 1000 times, will each of those samples
Learning Guide: Causal Inference
Center for Effective Global Action University of California, Berkeley
Page | 7
assign 2 females in treatment and 2 in control groups? The answer is no; in fact, only about 37% of
the time would there be two females in each group (you can calculate this this using combinations
and probability theory). The likelihood of achieving balance will increase as the sample size
increases, and as the sample size approaches infinity the balance approaches perfection.
Furthermore, randomization can itself be biased because of computer error or other mistakes.
Therefore, with randomized or experimental designs you must worry about sample size and whether
you have randomized correctly while implementing the study.
How can we deal with the selection bias in non-randomized designs? If we can quantify the
selection bias, then we can subtract this bias from the measured effect to get the true causal effect.
Structural estimation offers one set of methods for quantifying selection bias, but we will focus on
‘reduced-form’ approaches in this class. We should identify potential confounders and effect
modifiers. Then, we should check which of these are actually measured in the data we have
(secondary data) or will have (primary data). We can then assess how these measurements balance
between the treatment and control groups “before” the intervention and quantify the selection bias.
Note, however, that we will not be able to test for the balance in unmeasurable or unmeasured
factors.
3. BIBLIOGRAPHY/FURTHER READINGS
1. Gertler, Paul J., Sebastian Martinez, Patrick Premand, Laura B. Rawlings, and Christel MJ
Vermeersch. “Impact evaluation in practice.” World Bank Publications, 2011.
2. Haavelmo, Trygve. "The statistical implications of a system of simultaneous equations." Econometrica, Journal of the Econometric Society (1943): 1-12.
3. Heckman, James J., and Edward Vytlacil. "Structural equations, treatment effects, and econometric policy evaluation." Econometrica 73.3 (2005): 669-738.
4. Holland, Paul W. "Statistics and causal inference." Journal of the American Statistical Association 81.396 (1986): 945-960.
5. Neyman, J. (1934). On the two different aspects of the representative method: The method of stratified sampling and the method of purposive selection. J. Roy. Statist. Soc. Ser. A 97 558-606
6. Rubin, Donald B. "Estimating causal effects of treatments in randomized and nonrandomized studies." Journal of Educational Psychology 66.5 (1974): 688.
Related Documents