MODELLING OF SOIL EROSION MODELLING OF SOIL EROSION Purpose Purpose • research tool research tool • sensitivity analysis during sensitivity analysis during planning planning • design of engineering works design of engineering works USLE USLE Developed from 15,000 plot years in Developed from 15,000 plot years in USA: USA: Standardised plots : 9% slope, 72.6 Standardised plots : 9% slope, 72.6 ft long ft long A = R K L S C P A = R K L S C P [A is mean annual soil loss in [A is mean annual soil loss in t/ac/yr] t/ac/yr]

MODELLING OF SOIL EROSION Purpose research toolresearch tool sensitivity analysis during planningsensitivity analysis during planning design of engineering.
Dec 26, 2015
Welcome message from author
This document is posted to help you gain knowledge. Please leave a comment to let me know what you think about it! Share it to your friends and learn new things together.
Transcript
MODELLING OF SOIL EROSIONMODELLING OF SOIL EROSION
PurposePurpose• research toolresearch tool• sensitivity analysis during planningsensitivity analysis during planning• design of engineering worksdesign of engineering works
USLEUSLEDeveloped from 15,000 plot years in USA:Developed from 15,000 plot years in USA:Standardised plots : 9% slope, 72.6 ft longStandardised plots : 9% slope, 72.6 ft longA = R K L S C PA = R K L S C P[A is mean annual soil loss in t/ac/yr][A is mean annual soil loss in t/ac/yr]
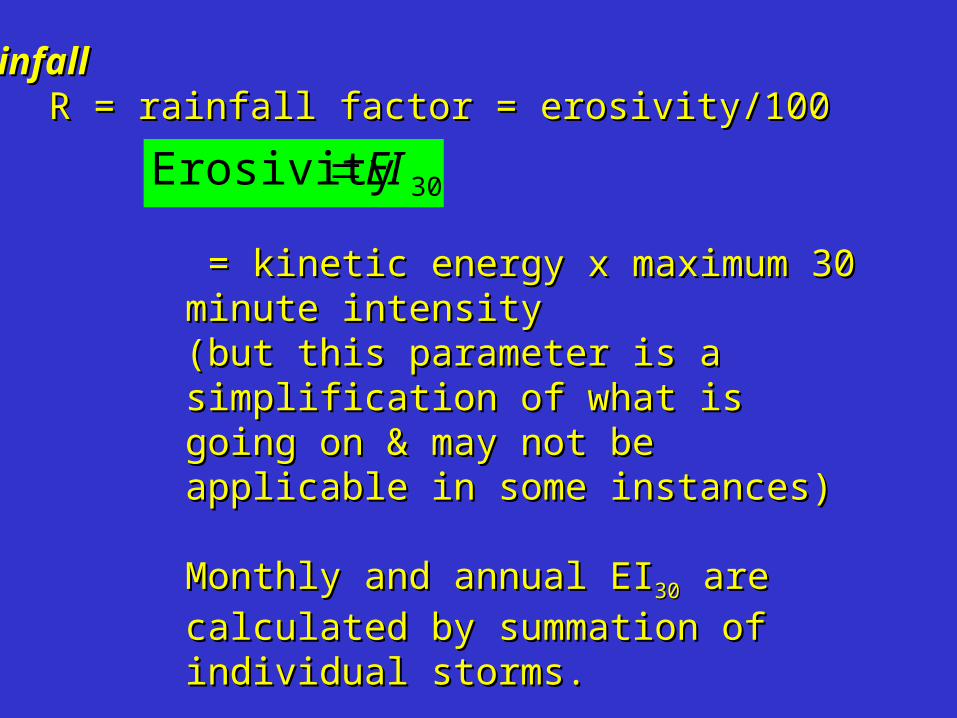
RainfallRainfallR = rainfall factor = erosivity/100R = rainfall factor = erosivity/100
30Erosivity EI
= kinetic energy x maximum 30 = kinetic energy x maximum 30 minute intensityminute intensity(but this parameter is a (but this parameter is a simplification of what is going on & simplification of what is going on & may not be applicable in some may not be applicable in some instances)instances)
Monthly and annual EIMonthly and annual EI3030 are are calculated by summation of calculated by summation of individual storms. individual storms.
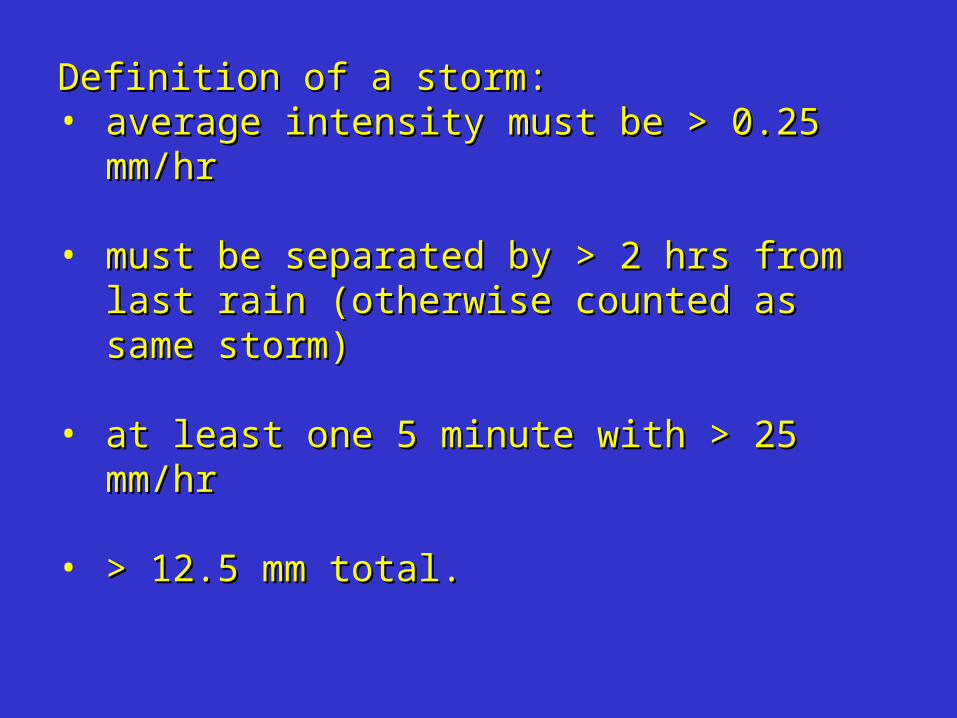
Definition of a storm: Definition of a storm: • average intensity must be > 0.25 mm/hraverage intensity must be > 0.25 mm/hr
• must be separated by > 2 hrs from last must be separated by > 2 hrs from last rain (otherwise counted as same storm)rain (otherwise counted as same storm)
• at least one 5 minute with > 25 mm/hrat least one 5 minute with > 25 mm/hr
• > 12.5 mm total.> 12.5 mm total.

To calculate EITo calculate EI3030 from first principles, drop from first principles, drop size distribution. v. intensity required. size distribution. v. intensity required. Therefore, equations such as the following Therefore, equations such as the following have been derived to eliminate need for drop have been derived to eliminate need for drop size - assumes relationship between drop size size - assumes relationship between drop size and intensity:and intensity:
1958] Smith, &r Wischmeie-[for USA )/(J/m log73.887.11 210 mmIE
1965] Hudson, - bwe[for Zimba )/(J/m /5.1278.29 2 mmIE
Note these are per mm of rain.Note these are per mm of rain.For a whole year sum EIFor a whole year sum EI3030 for each storm. for each storm.
logarithmic relationship -logarithmic relationship -
reciprocal relationshipreciprocal relationship
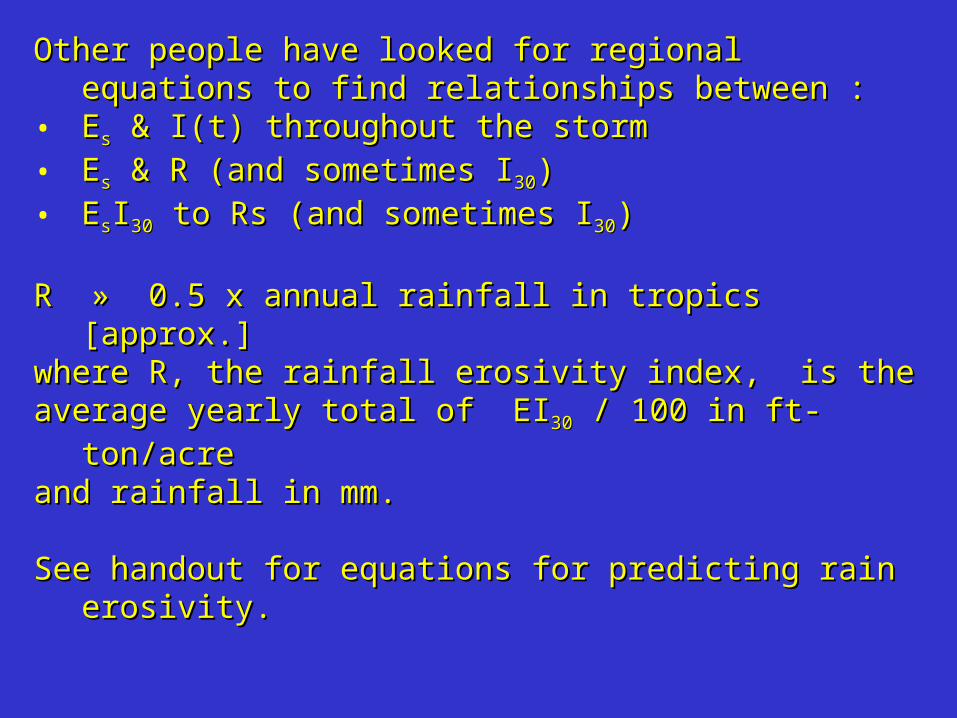
Other people have looked for regional equations to Other people have looked for regional equations to find relationships between :find relationships between :
• EEss & I(t) throughout the storm & I(t) throughout the storm• EEss & R (and sometimes I & R (and sometimes I3030))• EEssII3030 to Rs (and sometimes I to Rs (and sometimes I3030))
R » 0.5 x annual rainfall in tropics [approx.] R » 0.5 x annual rainfall in tropics [approx.] where R, the rainfall erosivity index, is thewhere R, the rainfall erosivity index, is theaverage yearly total of EIaverage yearly total of EI3030 / 100 in ft-ton/acre / 100 in ft-ton/acreand rainfall in mm.and rainfall in mm.
See handout for equations for predicting rain erosivity.See handout for equations for predicting rain erosivity.

HandoutsHandouts
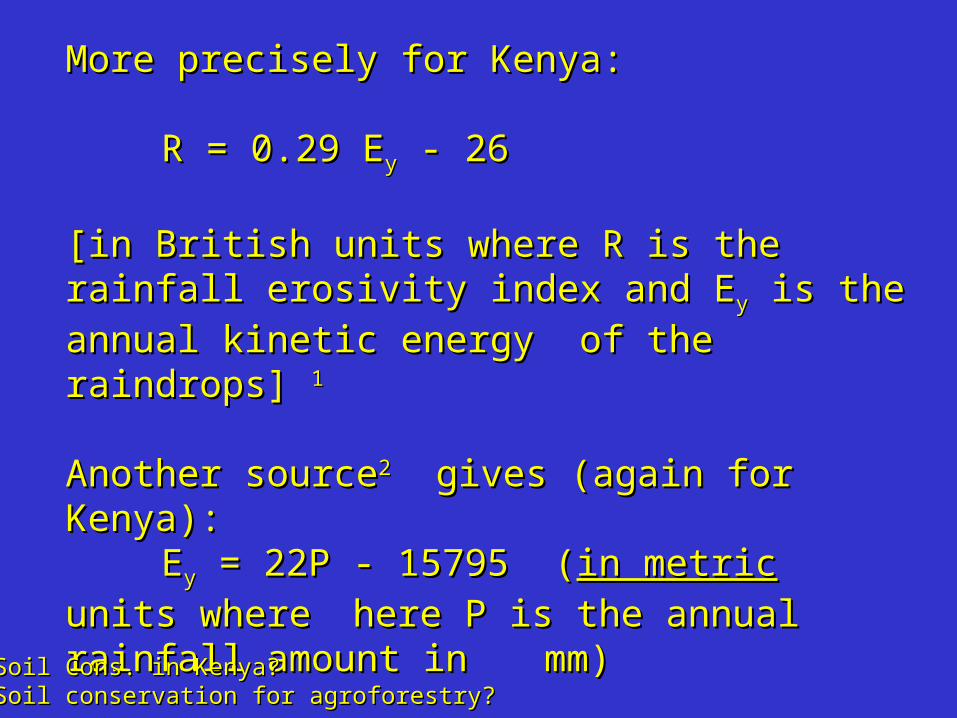
More precisely for Kenya:More precisely for Kenya:
R = 0.29 ER = 0.29 Eyy - 26 - 26
[in British units where R is the rainfall [in British units where R is the rainfall erosivity index and Eerosivity index and Eyy is the annual kinetic is the annual kinetic energy of the raindrops] energy of the raindrops] 11
Another sourceAnother source22 gives (again for Kenya): gives (again for Kenya):EEyy = 22P - 15795 ( = 22P - 15795 (in metricin metric units units
where where here P is the annual rainfall here P is the annual rainfall amount in amount in mm)mm)
11Soil Cons. in Kenya?Soil Cons. in Kenya? 22Soil conservation for agroforestry?Soil conservation for agroforestry?

Example (from Morgan, p. 47)Example (from Morgan, p. 47)
Time from start (min) Rainfall(mm)
Intensity (mm h-1) Kinetic energy per unit ofrain (J m-2 mm-1)
Total kinetic energy per timeslice (col 2 x col 4) [J m-2]
0-14 1.52 6.08 8.83 13.4215-29 14.22 56.88 27.56 391.9030-44 26.16 104.64 28.58 747.6545-59 31.5 126.00 28.79 906.8960-74 8.38 33.52 26.00 217.8875-89 0.25 1.00 - -
Energy per mm of rain calculated from:Energy per mm of rain calculated from:E = 29.8 - 127.5/I (for Zimbabwe - see above)E = 29.8 - 127.5/I (for Zimbabwe - see above)
Maximum 30 minute rainfall = 26.16 + 31.5 = 57.66Maximum 30 minute rainfall = 26.16 + 31.5 = 57.66Maximum 30 minute intensity = 57.66 x 2 = 115.32 Maximum 30 minute intensity = 57.66 x 2 = 115.32 mm hmm h-1-1
Total kinetic energy = 2277.74 J mTotal kinetic energy = 2277.74 J m-2-2 [total of column [total of column 5]5]EIEI3030 = 2277.74 x 115.32 = 262669 J m = 2277.74 x 115.32 = 262669 J m-2-2 mm h mm h-1-1 Hudson index of erosivity (KE>25) - energy for rain Hudson index of erosivity (KE>25) - energy for rain over 25 mm hover 25 mm h-1-1
= rows 2, 3, 4 & 5 of column 5 = 2264 J m= rows 2, 3, 4 & 5 of column 5 = 2264 J m-2-2 mm h mm h-1-1

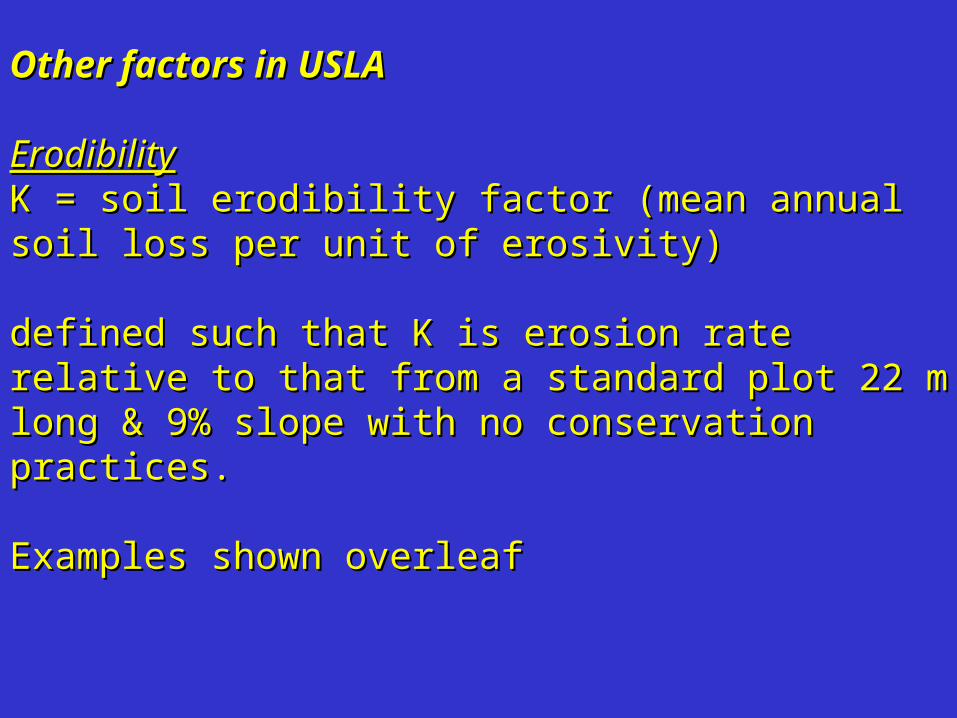
Other factors in USLAOther factors in USLA
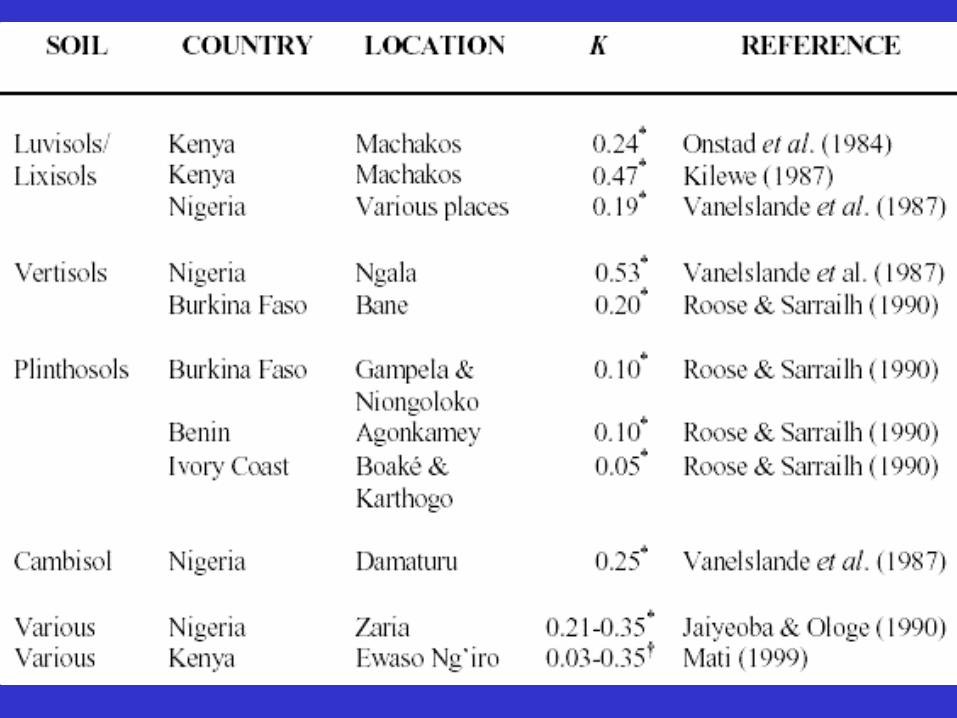
ErodibilityErodibilityK = soil erodibility factor (mean annual soil loss K = soil erodibility factor (mean annual soil loss per unit of erosivity)per unit of erosivity)
defined such that K is erosion rate relative to that defined such that K is erosion rate relative to that from a standard plot 22 m long & 9% slope with from a standard plot 22 m long & 9% slope with no conservation practices.no conservation practices.
Examples shown overleafExamples shown overleaf
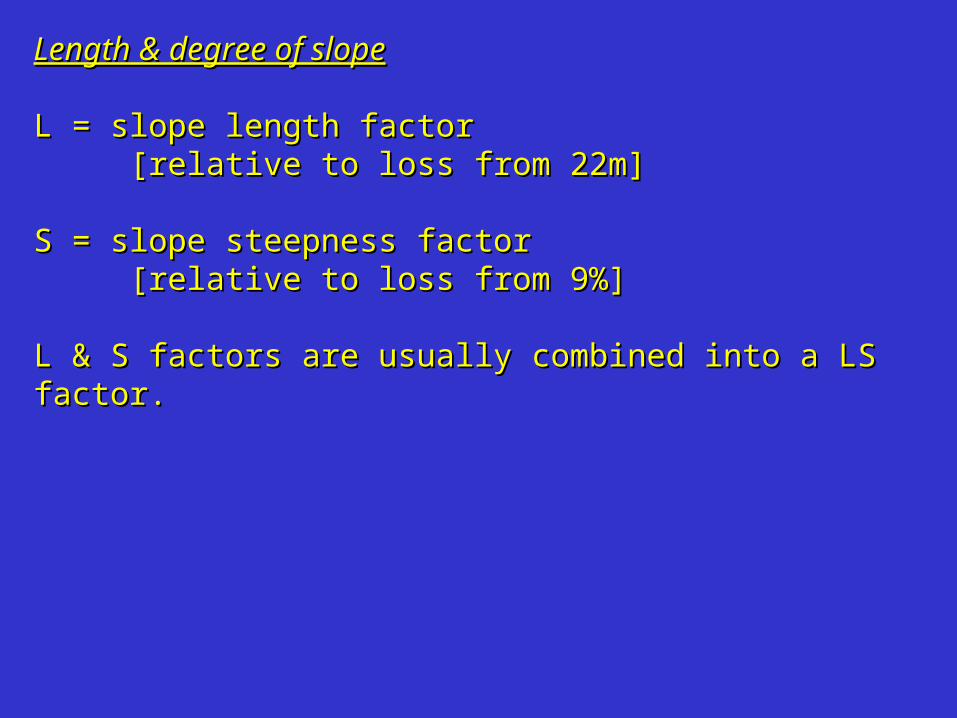
Length & degree of slopeLength & degree of slope
LL = slope length factor= slope length factor[relative to loss from 22m][relative to loss from 22m]
S = slope steepness factor S = slope steepness factor [relative to loss from 9%][relative to loss from 9%]
L & S factors are usually combined into a LS factor.L & S factors are usually combined into a LS factor.

One of the earliest equations was due to Zingg (1940): One of the earliest equations was due to Zingg (1940):
A = C SA = C S1.41.4 L L0.60.6
where where A was the average soil loss per unit of AREA , A was the average soil loss per unit of AREA , C was a constant, C was a constant, S was land slope (%), S was land slope (%), L was slope length (ft).L was slope length (ft).
Soil loss per unit WIDTH of slope would beSoil loss per unit WIDTH of slope would be
A = C SA = C S1.41.4 L L1.61.6

In Wischmeier & Smith (no relation) equation:In Wischmeier & Smith (no relation) equation:
““LS” = (LS” = (ll 0.50.5/22.13) x (0.065 + 0.045s + /22.13) x (0.065 + 0.045s + 0.0065s²)0.0065s²)
Note that this factor relates to the soil loss per Note that this factor relates to the soil loss per unit area.unit area.
For soil loss per unit WIDTH, the exponent For soil loss per unit WIDTH, the exponent would be 1.5.would be 1.5.

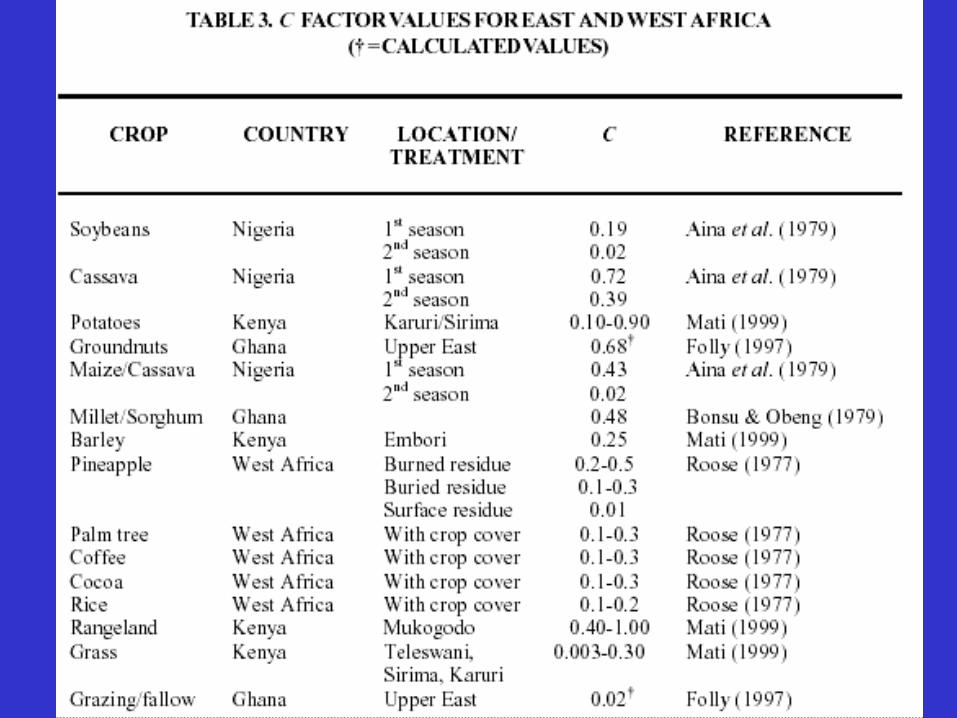
Cover and management factorCover and management factorC = cover and management factor [relative to bare C = cover and management factor [relative to bare fallow]fallow]e.g. e.g. C = 0.8 for maize or tobaccoC = 0.8 for maize or tobacco
C = 0.01 for well managed teaC = 0.01 for well managed teaC = 0.001 for natural rain forestC = 0.001 for natural rain forest
other values in table followingother values in table following
To arrive at an annual factor, the variation of crop To arrive at an annual factor, the variation of crop morphology throughout the year needs to be taken morphology throughout the year needs to be taken into account. Ground cover such as stubble between into account. Ground cover such as stubble between the cropping seasons is also allowed for.the cropping seasons is also allowed for.
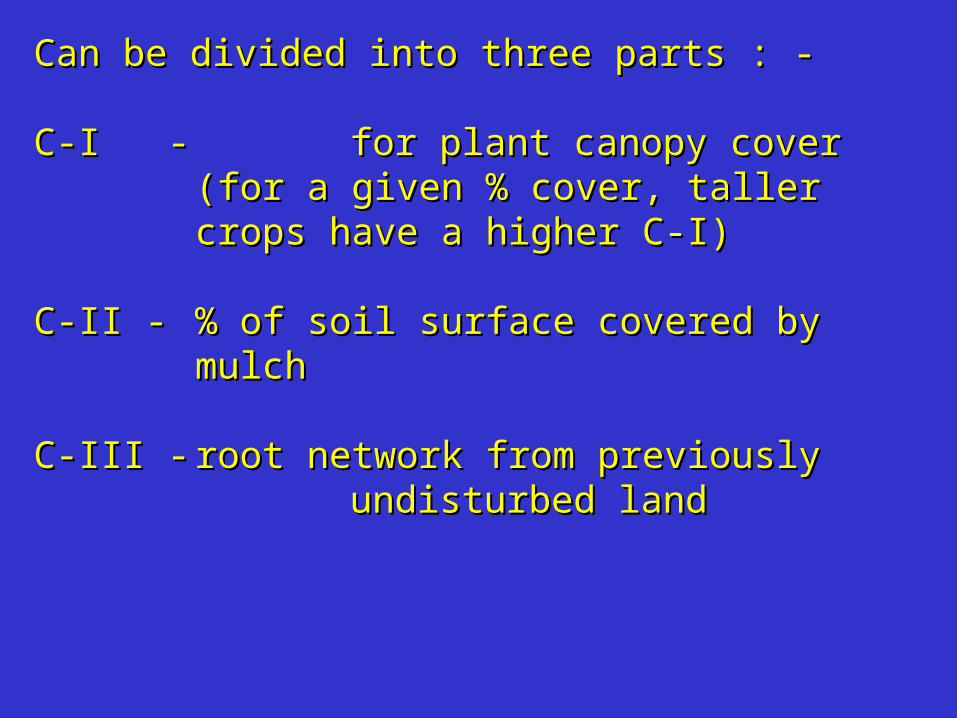
Can be divided into three parts : -Can be divided into three parts : -
C-I - C-I - for plant canopy cover (for a given % for plant canopy cover (for a given % cover, taller crops have a higher C-I)cover, taller crops have a higher C-I)
C-II - C-II - % of soil surface covered by mulch% of soil surface covered by mulch
C-III -C-III - root network from previously root network from previously undisturbed landundisturbed land
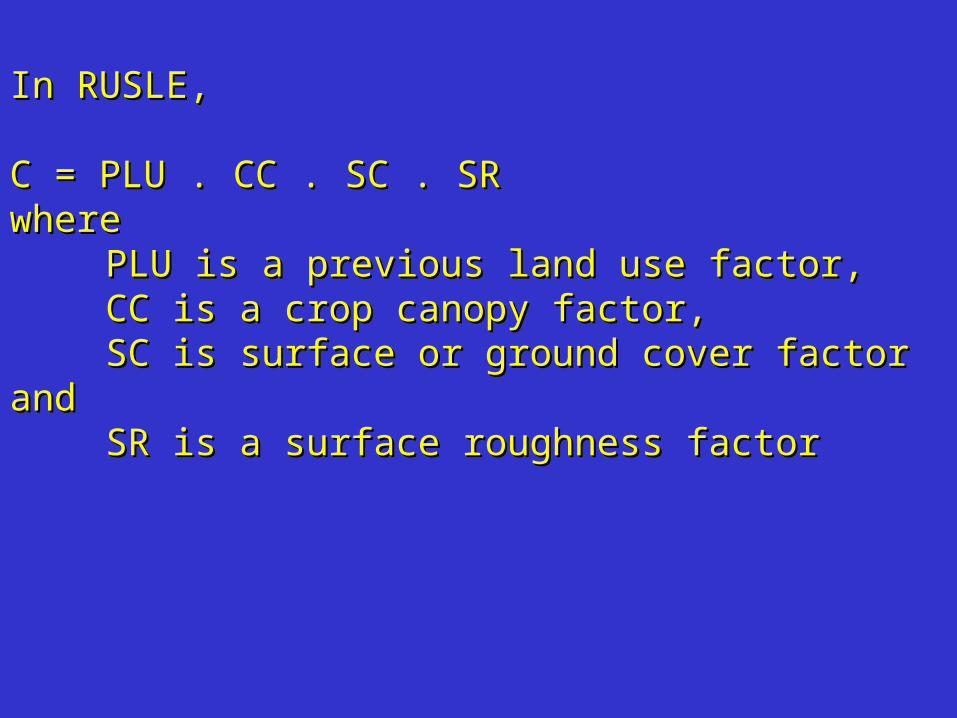
In RUSLE,In RUSLE,
C = PLU . CC . SC . SRC = PLU . CC . SC . SRwhere where
PLU is a previous land use factor,PLU is a previous land use factor,CC is a crop canopy factor, CC is a crop canopy factor, SC is surface or ground cover factor and SC is surface or ground cover factor and SR is a surface roughness factorSR is a surface roughness factor

Practice factorPractice factorP = practice factor [relative to erosion from P = practice factor [relative to erosion from field with plant rows up/down slope]. field with plant rows up/down slope].
If neither contouring nor strip cropping If neither contouring nor strip cropping practised and no other conservation measures, practised and no other conservation measures, the value is 1.0the value is 1.0e.g.e.g. P = 0.4 for strip croppingP = 0.4 for strip cropping
P = 0.05 to 0.1 for well maintained P = 0.05 to 0.1 for well maintained terracesterraces
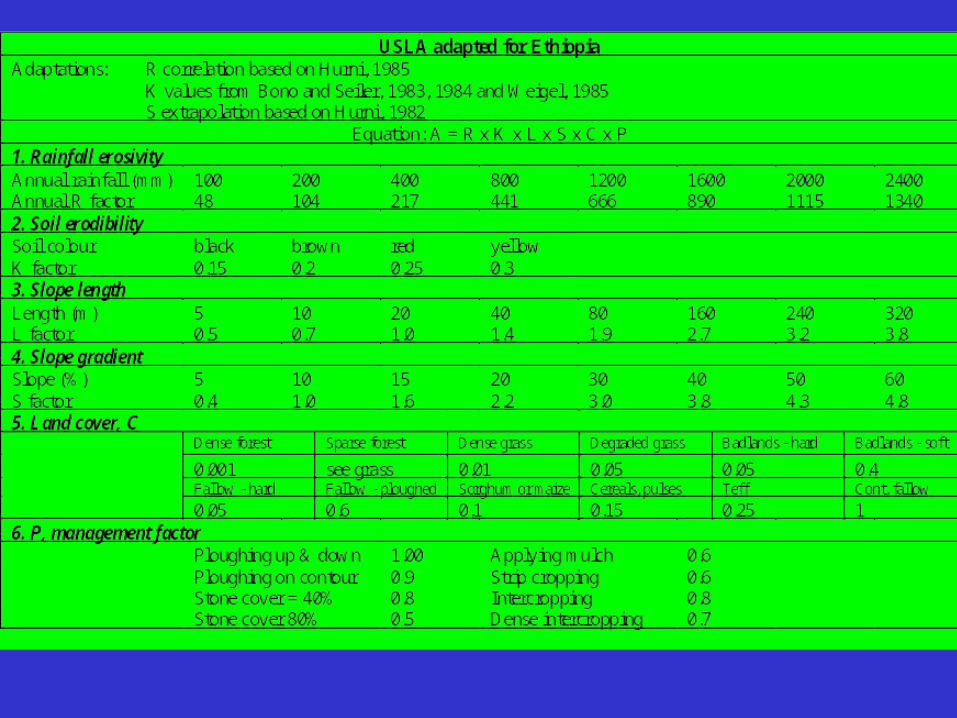
USLE needs modifying and calibration for use USLE needs modifying and calibration for use in the tropics. This has been done for some in the tropics. This has been done for some countries such as India, Ethiopiacountries such as India, Ethiopia

Example of the effect of ground coverExample of the effect of ground cover
2% slope at Nyankapa, 2% slope at Nyankapa, NigeriaNigeria33
33Bonsu. 1980. Erosion & cultural practices. In Morgan, 1980. p. 251Bonsu. 1980. Erosion & cultural practices. In Morgan, 1980. p. 251
Bare fallow was the controlBare fallow was the controlGroundnut cover was an intercropGroundnut cover was an intercrop
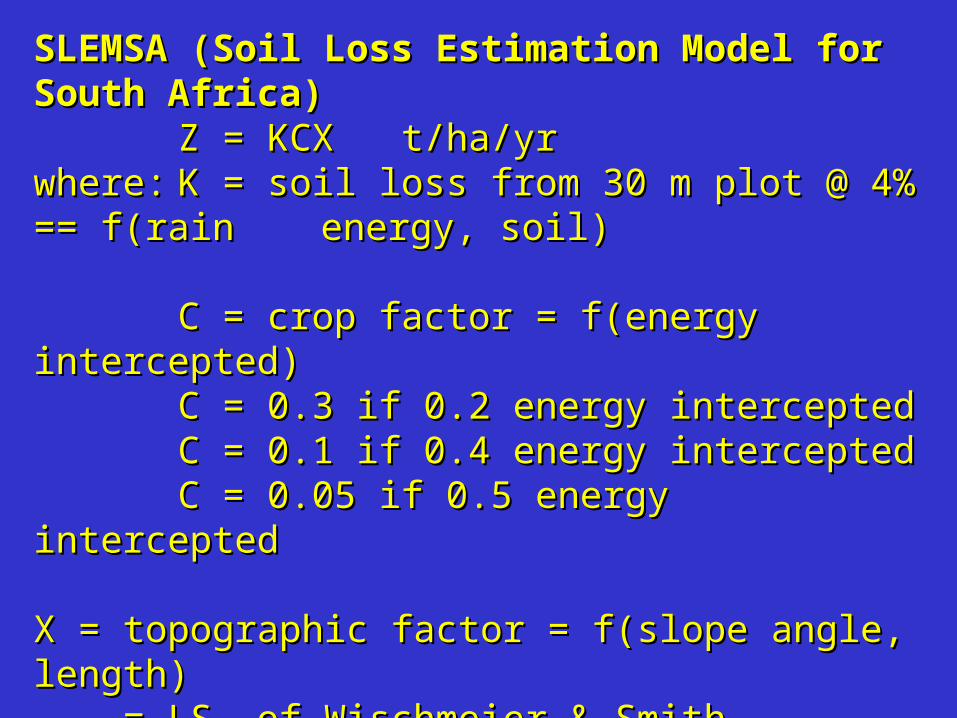
SLEMSA (Soil Loss Estimation Model for SLEMSA (Soil Loss Estimation Model for South Africa)South Africa)
Z = KCX t/ha/yrZ = KCX t/ha/yrwhere:where: K = soil loss from 30 m plot @ 4% == K = soil loss from 30 m plot @ 4% == f(rain f(rain energy, soil)energy, soil)
C = crop factor = f(energy intercepted)C = crop factor = f(energy intercepted)C = 0.3 if 0.2 energy interceptedC = 0.3 if 0.2 energy interceptedC = 0.1 if 0.4 energy interceptedC = 0.1 if 0.4 energy interceptedC = 0.05 if 0.5 energy interceptedC = 0.05 if 0.5 energy intercepted
X = topographic factor = f(slope angle, length) X = topographic factor = f(slope angle, length) = LS of Wischmeier & Smith, approximately= LS of Wischmeier & Smith, approximately

FAOFAOThis a simplified version of the USLE used by This a simplified version of the USLE used by the FAO:the FAO:
A = RKSC (ignores length & management)A = RKSC (ignores length & management)
• designed for large scale mapping of designed for large scale mapping of relative potential erosionrelative potential erosion
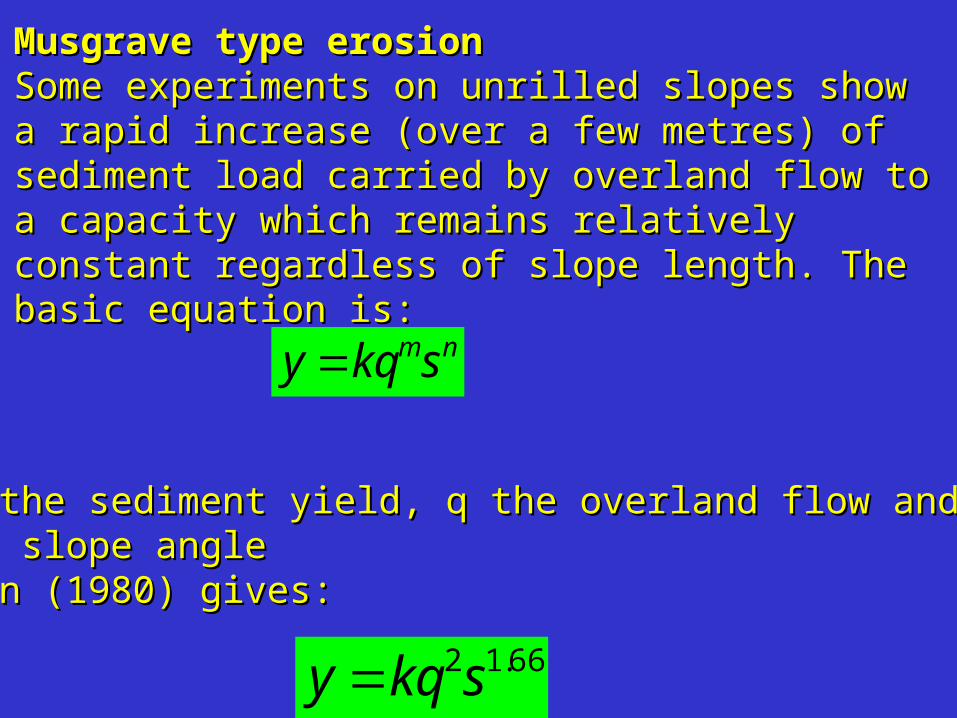
Musgrave type erosionMusgrave type erosionSome experiments on unrilled slopes show a Some experiments on unrilled slopes show a rapid increase (over a few metres) of sediment rapid increase (over a few metres) of sediment load carried by overland flow to a capacity which load carried by overland flow to a capacity which remains relatively constant regardless of slope remains relatively constant regardless of slope length. The basic equation is:length. The basic equation is:
nmskqy
where where y is the sediment yield, q the overland flow and y is the sediment yield, q the overland flow and s the slope angles the slope angleMorgan (1980) gives:Morgan (1980) gives:
66.12skqy
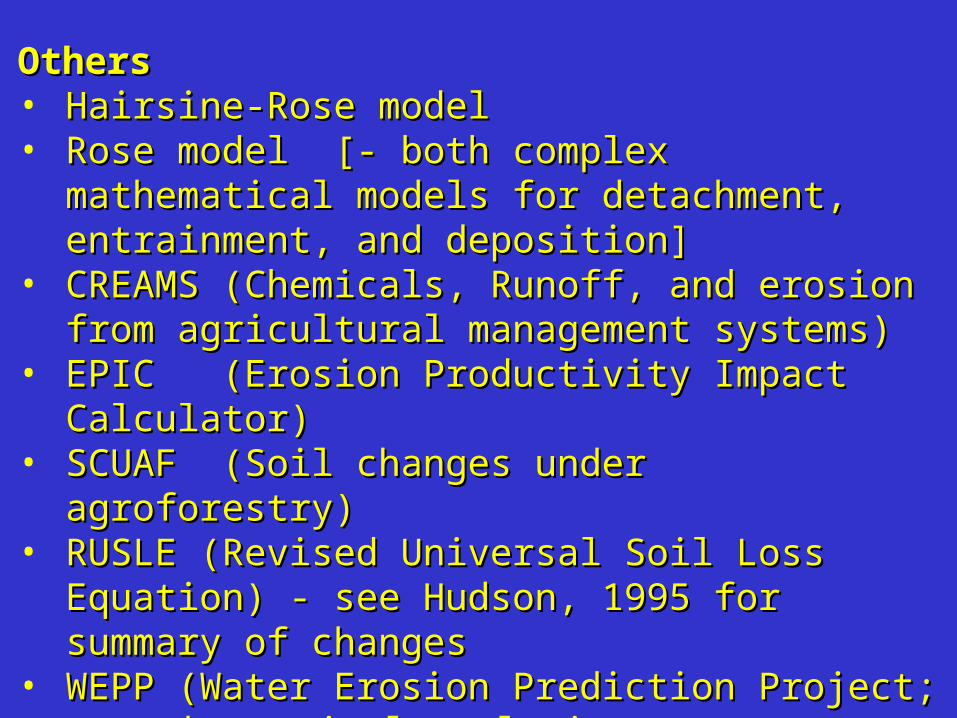
OthersOthers• Hairsine-Rose modelHairsine-Rose model• Rose model [- both complex mathematical Rose model [- both complex mathematical
models for detachment, entrainment, and models for detachment, entrainment, and deposition]deposition]
• CREAMS (Chemicals, Runoff, and erosion from CREAMS (Chemicals, Runoff, and erosion from agricultural management systems) agricultural management systems)
• EPIC (Erosion Productivity Impact Calculator)EPIC (Erosion Productivity Impact Calculator)• SCUAF (Soil changes under agroforestry)SCUAF (Soil changes under agroforestry)• RUSLE (Revised Universal Soil Loss Equation) - RUSLE (Revised Universal Soil Loss Equation) -
see Hudson, 1995 for summary of changessee Hudson, 1995 for summary of changes• WEPP (Water Erosion Prediction Project; WEPP (Water Erosion Prediction Project;
theoretical analysis; meant to replace USLE theoretical analysis; meant to replace USLE see Chapter 5 in Morgan; also Hudson, 1995see Chapter 5 in Morgan; also Hudson, 1995
• Stehlík (for Czech Rep. & Slovakia)Stehlík (for Czech Rep. & Slovakia)
Indices of soil erodibilityIndices of soil erodibility
See Table 1 HandoutSee Table 1 Handout
It gives various methods of comparing soil It gives various methods of comparing soil erodibility. erodibility.
Apart from the K value of Wischmeier and Smith, Apart from the K value of Wischmeier and Smith, these cannot be used in the USLE directly. these cannot be used in the USLE directly.
They would need to be calibrated andThey would need to be calibrated andrelated to K. related to K.
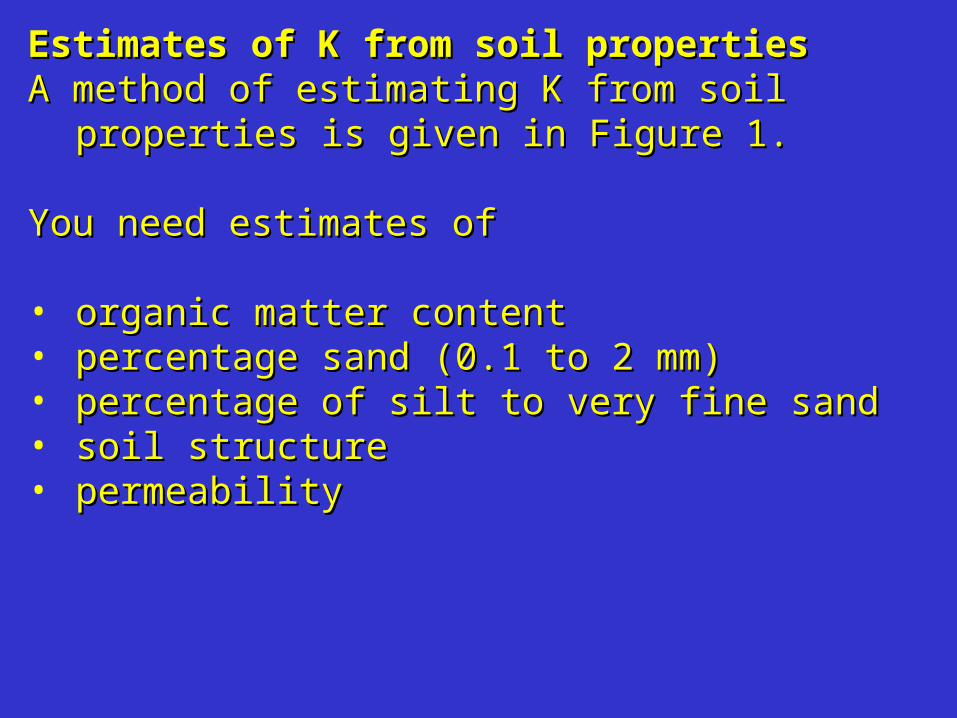
Estimates of K from soil propertiesEstimates of K from soil propertiesA method of estimating K from soil properties A method of estimating K from soil properties
is given in Figure 1.is given in Figure 1.
You need estimates of You need estimates of
• organic matter contentorganic matter content• percentage sand (0.1 to 2 mm)percentage sand (0.1 to 2 mm)• percentage of silt to very fine sandpercentage of silt to very fine sand• soil structuresoil structure• permeabilitypermeability
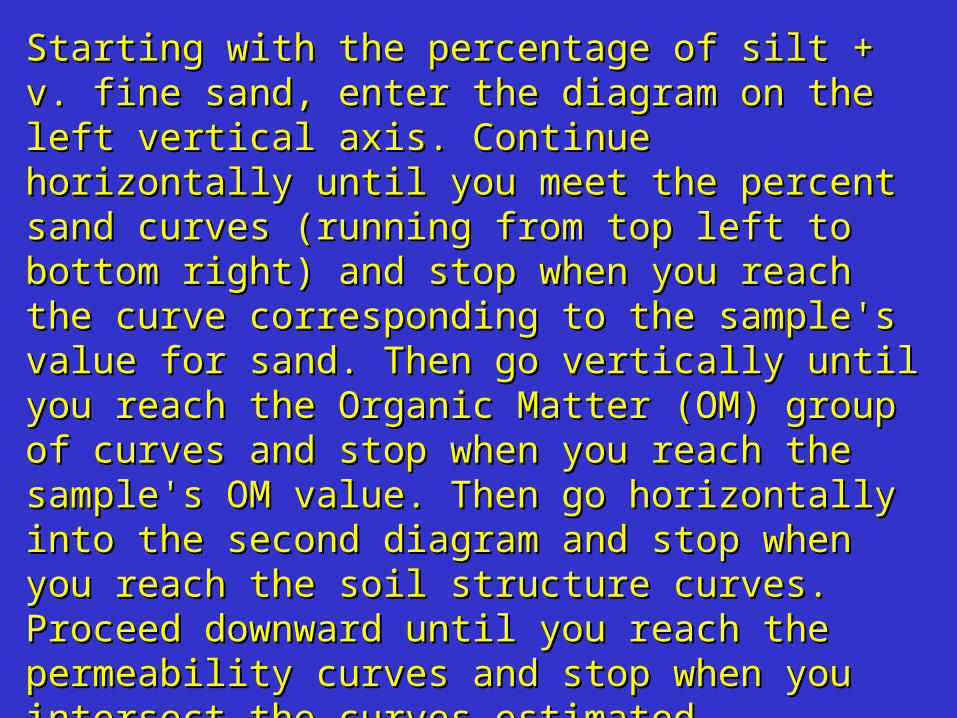
Starting with the percentage of silt + v. fine Starting with the percentage of silt + v. fine sand, enter the diagram on the left vertical axis. sand, enter the diagram on the left vertical axis. Continue horizontally until you meet the percent Continue horizontally until you meet the percent sand curves (running from top left to bottom sand curves (running from top left to bottom right) and stop when you reach the curve right) and stop when you reach the curve corresponding to the sample's value for sand. corresponding to the sample's value for sand. Then go vertically until you reach the Organic Then go vertically until you reach the Organic Matter (OM) group of curves and stop when you Matter (OM) group of curves and stop when you reach the sample's OM value. Then go reach the sample's OM value. Then go horizontally into the second diagram and stop horizontally into the second diagram and stop when you reach the soil structure curves. when you reach the soil structure curves. Proceed downward until you reach the Proceed downward until you reach the permeability curves and stop when you intersect permeability curves and stop when you intersect the curves estimated permeability. Then turn the curves estimated permeability. Then turn horizontally going left until you reach the horizontally going left until you reach the vertical axis of K. Read off the value. vertical axis of K. Read off the value.
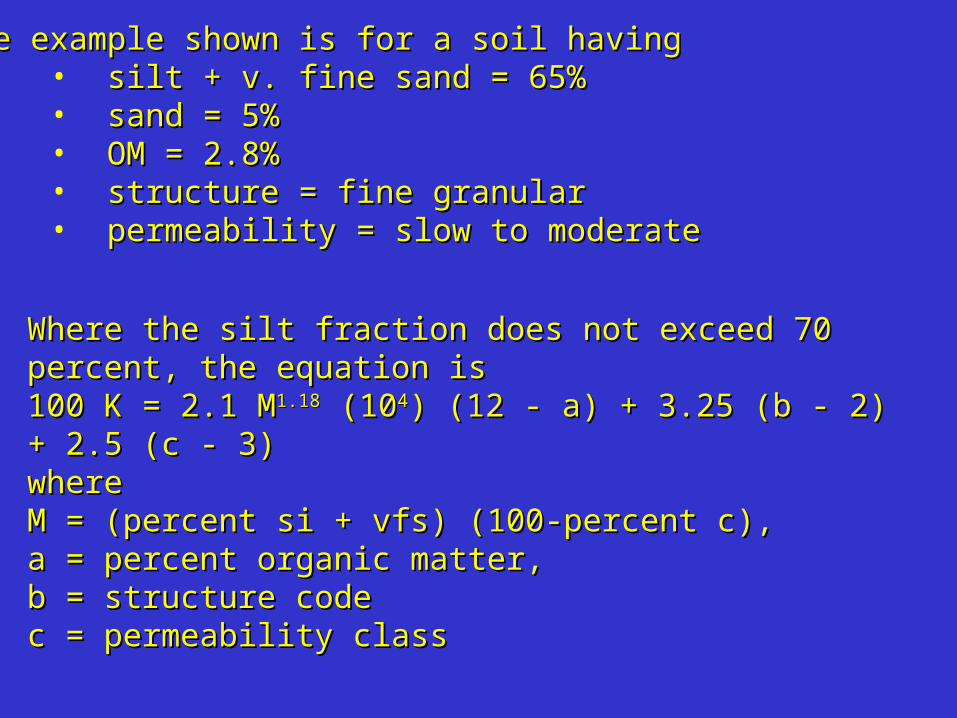
The example shown is for a soil havingThe example shown is for a soil having• silt + v. fine sand = 65%silt + v. fine sand = 65%• sand = 5%sand = 5%• OM = 2.8%OM = 2.8%• structure = fine granularstructure = fine granular• permeability = slow to moderatepermeability = slow to moderate
Where the silt fraction does not exceed 70 percent, the Where the silt fraction does not exceed 70 percent, the equation is equation is 100 K = 2.1 M100 K = 2.1 M1.181.18 (10 (1044) (12 - a) + 3.25 (b - 2) + 2.5 (c - ) (12 - a) + 3.25 (b - 2) + 2.5 (c - 3) 3) where where M = (percent si + vfs) (100-percent c), M = (percent si + vfs) (100-percent c), a = percent organic matter, a = percent organic matter, b = structure codeb = structure codec = permeability classc = permeability class

Nomograph for estimating soil erodibility (K) based on soil properties. From Morgan, p. 54, quoting Wischmeier, Johnson and Cross, 1971.

Related Documents