Hydrol. Earth Syst. Sci., 14, 2343–2354, 2010 www.hydrol-earth-syst-sci.net/14/2343/2010/ doi:10.5194/hess-14-2343-2010 © Author(s) 2010. CC Attribution 3.0 License. Hydrology and Earth System Sciences Modeling for transboundary water resources planning and allocation: the case of Southern Africa D. Ju´ ızo 1 and R. Lid´ en 2 1 Universidade Eduardo Mondlane, Faculdade de Engenharia, Av. de Moc ¸ambique, CP 257, Km 1.5, Maputo, Moc ¸ambique 2 Lund University, Department of Water Resources Engineering, P.O. Box 118, 22100 Lund, Sweden Received: 9 January 2008 – Published in Hydrol. Earth Syst. Sci. Discuss.: 19 February 2008 Revised: 6 October 2010 – Accepted: 15 November 2010 – Published: 26 November 2010 Abstract. International water resources agreements for transboundary rivers in southern Africa are generally founded in system analysis models for water planning and al- location. The Water Resources Yield Model (WRYM) devel- oped in South Africa has so far been the only model applied in official joint water resources studies aimed to form water- sharing agreements. The continuous discussion around the model performance and growing distress over it being South African, where it was originally developed, while South Africa is one of the interested parties in the process, results in an increased controversy over the system analysis results that are often only meant to guide in selecting the options for water resources management in a given set of scenarios. The objective of this study was therefore to assess the model performance of two other models; WAFLEX and WEAP21 in the Umbeluzi River Basin system where the WRYM was previously applied as part of a Joint River Basin Study. A set of basin development scenarios was equally tested in the three models and the results compared. The results show that the three models all are possible tools for system analysis of river basins in southern Africa, although the structure and complexity of the models are different. The obtained level of satisfaction for specific water users could, however, vary depending on which model was used, which causes uncer- tainties. The reason for the diverse results is the structurally different ways of describing allocation and prioritization of water in the three models. However, the large degrees of free- dom in all system models cause even larger uncertainty in the results since the model developer can, intentionally or unin- tentionally, direct the results to favor certain water user. The conclusion of this study is therefore that the choice of model does not per se affect the decision of best water allocation and infrastructure layout of a shared river basin. The chosen Correspondence to: D. Ju´ ızo ([email protected]) allocation and prioritization principles for the specific river basin and the model developer’s experience and integrity are more important factors to find the optimal and equitable al- location. 1 Introduction Water resources systems are generally complex with both qualitative and quantitative factors governing water resources availability (Raju and Pillai, 1999). In southern Africa the high climatic variability further adds the complexity. Both the large seasonal variations and the interannual variations, with long dry spells, make infrastructural solutions necessary to assure water availability at all times. The role of reservoirs in water resources management in Southern Africa is high- lighted by van der Zaag and Bolding (2005). However, building infrastructures will not on its own en- sure water availability and equitable water allocation be- tween countries and users of a particular river basin. The system of natural and regulated water resources should be utilized and managed appropriately for sustainable use of the water resources. In southern Africa, decision on wa- ter resources permit allocation between different users and between different riparian countries is therefore commonly based on system analysis tools. System analysis tools are ad- equate to evaluate and propose the best management strate- gies towards maximization of benefits for a given number of users under given objective functions in the catchment. As pointed out by Dent (2001) “... a model is a tool to help or- ganize a negotiation or learning process in which its primary function is to provide a framework for thinking by enabling participants to make their implicit assumptions explicit in a systematic manner”. Despite being a simplification of a com- plex water resources system, a system analysis model gives the opportunity for decision makers to know beforehand the consequence of a chosen management option or scenario, Published by Copernicus Publications on behalf of the European Geosciences Union.

Welcome message from author
This document is posted to help you gain knowledge. Please leave a comment to let me know what you think about it! Share it to your friends and learn new things together.
Transcript

Hydrol. Earth Syst. Sci., 14, 2343–2354, 2010www.hydrol-earth-syst-sci.net/14/2343/2010/doi:10.5194/hess-14-2343-2010© Author(s) 2010. CC Attribution 3.0 License.
Hydrology andEarth System
Sciences
Modeling for transboundary water resources planning andallocation: the case of Southern Africa
D. Juızo1 and R. Liden2
1Universidade Eduardo Mondlane, Faculdade de Engenharia, Av. de Mocambique, CP 257, Km 1.5, Maputo, Mocambique2Lund University, Department of Water Resources Engineering, P.O. Box 118, 22100 Lund, Sweden
Received: 9 January 2008 – Published in Hydrol. Earth Syst. Sci. Discuss.: 19 February 2008Revised: 6 October 2010 – Accepted: 15 November 2010 – Published: 26 November 2010
Abstract. International water resources agreements fortransboundary rivers in southern Africa are generallyfounded in system analysis models for water planning and al-location. The Water Resources Yield Model (WRYM) devel-oped in South Africa has so far been the only model appliedin official joint water resources studies aimed to form water-sharing agreements. The continuous discussion around themodel performance and growing distress over it being SouthAfrican, where it was originally developed, while SouthAfrica is one of the interested parties in the process, resultsin an increased controversy over the system analysis resultsthat are often only meant to guide in selecting the optionsfor water resources management in a given set of scenarios.The objective of this study was therefore to assess the modelperformance of two other models; WAFLEX and WEAP21in the Umbeluzi River Basin system where the WRYM waspreviously applied as part of a Joint River Basin Study. Aset of basin development scenarios was equally tested in thethree models and the results compared. The results show thatthe three models all are possible tools for system analysisof river basins in southern Africa, although the structure andcomplexity of the models are different. The obtained levelof satisfaction for specific water users could, however, varydepending on which model was used, which causes uncer-tainties. The reason for the diverse results is the structurallydifferent ways of describing allocation and prioritization ofwater in the three models. However, the large degrees of free-dom in all system models cause even larger uncertainty in theresults since the model developer can, intentionally or unin-tentionally, direct the results to favor certain water user. Theconclusion of this study is therefore that the choice of modeldoes not per se affect the decision of best water allocationand infrastructure layout of a shared river basin. The chosen
Correspondence to:D. Juızo([email protected])
allocation and prioritization principles for the specific riverbasin and the model developer’s experience and integrity aremore important factors to find the optimal and equitable al-location.
1 Introduction
Water resources systems are generally complex with bothqualitative and quantitative factors governing water resourcesavailability (Raju and Pillai, 1999). In southern Africa thehigh climatic variability further adds the complexity. Boththe large seasonal variations and the interannual variations,with long dry spells, make infrastructural solutions necessaryto assure water availability at all times. The role of reservoirsin water resources management in Southern Africa is high-lighted by van der Zaag and Bolding (2005).
However, building infrastructures will not on its own en-sure water availability and equitable water allocation be-tween countries and users of a particular river basin. Thesystem of natural and regulated water resources should beutilized and managed appropriately for sustainable use ofthe water resources. In southern Africa, decision on wa-ter resources permit allocation between different users andbetween different riparian countries is therefore commonlybased on system analysis tools. System analysis tools are ad-equate to evaluate and propose the best management strate-gies towards maximization of benefits for a given number ofusers under given objective functions in the catchment. Aspointed out by Dent (2001) “... a model is a tool to help or-ganize a negotiation or learning process in which its primaryfunction is to provide a framework for thinking by enablingparticipants to make their implicit assumptions explicit in asystematic manner”. Despite being a simplification of a com-plex water resources system, a system analysis model givesthe opportunity for decision makers to know beforehand theconsequence of a chosen management option or scenario,
Published by Copernicus Publications on behalf of the European Geosciences Union.
2344 D. Juızo and R. Liden: Modeling for transboundary water resources planning and allocation
though, within the limits imposed by the uncertainty in dataand gaps in the knowledge of the processes involved in natu-ral systems. These tools are therefore important instrumentsfor authorities and governments to adopt policies for waterresources management in both national and transboundaryriver basins. However, because the stakeholders or countriesobjectives often are conflicting it is necessary that the modelor software used is considered unbiased.
In southern Africa the countries have not yet agreed on theset of decision support tools that should apply in the waterallocation process. The experience from the already imple-mented joint system analysis studies in Umbeluzi and Inco-mati rivers in southeast Africa (Consultec and BKS Acres,2000; SWECO and Associates, 2005) has shown preferenceto the Water Resources Yield Model (WRYM) as the tooladopted for system analysis. The experience from these stud-ies, however, shows that the results obtained from WRYMare not easily understood by the stakeholders, and govern-ment representatives of different countries bear some suspi-cion about the results from the system analysis. The lackof trust in the system analysis tool has prevented a smoothnegotiation on transboundary water resources allocation, fo-cusing the discussion on the nature and properties of the toolsrather than the strategies that can be applied to improve waterresources allocation between countries.
Water resources system analysts are challenged to producea system analysis model that considers both the legal frame-work and the true behavior in the system. Stakeholders of-ten share water resources at very local level and rely mostlyon customary principles embodied in local level institutions(van der Zaag and Bolding, 2005). Integrating small stake-holders in a large-scale river basin management thus needsharmonization of local and regional interests. In the case awater release in a large basin targets the most downstreamuser, e.g. environment flow to the estuary, all the local wa-ter users along the river must have a corresponding objec-tive not to use this water, otherwise the reserved water willgradually be used by the local users starting with the mostupstream community. This situation is even more difficult intransboundary rivers. In such a situation the question is: howcomplex should a system analysis model be to handle thisscale problem but at the same time be sufficiently transpar-ent and uncomplicated to give stakeholders information forsetting and accepting allocation criteria?
This study examines the role that decision support toolsplay in the agreement process by evaluating three differ-ent system analysis model packages for water allocation forthe same river basin, the Umbeluzi River in Swaziland andMozambique. The objective is to compare these models interms of complexity, reliability of results, transparency andto assess whether the model selection may affect the deci-sion of best water allocation and infrastructure layout of ashared river basin.
2 Material and methods
Because the WRYM is the preferred model tool for sys-tem analysis of international river basins in the SADC re-gion (Carmo Vaz and van der Zaag, 2003; van der Zaag andCarmo Vaz, 2003) a comparative analysis of model perfor-mance was conducted through applying two other modelsin a river basin where the WRYM had been applied. As acase study it was chosen to do the assessment in the Um-beluzi River in which the WRYM has previously been setup as part of the Joint Umbeluzi River Basin Study (JU-RBS) that aimed to prepare the baseline for a new water re-sources sharing agreement between Swaziland and Mozam-bique (SWECO and Associates, 2005). The Umbeluzi Riverbasin was chosen because it is a relatively simple water re-sources system which is faced with some of the core chal-lenges of transboundary rivers in southern Africa: high cli-matic variability, scarce water resources, upstream versusdownstream users, large-scale versus small-scale users andsignificant environmental flow requirements. The challengesfor water resources management in the Umbeluzi River basinhave previously been studied by Juizo et al. (2006).
The basis for the study was that the different models wouldapply the same inputs and configuration as was used in thestudy by SWECO and Associates (2005). As a first step theWRYM model runs by SWECO and Associates (2005) werereproduced to simulate a set of different development sce-narios for the Umbeluzi River basin. Secondly a spreadsheetbased system analysis model, WAFLEX, and a correspond-ing GIS based software, WEAP21, were set up for the Um-beluzi River and applied for the same development scenarios.The WAFLEX model has been used previously in analyzingother river basins in SADC region, namely the Incomati, Ma-puto and Save (Nkomo and van der Zaag, 2004; Sengo et al.,2005; de Groot and Oosterwijk, 2006; Symphorian et al.,2003). While the WEAP21 was used in the Olifants river atributary to Limpopo river (Levite and Sally, 2002; Le Roy,2005).
2.1 The Umbeluzi River basin
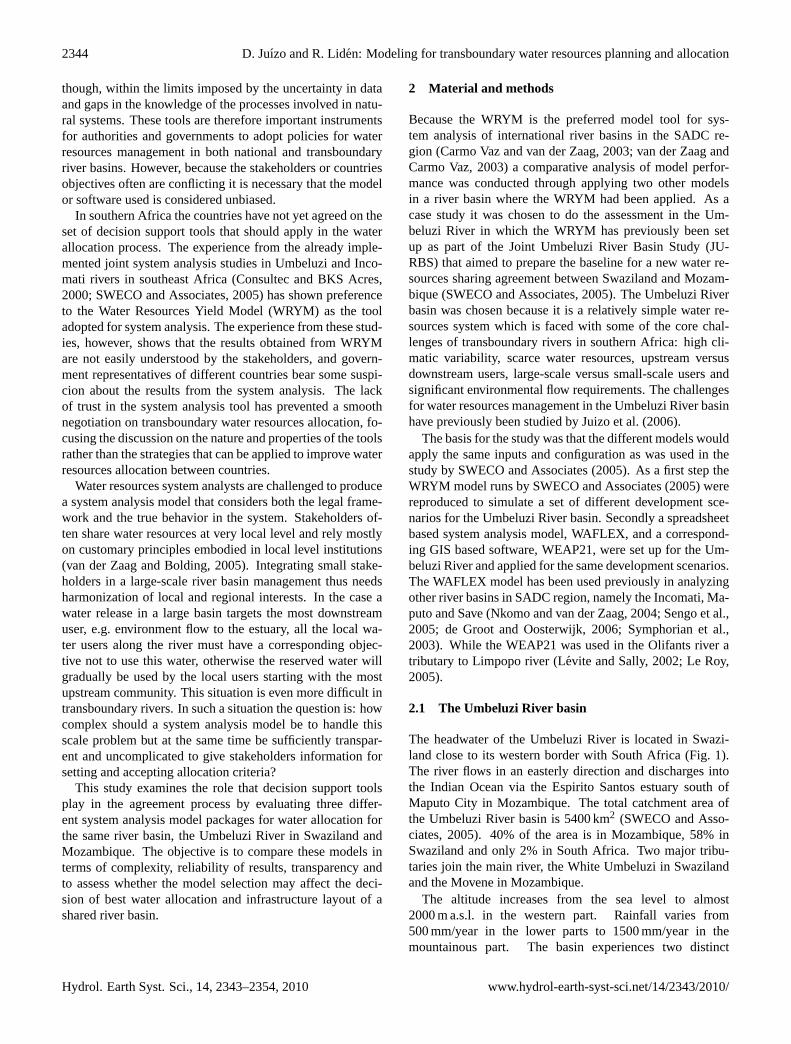
The headwater of the Umbeluzi River is located in Swazi-land close to its western border with South Africa (Fig. 1).The river flows in an easterly direction and discharges intothe Indian Ocean via the Espirito Santos estuary south ofMaputo City in Mozambique. The total catchment area ofthe Umbeluzi River basin is 5400 km2 (SWECO and Asso-ciates, 2005). 40% of the area is in Mozambique, 58% inSwaziland and only 2% in South Africa. Two major tribu-taries join the main river, the White Umbeluzi in Swazilandand the Movene in Mozambique.
The altitude increases from the sea level to almost2000 m a.s.l. in the western part. Rainfall varies from500 mm/year in the lower parts to 1500 mm/year in themountainous part. The basin experiences two distinct
Hydrol. Earth Syst. Sci., 14, 2343–2354, 2010 www.hydrol-earth-syst-sci.net/14/2343/2010/
D. Juızo and R. Liden: Modeling for transboundary water resources planning and allocation 2345
24
Subbasin U13
PequenosLibombosE10
Toestuary
Subbasin U10 Subbasin U11
GS20
Umbeluzi
Subbasin U02-04
GS4
Subbasin U01
GS10
Subbasin U07
WhiteMbuluzi
Black Mbuluzi Black Mbuluzi
UMBELUZI RIVER WATER RESOURCES SYSTEM
MOZAMBIQUESWAZILAND
GS3
Subbasin U05
Mjoli
Water supplyMbabane
Sugar CaneFactory
Large-scaleSugar Cane Irrigation
Subbasin U06
Subbasin U08-09
GS32
Subbasin U12
E395
MoveneDam site
Subbasin U15
E12
Subbasin U14
E14
Subbasin U17
Subbasin U16
MaputoWatersupply
Return flows
Farm dams
Farm dams
Release
Small-scale farming
Small-scale farming
Small-scale farming
Small-scale farming
Small-scale farming
Hawane
Black Mbuluzi
Release
SpillSpill
Legend
Subcatchment
Reservoir
Irrigation scheme
River flow
Water outtake
Runoff station
Border
Movene
Figure 2 Simplified Umbeluzi River basin system model schematic
Figure 1 The Umbeluzi River basinFig. 1. The Umbeluzi River basin.
seasons; the rainy season from November to April and thedry season between May and October. Two major dams arelocated in the basin. The Mnjoli Dam, with total capacityof 152 million m3 was built in 1978 with purpose to securewater for the sugar cane estates in eastern Swaziland. ThePequenos Libombos Dam in Mozambique, with total capac-ity of 385 million m3, was constructed in 1987 mainly to se-cure the urban water supply for Maputo City. The intake andwater treatment plant for Maputo City is located some kilo-meters downstream of the Pequenos Libombos and the damis therefore constantly releasing a minimum flow to allow forwater supply. In addition, a small dam in the upper basin inSwaziland, the Hawane (2.75 million m3), supplies the capi-tal Mbabane with fresh water.
The largest water user in the Umbeluzi basin is irri-gation as can be deduced from the water demands (Ta-ble 1). The sugar cane estates in eastern Swazilandstand for more than 70% of the present water demand.The total estimated present water demand for surface wa-ter is 350 million m3/year but is forecasted to increaseto 586 million m3/year by the year 2025. The avail-able water, under natural conditions, is estimated to be535 million m3/year (SWECO and Associates, 2005). Thetwo countries have a number of small-scale users distributedin the catchment and because of the water scarcity many pro-posals exist to build storage infrastructure.
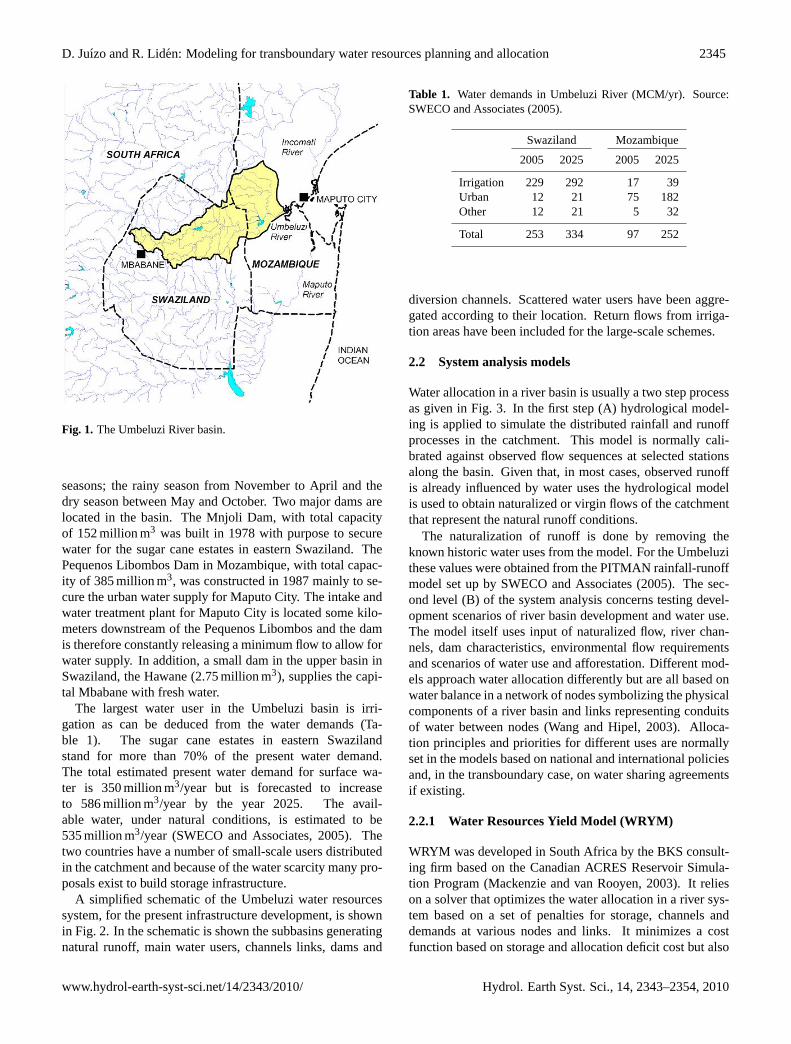
A simplified schematic of the Umbeluzi water resourcessystem, for the present infrastructure development, is shownin Fig. 2. In the schematic is shown the subbasins generatingnatural runoff, main water users, channels links, dams and
Table 1. Water demands in Umbeluzi River (MCM/yr). Source:SWECO and Associates (2005).
Swaziland Mozambique
2005 2025 2005 2025
Irrigation 229 292 17 39Urban 12 21 75 182Other 12 21 5 32
Total 253 334 97 252
diversion channels. Scattered water users have been aggre-gated according to their location. Return flows from irriga-tion areas have been included for the large-scale schemes.
2.2 System analysis models
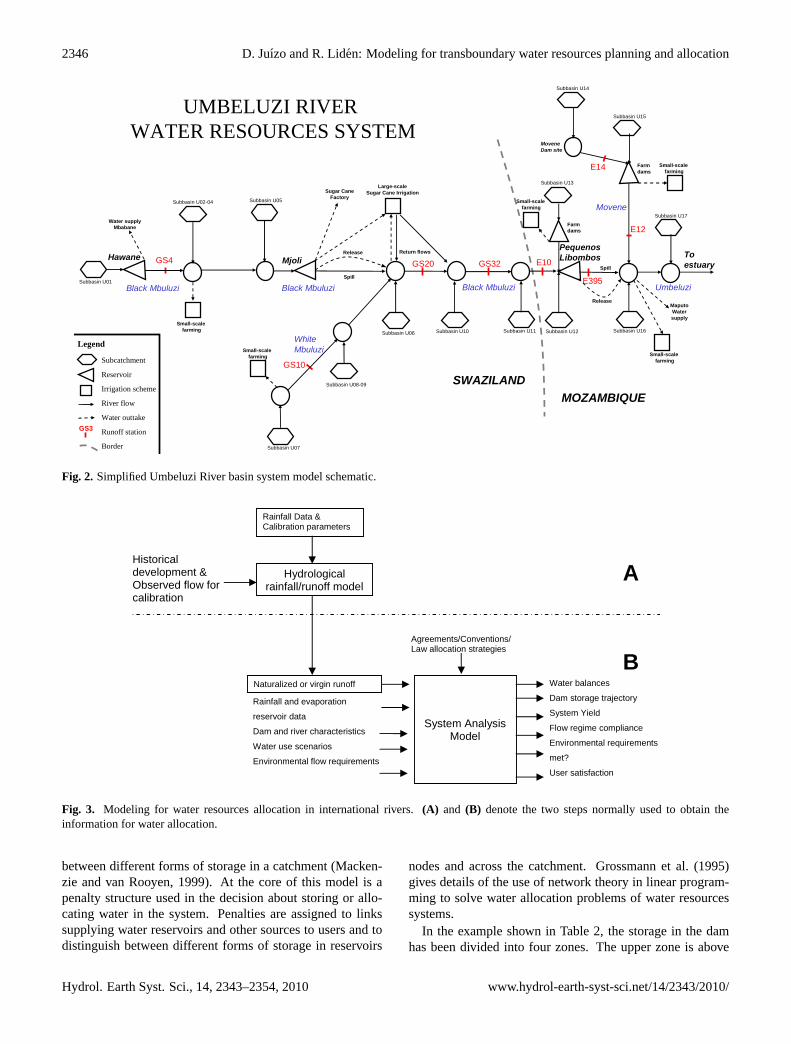
Water allocation in a river basin is usually a two step processas given in Fig. 3. In the first step (A) hydrological model-ing is applied to simulate the distributed rainfall and runoffprocesses in the catchment. This model is normally cali-brated against observed flow sequences at selected stationsalong the basin. Given that, in most cases, observed runoffis already influenced by water uses the hydrological modelis used to obtain naturalized or virgin flows of the catchmentthat represent the natural runoff conditions.
The naturalization of runoff is done by removing theknown historic water uses from the model. For the Umbeluzithese values were obtained from the PITMAN rainfall-runoffmodel set up by SWECO and Associates (2005). The sec-ond level (B) of the system analysis concerns testing devel-opment scenarios of river basin development and water use.The model itself uses input of naturalized flow, river chan-nels, dam characteristics, environmental flow requirementsand scenarios of water use and afforestation. Different mod-els approach water allocation differently but are all based onwater balance in a network of nodes symbolizing the physicalcomponents of a river basin and links representing conduitsof water between nodes (Wang and Hipel, 2003). Alloca-tion principles and priorities for different uses are normallyset in the models based on national and international policiesand, in the transboundary case, on water sharing agreementsif existing.
2.2.1 Water Resources Yield Model (WRYM)
WRYM was developed in South Africa by the BKS consult-ing firm based on the Canadian ACRES Reservoir Simula-tion Program (Mackenzie and van Rooyen, 2003). It relieson a solver that optimizes the water allocation in a river sys-tem based on a set of penalties for storage, channels anddemands at various nodes and links. It minimizes a costfunction based on storage and allocation deficit cost but also
www.hydrol-earth-syst-sci.net/14/2343/2010/ Hydrol. Earth Syst. Sci., 14, 2343–2354, 2010
2346 D. Juızo and R. Liden: Modeling for transboundary water resources planning and allocation
24
Subbasin U13
PequenosLibombosE10
Toestuary
Subbasin U10 Subbasin U11
GS20
Umbeluzi
Subbasin U02-04
GS4
Subbasin U01
GS10
Subbasin U07
WhiteMbuluzi
Black Mbuluzi Black Mbuluzi
UMBELUZI RIVER WATER RESOURCES SYSTEM
MOZAMBIQUESWAZILAND
GS3
Subbasin U05
Mjoli
Water supplyMbabane
Sugar CaneFactory
Large-scaleSugar Cane Irrigation
Subbasin U06
Subbasin U08-09
GS32
Subbasin U12
E395
MoveneDam site
Subbasin U15
E12
Subbasin U14
E14
Subbasin U17
Subbasin U16
MaputoWatersupply
Return flows
Farm dams
Farm dams
Release
Small-scale farming
Small-scale farming
Small-scale farming
Small-scale farming
Small-scale farming
Hawane
Black Mbuluzi
Release
SpillSpill
Legend
Subcatchment
Reservoir
Irrigation scheme
River flow
Water outtake
Runoff station
Border
Movene
Figure 2 Simplified Umbeluzi River basin system model schematic
Figure 1 The Umbeluzi River basin
Fig. 2. Simplified Umbeluzi River basin system model schematic.
25
Figure 3 Modeling for water resources allocation in international rivers. A & B denote the two steps normally used
to obtain the information for water allocation
A
B
DAM WALL
C
D
A
B
DAM WALL
C
D
FRC
URC
DSC
Figure 4 Storage forms in WAFLEX
Hydrological rainfall/runoff model
Rainfall Data & Calibration parameters
Historical development & Observed flow for calibration
Naturalized or virgin runoff
Rainfall and evaporation
reservoir data
Dam and river characteristics
Water use scenarios
Environmental flow requirements
System Analysis Model
Agreements/Conventions/Law allocation strategies
Water balances
Dam storage trajectory
System Yield
Flow regime compliance
Environmental requirements
met?
User satisfaction
B
A
Fig. 3. Modeling for water resources allocation in international rivers.(A) and (B) denote the two steps normally used to obtain theinformation for water allocation.
between different forms of storage in a catchment (Macken-zie and van Rooyen, 1999). At the core of this model is apenalty structure used in the decision about storing or allo-cating water in the system. Penalties are assigned to linkssupplying water reservoirs and other sources to users and todistinguish between different forms of storage in reservoirs
nodes and across the catchment. Grossmann et al. (1995)gives details of the use of network theory in linear program-ming to solve water allocation problems of water resourcessystems.
In the example shown in Table 2, the storage in the damhas been divided into four zones. The upper zone is above
Hydrol. Earth Syst. Sci., 14, 2343–2354, 2010 www.hydrol-earth-syst-sci.net/14/2343/2010/
D. Juızo and R. Liden: Modeling for transboundary water resources planning and allocation 2347
Table 2. Example of reservoir zones and penalty structure in theWRYM. Source: WRYM User Guide – 4.1.1.
Storage Penalty Elevation
100% 1000 1548.9690% 2 1547.990% 20 1533.000% 10 000 1533.00Bottom 1521.95
the full supply level (FSL) and has therefore a very highpenalty. The second zone is between FSL and the 90% ca-pacity. This zone has a penalty of 2 units. The third zone rep-resents the water between the 90% level and the dead storagelevel (DSL). Water in this zone has a penalty of 20 units andrepresents the main working storage for the reservoir. Thewater between the DSL and the bottom of the dam has a rel-atively very high value of 10 000 units. Thus the model willnever draw water from this zone to meet the downstream de-mand. The four penalties used in the example have the effectof restricting the working storage of the dam to the secondand third zones. In the model there are possibilities to havemore zones than shown in the example.
Table 3 shows a typical penalty structure for a channel witha specified target draft (TD). Failing to meet the target draftresults in a penalty of 250 units. If the target draft is supplied,there is a zero penalty and if it is exceeded, the excess flowresults in a penalty of 20 units. For further explanation of thepenalty structure of the WRYM model, see the User Guide –4.1.1 (Mackenzie and van Rooyen, 1999).
In WRYM the network is analyzed for each time periodand solved with the selected penalty structures. The net-work solver will minimize the penalties for each time step bychoosing the best allocation of water to the different users.It will also choose the most attractive route (i.e. minimumpenalty) for transferring the water from the storage zones tothe demand centers.
The WRYM is widely used in southern Africa and is thechosen tool by the South African Department of Water Af-fairs and Forestry for system analysis of all the river basinsin South Africa (Carmo Vaz and van der Zaag, 2003).
2.2.2 Water Allocation Flow model in Excel (WAFLEX)
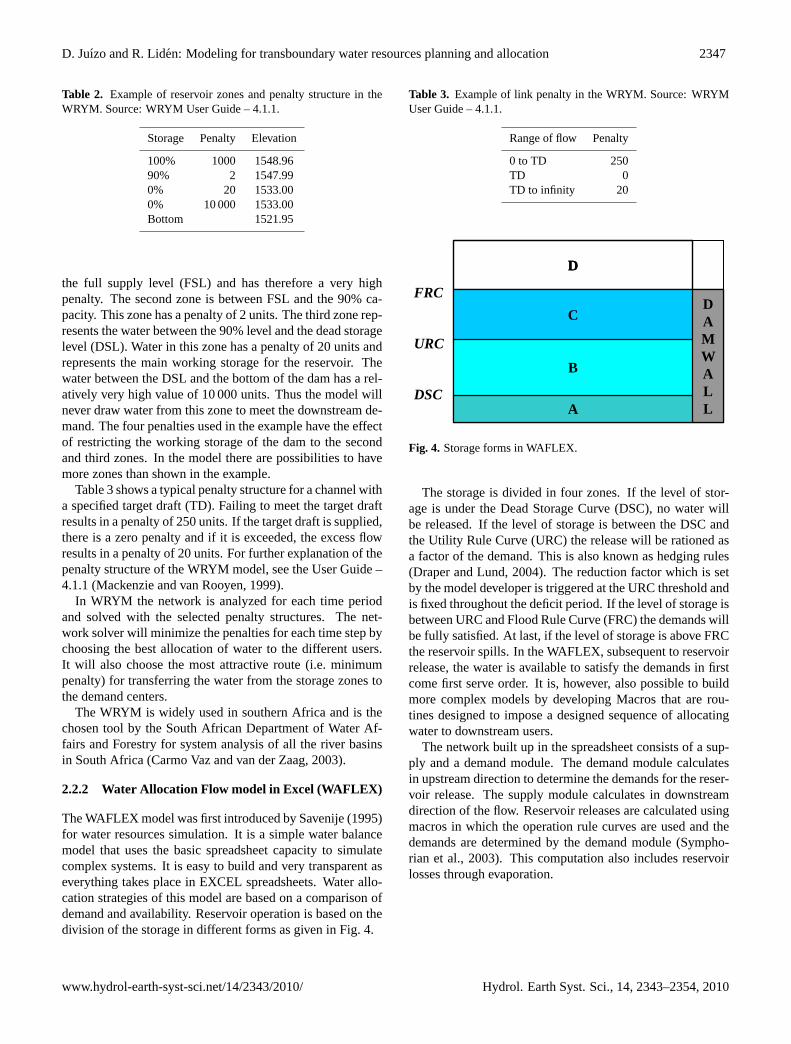
The WAFLEX model was first introduced by Savenije (1995)for water resources simulation. It is a simple water balancemodel that uses the basic spreadsheet capacity to simulatecomplex systems. It is easy to build and very transparent aseverything takes place in EXCEL spreadsheets. Water allo-cation strategies of this model are based on a comparison ofdemand and availability. Reservoir operation is based on thedivision of the storage in different forms as given in Fig. 4.
Table 3. Example of link penalty in the WRYM. Source: WRYMUser Guide – 4.1.1.
Range of flow Penalty
0 to TD 250TD 0TD to infinity 20
25
Figure 3 Modeling for water resources allocation in international rivers. A & B denote the two steps normally used
to obtain the information for water allocation
A
B
DAM WALL
C
D
A
B
DAM WALL
C
D
FRC
URC
DSC
Figure 4 Storage forms in WAFLEX
Hydrological rainfall/runoff model
Rainfall Data & Calibration parameters
Historical development & Observed flow for calibration
Naturalized or virgin runoff
Rainfall and evaporation
reservoir data
Dam and river characteristics
Water use scenarios
Environmental flow requirements
System Analysis Model
Agreements/Conventions/Law allocation strategies
Water balances
Dam storage trajectory
System Yield
Flow regime compliance
Environmental requirements
met?
User satisfaction
B
A
Fig. 4. Storage forms in WAFLEX.
The storage is divided in four zones. If the level of stor-age is under the Dead Storage Curve (DSC), no water willbe released. If the level of storage is between the DSC andthe Utility Rule Curve (URC) the release will be rationed asa factor of the demand. This is also known as hedging rules(Draper and Lund, 2004). The reduction factor which is setby the model developer is triggered at the URC threshold andis fixed throughout the deficit period. If the level of storage isbetween URC and Flood Rule Curve (FRC) the demands willbe fully satisfied. At last, if the level of storage is above FRCthe reservoir spills. In the WAFLEX, subsequent to reservoirrelease, the water is available to satisfy the demands in firstcome first serve order. It is, however, also possible to buildmore complex models by developing Macros that are rou-tines designed to impose a designed sequence of allocatingwater to downstream users.
The network built up in the spreadsheet consists of a sup-ply and a demand module. The demand module calculatesin upstream direction to determine the demands for the reser-voir release. The supply module calculates in downstreamdirection of the flow. Reservoir releases are calculated usingmacros in which the operation rule curves are used and thedemands are determined by the demand module (Sympho-rian et al., 2003). This computation also includes reservoirlosses through evaporation.
www.hydrol-earth-syst-sci.net/14/2343/2010/ Hydrol. Earth Syst. Sci., 14, 2343–2354, 2010

2348 D. Juızo and R. Liden: Modeling for transboundary water resources planning and allocation
2.2.3 Water Evaluation and Planning system(WEAP21)
WEAP21 was developed by Stockholm Environment Insti-tute (SEI) and is widely used as a system analysis model(Sieber et al., 2002). WEAP21 operates on the basic prin-ciple of water balancing, accounting between supply and de-mand at various system nodes. WEAP21 also has a GIS func-tion allowing the user to visualize the network on the screenand interactively modify or update the inputs of the model.In recent years this software has become popular in variousresearch related to climate adaptation within UN organiza-tions and others especially in research on effect of climatechange on agriculture (Rosenzweig et al., 2004; Yates et al.,2005; Joyce et al., 2006).
The reservoir operation is similar to that of WAFLEX.During the rationing period only a fraction of the storage isavailable for release. However, an added complexity in thismodel is the possibility of using a priority rule to give prefer-ence for use of certain reservoirs for satisfying the demands.A reservoir with lower priority will empty faster than thosewith higher priorities. Furthermore, in the WEAP21 modelthere is a possibility of controlling the water that is suppliedto different users once it is released from the reservoir. This isdone through a priority rule that set preferences to higher val-ued uses such as urban water supply and environmental wa-ter requirements as compared to other water uses; the samerange of priority values applies. In essence the mix of the setof supply and storage priority assigned to the network willdrive the model and the water allocation.
2.2.4 Comparison of the models
All three models are explicit system analysis models and de-pend on input of distributed naturalized inflow calculated byother methods.
The main differences of the three models are how the de-cision to allocate water from storage is done. The WRYM isflexible in the way it approaches water allocation to differentusers in a catchment. The numerical optimization is essen-tially limited to the users downstream each reservoir. How-ever, in case there are complex interconnections of reser-voirs in the basin these can be incorporated in the model.The WEAP21 essentially follows a priority rule of allocation.The system water allocation is driven by water user priorityversus reservoir priority allowing downstream users to bene-fit from any given upstream reservoir in the catchment. Alsothe allocation between users along the system will follow apriority rule given high preference to high value users. InWAFLEX water is allocated to downstream nodes connectedto reservoirs. In order to enable an upstream reservoir to sup-port a downstream it is necessary to build auxiliary functionsthat can only capture information from the time step beforethe one in computation. In other words it is more a compen-sation function than a direct support between the reservoirs.
In the case where reservoirs are located in tributaries feed-ing to a downstream canal leading to a user, the WRYMpenalty structure allows for reservoirs to conjunctively oper-ate to satisfy these demands in the catchment. The reservoirswith lowest penalties will be mobilized first to meet deficitsof supply by another concurrent reservoir. WEAP21 on theother hand is mostly based on comparative value of the reser-voir and the user in question. Normally, users should havehigh priority value associated with their demands in order toprofit from water in storage in a given reservoir. The order inwhich dams will be mobilized to meet the different deficitsin downstream nodes is given by the priority in filling that isassigned to the reservoirs.
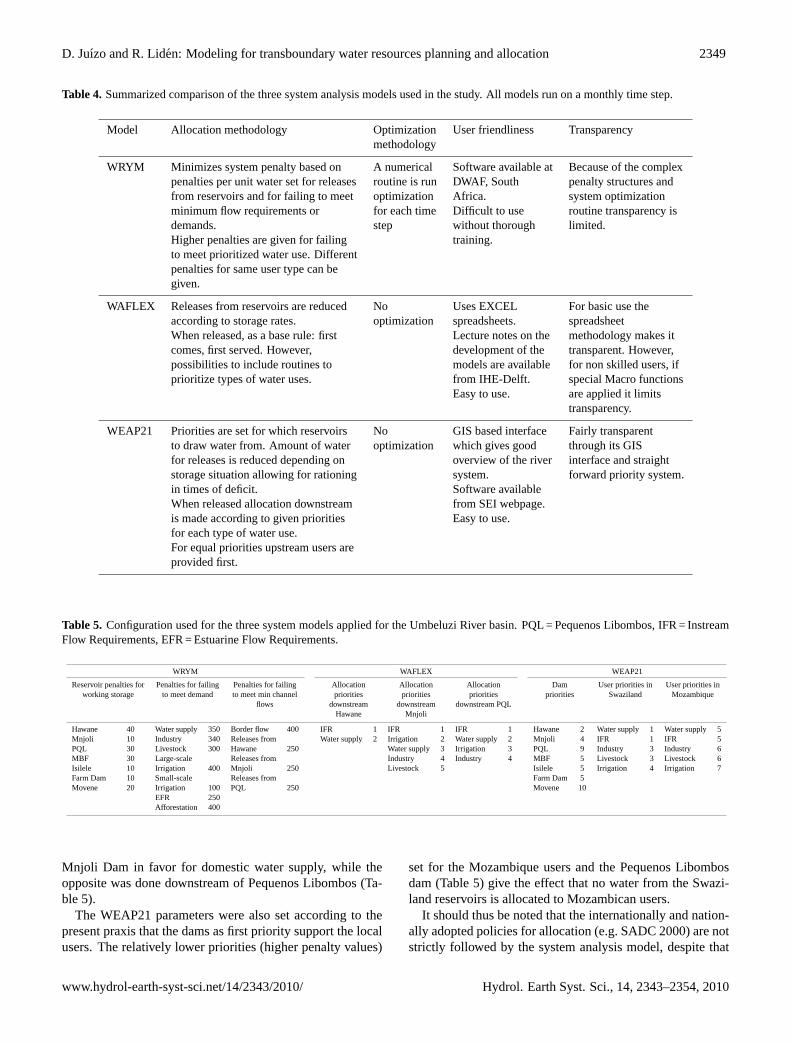
Table 4 gives a comparison of the main features and dif-ferences of the three system analysis models used in the Um-beluzi River basin.
2.3 System configurations
The schematic in Fig. 2 together with identified sites for newdams and expected future water outtakes was used as basisfor all models. Naturalized monthly inflows from 1925 to1999 for all the subbasins of the Umbeluzi River, producedby SWECO and Associates (2005), were used as input toall three models. As a basis for the water allocation, priori-ties were generally set according to the policies in southernAfrica (SADC, 2000). All other inputs values such as reser-voir net-evaporation, precipitation and demands for differentscenarios are equally based on the study by SWECO and As-sociates (2005).
SWECO and Associates (2005) used a calibration method-ology to set the penalty structure of the model. The basisfor the calibration was the knowledge of present water man-agement in the river basin and the observed runoff records.Realistic penalties could thus be found through an iterativeprocess where simulated and observed river runoff was com-pared. In a similar manner the priorities for reservoirs andwater uses were set in the WAFLEX and the WEAP21 (Ta-ble 5).
Table 5 shows that to enable a description of the historicand present water management in the Umbeluzi River basinthe model parameters were set to values that partly contradictthe international and national water policies. For instance,for failing to meet the demands of large-scale scale irrigationin Swaziland the WRYM penalties are set even higher thanfailing to meet urban water supply demands. On the otherhand, the WRYM has included an equally high penalty forfailing to meet the set minimum border flow determined bythe 1976 bi-lateral agreement between the countries (Juizo etal., 2006) aiming at supporting the water supply of MaputoCity.
In WAFLEX a central demand and supply module was in-troduced, which enabled to put the abstraction nodes down-stream of the reservoirs in the order of preference. By us-ing this module, irrigation was prioritized downstream of the
Hydrol. Earth Syst. Sci., 14, 2343–2354, 2010 www.hydrol-earth-syst-sci.net/14/2343/2010/
D. Juızo and R. Liden: Modeling for transboundary water resources planning and allocation 2349
Table 4. Summarized comparison of the three system analysis models used in the study. All models run on a monthly time step.
Model Allocation methodology Optimization User friendliness Transparencymethodology
WRYM Minimizes system penalty based on A numerical Software available at Because of the complexpenalties per unit water set for releases routine is run DWAF, South penalty structures andfrom reservoirs and for failing to meet optimization Africa. system optimizationminimum flow requirements or for each time Difficult to use routine transparency isdemands. step without thorough limited.Higher penalties are given for failing training.to meet prioritized water use. Differentpenalties for same user type can begiven.
WAFLEX Releases from reservoirs are reduced No Uses EXCEL For basic use theaccording to storage rates. optimization spreadsheets. spreadsheetWhen released, as a base rule: first Lecture notes on the methodology makes itcomes, first served. However, development of the transparent. However,possibilities to include routines to models are available for non skilled users, ifprioritize types of water uses. from IHE-Delft. special Macro functions
Easy to use. are applied it limitstransparency.
WEAP21 Priorities are set for which reservoirs No GIS based interface Fairly transparentto draw water from. Amount of water optimization which gives good through its GISfor releases is reduced depending on overview of the river interface and straightstorage situation allowing for rationing system. forward priority system.in times of deficit. Software availableWhen released allocation downstream from SEI webpage.is made according to given priorities Easy to use.for each type of water use.For equal priorities upstream users areprovided first.
Table 5. Configuration used for the three system models applied for the Umbeluzi River basin. PQL = Pequenos Libombos, IFR = InstreamFlow Requirements, EFR = Estuarine Flow Requirements.
WRYM WAFLEX WEAP21
Reservoir penalties for Penalties for failing Penalties for failing Allocation Allocation Allocation Dam User priorities in User priorities inworking storage to meet demand to meet min channel priorities priorities priorities priorities Swaziland Mozambique
flows downstream downstream downstream PQLHawane Mnjoli
Hawane 40 Water supply 350 Border flow 400 IFR 1 IFR 1 IFR 1 Hawane 2 Water supply 1 Water supply 5Mnjoli 10 Industry 340 Releases from Water supply 2 Irrigation 2 Water supply 2 Mnjoli 4 IFR 1 IFR 5PQL 30 Livestock 300 Hawane 250 Water supply 3 Irrigation 3 PQL 9 Industry 3 Industry 6MBF 30 Large-scale Releases from Industry 4 Industry 4 MBF 5 Livestock 3 Livestock 6Isilele 10 Irrigation 400 Mnjoli 250 Livestock 5 Isilele 5 Irrigation 4 Irrigation 7Farm Dam 10 Small-scale Releases from Farm Dam 5Movene 20 Irrigation 100 PQL 250 Movene 10
EFR 250Afforestation 400
Mnjoli Dam in favor for domestic water supply, while theopposite was done downstream of Pequenos Libombos (Ta-ble 5).
The WEAP21 parameters were also set according to thepresent praxis that the dams as first priority support the localusers. The relatively lower priorities (higher penalty values)
set for the Mozambique users and the Pequenos Libombosdam (Table 5) give the effect that no water from the Swazi-land reservoirs is allocated to Mozambican users.
It should thus be noted that the internationally and nation-ally adopted policies for allocation (e.g. SADC 2000) are notstrictly followed by the system analysis model, despite that
www.hydrol-earth-syst-sci.net/14/2343/2010/ Hydrol. Earth Syst. Sci., 14, 2343–2354, 2010

2350 D. Juızo and R. Liden: Modeling for transboundary water resources planning and allocation
Table 6. Scenario development for Umbeluzi River basin.
Scenario Description Comment
1 – 2005 for all users demands including environmental requirements; Assessment of current situation.– 2005 infrastructure (Dams at Hawane, Mnjoli and Pequenos Libombos).
3 – 2025 demand for all users including environmental requirements; Impact of additional infrastructure inmeeting future demands.
– Additional infrastructure, dams at Mbuluzi Falls, Isilele and Movene.
4 – 2005 irrigation demand in both countries; The existing IncoMaputo Agreement– 2005 industrial demand Maputo proposes that countries should reorient– 2025 demand for domestic water supply. there high demand uses to other system– Environmental requirements; with available water. In this scenario– Additional infrastructure, dams at Mbuluzi Falls, Isilele and system performance is tested for Movene.
increased demands except forirrigation that is assumed to bedeveloped in the Maputo River basin.
they are stated as a basis for the modeling. The reason is thatwater resources have not, and are presently not, allocated ac-cording to these policies on the catchment scale in the Um-beluzi River. As a choice the model developer, in this caseSWECO and Associates (2005) and the authors, thus choseto describe the river systems as it works today rather thanhow it would work if the SADC Protocol (SADC, 2000) wasstrictly followed.
The three models were developed to simulate three sce-nario developments in the basin (Table 6) targeting mainlythree main demands in the system (i) urban water supply;(ii) irrigation development and (iii) environmental flow re-leases to the estuary for present (2005) and future condi-tions (2025). Scenario 1 uses the present infrastructure, whilethe other two scenarios include development of new dams.The specific demands for all present and future users wereset equal in the three system analysis models.
3 Results
The results of the three models were compared in terms oflevel of satisfaction for different users and the dam behavior.The level of satisfaction is the ratio between supplied waterand demand for the whole period of modeling.
The models’ natural runoff input covered a period of75 years (1925–1999). Through the long series, the modelscan thus provide estimates of the available water resourcesfor different demand and infrastructure scenarios taking intoaccount the climatic variability of southern Africa.
Despite differences in the level of satisfaction that canbe seen for specific demands and scenarios, all models per-form similarly (Table 7). As expected when comparing 2005and 2025 (Scenarios 1 and 3) the level of satisfaction de-creases for the large users (e.g. large-scale irrigation and
Table 7. Level of satisfaction for the main users.
WRYM WAFLEX WEAP21
Scenario 1 (2005 demand level)
Mbabane water supply 100% 99% 98%Large-scale irrigation 100% 95% 99%Swaziland
Small-scale irrigation 97% 94% 97%Mozambique
Maputo Water supply 99% 97% 98%
Scenario 3 (2025 demand level, new infrastructure)
Mbabane water supply 98% 100% 100%Large-scale irrigation 88% 86% 88%SwazilandSmall-scale irrigation 48% 41% 47%MozambiqueMaputo Water supply 69% 69% 68%
Scenario 4 (2005 demand for irrigation, 2025demand for water supply,)
Mbabane water supply 100% 100% 98%Large-scale irrigation 88% 89% 88%SwazilandSmall-scale irrigation 70% 57% 62%MozambiqueMaputo Water supply 84% 76% 77%
Maputo City). It shows that the additional storage capac-ities introduced are not sufficient to balance the increasedwater demand (Table 1) on the catchment scale. Only forsmall users in the upper Umbeluzi and in the tributaries, theadditional reservoir storages compensate for the increased
Hydrol. Earth Syst. Sci., 14, 2343–2354, 2010 www.hydrol-earth-syst-sci.net/14/2343/2010/

D. Juızo and R. Liden: Modeling for transboundary water resources planning and allocation 2351
demand (e.g. for Mbabane water supply). Even when irriga-tion development is restricted and new infrastructure is putin place (Scenario 4), the level of satisfaction for urban watersupply to Maputo does not reach acceptable levels.
A comparison of the dynamics of the main reservoirs (ex-emplified for Mnjoli Dam in Fig. 5) confirms that the threemodels perform similarly.
A more detailed examination of the results of the threemodels shows that the WRYM model has a totally largerlevel of satisfaction for all users, although the difference isnot large (Table 8). For specific users the models may alsogive different results. An example is the small-scale irriga-tion that shows significant differences in satisfaction levelsfor the three models (Table 7). Since satisfaction levels areclosely linked to the production yield the different model re-sults may therefore affect the judged feasibility of these irri-gation schemes. Also the satisfaction levels for Maputo Cityshow varying levels, although all three models predict lev-els far below what is acceptable for urban supply for bothScenarios 3 and 4.
Another way of expressing how the models performedin meeting demands is to calculate the assurance of supply(Wurb, 2005), i.e. for how many months of the total periodthe demand was fully supplied. All three model results for as-surance of supply were similar to those for satisfaction levels.A trend was, however, that assurance of supply is generallylower than satisfaction level for the users located in smalltributaries with limited upstream storages.
4 Discussion
The results of the three system analysis models applied forthe Umbeluzi River basin in this study revealed two generaland essential findings:
1. Different system analysis models may give differencesin satisfaction levels for specific water users althoughthe same governing input variables are used.
2. The degrees of freedom in all three system analysismodels are very large and thus the model developperhas huge power to allocate water although the modelsare generally described to follow the internationally ac-cepted allocation principles.
The differences in satisfaction levels for specific water usersfound in this study most probably depend on the differentways water allocation and prioritization are structurally han-dled in the three models. In general terms the prioritizationbetween different users were described similarly in all mod-els but the exact levels of satisfaction still differed. In thewater scarce situation, as described by Scenario 3 where totaldemand is higher than the available water resources, all threemodels gave higher level of satisfaction to the large-scale ir-rigation in Swaziland compared to all the downstream users
Table 8. Total level of satisfaction for all users in the UmbeluziRiver.
WRYM WAFLEX WEAP21
Scenario 1 99% 97% 99%Scenario 3 84% 79% 79%Scenario 4 88% 85% 85%
in Mozambique. So in general terms all models allocatedwater as intended. But the level of satisfaction calculatedwith the three models for specific users could vary with up to10–20% units, especially for smaller users. Such differencesmay give a significant difference in the long-term feasibilityof the applied agriculture. On the other hand, the applicationof the three models showed that for large-scale users all threemodels gave similar satisfaction levels as seen by Table 7.
The differences in satisfaction levels due to the differentstructure of the models are, however, completely overriddenby the different results that can be obtained through changingthe allocation priorities in the models. The set up of the threesystem analysis models for Umbeluzi River illustrated thatthe allocation principles stated by the international and na-tional policies are difficult to apply. In the Umbeluzi case themodel developers set up the prioritization according to howthe water has been allocated historically. The reason was thatthe model developers judged this as the most probable sce-nario in the future. The Mnjoli Dam was constructed by, andfor, the sugar cane estates in Swaziland and the Pequenos Li-bombos dam was constructed by the Government of Mozam-bique for water supply to Maputo City. History shows thatit is very difficult to change allocation patterns and, facedwith the task to predict future water resources management,the model developer chose the most likely allocation fore-cast, which is that things will be as they always have been.SWECO and Associates (2005) made a sensitivity analysisfor the Umbeluzi River basin and found that by changingthe penalties in the WRYM model to favor the downstreamMaputo water supply the assurance of supply could be in-creased with 30% for the City and that overall satisfactionlevels could be slightly increased for the whole catchment.This of course led to decreased assurances of supply for theupstream irrigation schemes. If the prioritizations for wateruser types in Swaziland and Mozambique in the WEAP21(Table 6) were set equal, the results would have been simi-lar. Then water would have been drawn from the Mnjoli tosupport Maputo City before allocating water to the irrigationschemes.
What is essential is whether the stakeholders realize thatthese choices have been made by the model developer. Thesystem analysis models are generally described to follow theinternational praxis of water allocation, and even if the inputdata and parameters are reported in detail the stakeholders
www.hydrol-earth-syst-sci.net/14/2343/2010/ Hydrol. Earth Syst. Sci., 14, 2343–2354, 2010

2352 D. Juızo and R. Liden: Modeling for transboundary water resources planning and allocation
26
0
50
100
150
200
0 48 96 144 192 240 288 336 384 432 480 528 576 624 672 720 768 816 864
Sto
red
volu
me
timestep (months)
Mnjoli DamWAFLEX WRYM WEAP21
million (m
3 )
Figure 5 Model performance for Mnjoli dam operation for Scenario 3. Reservoir trajectory during 75 years of
simulation.
Fig. 5. Model performance for Mnjoli dam operation for Scenario 3. Reservoir trajectory during 75 years of simulation.
normally lack the knowledge to comprehend them. This iswhy the transparency and user friendliness of the models areimportant factors in the system analysis. If there is no un-derstanding or transparency of the system analysis model-ing, considerable trust must exist between the stakeholdersand the model developer (Chapman et al., 1995). Such trusthas been developed between the Department of Water Af-fairs and Forestry and the consultants running the WRYM inSouth Africa. Despite that the WRYM model is complicatedto use and has limited transparency it is therefore chosen asthe preferred tool in South Africa for water resources alloca-tion. In transboundary rivers in southern Africa the sametrust does not exist between the model developers, whichare often South African, and the other governments actingas stakeholders.
It may therefore be necessary to review the process of wa-ter resources planning and allocation in transboundary riversin southern Africa. An important step is to agree on the al-location principles and the modeling procedure before themodels are applied. This goes beyond the general princi-ples already agreed in the SADC Protocol. The principlesand procedures may be different depending on the local orregional situation for the different rivers. This step also in-cludes the choice of model tool, model developer and a pro-cedure on how to make the modeling transparent to as manystakeholders as possible. Capacity building of the stakehold-ers is obviously a key factor in this process.
This study may give advice on the choice of system anal-ysis tool. All three models applied to the Umbeluzi Rivershave the functions necessary to make a system analysis ofwater resources in a river basin in southern Africa. TheWEAP model, by its priority rule based allocation, seemsto give the best possibility to maximize water use in a wholeriver basin by allowing reservoirs to support each other intimes of scarcity. For river basin systems that are evenmore complicated and where water has a high price, e.g. sys-tems including large hydropower schemes or large interbasin
transfers for thermo power cooling that require high reliabil-ity of supply, the WRYM models may be advantageous to theWAFLEX and WEAP21.
The numerical optimization to find the least penalty foreach time step may be the reason why the WRYM givestotally slightly higher satisfaction levels than the two othermodels, as seen by Table 8. On the other hand, the sim-pler allocation algorithm used in the WAFLEX model, basi-cally upstream to downstream for each water use type, maybe more close to how water is actually allocated in reality inthe river basins. It may therefore be more close to the actualfuture satisfaction levels taking into account human’s inabil-ity to operate a whole river system optimally. The WAFLEXand the WEAP21 also have an advantage in being more trans-parent and user friendly compared to the WRYM.
The use of all three models, however, demands thoroughunderstanding of system analysis. The experience of apply-ing the three models to the Umbeluzi River is that mistakesare easily made when the individual penalties and prioritiesare set. Neither of the models have any quality assurancemodule, which means that it is up to the model developer’sexperience and knowledge to identify errors and judge thereasonability of the model results. The application of thethree system analysis models to the Umbeluzi River basinfurther showed that there is not one single solution for thewater allocation. Depending on the parameters set or themodel used, different results can be obtained as seen in Ta-ble 7. None of these results can be said to be more correctthan the other.
Hydrol. Earth Syst. Sci., 14, 2343–2354, 2010 www.hydrol-earth-syst-sci.net/14/2343/2010/

D. Juızo and R. Liden: Modeling for transboundary water resources planning and allocation 2353
5 Conclusions
In this study we have investigated the implications of apply-ing three different system analysis models for water alloca-tion in an international river basin. The results show that thethree models, WRYM, WAFLEX and WEAP21, all are ad-equate tools for system analysis of river basins in southernAfrica, although the structure and complexity of the mod-els are different. The obtained level of satisfaction for spe-cific water users could, however, vary depending on whichmodel was used, which causes uncertainties if an individ-ual model is applied directly for studying the feasibility ofwater demanding development. The reason for the diverseresults is the structurally different ways of describing allo-cation and prioritization of water in the three models. How-ever, the large degrees of freedom in all system models causeeven larger uncertainty in the results since the model devel-oper can, intentionally or unintentionally, direct the resultsto favor certain water users. These uncertainties are oftenunknown for the stakeholders and policy makers, who usethe results of the system analysis models to plan future waterallocation.
The water allocation in Umbeluzi River for future develop-ment scenarios is faced with considerable difficulties as thefuture demands can not be fully met even with an increasein reservoir storages. This study shows that planning of fu-ture water allocation in this transboundary river is difficultthrough straightforward application of system analysis mod-els. Prior to modeling, the main stakeholders have to agreeon the specific allocation principles and the modeling proce-dure to apply for the specific river basin in question. Generalprinciples such as the SADC Protocol are not sufficient ba-sis for the system analysis. To enable joint agreement on theprinciples to apply and to quality assure the results, signifi-cant capacity of system analysis must exist among the mainstakeholders. Furthermore, transparency of the system anal-ysis modeling is a key for the joint acceptance of the results.Alternatively, trust must be built between the stakeholdersand the system analysis model developers, something that isdifficult in transboundary river basins.
This study illustrates the possibility for the introduc-tion of other modeling packages for water resources alloca-tion in transboundary rivers in southern Africa beyond theWRYM, which has been adopted as the preferred tool buthas been questioned because of its complexity and limitedtransparency. For complex river basin systems the WRYMmodel most probably is the best tool but in many cases theWAFLEX and WEAP21 may be good alternatives. The ad-vantage of these models compared to the WRYM is that theyare relatively user friendly and transparent.
The conclusion of this study is that the choice of modeldoes not per se affect the decision of best water allocationand infrastructure layout of a shared river basin. The chosenallocation and prioritization principles for the specific riverbasin and the model developer’s experience and integrity are
more important factors to find the optimal and equitable al-location. This has to be realized by stakeholders and policymakers in order to improve the water resources planning andallocation in transboundary rivers in southern Africa. Thisstudy also shows the importance of river basin conceptual-ization as a key element in preparation for allocation.
Acknowledgements.This work received financial support fromSIDA-SAREC. The authors are thankful to all those who provideddata for this research. We also wish to thank Stockholm Environ-mental Institute (SEI) for providing a free WEAP21 licence toUEM and DWAF for providing the WRYM software.
Edited by: P. van der Zaag
References
Carmo Vaz, A. and van der Zaag, P.: Sharing the Incomati wa-ters: co-operation and competition in the balance: From potentialconflict to co-operation potential, UNESCO/IHP/WWAP/IHP-VI/Technical Documents in Hydrology/PC-CP Series/n. 14,2003.
Chapman, R. A., Manders, P. T., Scholes, R. J., and Bosch, J. M.:Who should get the water? Decision support for water resourcemanagement, Water Sci. Technol., 32(5–6), 37-43, 1995.
Consultec and BKS Acres: Joint Inkomati Basin Study: Phase 2,Tripartite Permanent Technical Committee, Kingdom of Swazi-land – Republic of Mozambique – Republic of South Africa,2000.
de Groot, R. and Oosterwijk, W.: Water Resources Study of the Ma-puto River Basin: Creating a water resources yield model for theMaputo river basin, M.Sc. report, Delft University of Technology(TU-Delft), Delft, The Netherlands, 2006.
Dent, M.: Installed water resource modelling systems for catchmentmanagement agencies, Water SA, 27(3), 333–340, 2001.
Draper , A.J, Lund, J.R.: Optimal Hedging and Carryover StorageValue, Journal of Water Resources Panning and Management,ASCE, January/February, Vol. 130, no 1,pp 83-87, 2004.
Grossmann, W., Guariso, G., Hitz, M., and Wethner, H.: A MinCost Solution for Dynamic Assignment Problems in Networkswith Storage Devices, Manage. Sci., 41(1), 83–93, 1995.
Joyce, B., Vacuna, S., Dale, L., Hanemann, M., Purkey, D., andYates, D.: Climate change impacts on water for agriculture inCalifornia: A case study in the Sacramento Valley, CaliforniaClimate Change Center, White Paper, CEC-500-2005-194-SF,California, USA, 2006.
Juizo, D., Liden, R., and Carmo Vaz, A.: Remaining Challengesfor bi-national agreements on shared water: The Umbeluzi case,Water Policy, 8, 231–253, 2006.
Le Roy, E.: A study of the development of water resources inthe Olifants catchment, South Africa: Application of the WEAPmodel, M.Sc. report, Imperial College, London, 2005.
Levite, H. and Sally, H: Linkages between Productivity and equi-table allocation of water, Phys. Chem. Earth, 27, 825–830, 2002.
Mackenzie, R. S. and van Rooyen, P. G.: Water Resources YieldModel: User Guide – Release 4.1.1, Department of Water Af-fairs (DWAF), South Africa, 1999.
Mackenzie, R. S. and van Rooyen, P. G.: Management large waterresources systems, Water Supp., 3(3), 297–304, 2003.
www.hydrol-earth-syst-sci.net/14/2343/2010/ Hydrol. Earth Syst. Sci., 14, 2343–2354, 2010

2354 D. Juızo and R. Liden: Modeling for transboundary water resources planning and allocation
Nkomo, S. and van der Zaag, P.: Equitable water allocation in aheavily committed international catchment area: the case of theKomati Catchment, Phys. Chem. Earth, 29, 1309–1317, 2004.
Raju, K. S. and Pillai, C. R. S.: Multicriterion decision making inriver basin planning and development, Eur. J. Oper. Res., 112,249–257, 1999.
Rosenzweig, C., Strzepek, K. M., Major, D. C., Iglesias, A., Yates,D. N., McCluskey, A., and Hillel, A.: Water resources for agri-culture in a changing climate: international case studies, GlobalEnviron. Change, 14, 345–360, 2004.
SADC: Revised Protocol on Shared Watercourses in the SouthernAfrican Development Community (SADC), 2000.
Savenije, H. H. G.: Spreadsheets: Flexible tools for integrated man-agement of water resources in river basins, IAHS Publications,231, 741–744, 1995.
Sengo, D.J., Kachapila, A., van der Zaag, P., Mul, M., and Nkomo,S.: Valuing the environmental water pulses into the Incomati es-tuary: Key to achieving equitable and sustainable utilisation oftransboundary waters, Phys. Chem. Earth, 30, 648–657, 2005.
Sieber, J., Huber-Lee, A., and Raskin, P.: WEAP: Water Evalua-tion And Planning System User Guide (for WEAP21), Stock-holm Environmental Institute – Boston, and Tellus Institute, UserGuide for WEAP21, Boston, MA, 2002.
Sweco in association with Consultec Lda, Impacto Lda, BKS,Knight Piesold: Joint Umbeluzi River Basin Study: Final Report,Report prepared for the Government of the Republic of Mozam-bique and the Government of the Kingdom of Swaziland, 2005.
Symphorian, G. R., Madamombe, E., and van der Zaag, P.: Damoperation for environmental water releases; the case of OsbornDam, Save Catchment, Zimbabwe, Phys. Chem. Earth, 28, 985–993, 2003.
Van der Zaag, P., and Bolding, A.: Water governance in the Pungweriver basin: institutional limits to the upscaling of hydraulicinfrastructure, in: Transboundary water governance in South-ern Africa; examining underexplored dimensions, edited by:Swatuk, L. A. and Wirkus, L., Nomos, Bonn, 163–177, 2009.
Van der Zaag, P. and Carmo Vaz,A : Sharing the Incomati wa-ters: cooperation and competition in the balance, Water Policy,5, 349–368, 2003.
Wang, L. F. and Hipel, W. K.: Cooperative water resources alloca-tion based on equitable rights, Proceedings of the 2003 IEEE In-ternational Conference on Systems, Man and Cybernetics, Wash-ington, USA, 5–8 October, 2003.
Wurb, R. A.: Modeling river/reservoir system management, waterallocation, and supply reliability, J. Hydrol., 300, 100–113, 2005.
Yates, D., Siber, J., Purkey, D., and Huber-Lee, A.: WEAP21-A Demand-, Priority-, and Preference-Driven Water PlanningModel Part 1: model characteristics, Water Int., 30(4), 487–500,2005.
Hydrol. Earth Syst. Sci., 14, 2343–2354, 2010 www.hydrol-earth-syst-sci.net/14/2343/2010/
Related Documents