Model Performance Evaluation Data Base and Software - Application to CENRAP Betty K. Pun, Shu-Yun Chen, Kristen Lohman, Christian Seigneur PM Model Performance Workshop Chapel Hill, NC 11 February 2004

Model Performance Evaluation Data Base and Software - Application to CENRAP Betty K. Pun, Shu-Yun Chen, Kristen Lohman, Christian Seigneur PM Model Performance.
Dec 24, 2015
Welcome message from author
This document is posted to help you gain knowledge. Please leave a comment to let me know what you think about it! Share it to your friends and learn new things together.
Transcript
Model Performance Evaluation Data Base and Software - Application to
CENRAP
Betty K. Pun, Shu-Yun Chen, Kristen Lohman, Christian Seigneur
PM Model Performance Workshop
Chapel Hill, NC
11 February 2004
Acknowledgements
• Funding for the MPE software is provided by CENRAP under Modeling Umbrella Contract 02-00307-RP-005 Work Order 1; PM modeling and evaluation are funded under Work Order 3
• CENRAP Modeling Workgroup and outside reviewers provided feedback on work plan and suggestions on useful features in the MPE database and software
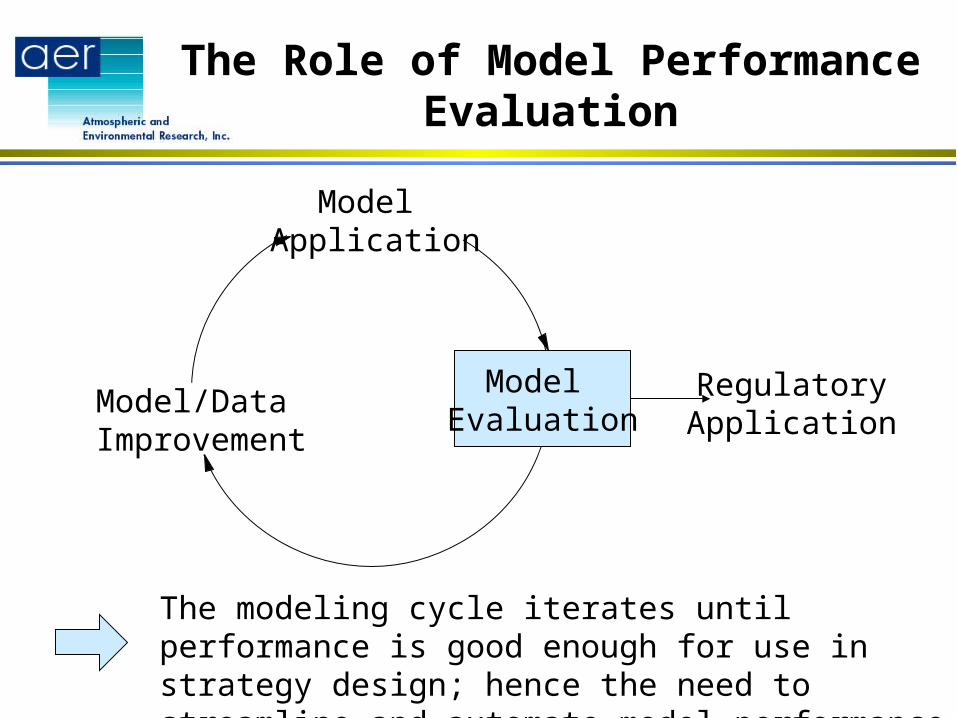
The Role of Model Performance Evaluation
Model Application
Model Evaluation
Model/Data Improvement
RegulatoryApplication
The modeling cycle iterates until performance is good enough for use in strategy design; hence the need to streamline and automate model performance evaluation
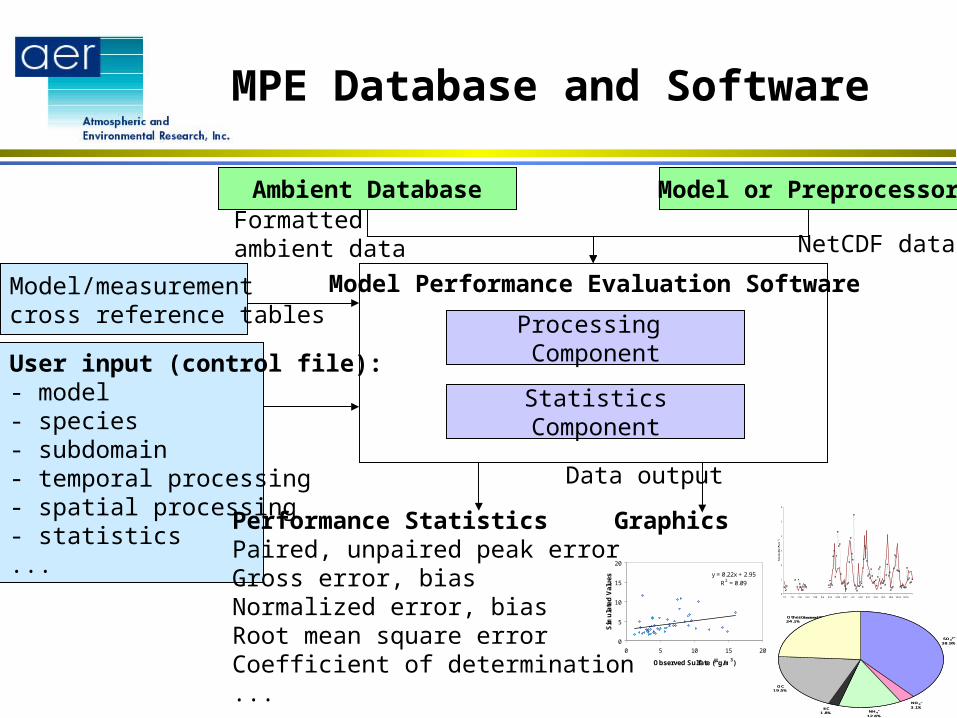
Processing Component
StatisticsComponent
Formatted ambient data
Model or Preprocessor
NetCDF data
Model/measurement cross reference tables
User input (control file):- model- species - subdomain- temporal processing- spatial processing- statistics...
Data output
Model Performance Evaluation Software
Ambient Database
MPE Database and Software
Performance StatisticsPaired, unpaired peak errorGross error, biasNormalized error, biasRoot mean square errorCoefficient of determination...
Observed PM2.5 =6.49 µg/m3
EC1.8%
OC19.5%
Other24.1%
SO42–
38.9%
NO3–
3.1%NH4
+
12.6%
EC1.8%
OC19.5%
Other24.1%
SO42–
38.9%
NO3–
3.1%NH4
+
12.6%
0
1
2
3
4
5
6
7/2 7/9 7/16 7/23 7/30 8/6 8/13 8/20 8/27 9/3 9/10 9/17 9/24 10/1 10/8 10/15 10/22
Tota
l Sulfur
(mg/m
3)
Big Bend
y = 0.22x + 2.95R2 = 0.09
0
5
10
15
20
0 5 10 15 20
Observed Sulfate (mg/m3)
Sim
ula
ted
Val
ues
Graphics
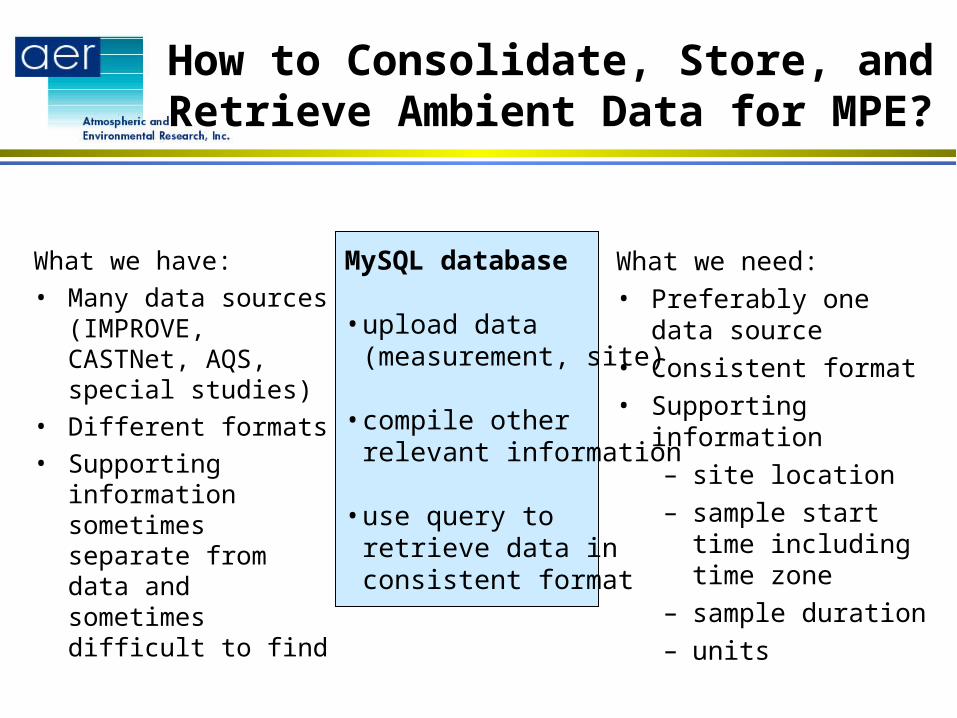
How to Consolidate, Store, and Retrieve Ambient Data for MPE?
What we have:• Many data sources
(IMPROVE, CASTNet, AQS, special studies)
• Different formats• Supporting
information sometimes separate from data and sometimes difficult to find
What we need:• Preferably one data
source• Consistent format• Supporting information
– site location– sample start time
including time zone– sample duration– units
MySQL database
• upload data(measurement, site)
• compile other relevant information
• use query to retrieve data in consistent format
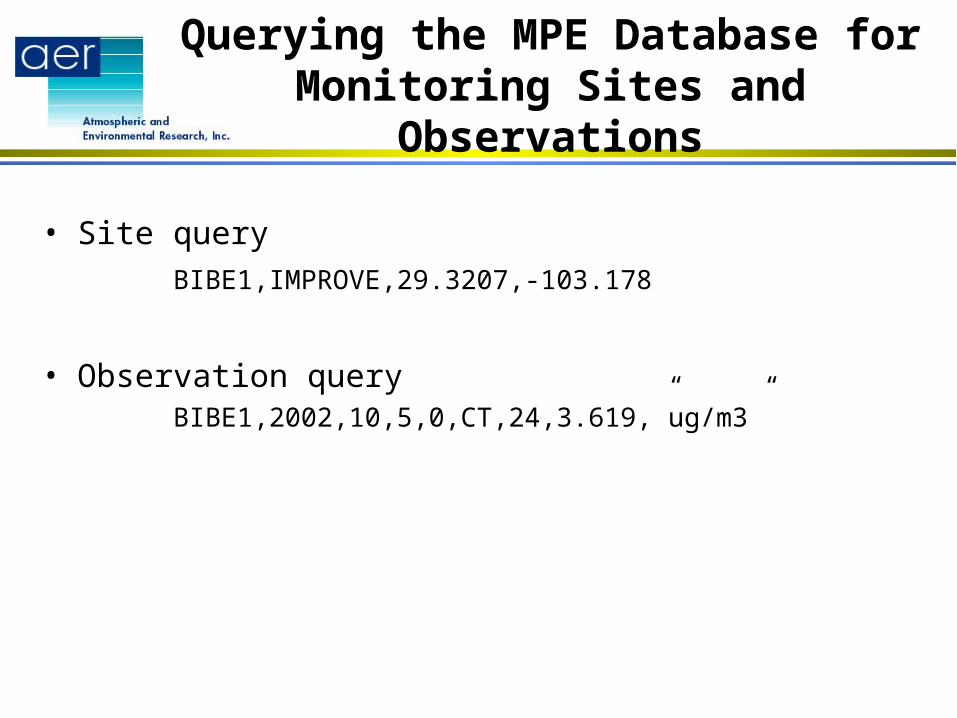
Querying the MPE Database for Monitoring Sites and Observations
• Site query
BIBE1,IMPROVE,29.3207,-103.178
• Observation queryBIBE1,2002,10,5,0,CT,24,3.619,”ug/m3”
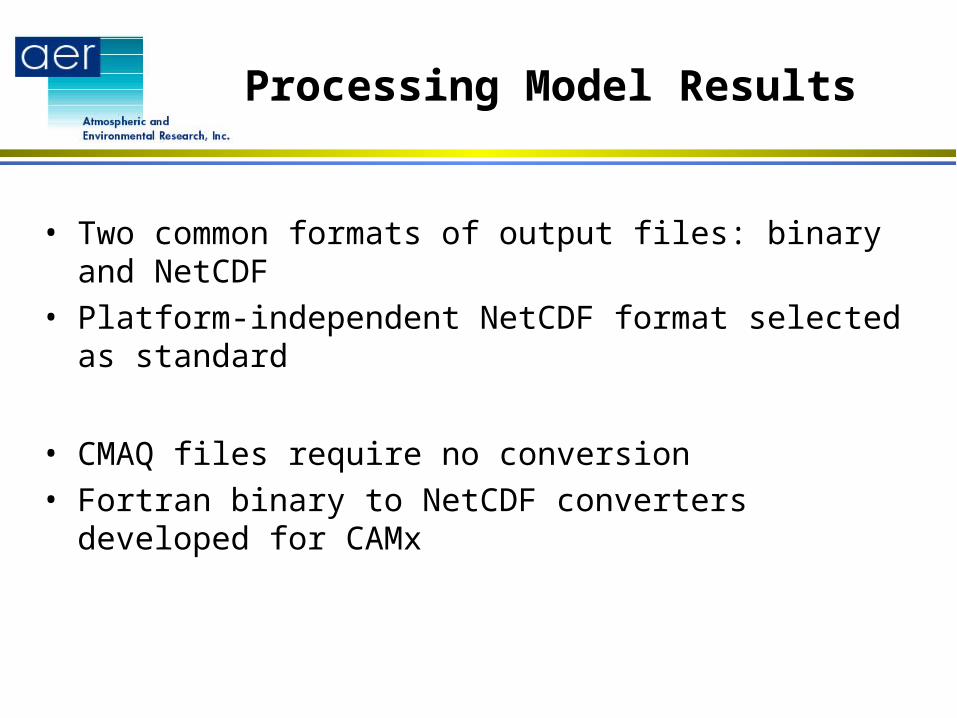
Processing Model Results
• Two common formats of output files: binary and NetCDF• Platform-independent NetCDF format selected as standard
• CMAQ files require no conversion• Fortran binary to NetCDF converters developed for CAMx

MPE Software Processing Component
• Read observations
– perform time zone changes
– average to longer periods
– perform unit conversions
• Extract modeling data
– calculate grid cell corresponding to latitude/longitude
– extract model data at grid cell(s)
– sum components of species
– perform unit conversions
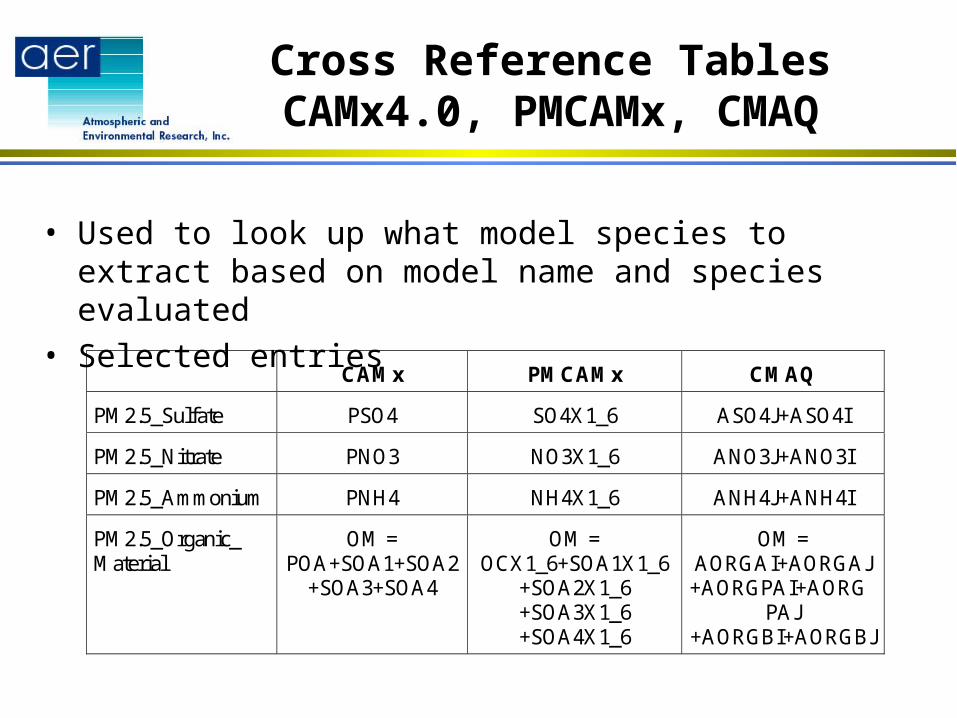
Cross Reference TablesCAMx4.0, PMCAMx, CMAQ
• Used to look up what model species to extract based on model name and species evaluated
• Selected entries
CAMx PMCAMx CMAQ
PM2.5_Sulfate PSO4 SO4X1_6 ASO4J+ASO4I
PM2.5_Nitrate PNO3 NO3X1_6 ANO3J+ANO3I
PM2.5_Ammonium PNH4 NH4X1_6 ANH4J+ANH4I
PM2.5_Organic_Material
OM =POA+SOA1+SOA2
+SOA3+SOA4
OM =OCX1_6+SOA1X1_6
+SOA2X1_6+SOA3X1_6+SOA4X1_6
OM =AORGAI+AORGAJ+AORGPAI+AORG
PAJ+AORGBI+AORGBJ
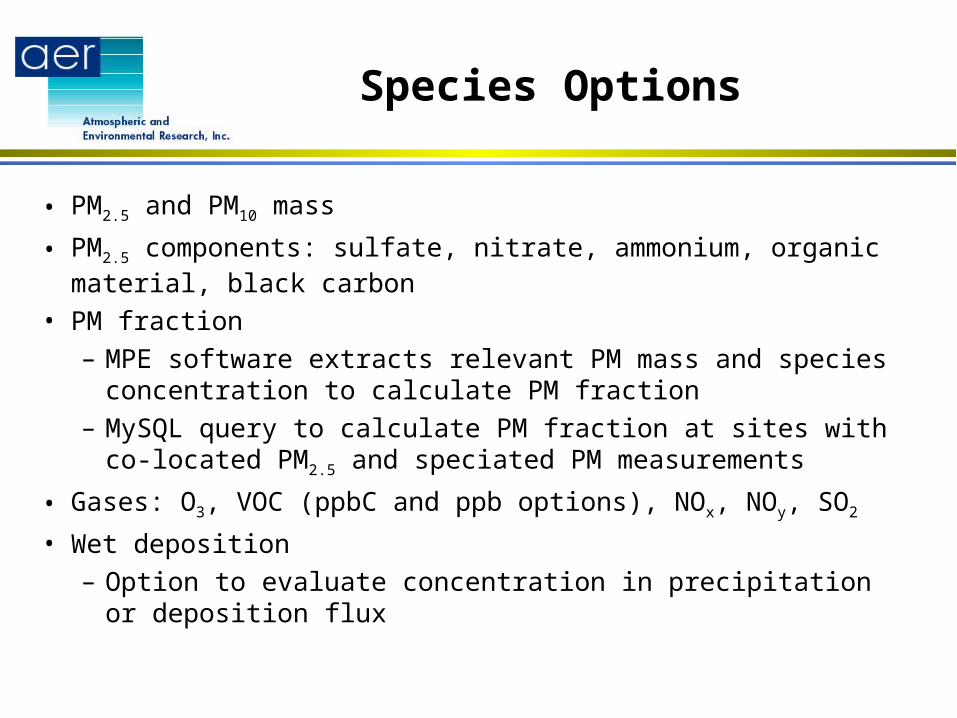
Species Options
• PM2.5 and PM10 mass
• PM2.5 components: sulfate, nitrate, ammonium, organic material, black carbon
• PM fraction
– MPE software extracts relevant PM mass and species concentration to calculate PM fraction
– MySQL query to calculate PM fraction at sites with co-located PM2.5 and speciated PM measurements
• Gases: O3, VOC (ppbC and ppb options), NOx, NOy, SO2
• Wet deposition
– Option to evaluate concentration in precipitation or deposition flux
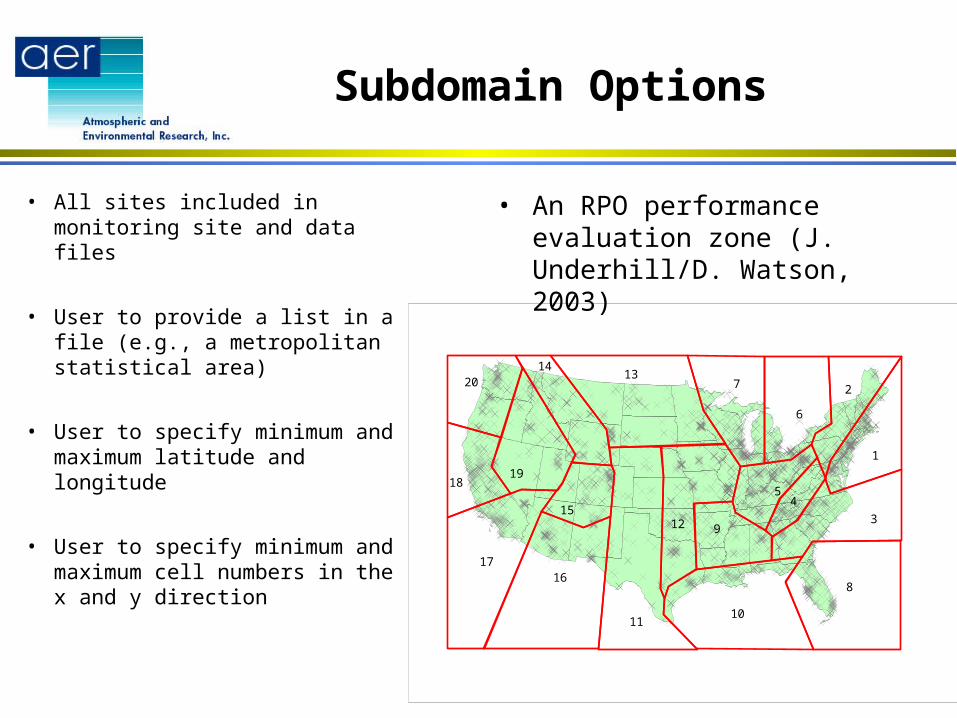
Subdomain Options
• All sites included in monitoring site and data files
• User to provide a list in a file (e.g., a metropolitan statistical area)
• User to specify minimum and maximum latitude and longitude
• User to specify minimum and maximum cell numbers in the x and y direction
• An RPO performance evaluation zone (J. Underhill/D. Watson, 2003)
15
1918
11
14
1617
20
9
137
8
3
1
2
45
6
10
12
Temporal Processing Options
• User can select sub-period within simulation period for evaluation
• User can specify a comparison interval that is greater than or equal to the measurement interval– MPE software will temporally average both
measurements and model results based on the comparison interval
– A completeness criterion is needed when performing temporal averaging (>75% recommended)
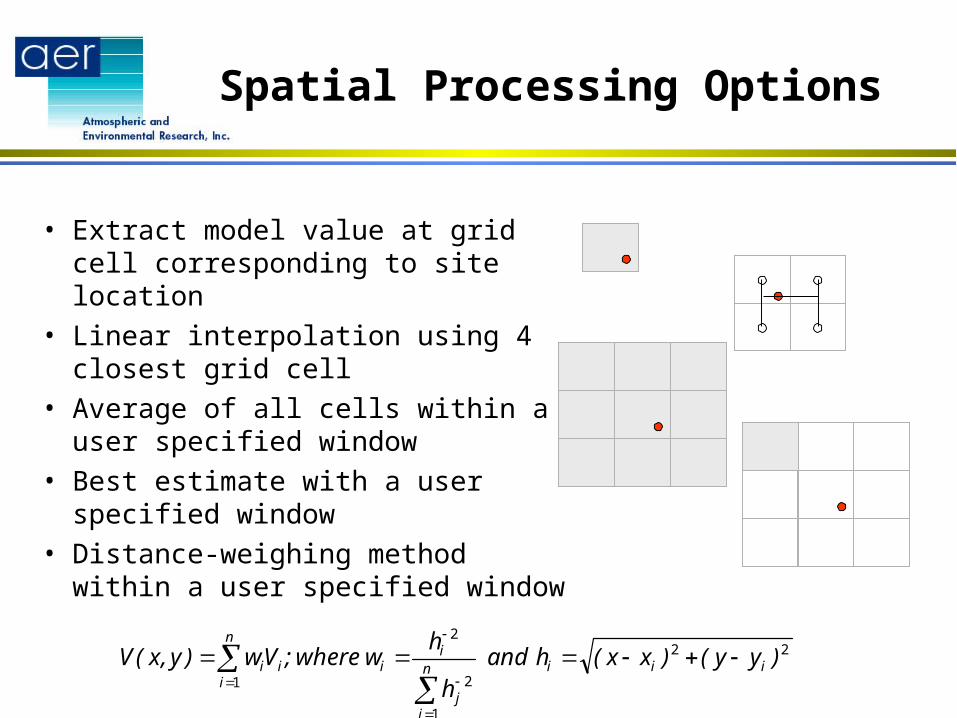
Spatial Processing Options
• Extract model value at grid cell corresponding to site location
• Linear interpolation using 4 closest grid cell
• Average of all cells within a user specified window
• Best estimate with a user specified window
• Distance-weighing method within a user specified window
22
1
2
2
1
)yy()xx(handh
hwwhere;Vw)y,x(V iiin
jj
ii
n
iii
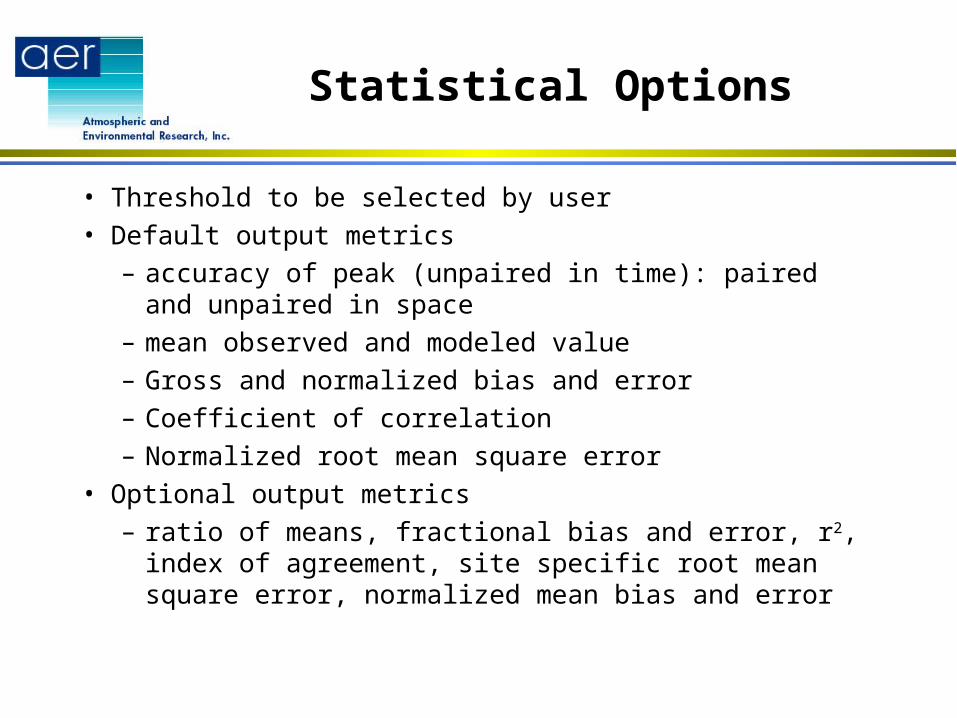
Statistical Options
• Threshold to be selected by user
• Default output metrics
– accuracy of peak (unpaired in time): paired and unpaired in space
– mean observed and modeled value
– Gross and normalized bias and error
– Coefficient of correlation
– Normalized root mean square error
• Optional output metrics
– ratio of means, fractional bias and error, r2, index of agreement, site specific root mean square error, normalized mean bias and error
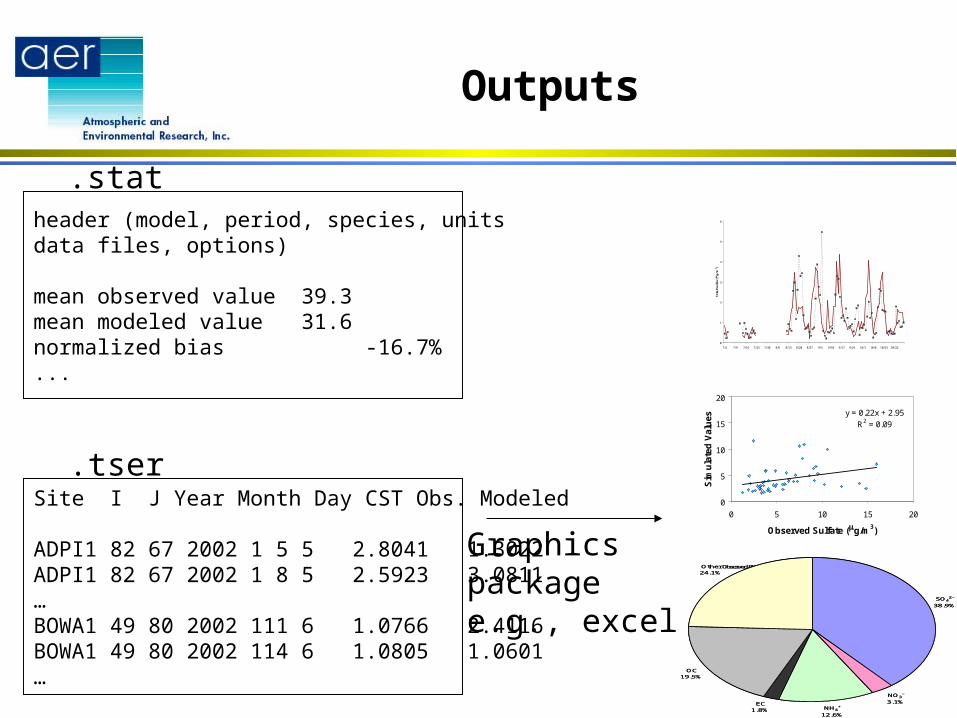
Outputs
header (model, period, species, unitsdata files, options)
mean observed value 39.3mean modeled value 31.6normalized bias -16.7%...
Site I J Year Month Day CST Obs. Modeled
ADPI1 82 67 2002 1 5 5 2.8041 1.3022ADPI1 82 67 2002 1 8 5 2.5923 3.0811…BOWA1 49 80 2002 111 6 1.0766 2.4116BOWA1 49 80 2002 114 6 1.0805 1.0601…
Graphics packagee.g., excel
Observed PM2.5 =6.49 µg/m3
EC1.8%
OC19.5%
Other24.1%
SO42–
38.9%
NO3–
3.1%NH4
+
12.6%
EC1.8%
OC19.5%
Other24.1%
SO42–
38.9%
NO3–
3.1%NH4
+
12.6%
0
1
2
3
4
5
6
7/2 7/9 7/16 7/23 7/30 8/6 8/13 8/20 8/27 9/3 9/10 9/17 9/24 10/1 10/8 10/15 10/22
Tota
l Sulf
ur
(mg/m
3)
Big Bend
y = 0.22x + 2.95
R2 = 0.09
0
5
10
15
20
0 5 10 15 20
Observed Sulfate (mg/m3)
Sim
ula
ted
Val
ues
.stat
.tser
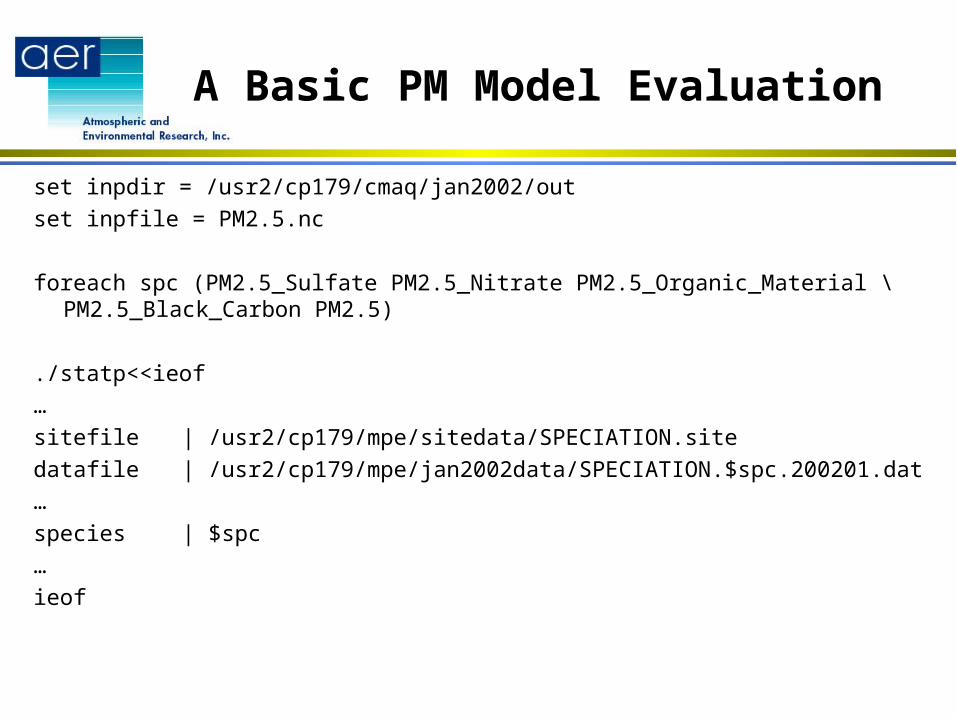
A Basic PM Model Evaluation
set inpdir = /usr2/cp179/cmaq/jan2002/out
set inpfile = PM2.5.nc
foreach spc (PM2.5_Sulfate PM2.5_Nitrate PM2.5_Organic_Material \ PM2.5_Black_Carbon PM2.5)
./statp<<ieof
…
sitefile | /usr2/cp179/mpe/sitedata/SPECIATION.site
datafile | /usr2/cp179/mpe/jan2002data/SPECIATION.$spc.200201.dat
…
species | $spc
…
ieof
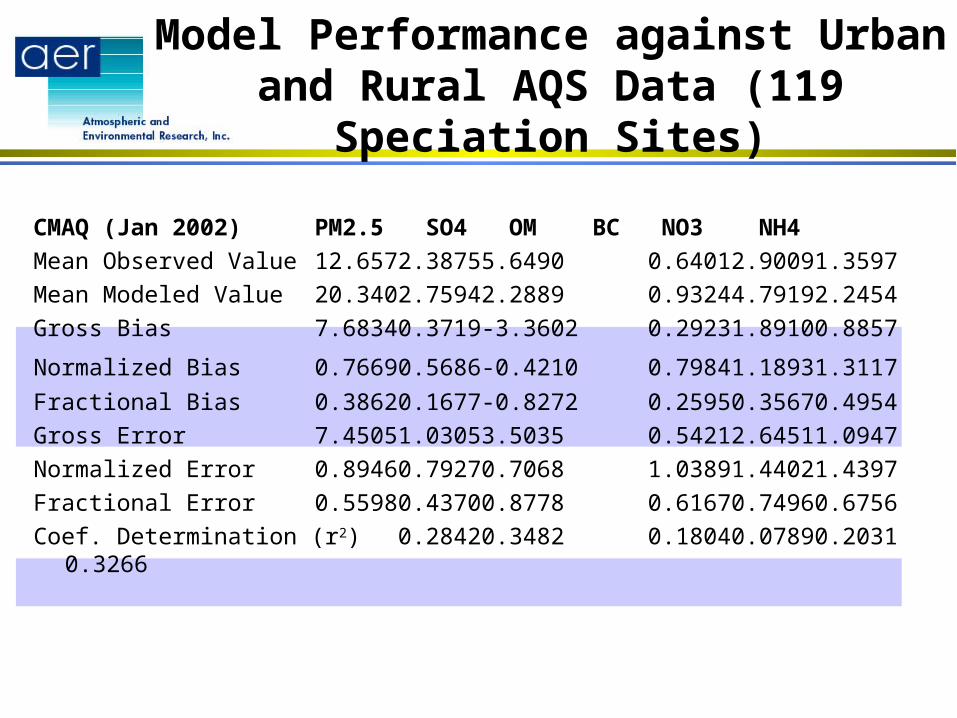
Model Performance against Urban and Rural AQS Data (119 Speciation Sites)
CMAQ (Jan 2002) PM2.5 SO4 OM BC NO3 NH4
Mean Observed Value 12.657 2.3875 5.6490 0.6401 2.9009 1.3597
Mean Modeled Value 20.340 2.7594 2.2889 0.9324 4.7919 2.2454
Gross Bias 7.6834 0.3719 -3.3602 0.2923 1.8910 0.8857
Normalized Bias 0.7669 0.5686 -0.4210 0.7984 1.1893 1.3117
Fractional Bias 0.3862 0.1677 -0.8272 0.2595 0.3567 0.4954
Gross Error 7.4505 1.0305 3.5035 0.5421 2.6451 1.0947
Normalized Error 0.8946 0.7927 0.7068 1.0389 1.4402 1.4397
Fractional Error 0.5598 0.4370 0.8778 0.6167 0.7496 0.6756
Coef. Determination (r2) 0.2842 0.3482 0.1804 0.0789 0.2031 0.3266

Subset of Sites Selected by Grid Cell Range
foreach spc (PM2.5_Sulfate PM2.5_Nitrate PM2.5_Organic_Material \ PM2.5_Black_Carbon PM2.5)./statp<<ieof…sitefile | /usr2/cp179/mpe/sitedata/IMPROVE.sitedatafile | /usr2/cp179/mpe/jan2002data/IMPROVE.$spc.200201.dat…species | $spc…model | CAMX…listflag | 3…minx, miny | 2, 2maxx, maxy| 100, 94...ieof
Internal boundary excluded from evaluation
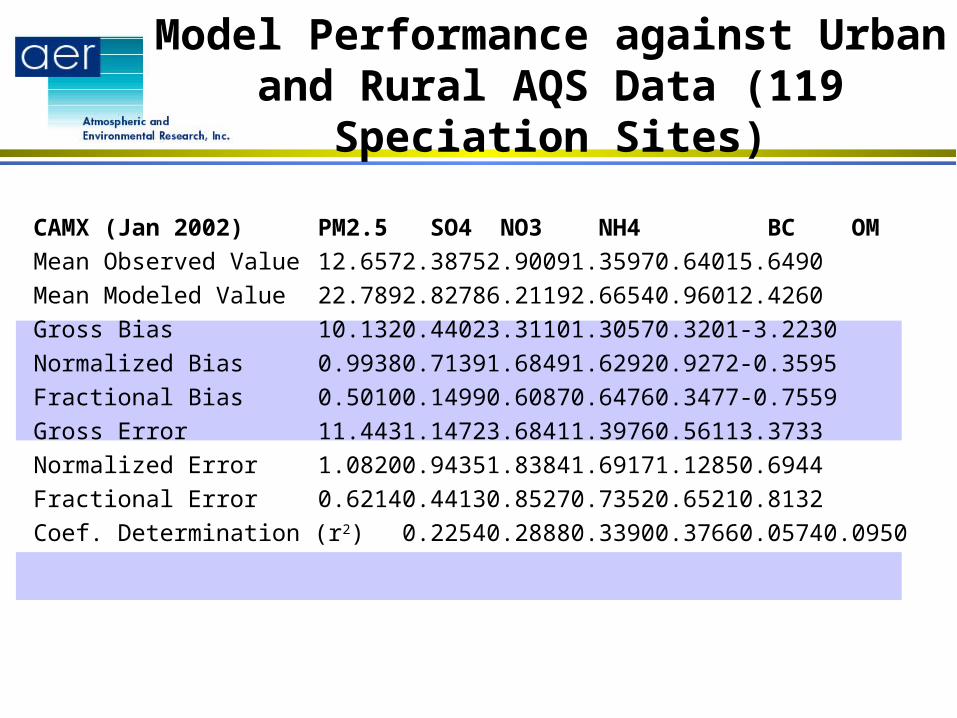
Model Performance against Urban and Rural AQS Data (119 Speciation Sites)
CAMX (Jan 2002) PM2.5 SO4 NO3 NH4 BC OM
Mean Observed Value 12.657 2.3875 2.9009 1.3597 0.6401 5.6490
Mean Modeled Value 22.789 2.8278 6.2119 2.6654 0.9601 2.4260
Gross Bias 10.132 0.4402 3.3110 1.3057 0.3201 -3.2230
Normalized Bias 0.9938 0.7139 1.6849 1.6292 0.9272 -0.3595
Fractional Bias 0.5010 0.1499 0.6087 0.6476 0.3477 -0.7559
Gross Error 11.443 1.1472 3.6841 1.3976 0.5611 3.3733
Normalized Error 1.0820 0.9435 1.8384 1.6917 1.1285 0.6944
Fractional Error 0.6214 0.4413 0.8527 0.7352 0.6521 0.8132
Coef. Determination (r2) 0.2254 0.2888 0.3390 0.3766 0.0574 0.0950

• Gross bias
• Normalized bias
• Gross error
• Normalized error
• r2
Comparison of Selected Performance Statistics at Speciation Sites
A color box is shown under the model with better performance
CMAQ CAMx
Key: PM2.5 Sulfate Nitrate Ammonium
Organic material Black carbon
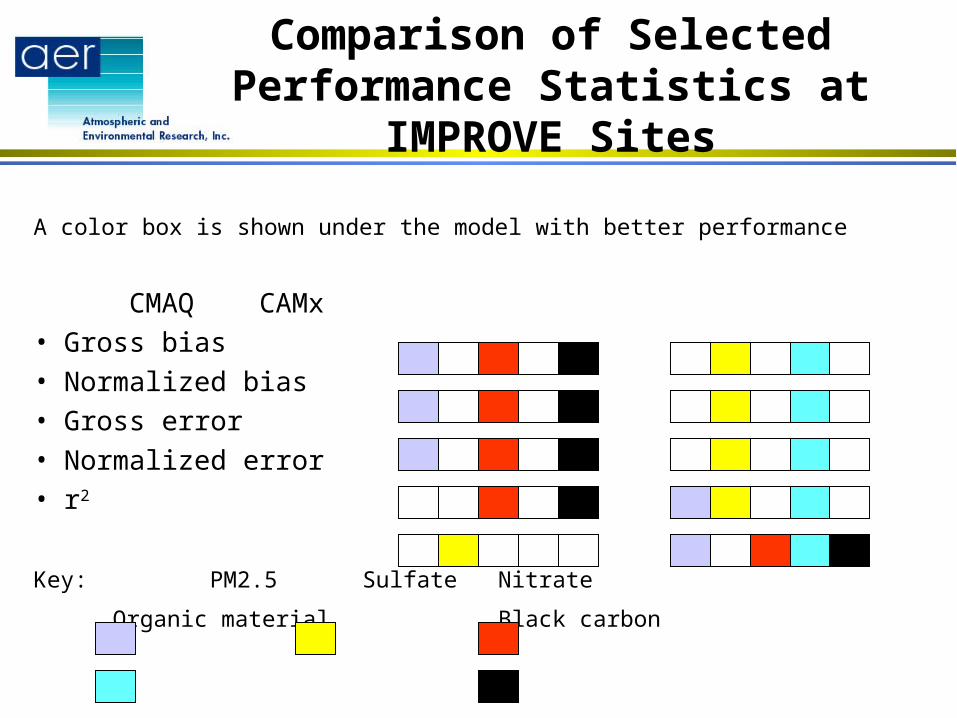
A color box is shown under the model with better performance
CMAQ CAMx• Gross bias • Normalized bias• Gross error• Normalized error• r2
Key: PM2.5 Sulfate Nitrate
Organic material Black carbon
Comparison of Selected Performance Statistics at IMPROVE Sites
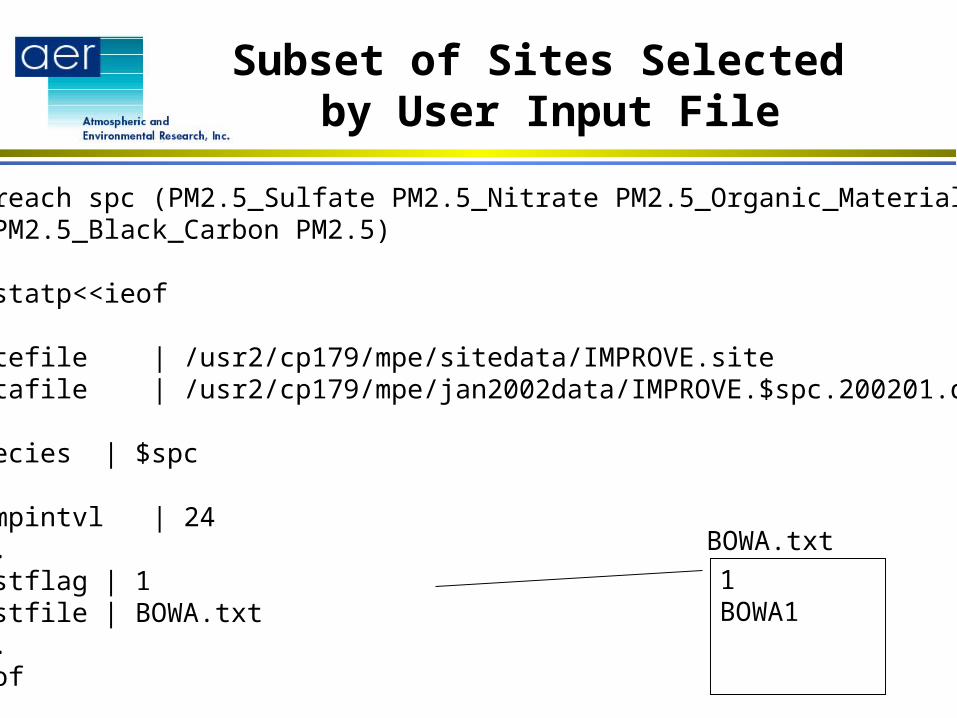
Subset of Sites Selected by User Input File
foreach spc (PM2.5_Sulfate PM2.5_Nitrate PM2.5_Organic_Material \ PM2.5_Black_Carbon PM2.5)
./statp<<ieof…sitefile | /usr2/cp179/mpe/sitedata/IMPROVE.sitedatafile | /usr2/cp179/mpe/jan2002data/IMPROVE.$spc.200201.dat…species | $spc…compintvl | 24...listflag | 1listfile | BOWA.txt...ieof
1BOWA1
BOWA.txt
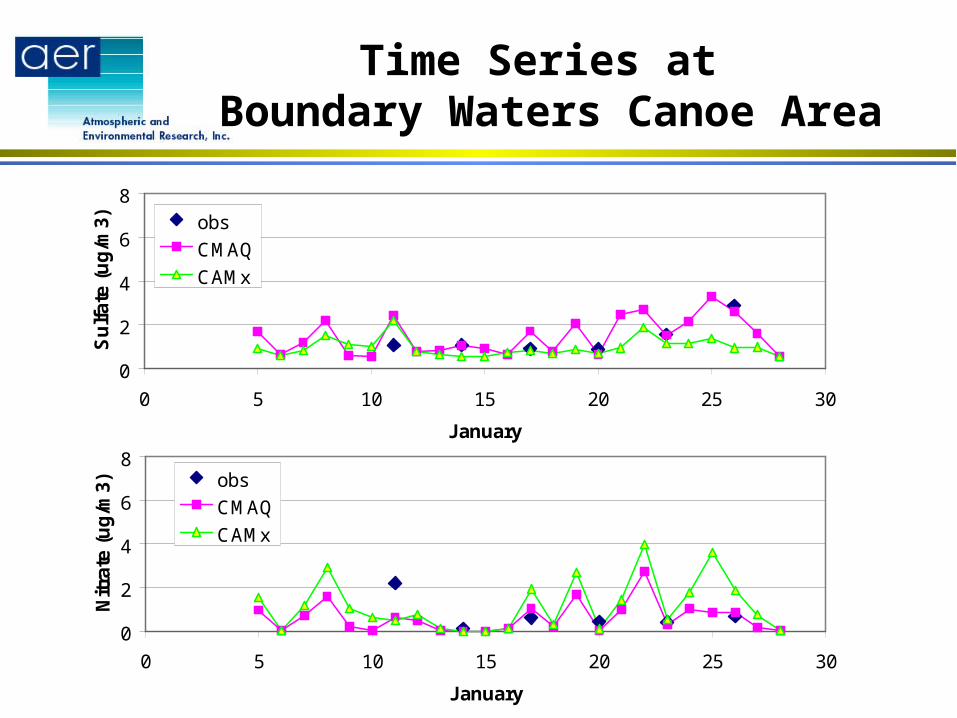
Time Series at Boundary Waters Canoe Area
0
2
4
6
8
0 5 10 15 20 25 30
January
Su
lfa
te (
ug
/m3
) obs
CMAQ
CAMx
0
2
4
6
8
0 5 10 15 20 25 30
January
Nit
rate
(u
g/m
3) obs
CMAQ
CAMx
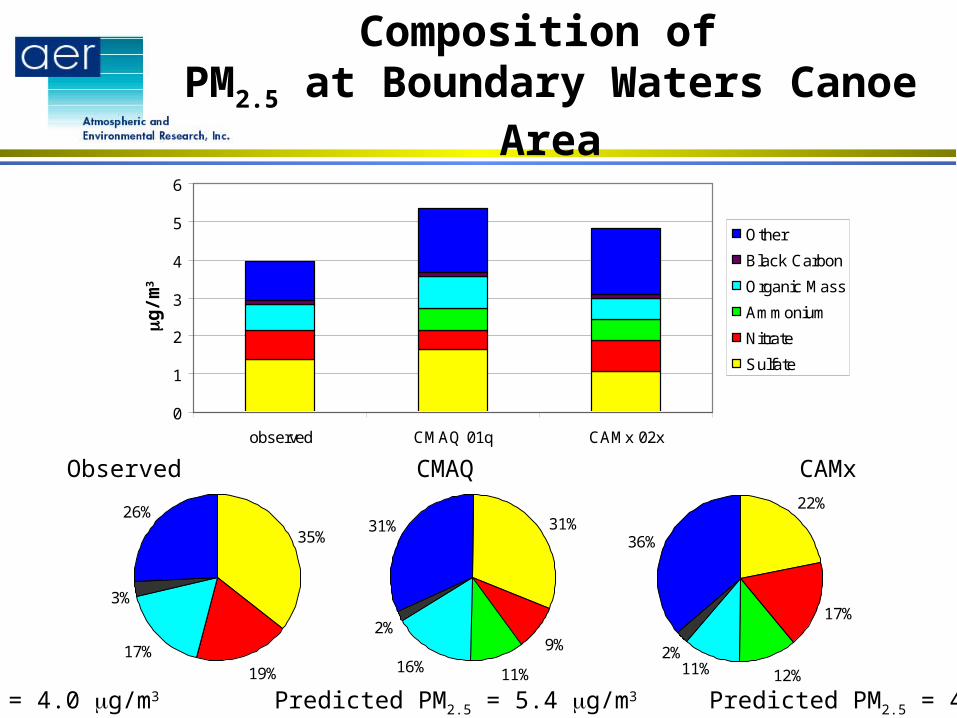
35%
19%17%
26%
3%
22%
17%
36%
2%11% 12%
31%
9%16%
31%
2%
11%
0
1
2
3
4
5
6
observed CMAQ 01q CAMx 02x
Other
Black Carbon
Organic Mass
Ammonium
Nitrate
Sulfate
Composition of PM2.5 at Boundary Waters Canoe Area
mg/m
3
PM2.5 Mass = 4.0 mg/m3 Predicted PM2.5 = 5.4 mg/m3 Predicted PM2.5 = 4.8 mg/m3
Observed CMAQ CAMx
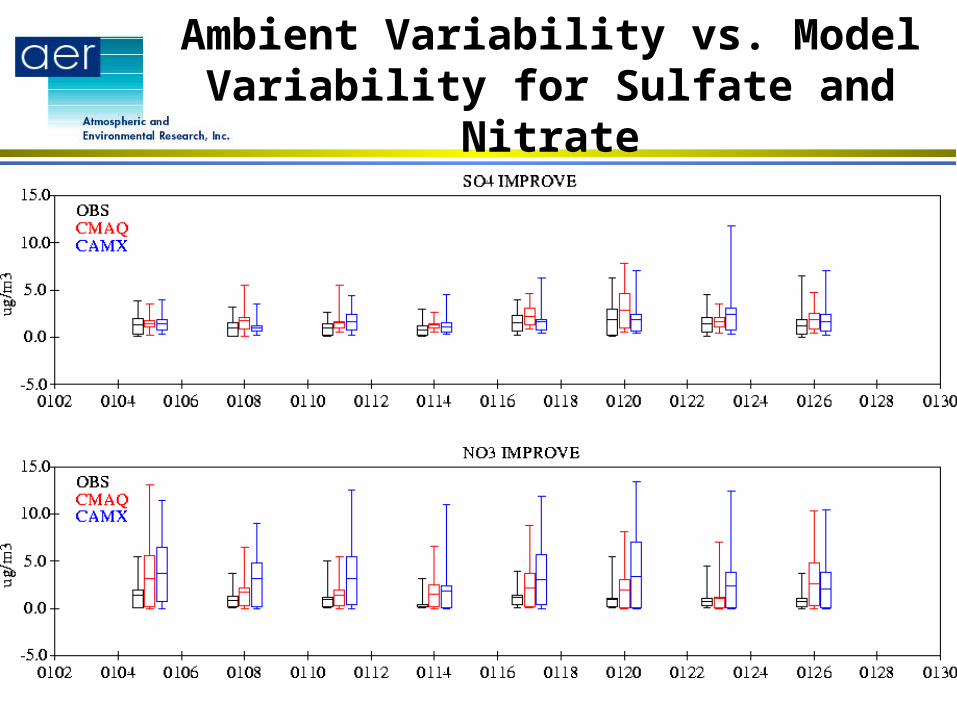
Ambient Variability vs. Model Variability for Sulfate and Nitrate
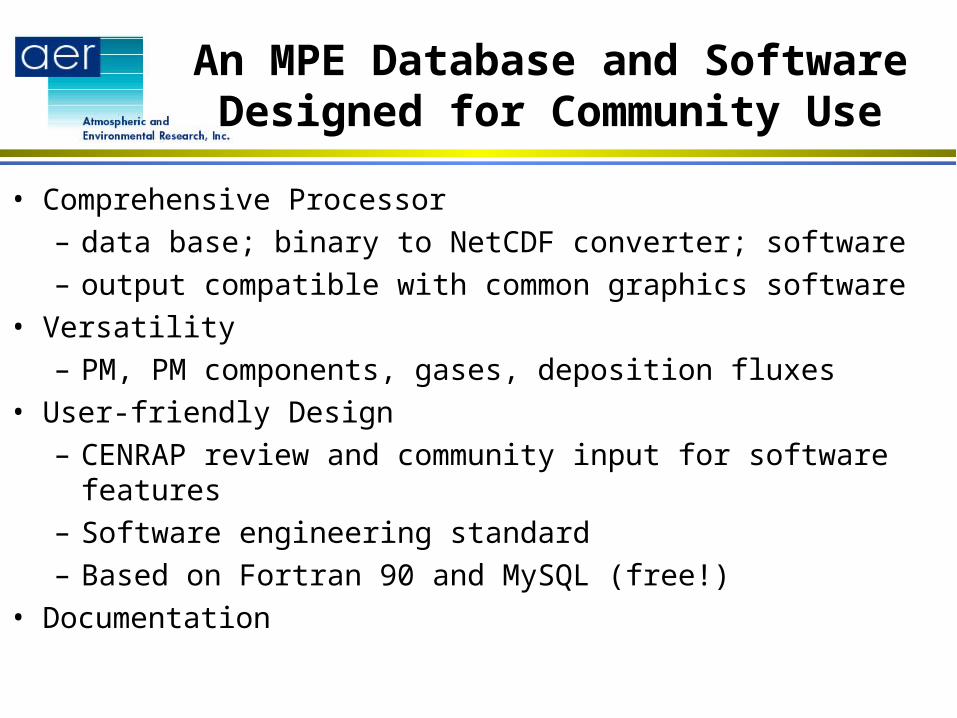
An MPE Database and Software Designed for Community Use
• Comprehensive Processor– data base; binary to NetCDF converter; software– output compatible with common graphics software
• Versatility– PM, PM components, gases, deposition fluxes
• User-friendly Design– CENRAP review and community input for software features– Software engineering standard– Based on Fortran 90 and MySQL (free!)
• Documentation
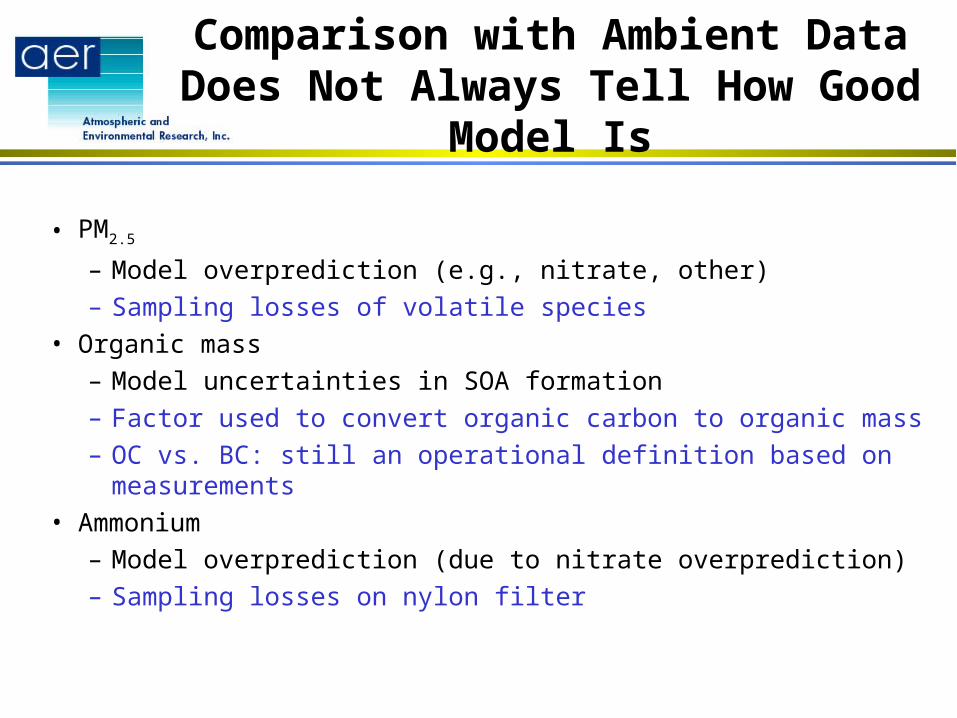
Comparison with Ambient Data Does Not Always Tell How Good Model Is
• PM2.5
– Model overprediction (e.g., nitrate, other)
– Sampling losses of volatile species
• Organic mass
– Model uncertainties in SOA formation
– Factor used to convert organic carbon to organic mass
– OC vs. BC: still an operational definition based on measurements
• Ammonium
– Model overprediction (due to nitrate overprediction)
– Sampling losses on nylon filter
Related Documents