Mississippi Canyon 252 Oil Spill NRDA Analysis Plan Analysis of the Distribution, Abundance and Biodiversity of Benthic Megafauna and Mesopelagic/Bathypelagic Megaplankton in the Vicinity of the MC252 Spill Deepwater Benthic Communities Technical Working Group/Water Column Technical Working Group March 25,2013 Approval o f this work plan is for the purposes of processing data for the Natural Resource Damage Assessment. Each Party reserves its right to produce its own independent interpretation and analysis of any data processed pursuant to this work plan. APPROVED: Department o f Commerce Trustee Representative: ? Date Louisiana Repres^tative: Date — _____________ 3^26/'ZOI'3 BP Representative: 1 Date March 25,2013: Analysis of Megafauna/Megaplankton Video and Photographic Data Plan Page 1 DWH-AR0019532

Welcome message from author
This document is posted to help you gain knowledge. Please leave a comment to let me know what you think about it! Share it to your friends and learn new things together.
Transcript
Mississippi Canyon 252 Oil Spill
NRDA Analysis Plan
Analysis of the Distribution, Abundance and Biodiversity of Benthic Megafauna and Mesopelagic/Bathypelagic Megaplankton in the Vicinity of the MC252 Spill
Deepwater Benthic Communities Technical Working Group/Water Column Technical Working Group
March 25,2013
Approval o f this work plan is for the purposes of processing data for the Natural Resource Damage Assessment. Each Party reserves its right to produce its own independent interpretation and analysis o f any data processed pursuant to this work plan.
APPROVED:
Department o f Commerce Trustee Representative: ? Date
Louisiana Repres^tative: Date
— _____________ 3 ^ 2 6 /'Z O I'3BP Representative: 1 Date
March 25,2013: Analysis of Megafauna/Megaplankton Video and Photographic Data Plan Page 1
DWH-AR0019532
Mississippi Canyon 252 Oil Spill NRDA Data Processing Plan
Analysis o f the Distribution, Abundance and Biodiversity of Benthic M egafauna and M esopelagic/Bathypelagic M egaplankton in the
V icinity o f the M C252 Spill
March 25, 2013
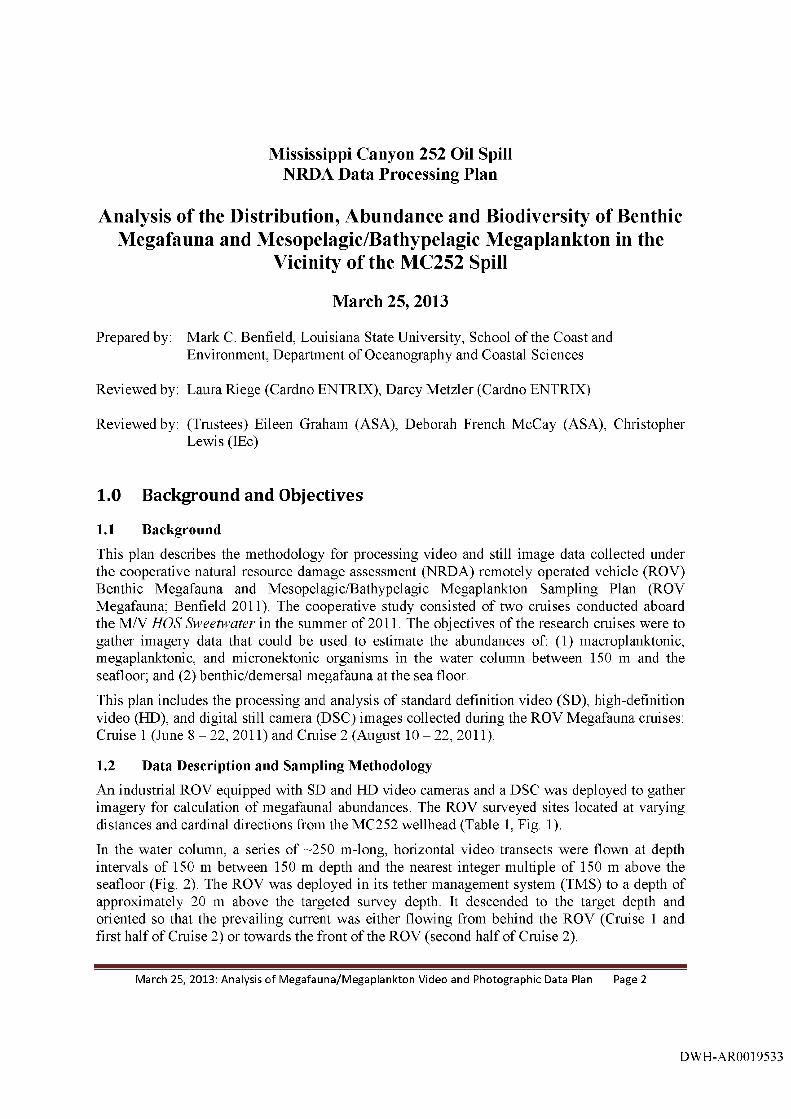
Prepared by: Mark C. Benfield, Louisiana State University, School of the Coast andEnvironment, Department of Oceanography and Coastal Sciences
Reviewed by: Laura Riege (Cardno ENTRK), Darcy Metzler (Cardno ENTRIX)
Reviewed by: (Tmstees) Eileen Graham (ASA), Deborah French McCay (ASA), Christopher Lewis (lEc)
1.0 Background and Objectives
1.1 Background
This plan describes the methodology for processing video and still image data collected under the cooperative natural resource damage assessment (NRDA) remotely operated vehicle (ROY) Benthic Megafauna and Mesopelagic/Bathypelagic Megaplankton Sampling Plan (ROY Megafauna; Benfield 2011). The cooperative study consisted of two cruises conducted aboard the M/Y HOS Sweetwater in the summer of 2011. The objectives of the research cruises were to gather imagery data that could be used to estimate the abundances of: (1) macroplanktonic, megaplanktonic, and micronektonic organisms in the water column between 150 m and the seafloor; and (2) benthic/demersal megafauna at the sea floor.
This plan includes the processing and analysis of standard definition video (SD), high-defmition video (HD), and digital still camera (DSC) images collected during the ROY Megafauna cruises: Cruise 1 (June 8 - 22, 2011) and Cmise 2 (August 1 0 -2 2 , 2011).
1.2 Data Description and Sampling Methodology
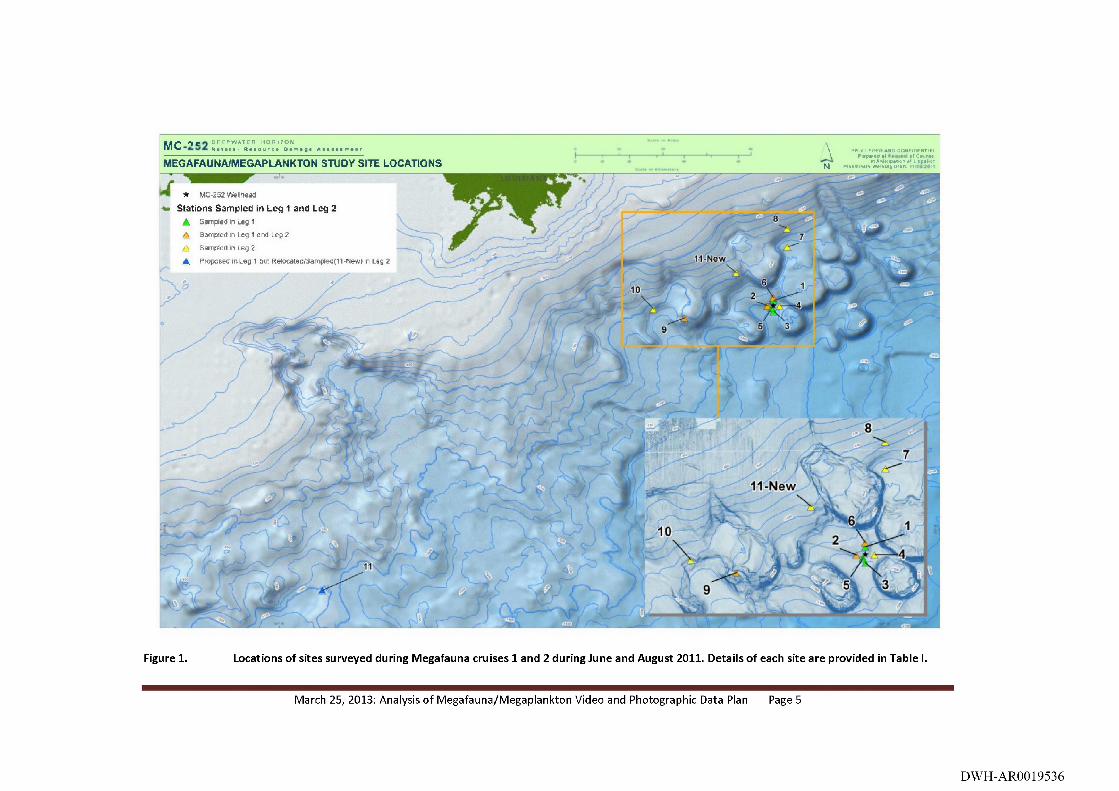
An industrial ROY equipped with SD and HD video cameras and a DSC was deployed to gather imagery for calculation of megafaunal abundances. The ROY surveyed sites located at varying distances and cardinal directions from the MC252 wellhead (Table 1, Fig. 1).
In the water column, a series of -250 m-long, horizontal video transects were flown at depth intervals of 150 m between 150 m depth and the nearest integer multiple of 150 m above the seafloor (Fig. 2). The ROY was deployed in its tether management system (TMS) to a depth of approximately 20 m above the targeted survey depth. It descended to the target depth and oriented so that the prevailing current was either flowing from behind the ROY (Cruise 1 and first half of Cruise 2) or towards the front of the ROY (second half of Cruise 2).
March 25, 2013: Analysis of Megafauna/Megaplankton Video and Photographic Data Plan Page 2
DWH-AR0019533
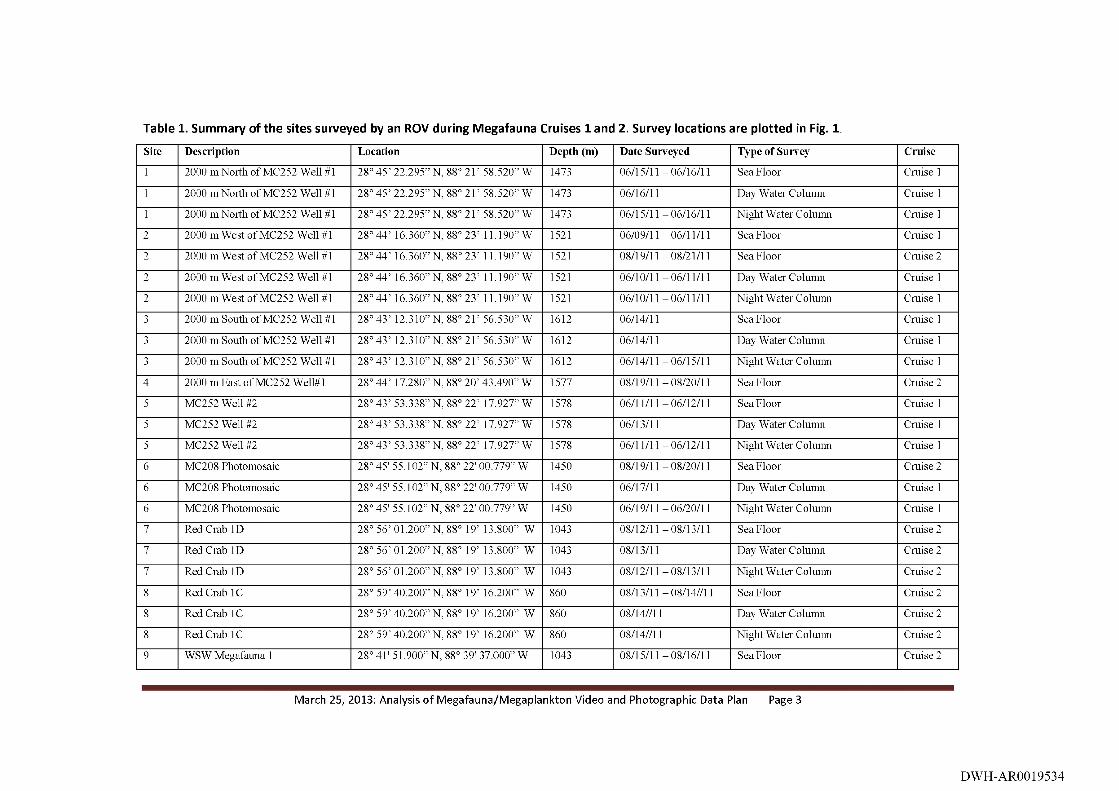
Table 1. Summary of th e sites surveyed by an ROV during M egafauna Cruises 1 and 2. Survey locations are plotted In Fig. 1
Site Description Location Depth (m) Date Surveyed Type of Survey Cruise
1 2000 m North o f MC252 Well # 1 28° 45 ’ 22.295” N, 88° 21’ 58.520” W 1473 06/15/11 -06/16/11 Sea Floor Cruise 1
1 2000 m North o f MC252 Well # 1 28° 45 ’ 22.295” N, 88° 21’ 58.520” W 1473 06/16/11 Day Water Coluimi Cruise 1
1 2000 m North o f MC252 Well # 1 28° 45 ’ 22.295” N, 88° 21’ 58.520” W 1473 06/15/11 -06/16/11 Night Water Column Cruise 1
2 2000 111 West o f MC252 Well #1 2 8 °4 4 ’ 16.360” N, 88° 23’ 11.190” W 1521 06/09/11 -06/11/11 Sea Floor Cruise 1
2 2000 m West o f MC252 Well #1 28° 44 ’ 16.360” N, 88° 23’ 11.190” W 1521 08/19/11 -08/21/11 Sea Floor Cruise 2
2 2000 m West o f MC252 Well #1 2 8 °4 4 ’ 16.360” N, 88° 23’ 11.190” W 1521 06/10/11 -06/11/11 Day Water Column Cruise 1
2 2000 m West o f MC252 Well #1 2 8 °4 4 ’ 16.360” N, 88° 23’ 11.190” W 1521 06/10/11 -06/11/11 Night Water Column Cruise 1
3 2000 m South o f MC252 W ell #1 28° 43 ’ 12.310” N, 88° 21’ 56.530” W 1612 06/14/11 Sea Floor Cruise 1
3 2000 m South o f MC252 W ell #1 28° 43 ’ 12.310” N, 88° 21’ 56.530” W 1612 06/14/11 Day Water Colurmi Cruise 1
3 2000 m South o f MC252 W ell #1 28° 43 ’ 12.310” N, 88° 21’ 56.530” W 1612 06/14/11 -06/15/11 Night Water Column Cruise 1
4 2000 m East o f MC252 W ell#l 28° 44 ’ 17.280” N, 88° 20’ 43.490” W 1577 08/19/11 -08/20/11 Sea Floor Cruise 2
5 MC252 Well #2 28° 43 ’ 53.338” N, 88° 22’ 17.927” W 1578 06/11/11 -06/12/11 Sea Floor Cruise 1
5 MC252 Well #2 28° 43 ’ 53.338” N, 88° 22’ 17.927” W 1578 06/13/11 Day Water Colurmi Cruise 1
5 MC252 Well #2 28° 43 ’ 53.338” N, 88° 22’ 17.927” W 1578 06/11/11 -06/12/11 Night Water Column Cruise 1
6 MC208 Photomosaic 28° 45' 55.102” N, 88° 22' 00.779” W 1450 08/19/11 -08/20/11 Sea Floor Cruise 2
6 MC208 Photomosaic 28° 45' 55.102” N, 88° 22' 00.779” W 1450 06/17/11 Day Water Colurmi Cruise 1
6 MC208 Photomosaic 28° 45' 55.102” N, 88° 22' 00.779” W 1450 06/19/11 -06/20/11 Night Water Column Cruise 1
7 Red Crab ID 28° 56’ 01.200” N, 88° 19’ 13.800” W 1043 08/12/11 -08/13/11 Sea Floor Cruise 2
7 Red Crab ID 28° 56’ 01.200” N, 88° 19’ 13.800” W 1043 08/13/11 Day Water Colurmi Cruise 2
7 Red Crab ID 28° 56’ 01.200” N, 88° 19’ 13.800” W 1043 08/12/11 -08/13/11 Night Water Column Cruise 2
8 Red Crab 1C 28° 59’ 40.200” N, 88° 19’ 16.200” W 860 08/13/11 -08/14//11 Sea Floor Cruise 2
8 Red Crab 1C 28° 59’ 40.200” N, 88° 19’ 16.200” W 860 08/14//11 Day Water Colurmi Cruise 2
8 Red Crab 1C 28° 59’ 40.200” N, 88° 19’ 16.200” W 860 08/14//11 Night Water Column Cruise 2
9 WSW Megafauna 1 28° 41' 51.900” N, 88° 39' 37.000” W 1043 08/15/11 -08/16/11 Sea Floor Cruise 2
March 25, 2013; Analysis of Megafauna/Megaplankton Video and Photographic Data Plan Page 3
DWH-AR0019534
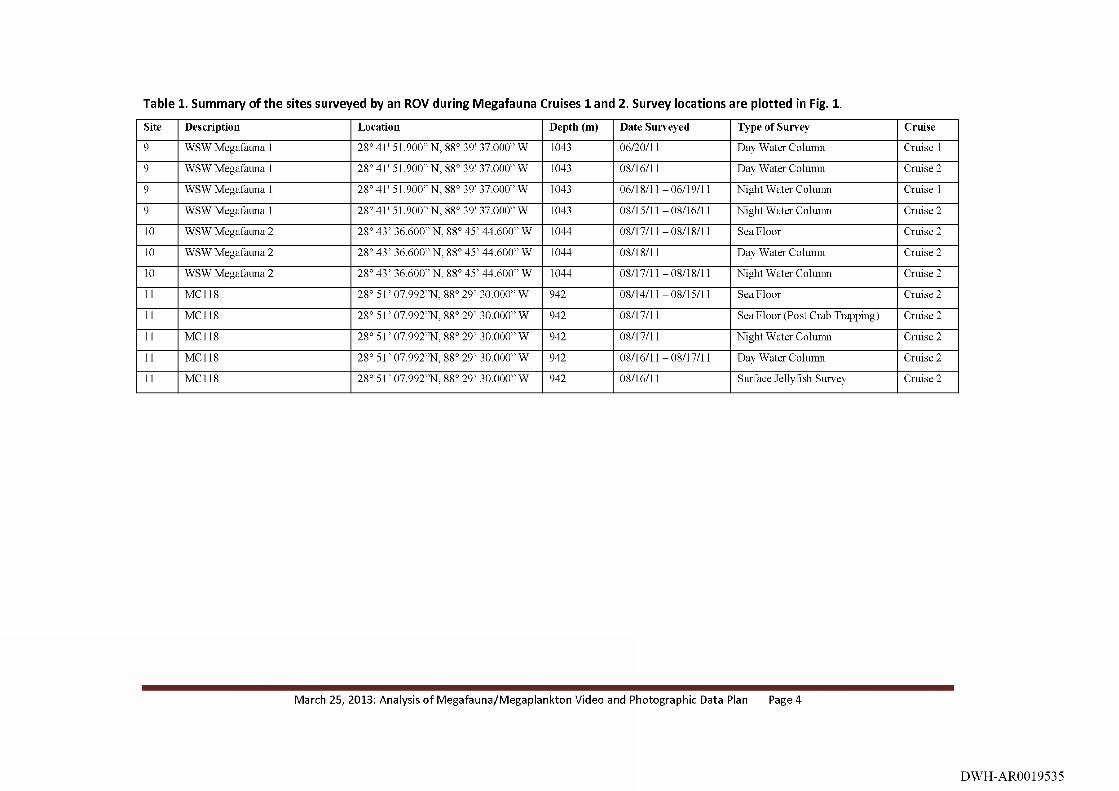
Table 1. Summary of th e sites surveyed by an ROV during M egafauna Cruises 1 and 2. Survey locations are plotted in Fig. 1.
Site Description Location Depth (m) Date Surveyed Type of Survey Cruise
9 WSW Megafauna 1 28° 41' 51.900” N, 88° 39' 37.000” W 1043 06/20/11 Day Water Column Cruise 1
9 WSW Megafauna 1 28° 41' 51.900” N, 88° 39' 37.000” W 1043 08/16/11 Day Water Colurmi Cruise 2
9 WSW Megafauna 1 28° 41' 51.900” N, 88° 39' 37.000” W 1043 06/18/11 -06/19/11 Night Water Column Cruise 1
9 WSW Megafauna 1 28° 41' 51.900” N, 88° 39' 37.000” W 1043 08/15/11 -08/16/11 Night Water Column Cruise 2
10 WSW Megafauna 2 28° 43 ’ 36.600” N, 88° 45’ 44.600” W 1044 08/17/11 -08/18/11 Sea Floor Cruise 2
10 WSW Megafauna 2 28° 43 ’ 36.600” N, 88° 45’ 44.600” W 1044 08/18/11 Day Water Colurmi Cruise 2
10 WSW Megafauna 2 28° 43 ’ 36.600” N, 88° 45’ 44.600” W 1044 08/17/11 -08/18/11 Night Water Column Cnrise 2
11 MCI 18 2 8 °5 1 ’ 07.992”N, 88° 29’ 30.000” W 942 08/14/11 -08/15/11 Sea Floor Cruise 2
11 MCI 18 28° 51 ’ 07.992”N, 88° 29’ 30.000” W 942 08/17/11 Sea Floor (Post Crab Trapping) Cruise 2
11 MCI 18 2 8 °5 1 ’ 07.992”N, 88° 29’ 30.000” W 942 08/17/11 Night Water Column Cruise 2
11 MCI 18 2 8 °5 1 ’ 07.992”N, 88° 29’ 30.000” W 942 08/16/11 -08/17/11 Day Water Colurmi Cruise 2
11 MCI 18 2 8 °5 1 ’ 07.992”N, 88° 29’ 30.000” W 942 08/16/11 Surface Jellyfish Survey Cruise 2
March 25, 2013; Analysis of Megafauna/Megaplankton Video and Photographic Data Plan Page 4
DWH-AR0019535
i m r * i ) e D E € P W A T E F! H O R t Z O Hr v i ^ r f M i i u i a ( R t i f l u r e * 0 4 m * g « A i * i » i m * n r
M EGAFAUNAyM EGAPLANKTON STUDY SITE LO CA TION S
* M C -252V \fellhedd
^ S ta tio n s S am pled in Leg 1 and Leg 2^ Sam pled in L«g I
A Sam pled in Leg 1 and Leg 2
A Sam pled in Leg 2
A . Propos&<} in L eg 1 Put R elooaiied^aam ple< ]<11 'N ew ) In Leg 2
\ PfllViLEGeO AI4D CDNFiQCMT^AL\ Prtpt’ia il arCounHlm A>sU«iMMr* pF Liiigi1>4Pi
^ P'*hAiiri*rv WarAMB Or*n.
11-New
/
I
Figure 1. Locations of sites surveyed during Megafauna cruises 1 and 2 during June and August 2011. Details o f each site are provided in Table I.
March 25, 2013; Analysis of Megafauna/Megaplankton Video and Photographic Data Plan Page 5
DWH-AR0019536
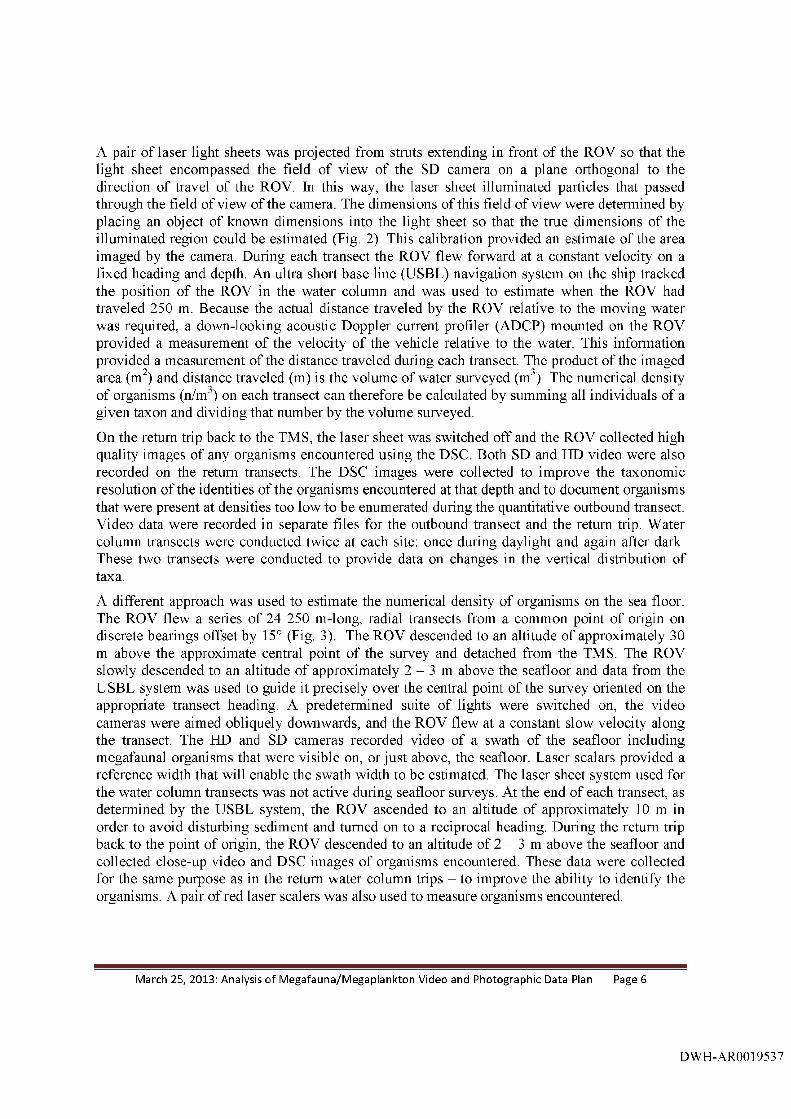
A pair of laser light sheets was projected from struts extending in front of the ROV so that the light sheet encompassed the field of view of the SD camera on a plane orthogonal to the direction of travel of the ROV. In this way, the laser sheet illuminated particles that passed through the field of view of the camera. The dimensions of this field of view were determined by placing an object of known dimensions into the light sheet so that the true dimensions of the illuminated region could be estimated (Fig. 2). This calibration provided an estimate of the area imaged by the camera. During each transect the ROV flew forward at a constant velocity on a fixed heading and depth. An ultra short base line (USBL) navigation system on the ship tracked the position of the ROV in the water column and was used to estimate when the ROV had traveled 250 m. Because the actual distance traveled by the ROV relative to the moving water was required, a down-looking acoustic Doppler current profiler (ADCP) mounted on the ROV provided a measurement of the velocity of the vehicle relative to the water. This information provided a measurement of the distance traveled during each transect. The product of the imaged area (m^) and distance traveled (m) is the volume of water surveyed (m^). The numerical density of organisms (n/m ) on each transect can therefore he calculated by summing all individuals of a given taxon and dividing that number by the volume surveyed.
On the return trip back to the TMS, the laser sheet was switched off and the ROV collected high quality images of any organisms encountered using the DSC. Both SD and HD video were also recorded on the return transects. The DSC images were collected to improve the taxonomic resolution of the identities of the organisms encountered at that depth and to document organisms that were present at densities too low to be enumerated during the quantitative outbound transect. Video data were recorded in separate files for the outbound transect and the return trip. Water column transects were conducted twice at each site: once during daylight and again after dark. These two transects were conducted to provide data on changes in the vertical distribution of taxa.
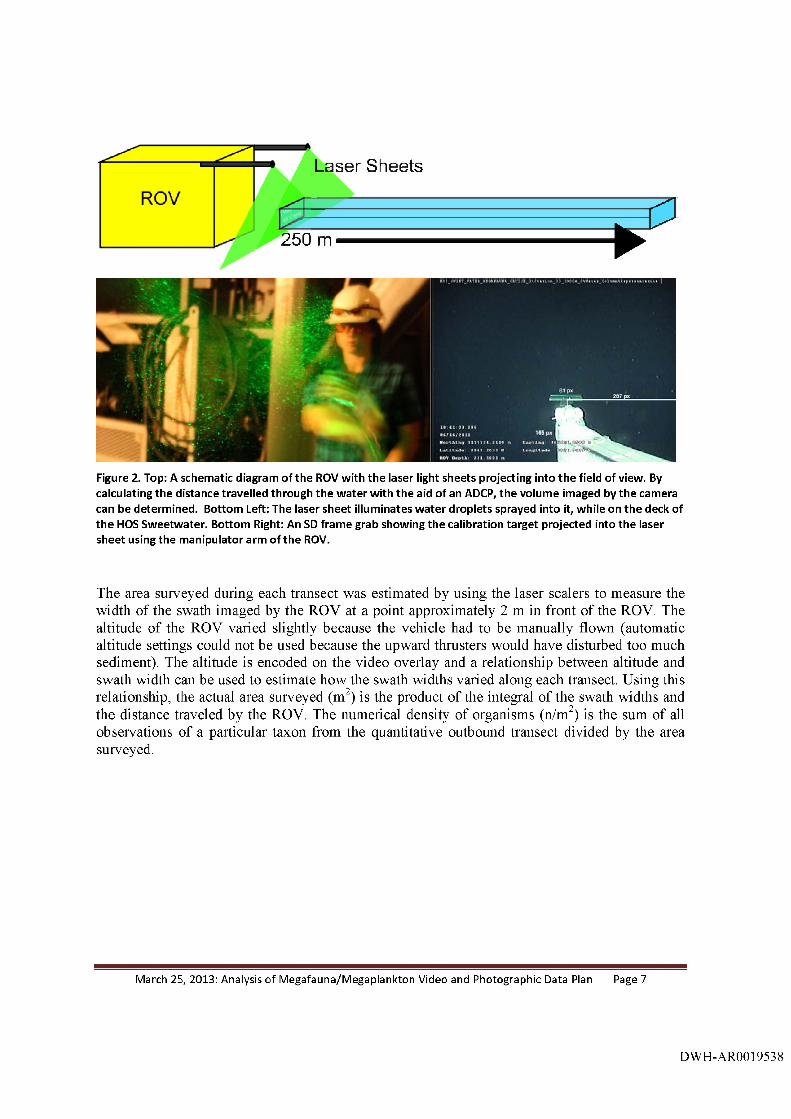
A different approach was used to estimate the numerical density of organisms on the sea floor. The ROV flew a series of 24 250 m-long, radial transects from a common point of origin on discrete bearings offset by 15° (Fig. 3). The ROV descended to an altitude of approximately 30 m above the approximate central point of the survey and detached from the TMS. The ROV slowly descended to an altitude of approximately 2 - 3 m above the seafloor and data from the USBL system was used to guide it precisely over the central point of the survey oriented on the appropriate transect heading. A predetermined suite of lights were switched on, the video cameras were aimed obliquely downwards, and the ROV flew at a constant slow velocity along the transect. The HD and SD cameras recorded video of a swath of the seafloor including megafaunal organisms that were visible on, or just above, the seafloor. Laser scalars provided a reference width that will enable the swath width to be estimated. The laser sheet system used for the water column transects was not active during seafloor surveys. At the end of each transect, as determined by the USBL system, the ROV ascended to an altitude of approximately 10 m in order to avoid disturbing sediment and tumed on to a reciprocal heading. During the return trip back to the point of origin, the ROV descended to an altitude of 2 - 3 m above the seafloor and collected close-up video and DSC images of organisms encountered. These data were collected for the same purpose as in the retum water column trips - to improve the ability to identify the organisms. A pair of red laser scalers was also used to measure organisms encountered.
March 25, 2013: Analysis of Megafauna/Megaplankton Video and Photographic Data Plan Page 6
DWH-AR0019537
Laser Sheets
250 m W
Figure 2. Top: A schem atic diagram o f th e ROV w ith the laser light sheets projecting Into th e field of view. By calculating the distance travelled through th e w ater with the aid of an ADCP, the volum e Imaged by th e camera can be determ ined. Bottom Left: The laser sheet Illuminates w ater droplets sprayed Into It, w hile on th e deck of th e HOS Sw eetw ater. Bottom Right: An SD frame grab showing th e calibration target projected Into the laser sh eet using the manipulator arm o f th e ROV.
The area surveyed during each transect was estimated by using the laser scalers to measure the width of the swath imaged by the ROV at a point approximately 2 m in front of the ROV. The altitude of the ROV varied slightly because the vehicle had to be manually flown (automatic altitude settings could not be used because the upward thrusters would have disturbed too much sediment). The altitude is encoded on the video overlay and a relationship between altitude and swath width can be used to estimate how the swath widths varied along each transect. Using this relationship, the actual area surveyed (m^) is the product of the integral of the swath widths and the distance traveled by the ROV. The numerical density of organisms (n/m^) is the sum of all observations of a particular taxon from the quantitative outbound transect divided by the area surveyed.
March 25, 2013: Analysis of Megafauna/Megaplankton Video and Photographic Data Plan Page 7
DWH-AR0019538
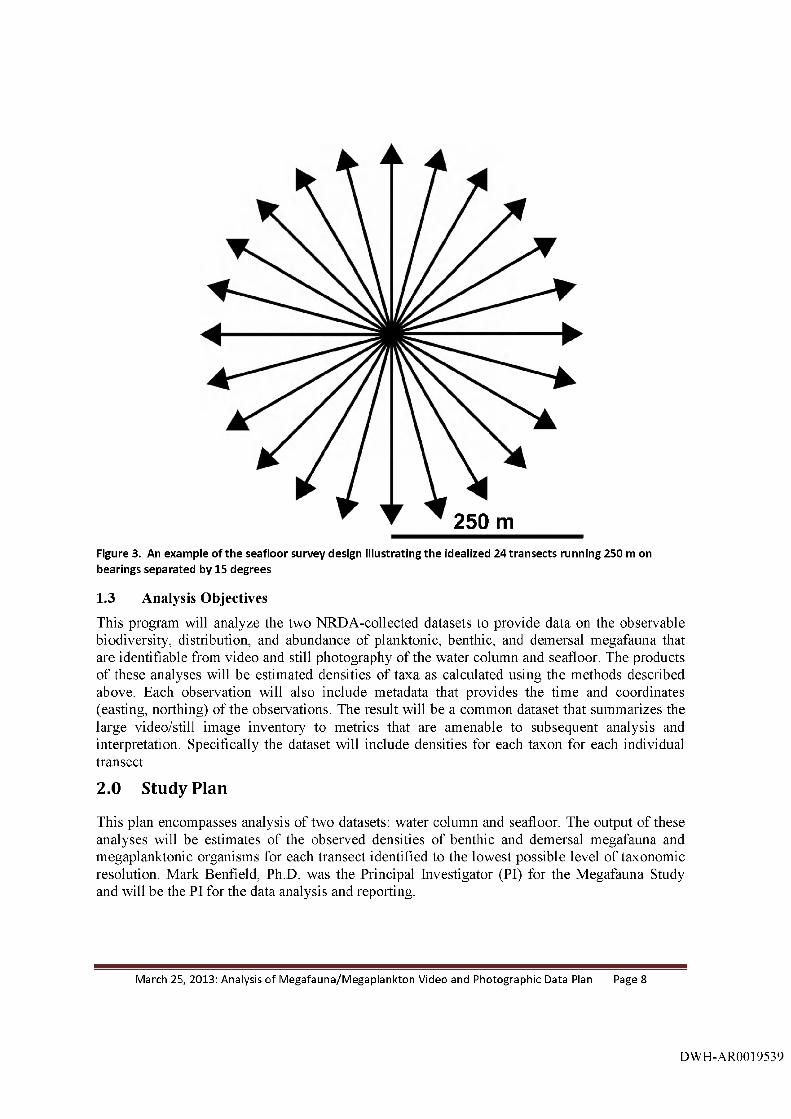
250 mFigure 3. An exam ple of the seafloor survey design Illustrating th e Idealized 24 transects running 250 m on bearings separated by 15 degrees
1.3 Analysis Objectives
This program will analyze the two NRDA-collected datasets to provide data on the observable biodiversity, distribution, and abundance of planktonic, benthic, and demersal megafauna that are identifiable from video and still photography of the water column and seafloor. The products of these analyses will be estimated densities of taxa as calculated using the methods described above. Each observation will also include metadata that provides the time and coordinates (easting, northing) of the observations. The result will be a common dataset that summarizes the large video/still image inventory to metrics that are amenable to subsequent analysis and interpretation. Specifically the dataset will include densities for each taxon for each individual transect.
2.0 Study Plan
This plan encompasses analysis of two datasets: water column and seafloor. The output of these analyses will be estimates of the observed densities of benthic and demersal megafauna and megaplanktonic organisms for each transect identified to the lowest possible level of taxonomic resolution. Mark Benfield, Ph.D. was the Principal Investigator (PI) for the Megafauna Study and will be the PI for the data analysis and reporting.
March 25, 2013: Analysis of Megafauna/Megaplankton Video and Photographic Data Plan Page 8
DWH-AR0019539
2.1 Approach
The data to be analyzed are video and still images collected by ROV along fixed transects (Benfield 2011) during the NRDA cruises aboard the HOS Sweetwater in June and August 2011. Videos will be reviewed and a still image of each organism observed by the ROV will be saved with the location, depth, date and time of the observation and the start and end points of each transect (including any significant turning points). The organisms in each still image will be identified to the lowest possible taxonomic level and enumerated. Taxonomic level will range from species to families or higher depending of the quality of the image data.
After a preliminary review to ensure that navigation information is accurate, the associated navigational data will be processed, the waypoints (i.e., locations and times) for each individual transect reported, and these waypoints will be analyzed to estimate a smoothed trackline for each survey leg (transect). Taxonomically-specific densities will be estimated for each transect by summing all observations of a given taxon within the temporal limits of the start and end time of each transect. The transect density will be calculated as the sum of the taxon divided by the survey volume/area. For purposes of this study plan, a mean transect density for each site will then be calculated as the average of all transect densities at that site. Both individual transect and the means of transect densities will be reported.
For surveys where linear distance surveyed is available, the observed abundance of each taxon will be estimated as the number of organisms observed divided by the area (for seafloor surveys) or volume (for water column surveys) surveyed, hi the case where navigation data are not continuous, the linear distance between the points at which navigation data were lost and reacquired will be estimated to fill in missing data allowing area and volume to be estimated. Any estimated navigation data will be clearly documented.
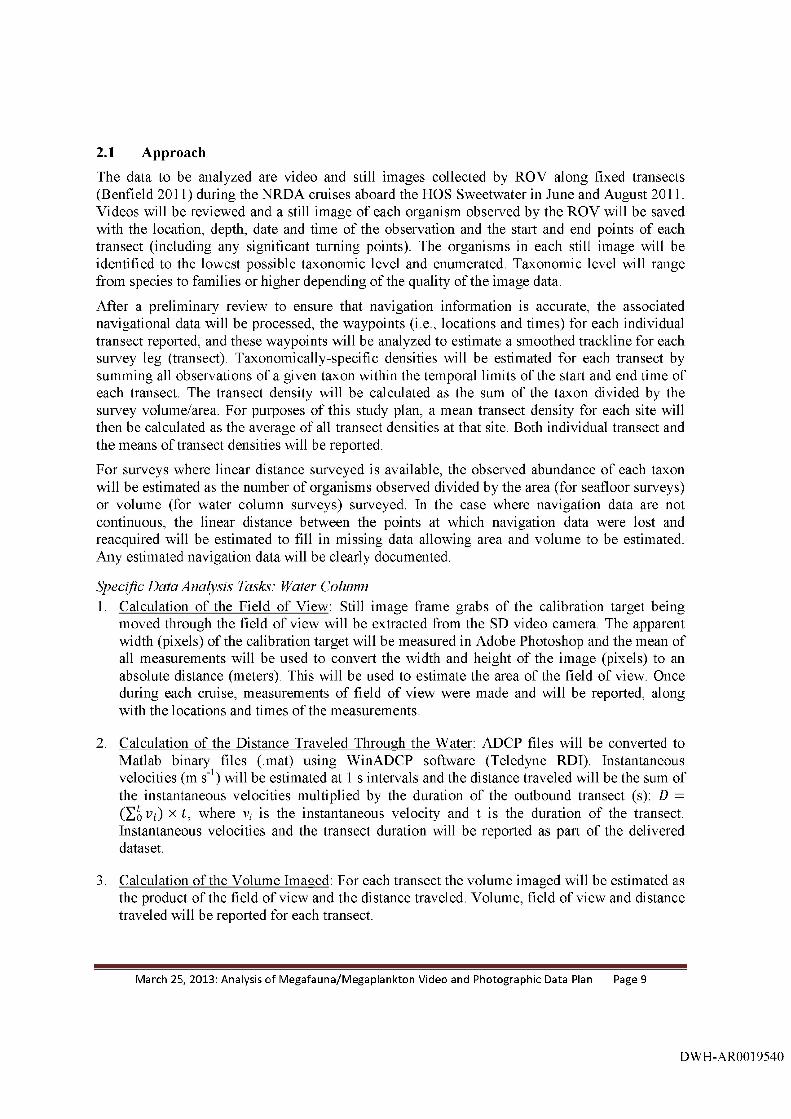
Specific Data Analysis Tasks: Water Column1. Calculation of the Field of View: Still image frame grabs of the calibration target being
moved through the field of view will he extracted from the SD video camera. The apparent width (pixels) of the calibration target will be measured in Adobe Photoshop and the mean of all measurements will be used to convert the width and height of the image (pixels) to an absolute distance (meters). This will be used to estimate the area of the field of view. Once during each cruise, measurements of field of view were made and will be reported, along with the locations and times of the measurements.
2. Calculation of the Distance Traveled Through the Water: ADCP files will be converted to Matlab binary files (.mat) using WinADCP software (Teledyne RDI). Instantaneous velocities (m s'^) will be estimated at 1 s intervals and the distance traveled will be the sum of the instantaneous velocities multiplied by the duration of the outbound transect (s): D — (Xi Vi ) X t , where v, is the instantaneous velocity and t is the duration of the transect. Instantaneous velocities and the transect duration will be reported as part of the delivered dataset.
3. Calculation of the Volume Imaged: For each transect the volume imaged will be estimated as the product of the field of view and the distance traveled. Volume, field of view and distance traveled will be reported for each transect.
March 25 , 2013: Analysis of Megafauna/Megaplankton Video and Photographic Data Plan Page 9
DWH-AROO19540
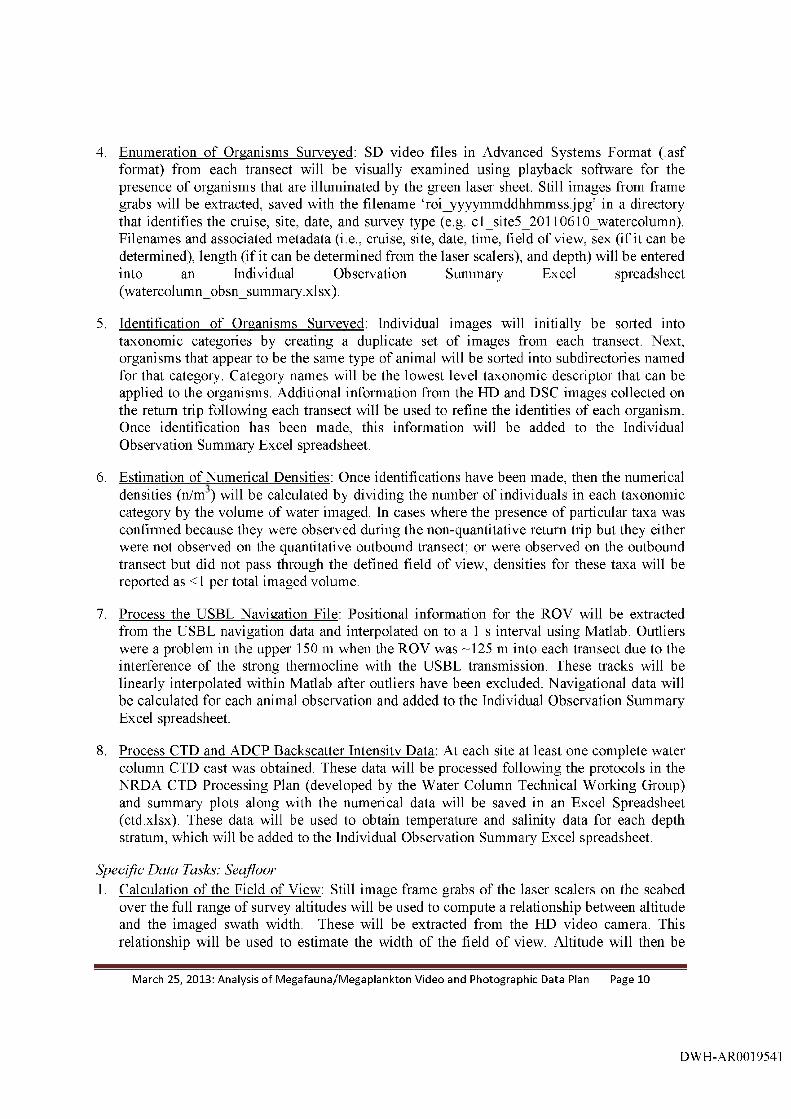
4. Enumeration of Organisms Surveyed: SD video files in Advanced Systems Format ( asf format) from each transect will be visually examined using playback software for the presence of organisms that are illuminated by the green laser sheet. Still images from frame grabs will be extracted, saved with the filename ‘roi_yyyymmddhhmmss.jpg’ in a directory that identifies the cruise, site, date, and survey type (e.g. cl_site5_20110610_watercolumn). Filenames and associated metadata (i.e., cruise, site, date, time, field of view, sex (if it can be determined), length (if it can be determined from the laser scalers), and depth) will be entered into an Individual Observation Summary Excel spreadsheet (watercolumn_obsn_summary.xlsx).
5. identification of Organisms Surveyed: individual images will initially be sorted into taxonomic categories by creating a duplicate set of images from each transect. Next, organisms that appear to be the same type of animal will be sorted into subdirectories named for that category. Category names will be the lowest level taxonomic descriptor that can be applied to the organisms. Additional information from the HD and DSC images collected on the retum trip following each transect will be used to refine the identities of each organism. Once identification has been made, this information will be added to the individual Observation Summary Excel spreadsheet.
6. Estimation of Numerical Densities: Once identifications have been made, then the numerical densities (n/m ) will be calculated by dividing the number of individuals in each taxonomic category by the volume of water imaged. In cases where the presence of particular taxa was confirmed because they were observed during the non-quantitative return trip but they either were not observed on the quantitative outbound transect; or were observed on the outbound transect but did not pass through the defined field of view, densities for these taxa will be reported as <1 per total imaged volume.
7. Process the USBE Navigation File: Positional information for the ROV will be extracted from the USBE navigation data and interpolated on to a I s interval using Matlab. Outliers were a problem in the upper 150 m when the ROV was -125 m into each transect due to the interference of the strong thermocline with the USBE transmission. These tracks will be linearly interpolated within Matlab after outliers have been excluded. Navigational data will be calculated for each animal observation and added to the individual Observation Summary Excel spreadsheet.
8. Process CTD and ADCP Backscatter intensity Data: At each site at least one complete water column CTD cast was obtained. These data will be processed following the protocols in the NRDA CTD Processing Plan (developed by the Water Column Technical Working Group) and summary plots along with the numerical data will be saved in an Excel Spreadsheet (ctd.xlsx). These data will be used to obtain temperature and salinity data for each depth stratum, which will be added to the individual Observation Summary Excel spreadsheet.
Specific Data Tasks: Seafloor1. Calculation of the Field of View: Still image frame grabs of the laser scalers on the seabed
over the full range of survey altitudes will be used to compute a relationship between altitude and the imaged swath width. These will be extracted from the HD video camera. This relationship will be used to estimate the width of the field of view. Altitude will then be
March 25, 2013: Analysis of M egafauna/Megaplankton Video and Photographic Data Plan Page 10
DWH-AROO 19541
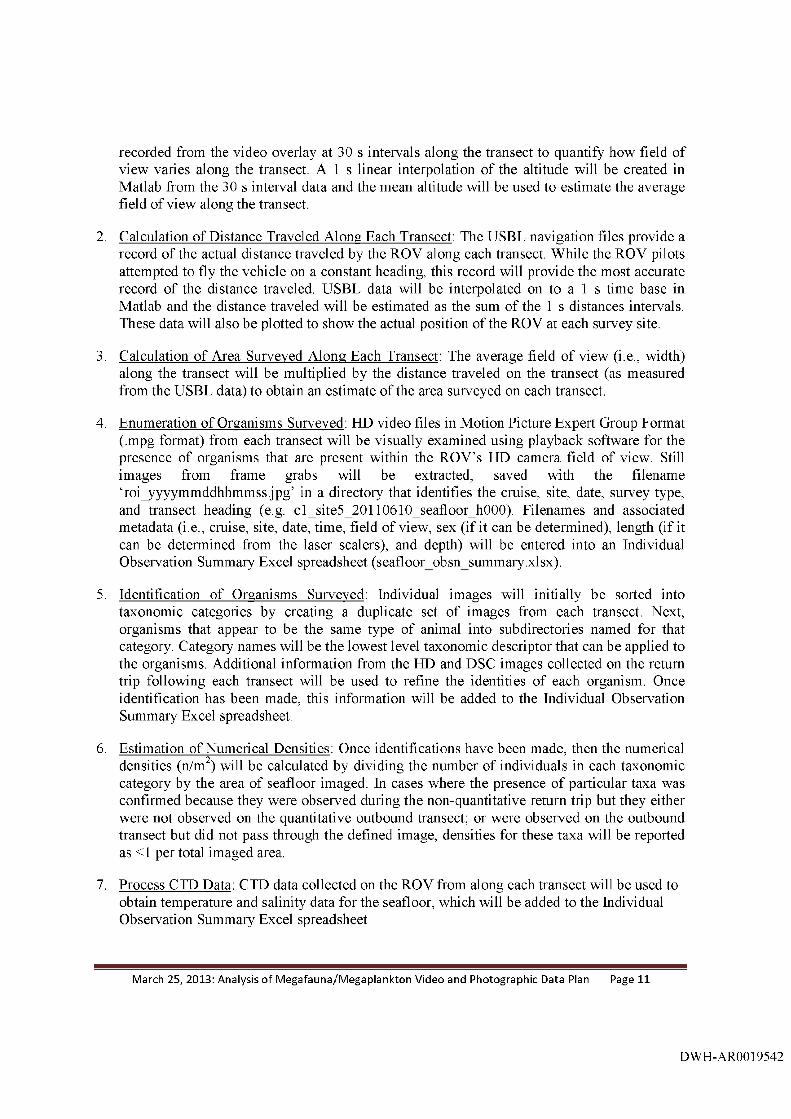
recorded from the video overlay at 30 s intervals along the transect to quantify how field of view varies along the transect. A 1 s linear interpolation of the altitude will be created in Matlab from the 30 s interval data and the mean altitude will be used to estimate the average field of view along the transect.
2. Calculation of Distance Traveled Along Each Transect: The USBL navigation files provide a record of the actual distance traveled by the ROV along each transect. While the ROY pilots attempted to fly the vehicle on a constant heading, this record will provide the most accurate record of the distance traveled. USBL data will be interpolated on to a 1 s time base in Matlab and the distance traveled will he estimated as the sum of the 1 s distances intervals. These data will also be plotted to show the actual position of the ROV at each survey site.
3. Calculation of Area Surveved Along Each Transect: The average field of view (i.e., width) along the transect will be multiplied by the distance traveled on the transect (as measured from the USBL data) to obtain an estimate of the area surveyed on each transect.
4. Enumeration of Organisms Surveved: HD video files in Motion Picture Expert Group Format (.mpg format) from each transect will be visually examined using playback software for the presence of organisms that are present within the ROV’s HD camera field of view. Still images from frame grabs will be extracted, saved with the filename ‘roi_yyyymmddhhmmss.jpg’ in a directory that identifies the cruise, site, date, survey type, and transect heading (e.g. cl site5 20110610 seafloor hOOO). Filenames and associated metadata (i.e., cruise, site, date, time, field of view, sex (if it can be determined), length (if it can be determined from the laser scalers), and depth) will be entered into an Individual Observation Summary Excel spreadsheet (seafloor obsn summary.xlsx).
5. Identification of Organisms Surveved: Individual images will initially be sorted into taxonomic categories by creating a duplicate set of images from each transect. Next, organisms that appear to be the same type of animal into subdirectories named for that category. Category names will be the lowest level taxonomic descriptor that can he applied to the organisms. Additional information from the HD and DSC images collected on the retum trip following each transect will be used to refine the identities of each organism. Once identification has been made, this information will be added to the Individual Observation Summary Excel spreadsheet.
6. Estimation of Numerical Densities: Once identifications have been made, then the numerical densities (n/m^) will be calculated by dividing the number of individuals in each taxonomic category by the area of seafloor imaged. In cases where the presence of particular taxa was confirmed because they were observed during the non-quantitative return trip hut they either were not observed on the quantitative outbound transect; or were observed on the outbound transect but did not pass through the defined image, densities for these taxa will he reported as <1 per total imaged area.
7. Process CTD Data: CTD data collected on the ROV from along each transect will be used to obtain temperature and salinity data for the seafloor, which will he added to the Individual Observation Summary Excel spreadsheet
March 25, 2013: Analysis of M egafauna/Megaplankton Video and Photographic Data Plan Page 11
DWH-AROO 19542
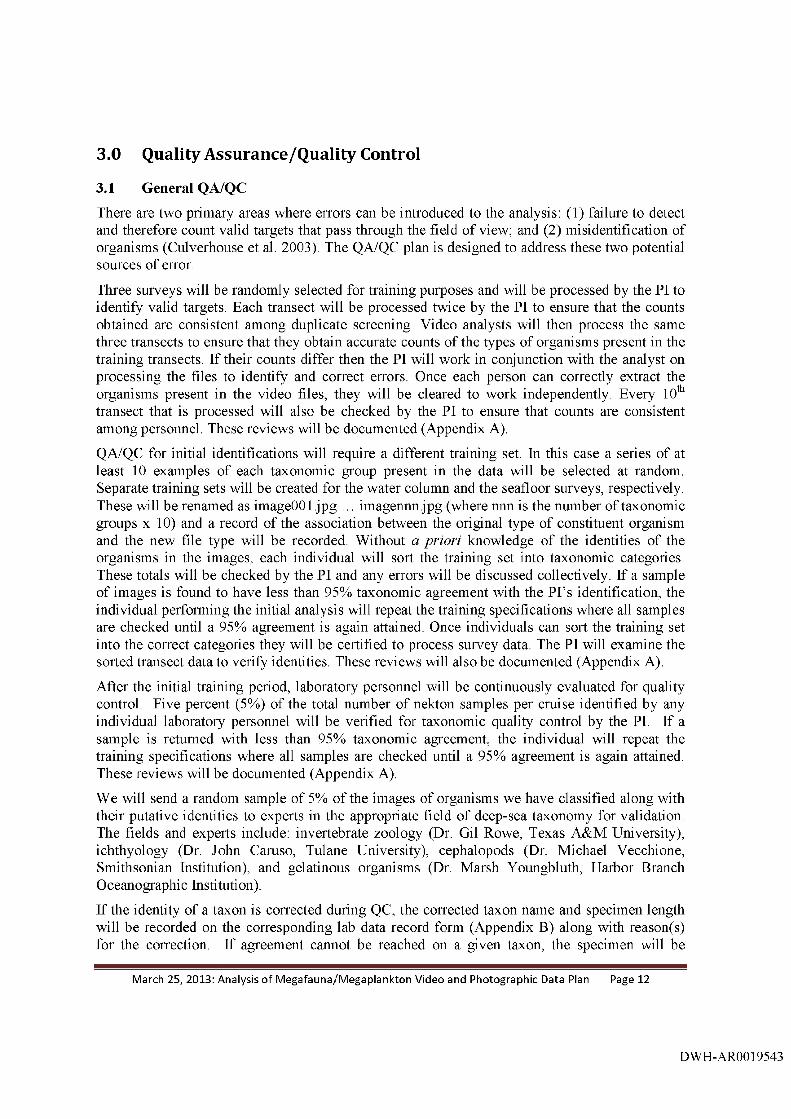
3.0 Quality Assurance/Quality Control
3.1 General QA/QC
There are two primary areas where errors can be introduced to the analysis: (1) failure to detect and therefore count valid targets that pass through the field of view; and (2) mi sidentification of organisms (Culverhouse et al. 2003). The QA/QC plan is designed to address these two potential sources of error.
Three surv eys will be randomly selected for training purposes and will be processed by the PI to identify valid targets. Each transect will be processed twice by the PI to ensure that the counts obtained are consistent among duplicate screening. Video analysts will then process the same three transects to ensure that they obtain accurate counts of the types of organisms present in the training transects. If their counts differ then the PI will work in conjunction with the analyst on processing the files to identify and correct errors. Once each person can correctly extract the organisms present in the video files, they will be cleared to work independently. Every 10̂ ’’ transect that is processed will also be checked by the PI to ensure that counts are consistent among personnel. These reviews will be documented (Appendix A).
QA/QC for initial identifications will require a different training set. In this case a series of at least 10 examples of each taxonomic group present in the data will be selected at random. Separate training sets will be created for the water column and the seafloor surveys, respectively. These will be renamed as imageOOI.jpg ... imagennn.jpg (where nnn is the number of taxonomic groups X 10) and a record of the association between the original type of constituent organism and the new file type will be recorded. Without a priori knowledge of the identities of the organisms in the images, each individual will sort the training set into taxonomic categories. These totals will be checked by the PI and any errors will be discussed collectively. If a sample of images is found to have less than 95% taxonomic agreement with the P i’s identification, the individual performing the initial analysis will repeat the training specifications where all samples are checked until a 95% agreement is again attained. Once individuals can sort the training set into the correct categories they will be certified to process survey data. The PI will examine the sorted transect data to verify identities. These reviews will also be documented (Appendix A).
After the initial training period, laboratory personnel will be continuously evaluated for quality control. Five percent (5%) of the total number of nekton samples per cruise identified by any individual laboratory personnel will be verified for taxonomic quality control by the PI. If a sample is retumed with less than 95% taxonomic agreement, the individual will repeat the training specifications where all samples are checked until a 95% agreement is again attained. These reviews will be documented (Appendix A).
We will send a random sample of 5% of the images of organisms we have classified along with their putative identities to experts in the appropriate field of deep-sea taxonomy for validation. The fields and experts include: invertebrate zoology (Dr. Gil Rowe, Texas A&M LTniversity), ichthyology (Dr. John Caruso, Tulane University), cephalopods (Dr. Michael Vecchione, Smithsonian Institution), and gelatinous organisms (Dr. Marsh Youngbluth, Harbor Branch Oceanographic Institution).
If the identity of a taxon is corrected during QC, the corrected taxon name and specimen length will be recorded on the corresponding lab data record form (Appendix B) along with reason(s) for the correction. If agreement cannot be reached on a given taxon, the specimen will be
March 25, 2013: Analysis of M egafauna/Megaplankton Video and Photographic Data Plan Page 12
DWH-AROO 19543
assigned to the lowest agreed upon taxonomic level. Required corrections will be evaluated, and taxon and/or species potentially mis-identified previous to the QC check will be reviewed. Reasons for changes will be communicated to the laboratory personnel so future identifications are consistent with the final identifications.
3.2 Reference Images
A reference collection of images of all taxa identified will he maintained and shared among parties. This will help ensure uniformity in recognizing identification criteria and to facilitate communication among taxonomists and across investigators collecting similar data. The reference image collection will be made available as part of the full data package.
3.3 Transcription QA/QC
A 100% data transcription check upon transfer of sample data written on paper bench sheets to electronic databases will be completed. The cross-check of 100% of all transcriptions will be conducted by an individual other than the individual who entered the original data. The individual conducting the data transcription cross-check and the date it takes place will be documented on the corresponding lab bench sheet. Screen shots for every animal observed in the videos will be saved as a jpeg file that includes the date and time the animal was observed. Screen shot photo files will be sorted by taxa into separate sub-directories. A directory file list will be recorded in an Excel spreadsheet to provide a quality assurance check of the screen shot photos.
4.0 Data Handling/Data Sharing Process and Data Reporting
4.1 Digital and Navigational Data Handling
Data from each of the two ROV surveys include: (1) SD video files of the field of view in front of the ROV stored on DVDs; (2) HD video or megapixel DSC images containing close-ups of organisms observed during the surveys; and (3) navigation data in ascii format containing time, northing, easting, depth, latitude and longitude (sequence and format may vary from system to system).
Identical copies of all raw digital video, still, and navigation files were provided to the Trustees and the RP at the conclusion of each cruise (Benfield 2011).
Copies of all images extracted from the videos, including the associated metadata, and used for identification and counting as part of this analysis will be provided in digital copy to all parties to this agreement at the same time as other data deliverables described in 4.2.
4.2 Data Products
The data products to be delivered to the parties to this agreement (NOAA, and the Louisiana Oil Spill Coordinator's Office (LOSCO) on behalf of the State of Louisiana, and BP (or Cardno LNTRIX on behalf of BP)) will be cruise reports, raw and processed data and all supporting information, and an analysis report.
Dr. Benfield previously generated a cruise report for the first leg of this cruise. It was provided to the Trustees on August 30, 2011. Dr. Benfield is currently compiling a similar document for the
March 25, 2013: Analysis of M egafauna/Megaplankton Video and Photographic Data Plan Page 13
DWH-AROO 19544
second leg, which will be provided to the Trustees upon its completion. These cruise reports contain, among other things, deployment summaries. This will detail any deviations, changes, or amendments to the original sampling plan that occurred due to factors at sea that likely required on-the-fly adaptations. Any technical issues (e.g. camera failures, missing data) will also be described.
The delivery of processed data will include estimates of the numerical densities of all taxa encountered during each of the quantitative outbound water column and seafloor transects. In addition, the following data will he provided for each individual observation: identity to lowest taxonomic level possible, date, time (local), location (easting, northing, longitude, latitude), depth, temperature, salinity, sex (if it can be determined), length (if it can be determined from the laser scalers), a representative video frame grab, and any other information such as epibionts or parasites. Each transect will include individual measurement and summary data on the field of view (water column), swath width (seafloor), and distance traveled as determined by the ADCP (water column) or USBL system (seafloor). This information will be delivered upon the completion of the processing for each cruise.
After the data has been processed and delivered to the parties, an analysis report will be completed, which is anticipated in the winter of 2013. The report will include the following elements:
Navigation Data: Smoothed positional data (date, time, easting, northing, latitude, longitude, depth) for the ROV at each survey site. Data will be smoothed using an appropriate running mean filter to remove noise from the subsea navigation system and interpolated on to a 1 second time base. Smoothed data will he accompanied by a detailed description of the smoothing process, as well as by the raw data set (i.e., locations and times of waypoints along the transect) prior to smoothing.
Observed Abundance Data: The number of taxa and total observed abundance of each taxon observed on each transect; the area of the transect surveyed; the observed density of each taxon per transect (n/area); and still images or video frame grabs with associated metadata (latitude, longitude, depth, time, identification).
Individual identification, size and location data: The taxonomic identification, dimensions, location (longitude, latitude and depth) and time observed for each individual organism identified from the video and still imagery. These data will be provided in Microsoft Excel format.
4.3 Distribution and Review of Results
Upon completion of the data processing and QA/QC procedures for each cruise, the principal investigator (Dr. Mark Benfield) will deliver all products generated as part of this work plan (see section above for a description) for such cruise to the parties of this agreement: NOAA, the Louisiana Oil Spill Coordinator's Office (LOSCO) on behalf of the State of Louisiana, and BP (or Cardno ENTRIX on behalf of BP). Each party of this agreement will designate a recipient to receive the data copy and provide Dr. Benfield with contact information. Dr. Benfield will deliver the data products in commonly utilized file types on external hard drives. NOAA reserves the right to coordinate with Dr. Benfield to determine the appropriate format for each type of data/result to facilitate uploading the delivered data and metadata products to the NOAA NRDA Content Management System.
March 25, 2013: Analysis of M egafauna/Megaplankton Video and Photographic Data Plan Page 14
DWH-AROO 19545
In the interest of maintaining one consistent data set for use by all parties, only the verified and validated data set made available to the parties by BP shall be considered the consensus data set. In order to ensure reliability of the consensus data and full review by the parties, no party shall publish consensus data until 14 days after such data have been made available to the parties. Any questions raised about the consensus data set, as it was made available to the parties by BP, shall be handled consistent with the procedures in Section 7.2 of the Deepwater Horizon NRDA Analytical Quality Assurance Plan.
• The trustees and BP shall each designate an individual responsible for raising questions, if any, on the consensus data set.
• If questions are raised, the two designated individuals will meet to determine the source of the difference and resolve.
• The questions raised and their resolution shall be distributed to all parties.• No changes to the consensus data set will be made if the differences are considered
immaterial by both designated individuals, acting on behalf of the parties.• If the parties agree that changes to the dataset should be made, the dataset will be updated
in accordance with the resolution and reposted with a notation that the dataset has been revised.
• If the designated individuals do not agree on how to resolve the difference concerning the consensus data set, the designated individuals shall request assistance from the Assessment Managers for the trustees and BP.
4.4 Retention of Materials
All imagery data and information developed pursuant to this plan will be retained, along with any changes in processing software or results. All of this information will be maintained during all review steps in the process and stored in secure locations under Trustee control and will be provided to all parties as part of the data release process.
All materials associated with the collection or analysis of samples under these protocols or pursuant to any approved work plan, including any remains of samples and, including remains of extracts created during or remaining after analytical testing, must be preserved and disposed of in accordance with the preservation and disposal requirements set forth in Pretrial Orders (“PTOs”) # I, # 30, #35, # 37, #39 and #43 and any other applicable Court Orders governing tangible items that are or may be issued in MDL No. 2179 IN RE: Oil Spill by the Oil Rig "DEEPWATER HORIZON" (E.D. LA 2010). Destructive analytical testing of oil, dispersant or sediment samples may only be conducted in accordance with PTO # 37, paragraph 11, and PTO # 39, paragraph 11. Circumstances and procedures goveming preservation and disposal of sample materials by the trustees must be set forth in a written protocol that is approved by the state or federal agency whose employees or contractors are in possession or control of such materials and must comply with the provisions of PTOs # 1, # 30, # 35, 37, #39 and #43.
5.0 Reporting and Review
Progress reports will be submitted quarterly to the parties to this agreement by Mark Benfield and will describe the status of transect and image processing for the previous three-month reporting period. A standardized format will he used for all lab progress reports (Appendix C).
March 25, 2013: Analysis of M egafauna/Megaplankton Video and Photographic Data Plan Page 15
DWH-AR0019546
At a minimum, the laboratory operations section of the progress report should include the number of transects processed, general location and times of transects processed, and planned activities for next three months.
6.0 Key Personnel
Mark Benfield, Ph.D. is a Professor in the Department of Oceanography and Coastal Sciences (DOCS) in the School of the Coast and Environment at Louisiana State University. He will serve as PI. Rosana DiMauro, Ph.D. is a postdoctoral research fellow in DOCS. She will serve as co- PI. Graduate students Marla Valentine (M.S. candidate) and Stephanie Sharuga (Ph.D. candidate) will assist with data analysis. Technician Megan Ferguson will assist with data analysis. An undergraduate student worker will assist with data backup and preparation.
7.0 Costs
The costs summarized below are associated with the analysis of the ROV/AUV data collected during this project.
The Parties acknowledge that this budget is an estimate, and that actual costs may prove to be higher. HP's commitment to fund the costs of this work includes any additional reasonable costs within the scope of this approved work plan that may arise. Dr. Benfield will make a good faith effort to notify BP in advance of any such increased costs.
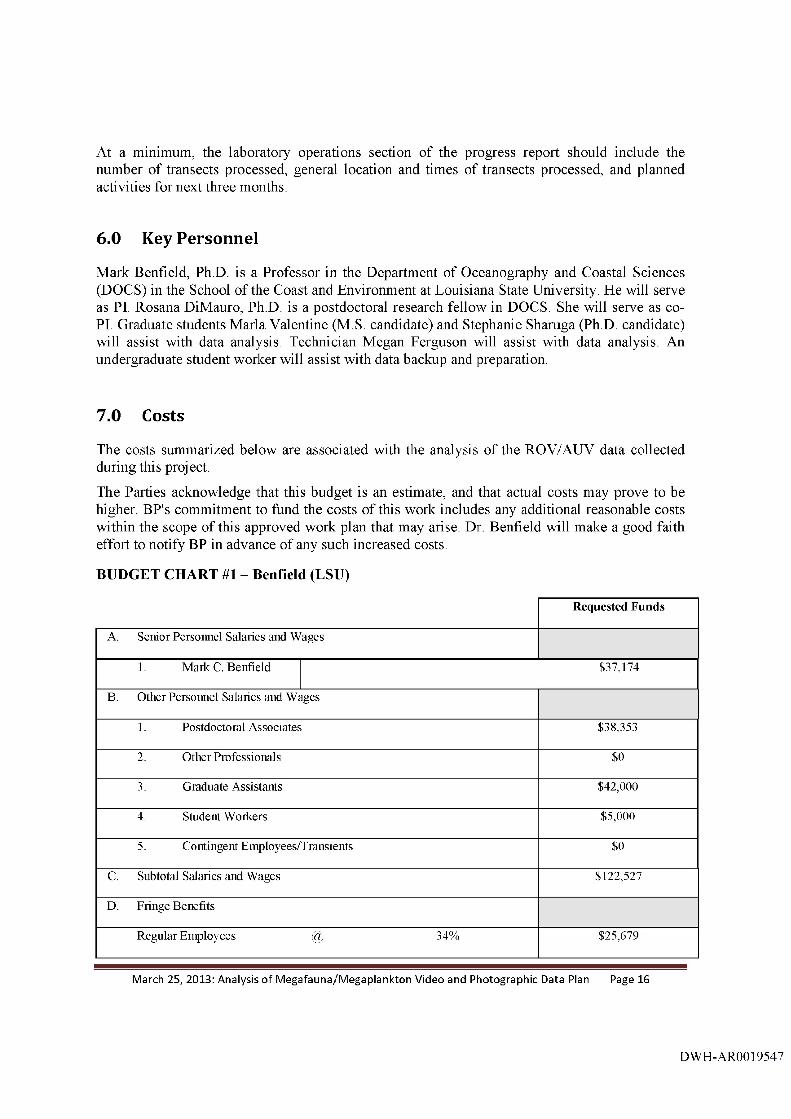
BUDGET CHART #1 - Benfield (LSU)
Requested Funds
A. Senior Personnel Salaries and Wages
1. Mark C. Benfield $37,174
B. Other Personnel Salaries and Wages
1. Postdoctoral Associates $38,353
2. Other Professionals $0
3. Graduate Assistants $42,000
4. Student Workers $5,000
5. Contingent Employees/Transients $0
C. Subtotal Salaries and Wages $122,527
D. Fringe Benefits
Regular Employees @ 34% $25,679
March 25, 2013: Analysis of M egafauna/Megaplankton Video and Photographic Data Plan Page 16
DWH-AROO 19547
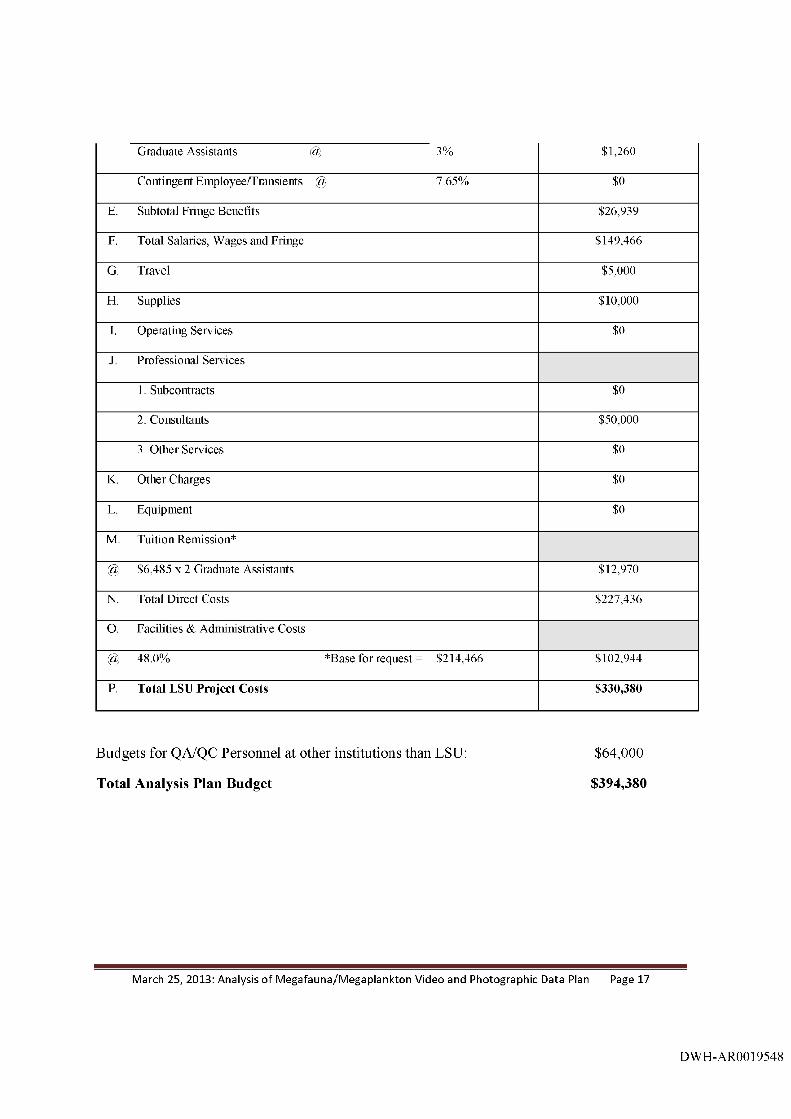
Graduate Assistants @ 3% $1,260
Contingent Employee/Transients @ 7.65% $0
E. Subtotal Fringe Benefits $26,939
F. Total Salaries, Wages and Fringe $149,466
G. Travel $5,000
H. Supplies $10,000
I. Operating Services $0
J Professional Services
1. Subcontracts $0
2. Consultants $50,000
3. Other Services $0
K. Other Charges $0
L. Equipment $0
M. Tuition Remission*
@ $6,485 X 2 Graduate Assistants $12,970
N. Total Direct Costs $227,436
O. Facilities & Administrative Costs
@ 48.0% *Base for request = $214,466 $102,944
P. Total LSU Project Costs $330,380
Budgets for QA/QC Personnel at other institutions than LSU:
Total Analysis Plan Budget
$64,000
$394,380
March 25 , 2013: Analysis of M egafauna/Megaplankton Video and Photographic Data Plan Page 17
DWH-AROO 19548
8.0 References
Benfield, M. 2011. Quantifying the Distribution, Abundance and Biodiversity of Benthic Megafauna and Mesopelagic/Bathypelagic Megaplankton in the Vicinity of the MC252 Spill. NRDA Study Plan, June 8.
Culverhouse, P.P., R. Williams, B. Reguera, V Herry, and S. Gonzalez-Gil. 2003. Do experts make mistakes? A comparison of human and machine identification of dinoflagellates. Marine Ecology Progress Series, 247: 1 7 -2 5 .
9.0 List of Appendices
Appendix A. Training record documentation forms
Appendix B. Data record forms
Appendix C. Standardized quarterly report template
March 25, 2013: Analysis of M egafauna/Megaplankton Video and Photographic Data Plan Page 18
DWH-AROO 19549
Related Documents