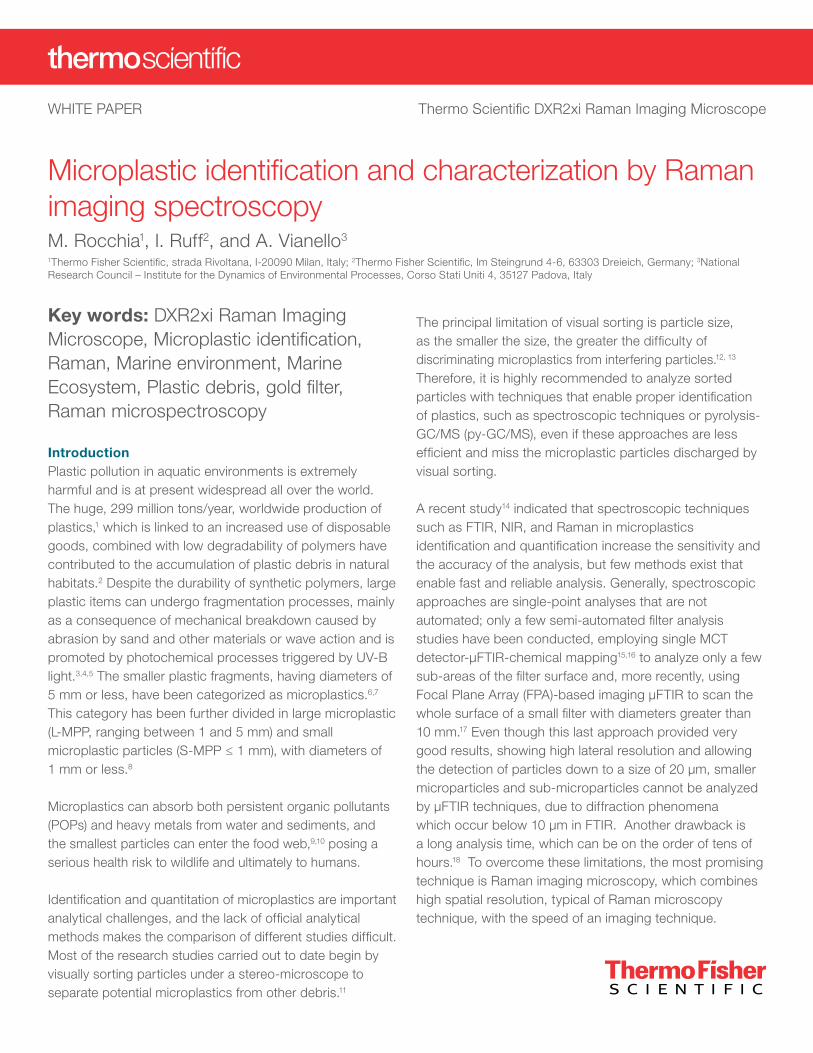
WHITE PAPER Thermo Scientific DXR2xi Raman Imaging Microscope Microplastic identification and characterization by Raman imaging spectroscopy The principal limitation of visual sorting is particle size, as the smaller the size, the greater the difficulty of discriminating microplastics from interfering particles. 12, 13 Therefore, it is highly recommended to analyze sorted particles with techniques that enable proper identification of plastics, such as spectroscopic techniques or pyrolysis- GC/MS (py-GC/MS), even if these approaches are less efficient and miss the microplastic particles discharged by visual sorting. A recent study 14 indicated that spectroscopic techniques such as FTIR, NIR, and Raman in microplastics identification and quantification increase the sensitivity and the accuracy of the analysis, but few methods exist that enable fast and reliable analysis. Generally, spectroscopic approaches are single-point analyses that are not automated; only a few semi-automated filter analysis studies have been conducted, employing single MCT detector-µFTIR-chemical mapping 15,16 to analyze only a few sub-areas of the filter surface and, more recently, using Focal Plane Array (FPA)-based imaging μFTIR to scan the whole surface of a small filter with diameters greater than 10 mm. 17 Even though this last approach provided very good results, showing high lateral resolution and allowing the detection of particles down to a size of 20 µm, smaller microparticles and sub-microparticles cannot be analyzed by µFTIR techniques, due to diffraction phenomena which occur below 10 µm in FTIR. Another drawback is a long analysis time, which can be on the order of tens of hours. 18 To overcome these limitations, the most promising technique is Raman imaging microscopy, which combines high spatial resolution, typical of Raman microscopy technique, with the speed of an imaging technique. Key words: DXR2xi Raman Imaging Microscope, Microplastic identification, Raman, Marine environment, Marine Ecosystem, Plastic debris, gold filter, Raman microspectroscopy Introduction Plastic pollution in aquatic environments is extremely harmful and is at present widespread all over the world. The huge, 299 million tons/year, worldwide production of plastics, 1 which is linked to an increased use of disposable goods, combined with low degradability of polymers have contributed to the accumulation of plastic debris in natural habitats. 2 Despite the durability of synthetic polymers, large plastic items can undergo fragmentation processes, mainly as a consequence of mechanical breakdown caused by abrasion by sand and other materials or wave action and is promoted by photochemical processes triggered by UV-B light. 3,4,5 The smaller plastic fragments, having diameters of 5 mm or less, have been categorized as microplastics. 6,7 This category has been further divided in large microplastic (L-MPP, ranging between 1 and 5 mm) and small microplastic particles (S-MPP ≤ 1 mm), with diameters of 1 mm or less. 8 Microplastics can absorb both persistent organic pollutants (POPs) and heavy metals from water and sediments, and the smallest particles can enter the food web, 9,10 posing a serious health risk to wildlife and ultimately to humans. Identification and quantitation of microplastics are important analytical challenges, and the lack of official analytical methods makes the comparison of different studies difficult. Most of the research studies carried out to date begin by visually sorting particles under a stereo-microscope to separate potential microplastics from other debris. 11 M. Rocchia 1 , I. Ruff 2 , and A. Vianello 3 1 Thermo Fisher Scientific, strada Rivoltana, I-20090 Milan, Italy; 2 Thermo Fisher Scientific, Im Steingrund 4-6, 63303 Dreieich, Germany; 3 National Research Council – Institute for the Dynamics of Environmental Processes, Corso Stati Uniti 4, 35127 Padova, Italy

Welcome message from author
This document is posted to help you gain knowledge. Please leave a comment to let me know what you think about it! Share it to your friends and learn new things together.
Transcript
WHITE PAPER Thermo Scientific DXR2xi Raman Imaging Microscope
Microplastic identification and characterization by Raman imaging spectroscopy
The principal limitation of visual sorting is particle size, as the smaller the size, the greater the difficulty of discriminating microplastics from interfering particles.12, 13 Therefore, it is highly recommended to analyze sorted particles with techniques that enable proper identification of plastics, such as spectroscopic techniques or pyrolysis-GC/MS (py-GC/MS), even if these approaches are less efficient and miss the microplastic particles discharged by visual sorting.
A recent study14 indicated that spectroscopic techniques such as FTIR, NIR, and Raman in microplastics identification and quantification increase the sensitivity and the accuracy of the analysis, but few methods exist that enable fast and reliable analysis. Generally, spectroscopic approaches are single-point analyses that are not automated; only a few semi-automated filter analysis studies have been conducted, employing single MCT detector-µFTIR-chemical mapping15,16 to analyze only a few sub-areas of the filter surface and, more recently, using Focal Plane Array (FPA)-based imaging μFTIR to scan the whole surface of a small filter with diameters greater than 10 mm.17 Even though this last approach provided very good results, showing high lateral resolution and allowing the detection of particles down to a size of 20 µm, smaller microparticles and sub-microparticles cannot be analyzed by µFTIR techniques, due to diffraction phenomena which occur below 10 µm in FTIR. Another drawback is a long analysis time, which can be on the order of tens of hours.18 To overcome these limitations, the most promising technique is Raman imaging microscopy, which combines high spatial resolution, typical of Raman microscopy technique, with the speed of an imaging technique.
Key words: DXR2xi Raman Imaging Microscope, Microplastic identification, Raman, Marine environment, Marine Ecosystem, Plastic debris, gold filter, Raman microspectroscopy
IntroductionPlastic pollution in aquatic environments is extremely harmful and is at present widespread all over the world. The huge, 299 million tons/year, worldwide production of plastics,1 which is linked to an increased use of disposable goods, combined with low degradability of polymers have contributed to the accumulation of plastic debris in natural habitats.2 Despite the durability of synthetic polymers, large plastic items can undergo fragmentation processes, mainly as a consequence of mechanical breakdown caused by abrasion by sand and other materials or wave action and is promoted by photochemical processes triggered by UV-B light.3,4,5 The smaller plastic fragments, having diameters of 5 mm or less, have been categorized as microplastics.6,7 This category has been further divided in large microplastic (L-MPP, ranging between 1 and 5 mm) and small microplastic particles (S-MPP ≤ 1 mm), with diameters of 1 mm or less.8
Microplastics can absorb both persistent organic pollutants (POPs) and heavy metals from water and sediments, and the smallest particles can enter the food web,9,10 posing a serious health risk to wildlife and ultimately to humans.
Identification and quantitation of microplastics are important analytical challenges, and the lack of official analytical methods makes the comparison of different studies difficult. Most of the research studies carried out to date begin by visually sorting particles under a stereo-microscope to separate potential microplastics from other debris.11
M. Rocchia1, I. Ruff2, and A. Vianello3 1Thermo Fisher Scientific, strada Rivoltana, I-20090 Milan, Italy; 2Thermo Fisher Scientific, Im Steingrund 4-6, 63303 Dreieich, Germany; 3National Research Council – Institute for the Dynamics of Environmental Processes, Corso Stati Uniti 4, 35127 Padova, Italy

This paper discusses a simulation of the analysis of microplastic particles by using reference materials to provide an ideal analytical model of potential environmental samples.
Experimental Materials and methods Three different reference materials were used to simulate microplastic debris with different particle sizes: irregularly shaped polyethylene particles sieved at 74 microns (Sigma-Aldrich S.r.l.), polystyrene-divinylbenzene PS-DVB (2% of DVB - Sigma-Aldrich) microspheres sieved between 37 -74 microns, and polyethylene-titanium dioxide PE-TiO2 microspheres with a size range of 27-45 micron (white polyethylene, opaque polymer microspheres beads; density 1.25 g/cm3 - Cospheric LLC). A few milligrams of each type of particles were mixed with 0.5 L of water and filtered through a gold-coated polycarbonate membrane (Whatman® Nuclepore™ Track-Etched Membrane 800195) with a diameter of 13 mm and a pore size of 0.8 μm. After filtration, the membrane was dried in a furnace at 60°C for 2h before Raman microscopy measurements to avoid shrinking the filter under laser illumination. The filter was then blocked between two thin glass cover slips (180 microns thick) in order to improve its flatness and was measured in confocal mode with the Thermo Scientific™ DXR™2xi Raman Imaging Microscope. The gold filter was chosen due to its versatility since it can be used for Raman as well as for infrared microscopy measurements.
Raman analysis Raman data were collected using the DXR2xi Raman imaging microscope and the accompanying Thermo Scientific™ OMNIC™xi Raman imaging software. The DXR2xi Raman microscope is capable of collecting up to 600 spectra/second, enabling the analysis of the whole surface of a filter. This approach greatly expands the analytical possibilities for microplastics and sub-microplastics down to the nanoplastics range, and also significantly reduces the analysis time. This increase in acquisition speed means that collection of large-area Raman images is now, not only practical, but can be routine. The OMNICxi software also represents an evolution in software specifically designed for imaging, providing a convenient and easy-to-use graphical interface for harnessing all additional data. The software also contains powerful analytical algorithms to process the data into informative Raman images in real time. During data acquisition, Multivariate Curve Resolution (MCR) is the technique used to calculate the number, relative concentration and distribution of the components of an unknown mixture without prior information.
Raman imaging result The 13 mm gold filter has an active 10 mm diameter area that can easily be imaged with the DXR2xi Raman microscope. An area of 10 mm x 10 mm was selected, as shown by the red frame in Figure 1A, and a 10x objective was used to scan the entire active surface. The acquisition speed was 400Hz (400 spectra/seconds) and 13 exposures were collected at each point using a 532 nm laser, a laser power of 10 mW measured at the sample, and a pinhole aperture of 25 µm. The image pixel size was 10 µm and more than 600,000 spectra were acquired. Figure 1B, C, and D each show the distribution of the microplastic particles; PE, PS-DVB, and PE-TiO2 respectively, on the filter surface after the acquisition of the Raman spectral image. Identification of the particles was accomplished by using the library search tool within the OMNICxi software.
The collection mode of the OMNICxi software permits the acquisition of one exposure over the full region of interest, allowing a quick visualization of the chemical information all over the image. The quality of the image can be improved by co-adding exposures to the first one with the same collection mode. This feature allows the user to look at different chemical information such as peak height, peak area, peak position, peak area ratio, peak height ratio and MCR during the collection and to stop the experiment as soon as the desired information is obtained.
Figure 1: A, optical image of the gold filter; B, distribution of irregular shaped PE particles, which are highlighted with green; C, distribution of PS-DVB, which are highlighted with blue; D, distribution of PE-TiO
2 microspheres, which are highlighted with red.

The spectra of the three reference microplastic particulate materials are shown in Figure 2 and were used to create a library. The search capability of the OMNICxi Raman imaging software, which allows the identification of the particles by using built-in libraries, is illustrated in Figure 3.
The analysis of the Raman spectra underlines the value of Raman microscopy as compared to infrared microscopy. Not only does Raman microscopy have better spatial resolution than infrared microscopy, but it also enables the identification of the plastic additive, titanium dioxide (TiO2) in this specific case, since the low wavenumber range down to 50 cm-1 is accessible with Raman spectroscopy. The identification and quantitation of TiO2 are important because of recent studies on its potential toxicity18 and due to the fact that it is widely used in packaging material as
Figure 2: Raman spectra of the microplastic standards: PE - polyethylene; PE-TiO2 polyethylene-titanium dioxide; PS-DVB – polystyrene-divinylbenzene.
well as in cosmetics such as scrubbing cream, toothpaste, and other common and widely used products. The FPA infrared detector, which is most commonly used for this application, has a cut-off at 900 cm-1 and, thus is not suitable for the determination of TiO2.
The map analysis using the MCR algorithm calculates the distribution and size of the three standard particles and facilitates visualization of each reference material with a different color. Figure 1 shows the complete picture of the filter with the particulate materials identified, while Figure 4B shows an enlargement of a specific region where it is possible to appreciate how Raman analysis is able to identify small particles.
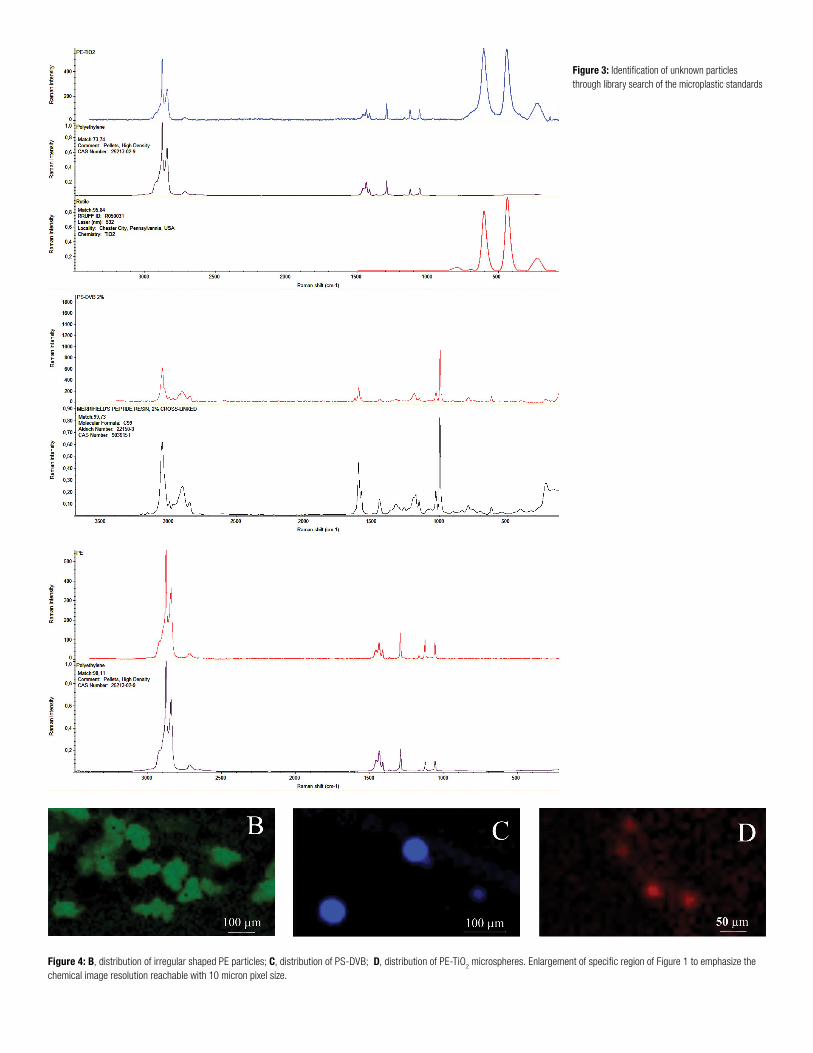
Figure 4: B, distribution of irregular shaped PE particles; C, distribution of PS-DVB; D, distribution of PE-TiO2 microspheres. Enlargement of specific region of Figure 1 to emphasize the
chemical image resolution reachable with 10 micron pixel size.
Figure 3: Identification of unknown particles through library search of the microplastic standards
Find out more at thermofisher.com/Raman
For Research Use Only. Not for use in diagnostic procedures. © 2017 Thermo Fisher Scientific Inc. All rights reserved. Whatman is a registered trademark and Nucleopore is a trademark of General Electric Company. All other trademarks are the property of Thermo Fisher Scientific and its subsidiaries. WP52981_E_10/17M
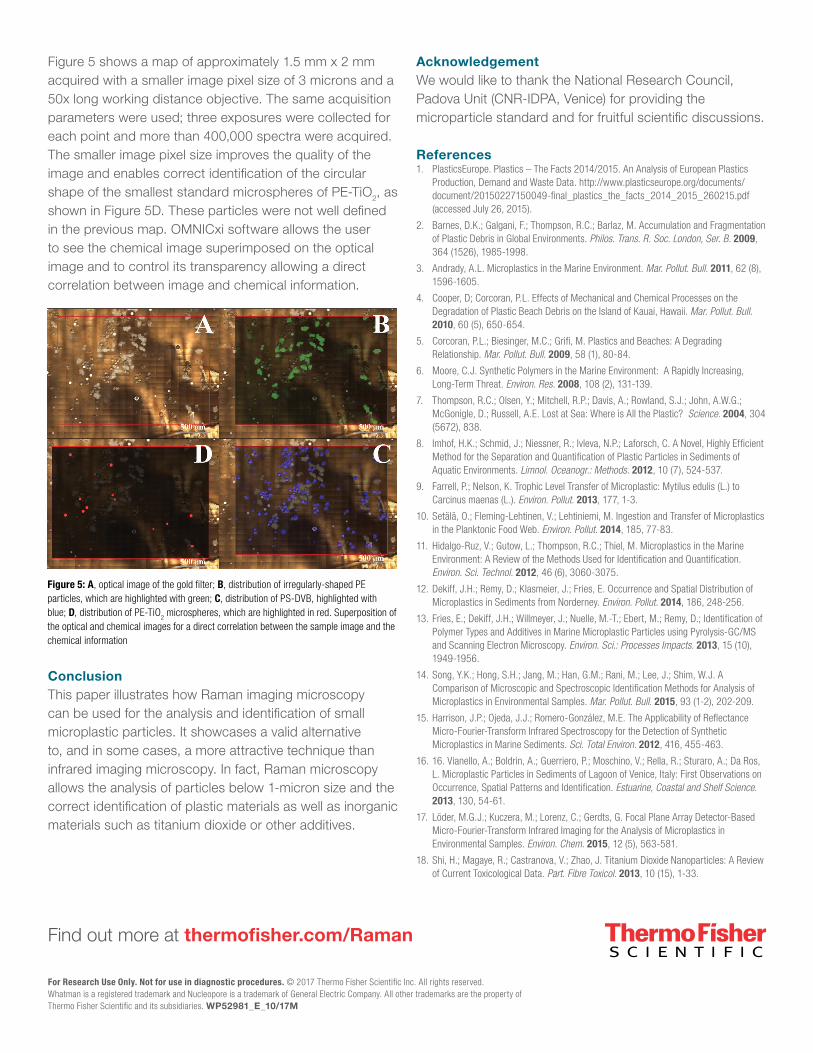
Figure 5 shows a map of approximately 1.5 mm x 2 mm acquired with a smaller image pixel size of 3 microns and a 50x long working distance objective. The same acquisition parameters were used; three exposures were collected for each point and more than 400,000 spectra were acquired. The smaller image pixel size improves the quality of the image and enables correct identification of the circular shape of the smallest standard microspheres of PE-TiO2, as shown in Figure 5D. These particles were not well defined in the previous map. OMNICxi software allows the user to see the chemical image superimposed on the optical image and to control its transparency allowing a direct correlation between image and chemical information.
ConclusionThis paper illustrates how Raman imaging microscopy can be used for the analysis and identification of small microplastic particles. It showcases a valid alternative to, and in some cases, a more attractive technique than infrared imaging microscopy. In fact, Raman microscopy allows the analysis of particles below 1-micron size and the correct identification of plastic materials as well as inorganic materials such as titanium dioxide or other additives.
Acknowledgement We would like to thank the National Research Council, Padova Unit (CNR-IDPA, Venice) for providing the microparticle standard and for fruitful scientific discussions.
References 1. PlasticsEurope. Plastics – The Facts 2014/2015. An Analysis of European Plastics
Production, Demand and Waste Data. http://www.plasticseurope.org/documents/document/20150227150049-final_plastics_the_facts_2014_2015_260215.pdf (accessed July 26, 2015).
2. Barnes, D.K.; Galgani, F.; Thompson, R.C.; Barlaz, M. Accumulation and Fragmentation of Plastic Debris in Global Environments. Philos. Trans. R. Soc. London, Ser. B. 2009, 364 (1526), 1985-1998.
3. Andrady, A.L. Microplastics in the Marine Environment. Mar. Pollut. Bull. 2011, 62 (8), 1596-1605.
4. Cooper, D; Corcoran, P.L. Effects of Mechanical and Chemical Processes on the Degradation of Plastic Beach Debris on the Island of Kauai, Hawaii. Mar. Pollut. Bull. 2010, 60 (5), 650-654.
5. Corcoran, P.L.; Biesinger, M.C.; Grifi, M. Plastics and Beaches: A Degrading Relationship. Mar. Pollut. Bull. 2009, 58 (1), 80-84.
6. Moore, C.J. Synthetic Polymers in the Marine Environment: A Rapidly Increasing, Long-Term Threat. Environ. Res. 2008, 108 (2), 131-139.
7. Thompson, R.C.; Olsen, Y.; Mitchell, R.P.; Davis, A.; Rowland, S.J.; John, A.W.G.; McGonigle, D.; Russell, A.E. Lost at Sea: Where is All the Plastic? Science. 2004, 304 (5672), 838.
8. Imhof, H.K.; Schmid, J.; Niessner, R.; Ivleva, N.P.; Laforsch, C. A Novel, Highly Efficient Method for the Separation and Quantification of Plastic Particles in Sediments of Aquatic Environments. Limnol. Oceanogr.: Methods. 2012, 10 (7), 524-537.
9. Farrell, P.; Nelson, K. Trophic Level Transfer of Microplastic: Mytilus edulis (L.) to Carcinus maenas (L.). Environ. Pollut. 2013, 177, 1-3.
10. Setälä, O.; Fleming-Lehtinen, V.; Lehtiniemi, M. Ingestion and Transfer of Microplastics in the Planktonic Food Web. Environ. Pollut. 2014, 185, 77-83.
11. Hidalgo-Ruz, V.; Gutow, L.; Thompson, R.C.; Thiel, M. Microplastics in the Marine Environment: A Review of the Methods Used for Identification and Quantification. Environ. Sci. Technol. 2012, 46 (6), 3060-3075.
12. Dekiff, J.H.; Remy, D.; Klasmeier, J.; Fries, E. Occurrence and Spatial Distribution of Microplastics in Sediments from Norderney. Environ. Pollut. 2014, 186, 248-256.
13. Fries, E.; Dekiff, J.H.; Willmeyer, J.; Nuelle, M.-T.; Ebert, M.; Remy, D.; Identification of Polymer Types and Additives in Marine Microplastic Particles using Pyrolysis-GC/MS and Scanning Electron Microscopy. Environ. Sci.: Processes Impacts. 2013, 15 (10), 1949-1956.
14. Song, Y.K.; Hong, S.H.; Jang, M.; Han, G.M.; Rani, M.; Lee, J.; Shim, W.J. A Comparison of Microscopic and Spectroscopic Identification Methods for Analysis of Microplastics in Environmental Samples. Mar. Pollut. Bull. 2015, 93 (1-2), 202-209.
15. Harrison, J.P.; Ojeda, J.J.; Romero-González, M.E. The Applicability of Reflectance Micro-Fourier-Transform Infrared Spectroscopy for the Detection of Synthetic Microplastics in Marine Sediments. Sci. Total Environ. 2012, 416, 455-463.
16. 16. Vianello, A.; Boldrin, A.; Guerriero, P.; Moschino, V.; Rella, R.; Sturaro, A.; Da Ros, L. Microplastic Particles in Sediments of Lagoon of Venice, Italy: First Observations on Occurrence, Spatial Patterns and Identification. Estuarine, Coastal and Shelf Science. 2013, 130, 54-61.
17. Löder, M.G.J.; Kuczera, M.; Lorenz, C.; Gerdts, G. Focal Plane Array Detector-Based Micro-Fourier-Transform Infrared Imaging for the Analysis of Microplastics in Environmental Samples. Environ. Chem. 2015, 12 (5), 563-581.
18. Shi, H.; Magaye, R.; Castranova, V.; Zhao, J. Titanium Dioxide Nanoparticles: A Review of Current Toxicological Data. Part. Fibre Toxicol. 2013, 10 (15), 1-33.
Figure 5: A, optical image of the gold filter; B, distribution of irregularly-shaped PE particles, which are highlighted with green; C, distribution of PS-DVB, highlighted with blue; D, distribution of PE-TiO
2 microspheres, which are highlighted in red. Superposition of
the optical and chemical images for a direct correlation between the sample image and the chemical information
Related Documents