POUR L'OBTENTION DU GRADE DE DOCTEUR ÈS SCIENCES acceptée sur proposition du jury: Prof. H. P. Herzig, président du jury Prof. H. Shea, directeur de thèse Dr M. Dadras, rapporteur Dr A. Karimi, rapporteur Dr G. Kofod, rapporteur Metal-Ion Implanted Elastomers: Analysis of Microstructures and Characterization and Modeling of Electrical and Mechanical Properties THÈSE N O 4798 (2010) ÉCOLE POLYTECHNIQUE FÉDÉRALE DE LAUSANNE PRÉSENTÉE LE 17 SEPTEMBRE 2010 À LA FACULTÉ SCIENCES ET TECHNIQUES DE L'INGÉNIEUR LABORATOIRE DES MICROSYSTÈMES POUR LES TECHNOLOGIES SPATIALES PROGRAMME DOCTORAL EN MICROSYSTÈMES ET MICROÉLECTRONIQUE Suisse 2010 PAR Muhamed NIKLAUS

Welcome message from author
This document is posted to help you gain knowledge. Please leave a comment to let me know what you think about it! Share it to your friends and learn new things together.
Transcript
POUR L'OBTENTION DU GRADE DE DOCTEUR ÈS SCIENCES
acceptée sur proposition du jury:
Prof. H. P. Herzig, président du juryProf. H. Shea, directeur de thèse
Dr M. Dadras, rapporteur Dr A. Karimi, rapporteur Dr G. Kofod, rapporteur
Metal-Ion Implanted Elastomers:Analysis of Microstructures and Characterization and
Modeling of Electrical and Mechanical Properties
THÈSE NO 4798 (2010)
ÉCOLE POLYTECHNIQUE FÉDÉRALE DE LAUSANNE
PRÉSENTÉE LE 17 SEPTEMBRE 2010
À LA FACULTÉ SCIENCES ET TECHNIQUES DE L'INGÉNIEUR
LABORATOIRE DES MICROSYSTÈMES POUR LES TECHNOLOGIES SPATIALES
PROGRAMME DOCTORAL EN MICROSYSTÈMES ET MICROÉLECTRONIQUE
Suisse2010
PAR
Muhamed NIKLAUS


Thought, a brief flash in the middle of night,
but a flash which means … everything.
Jules Henri Poincaré

Abstract This thesis reports on the microstructural analysis of metal ion implanted Polydimethylsiloxane (PDMS), and on the characterization and modeling of its electrical and mechanical properties. Low energy (below 35 keV) metal ion implantation into PDMS forms metal nanoparticles in the top 10 nm to 120 nm of the polymer, creating a metal–insulator composite. Above a certain ion dose, the percolation threshold, the particles form a conductive path. By suitable choice of the volume-ratio between the two constituents (metal atoms and PDMS), one is able to create stretchable electrodes capable of sustaining uniaxial strains of up to 175% while remaining conductive, and remaining operational after 105 cycles at 30% strain. These outstanding properties are especially required for flexible electronic and for polymer actuators and sensors. Low energy metal ion implantation into 30 μm thick PDMS was performed at 10 keV and 35 keV with Low Energy Broad Beam Implanter (LEI), and at 2.5 keV, 5 keV and 10 keV with Filtered Cathode Vacuum Arc (FCVA). The metals used for the implantation were Titanium and Gold. Doses ranged from 0.1x10¹⁶ at/cm2 to 7x10¹⁶ at/cm2, leading to surface resistivities between 100 Ω/square and 100 MΩ/square. Generally lower implantation energy and higher ion doses lead to better conductivities. However doses above the percolation threshold lead to an important increase of stiffness. The effective Young’s modulus measurements for FCVA implanted samples were in the range of 5 MPa. The samples implanted with LEI showed much important increase of the stiffness reaching 80 MPa for the gold and 170 MPa for the titanium implantations. Together the electrical and the mechanical measurements showed the best conductivity-to-compliance-ratio is obtained with FCVA implantation with Gold at 2.5 keV and doses around 1.5x10¹⁶ at/cm2.
A TEM sample preparation method based on cryo-ultramicrotomy, was developed, adapted for extremely low modulus (1 MPa) elastomers with hard inclusions, allowing high-resolution TEM cross-section micrographs for microstructural analysis of the implanted layers. Gold ions penetrate PDMS by up to 30 nm (for FCVA, 60 nm for LEI) and form crystalline nanoparticles whose size increases with the dose and the energy. Titanium forms a nearly homogeneous amorphous composite with the PDMS up to 18 nm thick (for FCVA) and 120 nm thick for LEI). The penetration depths were confirmed with computer simulations.
Using TEM micrographs the metal volume fraction of the composite was accurately determined, allowing conductivity and the Young’s modulus to be plotted vs. the volume fraction. The graphs showed different scalings dependant on the microstructure and on the ion species, allowing for the first time quantitative use of the percolation theory for ion implanted thin films. This allowed linking the composite’s Young’s modulus and conductivity directly to the implantation parameters and volume fraction. Both electrical and mechanical properties were measured on the same samples, and different percolation thresholds and exponents were found, showing that while percolation explains very well both conduction and stiffness of the composite, the interaction between metal nanoparticles occurs differently for determining mechanical and electrical properties.
Flexible electrodes fabricated by this ion implantation technique were used to fabricate small arrays of 1 to 3 mm diameter tunable lenses, consisting of

electroactive polymer actuators bonded to a socket that provides fluidic coupling between devices. The focal length was electrically tuned from 4 mm to 8 mm by applying a voltage from 0 kV to 1.7 kV. Keywords: Metal ion implantation, Conductivity, Elastic properties, Percolation, microstructure, Electroactive polymers.
Abstrakt Die vorliegende Dissertation berichtet über Analysen der Mikrostruktur von Metall-Ionen implantiertem Polydimethylsiloxan (PDMS) und über Charakterisierung und Modellierung der elektrischen und mechanischen Eigenschaften. Niederenergie-Metall-Ionen-Implantation (kleiner als 35 keV) des PDMS bildet Metall-Nanopartikel in obersten 10 nm bis 120 nm dicken Schichten des Polymers. Dadurch entsteht ein Metall-Isolator-Verbundwerkstoff. Ab einer bestimmten Ionenkonzentration, bekannt als die Perkolationsschwelle, formen die Partikel ein für den elektrischen Strom leitendes Netzwerk. Durch ein geeignetes Volumenverhältniss der beiden Komponenten, der Metallionen und des PDMS, werden flexible Elektroden entwickelt, die uniaxiale mechanische Spannungen von bis zu 175% ertragen, ohne dabei die elektrische Leitfähigkeit zu verlieren. Die Elektroden bleiben nach 105 Zyklen bei 30% mechanischer Spannung operationsfähig. Diese herausragenden Eigenschaften sind besonders interessant für flexible Elektronik, für Polymer-Aktoren und Sensoren. Die Implantationen der 30 μm dünnen Schicht des PDMS wurden für 10 keV und 35 keV mit einem Niederenergie-Breitstrahl-Implanter (LEI), und für 2,5 keV, 5 keV und 10 keV mit einem Filter-Kathode-Vakuum-Elektrobogen-Implanter (FCVA) durchgeführt. Für die Implantation verwendete Metalle waren Titanium und Gold. Die implantierte Ionendosis reichte von 0.1x10¹⁶ at/cm2 bis 7x10¹⁶ at/cm2, was zu spezifischen Flächenwiderständen zwischen 100 Ω/Quadrat und 100 MΩ/Quadrat führte. Generell folgt aus höherer Ionendosis und niedrigerer Energie bessere elektrische Leitfähigkeiten. Allerdings führen die Konzentrationen oberhalb der Perkolationsschwelle zu einer bedeutenden Steigerung der Steifigkeit. Der Elastizitätsmodulmessungen für die von FCVA implantierten Proben lagen im Bereich von 5 MPa. Die Proben, die mit LEI implantiert wurden, zeigten eine bedeutend grössere Zunahme der Steifigkeit, die 80 MPa für die Gold- und 170 MPa für die Titaniumimplantate ergab. Die elektrischen und mechanischen Messungen zigten zusammen das beste Verhältniss zwischen der elektrischen Leitfähigkeit und der Elastizität für die FCVA-Goldimplantation mit 2.5 keV und einer Dosis von 1.5x10¹⁶ at/cm2. Eine Probenvorbereitungsmethode für die Transmissionelektronenmikroskopie (TEM) wurde entwickelt. Sie basiert auf der Kryo-Ultramikrotomie und ist für extrem niedrige Elastizitätsmodule (1 MPa) geeignet. Die Methode erlaubt mikrostrukturelle Analysen der implantierten Schichten dank hochauflösenden TEM-Querschnittsbilder. Goldione dringen bis zu 30 nm tief in PDMS ein (für FCVA, 60 nm für LEI) und bilden danach kristalline Nanopartikel, deren Größe mit der Implantationsenergie und der Ionendosis steigt. Titaniumionen bilden mit PDMS eine fast homogene, 18 nm dicke (für FCVA, 120 nm für LEI), amorphe Schicht. Die Eingangstiefen der implantierten Ionen wurden mit Computer simuliert und bestätigt. Dank den TEM-Querschittsbilder wurde die Volumenfraktion (Konzentration) der Metallpartikel innerhalb der implantierten PDMS-Schicht determiniert, so dass die elektrische Leitfähigkeit und das Elastizitätsmodul als Funktion der Volumenfraktion graphisch dargestellt werden konnten. Zum ersten Mal wurde die
Perkolationstheorie an implantierten dünnen Schichten angewendet und quantitativ ausgewertet. Die Graphiken zeigten diverse Skalierungen abhängig von der Mikrostruktur und dem implantierten Element. Dies ermöglichte eine Beziehung zwischen dem Elastizitätsmodul (oder der Leitfähigkeit) und den Implantationsparametern zu etablieren, und zeigte unterschiedliche elektrische und mechanische Perkolationsparameter, die zum ersten mal gleichzeitig an denselben Proben gemessen wurden. Flexible Elektroden angefertigt durch Ionenimplantation wurden für die Herrstellung von in Matrizen geordneten, abstimmbaren, kleinen (1-3 mm Durchmesser) Linsen verwendet. Sie bestanden aus elektroaktiven Polymer-Aktoren und PDMS-Membranen (Linsen) verbunden durch mit Flüssigkeit gefüllten Kanälen. Die Brennweite wurde elektrisch, durch das Anlegen einer Spannung von 0 kV bis 1,7 kV, von 4 mm bis 8 mm abgestimmt. Stichwörter: Metall-Ionen-Implantation, elektrische Leitfähigkeit, Elastizität, Perkolation, Mikrostruktur, Elektroaktive Polymere.
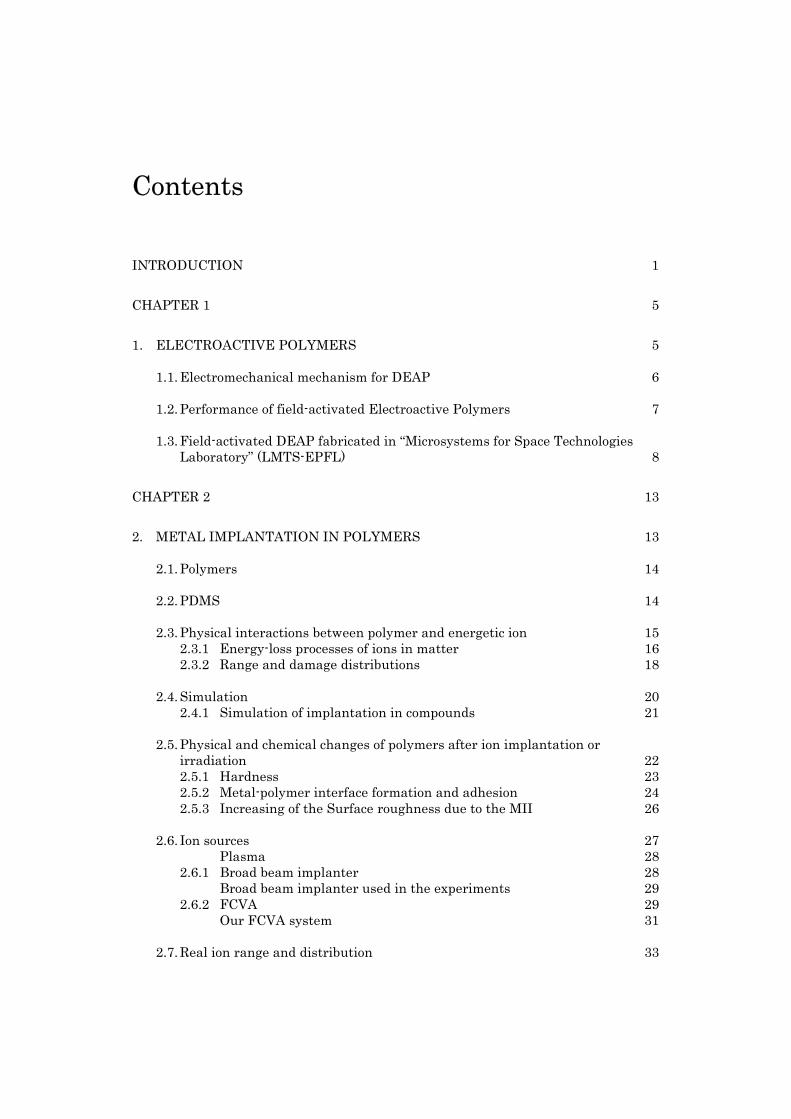
Contents
INTRODUCTION 1
CHAPTER 1 5
1. ELECTROACTIVE POLYMERS 5
1.1. Electromechanical mechanism for DEAP 6
1.2. Performance of field-activated Electroactive Polymers 7
1.3. Field-activated DEAP fabricated in “Microsystems for Space Technologies Laboratory” (LMTS-EPFL) 8
CHAPTER 2 13
2. METAL IMPLANTATION IN POLYMERS 13
2.1. Polymers 14
2.2. PDMS 14
2.3. Physical interactions between polymer and energetic ion 15 2.3.1 Energy-loss processes of ions in matter 16 2.3.2 Range and damage distributions 18
2.4. Simulation 20 2.4.1 Simulation of implantation in compounds 21
2.5. Physical and chemical changes of polymers after ion implantation or irradiation 22 2.5.1 Hardness 23 2.5.2 Metal-polymer interface formation and adhesion 24 2.5.3 Increasing of the Surface roughness due to the MII 26
2.6. Ion sources 27 Plasma 28
2.6.1 Broad beam implanter 28 Broad beam implanter used in the experiments 29
2.6.2 FCVA 29 Our FCVA system 31
2.7. Real ion range and distribution 33
CHAPTER 3 35
3. IRRADIATION EFFECTS ON POLYMERS 35
3.1. Influence on polymers 35 Total ionizing dose – TID 35
3.1.1 Gamma irradiation (ionizing irradiation) 35 3.1.2 Proton irradiation 37
3.2. Sources 38 3.2.1 Gamma source 38 3.2.2 Proton source 39
CHAPTER 4 41
4. MODELING OF ELASTICITY AND CONDUCTIVITY IN COMPOSITE HETEROGENEOUS MATERIALS 41
4.1. Modeling theories for heterogeneous materials 42 4.1.1 Percolation theory 42 4.1.2 General effective media theory 44 4.1.3 Field theories 44
Maxwell approximation or Coated spheres model (Hashin-Shtrikman Two-Point-Bounds) 44 Three-Point Bounds 45
4.1.4 Laminar theory 46
4.2. Universal scaling for the radiation induced polymer modifications 47 4.2.1 Closing remarks 48
CHAPTER 5 49
5. SAMPLE PREPARATION 49
5.1. Pyrex and silicon chips 49
5.2. Free standing PDMS thin films 50
5.3. Implantation 52
5.4. Sputtering 52
5.5. Irradiation 54
CHAPTER 6 55
6. MICROSTRUCTURE OF THE IMPLANTED PDMS 55
6.1. X-ray photoelectron spectroscopy (XPS) 56 6.1.1 Experimental setup 58 6.1.2 Results and discussion 59 6.1.3 Conclusion on XPS measurements 62
6.2. Atomic Force Microscope (AFM) 63 6.2.1 Experimental setup 64 6.2.2 Results and discussion 64
Height measurements 64 Phase measurements 67
6.2.3 Conclusion 69
6.3. Transmission electron microscope (TEM) 69 6.3.1 TEM imaging 71 6.3.2 Basic Sample preparation 72 6.3.3 Three techniques 74 6.3.4 Verification of the integrity of the cross-section 76 6.3.5 TEM micrographs 77
Au: LEI (35 kev and 10 keV) and FCVA (10 keV) 78 Ti: LEI (35 kev and 10 keV) and FCVA (10 kev) 79 Au (FCVA): 10 keV, 5 keV and 2.5 keV 80 Ti (FCVA): 10 keV, 5 keV and 2.5 keV 81
6.3.6 Results and discussion 82 Penetration depth 82 Surface states 82 Morphology of the titanium composites 82 Morphology of the gold composites 83
6.3.7 Volume fraction of metal in PDMS 87 General considerations 87 Procedure to compute the volume fraction 88 Gold clusters 89
6.4. Concluding Remark 90
CHAPTER 7 93
7. EXPERIMENTAL SETUPS FOR TESTING THE MECHANICAL, ELECTRICAL AND OPTICAL PROPERTIES OF THE ION-IMPLANTED PDMS 93
7.1. Electrical conductivity measurements 93
7.2. Dielectric breakdown measurements 94
7.3. Optical transmission properties 95
7.4. Measurements of mechanical properties: Young’s modulus 95
7.5. Fitting the data with the percolation theory: the Origin software 97
CHAPTER 8 99
8. MECHANICAL, ELECTRICAL AND OPTICAL PROPERTIES OF THE ION-IMPLANTED PDMS, AND LINK TO MICROSTRUCTURE VIA PERCOLATION THEORY 99
8.1. Physical properties of irradiated samples – Gamma and proton irradiation 101 8.1.1 Gamma irradiation 101
Breakdown Voltage vs. TID 102 Mechanical properties vs. TID 102 Optical transmission vs. TID 103 Transmission properties of the un-implanted PDMS membranes vs. TID 104 Transmission properties of the doubly-implanted PDMS membranes vs. TID 104
8.1.2 Proton Irradiation 106 Breakdown Voltage vs. TID 106 Mechanical properties vs. TID 107 Optical transmission vs. TID 108
8.2. Physical properties of implanted samples – LEI vs. FCVA 109 8.2.1 Electrical properties (LEI vs. FCVA) 109
Percolation model 112 Conduction mechanisms 114
8.2.2 Mechanical properties (LEI vs. FCVA) 115
8.3. Electrical conductivity of the FCVA implanted samples 118 8.3.1 Results 118 8.3.2 Discussion and Modeling 119
About the Field theories 119 8.3.3 Percolation theory 123
Percolation threshold 124 Exponent 126
8.4. Mechanical properties of the FCVA implanted samples 128 8.4.1 Results 128 8.4.2 Discussion and Modeling of Young’s modulus of the composite 132
Percolation Threshold 135 Exponents a and f 136 Young’s Modules of components 137
8.5. Conclusion on the Young’s modulus and electrical conductivity of the FCVA implanted samples 138
CHAPTER 9 143
9. APPLICATION - ARRAY OF LENSES WITH INDIVIDUALLY TUNABLE FOCAL-LENGTH BASED ON TRANSPARENT ION-IMPLANTED EAPS 143
9.1. Introduction 144
9.2. Design and fabrication 145 9.2.1 Design 145 9.2.2 Fabrication 147 9.2.3 Assembly 149
9.3. Performance test 149
9.4. Model of focal length vs. voltage 149
9.5. Results – Performance of the tunable lens device 152
9.6. Conclusion 154
10. CONCLUSIONS 155
11. PUBLICATIONS 163
12. ACKNOWLEDGMENTS 165
13. APPENDIX 167
13.1. XPS measurements 167
13.2. AFM images 171
14. BIBLIOGRAPHY 175
15. CURRICULUM VITAE 183

1
Introduction
In 2005, it was shown at the EPFL-LMTS that miniaturized dielectric electroactive polymer (DEAP) actuators made with compliant elastomeric electrodes fabricated by ion-implantation combined high electromechanical efficiency with the potential for integrating large numbers of such actuators on one chip.
Using metal ion implantation to fabricate compliant electrodes on elastomers has several advantages compared to other techniques such as thin film metal deposition, carbon grease, metallic nano-particles, or conductive polymers. The advantages are primarily a very small increase in stiffness of the metals-elastomer composite, the ability to conduct at strains of over 100%, and the patternability on the µm sale.
Knowing that ion-implanted elastomer electrodes enable the microfabrication of high efficiency electroactive polymer actuators, the goal of this thesis was to understand this novel composite on a more fundamental level, with as main objective linking the microstructure to the macroscopic properties.
When I started work on this thesis in 2006, there was only a very limited understanding of electrical and mechanical properties of ion-implanted elastomers. Metal ion implantation is indeed a well-known and widely used technique in metallurgy for coatings or in the semiconductor industry for doping. However low-energy metal ion-implantation is used here to create a novel composite material, consisting of 2-20 nm diameter metal particles in a PDMS matrix. The implantation leads not only to the formation of metal particles, but also modifies the PDMS’s properties (Young’s modulus, conductivity). From the modeling point of view, due to the structure complexity of polymers, the phenomenon of the ion-polymer interaction is not as well understood as for ion-metal or ion-semiconductor interaction. The microstructure of the ion implanted PDMS and the macroscopic properties are linked, but little data was available to establish this relationship. The first step of this work was to characterize the electrical and mechanical properties of PDMS implanted at low energies (lower than 35 keV) with Gold and Titanium ions, at different doses. As a second step, the microstructure of the implanted PDMS was analyzed, principally by Transmission Electron Microscopy (TEM), and related to implantation parameter such as ion energy, ion dose, and ion species. Finally, percolation theory showed to provide a very good description of both conductivity and Young’s modulus of the composite, allowing accurate modeling of this novel composite. In Chapter 1 a short introduction to the electroactive polymers (EAP) will be given, as they are the motivation of this project. Their working principle as well as the latest developments in that field, including the developments from LMTS group, will be presented.
Chapter 2 summarizes the theory necessary to understand the basic phenomena of Metal Ion Implantation (MII) into polymers. It gives an overview on the polymers and PDMS in particular, a short section on the physical interactions between the ions
2 INTRODUCTION
and the polymers, and a summary on chemical and mechanical modifications observed by other groups. Also the ion sources used in the experiments will be presented.
The 3rd chapter deals with gamma and proton irradiation of polymers, their influence on the polymer properties, and the irradiation sources employed.
Chapter 4 presents several of the theories that were used to model the electrical and mechanical properties of the implanted PDMS.
In the Chapter 5 the sample preparation method will be explained – from the fabrication of free-standing PDMS films to the ion implantation and irradiation.
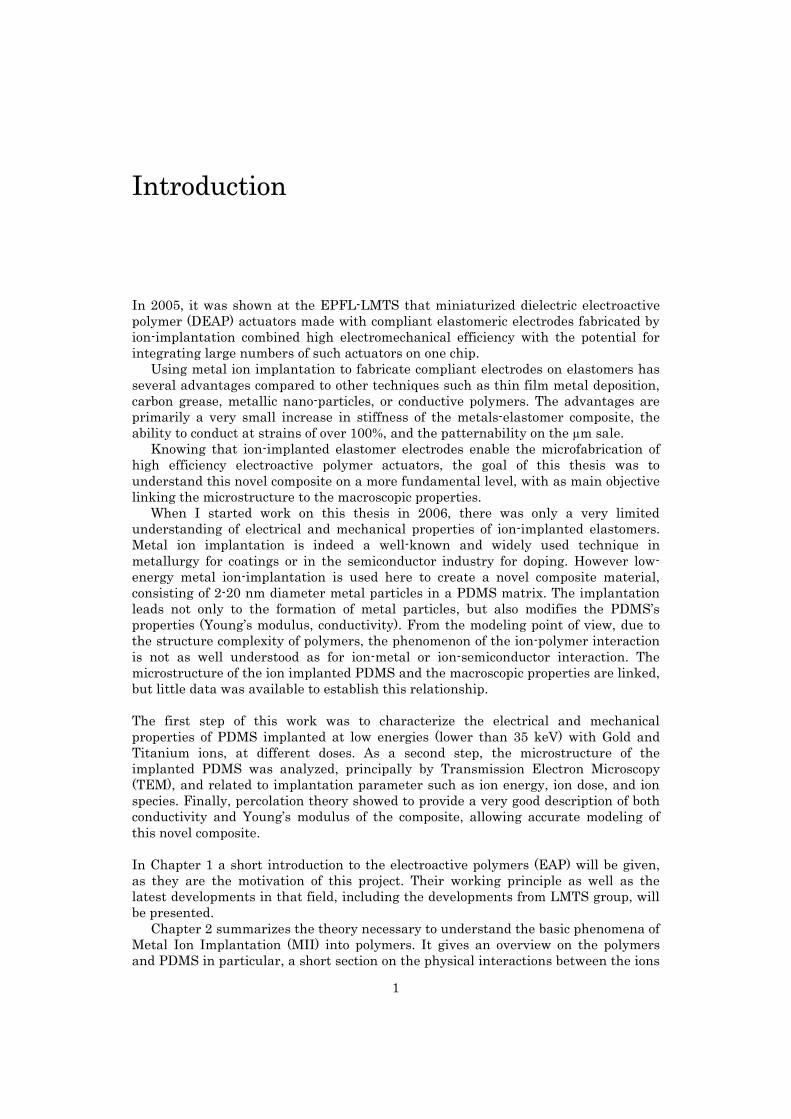
Chapter 6 is devoted to the structural analysis. It starts with X-ray photoelectron spectroscopy, giving some information on the chemical modifications of the implanted PDMS. It is followed by the atomic force measurements which show the surface state of the samples. Then TEM micrographs of all the samples at different energies and doses will be shown (see Figure A). Each part will have a small introduction on the analyzing method used and a short discussion on the results obtained.
In the 7th chapter the experimental setup used for dielectric, optical, mechanical and electrical measurements of the FCVA implanted samples is explained.
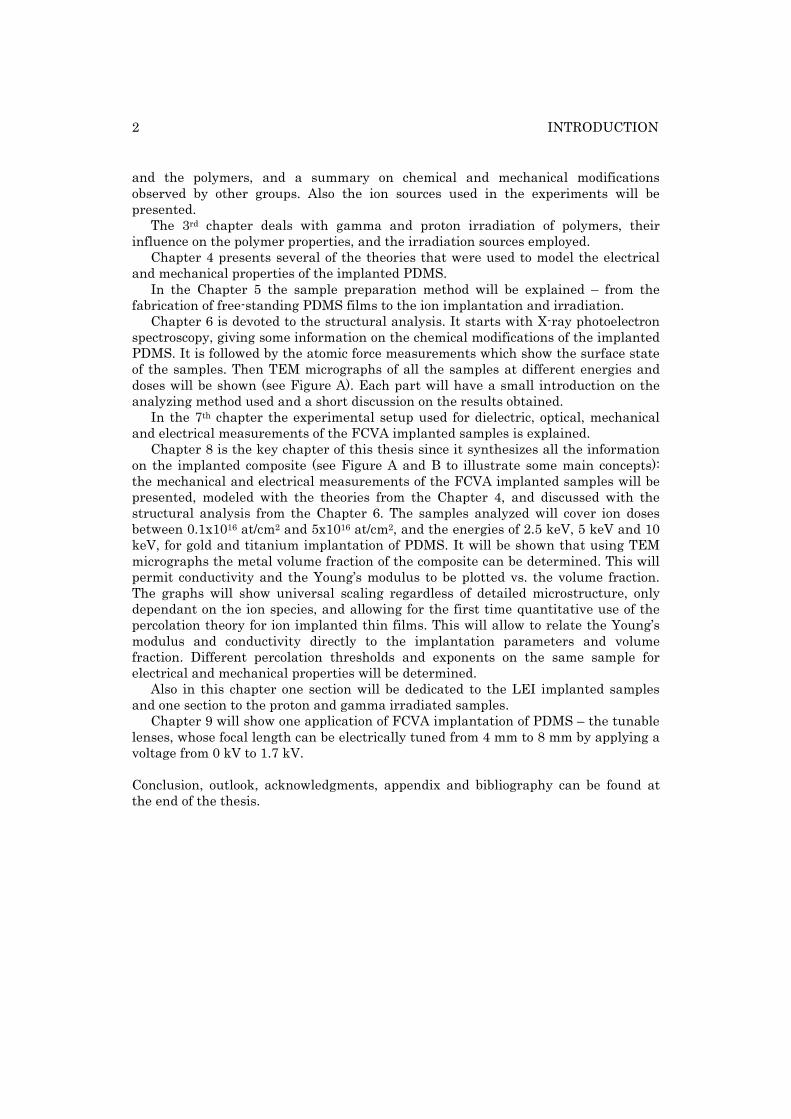
Chapter 8 is the key chapter of this thesis since it synthesizes all the information on the implanted composite (see Figure A and B to illustrate some main concepts): the mechanical and electrical measurements of the FCVA implanted samples will be presented, modeled with the theories from the Chapter 4, and discussed with the structural analysis from the Chapter 6. The samples analyzed will cover ion doses between 0.1x10¹⁶ at/cm2 and 5x10¹⁶ at/cm2, and the energies of 2.5 keV, 5 keV and 10 keV, for gold and titanium implantation of PDMS. It will be shown that using TEM micrographs the metal volume fraction of the composite can be determined. This will permit conductivity and the Young’s modulus to be plotted vs. the volume fraction. The graphs will show universal scaling regardless of detailed microstructure, only dependant on the ion species, and allowing for the first time quantitative use of the percolation theory for ion implanted thin films. This will allow to relate the Young’s modulus and conductivity directly to the implantation parameters and volume fraction. Different percolation thresholds and exponents on the same sample for electrical and mechanical properties will be determined.
Also in this chapter one section will be dedicated to the LEI implanted samples and one section to the proton and gamma irradiated samples.
Chapter 9 will show one application of FCVA implantation of PDMS – the tunable lenses, whose focal length can be electrically tuned from 4 mm to 8 mm by applying a voltage from 0 kV to 1.7 kV. Conclusion, outlook, acknowledgments, appendix and bibliography can be found at the end of the thesis.
3
Figure A. TEM cross-section micrographs for microstructural analysis of the implanted layers. Gold ions penetrate PDMS from the top by up to 30 nm for FCVA, 60 nm for LEI, and form crystalline nanoparticles (Gold clusters) whose size increases with the dose and the energy. Using TEM micrographs the metal volume fraction of the composite was determined, allowing conductivity and the Young’s modulus to be plotted vs. the volume fraction.
Figure B. Surface Resistivity and Young’s modulus of PDMS films after implantation with Ti
at 10 keV by LEI. The initial value of the Young’s modulus is 0.85 MPa.

5
Chapter 1
1. Electroactive Polymers
Electroactive polymers (EAP) are materials that respond mechanically to electrical stimulation and vice versa. Exhibiting large strain when subjected to electrical stimulation their electromechanical response makes them the materials that most closely emulate natural muscles. There are several different mechanisms that determine their response to electrical stimulation, and there are many polymers that are considered EAPs. The attention of engineers and scientists from many different disciplines is attracted by impressive advances in improving the actuation strain capability of EAPs. Some reported EAP-actuated devices include miniature manipulators and grippers, audio speakers, focus control for cameras in cellular telephones or active diaphragms for pumps [1]. Since they can be used to mimic the movements of humans, animals and insects for making biologically inspired mechanisms, these materials are particularly attractive in biomimetics [2].
The electromechanical properties of some EAP materials enable them to serve as both actuators and sensors. They can be used as actuators when they are stimulated to respond with shape or dimensional changes, or they can be used as sensors or even power generators if they exhibit the inverse effect. The polymer base of EAP materials allows many attractive properties and characteristics including low weight, fracture tolerance, and pliability. Further their properties can be tailored to suit a broad range of requirements and they can be configured into almost any shape. Certain polymers can be stimulated by electric, chemical, pneumatic, light, temperature or magnetic activation to change shape or size. However electrical stimulation and the recent improvement in capabilities have made EAPs one of the most attractive among the mechanically responsive materials. The activation mechanisms and the key EAP material types known today are divided into two major groups: field activated and ionic EAPs [3].
Field-activated EAPs are driven by the Coulomb interaction (electrostatic force) produced by the electric field created between the coating electrodes on films or by charge on a local scale. In response to an applied field strain manifests from molecular, microscopic, or macroscopic phenomena. As the dipoles align with the field, an applied electric field can induce a molecular conformation change. Field activated EAPs divide into three groups of material types: Ferroelectric polymers, dielectric or electrostatically stricted polymers (DEAP), and electrostrictive graft elastomers. In DEAP coulomb forces between the electrodes compresses the elastomer, causing it to expand in the plane of the electrodes, Figure 1.1. When the
6 CHAPTER 1. ELECTROACTIVE POLYMERS
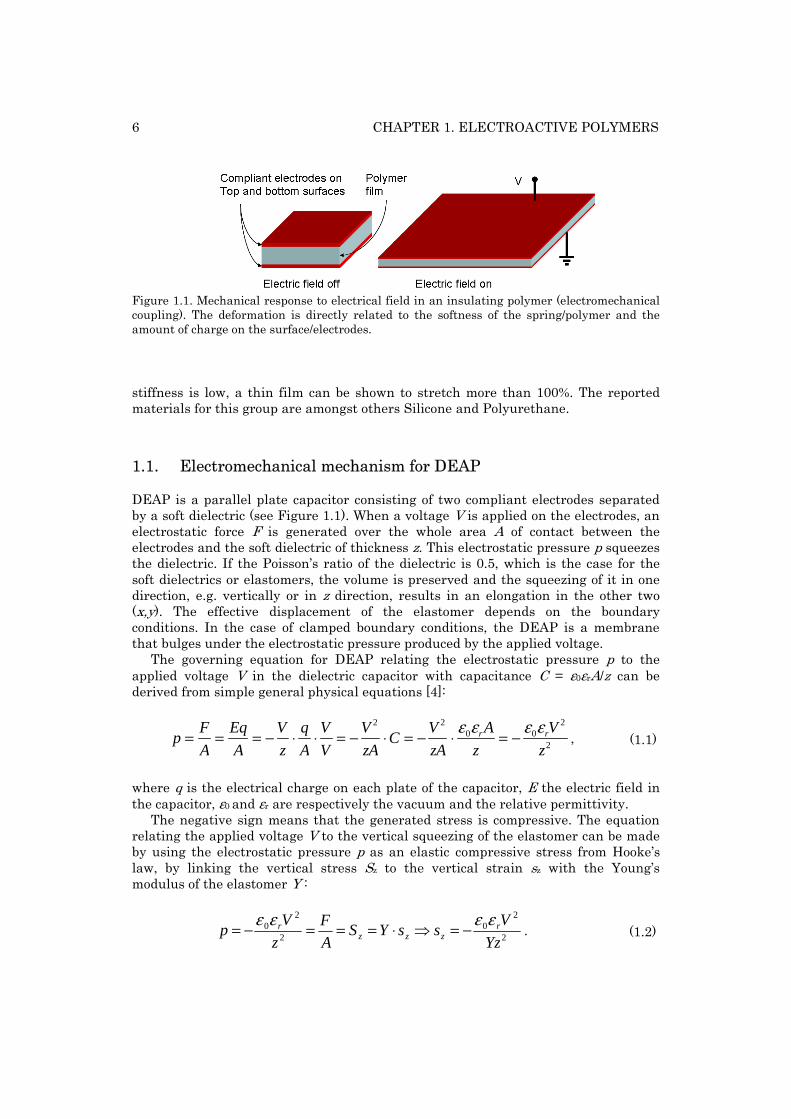
Figure 1.1. Mechanical response to electrical field in an insulating polymer (electromechanical coupling). The deformation is directly related to the softness of the spring/polymer and the amount of charge on the surface/electrodes. stiffness is low, a thin film can be shown to stretch more than 100%. The reported materials for this group are amongst others Silicone and Polyurethane.
1.1. Electromechanical mechanism for DEAP
DEAP is a parallel plate capacitor consisting of two compliant electrodes separated by a soft dielectric (see Figure 1.1). When a voltage V is applied on the electrodes, an electrostatic force F is generated over the whole area A of contact between the electrodes and the soft dielectric of thickness z. This electrostatic pressure p squeezes the dielectric. If the Poisson’s ratio of the dielectric is 0.5, which is the case for the soft dielectrics or elastomers, the volume is preserved and the squeezing of it in one direction, e.g. vertically or in z direction, results in an elongation in the other two (x,y). The effective displacement of the elastomer depends on the boundary conditions. In the case of clamped boundary conditions, the DEAP is a membrane that bulges under the electrostatic pressure produced by the applied voltage.
The governing equation for DEAP relating the electrostatic pressure p to the applied voltage V in the dielectric capacitor with capacitance C = ε0εrA/z can be derived from simple general physical equations [4]:
p =F
A=
Eq
A= −
V
z⋅q
A⋅V
V= −
V 2
zA⋅C = −
V 2
zA⋅ε0εrA
z= −
ε0εrV2
z2 , (1.1)
where q is the electrical charge on each plate of the capacitor, E the electric field in the capacitor, ε0 and εr are respectively the vacuum and the relative permittivity.
The negative sign means that the generated stress is compressive. The equation relating the applied voltage V to the vertical squeezing of the elastomer can be made by using the electrostatic pressure p as an elastic compressive stress from Hooke’s law, by linking the vertical stress Sz to the vertical strain sz with the Young’s modulus of the elastomer Y :
2
20
2
20
Yz
VssYS
A
F
z
Vp r
zzzr εεεε −=⇒⋅===−= .
(1.2)
1.2. PERFORMANCE OF FIELD-ACTIVATED ELECTROACTIVE POLYMERS
7
Two remarks must been said about the dynamics of Eq. (1.2). Eq. (1.2) is only valid statically, i.e. in the moment for which z, Y and εr are defined and considered as constant. However by applying a voltage all of them change.
First the elastomer’s thickness will change due to the electrostatic pressure. For instance a 4% increase of the elastomer’s area corresponds to about 4% decrease of thickness. This thickness compression will in its turn increase the electrostatic force, which will again increase the generated stress, etc. Added to that, the stretched electrodes of the expanded area increase the electrostatic pressure for the second time. After a certain time, at equilibrium, the electrostatic force will equalize the “restoring force” of the elastomer by Hooke’s law of elasticity, and this dynamical loop of effects will come to the rest. This solution is only stable up to the “pull-in” point, exactly as for air-gap parallel plate electrostatic actuators.
Second the stress-strain behavior of elastomers is hyperelastic and non-linear [6], i.e. the Young’s modulus depends on the stress or the voltage applied, especially for large strains bigger than 20%. To be more precise hyperelastic non-linear models have been developed to describe large deformations and some of them even include the time-dependence of the deformation response due to applied stress.
1.2. Performance of field-activated Electroactive Polymers
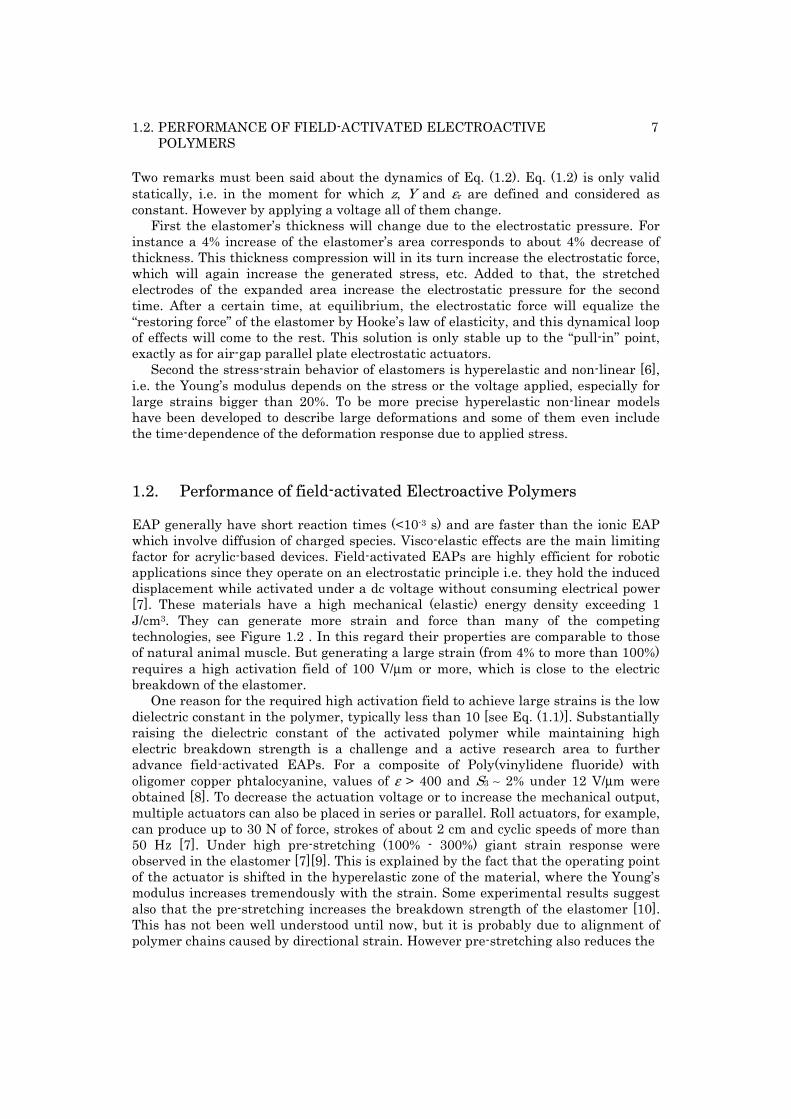
EAP generally have short reaction times (<10-3 s) and are faster than the ionic EAP which involve diffusion of charged species. Visco-elastic effects are the main limiting factor for acrylic-based devices. Field-activated EAPs are highly efficient for robotic applications since they operate on an electrostatic principle i.e. they hold the induced displacement while activated under a dc voltage without consuming electrical power [7]. These materials have a high mechanical (elastic) energy density exceeding 1 J/cm3. They can generate more strain and force than many of the competing technologies, see Figure 1.2 . In this regard their properties are comparable to those of natural animal muscle. But generating a large strain (from 4% to more than 100%) requires a high activation field of 100 V/μm or more, which is close to the electric breakdown of the elastomer.
One reason for the required high activation field to achieve large strains is the low dielectric constant in the polymer, typically less than 10 [see Eq. (1.1)]. Substantially raising the dielectric constant of the activated polymer while maintaining high electric breakdown strength is a challenge and a active research area to further advance field-activated EAPs. For a composite of Poly(vinylidene fluoride) with oligomer copper phtalocyanine, values of ε > 400 and S3 ∼ 2% under 12 V/μm were obtained [8]. To decrease the actuation voltage or to increase the mechanical output, multiple actuators can also be placed in series or parallel. Roll actuators, for example, can produce up to 30 N of force, strokes of about 2 cm and cyclic speeds of more than 50 Hz [7]. Under high pre-stretching (100% - 300%) giant strain response were observed in the elastomer [7][9]. This is explained by the fact that the operating point of the actuator is shifted in the hyperelastic zone of the material, where the Young’s modulus increases tremendously with the strain. Some experimental results suggest also that the pre-stretching increases the breakdown strength of the elastomer [10]. This has not been well understood until now, but it is probably due to alignment of polymer chains caused by directional strain. However pre-stretching also reduces the
8 CHAPTER 1. ELECTROACTIVE POLYMERS
Figure 1.2. Strain as a function of the actuation pressure [7]. Strain refers to the amount of displacement per unit length the device can create, and the actuation pressure/density is a measure of the force they produce. life-time of the material, since the internal defects propagate much easier due to the strain energy stored in the elastomer.
1.3. Field-activated DEAP fabricated in “Microsystems for Space Technologies Laboratory” (LMTS-EPFL)
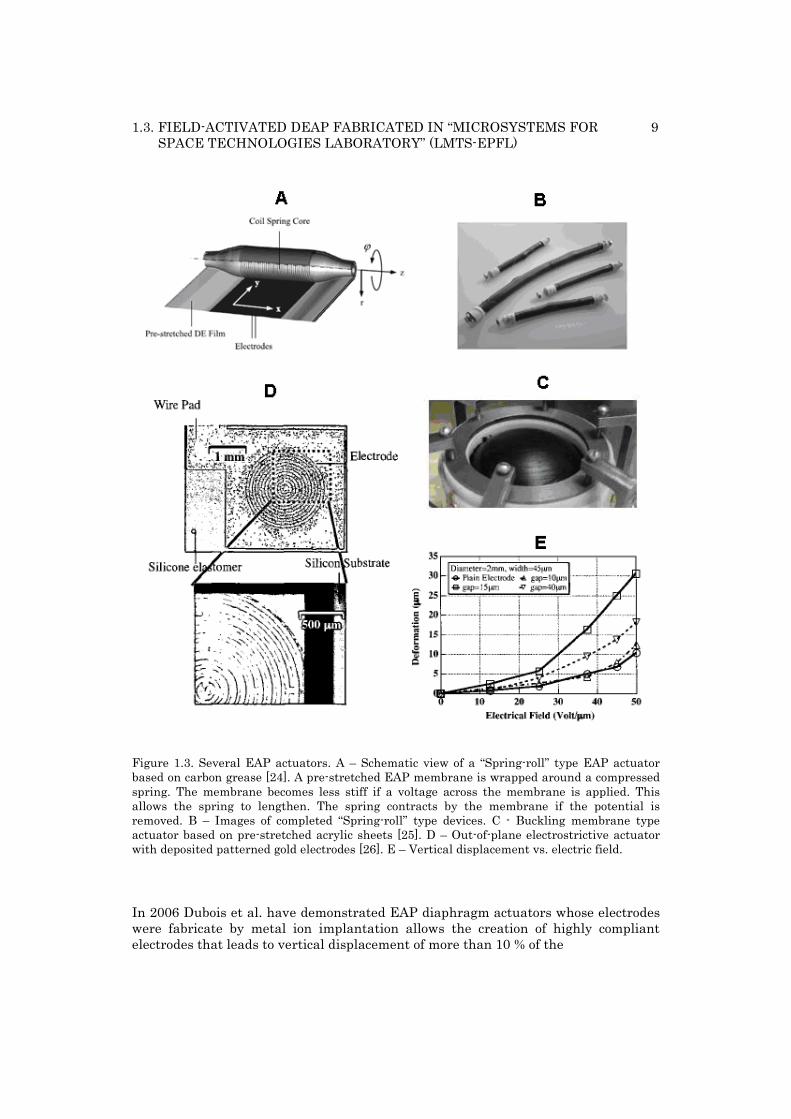
Compliant electrodes are one of the key factors to obtain large displacements and high efficiency with DEAs. Conducting grease or powder (metal or graphite) that is screen printed, painted or airbrushed onto the elastomer are the most used methods to fabricate macrosize DEAs [12][13]. But these techniques have at least two drawbacks. First they work very well for devices whose area is greater than 1 cm2, but if patterning of micro-electrodes is desired they’re not well suited. And second, the grease or carbon powder based electrodes are not optically transparent. For some examples see Figure 1.3.
If one wants to create many independently addressable micro-actuators, by patterning the electrodes on the micro-scale, these standard electrode fabrication methods cannot be applicable, and thus the miniaturized DEAPs cannot be made using them. Also metal evaporation of thin films or serpentine electrodes, one of the standard clean room electrode creation methods, tends to greatly increase the actuator’s rigidity, which negatively affects its performance. All these standard fabrication modes trying to scale down EAPs showed to have low efficiency due to stiffened membranes [14].
1.3. FIELD-ACTIVATED DEAP FABRICATED IN “MICROSYSTEMS FOR SPACE TECHNOLOGIES LABORATORY” (LMTS-EPFL)
9
Figure 1.3. Several EAP actuators. A – Schematic view of a “Spring-roll” type EAP actuator based on carbon grease [24]. A pre-stretched EAP membrane is wrapped around a compressed spring. The membrane becomes less stiff if a voltage across the membrane is applied. This allows the spring to lengthen. The spring contracts by the membrane if the potential is removed. B – Images of completed “Spring-roll” type devices. C - Buckling membrane type actuator based on pre-stretched acrylic sheets [25]. D – Out-of-plane electrostrictive actuator with deposited patterned gold electrodes [26]. E – Vertical displacement vs. electric field. In 2006 Dubois et al. have demonstrated EAP diaphragm actuators whose electrodes were fabricate by metal ion implantation allows the creation of highly compliant electrodes that leads to vertical displacement of more than 10 % of the
10 CHAPTER 1. ELECTROACTIVE POLYMERS
membrane’s length [15]. Exhibiting the same efficiency as macro-scale devices made with standard carbon-based electrode these devices additionally allowed:
micron-scale patterning of electrodes, allowing a very large number of devices to be individually addressed on a wafer,
optically transparent electrodes with a possibility of using micro-EAPs for arrays of tunable optical elements on a chip, and
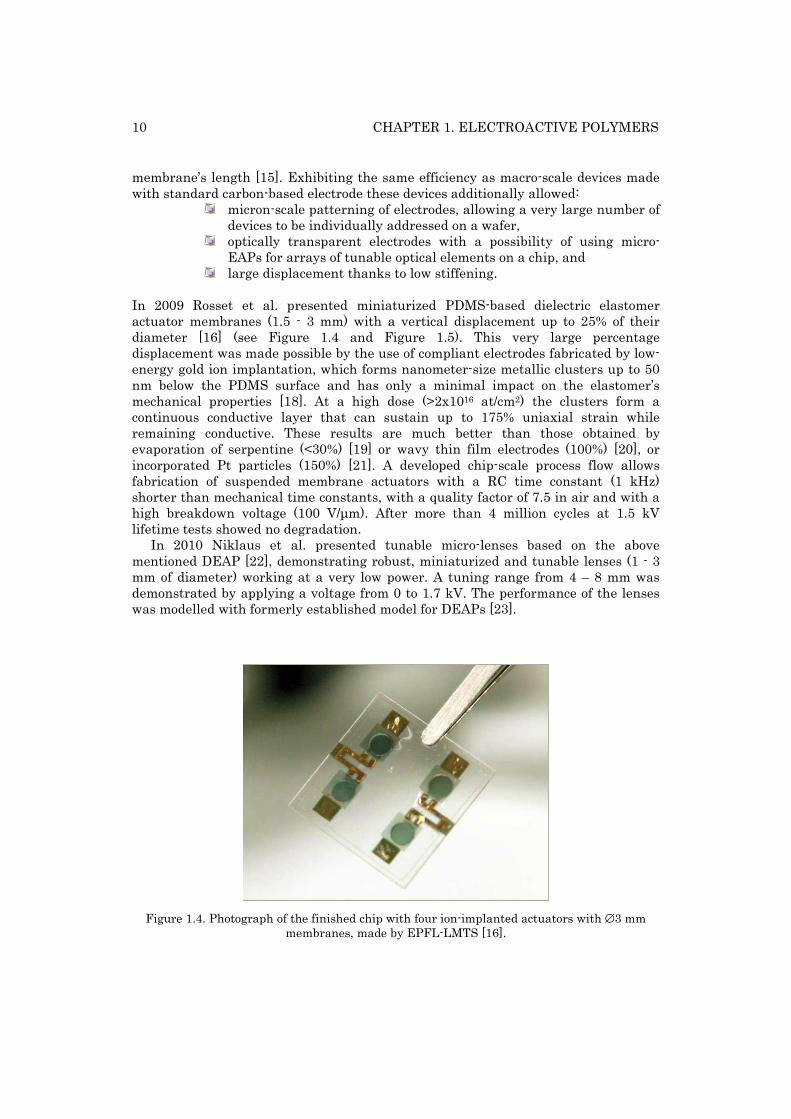
large displacement thanks to low stiffening. In 2009 Rosset et al. presented miniaturized PDMS-based dielectric elastomer actuator membranes (1.5 - 3 mm) with a vertical displacement up to 25% of their diameter [16] (see Figure 1.4 and Figure 1.5). This very large percentage displacement was made possible by the use of compliant electrodes fabricated by low-energy gold ion implantation, which forms nanometer-size metallic clusters up to 50 nm below the PDMS surface and has only a minimal impact on the elastomer’s mechanical properties [18]. At a high dose (>2x10¹⁶ at/cm2) the clusters form a continuous conductive layer that can sustain up to 175% uniaxial strain while remaining conductive. These results are much better than those obtained by evaporation of serpentine (<30%) [19] or wavy thin film electrodes (100%) [20], or incorporated Pt particles (150%) [21]. A developed chip-scale process flow allows fabrication of suspended membrane actuators with a RC time constant (1 kHz) shorter than mechanical time constants, with a quality factor of 7.5 in air and with a high breakdown voltage (100 V/μm). After more than 4 million cycles at 1.5 kV lifetime tests showed no degradation.
In 2010 Niklaus et al. presented tunable micro-lenses based on the above mentioned DEAP [22], demonstrating robust, miniaturized and tunable lenses (1 - 3 mm of diameter) working at a very low power. A tuning range from 4 – 8 mm was demonstrated by applying a voltage from 0 to 1.7 kV. The performance of the lenses was modelled with formerly established model for DEAPs [23].
Figure 1.4. Photograph of the finished chip with four ion-implanted actuators with ∅3 mm membranes, made by EPFL-LMTS [16].
1.3. FIELD-ACTIVATED DEAP FABRICATED IN “MICROSYSTEMS FOR SPACE TECHNOLOGIES LABORATORY” (LMTS-EPFL)
11
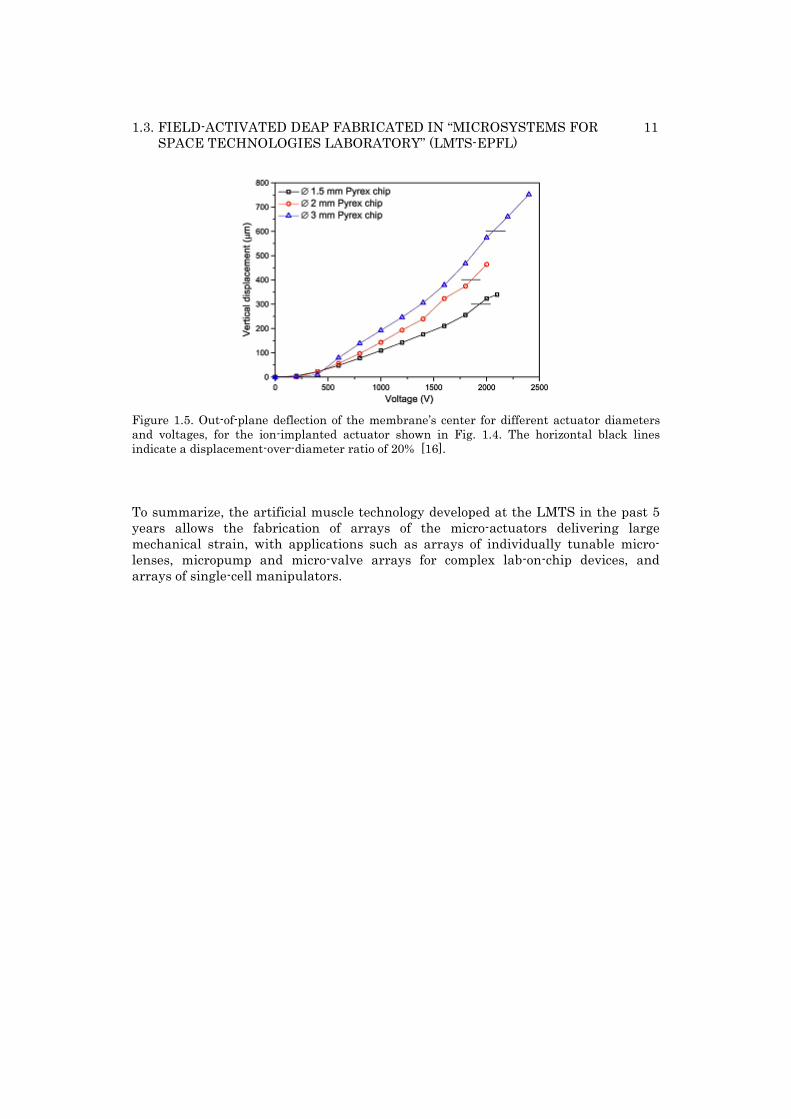
Figure 1.5. Out-of-plane deflection of the membrane’s center for different actuator diameters and voltages, for the ion-implanted actuator shown in Fig. 1.4. The horizontal black lines indicate a displacement-over-diameter ratio of 20% [16].
To summarize, the artificial muscle technology developed at the LMTS in the past 5 years allows the fabrication of arrays of the micro-actuators delivering large mechanical strain, with applications such as arrays of individually tunable micro-lenses, micropump and micro-valve arrays for complex lab-on-chip devices, and arrays of single-cell manipulators.


13
Chapter 2
2. Metal Implantation in Polymers
Polymers are more sensitive to radiation than ceramics and metals. After illumination with visible and UV irradiation, and following exposure to γ-rays and energetic charged particles such as electrons and ions, chemical and structural degradation was observed [27]. It was realized that polymer irradiation is not necessarily detrimental but that it might even be beneficial for some technological applications [28]. This increased the interest of researches in this field, and after 1950s quite a number radiochemists have devoted themselves to the examination of radiochemical processes in polymers after γ-ray and electron irradiation [29][30].
At that time, there were few systematic studies on ion-irradiation effects in polymers since ion accelerators were exclusively the domain of nuclear physicists. But when modern electronics emerged, this changed. Doping of semiconductors masked by polymers (photoresist) by ion implantation became common tool to obtain finely structured devices and the need for understanding the involved physical interactions (the chemical and the structural changes of polymers upon energetic ion impact) grew.
A renewed interest in polymers in the field of polymer electronics can be observed making it possible to produce flexible large area panels for monitoring or sensing. Due to its simplicity and low cost of production, polymer electronics is one of the most promising alternative fields as compared to the highly sophisticated and expensive semiconductor micro and nano-electronics. Ion irradiation of polymers presents a rapidly expanding field to fabricated compliant electrodes for wearable or foldable, bendable and stretchable electronics.
The basic physical and chemical mechanisms of ion-polymer interactions have been established and some general understanding of the processes occurring has been reached [31]-[36]. However, the knowledge of closer details possesses still some large gaps. In this chapter some basic knowledge about ion-solid interactions, polymers (PDMS in particular), ion sources, and previous research in this field will be summarized. This chapter focuses on the effect of implanted metal ions modifying polymers; in Chapter 3 the effect of ionizing and non-ionizing radiation on polymers will be briefly discussed.
14 CHAPTER 2. METAL IMPLANTATION IN POLYMERS
2.1. Polymers
A polymer is a macromolecule composed of repeating structural units (monomers) typically connected by covalent chemical bonds. If a polymers consists of one type of monomers it is called homopolymers, else a copolymer. High binding energies (146 to 628 kJ/mole), short bond lengths (0.11 to 0.16 nm) and relatively constant angles between successive bonds characterize the covalent bonds involved [27]. Generally, polymer chains are very flexible, and therefore are coiled up with some free volume in between. The simplest chains are of linear skeletal structure that may be presented by a chain with two ends. If polymers are branched, that means that they have side chains, or branches, of significant length which are bonded to the main chain at branch points (junctions), and that they are characterized in terms of the number and size of the branches. A 3D structures in which each chain is connected to all others by a sequence of junction points and other chains are called network polymers or are said to be cross-linked. Usually the polymers are classified into three groups: thermosets, thermoplastics, and elastomers. Thermosets are rigid network polymers with a high degree of cross-linking between the chains. In Thermoplastics, linear polymers are weakly branched with negligible entanglement. They can be crystalline or amorphous. The cross-linked rubbery polymers that can be stretched easily to high extensions and which rapidly recover their original dimensions when the applied stress is released are called Elastomers. It is this last group of polymers that Polydimethylsiloxane (PDMS) belongs to and on which I will work.
2.2. PDMS
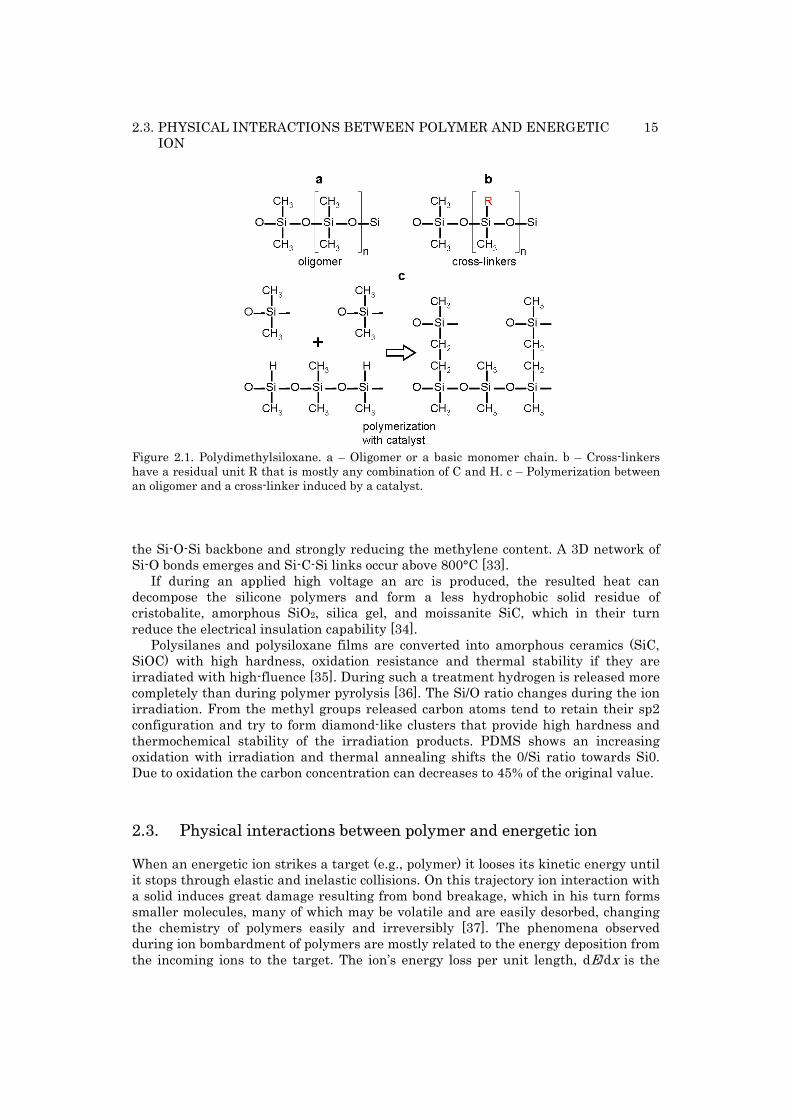
Polysiloxanes have an oxygen-silicon bridge in their backbone structure and the side groups are as usual either aromatic or aliphatic groups. In case of PDMS the side groups are two methyl molecules ([CH3]2-Si-O) (see Figure 2.1). One must not forget that the formulae for polysilanes and polysilicones are only simplifications of the actual polymer structures, which usually involves the presence of branchings and rings. The industrial silicone rubber are almost always compounded, i.e., combined with fillers, catalysts, and additives to improve its performance.
Polysiloxanes have a good chemical resistance against diluted acids and oils, a poor one against concentrated acids, alkalines, and ketones, and a very bad chemical resistance against organic solvents such as alcohol of aromatic carbon hydroxides. However, in an acidic environment aging leads to a decrease in surface crosslinking density and some increase in chain scissioning [31]. Generally, when exposed to electrical and environmental stresses polysiloxanes keep their hydrophobicity and electrical insulation properties high. But aging at ambient temperature under UV irradiation leads to a decrease of the methylene content, which decreases the hydrophobicity [32]. Above 400° C decomposition sets in, destroying to a lesser extent
2.3. PHYSICAL INTERACTIONS BETWEEN POLYMER AND ENERGETIC ION
15
Figure 2.1. Polydimethylsiloxane. a – Oligomer or a basic monomer chain. b – Cross-linkers have a residual unit R that is mostly any combination of C and H. c – Polymerization between an oligomer and a cross-linker induced by a catalyst. the Si-O-Si backbone and strongly reducing the methylene content. A 3D network of Si-O bonds emerges and Si-C-Si links occur above 800°C [33].
If during an applied high voltage an arc is produced, the resulted heat can decompose the silicone polymers and form a less hydrophobic solid residue of cristobalite, amorphous SiO2, silica gel, and moissanite SiC, which in their turn reduce the electrical insulation capability [34].
Polysilanes and polysiloxane films are converted into amorphous ceramics (SiC, SiOC) with high hardness, oxidation resistance and thermal stability if they are irradiated with high-fluence [35]. During such a treatment hydrogen is released more completely than during polymer pyrolysis [36]. The Si/O ratio changes during the ion irradiation. From the methyl groups released carbon atoms tend to retain their sp2 configuration and try to form diamond-like clusters that provide high hardness and thermochemical stability of the irradiation products. PDMS shows an increasing oxidation with irradiation and thermal annealing shifts the 0/Si ratio towards Si0. Due to oxidation the carbon concentration can decreases to 45% of the original value.
2.3. Physical interactions between polymer and energetic ion
When an energetic ion strikes a target (e.g., polymer) it looses its kinetic energy until it stops through elastic and inelastic collisions. On this trajectory ion interaction with a solid induces great damage resulting from bond breakage, which in his turn forms smaller molecules, many of which may be volatile and are easily desorbed, changing the chemistry of polymers easily and irreversibly [37]. The phenomena observed during ion bombardment of polymers are mostly related to the energy deposition from the incoming ions to the target. The ion’s energy loss per unit length, dE/dx is the
16 CHAPTER 2. METAL IMPLANTATION IN POLYMERS
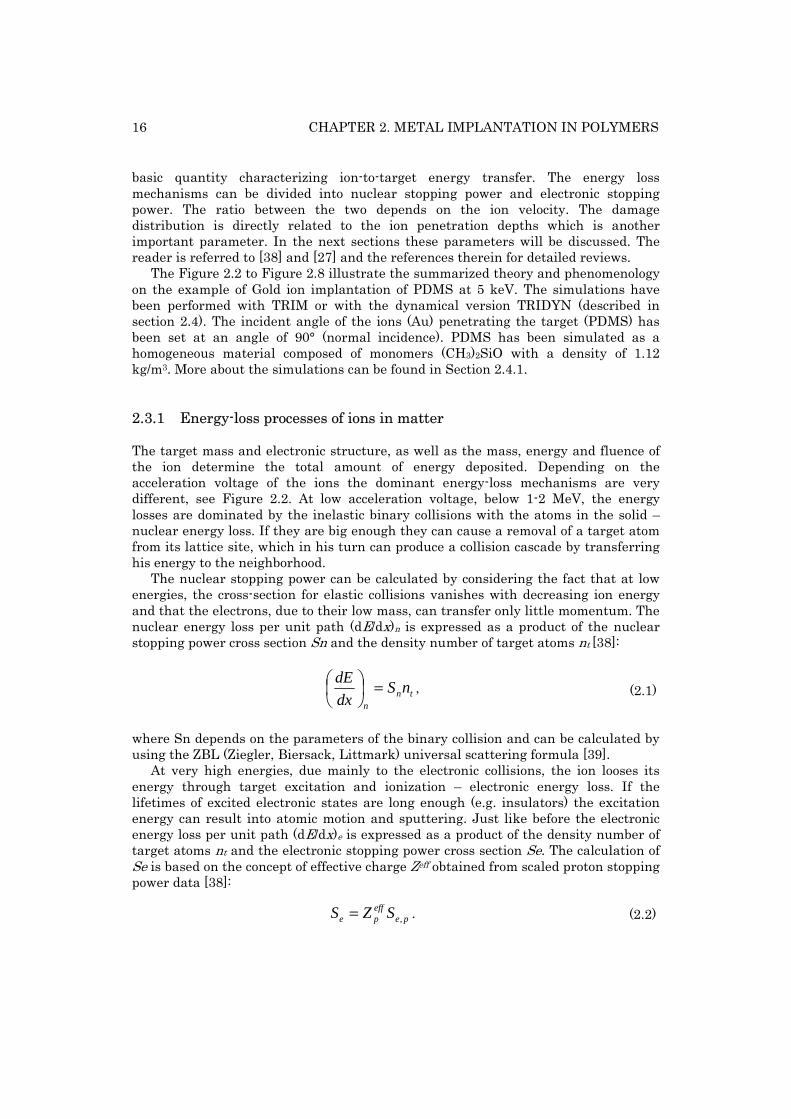
basic quantity characterizing ion-to-target energy transfer. The energy loss mechanisms can be divided into nuclear stopping power and electronic stopping power. The ratio between the two depends on the ion velocity. The damage distribution is directly related to the ion penetration depths which is another important parameter. In the next sections these parameters will be discussed. The reader is referred to [38] and [27] and the references therein for detailed reviews.
The Figure 2.2 to Figure 2.8 illustrate the summarized theory and phenomenology on the example of Gold ion implantation of PDMS at 5 keV. The simulations have been performed with TRIM or with the dynamical version TRIDYN (described in section 2.4). The incident angle of the ions (Au) penetrating the target (PDMS) has been set at an angle of 90° (normal incidence). PDMS has been simulated as a homogeneous material composed of monomers (CH3)2SiO with a density of 1.12 kg/m3. More about the simulations can be found in Section 2.4.1.
2.3.1 Energy-loss processes of ions in matter
The target mass and electronic structure, as well as the mass, energy and fluence of the ion determine the total amount of energy deposited. Depending on the acceleration voltage of the ions the dominant energy-loss mechanisms are very different, see Figure 2.2. At low acceleration voltage, below 1-2 MeV, the energy losses are dominated by the inelastic binary collisions with the atoms in the solid – nuclear energy loss. If they are big enough they can cause a removal of a target atom from its lattice site, which in his turn can produce a collision cascade by transferring his energy to the neighborhood.
The nuclear stopping power can be calculated by considering the fact that at low energies, the cross-section for elastic collisions vanishes with decreasing ion energy and that the electrons, due to their low mass, can transfer only little momentum. The nuclear energy loss per unit path (dE/dx)n is expressed as a product of the nuclear stopping power cross section Sn and the density number of target atoms nt [38]:
tnn
nSdx
dE =⎟⎠⎞
⎜⎝⎛ ,
(2.1)
where Sn depends on the parameters of the binary collision and can be calculated by using the ZBL (Ziegler, Biersack, Littmark) universal scattering formula [39].
At very high energies, due mainly to the electronic collisions, the ion looses its energy through target excitation and ionization – electronic energy loss. If the lifetimes of excited electronic states are long enough (e.g. insulators) the excitation energy can result into atomic motion and sputtering. Just like before the electronic energy loss per unit path (dE/dx)e is expressed as a product of the density number of target atoms nt and the electronic stopping power cross section Se. The calculation of Se is based on the concept of effective charge Zeff obtained from scaled proton stopping power data [38]:
peeffpe SZS ,= .
(2.2)
2.3. PHYSICAL INTERACTIONS BETWEEN POLYMER AND ENERGETIC ION
17
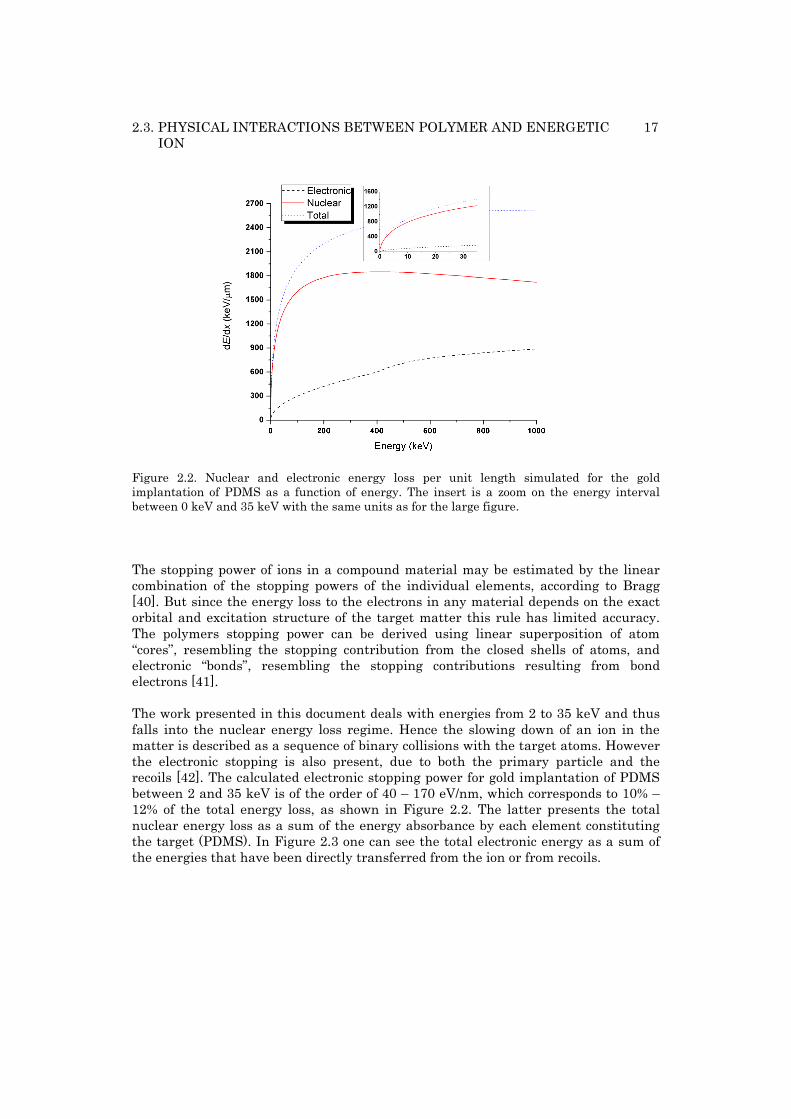
Figure 2.2. Nuclear and electronic energy loss per unit length simulated for the gold implantation of PDMS as a function of energy. The insert is a zoom on the energy interval between 0 keV and 35 keV with the same units as for the large figure. The stopping power of ions in a compound material may be estimated by the linear combination of the stopping powers of the individual elements, according to Bragg [40]. But since the energy loss to the electrons in any material depends on the exact orbital and excitation structure of the target matter this rule has limited accuracy. The polymers stopping power can be derived using linear superposition of atom “cores”, resembling the stopping contribution from the closed shells of atoms, and electronic “bonds”, resembling the stopping contributions resulting from bond electrons [41]. The work presented in this document deals with energies from 2 to 35 keV and thus falls into the nuclear energy loss regime. Hence the slowing down of an ion in the matter is described as a sequence of binary collisions with the target atoms. However the electronic stopping is also present, due to both the primary particle and the recoils [42]. The calculated electronic stopping power for gold implantation of PDMS between 2 and 35 keV is of the order of 40 – 170 eV/nm, which corresponds to 10% – 12% of the total energy loss, as shown in Figure 2.2. The latter presents the total nuclear energy loss as a sum of the energy absorbance by each element constituting the target (PDMS). In Figure 2.3 one can see the total electronic energy as a sum of the energies that have been directly transferred from the ion or from recoils.
18 CHAPTER 2. METAL IMPLANTATION IN POLYMERS
Figure 2.3. Nuclear and electronic energy loss per Angstrom length for one gold ion penetrating PDMS with an initial energy of 5 keV as simulated with TRIM. (Left) The direct energy loss by the ion to the various target atoms. (Right) Energy given up to the target electrons either directly from the ion or from the energy transferred from recoiling.
2.3.2 Range and damage distributions
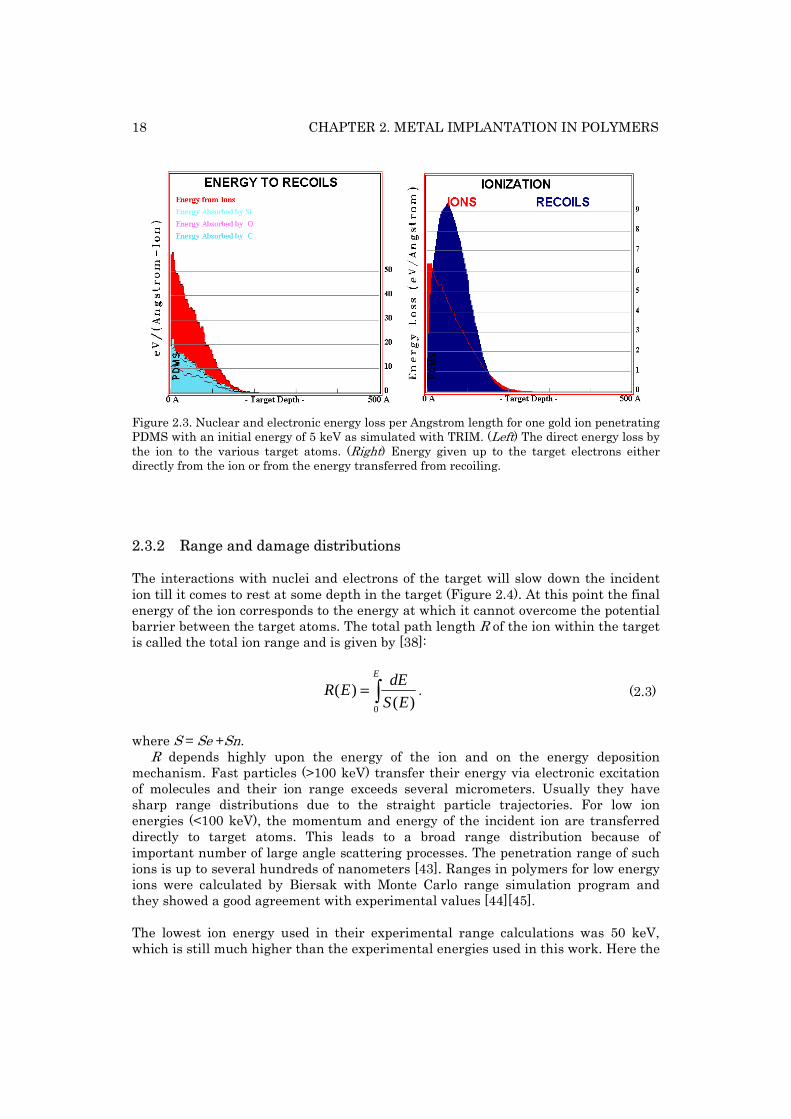
The interactions with nuclei and electrons of the target will slow down the incident ion till it comes to rest at some depth in the target (Figure 2.4). At this point the final energy of the ion corresponds to the energy at which it cannot overcome the potential barrier between the target atoms. The total path length R of the ion within the target is called the total ion range and is given by [38]:
∫=E
ES
dEER
0 )()( .
(2.3)
where S = Se +Sn.
R depends highly upon the energy of the ion and on the energy deposition mechanism. Fast particles (>100 keV) transfer their energy via electronic excitation of molecules and their ion range exceeds several micrometers. Usually they have sharp range distributions due to the straight particle trajectories. For low ion energies (<100 keV), the momentum and energy of the incident ion are transferred directly to target atoms. This leads to a broad range distribution because of important number of large angle scattering processes. The penetration range of such ions is up to several hundreds of nanometers [43]. Ranges in polymers for low energy ions were calculated by Biersak with Monte Carlo range simulation program and they showed a good agreement with experimental values [44][45].
The lowest ion energy used in their experimental range calculations was 50 keV, which is still much higher than the experimental energies used in this work. Here the
2.3. PHYSICAL INTERACTIONS BETWEEN POLYMER AND ENERGETIC ION
19
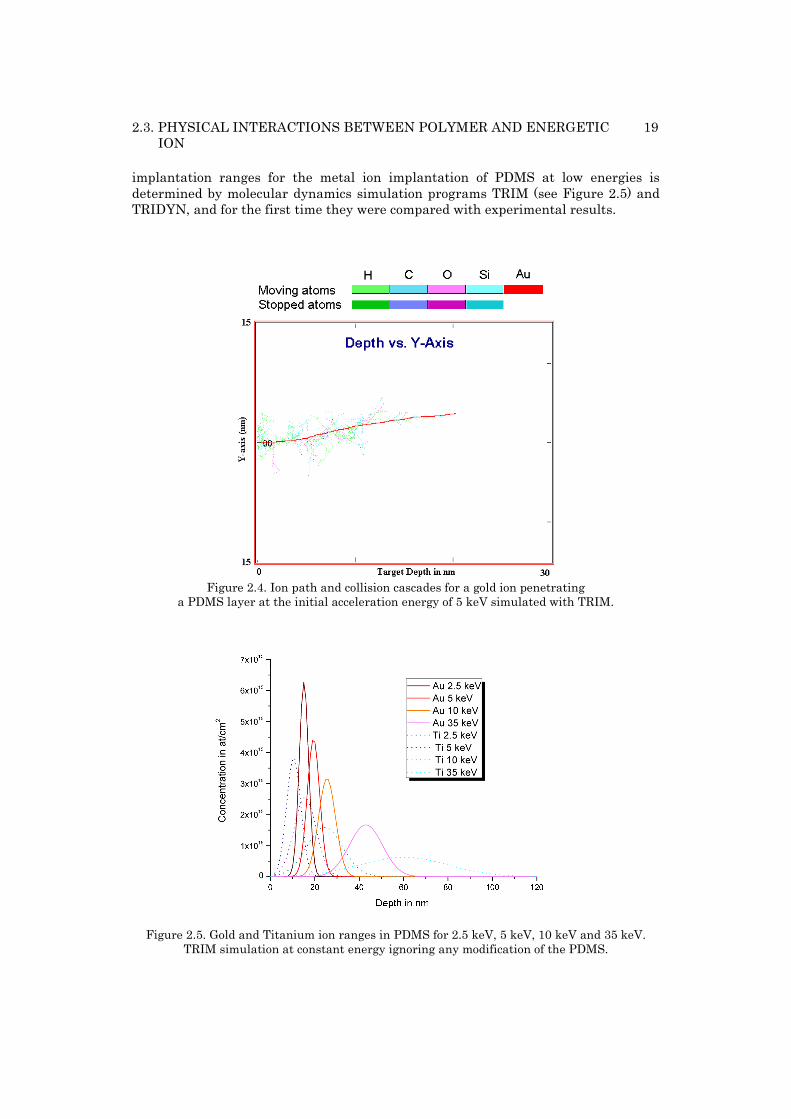
implantation ranges for the metal ion implantation of PDMS at low energies is determined by molecular dynamics simulation programs TRIM (see Figure 2.5) and TRIDYN, and for the first time they were compared with experimental results.
Figure 2.4. Ion path and collision cascades for a gold ion penetrating
a PDMS layer at the initial acceleration energy of 5 keV simulated with TRIM.
Figure 2.5. Gold and Titanium ion ranges in PDMS for 2.5 keV, 5 keV, 10 keV and 35 keV.
TRIM simulation at constant energy ignoring any modification of the PDMS.
20 CHAPTER 2. METAL IMPLANTATION IN POLYMERS
2.4. Simulation
The advantage of direct simulations of the particle flight paths is the feasibility of handling interfaces, layered structures or target crystallinity and in obtaining 3D range, damage and ionization system distributions as well as transmission and reflection data. The particle trajectory in the sample can be calculated exactly once the initial particle conditions are given. This requires however a large amount of calculations and much computing time. The computing effort can be reduced considerably and without loss of precision, if one introduces probability distributions for the scattering parameters in each collision by selecting randomly any numerical value for the parameter under consideration, according to its given probability distribution. Mathematically this is called “Monte-Carlo technique”.
The “MARLOWE” code and the “TRIM” (= transport and range of ions in matter) code of Biersack are the two most important representatives of these techniques for range profile simulation [46][43] and they were shown to be very reliable with experiments [47]. In the past two decades sufficient amounts of data have been obtained to allow comparison between experiment and simulation. A large number of these results refer to photoresists (AZ111, AZ1350) due to the technological implications [48] and to PMMA [49]. It appeared an existence of a threshold energy below which the range profiles for light ions implanted into polymers follow the theoretical prediction and above which redistribution sets in.
The TRIM version has made some additional basic assumptions in order to reduce the necessary computing time: a) only binary large-angle collisions are considered, between which particles undergo; b) small-angle deflections are treated analytically as “multiple scattering”; c) the hyperbolic particle trajectories are simplified by circular segments in the Monte Carlo system (Biersack’s Magic formula); d) only amorphous materials are considered (i.e., the collision parameters of subsequent collisions are treated as uncorrelated to each other; e) the changes in the chemical structure of the target are neglected. The latter assumption is probably the most important one since it is well known (and it will be presented in the following sections, see 2.4.) that MII has a huge impact on the chemical modifications of the polymer in a form of cross-linking, chain-scissions, sputtering of the volatile and non-volatile components, which have a direct influence on the hardness and specific density of the target.
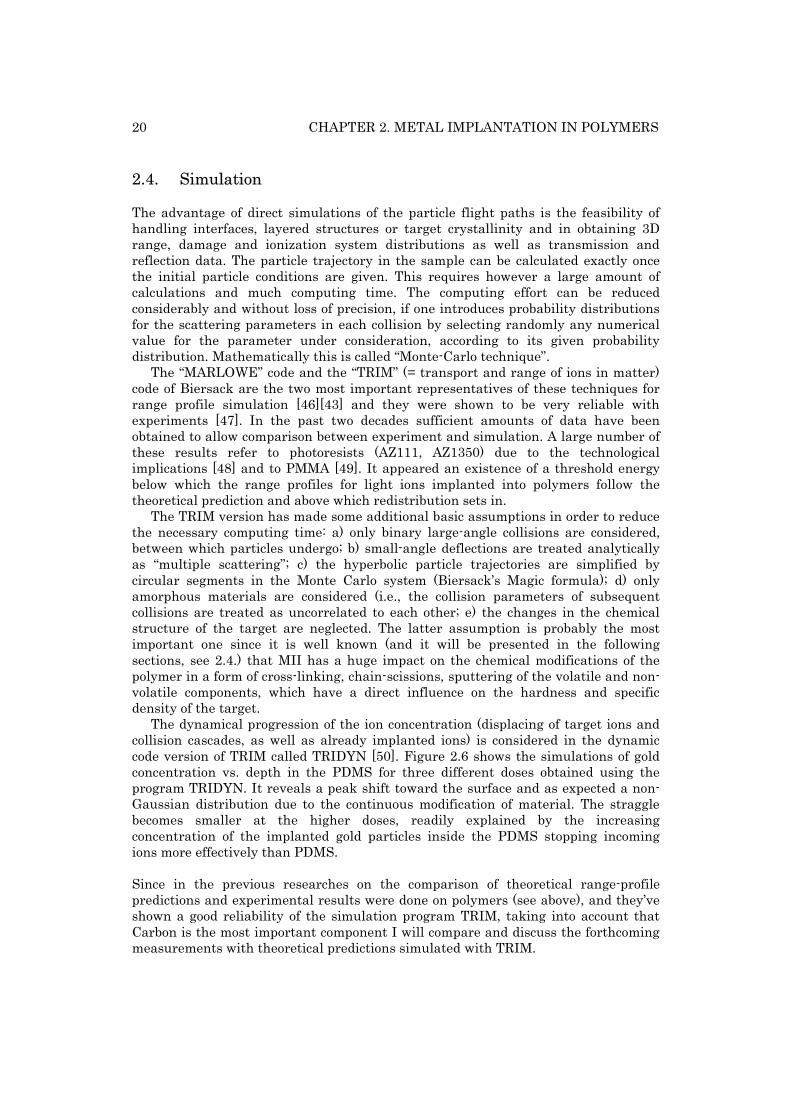
The dynamical progression of the ion concentration (displacing of target ions and collision cascades, as well as already implanted ions) is considered in the dynamic code version of TRIM called TRIDYN [50]. Figure 2.6 shows the simulations of gold concentration vs. depth in the PDMS for three different doses obtained using the program TRIDYN. It reveals a peak shift toward the surface and as expected a non-Gaussian distribution due to the continuous modification of material. The straggle becomes smaller at the higher doses, readily explained by the increasing concentration of the implanted gold particles inside the PDMS stopping incoming ions more effectively than PDMS.
Since in the previous researches on the comparison of theoretical range-profile predictions and experimental results were done on polymers (see above), and they’ve shown a good reliability of the simulation program TRIM, taking into account that Carbon is the most important component I will compare and discuss the forthcoming measurements with theoretical predictions simulated with TRIM.
2.4. SIMULATION 21
Figure 2.6. Simulated (TRYDIN) depth profiles of Au in PDMS for three doses of Au at 5keV.
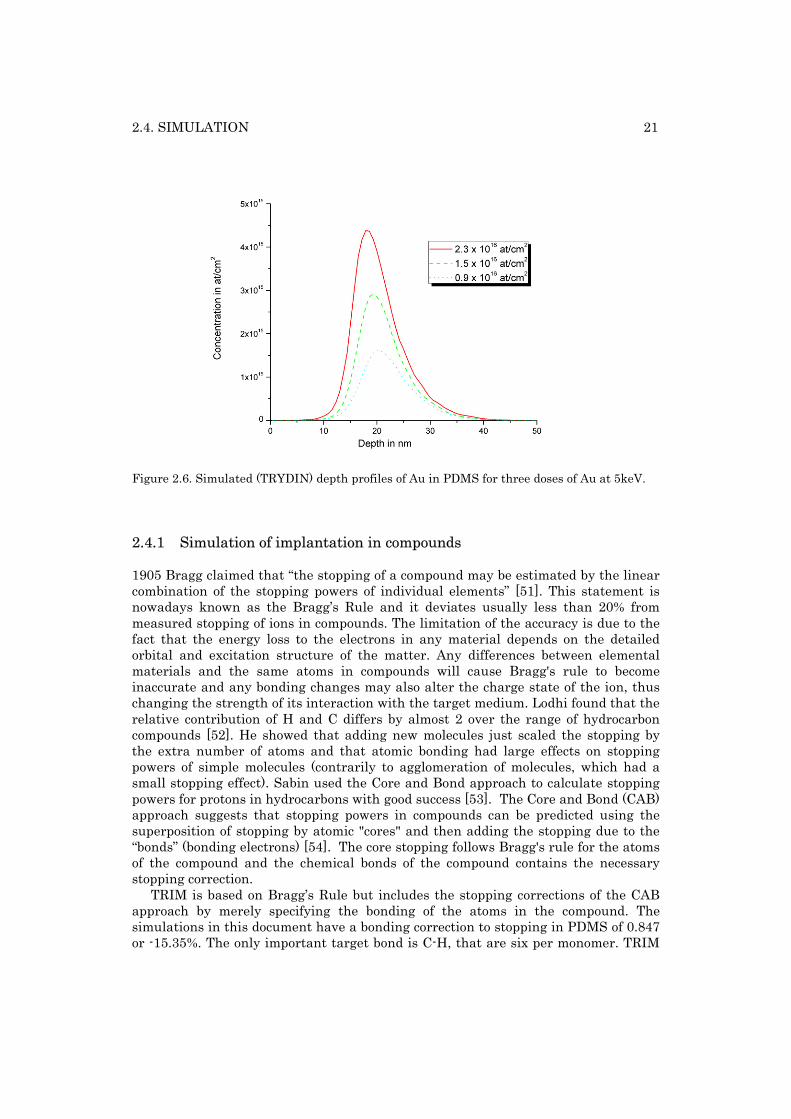
2.4.1 Simulation of implantation in compounds
1905 Bragg claimed that “the stopping of a compound may be estimated by the linear combination of the stopping powers of individual elements” [51]. This statement is nowadays known as the Bragg’s Rule and it deviates usually less than 20% from measured stopping of ions in compounds. The limitation of the accuracy is due to the fact that the energy loss to the electrons in any material depends on the detailed orbital and excitation structure of the matter. Any differences between elemental materials and the same atoms in compounds will cause Bragg's rule to become inaccurate and any bonding changes may also alter the charge state of the ion, thus changing the strength of its interaction with the target medium. Lodhi found that the relative contribution of H and C differs by almost 2 over the range of hydrocarbon compounds [52]. He showed that adding new molecules just scaled the stopping by the extra number of atoms and that atomic bonding had large effects on stopping powers of simple molecules (contrarily to agglomeration of molecules, which had a small stopping effect). Sabin used the Core and Bond approach to calculate stopping powers for protons in hydrocarbons with good success [53]. The Core and Bond (CAB) approach suggests that stopping powers in compounds can be predicted using the superposition of stopping by atomic "cores" and then adding the stopping due to the “bonds” (bonding electrons) [54]. The core stopping follows Bragg's rule for the atoms of the compound and the chemical bonds of the compound contains the necessary stopping correction.
TRIM is based on Bragg’s Rule but includes the stopping corrections of the CAB approach by merely specifying the bonding of the atoms in the compound. The simulations in this document have a bonding correction to stopping in PDMS of 0.847 or -15.35%. The only important target bond is C-H, that are six per monomer. TRIM
22 CHAPTER 2. METAL IMPLANTATION IN POLYMERS
accords to these bonds a value of 7.423 for stopping, compared to the core stopping of 0 for H, 5.36 for O, 6.26 for C and 23.56 for Si.
2.5. Physical and chemical changes of polymers after ion implantation or irradiation
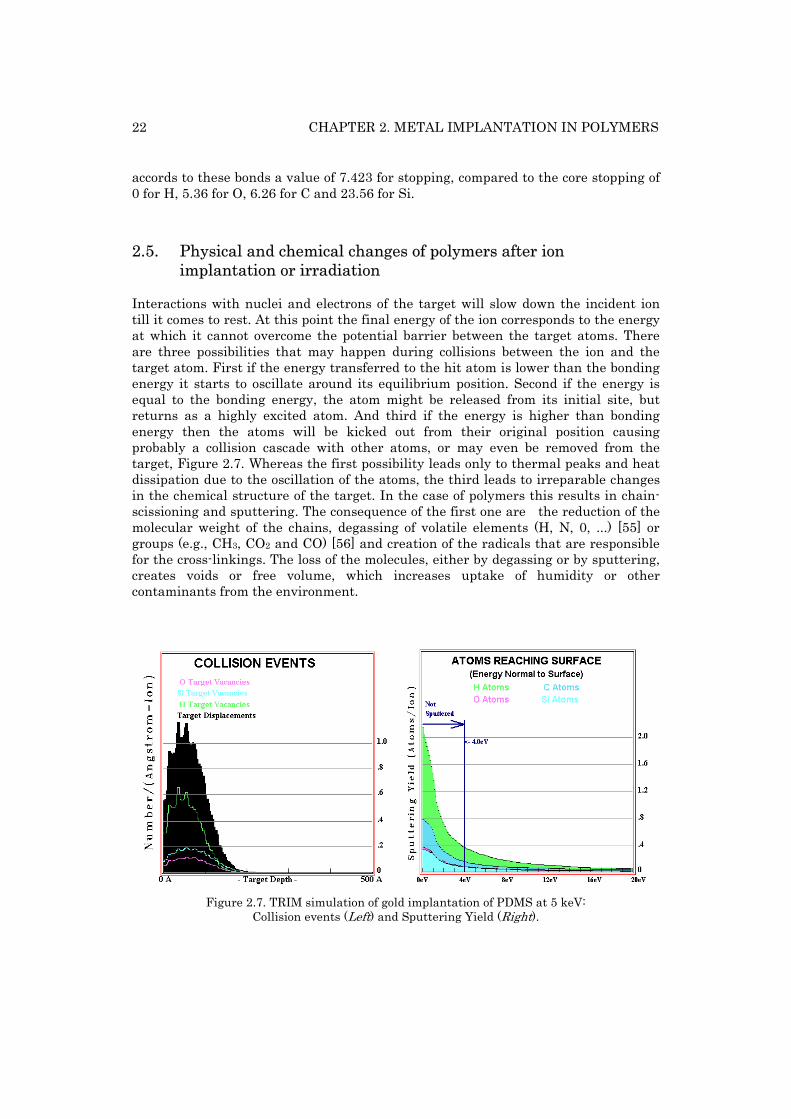
Interactions with nuclei and electrons of the target will slow down the incident ion till it comes to rest. At this point the final energy of the ion corresponds to the energy at which it cannot overcome the potential barrier between the target atoms. There are three possibilities that may happen during collisions between the ion and the target atom. First if the energy transferred to the hit atom is lower than the bonding energy it starts to oscillate around its equilibrium position. Second if the energy is equal to the bonding energy, the atom might be released from its initial site, but returns as a highly excited atom. And third if the energy is higher than bonding energy then the atoms will be kicked out from their original position causing probably a collision cascade with other atoms, or may even be removed from the target, Figure 2.7. Whereas the first possibility leads only to thermal peaks and heat dissipation due to the oscillation of the atoms, the third leads to irreparable changes in the chemical structure of the target. In the case of polymers this results in chain-scissioning and sputtering. The consequence of the first one are the reduction of the molecular weight of the chains, degassing of volatile elements (H, N, 0, ...) [55] or groups (e.g., CH3, CO2 and CO) [56] and creation of the radicals that are responsible for the cross-linkings. The loss of the molecules, either by degassing or by sputtering, creates voids or free volume, which increases uptake of humidity or other contaminants from the environment.
Figure 2.7. TRIM simulation of gold implantation of PDMS at 5 keV: Collision events (Left) and Sputtering Yield (Right).
2.5. PHYSICAL AND CHEMICAL CHANGES OF POLYMERS AFTER ION IMPLANTATION OR IRRADIATION
23
Electronic excitations and nuclear collisions lead to sputtering of target fragments from the polymeric surface. Sputtering at low energies is caused by elastic collisions between incident ions and the host atom, followed by a cascade of collisions among a large number of atoms inside the solid. The sputtering yield is in this energy regime directly proportional to the nuclear energy loss (Sn) [57]. The fragments sputtered from polymers by keV ions are characteristic fingerprints of each species, allowing even the identification of isomers. For this purpose a reference spectrum library is available for PDMS in [58]. Sputtering can also lead to considerable surface roughening.
2.5.1 Hardness
Changes in the tribological properties of polymers are the one of the results of ion irradiation of polymers at higher fluences. As mentioned before chain scission and cross-linking are the two basic degradation processes induced by the ion irradiation of polymers. While the cross-linking increases polymers hardness, improves wear and scratch resistance of the polymer surface layer, and decreases the friction coefficient the chain scission degrades the polymer’s mechanical strength [59].
The hardness enhancement is linked to the presence of carbonized structures created by electronic and nuclear energy loss in the irradiated material. The electronic energy loss leads to creation of prolonged carbonized structures and the nuclear energy loss creates interconnections between them. The experimental data of [60] indicates that electronic energy loss plays a dominant role in the process of polymer hardening. A continuous evolution of the polymer structure is observed towards a final carbonaceous material if ion fluence is increased (<3.5x10¹⁵ at/cm2). The properties of the final material are similar to those of hyrogenated amorpohous carbon: extreme hardness, infrared transparency, chemical inertness and electrical conductivity [61]. It has been also shown that the hardness was not only monotonously increasing function of the fluence but also on the ion energy [62]. In [63] it has been found that the hardness of B-, N-, and C-implanted polyimide is over three times larger than that of stainless steel and about two times harder than that of implanted stainless steel.
Increase in hardness due to high fluences can also result from a significant compaction of the irradiated layer associated with a density increase by tens of percent with respect to the pristine polymer values [64].
Also the initial polymer structure has an influence on the hardness increase. Generally the hardness of simple ion-irradiated backbone-structured polymers is lower and the absolute value of the hardness increases with increasing complexity and concentration of side groups along the polymer backbone structure [65].
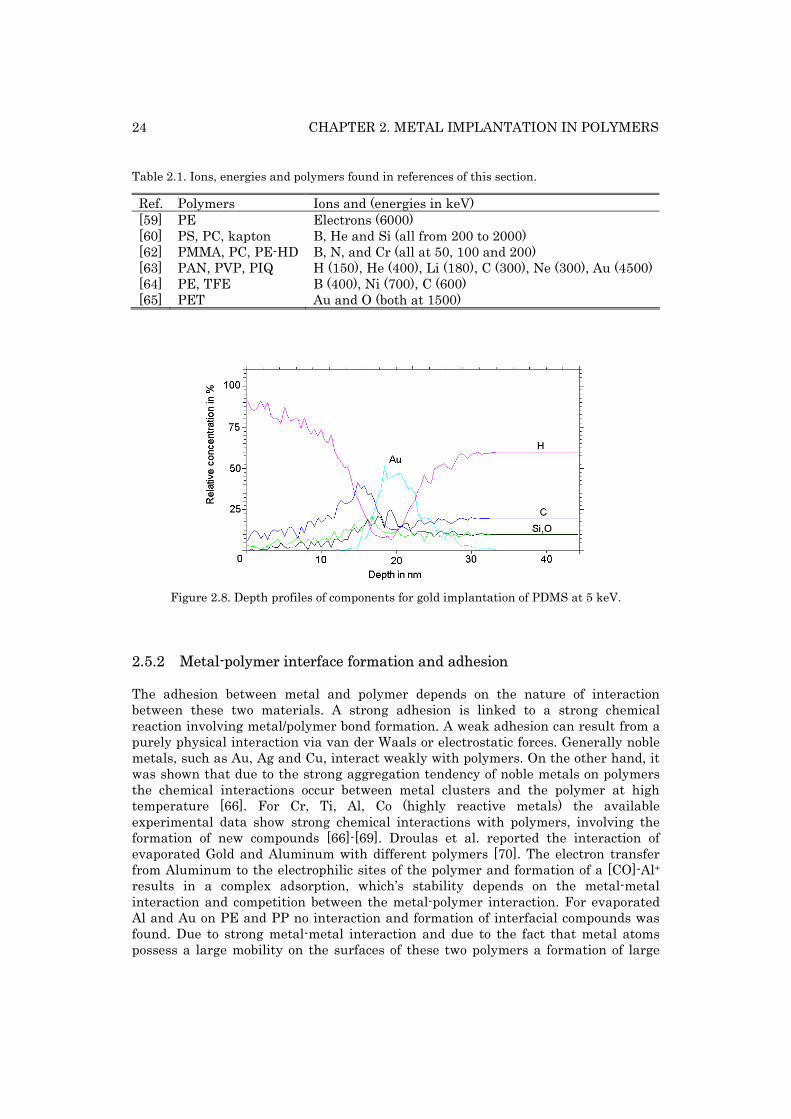
All these results however have been performed with higher energies, different polymers and elements than those in experiments performed in this document. Table 2.1 summarizes the different conditions used in the references and Figure 2.8 presents changes in elements’ concentrations simulated with TRIDYN for gold implantation of PDMS at 5 keV.
24 CHAPTER 2. METAL IMPLANTATION IN POLYMERS
Table 2.1. Ions, energies and polymers found in references of this section.
Ref. Polymers Ions and (energies in keV) [59] PE Electrons (6000) [60] PS, PC, kapton B, He and Si (all from 200 to 2000) [62] PMMA, PC, PE-HD B, N, and Cr (all at 50, 100 and 200) [63] PAN, PVP, PIQ H (150), He (400), Li (180), C (300), Ne (300), Au (4500) [64] PE, TFE B (400), Ni (700), C (600) [65] PET Au and O (both at 1500)
Figure 2.8. Depth profiles of components for gold implantation of PDMS at 5 keV.
2.5.2 Metal-polymer interface formation and adhesion
The adhesion between metal and polymer depends on the nature of interaction between these two materials. A strong adhesion is linked to a strong chemical reaction involving metal/polymer bond formation. A weak adhesion can result from a purely physical interaction via van der Waals or electrostatic forces. Generally noble metals, such as Au, Ag and Cu, interact weakly with polymers. On the other hand, it was shown that due to the strong aggregation tendency of noble metals on polymers the chemical interactions occur between metal clusters and the polymer at high temperature [66]. For Cr, Ti, Al, Co (highly reactive metals) the available experimental data show strong chemical interactions with polymers, involving the formation of new compounds [66]-[69]. Droulas et al. reported the interaction of evaporated Gold and Aluminum with different polymers [70]. The electron transfer from Aluminum to the electrophilic sites of the polymer and formation of a [CO]-Al+ results in a complex adsorption, which’s stability depends on the metal-metal interaction and competition between the metal-polymer interaction. For evaporated Al and Au on PE and PP no interaction and formation of interfacial compounds was found. Due to strong metal-metal interaction and due to the fact that metal atoms possess a large mobility on the surfaces of these two polymers a formation of large
2.5. PHYSICAL AND CHEMICAL CHANGES OF POLYMERS AFTER ION IMPLANTATION OR IRRADIATION
25
clusters takes place. If Cr is deposited onto a polymer surface, a reorientation of polymer macromolecules causes the metal to react strongly with functional groups of the polymer surfaces [71]. Formations of Cr-C and C-O-Cr groups were observed. For the Ag/PET system stronger Ag-O-C species were formed [72]. Strong silver-nitrogen-carbon bonds were observed when nitrogen was present in the polymer. Complex metal-oxygen-polymer or metal-nitrogen-polymer species usually result in stable and strong metal/polymer interactions, which also depend on the nature of the metal. The lower the electronegativity (the more easily the metal is ionized) the bigger is the chemical reactivity of the metal, and through that the bigger is the chance that it will bound with polymer molecules or radicals. From the macroscopic point of view a thin metal film with thickness d deposited on a rigid substrate (e.g., a polymer held at deep temperature) will, in the general case, be subject to tensile stress S, resulting in the storage of elastic energy U
Y
dSU
)1(2 ν−= ,
(2.4)
where Y is the Young’s modulus and ν the Poisson number [73]. Above a critical energy, the film will lose its stability and detach from the substrate spontaneously, if
)1(2 22
ν−= YW
dS ad ,
(2.5)
with Wad being the work of adhesion. To improve the adhesion between two layers, ion irradiation has been shown to be an effective technique. As a consequence of nuclear energy transfer from the ions to the target atoms, the improvement of adhesion is essentially due to the ballistic intermixing of the interface in the case of low-energy ion beams. Also irradiation of a surface may create radicals or activated sites between the two layers and thus give rise to chemical reactions. Since the surfaces of polymers prepared from the solution generally present a “terminated” structure of tangled chains, with saturated bonds, the chemical metal—polymer bonding usually demands the disruption of polymer chains to expose active sites. The chemical bonding is always accompanied by the formation of metal—carbon complex bonds and it can be enhanced by the addition of chemically active species (e.g., plasma O2 activation) or implantation of Cr at the interfaces. During the implantation both ion-induced chain scissions and cross-linking make irreversible changes in the polymer and its elastic properties. While scission destroys the polymer chains and degrades the implanted layer, cross-linking leads to adhesion failure between the strong cross-linked polymer regions and the underlying un-irradiated polymer.
26 CHAPTER 2. METAL IMPLANTATION IN POLYMERS
2.5.3 Increasing of the Surface roughness due to the MII
Implantation of PDMS creates a novel material consisting of the implanted metal particles and modified PDMS, whose chemical structure is different from the pristine PDMS. This new composite is situated in the first 100 nm from the surface (see Figure 2.5), and from the point of view of its physical properties, is different from the un-implanted PDMS beneath. During implantation the implanted PDMS layer is heated. After cooling to ambient temperature a network of periodic waves appears on the surface due to the different coefficient of thermal expansion between the implanted and non-implanted layer of PDMS. Similar waves were found with a variety of metals and polymers during metal deposition [74][75]. The waves can disappear when the sample is reheated to 110°C, but reform on cooling. The waves result from redistribution, by buckling, of compressive stresses that develop in the surface of the sample on cooling from the evaporator temperature to ambient temperature. Bowden et al. developed a model that relates the spatially non-uniform stresses in a metal film on patterned PDMS to the wave patterns [76]. This model correctly estimates the circumstances in which waves initiate, as well as their orientation and wavelength. The same model has been used by Stafford et al. who developed a new technique for the measurements of the ultrathin (<40 nm) elastic polymer films [77]. The complete theory can be found in [78]. In the following summary of the theory, due to the similarity of the samples analyzed in the above mentioned references and ion implanted PDMS, this model will be applied on the implanted samples. Adapted terms related to the implantation will be added in brackets. If the PDMS were perfectly smooth and the film unbuckled, then at temperatures T below the deposition (implantation) temperature TD, the film would be in a state of uniform, equi-biaxial compressive stress S0(Pa) given by [79]:
)1(
))((0
M
DMPM TTYS
ναα−
−−= . (2.6)
The subscripts M and P refer to the metal (composite) film and PDMS, respectively, ν (unit-less) is the Poisson’s ratio, α is the coefficient of thermal expansion, and Y (Pa) is the Young’s modulus. The equi-biaxial compressive film stress arises from the considerable mismatch of the coefficients of thermal expansion of the PDMS and the film (implanted layer). As the temperature drops and the compressive stresses in the film (implanted layer) increase, buckling starts where the maximum principal compressive stress attains the critical value, Scrit given by [78]:
3
2
2
3
1
2 )1()1(52.0 ⎟⎟
⎠
⎞⎜⎜⎝
⎛−⎟⎟
⎠
⎞⎜⎜⎝
⎛−
≈P
P
M
Mcrit
YYS
νν. (2.7)
The associated sinusoidal wave pattern, aligned perpendicular to the direction of maximum compression, has wavelength L [78]:
2.6. ION SOURCES 27
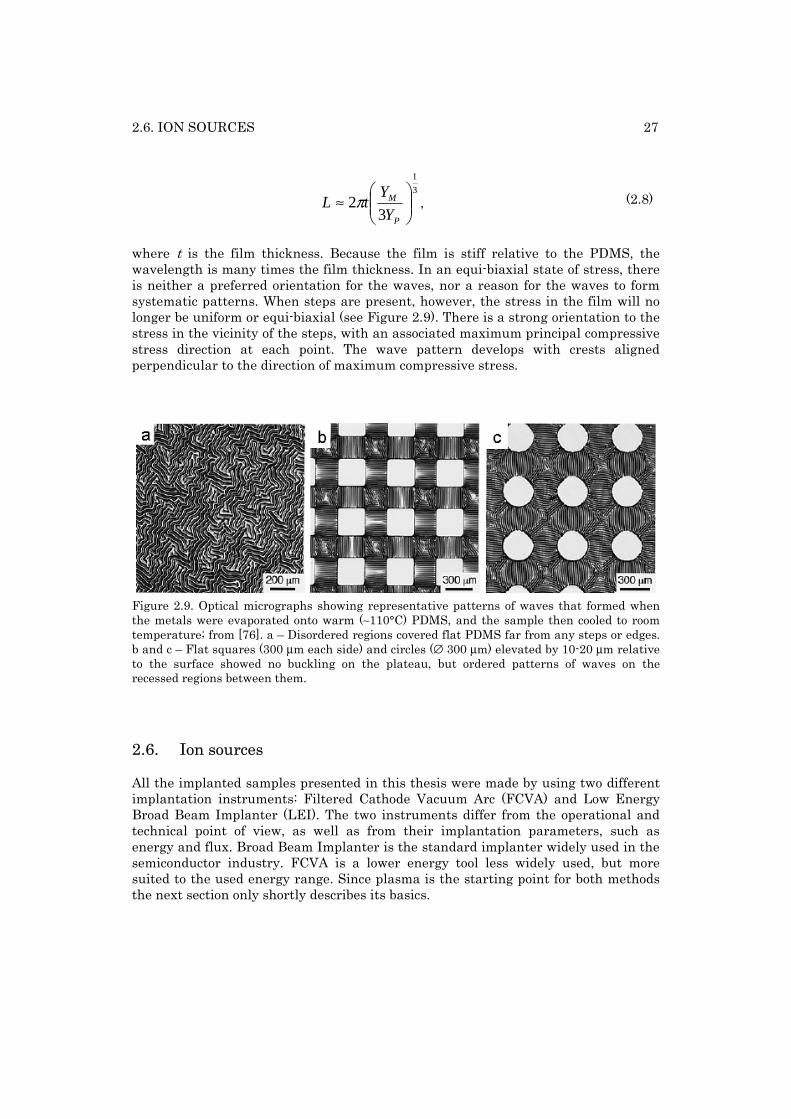
3
1
32 ⎟⎟
⎠
⎞⎜⎜⎝
⎛≈
P
M
Y
YtL π , (2.8)
where t is the film thickness. Because the film is stiff relative to the PDMS, the wavelength is many times the film thickness. In an equi-biaxial state of stress, there is neither a preferred orientation for the waves, nor a reason for the waves to form systematic patterns. When steps are present, however, the stress in the film will no longer be uniform or equi-biaxial (see Figure 2.9). There is a strong orientation to the stress in the vicinity of the steps, with an associated maximum principal compressive stress direction at each point. The wave pattern develops with crests aligned perpendicular to the direction of maximum compressive stress.
Figure 2.9. Optical micrographs showing representative patterns of waves that formed when the metals were evaporated onto warm (∼110°C) PDMS, and the sample then cooled to room temperature; from [76]. a – Disordered regions covered flat PDMS far from any steps or edges. b and c – Flat squares (300 μm each side) and circles (∅ 300 μm) elevated by 10-20 μm relative to the surface showed no buckling on the plateau, but ordered patterns of waves on the recessed regions between them.
2.6. Ion sources
All the implanted samples presented in this thesis were made by using two different implantation instruments: Filtered Cathode Vacuum Arc (FCVA) and Low Energy Broad Beam Implanter (LEI). The two instruments differ from the operational and technical point of view, as well as from their implantation parameters, such as energy and flux. Broad Beam Implanter is the standard implanter widely used in the semiconductor industry. FCVA is a lower energy tool less widely used, but more suited to the used energy range. Since plasma is the starting point for both methods the next section only shortly describes its basics.
28 CHAPTER 2. METAL IMPLANTATION IN POLYMERS
Plasma
Plasma is an electrical neutral collection of free charged particles (electrons and positive ions) moving in random directions. In the contact with a floating or low-voltage wall surface, if the plasma is quasi-neutral (same density of the charged particles – ions and electrons), it creates a thin positively charged layer called sheath. This is due to the local loss of the electrons that are situated next to the wall, which creates in that region a positive ion sheath. It acts as a confining potential valley for electrons and a hill for ions because the electric field within the sheath point from the plasma to the wall. The separation of plasma into bulk and sheath region is a very important phenomenon. Its dynamics is described by various ion space charge sheath lows, including low- and various high-voltage sheath models, such as collision-less and collisional Child law or matrix sheaths and their modifications.
2.6.1 Broad beam implanter
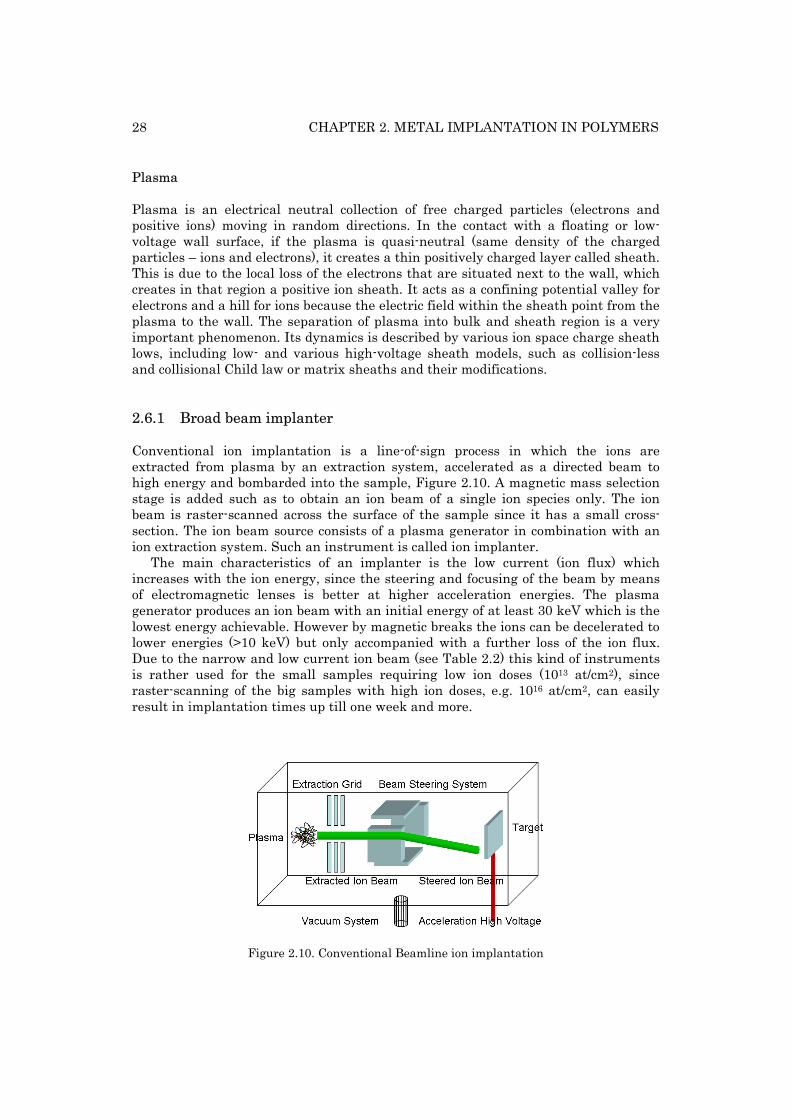
Conventional ion implantation is a line-of-sign process in which the ions are extracted from plasma by an extraction system, accelerated as a directed beam to high energy and bombarded into the sample, Figure 2.10. A magnetic mass selection stage is added such as to obtain an ion beam of a single ion species only. The ion beam is raster-scanned across the surface of the sample since it has a small cross-section. The ion beam source consists of a plasma generator in combination with an ion extraction system. Such an instrument is called ion implanter.
The main characteristics of an implanter is the low current (ion flux) which increases with the ion energy, since the steering and focusing of the beam by means of electromagnetic lenses is better at higher acceleration energies. The plasma generator produces an ion beam with an initial energy of at least 30 keV which is the lowest energy achievable. However by magnetic breaks the ions can be decelerated to lower energies (>10 keV) but only accompanied with a further loss of the ion flux. Due to the narrow and low current ion beam (see Table 2.2) this kind of instruments is rather used for the small samples requiring low ion doses (1013 at/cm2), since raster-scanning of the big samples with high ion doses, e.g. 1016 at/cm2, can easily result in implantation times up till one week and more.
Figure 2.10. Conventional Beamline ion implantation
2.6. ION SOURCES 29
Broad beam implanter used in the experiments
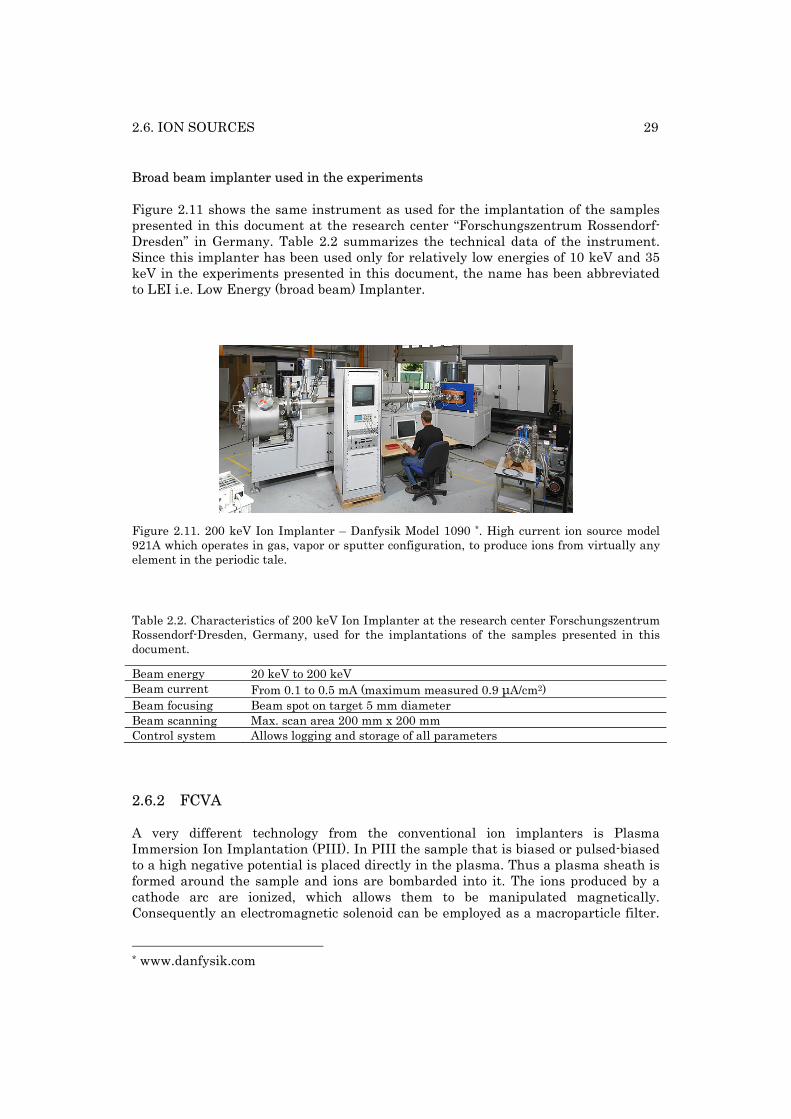
Figure 2.11 shows the same instrument as used for the implantation of the samples presented in this document at the research center “Forschungszentrum Rossendorf-Dresden” in Germany. Table 2.2 summarizes the technical data of the instrument. Since this implanter has been used only for relatively low energies of 10 keV and 35 keV in the experiments presented in this document, the name has been abbreviated to LEI i.e. Low Energy (broad beam) Implanter.
Figure 2.11. 200 keV Ion Implanter – Danfysik Model 1090 *. High current ion source model 921A which operates in gas, vapor or sputter configuration, to produce ions from virtually any element in the periodic tale. Table 2.2. Characteristics of 200 keV Ion Implanter at the research center Forschungszentrum Rossendorf-Dresden, Germany, used for the implantations of the samples presented in this document. Beam energy 20 keV to 200 keV Beam current From 0.1 to 0.5 mA (maximum measured 0.9 μA/cm2) Beam focusing Beam spot on target 5 mm diameter Beam scanning Max. scan area 200 mm x 200 mm Control system Allows logging and storage of all parameters
2.6.2 FCVA
A very different technology from the conventional ion implanters is Plasma Immersion Ion Implantation (PIII). In PIII the sample that is biased or pulsed-biased to a high negative potential is placed directly in the plasma. Thus a plasma sheath is formed around the sample and ions are bombarded into it. The ions produced by a cathode arc are ionized, which allows them to be manipulated magnetically. Consequently an electromagnetic solenoid can be employed as a macroparticle filter.
* www.danfysik.com
30 CHAPTER 2. METAL IMPLANTATION IN POLYMERS
The plasma applications group at Lawrence Berkeley Laboratory (California) and Ian G. Brown are responsible for the extensive development of this technology [80]. If the source is based on cathodic arcs producing metal ions then one talks about MePIII, and if the implantation is done without the acceleration potential the ions will be also deposited (MePIIID).
Filtered Cathode Vacuum Arc (FCVA) is a modern MePIIID instrument consisting of: a conductive cathode from which the plasma is created; a high-voltage trigger to initiate the arc; an anode operating at several hundreds of volts in order to extract the plasma towards the filter; a macroparticle filter; a vacuum chamber; and a power supply for FCVA as well as for the substrate (Figure 2.12).
The cathode material must be conductive (metals, alloys, doped semiconductors, graphite). The shape of the cathode is a cylinder with one end being the region of arcing and plasma production and the other connected to the power supply. The diameter of the cathode ranges from several millimeters, for smaller systems, to tens of centimeters producing denser and wider plasma cloud for high doses implantations. The majority of the plasma atoms are ionized during the discharge. The material ejected from the spot region contains energetic ions with multiple charge states, due to the extremely high current densities, and most of them have an average ion charge state of between 1 and 3 [81].
The operating pressure of FCVA lies below 1x10⁻⁵ mbar. At this pressure a creation of an arc generates a pressure gradient, corresponding to ion acceleration energies of about 25-200 eV or velocities of 5x10³ – 2x10⁴ m/s [82]. The anode is a metallic ring situated in proximity of the plasma plume (which is created on the cathode surface) in order to collect enough electrons to sustain the discharge and in the same time not disturb the plasma flow to the filter. Once the arc is initiated with the trigger and as long as the power supply can sustain the potential difference between the anode and the cathode, the anode will collect electrons from the cathode until the entire source is ablated. FCVA can work in a continuous or in a pulsed mode, which means, that the previous explained situation happens only during hundreds of microseconds. The typically used implantation frequencies are in the range between 2 and 0.5 Hz.
After the anode and due to the pressure gradient, plasma moves toward the bent magnetic filter [83]. This part of FCVA is not always present on the implantation systems and depends on the application of the implantation. For many applications the presence of macroparticles of size up to a few micrometers in plasma, and later on the target surface, is highly undesirable. It can lead to creation of continuous metal layer and lower quality of implanted layer. The magnet field is created by means of coils wound around a 90° bent tube. The coils can have an independent, external, continuous or pulsed power supply, or they can be connected in series with the anode. In that way the magnetic field is only created as long as the extracting of the plasma by anode is active. The filter removes macroparticles from plasma by using their low charge over mass ratio. It confines the electrons through the Lorenz force inside the tube and guides the ions, attracted to the electrons by the electrostatic Coulomb force, through the tube. For more information on the different sort of filters and their influences on plasma the reader is pleased to refer to many studies performed by Anders et al [81]- [83]. They have shown that having an externally controlled source for the magnetic coil would only improve the filter’s efficiency to a few percents, compared to the wounded coil connected in series with the anode.
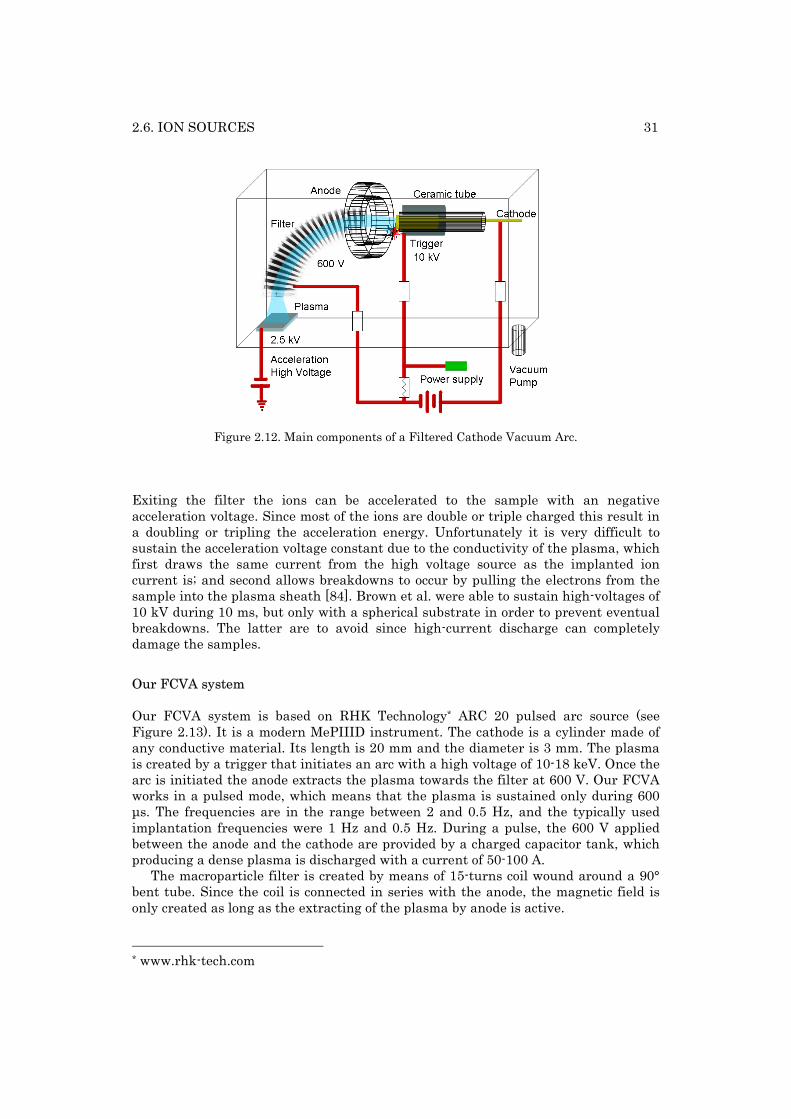
2.6. ION SOURCES 31
Figure 2.12. Main components of a Filtered Cathode Vacuum Arc. Exiting the filter the ions can be accelerated to the sample with an negative acceleration voltage. Since most of the ions are double or triple charged this result in a doubling or tripling the acceleration energy. Unfortunately it is very difficult to sustain the acceleration voltage constant due to the conductivity of the plasma, which first draws the same current from the high voltage source as the implanted ion current is; and second allows breakdowns to occur by pulling the electrons from the sample into the plasma sheath [84]. Brown et al. were able to sustain high-voltages of 10 kV during 10 ms, but only with a spherical substrate in order to prevent eventual breakdowns. The latter are to avoid since high-current discharge can completely damage the samples.
Our FCVA system
Our FCVA system is based on RHK Technology* ARC 20 pulsed arc source (see Figure 2.13). It is a modern MePIIID instrument. The cathode is a cylinder made of any conductive material. Its length is 20 mm and the diameter is 3 mm. The plasma is created by a trigger that initiates an arc with a high voltage of 10-18 keV. Once the arc is initiated the anode extracts the plasma towards the filter at 600 V. Our FCVA works in a pulsed mode, which means that the plasma is sustained only during 600 μs. The frequencies are in the range between 2 and 0.5 Hz, and the typically used implantation frequencies were 1 Hz and 0.5 Hz. During a pulse, the 600 V applied between the anode and the cathode are provided by a charged capacitor tank, which producing a dense plasma is discharged with a current of 50-100 A.
The macroparticle filter is created by means of 15-turns coil wound around a 90° bent tube. Since the coil is connected in series with the anode, the magnetic field is only created as long as the extracting of the plasma by anode is active. * www.rhk-tech.com
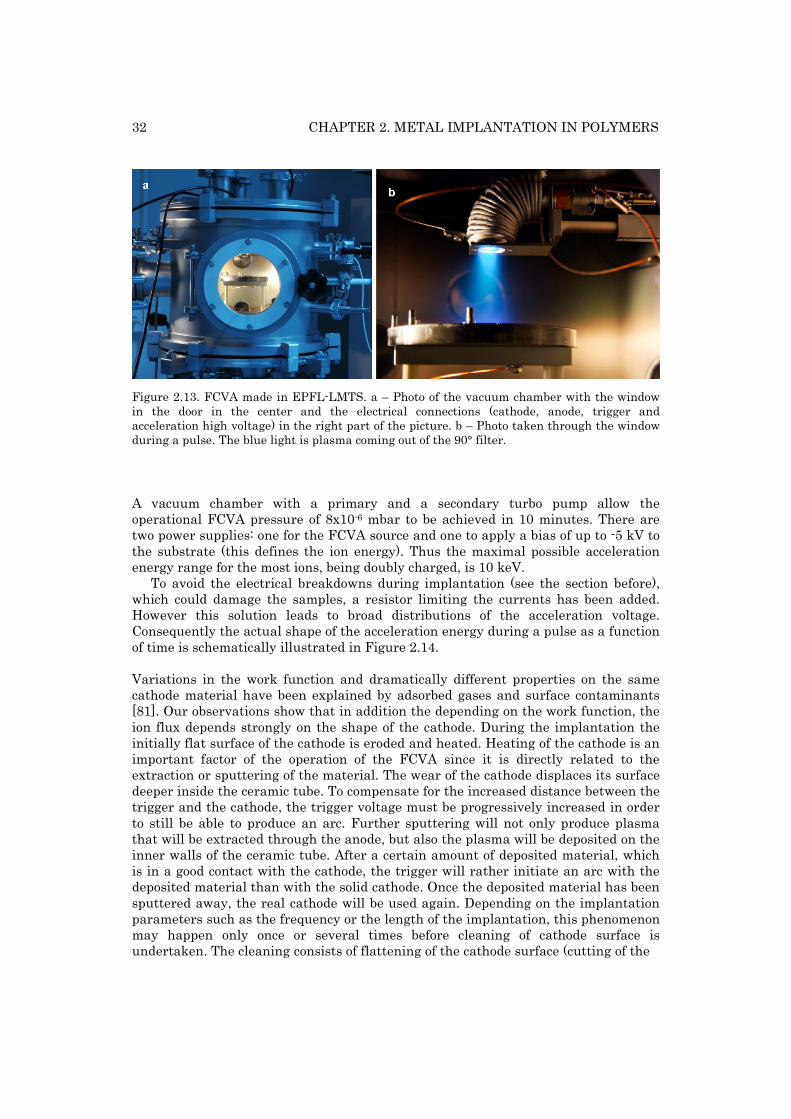
32 CHAPTER 2. METAL IMPLANTATION IN POLYMERS
Figure 2.13. FCVA made in EPFL-LMTS. a – Photo of the vacuum chamber with the window in the door in the center and the electrical connections (cathode, anode, trigger and acceleration high voltage) in the right part of the picture. b – Photo taken through the window during a pulse. The blue light is plasma coming out of the 90° filter. A vacuum chamber with a primary and a secondary turbo pump allow the operational FCVA pressure of 8x10⁻⁶ mbar to be achieved in 10 minutes. There are two power supplies: one for the FCVA source and one to apply a bias of up to -5 kV to the substrate (this defines the ion energy). Thus the maximal possible acceleration energy range for the most ions, being doubly charged, is 10 keV.
To avoid the electrical breakdowns during implantation (see the section before), which could damage the samples, a resistor limiting the currents has been added. However this solution leads to broad distributions of the acceleration voltage. Consequently the actual shape of the acceleration energy during a pulse as a function of time is schematically illustrated in Figure 2.14. Variations in the work function and dramatically different properties on the same cathode material have been explained by adsorbed gases and surface contaminants [81]. Our observations show that in addition the depending on the work function, the ion flux depends strongly on the shape of the cathode. During the implantation the initially flat surface of the cathode is eroded and heated. Heating of the cathode is an important factor of the operation of the FCVA since it is directly related to the extraction or sputtering of the material. The wear of the cathode displaces its surface deeper inside the ceramic tube. To compensate for the increased distance between the trigger and the cathode, the trigger voltage must be progressively increased in order to still be able to produce an arc. Further sputtering will not only produce plasma that will be extracted through the anode, but also the plasma will be deposited on the inner walls of the ceramic tube. After a certain amount of deposited material, which is in a good contact with the cathode, the trigger will rather initiate an arc with the deposited material than with the solid cathode. Once the deposited material has been sputtered away, the real cathode will be used again. Depending on the implantation parameters such as the frequency or the length of the implantation, this phenomenon may happen only once or several times before cleaning of cathode surface is undertaken. The cleaning consists of flattening of the cathode surface (cutting of the
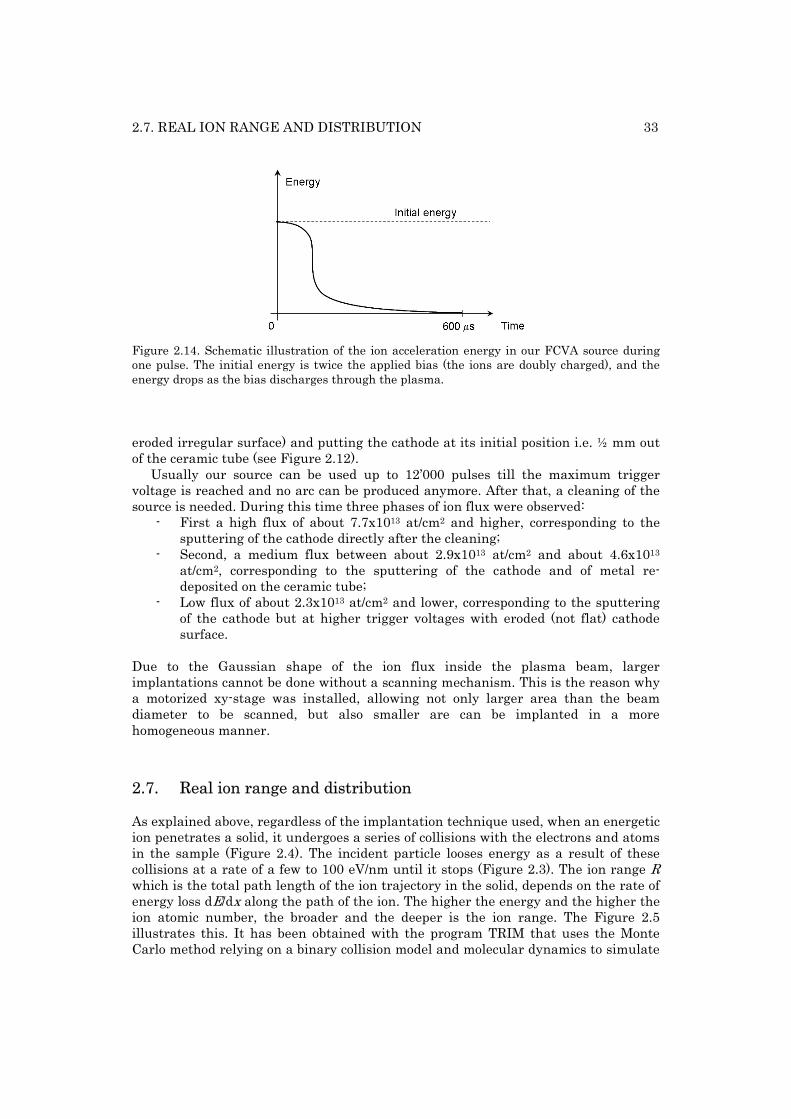
2.7. REAL ION RANGE AND DISTRIBUTION 33
Figure 2.14. Schematic illustration of the ion acceleration energy in our FCVA source during one pulse. The initial energy is twice the applied bias (the ions are doubly charged), and the energy drops as the bias discharges through the plasma. eroded irregular surface) and putting the cathode at its initial position i.e. ½ mm out of the ceramic tube (see Figure 2.12).
Usually our source can be used up to 12’000 pulses till the maximum trigger voltage is reached and no arc can be produced anymore. After that, a cleaning of the source is needed. During this time three phases of ion flux were observed:
- First a high flux of about 7.7x10¹³ at/cm2 and higher, corresponding to the sputtering of the cathode directly after the cleaning;
- Second, a medium flux between about 2.9x10¹³ at/cm2 and about 4.6x10¹³ at/cm2, corresponding to the sputtering of the cathode and of metal re-deposited on the ceramic tube;
- Low flux of about 2.3x10¹³ at/cm2 and lower, corresponding to the sputtering of the cathode but at higher trigger voltages with eroded (not flat) cathode surface.
Due to the Gaussian shape of the ion flux inside the plasma beam, larger implantations cannot be done without a scanning mechanism. This is the reason why a motorized xy-stage was installed, allowing not only larger area than the beam diameter to be scanned, but also smaller are can be implanted in a more homogeneous manner.
2.7. Real ion range and distribution
As explained above, regardless of the implantation technique used, when an energetic ion penetrates a solid, it undergoes a series of collisions with the electrons and atoms in the sample (Figure 2.4). The incident particle looses energy as a result of these collisions at a rate of a few to 100 eV/nm until it stops (Figure 2.3). The ion range R which is the total path length of the ion trajectory in the solid, depends on the rate of energy loss dE/dx along the path of the ion. The higher the energy and the higher the ion atomic number, the broader and the deeper is the ion range. The Figure 2.5 illustrates this. It has been obtained with the program TRIM that uses the Monte Carlo method relying on a binary collision model and molecular dynamics to simulate
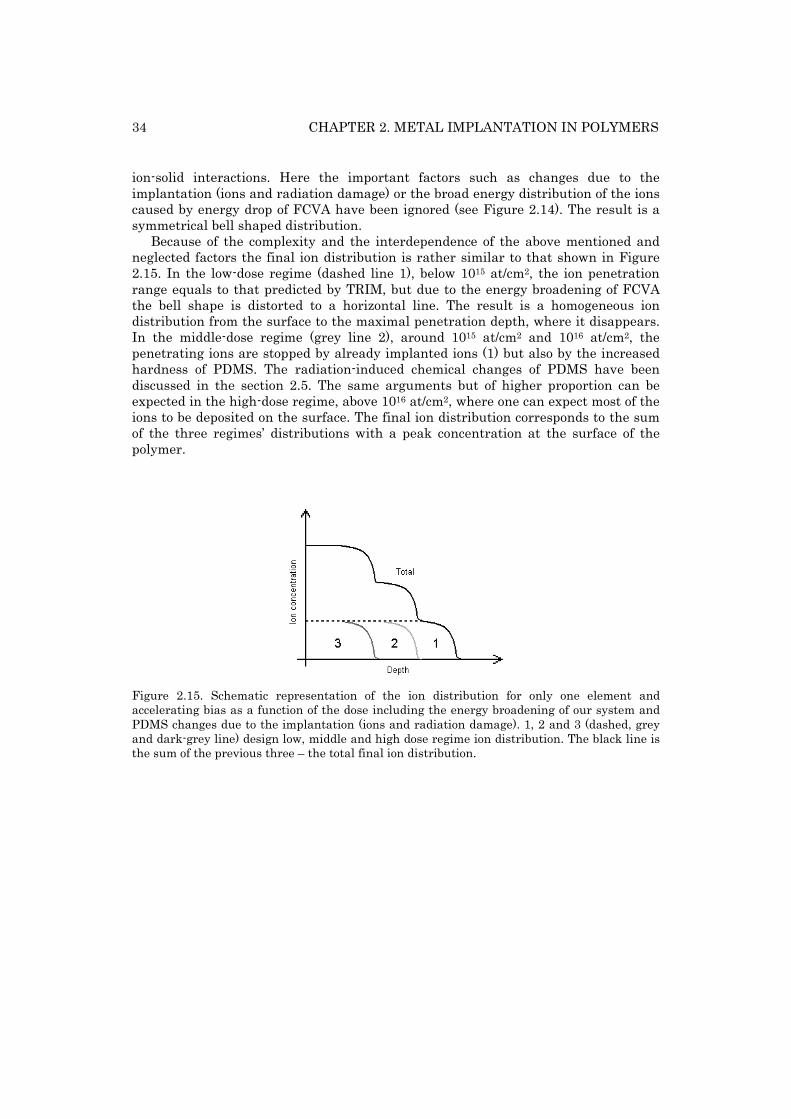
34 CHAPTER 2. METAL IMPLANTATION IN POLYMERS
ion-solid interactions. Here the important factors such as changes due to the implantation (ions and radiation damage) or the broad energy distribution of the ions caused by energy drop of FCVA have been ignored (see Figure 2.14). The result is a symmetrical bell shaped distribution.
Because of the complexity and the interdependence of the above mentioned and neglected factors the final ion distribution is rather similar to that shown in Figure 2.15. In the low-dose regime (dashed line 1), below 1015 at/cm2, the ion penetration range equals to that predicted by TRIM, but due to the energy broadening of FCVA the bell shape is distorted to a horizontal line. The result is a homogeneous ion distribution from the surface to the maximal penetration depth, where it disappears. In the middle-dose regime (grey line 2), around 1015 at/cm2 and 1016 at/cm2, the penetrating ions are stopped by already implanted ions (1) but also by the increased hardness of PDMS. The radiation-induced chemical changes of PDMS have been discussed in the section 2.5. The same arguments but of higher proportion can be expected in the high-dose regime, above 1016 at/cm2, where one can expect most of the ions to be deposited on the surface. The final ion distribution corresponds to the sum of the three regimes’ distributions with a peak concentration at the surface of the polymer.
Figure 2.15. Schematic representation of the ion distribution for only one element and accelerating bias as a function of the dose including the energy broadening of our system and PDMS changes due to the implantation (ions and radiation damage). 1, 2 and 3 (dashed, grey and dark-grey line) design low, middle and high dose regime ion distribution. The black line is the sum of the previous three – the total final ion distribution.
35
Chapter 3
3. Irradiation effects on polymers
Since a small part of experiments presented in this document were done on gamma irradiation of PDMS, this chapter presents a quick overview of the basic mechanisms involved during the irradiation of the polymers as well as the instrument or experimental setup used. Additionally because the experiments were compared with high-energy proton irradiation of PDMS, a small summary on influences of proton irradiation of the PDMS will be presented. For both gamma and proton irradiation, the basic theory and the modifications of polymer structure explained in the previous chapter are almost the same. The amount of the damage produced and consequences differ.
3.1. Influence on polymers
In this short section the effect of ionizing irradiation (1 MeV gamma irradiation) and non-ionizing irradiation (1 to 5 MeV protons leading to mostly displacement damage) will be briefly discussed.
Total ionizing dose – TID
The amount of the energy deposited per unit mass of a medium deposited by irradiation is called the total ionizing dose. It has the unit J/kg or Gray (Gy).
3.1.1 Gamma irradiation (ionizing irradiation)
The technologically useful modifications that ionizing irradiation may induce in polymers has been a field of extensive research. Cross-linking and scission reactions are the products of irradiation treatment of a polymeric material and they affect the molecular weight, the molecular weight distribution, and in turn the physical properties of the treated material [85][86].
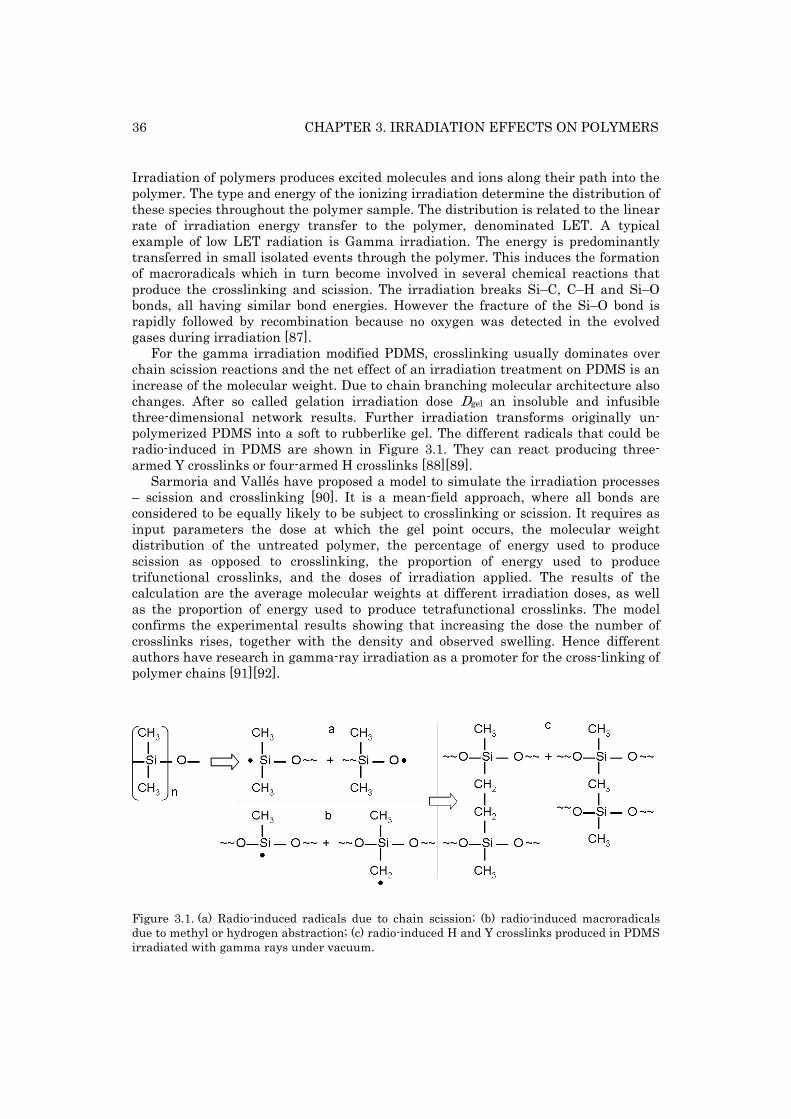
36 CHAPTER 3. IRRADIATION EFFECTS ON POLYMERS
Irradiation of polymers produces excited molecules and ions along their path into the polymer. The type and energy of the ionizing irradiation determine the distribution of these species throughout the polymer sample. The distribution is related to the linear rate of irradiation energy transfer to the polymer, denominated LET. A typical example of low LET radiation is Gamma irradiation. The energy is predominantly transferred in small isolated events through the polymer. This induces the formation of macroradicals which in turn become involved in several chemical reactions that produce the crosslinking and scission. The irradiation breaks Si–C, C–H and Si–O bonds, all having similar bond energies. However the fracture of the Si–O bond is rapidly followed by recombination because no oxygen was detected in the evolved gases during irradiation [87].
For the gamma irradiation modified PDMS, crosslinking usually dominates over chain scission reactions and the net effect of an irradiation treatment on PDMS is an increase of the molecular weight. Due to chain branching molecular architecture also changes. After so called gelation irradiation dose Dgel an insoluble and infusible three-dimensional network results. Further irradiation transforms originally un-polymerized PDMS into a soft to rubberlike gel. The different radicals that could be radio-induced in PDMS are shown in Figure 3.1. They can react producing three-armed Y crosslinks or four-armed H crosslinks [88][89].
Sarmoria and Vallés have proposed a model to simulate the irradiation processes – scission and crosslinking [90]. It is a mean-field approach, where all bonds are considered to be equally likely to be subject to crosslinking or scission. It requires as input parameters the dose at which the gel point occurs, the molecular weight distribution of the untreated polymer, the percentage of energy used to produce scission as opposed to crosslinking, the proportion of energy used to produce trifunctional crosslinks, and the doses of irradiation applied. The results of the calculation are the average molecular weights at different irradiation doses, as well as the proportion of energy used to produce tetrafunctional crosslinks. The model confirms the experimental results showing that increasing the dose the number of crosslinks rises, together with the density and observed swelling. Hence different authors have research in gamma-ray irradiation as a promoter for the cross-linking of polymer chains [91][92].
Figure 3.1. (a) Radio-induced radicals due to chain scission; (b) radio-induced macroradicals due to methyl or hydrogen abstraction; (c) radio-induced H and Y crosslinks produced in PDMS irradiated with gamma rays under vacuum.
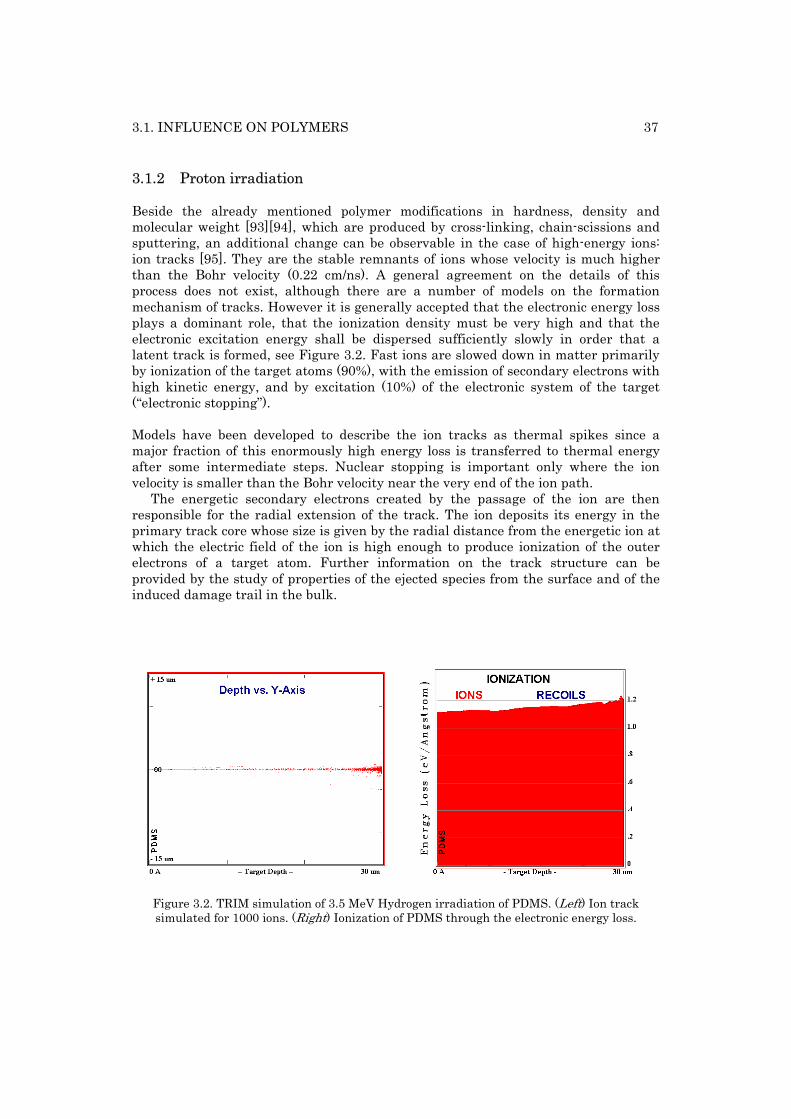
3.1. INFLUENCE ON POLYMERS 37
3.1.2 Proton irradiation
Beside the already mentioned polymer modifications in hardness, density and molecular weight [93][94], which are produced by cross-linking, chain-scissions and sputtering, an additional change can be observable in the case of high-energy ions: ion tracks [95]. They are the stable remnants of ions whose velocity is much higher than the Bohr velocity (0.22 cm/ns). A general agreement on the details of this process does not exist, although there are a number of models on the formation mechanism of tracks. However it is generally accepted that the electronic energy loss plays a dominant role, that the ionization density must be very high and that the electronic excitation energy shall be dispersed sufficiently slowly in order that a latent track is formed, see Figure 3.2. Fast ions are slowed down in matter primarily by ionization of the target atoms (90%), with the emission of secondary electrons with high kinetic energy, and by excitation (10%) of the electronic system of the target (“electronic stopping”). Models have been developed to describe the ion tracks as thermal spikes since a major fraction of this enormously high energy loss is transferred to thermal energy after some intermediate steps. Nuclear stopping is important only where the ion velocity is smaller than the Bohr velocity near the very end of the ion path.
The energetic secondary electrons created by the passage of the ion are then responsible for the radial extension of the track. The ion deposits its energy in the primary track core whose size is given by the radial distance from the energetic ion at which the electric field of the ion is high enough to produce ionization of the outer electrons of a target atom. Further information on the track structure can be provided by the study of properties of the ejected species from the surface and of the induced damage trail in the bulk.
Figure 3.2. TRIM simulation of 3.5 MeV Hydrogen irradiation of PDMS. (Left) Ion track simulated for 1000 ions. (Right) Ionization of PDMS through the electronic energy loss.
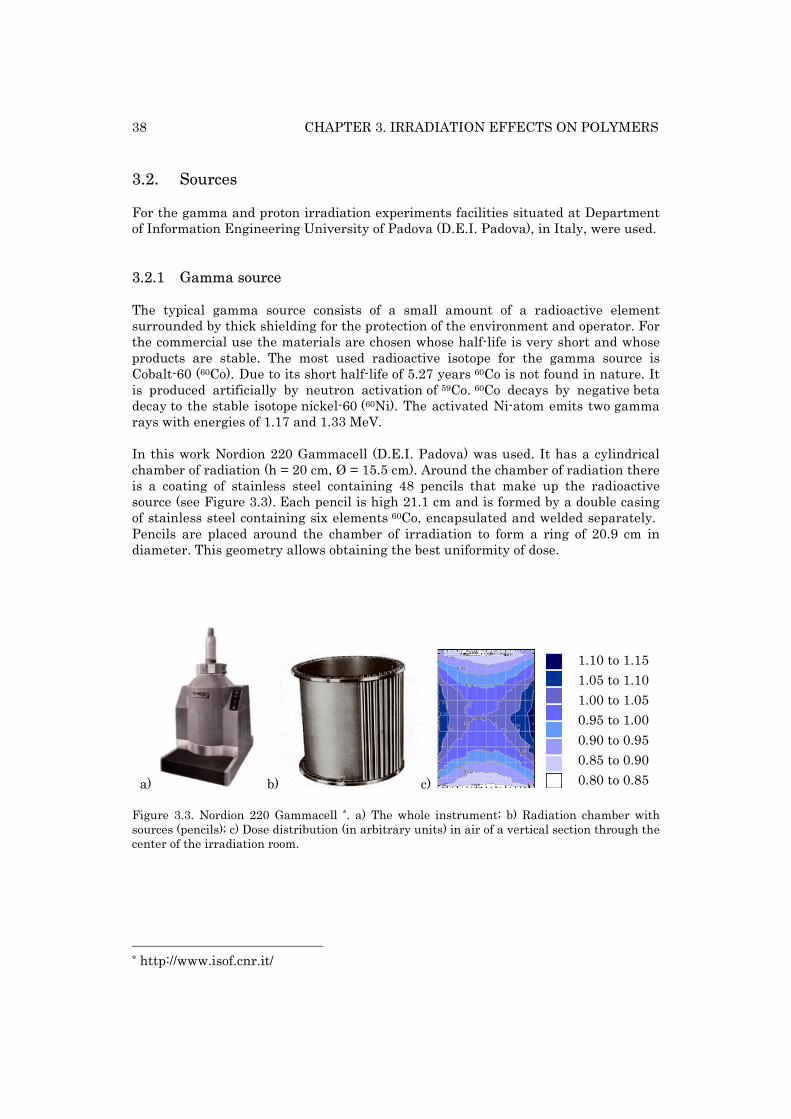
38 CHAPTER 3. IRRADIATION EFFECTS ON POLYMERS
3.2. Sources
For the gamma and proton irradiation experiments facilities situated at Department of Information Engineering University of Padova (D.E.I. Padova), in Italy, were used.
3.2.1 Gamma source
The typical gamma source consists of a small amount of a radioactive element surrounded by thick shielding for the protection of the environment and operator. For the commercial use the materials are chosen whose half-life is very short and whose products are stable. The most used radioactive isotope for the gamma source is Cobalt-60 (60Co). Due to its short half-life of 5.27 years 60Co is not found in nature. It is produced artificially by neutron activation of 59Co. 60Co decays by negative beta decay to the stable isotope nickel-60 (60Ni). The activated Ni-atom emits two gamma rays with energies of 1.17 and 1.33 MeV. In this work Nordion 220 Gammacell (D.E.I. Padova) was used. It has a cylindrical chamber of radiation (h = 20 cm, Ø = 15.5 cm). Around the chamber of radiation there is a coating of stainless steel containing 48 pencils that make up the radioactive source (see Figure 3.3). Each pencil is high 21.1 cm and is formed by a double casing of stainless steel containing six elements 60Co, encapsulated and welded separately. Pencils are placed around the chamber of irradiation to form a ring of 20.9 cm in diameter. This geometry allows obtaining the best uniformity of dose.
a) b) c)
1.10 to 1.15 1.05 to 1.10 1.00 to 1.05 0.95 to 1.00 0.90 to 0.95 0.85 to 0.90 0.80 to 0.85
Figure 3.3. Nordion 220 Gammacell *. a) The whole instrument; b) Radiation chamber with sources (pencils); c) Dose distribution (in arbitrary units) in air of a vertical section through the center of the irradiation room.
* http://www.isof.cnr.it/
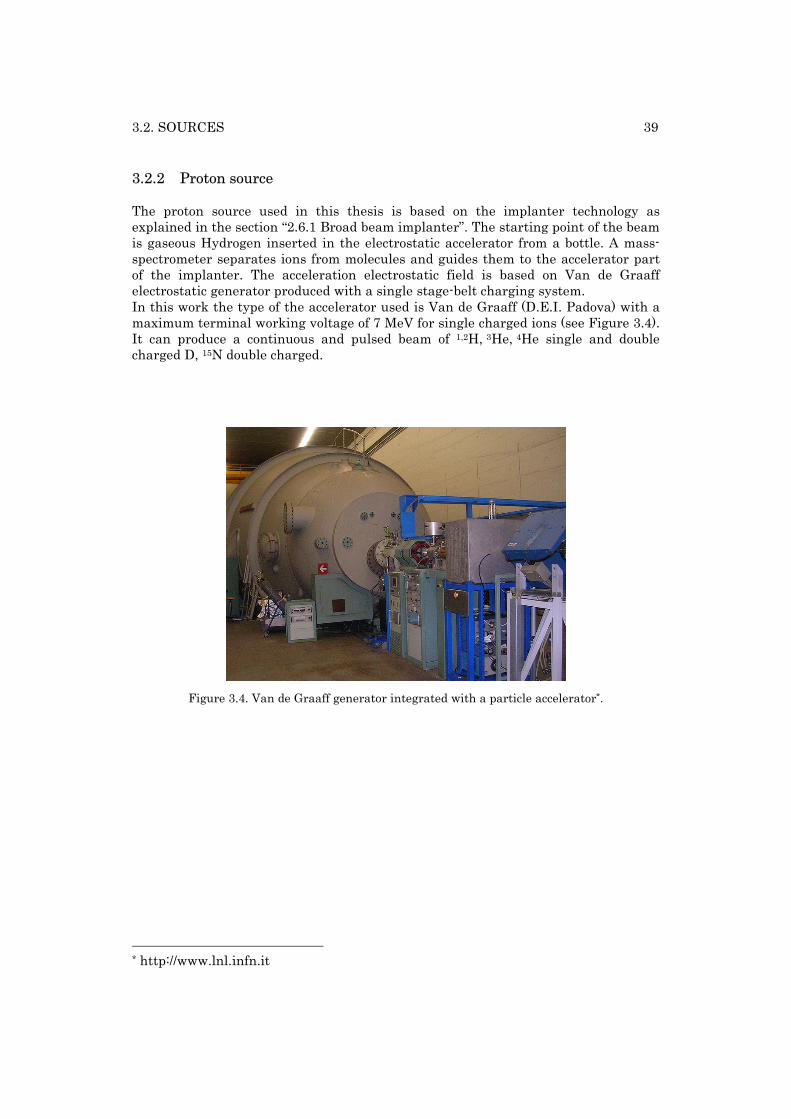
3.2. SOURCES 39
3.2.2 Proton source
The proton source used in this thesis is based on the implanter technology as explained in the section “2.6.1 Broad beam implanter”. The starting point of the beam is gaseous Hydrogen inserted in the electrostatic accelerator from a bottle. A mass-spectrometer separates ions from molecules and guides them to the accelerator part of the implanter. The acceleration electrostatic field is based on Van de Graaff electrostatic generator produced with a single stage-belt charging system. In this work the type of the accelerator used is Van de Graaff (D.E.I. Padova) with a maximum terminal working voltage of 7 MeV for single charged ions (see Figure 3.4). It can produce a continuous and pulsed beam of 1,2H, 3He, 4He single and double charged D, 15N double charged.
Figure 3.4. Van de Graaff generator integrated with a particle accelerator*.
* http://www.lnl.infn.it

41
Chapter 4
4. Modeling of Elasticity and Conductivity in composite heterogeneous materials
Composites are engineered materials made from two or more individual materials, referred to as constituents, with significantly different physical or chemical properties. There are two categories of constituent materials: matrix (modified material) and reinforcement or incorporated material (modifying material). The special mechanical and physical properties of the reinforcements are used to enhance the matrix properties. Wide variety of matrix and incorporated materials allow different combinations and creations of material properties unavailable from the individual constituent materials. If the mixture of the constituents is uniform, one talks about homogeneous material. If not, two or more phases are present and the composition can easily be identified. If the properties of the material are dependent on direction one talks about anisotropic material, else isotropic material. Metal ion implantation incorporates metal ions (Au or Ti ions) inside of the target (PDMS), which will lead to a new composite, heterogeneous and anisotropic material with properties of both constituents. There are two sorts of modifications following the implantation: a) radiation induced chemical modifications of the polymer, and b) the inclusion of metal particles in the PDMS, leading to a composite of two materials with very different properties: hard metal particles in relatively soft polymer matrix. In Chapter 3 some consequences of ion implantation on the properties of polymers were reviewed. High energy, high fluence ion implantation can transform the insulating polymer to a conductive material by creating carbonaceous domains that are produced through the energy losses resulting in chain-scissions. Also, the evaporation of the volatile molecules as well as the recombination of the broken chains increases polymer density and hardness. In the case of PDMS this can even change the elastic material to very rigid and hard material, e.g. by forming SiO2. For the ion doses, ion energies and materials studied in this thesis, these effects are not as important as the inclusion on metal nanoparticles in the polymer, but they must not be forgotten. Details of the microstructure will be given in chapter 6.
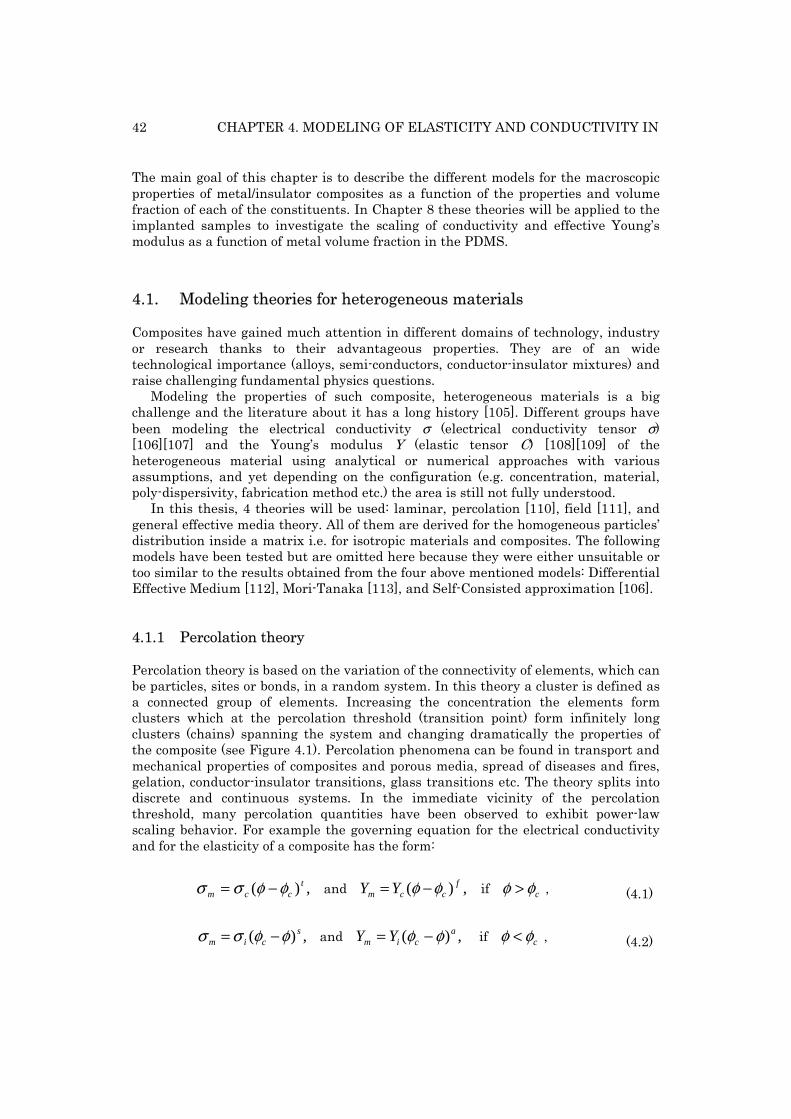
42 CHAPTER 4. MODELING OF ELASTICITY AND CONDUCTIVITY IN
The main goal of this chapter is to describe the different models for the macroscopic properties of metal/insulator composites as a function of the properties and volume fraction of each of the constituents. In Chapter 8 these theories will be applied to the implanted samples to investigate the scaling of conductivity and effective Young’s modulus as a function of metal volume fraction in the PDMS.
4.1. Modeling theories for heterogeneous materials
Composites have gained much attention in different domains of technology, industry or research thanks to their advantageous properties. They are of an wide technological importance (alloys, semi-conductors, conductor-insulator mixtures) and raise challenging fundamental physics questions.
Modeling the properties of such composite, heterogeneous materials is a big challenge and the literature about it has a long history [105]. Different groups have been modeling the electrical conductivity σ (electrical conductivity tensor σ) [106][107] and the Young’s modulus Y (elastic tensor C) [108][109] of the heterogeneous material using analytical or numerical approaches with various assumptions, and yet depending on the configuration (e.g. concentration, material, poly-dispersivity, fabrication method etc.) the area is still not fully understood.
In this thesis, 4 theories will be used: laminar, percolation [110], field [111], and general effective media theory. All of them are derived for the homogeneous particles’ distribution inside a matrix i.e. for isotropic materials and composites. The following models have been tested but are omitted here because they were either unsuitable or too similar to the results obtained from the four above mentioned models: Differential Effective Medium [112], Mori-Tanaka [113], and Self-Consisted approximation [106].
4.1.1 Percolation theory
Percolation theory is based on the variation of the connectivity of elements, which can be particles, sites or bonds, in a random system. In this theory a cluster is defined as a connected group of elements. Increasing the concentration the elements form clusters which at the percolation threshold (transition point) form infinitely long clusters (chains) spanning the system and changing dramatically the properties of the composite (see Figure 4.1). Percolation phenomena can be found in transport and mechanical properties of composites and porous media, spread of diseases and fires, gelation, conductor-insulator transitions, glass transitions etc. The theory splits into discrete and continuous systems. In the immediate vicinity of the percolation threshold, many percolation quantities have been observed to exhibit power-law scaling behavior. For example the governing equation for the electrical conductivity and for the elasticity of a composite has the form:
,)( tccm φφσσ −= and ,)( f
ccm YY φφ −= if cφφ > ,
(4.1)
,)( scim φφσσ −= and ,)( a
cim YY φφ −= if cφφ < ,
(4.2)
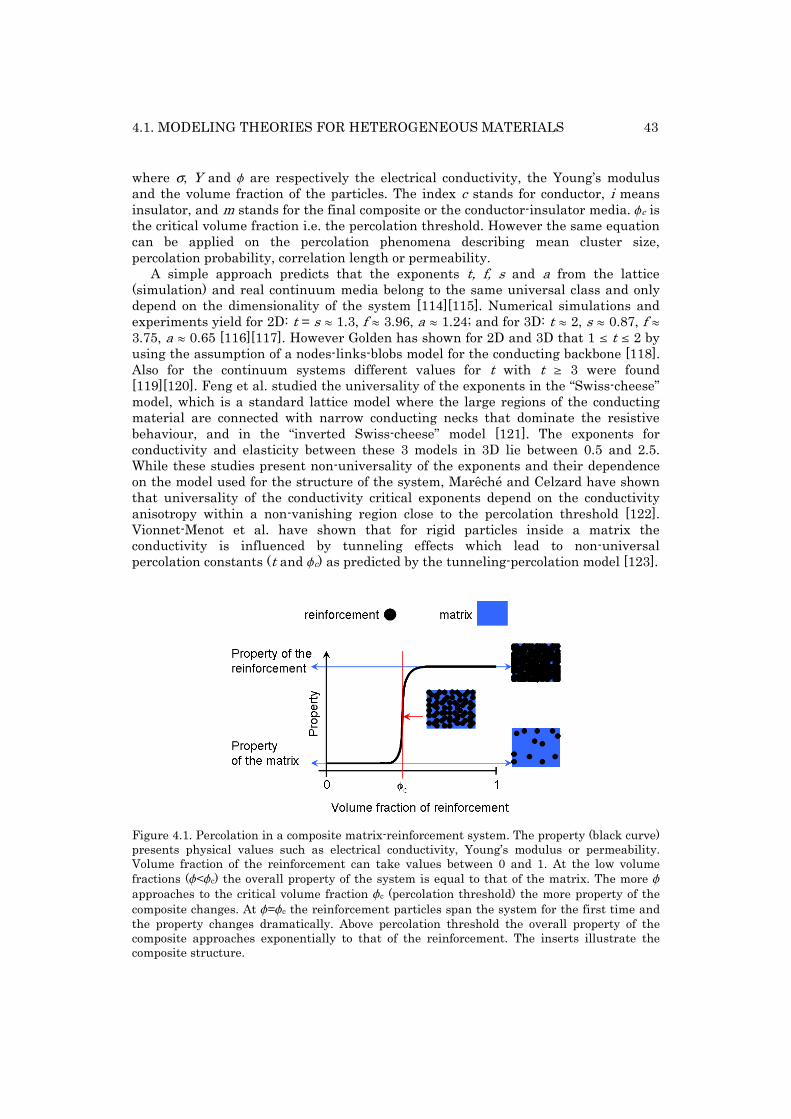
4.1. MODELING THEORIES FOR HETEROGENEOUS MATERIALS 43
where σ, Y and f are respectively the electrical conductivity, the Young’s modulus and the volume fraction of the particles. The index c stands for conductor, i means insulator, and m stands for the final composite or the conductor-insulator media. fc is the critical volume fraction i.e. the percolation threshold. However the same equation can be applied on the percolation phenomena describing mean cluster size, percolation probability, correlation length or permeability.
A simple approach predicts that the exponents t, f, s and a from the lattice (simulation) and real continuum media belong to the same universal class and only depend on the dimensionality of the system [114][115]. Numerical simulations and experiments yield for 2D: t = s º 1.3, f º 3.96, a º 1.24; and for 3D: t º 2, s º 0.87, f º 3.75, a º 0.65 [116][117]. However Golden has shown for 2D and 3D that 1 § t § 2 by using the assumption of a nodes-links-blobs model for the conducting backbone [118]. Also for the continuum systems different values for t with t ¥ 3 were found [119][120]. Feng et al. studied the universality of the exponents in the “Swiss-cheese” model, which is a standard lattice model where the large regions of the conducting material are connected with narrow conducting necks that dominate the resistive behaviour, and in the “inverted Swiss-cheese” model [121]. The exponents for conductivity and elasticity between these 3 models in 3D lie between 0.5 and 2.5. While these studies present non-universality of the exponents and their dependence on the model used for the structure of the system, Marêché and Celzard have shown that universality of the conductivity critical exponents depend on the conductivity anisotropy within a non-vanishing region close to the percolation threshold [122]. Vionnet-Menot et al. have shown that for rigid particles inside a matrix the conductivity is influenced by tunneling effects which lead to non-universal percolation constants (t and fc) as predicted by the tunneling-percolation model [123].
Figure 4.1. Percolation in a composite matrix-reinforcement system. The property (black curve) presents physical values such as electrical conductivity, Young’s modulus or permeability. Volume fraction of the reinforcement can take values between 0 and 1. At the low volume fractions (f<fc) the overall property of the system is equal to that of the matrix. The more f approaches to the critical volume fraction fc (percolation threshold) the more property of the composite changes. At f=fc the reinforcement particles span the system for the first time and the property changes dramatically. Above percolation threshold the overall property of the composite approaches exponentially to that of the reinforcement. The inserts illustrate the composite structure.
44 CHAPTER 4. MODELING OF ELASTICITY AND CONDUCTIVITY IN
4.1.2 General effective media theory
As shown in previous section the percolation transition is actually a critical phenomenon of a second-order phase transition. Thus Eq. (4.1) and Eq. (4.2) are defined either above or below the critical point fc. McLachlan et al. proposed general effective media (GEM) equation that describes the percolation mechanism of a binary composite system over the whole range of the volume fraction, from 0 to 1 [119][125]. It is based on the percolation and effective medium theories, obtained through interpolation. The modified version of it contains the above mentioned 2 exponent a (or s) and f (or t), the volume fraction 0 § fc § 1, as well as the Young’s modules of the mixtures and of the composite Yc, Yi, and Ym (or in the case of conductivity σc , σi , and σm).
0)())(1(
/1/1
/1/1
/1/1
//1
=+
−+−
−−f
mf
c
fm
fc
am
ai
afm
ai
AYY
YY
AYY
YY φφ, (4.3)
with A=(1-fc)/ fc. One can verify that Eq. (4.3) reduces to the Eqs. (4.1) and (4.2) when Yc (σc ) Ø ¶ or Yi (σi) = 0.
4.1.3 Field theories
The effective properties of random heterogeneous media can rarely be determined exactly. By using the solution of the boundary value problem of the relevant field for a single inclusion of one material in a matrix of another material, it is possible to make estimates of the effective properties of heterogeneous media. These estimates include a variety of effective-medium type approximations, effective properties of dispersions in the dilute-concentration limit, and rigorous bounds on the effective properties. The notion “bound” means the physical limit of the overall composite property (conductivity, Young’s modulus …) calculated with the individual properties of the constituents and with the other information on the composite (e.g. structure) that must not be exceeded. The “bounds” are applied as a sort of statistical descriptors because they incorporate the information about the microstructure through statistical functions; the more information one includes in statistics, the sharper is the estimation by bounds. The formulas for the Young’s modulus Y are derived by using the relation Y = 3G(1 + n), with n as the Poisson’s ratio and G as the shear modulus.
Maxwell approximation or Coated spheres model (Hashin-Shtrikman Two-Point-Bounds)
Suppose two materials composing a mixture with σ2 > σ1; f1 and f2 being the volume fraction of the matrix and the incorporating particles respectively. The following equation was determined by Maxwell in 1873 [105] and by Hashin and Shtrikman 1962 [126]:
4.1. MODELING THEORIES FOR HETEROGENEOUS MATERIALS 45
Lσσσσσφφσ
φφ =
+−
−1
21221
2~)(
and Uσσσσσφφσ
φφ =
+−
−2
21221
2~)(
, (4.4)
where the indexes U and L stand for the upper and lower bound respectively. The analog equation for the Young’s modulus can be derived:
LYYY
YYY =
+−−
2/~
)(
1
21221
φ
φ
φφ and UY
YY
YYY =
+−−
2/~
)(
2
21221
φ
φ
φφ, (4.5)
where for any property c one has c1 f1 + c2 f2 = ⟨c⟩f and φ
φφ ccc ~1221 =+ .
These equations can be used to estimate the electrical conductivity and the Young’s modulus of a composite at dilute and non-dilute conditions, provided the incorporated particles inside the matrix are well separated from each other. Thus if σ2 Ø ¶ and σ1 = 0 ( or Y2 Ø ¶ and Y1 = 0) only at the trivial threshold f2 = 1 the composite is conductive (or rigid).
Three-Point Bounds
These bounds depend not only on the volume fraction but also on the three-point microstructural parameters zi and hi that are a multidimensional integrals involving the three-point probability function S3. Since there are improved upon the One- and Two-Point-Bounds they should provide relatively sharper estimates of the effective properties.
Lσσσσσφφσ
ζφ
φ =+
−− −− 11
21221
2~)(
and Uσσσσσφφσ
ζφφ =
+−
−2~
)( 21221 , (4.6)
where 11
1221
21 −−=+ ζ
σσζσζ
σσ.
A similar equation for the Young’s modulus can be derived:
LYY
YYY =
Ξ+−− ~
)( 21221φφ
and UYY
YYY =
Θ+−− ~
)( 21221φφ
, (4.7)
where X = X (Y, z, h) and Q = Q (Y, z, h) (refer to [127]). A detailed explanation on the derivation of the bounds and the meaning of the therein mentioned parameters would go beyond the scope of this article, but the reader can refer to [107][127]. Concerning the determination of structural parameters
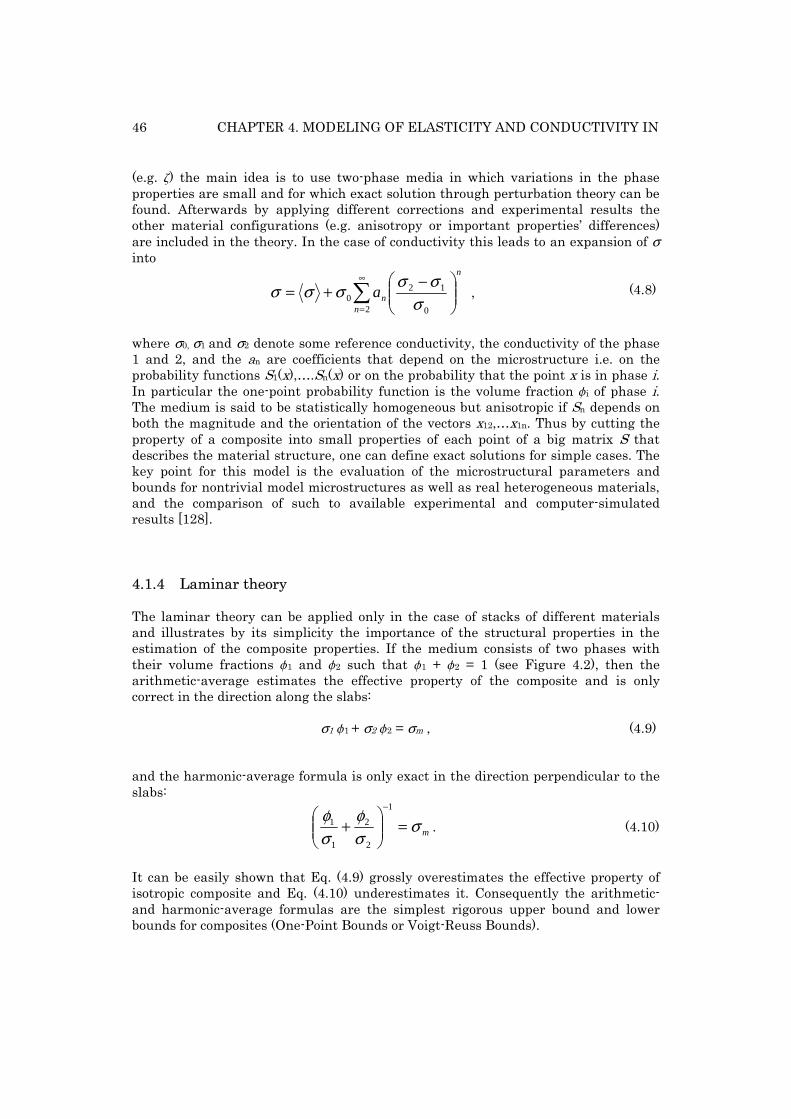
46 CHAPTER 4. MODELING OF ELASTICITY AND CONDUCTIVITY IN
(e.g. z) the main idea is to use two-phase media in which variations in the phase properties are small and for which exact solution through perturbation theory can be found. Afterwards by applying different corrections and experimental results the other material configurations (e.g. anisotropy or important properties’ differences) are included in the theory. In the case of conductivity this leads to an expansion of σ into
n
nna ⎟⎟
⎠
⎞⎜⎜⎝
⎛ −+= ∑
∞
= 0
12
20 σ
σσσσσ ,
(4.8)
where σ0, σ1 and σ2 denote some reference conductivity, the conductivity of the phase 1 and 2, and the an are coefficients that depend on the microstructure i.e. on the probability functions S1(x),….Sn(x) or on the probability that the point x is in phase i. In particular the one-point probability function is the volume fraction fi of phase i. The medium is said to be statistically homogeneous but anisotropic if Sn depends on both the magnitude and the orientation of the vectors x12,…x1n. Thus by cutting the property of a composite into small properties of each point of a big matrix S that describes the material structure, one can define exact solutions for simple cases. The key point for this model is the evaluation of the microstructural parameters and bounds for nontrivial model microstructures as well as real heterogeneous materials, and the comparison of such to available experimental and computer-simulated results [128].
4.1.4 Laminar theory
The laminar theory can be applied only in the case of stacks of different materials and illustrates by its simplicity the importance of the structural properties in the estimation of the composite properties. If the medium consists of two phases with their volume fractions f1 and f2 such that f1 + f2 = 1 (see Figure 4.2), then the arithmetic-average estimates the effective property of the composite and is only correct in the direction along the slabs:
σ1 f1 + σ2 f2 = σm , (4.9)
and the harmonic-average formula is only exact in the direction perpendicular to the slabs:
mσσφ
σφ
=⎟⎟⎠
⎞⎜⎜⎝
⎛+
−1
2
2
1
1 . (4.10)
It can be easily shown that Eq. (4.9) grossly overestimates the effective property of isotropic composite and Eq. (4.10) underestimates it. Consequently the arithmetic- and harmonic-average formulas are the simplest rigorous upper bound and lower bounds for composites (One-Point Bounds or Voigt-Reuss Bounds).
4.2. UNIVERSAL SCALING FOR THE RADIATION INDUCED POLYMER MODIFICATIONS
47
Figure 4.2. 2-stacks or binary composite system. Dependent on the direction of the measurements, the overall maximal or the minimal values of the composite are measured.
4.2. Universal scaling for the radiation induced polymer modifications
It has been clear since the early days of ion implantation onto polymers that to describe the change in the polymer’s properties it is not a sufficient measure to consider only the total deposited energy. The changes in properties scale reasonably with the energy density ΦSe, the product of the fluence (dose) Φ and the electronic energy loss Se, as it was known from radiobiology. Costatini and Salvetat introduced another scaling with the product of deposited electronic energy density and electronic energy loss ΦSe2 [96]. An unambiguous decision between these two scalings is difficult. With the time it has been shown the best correlation is given by
nSeM Φ∝ ,
(4.11)
with 1.5 < n < 2.5 [97]. The electronic energy loss, also called electronic stopping power, of ions in compounds is given by Se = ckkLSK ½ ,with K being the ion energy, kLS being the Lindhard-Scharff constant, and ck the correction factor [98][99]. The latter takes the values between 0.2 and 2, increases with the energy and the atomic number. Thus if n = 2 the dependence of a property scales linearly with the acceleration energy K.
However these types of scaling are insufficient and the reason for it lies in averaging the mean energy deposited per unit volume of material over the entire sample, which is not a good parameter to describe the modification process. For example the initial velocity of the ion should not be kept constant from begin till the end of its penetration path. Experiments have revealed a strong nonlinear dependence of the stopping power and that cooperative effects within single ion track play an important role in the damage induced [100]. Thus low-energy light ions may damage polymers even more than high-energy heavy ions.
Quantification of the modifications is better described by the damage cross-section β for the various modification processes. It is a quantity introduced to quantify the effective damage zone around the path of the impacting ion. This zone is produced by secondary electrons creating multiple ionization events. Directly by measuring the
48 CHAPTER 4. MODELING OF ELASTICITY AND CONDUCTIVITY IN
impact features or latent tracks (e.g. by microscopy) or indirectly by monitoring the changes in the physicochemical properties of the target with various techniques (e.g. IR spectroscopy, optical properties, degree of crystallinity etc.) one can quantify the damage. In the latter case the size of the damage zones can be extracted from the evolution of the signal characteristic of the pristine material M, as a function of fluence Φ :
)exp()( 0 βΦ−=Φ MM .
(4.12)
The equation is to explain by the fact that the modifications introduced by different impacting ions are a series of statistically independent events, and the probability of creating further damage after a certain number of impacts is proportional to the undamaged area of the target.
The above-mentioned scalings have been used in many researches [101]-[104]. However till nowadays no universal scaling has been found.
4.2.1 Closing remarks
A big challenge in this work has been to determine the properties of the composite created by implanted ions and PDMS. Only the first 100 nm of the 30 μm thick PDMS membrane contains implanted ions. Therefore the first step will be by using the laminar theory to separate the implanted PDMS layer from the non-implanted into two stacks, and through that to extract the physical properties of the first one from the pristine properties of the non-implanted PDMS.
The field theory can be used to estimate the electrical conductivity and the Young’s modulus of a composite at dilute and non-dilute conditions, provided the incorporated particles inside the matrix are well separated from each other. The TEM micrographs will though show that this is not the case for PDMS implanted samples. Already before percolation threshold the ions aggregate into bigger particles which at the percolation threshold enter in contact. Consequently one should not expect the field theories to be best suited for the modeling of the results. On the other hand at very diluted conditions the small number of data points does not allow making any important statements about the composite structure or properties related to Eq. (4.6) and (4.7) by means of the microstructural parameters zi and hi. For both Young’s modulus and electrical conductivity, one can just say for all the measurements they are within the physical extreme limits (upper and lower bounds) given by Eq. (4.4) and (4.5). It will be shown on an example of conductivity that these theories are not well suited to describe the physical properties for the ion implanted PDMS.
It will be shown that the implanted PDMS samples present percolative behaviour for both measurements: electrical conductivity and Young’s modulus. Thus the best fits will be obtained with percolation theory. The volume fractions of the ions respectively to PDMS at which the percolation occurs, also called the percolation threshold, lie around 0.1 and 0.2. These values are not in agreement with the theoretically predicted values. However in practice no universal values for fc and t are observed, because details of the microstructure lead to different results as reviewed in [123]. The percolation threshold has been reported from as low as 0.003 for carbon nanotubes [124] and greater than 0.4 for granular metals [123]. Other percolation parameters will also be discussed.
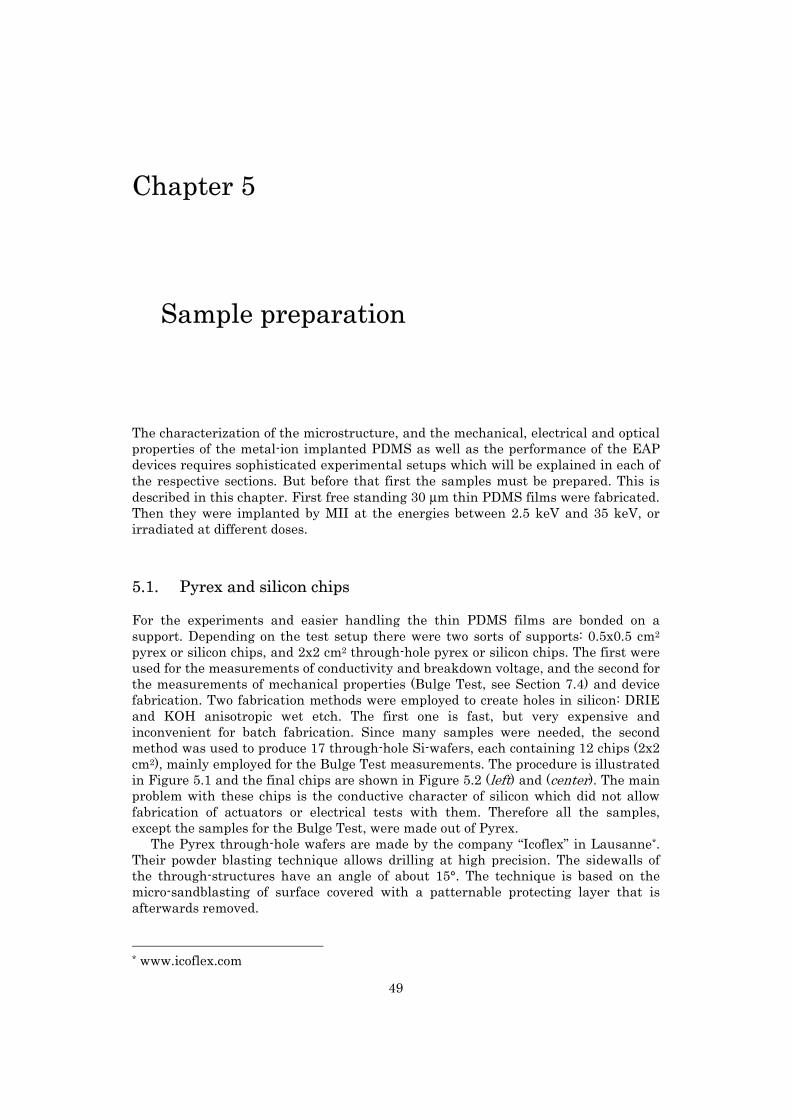
49
Chapter 5
5. Sample preparation
The characterization of the microstructure, and the mechanical, electrical and optical properties of the metal-ion implanted PDMS as well as the performance of the EAP devices requires sophisticated experimental setups which will be explained in each of the respective sections. But before that first the samples must be prepared. This is described in this chapter. First free standing 30 μm thin PDMS films were fabricated. Then they were implanted by MII at the energies between 2.5 keV and 35 keV, or irradiated at different doses.
5.1. Pyrex and silicon chips
For the experiments and easier handling the thin PDMS films are bonded on a support. Depending on the test setup there were two sorts of supports: 0.5x0.5 cm2 pyrex or silicon chips, and 2x2 cm2 through-hole pyrex or silicon chips. The first were used for the measurements of conductivity and breakdown voltage, and the second for the measurements of mechanical properties (Bulge Test, see Section 7.4) and device fabrication. Two fabrication methods were employed to create holes in silicon: DRIE and KOH anisotropic wet etch. The first one is fast, but very expensive and inconvenient for batch fabrication. Since many samples were needed, the second method was used to produce 17 through-hole Si-wafers, each containing 12 chips (2x2 cm2), mainly employed for the Bulge Test measurements. The procedure is illustrated in Figure 5.1 and the final chips are shown in Figure 5.2 (left) and (center). The main problem with these chips is the conductive character of silicon which did not allow fabrication of actuators or electrical tests with them. Therefore all the samples, except the samples for the Bulge Test, were made out of Pyrex.
The Pyrex through-hole wafers are made by the company “Icoflex” in Lausanne*. Their powder blasting technique allows drilling at high precision. The sidewalls of the through-structures have an angle of about 15°. The technique is based on the micro-sandblasting of surface covered with a patternable protecting layer that is afterwards removed.
* www.icoflex.com
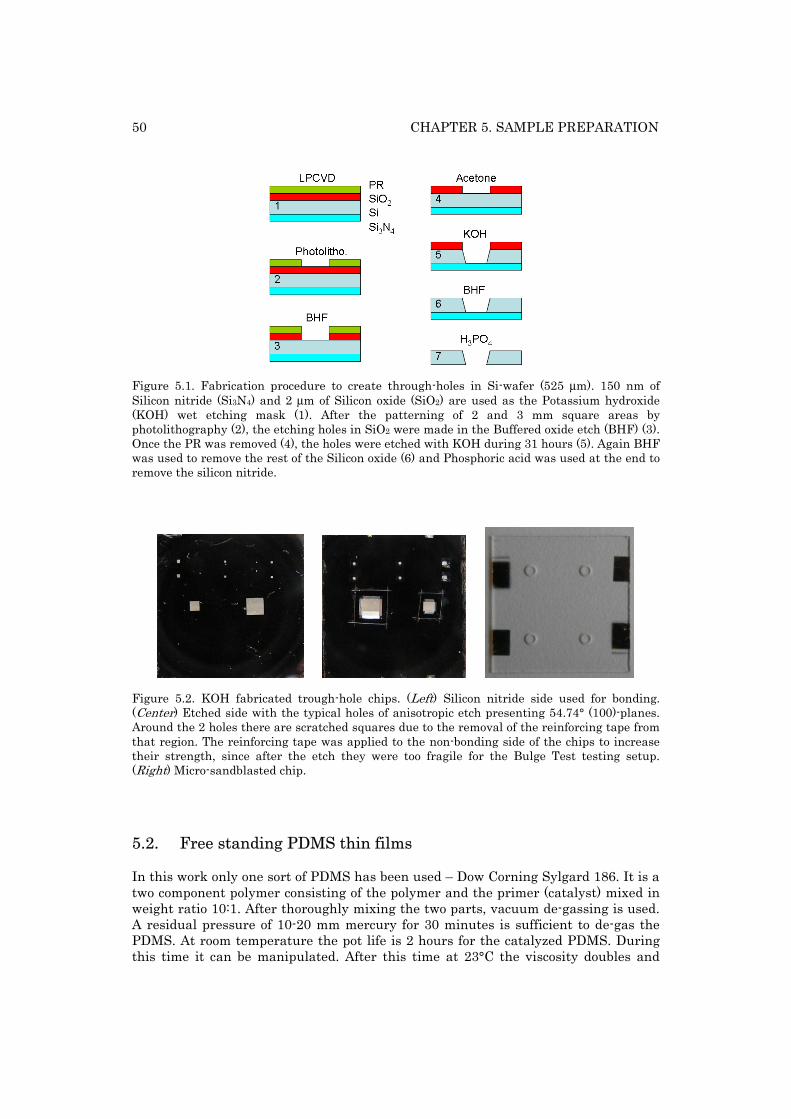
50 CHAPTER 5. SAMPLE PREPARATION
Figure 5.1. Fabrication procedure to create through-holes in Si-wafer (525 μm). 150 nm of Silicon nitride (Si3N4) and 2 μm of Silicon oxide (SiO2) are used as the Potassium hydroxide (KOH) wet etching mask (1). After the patterning of 2 and 3 mm square areas by photolithography (2), the etching holes in SiO2 were made in the Buffered oxide etch (BHF) (3). Once the PR was removed (4), the holes were etched with KOH during 31 hours (5). Again BHF was used to remove the rest of the Silicon oxide (6) and Phosphoric acid was used at the end to remove the silicon nitride.
Figure 5.2. KOH fabricated trough-hole chips. (Left) Silicon nitride side used for bonding. (Center) Etched side with the typical holes of anisotropic etch presenting 54.74° (100)-planes. Around the 2 holes there are scratched squares due to the removal of the reinforcing tape from that region. The reinforcing tape was applied to the non-bonding side of the chips to increase their strength, since after the etch they were too fragile for the Bulge Test testing setup. (Right) Micro-sandblasted chip.
5.2. Free standing PDMS thin films
In this work only one sort of PDMS has been used – Dow Corning Sylgard 186. It is a two component polymer consisting of the polymer and the primer (catalyst) mixed in weight ratio 10:1. After thoroughly mixing the two parts, vacuum de-gassing is used. A residual pressure of 10-20 mm mercury for 30 minutes is sufficient to de-gas the PDMS. At room temperature the pot life is 2 hours for the catalyzed PDMS. During this time it can be manipulated. After this time at 23°C the viscosity doubles and
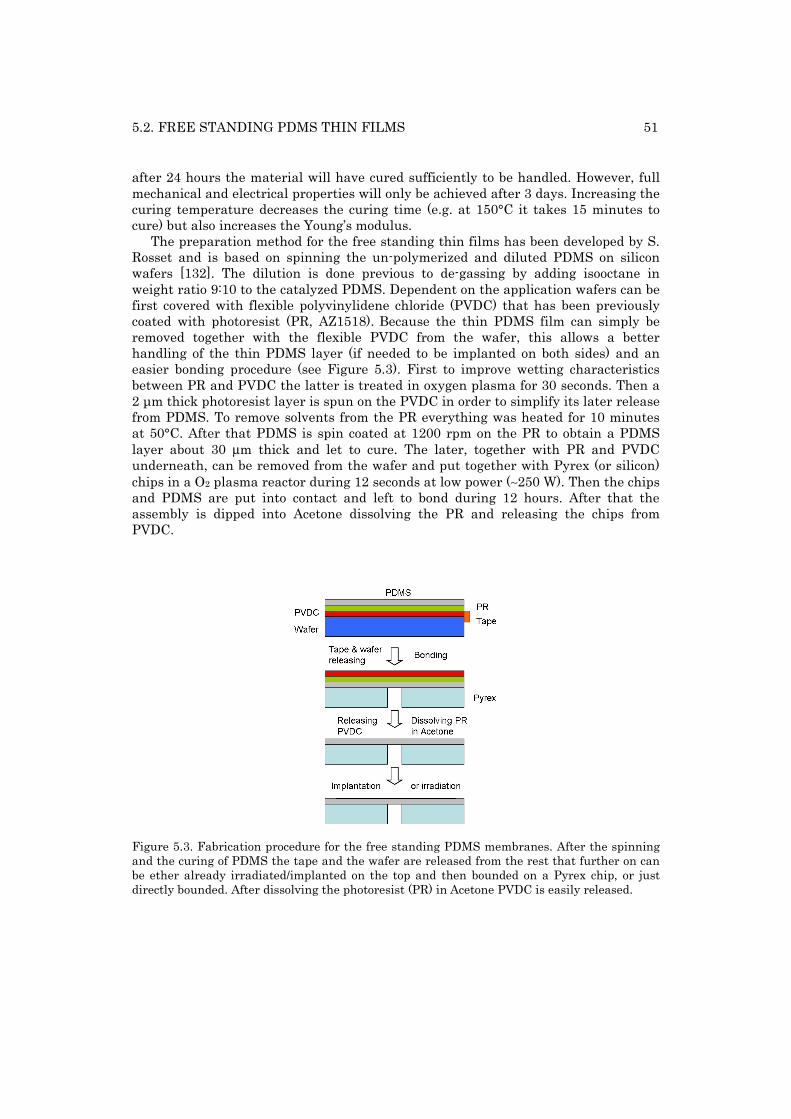
5.2. FREE STANDING PDMS THIN FILMS 51
after 24 hours the material will have cured sufficiently to be handled. However, full mechanical and electrical properties will only be achieved after 3 days. Increasing the curing temperature decreases the curing time (e.g. at 150°C it takes 15 minutes to cure) but also increases the Young’s modulus.
The preparation method for the free standing thin films has been developed by S. Rosset and is based on spinning the un-polymerized and diluted PDMS on silicon wafers [132]. The dilution is done previous to de-gassing by adding isooctane in weight ratio 9:10 to the catalyzed PDMS. Dependent on the application wafers can be first covered with flexible polyvinylidene chloride (PVDC) that has been previously coated with photoresist (PR, AZ1518). Because the thin PDMS film can simply be removed together with the flexible PVDC from the wafer, this allows a better handling of the thin PDMS layer (if needed to be implanted on both sides) and an easier bonding procedure (see Figure 5.3). First to improve wetting characteristics between PR and PVDC the latter is treated in oxygen plasma for 30 seconds. Then a 2 μm thick photoresist layer is spun on the PVDC in order to simplify its later release from PDMS. To remove solvents from the PR everything was heated for 10 minutes at 50°C. After that PDMS is spin coated at 1200 rpm on the PR to obtain a PDMS layer about 30 μm thick and let to cure. The later, together with PR and PVDC underneath, can be removed from the wafer and put together with Pyrex (or silicon) chips in a O2 plasma reactor during 12 seconds at low power (∼250 W). Then the chips and PDMS are put into contact and left to bond during 12 hours. After that the assembly is dipped into Acetone dissolving the PR and releasing the chips from PVDC.
Figure 5.3. Fabrication procedure for the free standing PDMS membranes. After the spinning and the curing of PDMS the tape and the wafer are released from the rest that further on can be ether already irradiated/implanted on the top and then bounded on a Pyrex chip, or just directly bounded. After dissolving the photoresist (PR) in Acetone PVDC is easily released.
52 CHAPTER 5. SAMPLE PREPARATION
5.3. Implantation
At the beginning of the project one of the main questions was which sort of the implanter to use: LEI or FCVA?
LEI was done at the Research center Forschungszentrum Dresden-Rossendorf, Germany, where 10 keV and 35 keV, Gold and Titanium implantations have been performed as well as dose measurements by Rutherford Backscattering Spectrometry (RBS).
FCVA implantations were done with our own instrument. Again Gold and Titanium were implanted but with bias voltages of 1.26 kV, 2.5 kV, and 5 kV (corresponding to initial ion energies at the beginning of each pulse of 2.5 keV, 5 keV and 10 keV). The calibration of dose has been done thanks to the RBS measurements performed at the Paul Scherrer Institute (PSI).
In both cases the implantation doses were between 0.1x10¹⁶ at/cm2 and 5x10¹⁶ at/cm2. Nevertheless dependent on the presented experiment in this document the results may be shown only in some parts of this domain. Mostly the measurements will lie between 1x10¹⁶ at/cm2 and 2.3x10¹⁶ at/cm2 since this presents the area of interests for the wanted performances of the subsequent EAP devices – good conductivity and low stiffness.
5.4. Sputtering
Gold implantations of PDMS with LEI with doses above 3.11x10¹⁶ at/cm2 could not be made. Figure 5.4 presents the real implanted dose of gold, as measured by RBS after the implantation, as a function of the estimated ion dose, which is obtained by knowing the ion flux and the duration of the implantation. One can see that after 2x10¹⁶ at/cm2 for both energies the implanted doses deviate from the estimated doses. While for 10 keV the curve continuously saturates at around 2.6x10¹⁶ at/cm2 for 35 keV it drops and then reaches its maximal value of 3.11x10¹⁶ at/cm2.
The reason for this observation lies in sputtering, which is a process driven by momentum exchange between the ions and atoms in the material due to collisions. The consequence of this is the ejection of atoms from the surface of the sample. Metal ions, metal clusters, as well as PDMS molecules, can be ejected. The number of atoms ejected from the surface per incident particle is the sputter yield. Sputter yield depends on the energy of the incident ions, the masses of the ions and target atoms, and the binding energy of atoms in the solid. Unlike for the pure elements [133][134] there is little published research on the sputtering of complex compounds. The conditions used in this work were simulated with the program TRIM, Figure 5.5. However since TRIM doesn’t take into account the ions that already have been implanted, the program was used in a manual iterative manner modifying at each step the composition of the implanted target with the additional dose of implanted ions resulting from the former cycle. Simulations showed an important high sputter yield for the used energies and high doses. At 10 keV there are about 2 atoms for gold and about 1 atom for titanium implantation that are ejected from the surface for each incident ion. By increasing the energy or the dose these rates increase and reach at 2x10¹⁶ at/cm2 almost 6 atom/ion for Gold and 2 atom/ion for Titanium. This cannot be neglected. Figure 5.6 illustrates the expected distribution of the implanted ions once sputtering is taken into account. Not only that the metallic layer is no longer buried
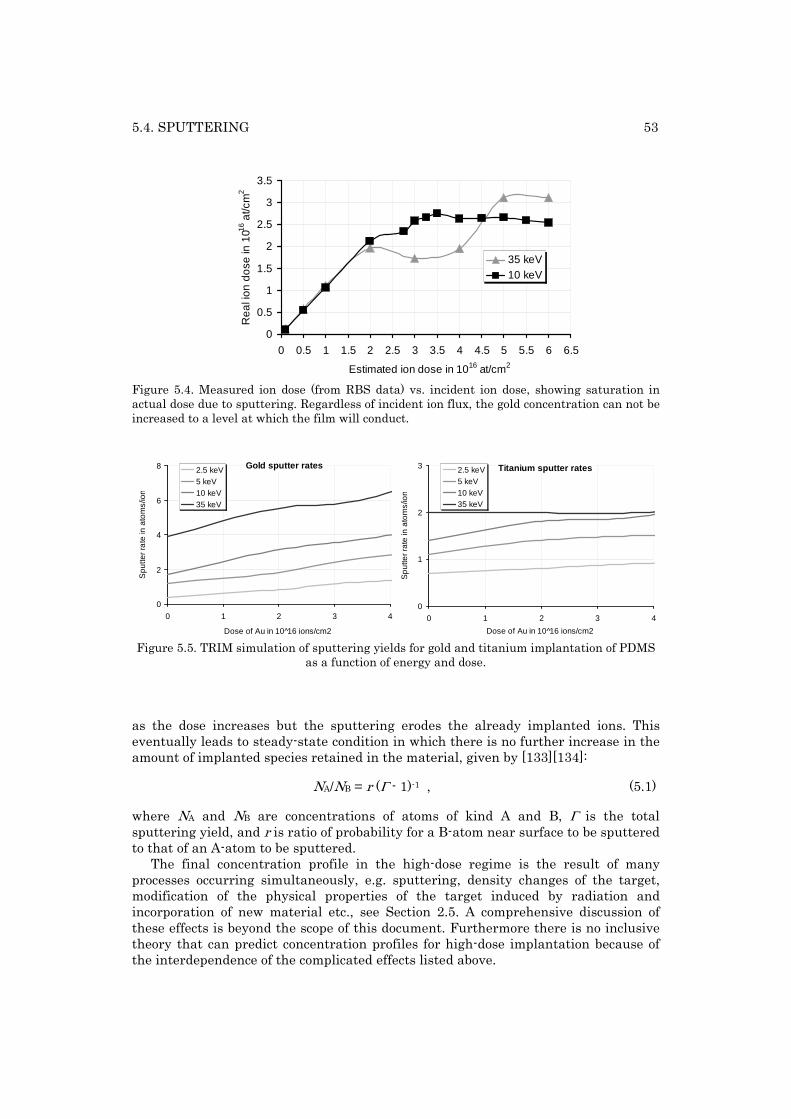
5.4. SPUTTERING 53
0
0.5
1
1.5
2
2.5
3
3.5
0 0.5 1 1.5 2 2.5 3 3.5 4 4.5 5 5.5 6 6.5
Estimated ion dose in 1016 at/cm2
Re
al i
on d
ose
in 1
016 a
t/cm
2
35 keV10 keV
Figure 5.4. Measured ion dose (from RBS data) vs. incident ion dose, showing saturation in actual dose due to sputtering. Regardless of incident ion flux, the gold concentration can not be increased to a level at which the film will conduct.
0
2
4
6
8
0 1 2 3 4
Dose of Au in 10 16 ions/cm2
Spu
tter
rate
in a
tom
s/io
n
2.5 keV5 keV10 keV 35 keV
Gold sputter rates
0
1
2
3
0 1 2 3 4
Dose of Au in 10 16 ions/cm2
Sp
utte
r rat
e in
ato
ms/
ion
2.5 keV5 keV10 keV 35 keV
Titanium sputter rates
Figure 5.5. TRIM simulation of sputtering yields for gold and titanium implantation of PDMS
as a function of energy and dose.
as the dose increases but the sputtering erodes the already implanted ions. This eventually leads to steady-state condition in which there is no further increase in the amount of implanted species retained in the material, given by [133][134]:
NA/NB = r (Γ - 1)-1 , (5.1)
where NA and NB are concentrations of atoms of kind A and B, Γ is the total sputtering yield, and r is ratio of probability for a B-atom near surface to be sputtered to that of an A-atom to be sputtered.
The final concentration profile in the high-dose regime is the result of many processes occurring simultaneously, e.g. sputtering, density changes of the target, modification of the physical properties of the target induced by radiation and incorporation of new material etc., see Section 2.5. A comprehensive discussion of these effects is beyond the scope of this document. Furthermore there is no inclusive theory that can predict concentration profiles for high-dose implantation because of the interdependence of the complicated effects listed above.
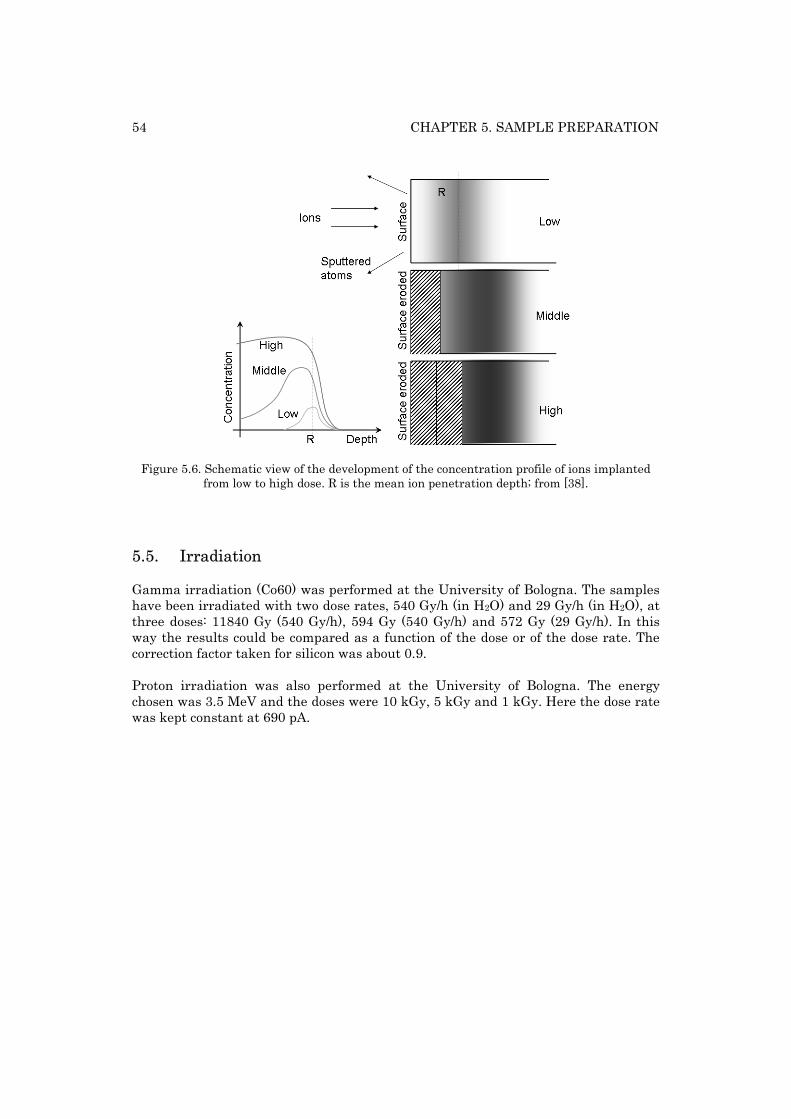
54 CHAPTER 5. SAMPLE PREPARATION
Figure 5.6. Schematic view of the development of the concentration profile of ions implanted from low to high dose. R is the mean ion penetration depth; from [38].
5.5. Irradiation
Gamma irradiation (Co60) was performed at the University of Bologna. The samples have been irradiated with two dose rates, 540 Gy/h (in H2O) and 29 Gy/h (in H2O), at three doses: 11840 Gy (540 Gy/h), 594 Gy (540 Gy/h) and 572 Gy (29 Gy/h). In this way the results could be compared as a function of the dose or of the dose rate. The correction factor taken for silicon was about 0.9. Proton irradiation was also performed at the University of Bologna. The energy chosen was 3.5 MeV and the doses were 10 kGy, 5 kGy and 1 kGy. Here the dose rate was kept constant at 690 pA.
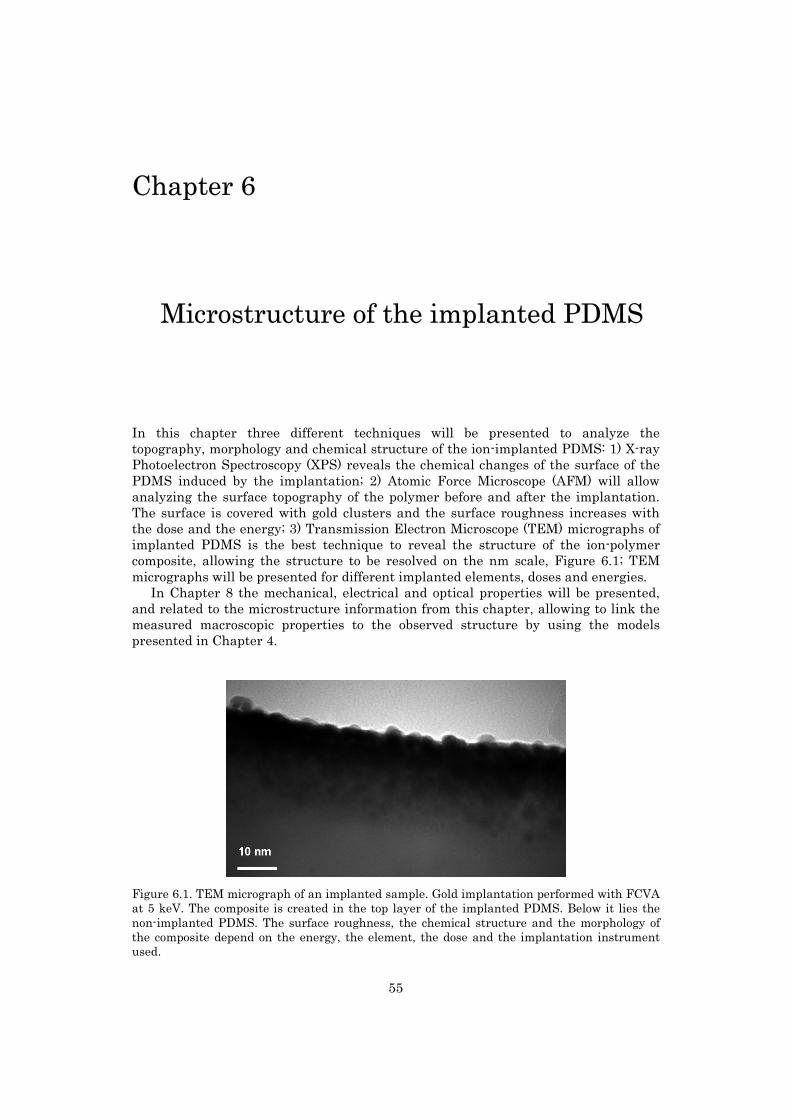
55
Chapter 6
6. Microstructure of the implanted PDMS
In this chapter three different techniques will be presented to analyze the topography, morphology and chemical structure of the ion-implanted PDMS: 1) X-ray Photoelectron Spectroscopy (XPS) reveals the chemical changes of the surface of the PDMS induced by the implantation; 2) Atomic Force Microscope (AFM) will allow analyzing the surface topography of the polymer before and after the implantation. The surface is covered with gold clusters and the surface roughness increases with the dose and the energy; 3) Transmission Electron Microscope (TEM) micrographs of implanted PDMS is the best technique to reveal the structure of the ion-polymer composite, allowing the structure to be resolved on the nm scale, Figure 6.1; TEM micrographs will be presented for different implanted elements, doses and energies.
In Chapter 8 the mechanical, electrical and optical properties will be presented, and related to the microstructure information from this chapter, allowing to link the measured macroscopic properties to the observed structure by using the models presented in Chapter 4.
Figure 6.1. TEM micrograph of an implanted sample. Gold implantation performed with FCVA at 5 keV. The composite is created in the top layer of the implanted PDMS. Below it lies the non-implanted PDMS. The surface roughness, the chemical structure and the morphology of the composite depend on the energy, the element, the dose and the implantation instrument used.
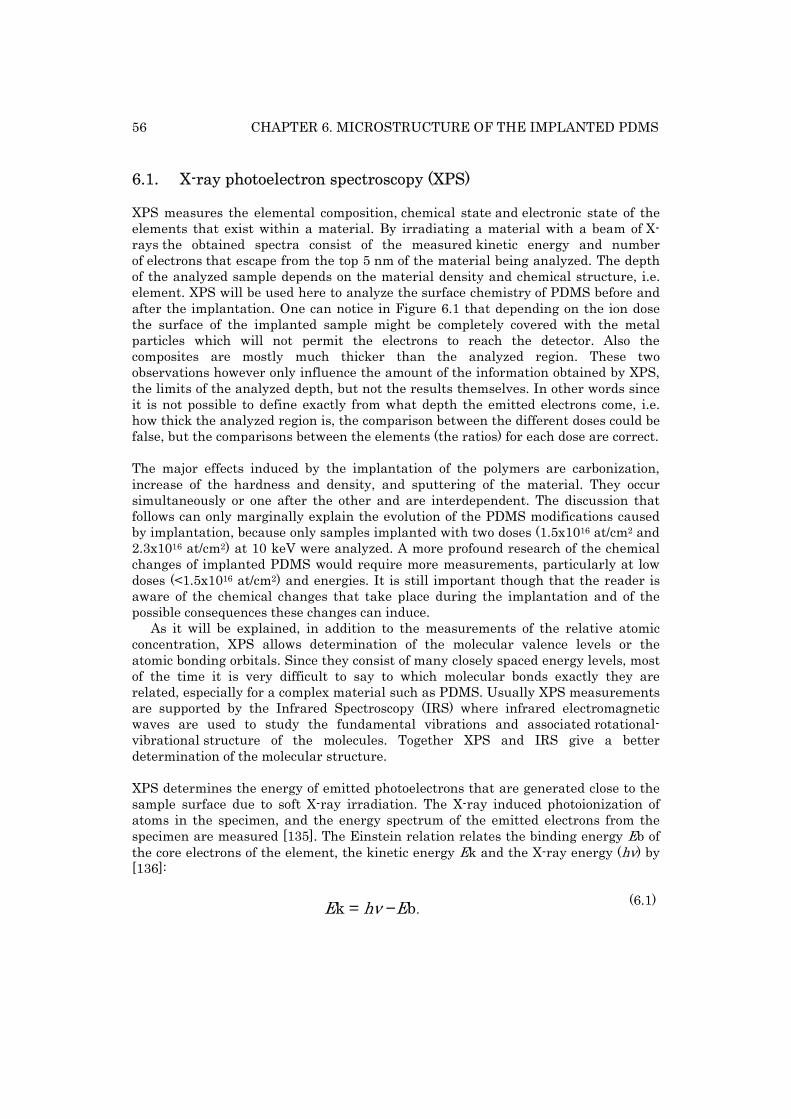
56 CHAPTER 6. MICROSTRUCTURE OF THE IMPLANTED PDMS
6.1. X-ray photoelectron spectroscopy (XPS)
XPS measures the elemental composition, chemical state and electronic state of the elements that exist within a material. By irradiating a material with a beam of X-rays the obtained spectra consist of the measured kinetic energy and number of electrons that escape from the top 5 nm of the material being analyzed. The depth of the analyzed sample depends on the material density and chemical structure, i.e. element. XPS will be used here to analyze the surface chemistry of PDMS before and after the implantation. One can notice in Figure 6.1 that depending on the ion dose the surface of the implanted sample might be completely covered with the metal particles which will not permit the electrons to reach the detector. Also the composites are mostly much thicker than the analyzed region. These two observations however only influence the amount of the information obtained by XPS, the limits of the analyzed depth, but not the results themselves. In other words since it is not possible to define exactly from what depth the emitted electrons come, i.e. how thick the analyzed region is, the comparison between the different doses could be false, but the comparisons between the elements (the ratios) for each dose are correct. The major effects induced by the implantation of the polymers are carbonization, increase of the hardness and density, and sputtering of the material. They occur simultaneously or one after the other and are interdependent. The discussion that follows can only marginally explain the evolution of the PDMS modifications caused by implantation, because only samples implanted with two doses (1.5x10¹⁶ at/cm2 and 2.3x10¹⁶ at/cm2) at 10 keV were analyzed. A more profound research of the chemical changes of implanted PDMS would require more measurements, particularly at low doses (<1.5x10¹⁶ at/cm2) and energies. It is still important though that the reader is aware of the chemical changes that take place during the implantation and of the possible consequences these changes can induce.
As it will be explained, in addition to the measurements of the relative atomic concentration, XPS allows determination of the molecular valence levels or the atomic bonding orbitals. Since they consist of many closely spaced energy levels, most of the time it is very difficult to say to which molecular bonds exactly they are related, especially for a complex material such as PDMS. Usually XPS measurements are supported by the Infrared Spectroscopy (IRS) where infrared electromagnetic waves are used to study the fundamental vibrations and associated rotational-vibrational structure of the molecules. Together XPS and IRS give a better determination of the molecular structure. XPS determines the energy of emitted photoelectrons that are generated close to the sample surface due to soft X-ray irradiation. The X-ray induced photoionization of atoms in the specimen, and the energy spectrum of the emitted electrons from the specimen are measured [135]. The Einstein relation relates the binding energy Eb of the core electrons of the element, the kinetic energy Ek and the X-ray energy (hν) by [136]:
Ek = hν −Eb. (6.1)
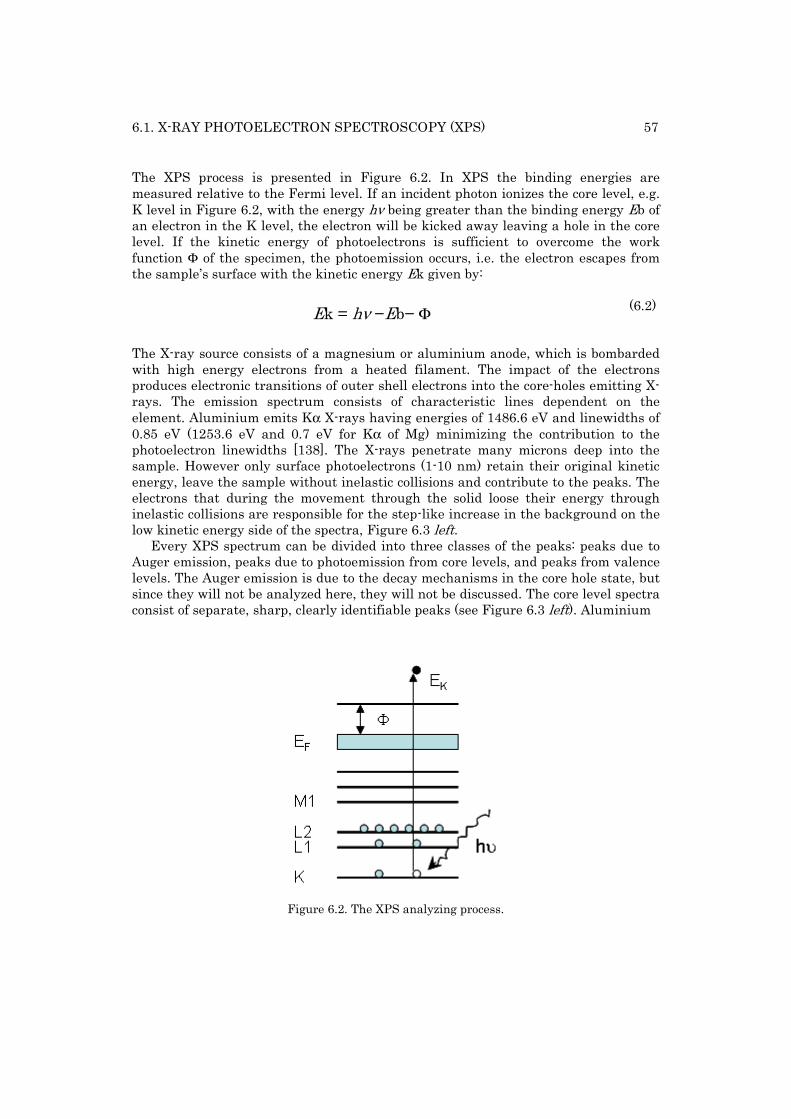
6.1. X-RAY PHOTOELECTRON SPECTROSCOPY (XPS) 57
The XPS process is presented in Figure 6.2. In XPS the binding energies are measured relative to the Fermi level. If an incident photon ionizes the core level, e.g. K level in Figure 6.2, with the energy hν being greater than the binding energy Eb of an electron in the K level, the electron will be kicked away leaving a hole in the core level. If the kinetic energy of photoelectrons is sufficient to overcome the work function Φ of the specimen, the photoemission occurs, i.e. the electron escapes from the sample’s surface with the kinetic energy Ek given by:
Ek = hν −Eb− Φ (6.2)
The X-ray source consists of a magnesium or aluminium anode, which is bombarded with high energy electrons from a heated filament. The impact of the electrons produces electronic transitions of outer shell electrons into the core-holes emitting X-rays. The emission spectrum consists of characteristic lines dependent on the element. Aluminium emits Kα X-rays having energies of 1486.6 eV and linewidths of 0.85 eV (1253.6 eV and 0.7 eV for Kα of Mg) minimizing the contribution to the photoelectron linewidths [138]. The X-rays penetrate many microns deep into the sample. However only surface photoelectrons (1-10 nm) retain their original kinetic energy, leave the sample without inelastic collisions and contribute to the peaks. The electrons that during the movement through the solid loose their energy through inelastic collisions are responsible for the step-like increase in the background on the low kinetic energy side of the spectra, Figure 6.3 left.
Every XPS spectrum can be divided into three classes of the peaks: peaks due to Auger emission, peaks due to photoemission from core levels, and peaks from valence levels. The Auger emission is due to the decay mechanisms in the core hole state, but since they will not be analyzed here, they will not be discussed. The core level spectra consist of separate, sharp, clearly identifiable peaks (see Figure 6.3 left). Aluminium
Figure 6.2. The XPS analyzing process.
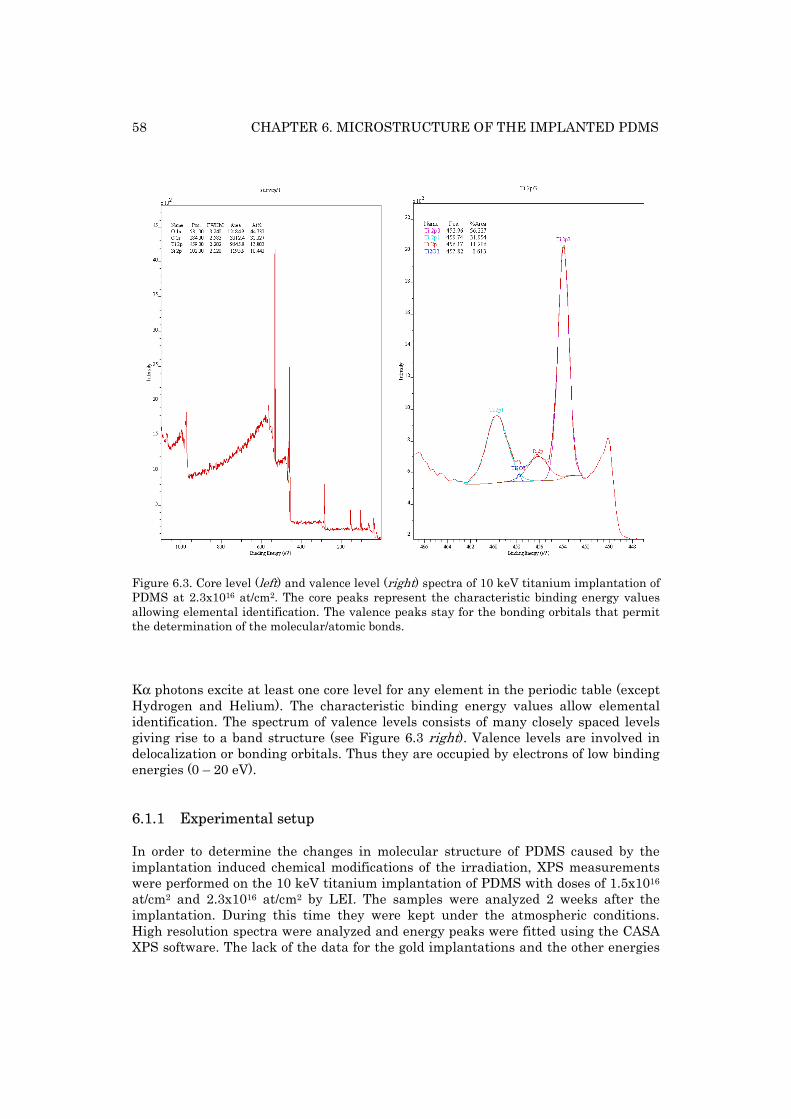
58 CHAPTER 6. MICROSTRUCTURE OF THE IMPLANTED PDMS
Figure 6.3. Core level (left) and valence level (right) spectra of 10 keV titanium implantation of PDMS at 2.3x10¹⁶ at/cm2. The core peaks represent the characteristic binding energy values allowing elemental identification. The valence peaks stay for the bonding orbitals that permit the determination of the molecular/atomic bonds.
Kα photons excite at least one core level for any element in the periodic table (except Hydrogen and Helium). The characteristic binding energy values allow elemental identification. The spectrum of valence levels consists of many closely spaced levels giving rise to a band structure (see Figure 6.3 right). Valence levels are involved in delocalization or bonding orbitals. Thus they are occupied by electrons of low binding energies (0 – 20 eV).
6.1.1 Experimental setup
In order to determine the changes in molecular structure of PDMS caused by the implantation induced chemical modifications of the irradiation, XPS measurements were performed on the 10 keV titanium implantation of PDMS with doses of 1.5x10¹⁶ at/cm2 and 2.3x10¹⁶ at/cm2 by LEI. The samples were analyzed 2 weeks after the implantation. During this time they were kept under the atmospheric conditions. High resolution spectra were analyzed and energy peaks were fitted using the CASA XPS software. The lack of the data for the gold implantations and the other energies
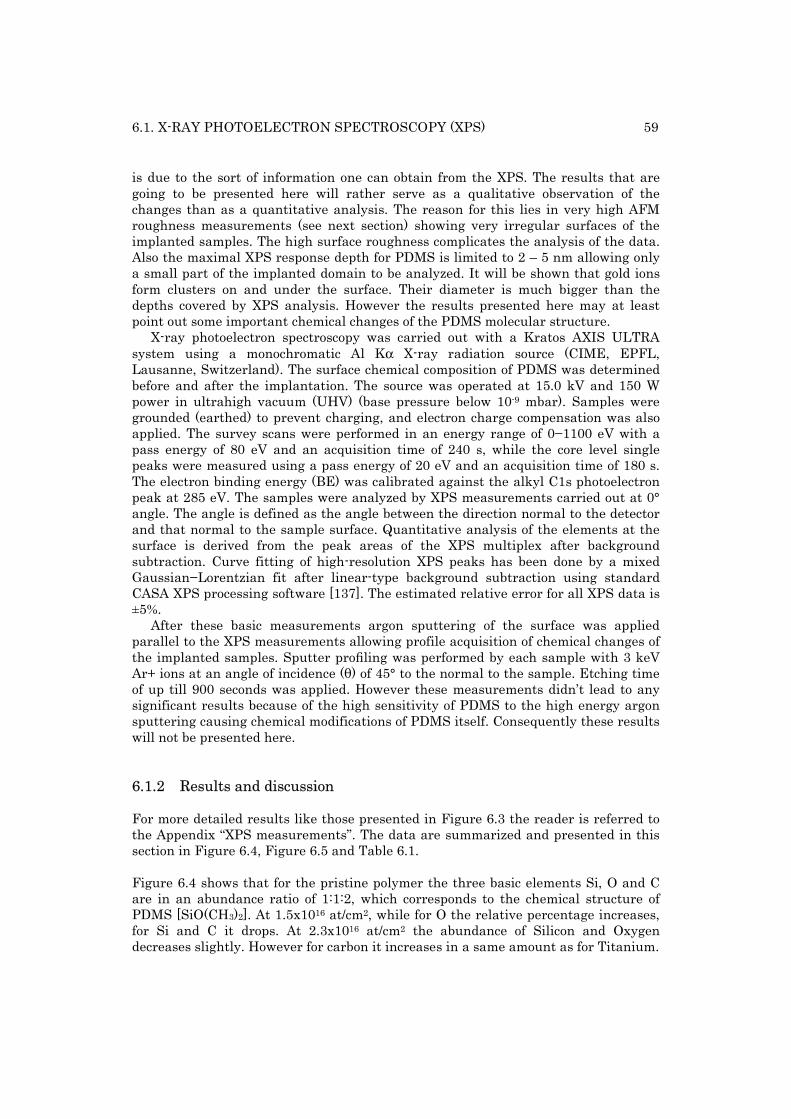
6.1. X-RAY PHOTOELECTRON SPECTROSCOPY (XPS) 59
is due to the sort of information one can obtain from the XPS. The results that are going to be presented here will rather serve as a qualitative observation of the changes than as a quantitative analysis. The reason for this lies in very high AFM roughness measurements (see next section) showing very irregular surfaces of the implanted samples. The high surface roughness complicates the analysis of the data. Also the maximal XPS response depth for PDMS is limited to 2 – 5 nm allowing only a small part of the implanted domain to be analyzed. It will be shown that gold ions form clusters on and under the surface. Their diameter is much bigger than the depths covered by XPS analysis. However the results presented here may at least point out some important chemical changes of the PDMS molecular structure.
X-ray photoelectron spectroscopy was carried out with a Kratos AXIS ULTRA system using a monochromatic Al Kα X-ray radiation source (CIME, EPFL, Lausanne, Switzerland). The surface chemical composition of PDMS was determined before and after the implantation. The source was operated at 15.0 kV and 150 W power in ultrahigh vacuum (UHV) (base pressure below 10-9 mbar). Samples were grounded (earthed) to prevent charging, and electron charge compensation was also applied. The survey scans were performed in an energy range of 0−1100 eV with a pass energy of 80 eV and an acquisition time of 240 s, while the core level single peaks were measured using a pass energy of 20 eV and an acquisition time of 180 s. The electron binding energy (BE) was calibrated against the alkyl C1s photoelectron peak at 285 eV. The samples were analyzed by XPS measurements carried out at 0° angle. The angle is defined as the angle between the direction normal to the detector and that normal to the sample surface. Quantitative analysis of the elements at the surface is derived from the peak areas of the XPS multiplex after background subtraction. Curve fitting of high-resolution XPS peaks has been done by a mixed Gaussian−Lorentzian fit after linear-type background subtraction using standard CASA XPS processing software [137]. The estimated relative error for all XPS data is ±5%.
After these basic measurements argon sputtering of the surface was applied parallel to the XPS measurements allowing profile acquisition of chemical changes of the implanted samples. Sputter profiling was performed by each sample with 3 keV Ar+ ions at an angle of incidence (θ) of 45° to the normal to the sample. Etching time of up till 900 seconds was applied. However these measurements didn’t lead to any significant results because of the high sensitivity of PDMS to the high energy argon sputtering causing chemical modifications of PDMS itself. Consequently these results will not be presented here.
6.1.2 Results and discussion
For more detailed results like those presented in Figure 6.3 the reader is referred to the Appendix “XPS measurements”. The data are summarized and presented in this section in Figure 6.4, Figure 6.5 and Table 6.1. Figure 6.4 shows that for the pristine polymer the three basic elements Si, O and C are in an abundance ratio of 1:1:2, which corresponds to the chemical structure of PDMS [SiO(CH3)2]. At 1.5x10¹⁶ at/cm2, while for O the relative percentage increases, for Si and C it drops. At 2.3x10¹⁶ at/cm2 the abundance of Silicon and Oxygen decreases slightly. However for carbon it increases in a same amount as for Titanium.
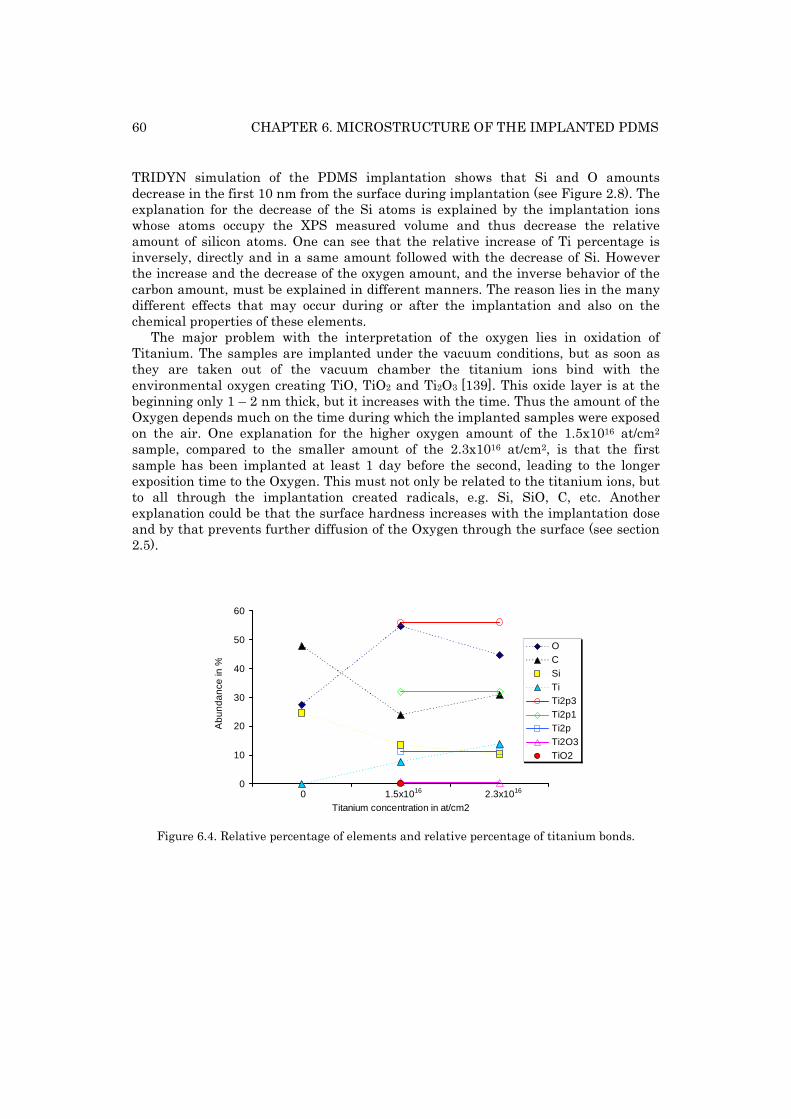
60 CHAPTER 6. MICROSTRUCTURE OF THE IMPLANTED PDMS
TRIDYN simulation of the PDMS implantation shows that Si and O amounts decrease in the first 10 nm from the surface during implantation (see Figure 2.8). The explanation for the decrease of the Si atoms is explained by the implantation ions whose atoms occupy the XPS measured volume and thus decrease the relative amount of silicon atoms. One can see that the relative increase of Ti percentage is inversely, directly and in a same amount followed with the decrease of Si. However the increase and the decrease of the oxygen amount, and the inverse behavior of the carbon amount, must be explained in different manners. The reason lies in the many different effects that may occur during or after the implantation and also on the chemical properties of these elements.
The major problem with the interpretation of the oxygen lies in oxidation of Titanium. The samples are implanted under the vacuum conditions, but as soon as they are taken out of the vacuum chamber the titanium ions bind with the environmental oxygen creating TiO, TiO2 and Ti2O3 [139]. This oxide layer is at the beginning only 1 – 2 nm thick, but it increases with the time. Thus the amount of the Oxygen depends much on the time during which the implanted samples were exposed on the air. One explanation for the higher oxygen amount of the 1.5x10¹⁶ at/cm2 sample, compared to the smaller amount of the 2.3x10¹⁶ at/cm2, is that the first sample has been implanted at least 1 day before the second, leading to the longer exposition time to the Oxygen. This must not only be related to the titanium ions, but to all through the implantation created radicals, e.g. Si, SiO, C, etc. Another explanation could be that the surface hardness increases with the implantation dose and by that prevents further diffusion of the Oxygen through the surface (see section 2.5).
0
10
20
30
40
50
60
0.5 1.5 2.5 3.5
Titanium concentration in at/cm2
Ab
un
da
nce
in %
OCSiTiTi2p3Ti2p1Ti2pTi2O3TiO2
0 1.5x10¹⁶ 2.3x10¹⁶
Figure 6.4. Relative percentage of elements and relative percentage of titanium bonds.
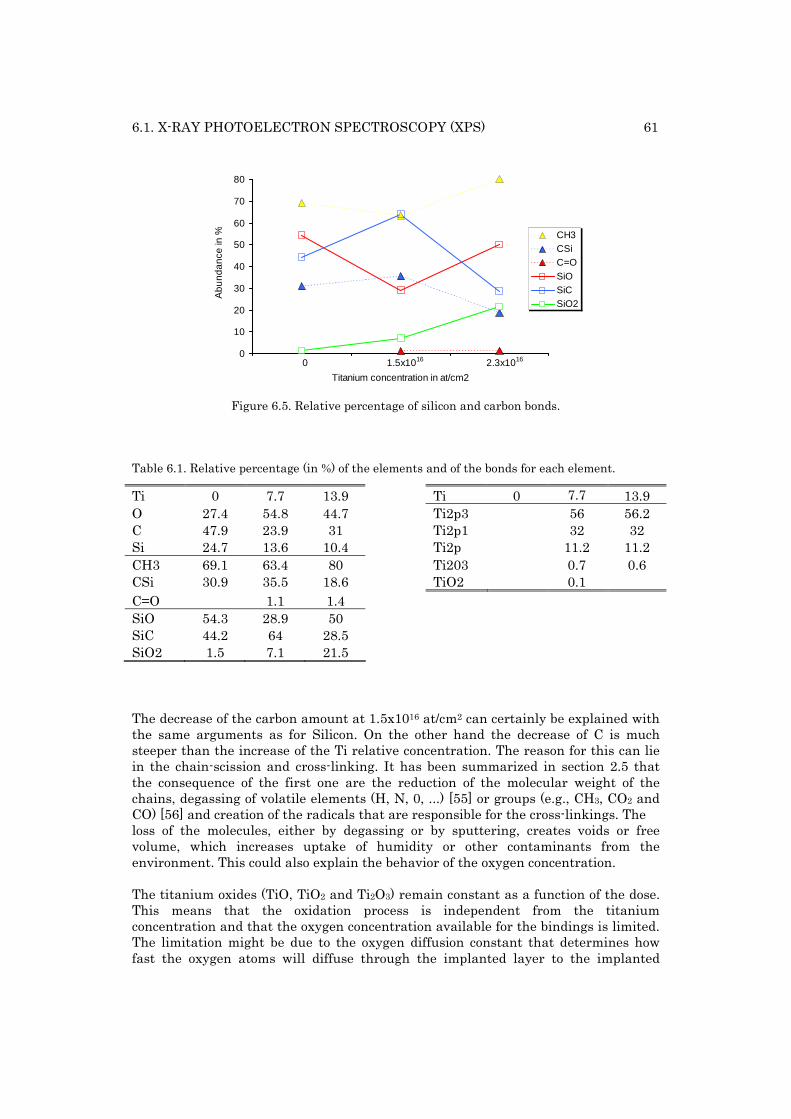
6.1. X-RAY PHOTOELECTRON SPECTROSCOPY (XPS) 61
0
10
20
30
40
50
60
70
80
0.5 1.5 2.5 3.5
Titanium concentration in at/cm2
Abu
ndan
ce in
% CH3CSiC=OSiOSiCSiO2
0 1.5x10¹⁶ 2.3x10¹⁶
Figure 6.5. Relative percentage of silicon and carbon bonds.
Table 6.1. Relative percentage (in %) of the elements and of the bonds for each element.
Ti 0 7.7 13.9 Ti 0 7.7 13.9 O 27.4 54.8 44.7 Ti2p3 56 56.2 C 47.9 23.9 31 Ti2p1 32 32 Si 24.7 13.6 10.4 Ti2p 11.2 11.2 CH3 69.1 63.4 80 Ti203 0.7 0.6 CSi 30.9 35.5 18.6 TiO2 0.1 C=O 1.1 1.4 SiO 54.3 28.9 50 SiC 44.2 64 28.5 SiO2 1.5 7.1 21.5
The decrease of the carbon amount at 1.5x10¹⁶ at/cm2 can certainly be explained with the same arguments as for Silicon. On the other hand the decrease of C is much steeper than the increase of the Ti relative concentration. The reason for this can lie in the chain-scission and cross-linking. It has been summarized in section 2.5 that the consequence of the first one are the reduction of the molecular weight of the chains, degassing of volatile elements (H, N, 0, ...) [55] or groups (e.g., CH3, CO2 and CO) [56] and creation of the radicals that are responsible for the cross-linkings. The loss of the molecules, either by degassing or by sputtering, creates voids or free volume, which increases uptake of humidity or other contaminants from the environment. This could also explain the behavior of the oxygen concentration. The titanium oxides (TiO, TiO2 and Ti2O3) remain constant as a function of the dose. This means that the oxidation process is independent from the titanium concentration and that the oxygen concentration available for the bindings is limited. The limitation might be due to the oxygen diffusion constant that determines how fast the oxygen atoms will diffuse through the implanted layer to the implanted
62 CHAPTER 6. MICROSTRUCTURE OF THE IMPLANTED PDMS
Titanium. Another constraint can also be the limited number of connection sites on the titanium atoms, because Ti also reacts with the hydrocarbon groups, presented by the bonding orbitals Ti2p, Ti2p1 and Ti2p3. The chemical reactivity of Ti is very big because of its low electronegativity, and it shares its up to 4 outer electrons in covalent bonds with almost any element. Ti or TiO2 creates strong bonds with SiO or SiO2, and with any configuration of the side chains C-H-O [139]-[142]. It is very difficult to say how exactly the bonds of the orbitals Ti2p, Ti2p1 and Ti2p3 look like, since there is a huge variation of possibilities with all the different radicals formed through the implantation. However all of them remain constant as a function of the dose. Concerning the carbon bonds, three have been determined. The most important is the methyl group (CH3), whose existence is obvious since these molecules build the main side group of the polymer. The simultaneous slight decrease and increase of its concentration follows exactly the inverse behavior of the CSi bonds. It is therefore possible that these two concentrations are related and that the chain-scissions between C and Si yield to higher cross-linking possibilities between C and H. The SiO2 slope is almost identical to the Ti concentration. As it has been summarized in the Section 2.2 and 2.5 if heated above 400° C decomposition sets in, destroying the Si-O-Si backbone and strongly reducing the methylene content. During all the time, while implanting, carbonization of the surface will be present since C atoms have the lowest bonding energies. A 3D network of Si-O bonds emerges and Si-C-Si links occur above 800°C [33]. Heating of the surface can also transform the silicon bonds to amorphous SiO2 or SiC [35]. All of these phenomena can be observed in Figure 6.5, but as mentioned before it is difficult to determine which of the implantation induced effects are dominant for that dose. For instance if there is an important increase of the hardness and density, sputtering yield will increase and remove that rigid layer from the surface, leaving a new layer, whose density and hardness again can be increased. This can explain for example the variation of the SiO bonds which for the pristine PDMS and for the dose of 2.3x10¹⁶ at/cm2 is the same, but for the lower dose is decreased. For the SiC bonds the opposite is the case. Thus it is very much probable that at 1.5x10¹⁶ at/cm2 the cross-linking of SiC and the chain-scissions of SiO dominate, where else at 2.3x10¹⁶ at/cm2 it is the converse.
6.1.3 Conclusion on XPS measurements
Although having some limits in the determination of the exactly analyzed region this techniques still allows finding some concrete supporting data on the influence of the implantation on the chemical structure of PDMS. It shows an increase of O and Ti and simultaneous decrease of Si and C concentrations. While Si amount can directly be related to that of Ti (supported with the TRIDYN simulation showing in fact that Ti replaces Si), O and C curves are results of different physico-chemical reactions. Many results from the literature suggest that the implantation process leads to degassing of the volatile elements or even sputtering of the material. These reactions are connected to each other and during the implantation dynamically dominate one over the other. The increase of O concentration is due to the oxidation of Ti as well as a direct uptake by PDMS radicals such as SiO2.
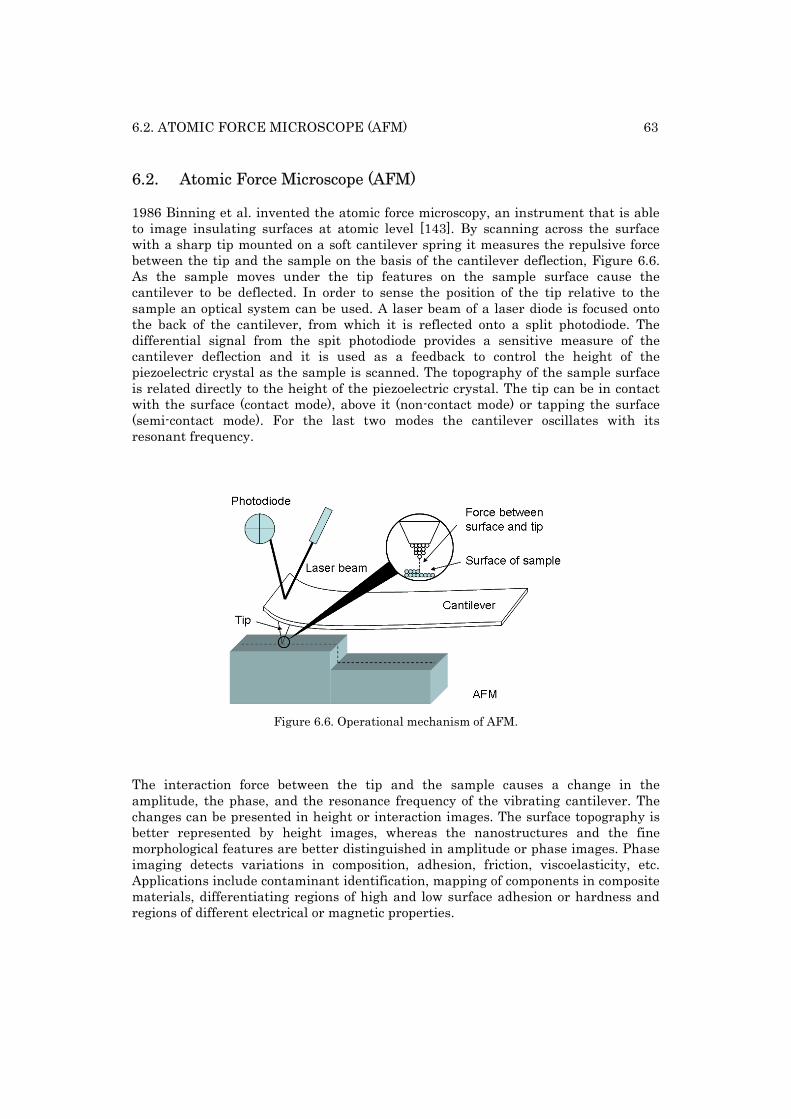
6.2. ATOMIC FORCE MICROSCOPE (AFM) 63
6.2. Atomic Force Microscope (AFM)
1986 Binning et al. invented the atomic force microscopy, an instrument that is able to image insulating surfaces at atomic level [143]. By scanning across the surface with a sharp tip mounted on a soft cantilever spring it measures the repulsive force between the tip and the sample on the basis of the cantilever deflection, Figure 6.6. As the sample moves under the tip features on the sample surface cause the cantilever to be deflected. In order to sense the position of the tip relative to the sample an optical system can be used. A laser beam of a laser diode is focused onto the back of the cantilever, from which it is reflected onto a split photodiode. The differential signal from the spit photodiode provides a sensitive measure of the cantilever deflection and it is used as a feedback to control the height of the piezoelectric crystal as the sample is scanned. The topography of the sample surface is related directly to the height of the piezoelectric crystal. The tip can be in contact with the surface (contact mode), above it (non-contact mode) or tapping the surface (semi-contact mode). For the last two modes the cantilever oscillates with its resonant frequency.
Figure 6.6. Operational mechanism of AFM. The interaction force between the tip and the sample causes a change in the amplitude, the phase, and the resonance frequency of the vibrating cantilever. The changes can be presented in height or interaction images. The surface topography is better represented by height images, whereas the nanostructures and the fine morphological features are better distinguished in amplitude or phase images. Phase imaging detects variations in composition, adhesion, friction, viscoelasticity, etc. Applications include contaminant identification, mapping of components in composite materials, differentiating regions of high and low surface adhesion or hardness and regions of different electrical or magnetic properties.
64 CHAPTER 6. MICROSTRUCTURE OF THE IMPLANTED PDMS
6.2.1 Experimental setup
Samples were prepared as explained in Section 5.2 and 5.3. The AFM Dimension 3100 (NanoScope Control) from Veeco Digital Instruments was used to measure the influence of the MII on the surface roughness of the PDMS film (IMT, Neuchâtel, Switzerland). The analyzed samples were implanted with Gold and Titanium, and the doses from 0.1x10¹⁶ at/cm2 to 2.3x10¹⁶ at/cm2. The implantation energy was 10 keV and 35 keV for LEI and 2.5 keV, 5 keV and 10 keV for FCVA. After the implantation the samples were directly analyzed by AFM, in tapping mode, without any additional preparations. The surface roughness was calculated with Nanoscope III (v5.12r3) software, once the “Flatten” option was applied, and is expressed as Root-mean-squared roughness (RRMS). The latter is the standard deviation of the height data z referred to the mean height of the data within the measured area:
1
)(1
2
−
−=∑
=
N
zz
R
N
nn
RMS .
(6.3)
6.2.2 Results and discussion
In what follows first the height measurements will be presented showing important increase of the surface roughness dependent on the energy, on the dose and on the implantation instrument used. After that phase measurements will reveal existence of small clusters for the gold implantation with FCVA. The size of the clusters will be determined for three different doses and energies. The section concludes with a retrospect on the Section 2.5.3 where a short summary is described on a model which will allow extracting the biaxial Young’s modulus of the implanted layer by means of the surface roughness results.
Height measurements
Initial RRMS value of PDMS obtained before implantation is 2 nm, see Figure 6.7. Figure 6.8 and Figure 6.9 present a typical state of the surface of PDMS after implantation with both FCVA and LEI. As explained in Section 2.5.3, during implantation the implanted PDMS layer is heated due to the flux of ions. After cooling to ambient temperature a network of periodic waves appears on the surface due to the different coefficient of thermal expansion and due to the different stiffening between the implanted and non-implanted layer of PDMS (see Section 2.5.3). All RMS values were determined from 10x10 µm2 scans. The surface roughness is analyzed as a function of three parameters: the implantation energy, the ion dose and the element used. The results are summarized in Figure 6.10. One can see that the surface roughness increases with the implanted ion concentration until a certain value, after which it decreases again. This is independent from the energy or the element. However the smaller is the energy the more this maximal values moves to
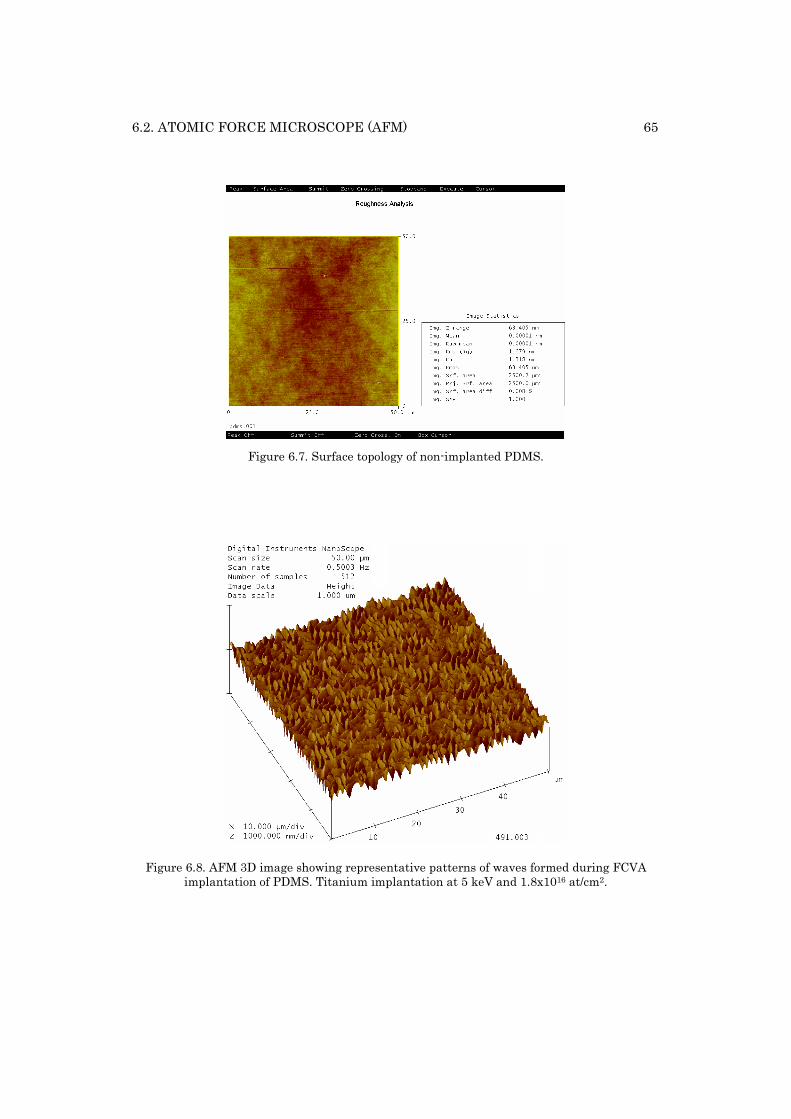
6.2. ATOMIC FORCE MICROSCOPE (AFM) 65
Figure 6.7. Surface topology of non-implanted PDMS.
Figure 6.8. AFM 3D image showing representative patterns of waves formed during FCVA implantation of PDMS. Titanium implantation at 5 keV and 1.8x10¹⁶ at/cm2.
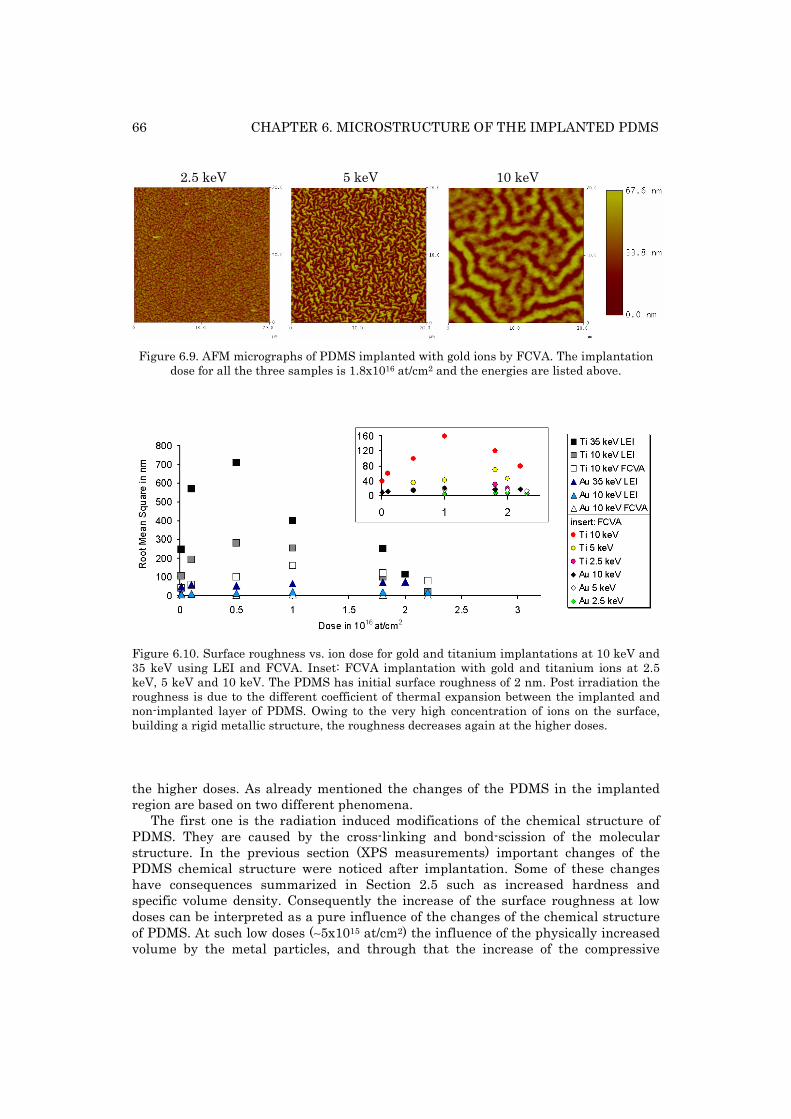
66 CHAPTER 6. MICROSTRUCTURE OF THE IMPLANTED PDMS
2.5 keV 5 keV 10 keV
Figure 6.9. AFM micrographs of PDMS implanted with gold ions by FCVA. The implantation
dose for all the three samples is 1.8x10¹⁶ at/cm2 and the energies are listed above.
Figure 6.10. Surface roughness vs. ion dose for gold and titanium implantations at 10 keV and 35 keV using LEI and FCVA. Inset: FCVA implantation with gold and titanium ions at 2.5 keV, 5 keV and 10 keV. The PDMS has initial surface roughness of 2 nm. Post irradiation the roughness is due to the different coefficient of thermal expansion between the implanted and non-implanted layer of PDMS. Owing to the very high concentration of ions on the surface, building a rigid metallic structure, the roughness decreases again at the higher doses. the higher doses. As already mentioned the changes of the PDMS in the implanted region are based on two different phenomena.
The first one is the radiation induced modifications of the chemical structure of PDMS. They are caused by the cross-linking and bond-scission of the molecular structure. In the previous section (XPS measurements) important changes of the PDMS chemical structure were noticed after implantation. Some of these changes have consequences summarized in Section 2.5 such as increased hardness and specific volume density. Consequently the increase of the surface roughness at low doses can be interpreted as a pure influence of the changes of the chemical structure of PDMS. At such low doses (∼5x10¹⁵ at/cm2) the influence of the physically increased volume by the metal particles, and through that the increase of the compressive
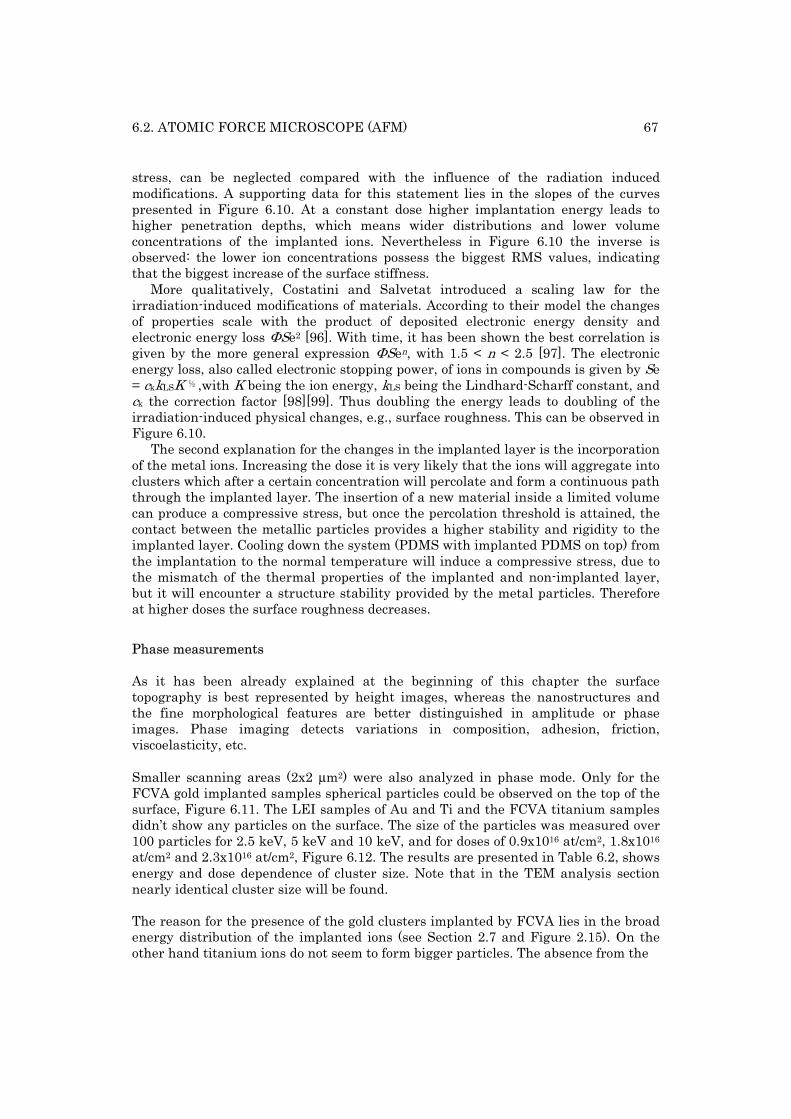
6.2. ATOMIC FORCE MICROSCOPE (AFM) 67
stress, can be neglected compared with the influence of the radiation induced modifications. A supporting data for this statement lies in the slopes of the curves presented in Figure 6.10. At a constant dose higher implantation energy leads to higher penetration depths, which means wider distributions and lower volume concentrations of the implanted ions. Nevertheless in Figure 6.10 the inverse is observed: the lower ion concentrations possess the biggest RMS values, indicating that the biggest increase of the surface stiffness.
More qualitatively, Costatini and Salvetat introduced a scaling law for the irradiation-induced modifications of materials. According to their model the changes of properties scale with the product of deposited electronic energy density and electronic energy loss ΦSe2 [96]. With time, it has been shown the best correlation is given by the more general expression ΦSen, with 1.5 < n < 2.5 [97]. The electronic energy loss, also called electronic stopping power, of ions in compounds is given by Se = ckkLSK ½ ,with K being the ion energy, kLS being the Lindhard-Scharff constant, and ck the correction factor [98][99]. Thus doubling the energy leads to doubling of the irradiation-induced physical changes, e.g., surface roughness. This can be observed in Figure 6.10.
The second explanation for the changes in the implanted layer is the incorporation of the metal ions. Increasing the dose it is very likely that the ions will aggregate into clusters which after a certain concentration will percolate and form a continuous path through the implanted layer. The insertion of a new material inside a limited volume can produce a compressive stress, but once the percolation threshold is attained, the contact between the metallic particles provides a higher stability and rigidity to the implanted layer. Cooling down the system (PDMS with implanted PDMS on top) from the implantation to the normal temperature will induce a compressive stress, due to the mismatch of the thermal properties of the implanted and non-implanted layer, but it will encounter a structure stability provided by the metal particles. Therefore at higher doses the surface roughness decreases.
Phase measurements
As it has been already explained at the beginning of this chapter the surface topography is best represented by height images, whereas the nanostructures and the fine morphological features are better distinguished in amplitude or phase images. Phase imaging detects variations in composition, adhesion, friction, viscoelasticity, etc. Smaller scanning areas (2x2 μm2) were also analyzed in phase mode. Only for the FCVA gold implanted samples spherical particles could be observed on the top of the surface, Figure 6.11. The LEI samples of Au and Ti and the FCVA titanium samples didn’t show any particles on the surface. The size of the particles was measured over 100 particles for 2.5 keV, 5 keV and 10 keV, and for doses of 0.9x10¹⁶ at/cm2, 1.8x10¹⁶ at/cm2 and 2.3x10¹⁶ at/cm2, Figure 6.12. The results are presented in Table 6.2, shows energy and dose dependence of cluster size. Note that in the TEM analysis section nearly identical cluster size will be found. The reason for the presence of the gold clusters implanted by FCVA lies in the broad energy distribution of the implanted ions (see Section 2.7 and Figure 2.15). On the other hand titanium ions do not seem to form bigger particles. The absence from the
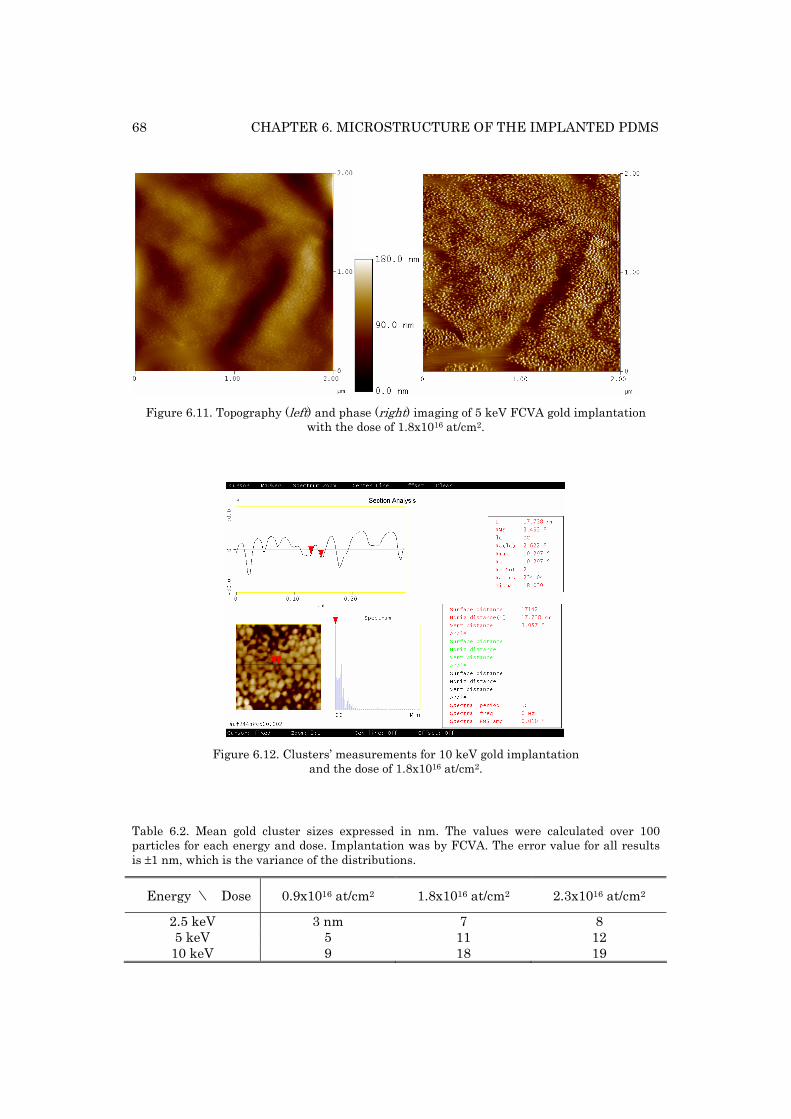
68 CHAPTER 6. MICROSTRUCTURE OF THE IMPLANTED PDMS
Figure 6.11. Topography (left) and phase (right) imaging of 5 keV FCVA gold implantation with the dose of 1.8x10¹⁶ at/cm2.
Figure 6.12. Clusters’ measurements for 10 keV gold implantation and the dose of 1.8x10¹⁶ at/cm2.
Table 6.2. Mean gold cluster sizes expressed in nm. The values were calculated over 100 particles for each energy and dose. Implantation was by FCVA. The error value for all results is ±1 nm, which is the variance of the distributions.
Energy \ Dose 0.9x10¹⁶ at/cm2 1.8x10¹⁶ at/cm2 2.3x10¹⁶ at/cm2
2.5 keV 3 nm 7 8 5 keV 5 11 12 10 keV 9 18 19
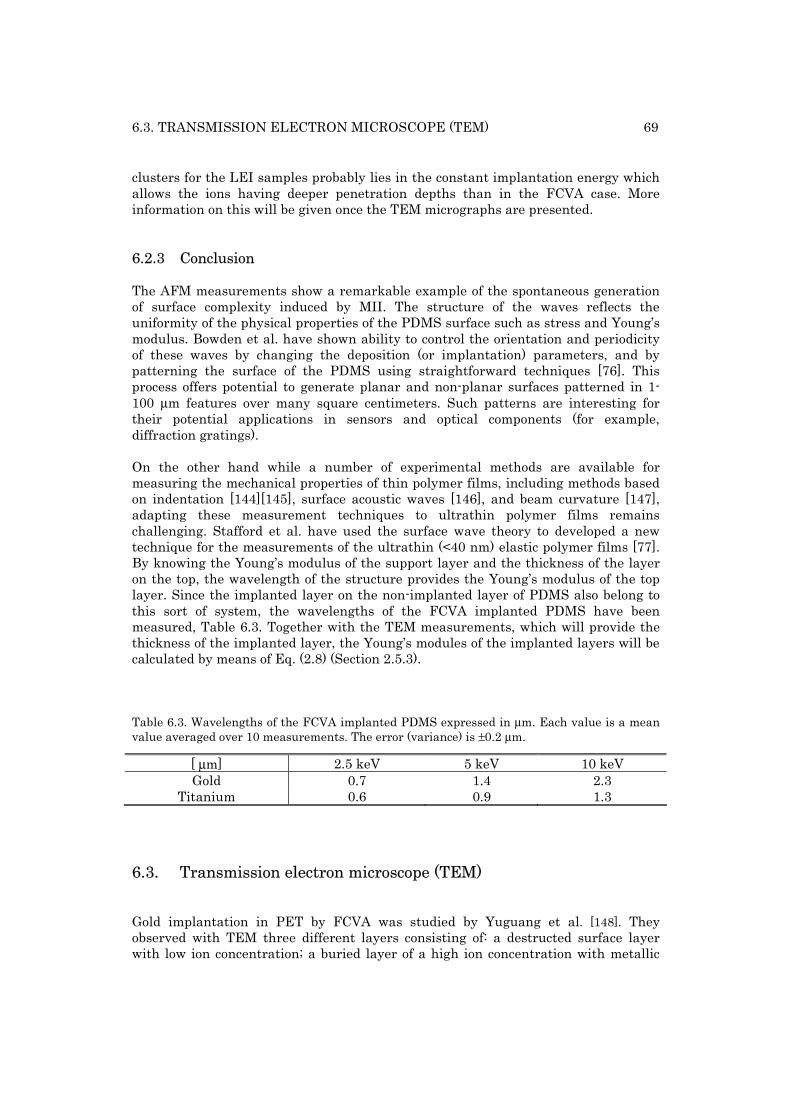
6.3. TRANSMISSION ELECTRON MICROSCOPE (TEM) 69
clusters for the LEI samples probably lies in the constant implantation energy which allows the ions having deeper penetration depths than in the FCVA case. More information on this will be given once the TEM micrographs are presented.
6.2.3 Conclusion
The AFM measurements show a remarkable example of the spontaneous generation of surface complexity induced by MII. The structure of the waves reflects the uniformity of the physical properties of the PDMS surface such as stress and Young’s modulus. Bowden et al. have shown ability to control the orientation and periodicity of these waves by changing the deposition (or implantation) parameters, and by patterning the surface of the PDMS using straightforward techniques [76]. This process offers potential to generate planar and non-planar surfaces patterned in 1-100 μm features over many square centimeters. Such patterns are interesting for their potential applications in sensors and optical components (for example, diffraction gratings). On the other hand while a number of experimental methods are available for measuring the mechanical properties of thin polymer films, including methods based on indentation [144][145], surface acoustic waves [146], and beam curvature [147], adapting these measurement techniques to ultrathin polymer films remains challenging. Stafford et al. have used the surface wave theory to developed a new technique for the measurements of the ultrathin (<40 nm) elastic polymer films [77]. By knowing the Young’s modulus of the support layer and the thickness of the layer on the top, the wavelength of the structure provides the Young’s modulus of the top layer. Since the implanted layer on the non-implanted layer of PDMS also belong to this sort of system, the wavelengths of the FCVA implanted PDMS have been measured, Table 6.3. Together with the TEM measurements, which will provide the thickness of the implanted layer, the Young’s modules of the implanted layers will be calculated by means of Eq. (2.8) (Section 2.5.3). Table 6.3. Wavelengths of the FCVA implanted PDMS expressed in μm. Each value is a mean value averaged over 10 measurements. The error (variance) is ±0.2 μm.
[ μm] 2.5 keV 5 keV 10 keV Gold 0.7 1.4 2.3
Titanium 0.6 0.9 1.3
6.3. Transmission electron microscope (TEM)
Gold implantation in PET by FCVA was studied by Yuguang et al. [148]. They observed with TEM three different layers consisting of: a destructed surface layer with low ion concentration; a buried layer of a high ion concentration with metallic
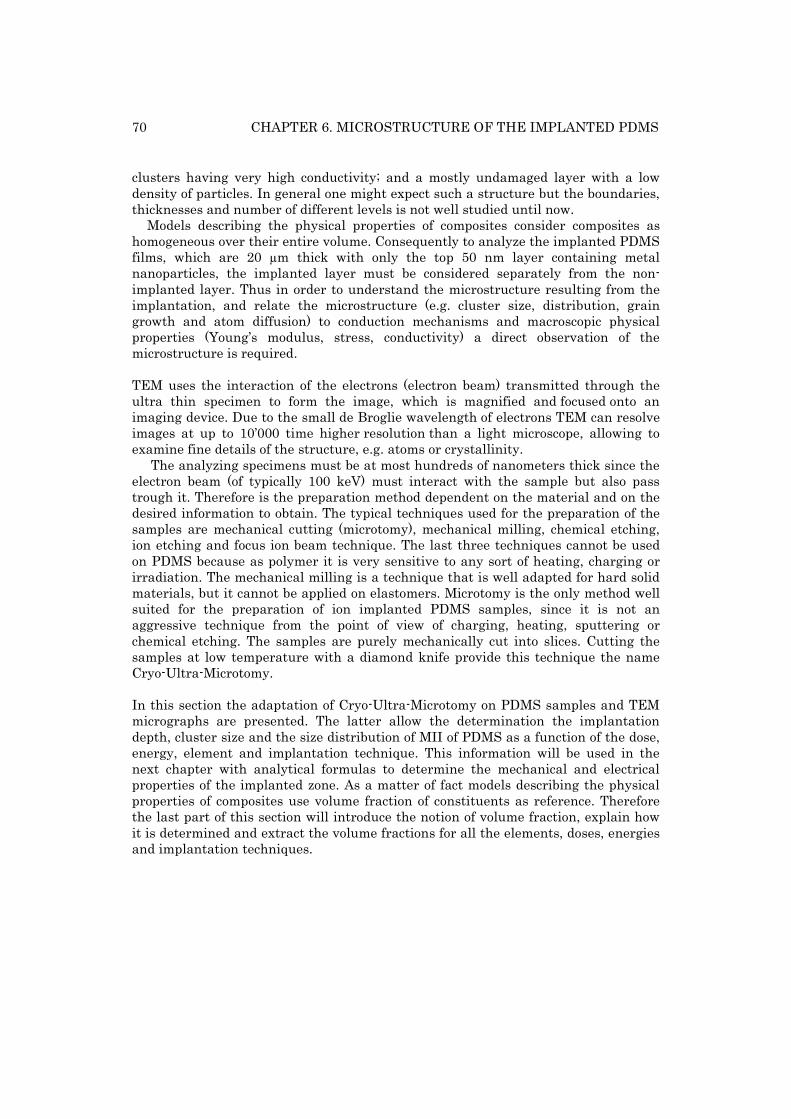
70 CHAPTER 6. MICROSTRUCTURE OF THE IMPLANTED PDMS
clusters having very high conductivity; and a mostly undamaged layer with a low density of particles. In general one might expect such a structure but the boundaries, thicknesses and number of different levels is not well studied until now.
Models describing the physical properties of composites consider composites as homogeneous over their entire volume. Consequently to analyze the implanted PDMS films, which are 20 µm thick with only the top 50 nm layer containing metal nanoparticles, the implanted layer must be considered separately from the non-implanted layer. Thus in order to understand the microstructure resulting from the implantation, and relate the microstructure (e.g. cluster size, distribution, grain growth and atom diffusion) to conduction mechanisms and macroscopic physical properties (Young’s modulus, stress, conductivity) a direct observation of the microstructure is required.
TEM uses the interaction of the electrons (electron beam) transmitted through the ultra thin specimen to form the image, which is magnified and focused onto an imaging device. Due to the small de Broglie wavelength of electrons TEM can resolve images at up to 10’000 time higher resolution than a light microscope, allowing to examine fine details of the structure, e.g. atoms or crystallinity.
The analyzing specimens must be at most hundreds of nanometers thick since the electron beam (of typically 100 keV) must interact with the sample but also pass trough it. Therefore is the preparation method dependent on the material and on the desired information to obtain. The typical techniques used for the preparation of the samples are mechanical cutting (microtomy), mechanical milling, chemical etching, ion etching and focus ion beam technique. The last three techniques cannot be used on PDMS because as polymer it is very sensitive to any sort of heating, charging or irradiation. The mechanical milling is a technique that is well adapted for hard solid materials, but it cannot be applied on elastomers. Microtomy is the only method well suited for the preparation of ion implanted PDMS samples, since it is not an aggressive technique from the point of view of charging, heating, sputtering or chemical etching. The samples are purely mechanically cut into slices. Cutting the samples at low temperature with a diamond knife provide this technique the name Cryo-Ultra-Microtomy. In this section the adaptation of Cryo-Ultra-Microtomy on PDMS samples and TEM micrographs are presented. The latter allow the determination the implantation depth, cluster size and the size distribution of MII of PDMS as a function of the dose, energy, element and implantation technique. This information will be used in the next chapter with analytical formulas to determine the mechanical and electrical properties of the implanted zone. As a matter of fact models describing the physical properties of composites use volume fraction of constituents as reference. Therefore the last part of this section will introduce the notion of volume fraction, explain how it is determined and extract the volume fractions for all the elements, doses, energies and implantation techniques.
6.3. TRANSMISSION ELECTRON MICROSCOPE (TEM) 71
6.3.1 TEM imaging
TEM samples are about 100 nm thick, or less as the electronc beam must go through them. They are irradiated with high energy (100-300 keV) electron beam that is shaped by a condenser lens into an approximately parallel beam, Figure 6.13. Only transmitted electrons pass through the objective lens that produces a first image. Then the image is magnified by intermediate and projector before being projected onto the fluorescent screen. Mostly for image formation only electrons penetrating the specimen without scattering are used. In order to filter the direct beam from the scattering electrons a limiting objective aperture can be adjusted. By that the scattered and diffracted beam are excluded. Image contrast is created due to inhomogeneities in the specimen with respect to density, thickness, and orientation, by changing the transmitted beam intensity. The image is also recorded by a CCD camera. This allows further digital picture processing. More information on TEM can be found in [149]. TEM gives details about the material structure at high resolution down to atomic dimensions. In this work TEM Philips CM200 electron microscope with a maximal acceleration energy of 200 keV and 0.27 nm resolution was used to analyze the form, size and distribution of metal particles inside the implanted layer (IMT, Neuchâtel, Switzerland). The electron energy, spot size, intensity and focus were specially adjusted for each sample in order to allow 1-3 seconds long imaging. Lower
Figure 6.13. Main TEM components.
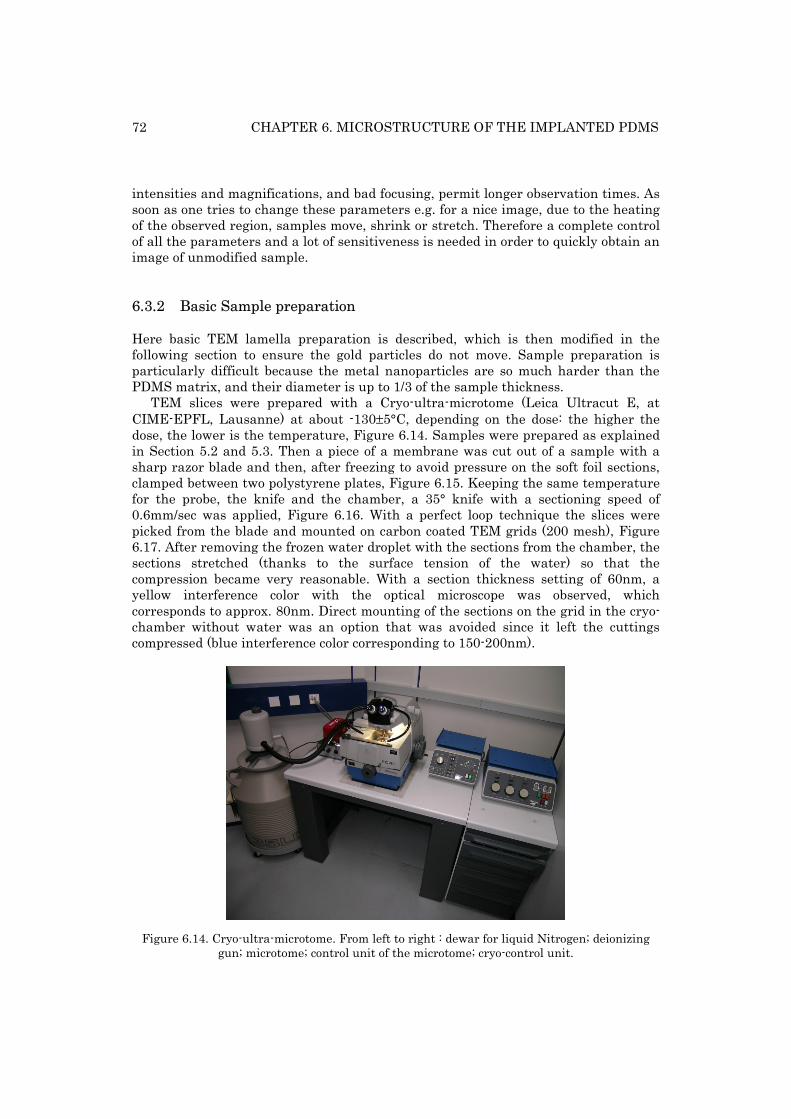
72 CHAPTER 6. MICROSTRUCTURE OF THE IMPLANTED PDMS
intensities and magnifications, and bad focusing, permit longer observation times. As soon as one tries to change these parameters e.g. for a nice image, due to the heating of the observed region, samples move, shrink or stretch. Therefore a complete control of all the parameters and a lot of sensitiveness is needed in order to quickly obtain an image of unmodified sample.
6.3.2 Basic Sample preparation
Here basic TEM lamella preparation is described, which is then modified in the following section to ensure the gold particles do not move. Sample preparation is particularly difficult because the metal nanoparticles are so much harder than the PDMS matrix, and their diameter is up to 1/3 of the sample thickness.
TEM slices were prepared with a Cryo-ultra-microtome (Leica Ultracut E, at CIME-EPFL, Lausanne) at about -130±5°C, depending on the dose: the higher the dose, the lower is the temperature, Figure 6.14. Samples were prepared as explained in Section 5.2 and 5.3. Then a piece of a membrane was cut out of a sample with a sharp razor blade and then, after freezing to avoid pressure on the soft foil sections, clamped between two polystyrene plates, Figure 6.15. Keeping the same temperature for the probe, the knife and the chamber, a 35° knife with a sectioning speed of 0.6mm/sec was applied, Figure 6.16. With a perfect loop technique the slices were picked from the blade and mounted on carbon coated TEM grids (200 mesh), Figure 6.17. After removing the frozen water droplet with the sections from the chamber, the sections stretched (thanks to the surface tension of the water) so that the compression became very reasonable. With a section thickness setting of 60nm, a yellow interference color with the optical microscope was observed, which corresponds to approx. 80nm. Direct mounting of the sections on the grid in the cryo-chamber without water was an option that was avoided since it left the cuttings compressed (blue interference color corresponding to 150-200nm).
Figure 6.14. Cryo-ultra-microtome. From left to right : dewar for liquid Nitrogen; deionizing gun; microtome; control unit of the microtome; cryo-control unit.
6.3. TRANSMISSION ELECTRON MICROSCOPE (TEM) 73
Figure 6.15. TEM sample preparation. The sample is mechanically sandwiched between two polystyrene plates and then fixed in the sample holder.
Figure 6.16. Section chamber inside of the microtome. The sample moves up and down and approaches toward fixed diamond knife where is getting cut.
Figure 6.17. TEM-grid with a membrane’s cross section (the multi-colored part at the center). The colors corresponding to interference patterns in the 50-100 nm thick lamella.
74 CHAPTER 6. MICROSTRUCTURE OF THE IMPLANTED PDMS
6.3.3 Three techniques
Unfortunately the samples prepared as explained above (1st technique) were strongly modified during the sectioning, i.e., the metal clusters did not remain in their original position in the PDMS. Unlike the simulations presented in the Figure 2.5, the TEM observations showed one order of magnitude larger distribution of the particle in the implanted layer than it was expected, see Figure 6.18. Hence an improved technique was developed.
The preparation method of the TEM slices was slightly modified by adding an additional layer of the PDMS on the top of the implanted membrane Figure 6.19. The implanted zone was then embedded between the additive film of PDMS and a non-implanted layer of the membrane (2nd technique). This conserved the implanted layer in the PDMS during the cutting in his initial form, but in the same time reduced the sharpness of the images due to increased thickness, Figure 6.20. Without the additional layer of PDMS the implanted area is situated on the edge of the section, which is even thinner than 80nm. The second preparation method leads to the thicker slices (around 100nm) with the implantation zone being in the middle of it, making it impossible to focus on all clusters at the same time, leading to a lower quality images. The TEM micrographs presented in the Section 6.3.5 below are made by the first method (without additional layer) but by adjusting the angle between the sample and the knife in a way that the implanted particles are not removed, and if so (at very low lamellae thickness, i.e. below 40 nm), that there is no contamination of the cross-sections by removed material (3rd technique). The micrographs
Figure 6.18. FCVA gold implantation of PDMS (5 keV, 3x10¹⁶ at/cm2). Cross-section cut without any additional preparations, directly after the implantation, Figure 6.19 c.
6.3. TRANSMISSION ELECTRON MICROSCOPE (TEM) 75
Figure 6.19. Two preparation techniques. a) – A block of an implanted sample with an optional subsequently coated layer of PDMS on the top (2nd technique). b) – TEM lamellae prepared with the additional layer of PDMS. c) – TEM lamellae of the bare film (1st or 3rd technique).
Figure 6.20. FCVA gold implantation of PDMS (5 keV, 1.8x10¹⁶ at/cm2). Cross-section cut with additional layer of PDMS, Figure 6.19 b.
were then compared with those made with additional layer, in order to verify their state. The first technique was used to investigate the size distribution of the clusters, as it allows the highest resolution imaging. The technique with additional PDSM provides the highest fidelity of metal particles position, but with lower resolution images.
76 CHAPTER 6. MICROSTRUCTURE OF THE IMPLANTED PDMS
6.3.4 Verification of the integrity of the cross-section
RMS roughness and surface topology was measured with AFM (Digital Instruments D3100). The AFM topology cross sections images can give very important information about the distortion of the TEM sections and validity of the TEM micrographs. Cryo-ultra-microtomy is a dry sectioning process at which the sample is cut at -130°C with a 35° diamond knife producing at least 5-20% of compressions on the membrane. The forces exerted on the sections through the knife are very important, due to the absence of the water as a lubricant. Furthermore due to the coefficient of thermal expansion of 9x10⁻⁴ K-1 after the difficult removal of the sections from the chamber to the normal temperature their volume changes by 13.5% and the thickness correspondingly by 50%. It may be questionable how much these constraints affect the initial form of the implanted membrane and whether this blurs completely the interpretation of the results. To analyze this phenomenon the AFM section analysis was compared with the TEM micrographs. This can simply be done for example by superposing the adjusted scale of the Figure 6.21Top with the TEM micrograph of the same sample, Figure 6.21Bottom. It can be seen that the cross section of the implanted layer on the TEM micrographs are in a good agreement with the corresponding AFM topology section, which insures that the preparation technique preserves the initial state of the matter.
Figure 6.21. Top – Section analysis of an AFM imaged surface. Bottom – Comparison between the AFM and the TEM section analysis.
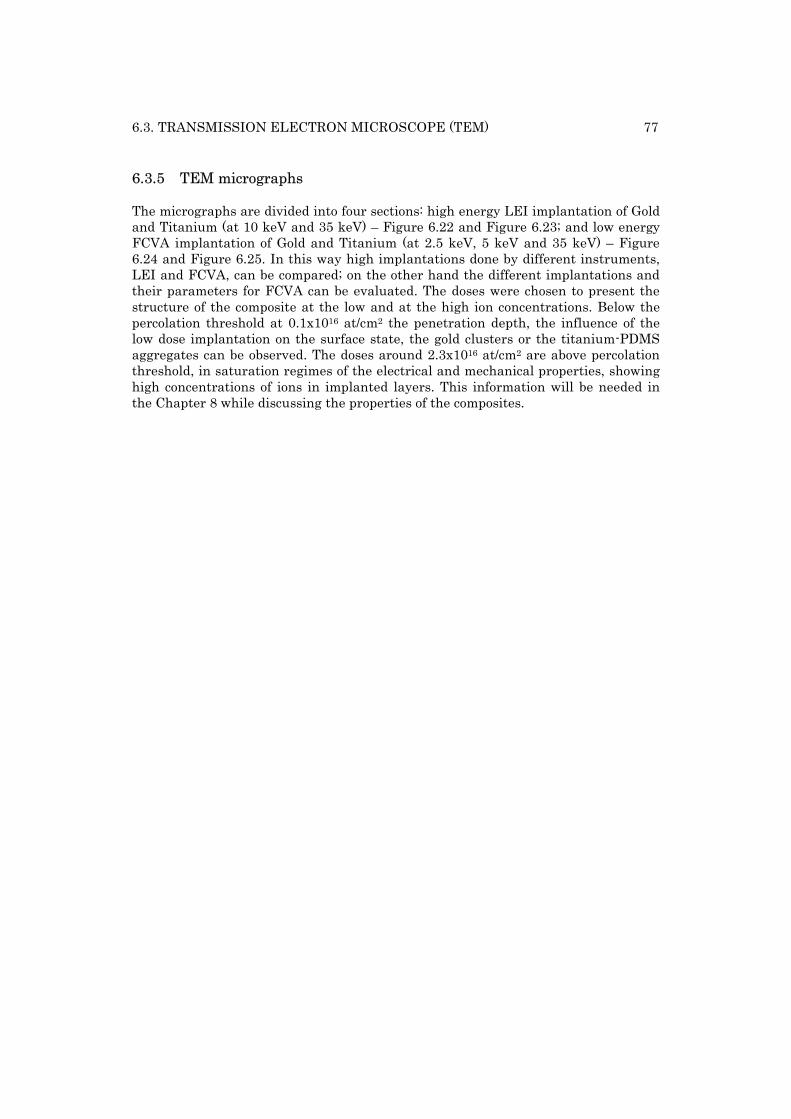
6.3. TRANSMISSION ELECTRON MICROSCOPE (TEM) 77
6.3.5 TEM micrographs
The micrographs are divided into four sections: high energy LEI implantation of Gold and Titanium (at 10 keV and 35 keV) – Figure 6.22 and Figure 6.23; and low energy FCVA implantation of Gold and Titanium (at 2.5 keV, 5 keV and 35 keV) – Figure 6.24 and Figure 6.25. In this way high implantations done by different instruments, LEI and FCVA, can be compared; on the other hand the different implantations and their parameters for FCVA can be evaluated. The doses were chosen to present the structure of the composite at the low and at the high ion concentrations. Below the percolation threshold at 0.1x10¹⁶ at/cm2 the penetration depth, the influence of the low dose implantation on the surface state, the gold clusters or the titanium-PDMS aggregates can be observed. The doses around 2.3x10¹⁶ at/cm2 are above percolation threshold, in saturation regimes of the electrical and mechanical properties, showing high concentrations of ions in implanted layers. This information will be needed in the Chapter 8 while discussing the properties of the composites.
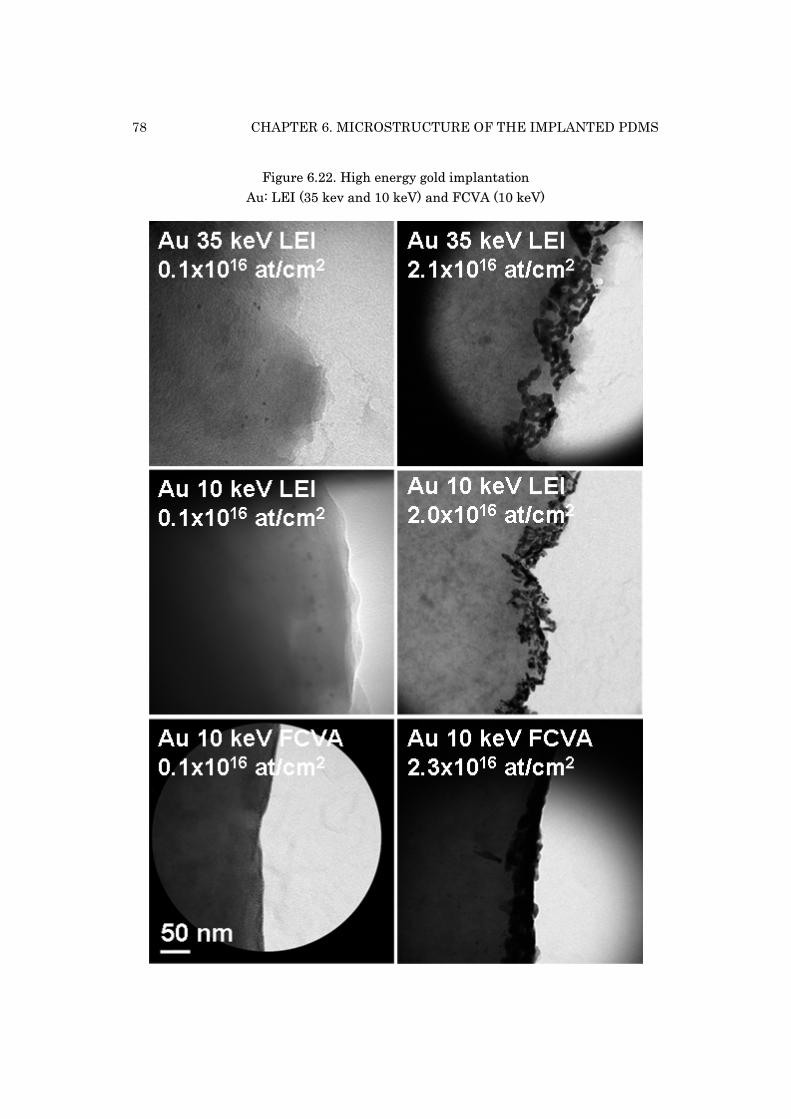
78 CHAPTER 6. MICROSTRUCTURE OF THE IMPLANTED PDMS
Figure 6.22. High energy gold implantation Au: LEI (35 kev and 10 keV) and FCVA (10 keV)
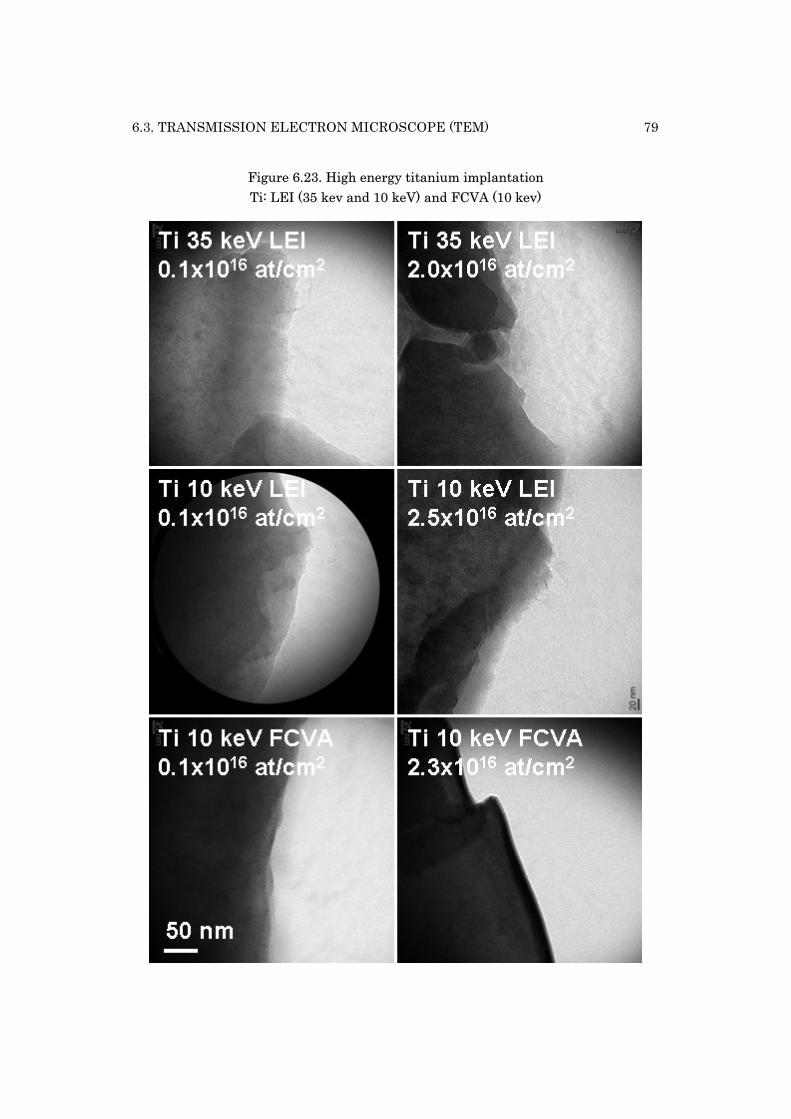
6.3. TRANSMISSION ELECTRON MICROSCOPE (TEM) 79
Figure 6.23. High energy titanium implantation Ti: LEI (35 kev and 10 keV) and FCVA (10 kev)
80 CHAPTER 6. MICROSTRUCTURE OF THE IMPLANTED PDMS
Figure 6.24. Low energy FCVA gold implantation Au (FCVA): 10 keV, 5 keV and 2.5 keV
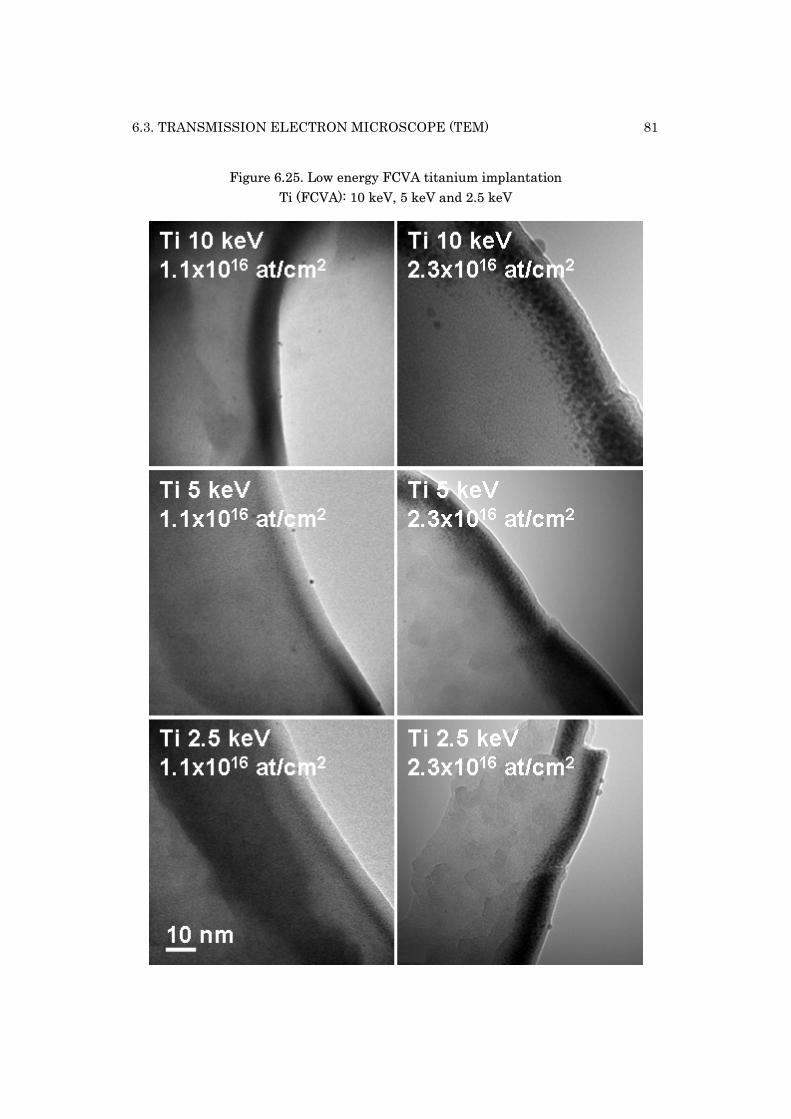
6.3. TRANSMISSION ELECTRON MICROSCOPE (TEM) 81
Figure 6.25. Low energy FCVA titanium implantation Ti (FCVA): 10 keV, 5 keV and 2.5 keV
82 CHAPTER 6. MICROSTRUCTURE OF THE IMPLANTED PDMS
6.3.6 Results and discussion
Penetration depth
From Figure 6.22 to Figure 6.25 one can see that the maximal penetration depth of the ions implanted with LEI fits well with the TRIM program simulation (see Figure 2.5). For Gold, the simulation predicts the maximal penetration depth for 35 keV, 10 keV, 5 keV and 2.5 keV to be respectively around 60 nm, 40 nm, 30 nm and 20 nm. For the titanium implantations for the same four above mentioned energies it is respectively 120 nm, 50 nm, 30 nm and 20 nm. Thus the penetration depths of 60 nm and 40 nm for gold ions, and 120 nm and 50 nm for titanium ions can be observed in Figure 6.22 and Figure 6.23 for LEI implantations.
For the FCVA implantations lower values than those predicted by TRIM were measured. However the ratios between the values obtained for the different energies are roughly the same. This shift of the measured penetration depths toward lower values is due to the energy drop of FCVA, see Section 2.7. Since theses values will be later used for the calculation of the volume fraction and modeling of the physical properties, a more detailed measurements will be explained and shown in the next section (see Table 6.4 and Section 6.3.7).
Surface states
By looking at the top surface of implanted PDMS one can notice different states if comparing LEI with FCVA implantations. Independent from the element, while the FCVA samples have well distinguished, smooth and continuous border, the LEI samples show a rather broken, disrupted surface. Again this can be explained by the high constant ion energy produced by LEI, contrarily to the variable acceleration energy delivered by FCVA, inducing more important chemical changes of the PDMS structure (surface) than the FCVA implantations.
Morphology of the titanium composites
The titanium implantations with LEI present big rigid blocks of implanted layer separated partially or completely from the non-implanted PDMS layer during the cross-section preparation at low temperatures. The samples have cracks and different color if compared to the pristine PDMS. In Section 2.5 diverse influences of MII on polymers have been discussed such as increase of harness, surface roughness or volume density. Titanium is a chemically very reactive element. In microtechnology it is used as intermediate adhesive layer since it binds strongly with almost any other element or molecule. In Section 6.1 XPS measurements have been discussed showing important changes of the chemical structure of PDMS. If trying to cut high-dose implanted Ti samples (i.e. 2.3x10¹⁶ at/cm2) in very thin lamella (i.e. 20-30 nm), the implanted layer (composite) cracked and separated almost completely from the non-
6.3. TRANSMISSION ELECTRON MICROSCOPE (TEM) 83
implanted layer. This phenomenon is even more pronounced if dose and energy are increased. Thus below percolation threshold titanium ions form amorphous aggregates since the isolated titanium ions strongly bind with PDMS. At high doses, above percolation threshold the whole composite layer behaves as a homogenized uniform structure with hardness that depends on the dose and energy.
For the FCVA titanium implantation the most important observation is that, with contrast to gold or LEI implantations, titanium ions are implanted under the surface. The surface below it still present some small cracks but is much better preserved as compared with LEI implantations. For all the three energies at low dose a dark area present the implanted region. At high doses, i.e. 2.3x10¹⁶ at/cm2 and above, small dark regions can be observed. Their size cannot be determined since their shape cannot be defined. The electron diffraction of these artifacts reveals an amorphous structure, Figure 6.26. Their size increases with the dose and with energy. At high doses above 2.3x10¹⁶ at/cm2 they form homogeneous grey layer. From all these observations it follows that these regions must be domains of high titanium concentration, i.e. highly titanium doped PDMS. The reason for the lack of titanium clusters lies in its electronegativity which is the lowest (1.54) if compared to the PDMS atoms (Si – 1.9, H – 2.2, C – 2.55, O – 3.44). Consequently Titanium will rather bind with the PDMS molecules than with itself.
Morphology of the gold composites
The three layers observed by Yuguang et al. for PET implantation with Gold [148], is not present on any of the images showing FCVA gold implanted samples. Three independent explanations may be the reason for this.
The first one is the fact that during the very short time of the pulse, i.e. 600 μs, while accelerating the ions toward the surface the accelerating electrical field drops due to the impact of 17.5x10¹² at/cm2 of double charged Au ions on the probe. Consequently only the first part of the accelerated packet of particles has the predetermined energy. The other ions inside of the same pulse are then implanted with the rest of the potential (see Section 2.7). In addition to that in some stage of the implantation there may be an accumulation of the charge on the surface of the insulating polymer that repulses the incoming ions.
The second aspect explaining the missing surface is the effect of the distribution of the ionic charge. In fact around 10% of the particles are simply charged, 75% double and about 5% triple charged ions. In the low doses regime this may not have a big influence on the implanted layer, but at high concentrations, e.g. 2.3x10¹⁶at/cm2, 1/10 of the dose is a non-negligible value. Thus the 3 times charged particles have the highest energy and could be an explanation for the small isolated clusters situated deeply under the highly concentrated metallic layer.
The third explanation for the clusters on the surface is sputtering. With energy of 5keV simulations have shown that at the dose 2x10¹⁶at/cm2 there are roughly 2 atoms of gold sputtered out of PDMS by each penetrating gold ion. If the simulation is right this means around 2x10¹⁶at/cm2 there is a steady state condition: the amount one deposits is the amount one sputters.
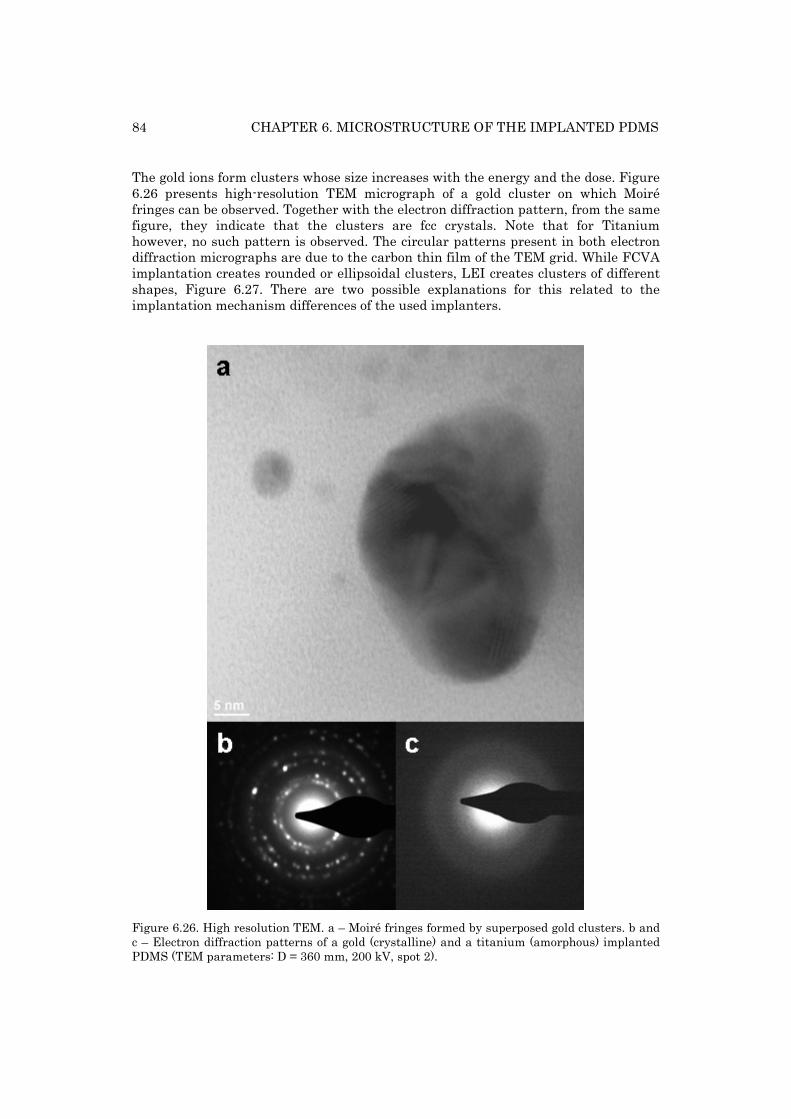
84 CHAPTER 6. MICROSTRUCTURE OF THE IMPLANTED PDMS
The gold ions form clusters whose size increases with the energy and the dose. Figure 6.26 presents high-resolution TEM micrograph of a gold cluster on which Moiré fringes can be observed. Together with the electron diffraction pattern, from the same figure, they indicate that the clusters are fcc crystals. Note that for Titanium however, no such pattern is observed. The circular patterns present in both electron diffraction micrographs are due to the carbon thin film of the TEM grid. While FCVA implantation creates rounded or ellipsoidal clusters, LEI creates clusters of different shapes, Figure 6.27. There are two possible explanations for this related to the implantation mechanism differences of the used implanters.
Figure 6.26. High resolution TEM. a – Moiré fringes formed by superposed gold clusters. b and c – Electron diffraction patterns of a gold (crystalline) and a titanium (amorphous) implanted PDMS (TEM parameters: D = 360 mm, 200 kV, spot 2).
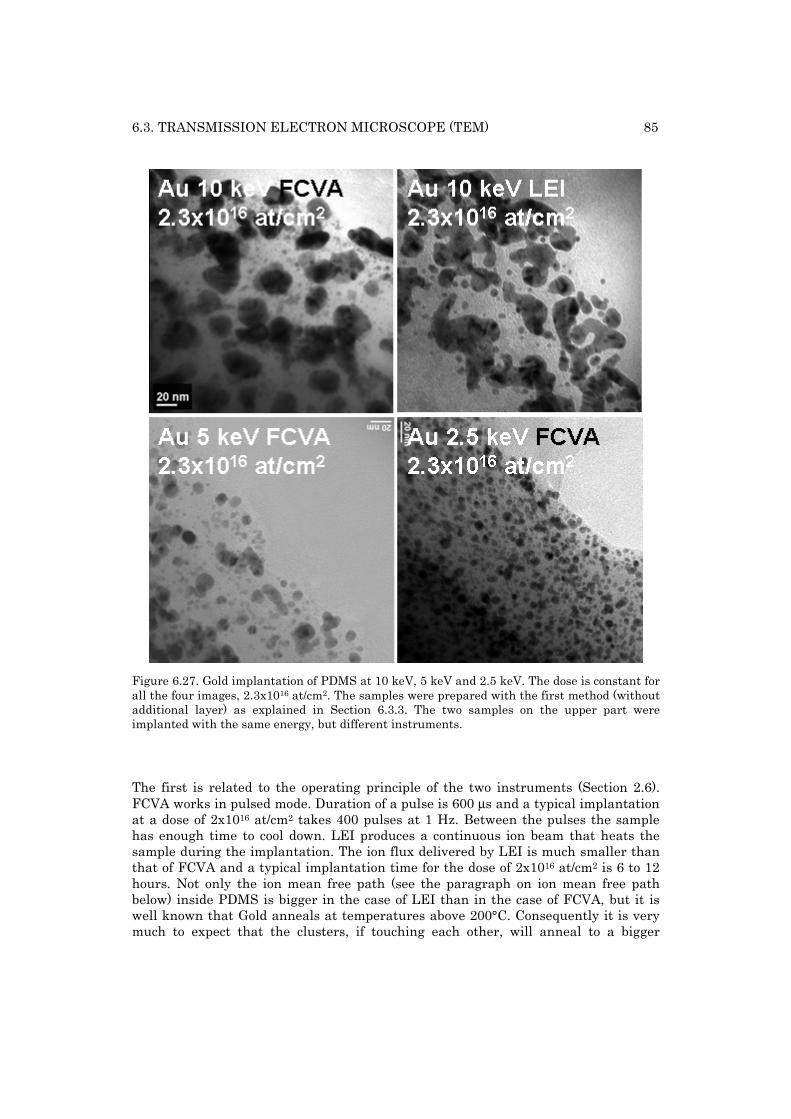
6.3. TRANSMISSION ELECTRON MICROSCOPE (TEM) 85
Figure 6.27. Gold implantation of PDMS at 10 keV, 5 keV and 2.5 keV. The dose is constant for all the four images, 2.3x10¹⁶ at/cm2. The samples were prepared with the first method (without additional layer) as explained in Section 6.3.3. The two samples on the upper part were implanted with the same energy, but different instruments.
The first is related to the operating principle of the two instruments (Section 2.6). FCVA works in pulsed mode. Duration of a pulse is 600 μs and a typical implantation at a dose of 2x10¹⁶ at/cm2 takes 400 pulses at 1 Hz. Between the pulses the sample has enough time to cool down. LEI produces a continuous ion beam that heats the sample during the implantation. The ion flux delivered by LEI is much smaller than that of FCVA and a typical implantation time for the dose of 2x10¹⁶ at/cm2 is 6 to 12 hours. Not only the ion mean free path (see the paragraph on ion mean free path below) inside PDMS is bigger in the case of LEI than in the case of FCVA, but it is well known that Gold anneals at temperatures above 200°C. Consequently it is very much to expect that the clusters, if touching each other, will anneal to a bigger
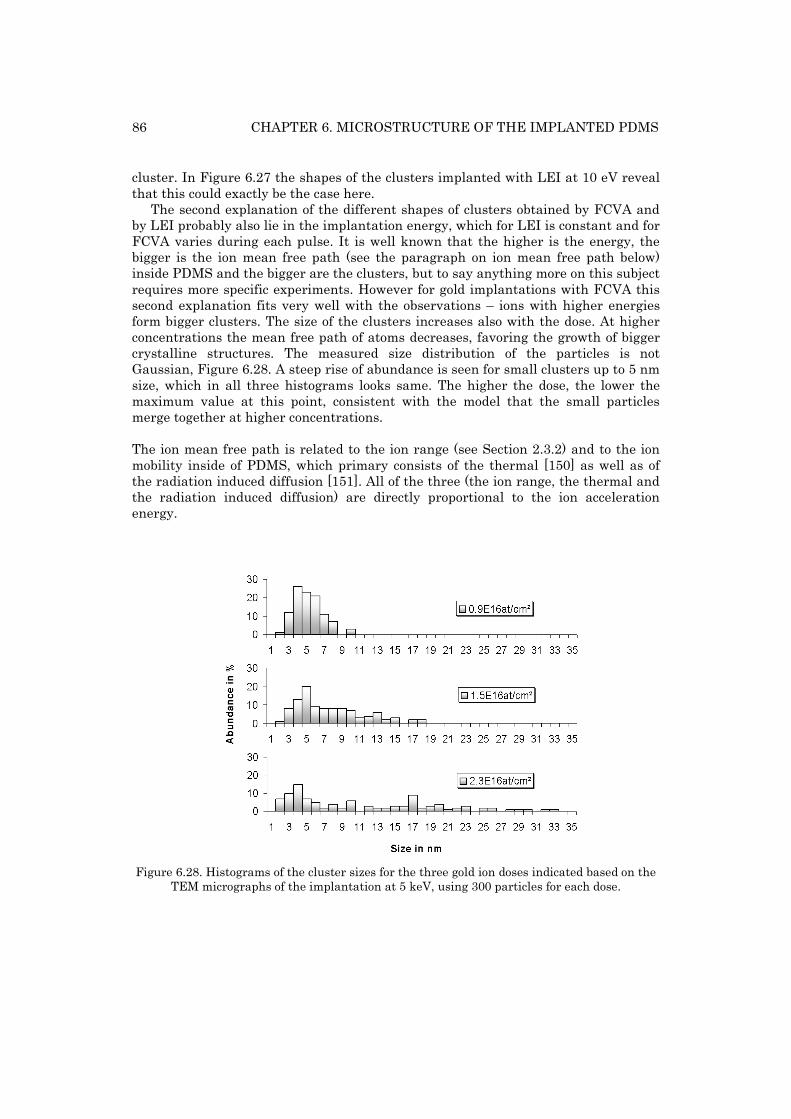
86 CHAPTER 6. MICROSTRUCTURE OF THE IMPLANTED PDMS
cluster. In Figure 6.27 the shapes of the clusters implanted with LEI at 10 eV reveal that this could exactly be the case here.
The second explanation of the different shapes of clusters obtained by FCVA and by LEI probably also lie in the implantation energy, which for LEI is constant and for FCVA varies during each pulse. It is well known that the higher is the energy, the bigger is the ion mean free path (see the paragraph on ion mean free path below) inside PDMS and the bigger are the clusters, but to say anything more on this subject requires more specific experiments. However for gold implantations with FCVA this second explanation fits very well with the observations – ions with higher energies form bigger clusters. The size of the clusters increases also with the dose. At higher concentrations the mean free path of atoms decreases, favoring the growth of bigger crystalline structures. The measured size distribution of the particles is not Gaussian, Figure 6.28. A steep rise of abundance is seen for small clusters up to 5 nm size, which in all three histograms looks same. The higher the dose, the lower the maximum value at this point, consistent with the model that the small particles merge together at higher concentrations.
The ion mean free path is related to the ion range (see Section 2.3.2) and to the ion mobility inside of PDMS, which primary consists of the thermal [150] as well as of the radiation induced diffusion [151]. All of the three (the ion range, the thermal and the radiation induced diffusion) are directly proportional to the ion acceleration energy.
Figure 6.28. Histograms of the cluster sizes for the three gold ion doses indicated based on the
TEM micrographs of the implantation at 5 keV, using 300 particles for each dose.
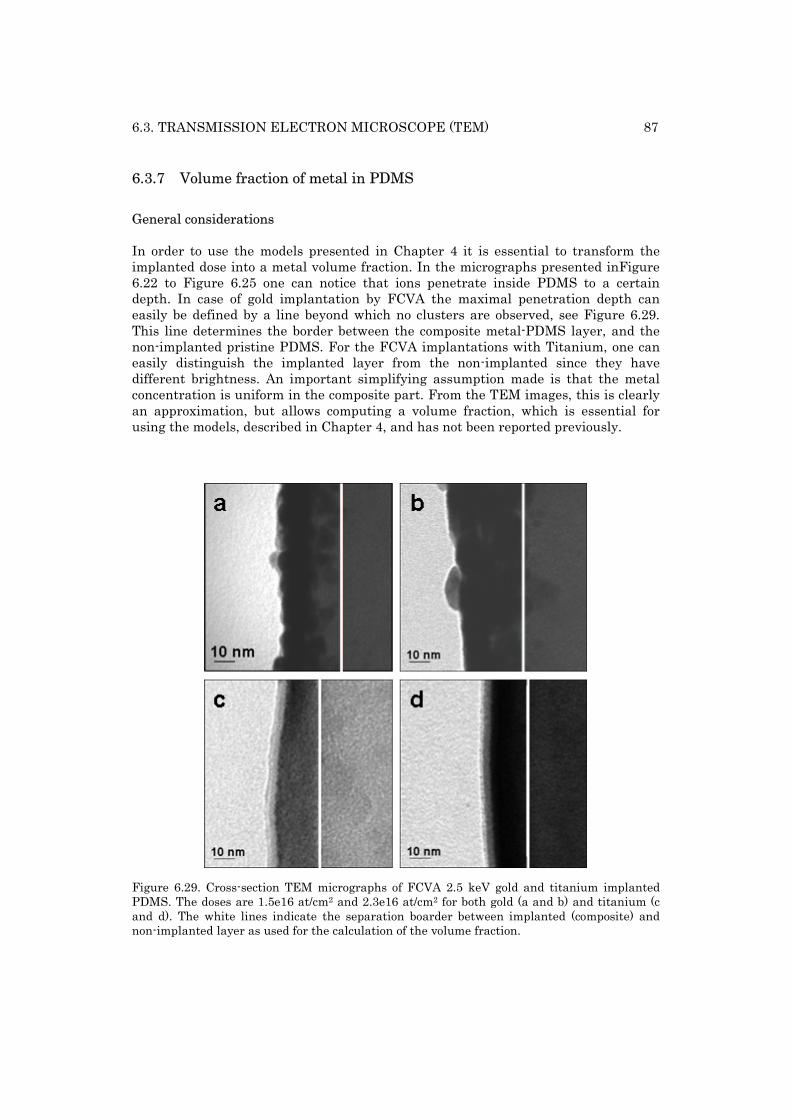
6.3. TRANSMISSION ELECTRON MICROSCOPE (TEM) 87
6.3.7 Volume fraction of metal in PDMS
General considerations
In order to use the models presented in Chapter 4 it is essential to transform the implanted dose into a metal volume fraction. In the micrographs presented inFigure 6.22 to Figure 6.25 one can notice that ions penetrate inside PDMS to a certain depth. In case of gold implantation by FCVA the maximal penetration depth can easily be defined by a line beyond which no clusters are observed, see Figure 6.29. This line determines the border between the composite metal-PDMS layer, and the non-implanted pristine PDMS. For the FCVA implantations with Titanium, one can easily distinguish the implanted layer from the non-implanted since they have different brightness. An important simplifying assumption made is that the metal concentration is uniform in the composite part. From the TEM images, this is clearly an approximation, but allows computing a volume fraction, which is essential for using the models, described in Chapter 4, and has not been reported previously.
Figure 6.29. Cross-section TEM micrographs of FCVA 2.5 keV gold and titanium implanted PDMS. The doses are 1.5e16 at/cm2 and 2.3e16 at/cm2 for both gold (a and b) and titanium (c and d). The white lines indicate the separation boarder between implanted (composite) and non-implanted layer as used for the calculation of the volume fraction.
88 CHAPTER 6. MICROSTRUCTURE OF THE IMPLANTED PDMS
For LEI implantations the determination of the maximal penetration depth is very difficult. In case of Gold, the created clusters have different shapes and orientations. A delimiting line can be drawn, but the variations over different places on one sample are very large. This may well depends on the surface roughness, see Section 6.1.3. TRIM simulation show that for an angle of incidence of 0°, which is defined as the angle between the ion beam and the surface normal, the mean penetration depth of gold ions is 22 nm, where else for 45° it is only 15 nm. Since LEI implantations produce much higher surface roughness than FCVA this induces also much bigger error on the average value of the penetration depth. In case of Titanium implanted with LEI, the surface state (the rigid blocks and cracks) does not allow any concrete determination of the penetration depth. It varies between 100 nm and 200 nm for 35 keV and between 50 nm and 100 nm for 10 keV. In the next chapter the mechanical and electrical properties of LEI and FCVA implantations of PDMS will be presented. It will be shown that the physical properties obtained by LEI are very different from those obtained by FCVA: Gold implantation with LEI does not lead to a conductive composite, and titanium implantation will induce huge increase of Young’s modulus leading to cracks on the surface. Since the first main goal of this PhD work is to create a flexible conductive composite, LEI implantation will not be used for this purpose. Additionally because the influences of the cracks on mechanical properties are not included by the modeling theories from Chapter 4, the models will not be applied on the measured electrical and mechanical results of the LEI implanted samples. Due to these arguments and supported by the fact that the maximal penetration depth of the LEI samples can only be determined with enormous error, the volume fraction will only be calculated here for FCVA implanted samples. Nevertheless in the next Chapter, only because of the possible comparison with the FCVA, the electrical conductivity of LEI implanted samples will be expressed also as a function of the volume fraction and short discussion on the found percolation parameters will be made.
Procedure to compute the volume fraction
For each energy (FCVA 2.5 keV, 5 keV and 10 keV) 10 images were chosen for gold and titanium implanted samples. The maximal penetration depth line was drawn for each image, determined by the deepest particles, Figure 6.29. For each image the distance between the surface and the line was measured. Since the maximal penetration depth h does not vary with the dose, the average value has been calculated for each energy and element. The results are presented in Table 6.4. The error values Δhi are the variances of the distributions of the measured depths hi. In order to calculate the volume fraction f one must know the volume of the implanted atoms VC and divide it by a total volume of the composite V. Since surfaces of the volumes are equal, this resumes to the ratio hc/h, with hc and h being the height of the implanted ions and the height of the composite (maximal penetration depth). hc is obtained by dividing the atomic weigh of element Mm (e.g. 196.97 g/mol for Au) with density ρ (e.g. 19.3 g/cm3), which equals to the volume of one mole Vm, and by multiplying the result with the implanted dose D expressed in moles (NA):
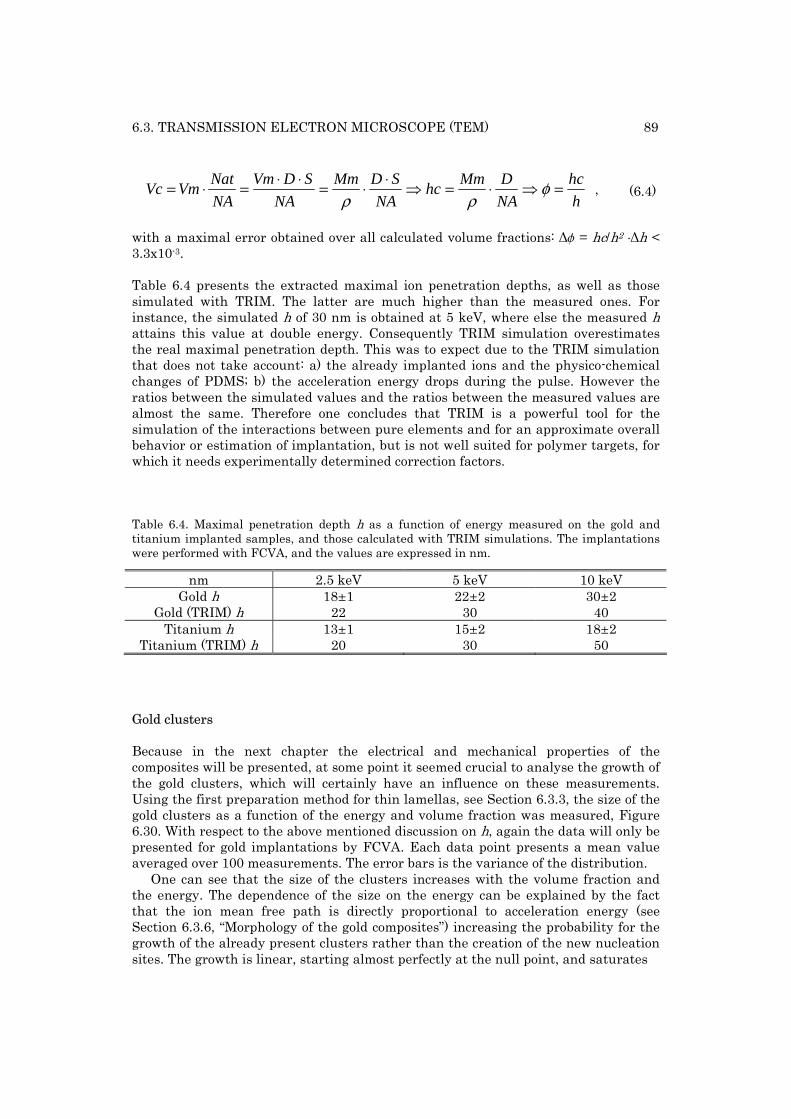
6.3. TRANSMISSION ELECTRON MICROSCOPE (TEM) 89
h
hc
NA
DMmhc
NA
SDMm
NA
SDVm
NA
NatVmVc =⇒⋅=⇒
⋅⋅=⋅⋅=⋅= φρρ
, (6.4)
with a maximal error obtained over all calculated volume fractions: Δf = hc/h2 ÿΔh < 3.3x10⁻³. Table 6.4 presents the extracted maximal ion penetration depths, as well as those simulated with TRIM. The latter are much higher than the measured ones. For instance, the simulated h of 30 nm is obtained at 5 keV, where else the measured h attains this value at double energy. Consequently TRIM simulation overestimates the real maximal penetration depth. This was to expect due to the TRIM simulation that does not take account: a) the already implanted ions and the physico-chemical changes of PDMS; b) the acceleration energy drops during the pulse. However the ratios between the simulated values and the ratios between the measured values are almost the same. Therefore one concludes that TRIM is a powerful tool for the simulation of the interactions between pure elements and for an approximate overall behavior or estimation of implantation, but is not well suited for polymer targets, for which it needs experimentally determined correction factors. Table 6.4. Maximal penetration depth h as a function of energy measured on the gold and titanium implanted samples, and those calculated with TRIM simulations. The implantations were performed with FCVA, and the values are expressed in nm.
nm 2.5 keV 5 keV 10 keV Gold h 18≤1 22≤2 30≤2
Gold (TRIM) h 22 30 40 Titanium h 13≤1 15≤2 18≤2
Titanium (TRIM) h 20 30 50
Gold clusters
Because in the next chapter the electrical and mechanical properties of the composites will be presented, at some point it seemed crucial to analyse the growth of the gold clusters, which will certainly have an influence on these measurements. Using the first preparation method for thin lamellas, see Section 6.3.3, the size of the gold clusters as a function of the energy and volume fraction was measured, Figure 6.30. With respect to the above mentioned discussion on h, again the data will only be presented for gold implantations by FCVA. Each data point presents a mean value averaged over 100 measurements. The error bars is the variance of the distribution.
One can see that the size of the clusters increases with the volume fraction and the energy. The dependence of the size on the energy can be explained by the fact that the ion mean free path is directly proportional to acceleration energy (see Section 6.3.6, “Morphology of the gold composites”) increasing the probability for the growth of the already present clusters rather than the creation of the new nucleation sites. The growth is linear, starting almost perfectly at the null point, and saturates
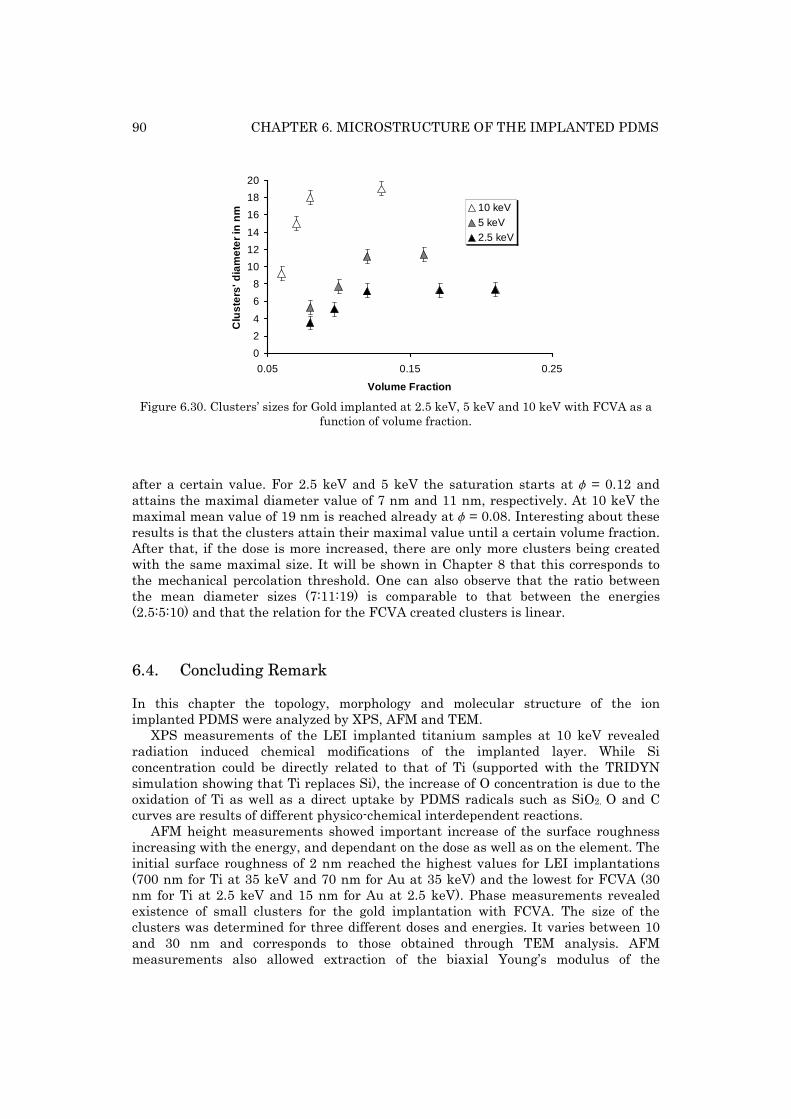
90 CHAPTER 6. MICROSTRUCTURE OF THE IMPLANTED PDMS
0
2
4
6
8
10
12
14
16
18
20
0.05 0.15 0.25
Volume Fraction
Clu
ster
s' d
iam
eter
in n
m 10 keV5 keV2.5 keV
Figure 6.30. Clusters’ sizes for Gold implanted at 2.5 keV, 5 keV and 10 keV with FCVA as a
function of volume fraction.
after a certain value. For 2.5 keV and 5 keV the saturation starts at f = 0.12 and attains the maximal diameter value of 7 nm and 11 nm, respectively. At 10 keV the maximal mean value of 19 nm is reached already at f = 0.08. Interesting about these results is that the clusters attain their maximal value until a certain volume fraction. After that, if the dose is more increased, there are only more clusters being created with the same maximal size. It will be shown in Chapter 8 that this corresponds to the mechanical percolation threshold. One can also observe that the ratio between the mean diameter sizes (7:11:19) is comparable to that between the energies (2.5:5:10) and that the relation for the FCVA created clusters is linear.
6.4. Concluding Remark
In this chapter the topology, morphology and molecular structure of the ion implanted PDMS were analyzed by XPS, AFM and TEM.
XPS measurements of the LEI implanted titanium samples at 10 keV revealed radiation induced chemical modifications of the implanted layer. While Si concentration could be directly related to that of Ti (supported with the TRIDYN simulation showing that Ti replaces Si), the increase of O concentration is due to the oxidation of Ti as well as a direct uptake by PDMS radicals such as SiO2. O and C curves are results of different physico-chemical interdependent reactions.
AFM height measurements showed important increase of the surface roughness increasing with the energy, and dependant on the dose as well as on the element. The initial surface roughness of 2 nm reached the highest values for LEI implantations (700 nm for Ti at 35 keV and 70 nm for Au at 35 keV) and the lowest for FCVA (30 nm for Ti at 2.5 keV and 15 nm for Au at 2.5 keV). Phase measurements revealed existence of small clusters for the gold implantation with FCVA. The size of the clusters was determined for three different doses and energies. It varies between 10 and 30 nm and corresponds to those obtained through TEM analysis. AFM measurements also allowed extraction of the biaxial Young’s modulus of the
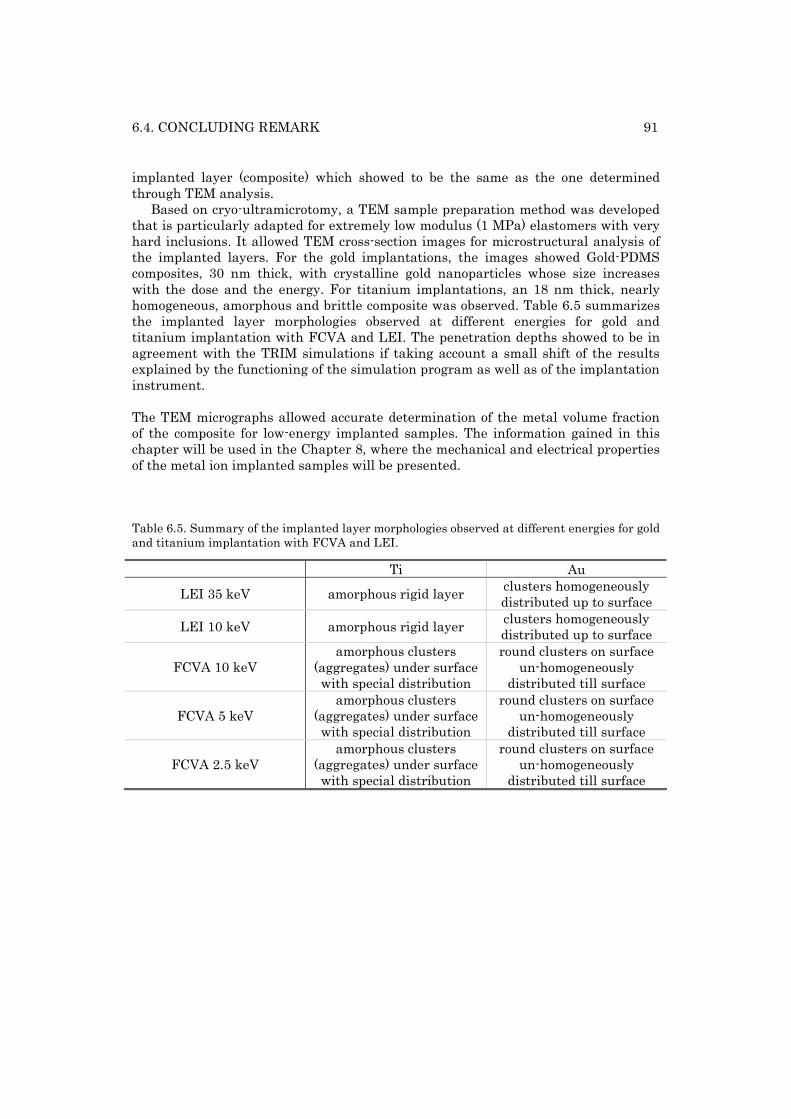
6.4. CONCLUDING REMARK 91
implanted layer (composite) which showed to be the same as the one determined through TEM analysis.
Based on cryo-ultramicrotomy, a TEM sample preparation method was developed that is particularly adapted for extremely low modulus (1 MPa) elastomers with very hard inclusions. It allowed TEM cross-section images for microstructural analysis of the implanted layers. For the gold implantations, the images showed Gold-PDMS composites, 30 nm thick, with crystalline gold nanoparticles whose size increases with the dose and the energy. For titanium implantations, an 18 nm thick, nearly homogeneous, amorphous and brittle composite was observed. Table 6.5 summarizes the implanted layer morphologies observed at different energies for gold and titanium implantation with FCVA and LEI. The penetration depths showed to be in agreement with the TRIM simulations if taking account a small shift of the results explained by the functioning of the simulation program as well as of the implantation instrument. The TEM micrographs allowed accurate determination of the metal volume fraction of the composite for low-energy implanted samples. The information gained in this chapter will be used in the Chapter 8, where the mechanical and electrical properties of the metal ion implanted samples will be presented. Table 6.5. Summary of the implanted layer morphologies observed at different energies for gold and titanium implantation with FCVA and LEI.
Ti Au
LEI 35 keV amorphous rigid layer clusters homogeneously distributed up to surface
LEI 10 keV amorphous rigid layer clusters homogeneously distributed up to surface
FCVA 10 keV amorphous clusters
(aggregates) under surface with special distribution
round clusters on surface un-homogeneously
distributed till surface
FCVA 5 keV amorphous clusters
(aggregates) under surface with special distribution
round clusters on surface un-homogeneously
distributed till surface
FCVA 2.5 keV amorphous clusters
(aggregates) under surface with special distribution
round clusters on surface un-homogeneously
distributed till surface

93
Chapter 7
7. Experimental setups for testing the mechanical, electrical and optical properties of the ion-implanted PDMS
The preparation of the samples was presented in Chapter 5. The procedure for the production of the PDMS thin films and membranes on Pyrex chip was shown. It was also explained how and under which conditions these samples were afterwards treated i.e. implanted or irradiated. Here, in this chapter, the experimental setups used to determine the Young’s modulus, the electrical conductivity, the optical transmission and the dielectric breakdown of the virgin and treated samples will be presented. The results and their discussions are in the next chapter.
7.1. Electrical conductivity measurements
The samples for the conductivity measurements consist of 30 μm thick layer of PDMS bonded on a 1 cm2 pyrex chip. The implantation is performed through a stainless steel mask, placed in contact on the top of the sample, with an opening of 0.5 x 0.5 cm2. After the implantation two gold electrodes were deposited over the implanted area leaving an implanted track in between of a size of 0.5 x 5 mm2, Figure 7.1. Gold and titanium implantations were performed with LEI and FCVA at all the energies and doses as mentioned in Section 5.3. The DC conductivity measurements were performed with a standard multimeter by contacting the two electrodes. Since the spacing between the electrodes corresponds to 10 squares, the measured resistance was multiplied with 10 and is expressed in kΩ/square. Hence the electrical conductivity is presented in (kΩ/square)-1. While the electrical properties of the gold implanted samples remain stable with the time, the titanium implanted samples oxidize. Therefore the results presented here were taken shortly after the implantation.
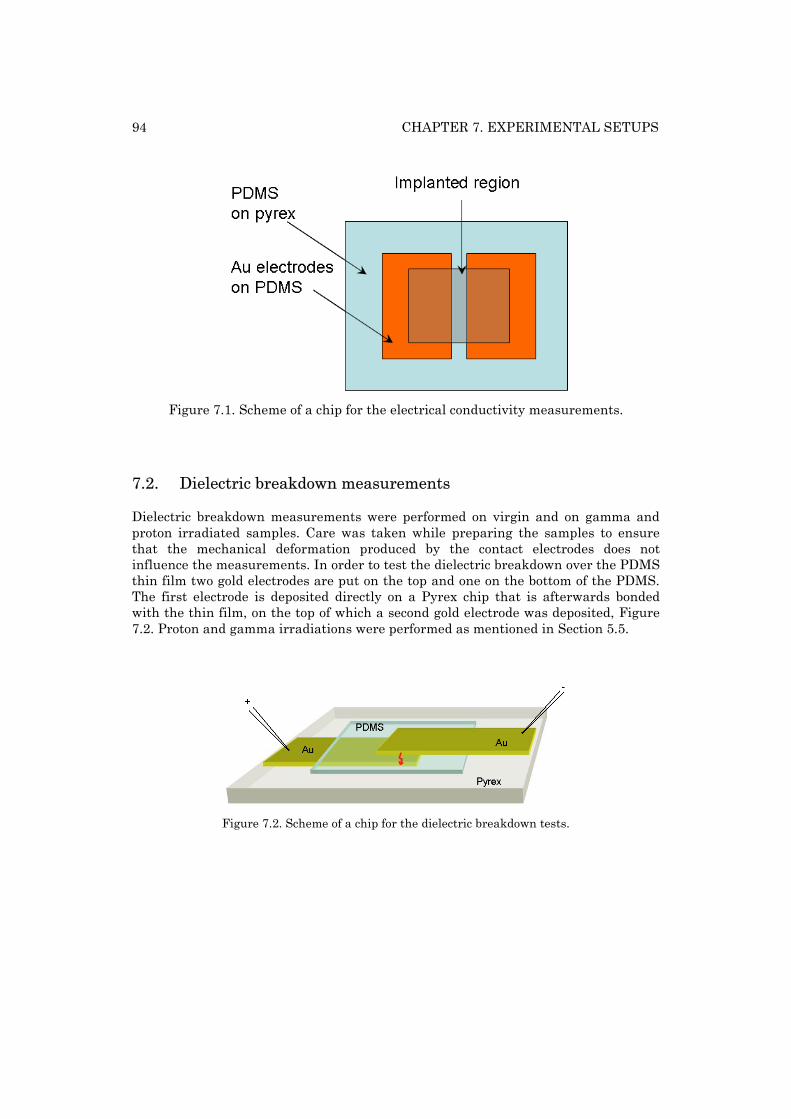
94 CHAPTER 7. EXPERIMENTAL SETUPS
Figure 7.1. Scheme of a chip for the electrical conductivity measurements.
7.2. Dielectric breakdown measurements
Dielectric breakdown measurements were performed on virgin and on gamma and proton irradiated samples. Care was taken while preparing the samples to ensure that the mechanical deformation produced by the contact electrodes does not influence the measurements. In order to test the dielectric breakdown over the PDMS thin film two gold electrodes are put on the top and one on the bottom of the PDMS. The first electrode is deposited directly on a Pyrex chip that is afterwards bonded with the thin film, on the top of which a second gold electrode was deposited, Figure 7.2. Proton and gamma irradiations were performed as mentioned in Section 5.5.
Figure 7.2. Scheme of a chip for the dielectric breakdown tests.
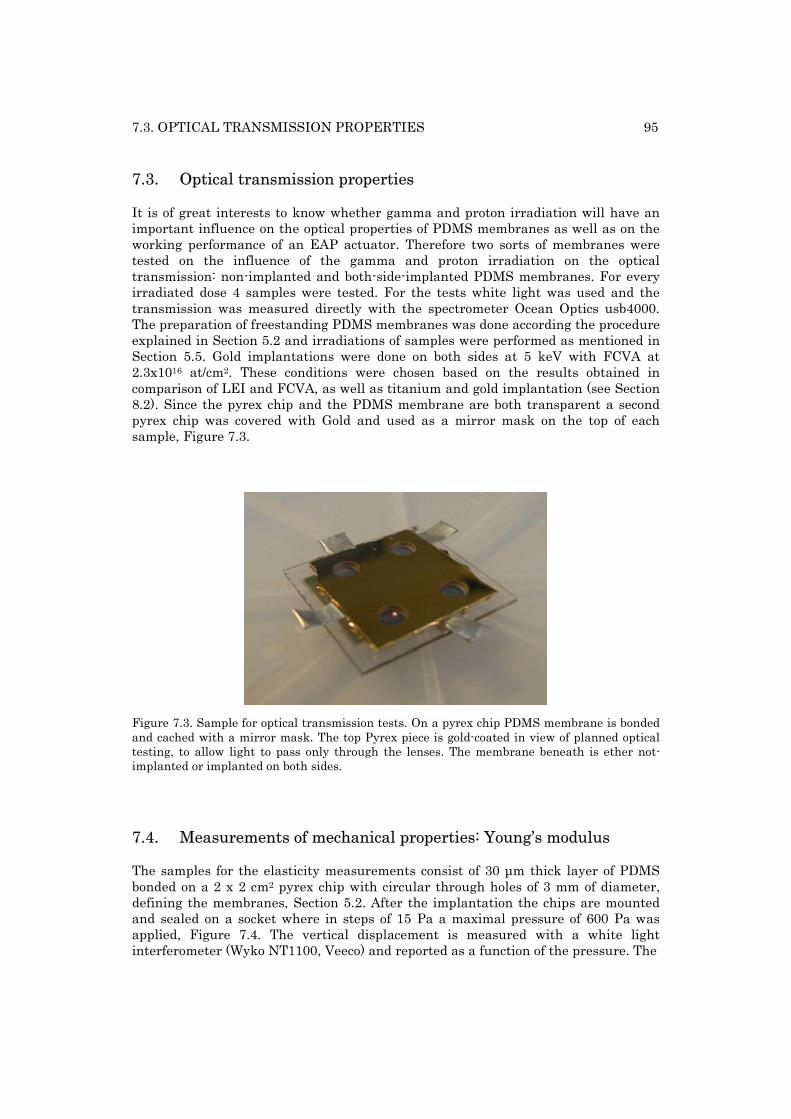
7.3. OPTICAL TRANSMISSION PROPERTIES 95
7.3. Optical transmission properties
It is of great interests to know whether gamma and proton irradiation will have an important influence on the optical properties of PDMS membranes as well as on the working performance of an EAP actuator. Therefore two sorts of membranes were tested on the influence of the gamma and proton irradiation on the optical transmission: non-implanted and both-side-implanted PDMS membranes. For every irradiated dose 4 samples were tested. For the tests white light was used and the transmission was measured directly with the spectrometer Ocean Optics usb4000. The preparation of freestanding PDMS membranes was done according the procedure explained in Section 5.2 and irradiations of samples were performed as mentioned in Section 5.5. Gold implantations were done on both sides at 5 keV with FCVA at 2.3x10¹⁶ at/cm2. These conditions were chosen based on the results obtained in comparison of LEI and FCVA, as well as titanium and gold implantation (see Section 8.2). Since the pyrex chip and the PDMS membrane are both transparent a second pyrex chip was covered with Gold and used as a mirror mask on the top of each sample, Figure 7.3.
Figure 7.3. Sample for optical transmission tests. On a pyrex chip PDMS membrane is bonded and cached with a mirror mask. The top Pyrex piece is gold-coated in view of planned optical testing, to allow light to pass only through the lenses. The membrane beneath is ether not-implanted or implanted on both sides.
7.4. Measurements of mechanical properties: Young’s modulus
The samples for the elasticity measurements consist of 30 μm thick layer of PDMS bonded on a 2 x 2 cm2 pyrex chip with circular through holes of 3 mm of diameter, defining the membranes, Section 5.2. After the implantation the chips are mounted and sealed on a socket where in steps of 15 Pa a maximal pressure of 600 Pa was applied, Figure 7.4. The vertical displacement is measured with a white light interferometer (Wyko NT1100, Veeco) and reported as a function of the pressure. The
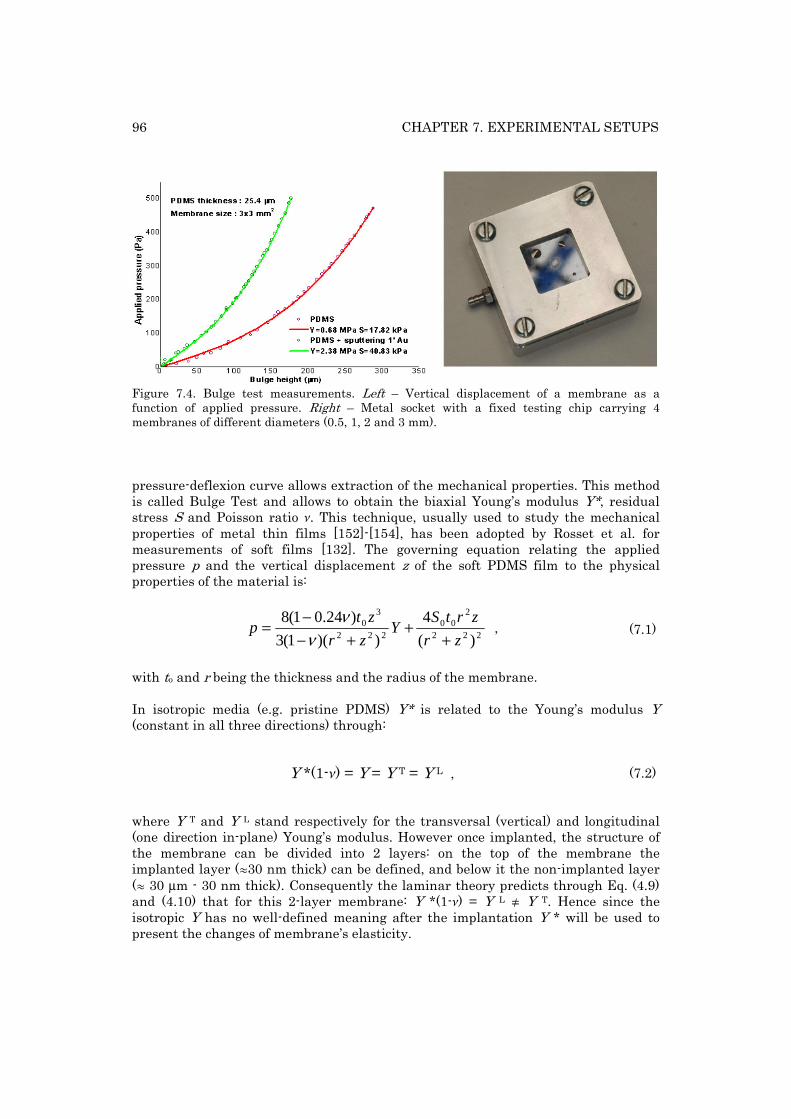
96 CHAPTER 7. EXPERIMENTAL SETUPS
Figure 7.4. Bulge test measurements. Left – Vertical displacement of a membrane as a function of applied pressure. Right – Metal socket with a fixed testing chip carrying 4 membranes of different diameters (0.5, 1, 2 and 3 mm). pressure-deflexion curve allows extraction of the mechanical properties. This method is called Bulge Test and allows to obtain the biaxial Young’s modulus Y*, residual stress S and Poisson ratio n. This technique, usually used to study the mechanical properties of metal thin films [152]-[154], has been adopted by Rosset et al. for measurements of soft films [132]. The governing equation relating the applied pressure p and the vertical displacement z of the soft PDMS film to the physical properties of the material is:
222
200
222
30
)(
4
))(1(3
)24.01(8
zr
zrtSY
zr
ztp
++
+−−
=ν
ν ,
(7.1)
with to and r being the thickness and the radius of the membrane. In isotropic media (e.g. pristine PDMS) Y* is related to the Young’s modulus Y (constant in all three directions) through:
Y *(1-n) = Y = Y T = Y L ,
(7.2)
where Y T and Y L stand respectively for the transversal (vertical) and longitudinal (one direction in-plane) Young’s modulus. However once implanted, the structure of the membrane can be divided into 2 layers: on the top of the membrane the implanted layer (º30 nm thick) can be defined, and below it the non-implanted layer (º 30 μm - 30 nm thick). Consequently the laminar theory predicts through Eq. (4.9) and (4.10) that for this 2-layer membrane: Y *(1-n) = Y L ∫ Y T. Hence since the isotropic Y has no well-defined meaning after the implantation Y * will be used to present the changes of membrane’s elasticity.
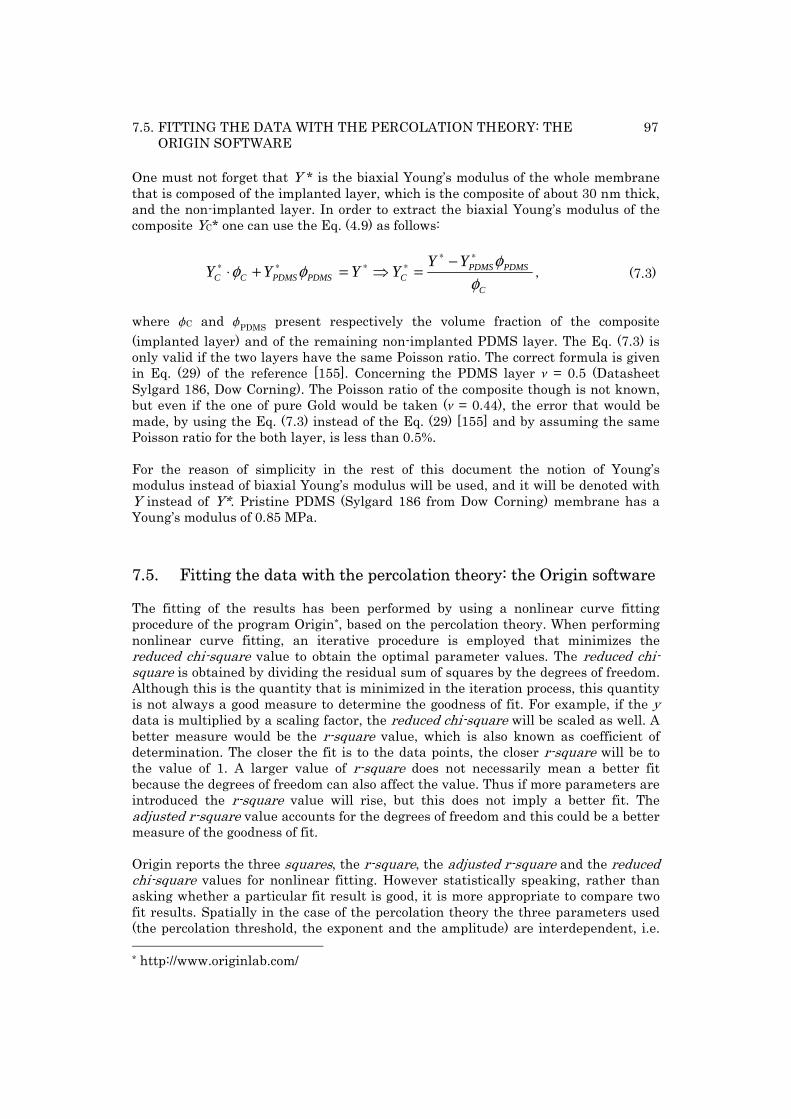
7.5. FITTING THE DATA WITH THE PERCOLATION THEORY: THE ORIGIN SOFTWARE
97
One must not forget that Y * is the biaxial Young’s modulus of the whole membrane that is composed of the implanted layer, which is the composite of about 30 nm thick, and the non-implanted layer. In order to extract the biaxial Young’s modulus of the composite YC* one can use the Eq. (4.9) as follows:
C
PDMSPDMSCPDMSPDMSCC
YYYYYY
φφφφ
∗∗∗∗∗∗ −
=⇒=+⋅ ,
(7.3)
where fC and fPDMS present respectively the volume fraction of the composite (implanted layer) and of the remaining non-implanted PDMS layer. The Eq. (7.3) is only valid if the two layers have the same Poisson ratio. The correct formula is given in Eq. (29) of the reference [155]. Concerning the PDMS layer n = 0.5 (Datasheet Sylgard 186, Dow Corning). The Poisson ratio of the composite though is not known, but even if the one of pure Gold would be taken (n = 0.44), the error that would be made, by using the Eq. (7.3) instead of the Eq. (29) [155] and by assuming the same Poisson ratio for the both layer, is less than 0.5%. For the reason of simplicity in the rest of this document the notion of Young’s modulus instead of biaxial Young’s modulus will be used, and it will be denoted with Y instead of Y*. Pristine PDMS (Sylgard 186 from Dow Corning) membrane has a Young’s modulus of 0.85 MPa.
7.5. Fitting the data with the percolation theory: the Origin software
The fitting of the results has been performed by using a nonlinear curve fitting procedure of the program Origin*, based on the percolation theory. When performing nonlinear curve fitting, an iterative procedure is employed that minimizes the reduced chi-square value to obtain the optimal parameter values. The reduced chi-square is obtained by dividing the residual sum of squares by the degrees of freedom. Although this is the quantity that is minimized in the iteration process, this quantity is not always a good measure to determine the goodness of fit. For example, if the y data is multiplied by a scaling factor, the reduced chi-square will be scaled as well. A better measure would be the r-square value, which is also known as coefficient of determination. The closer the fit is to the data points, the closer r-square will be to the value of 1. A larger value of r-square does not necessarily mean a better fit because the degrees of freedom can also affect the value. Thus if more parameters are introduced the r-square value will rise, but this does not imply a better fit. The adjusted r-square value accounts for the degrees of freedom and this could be a better measure of the goodness of fit. Origin reports the three squares, the r-square, the adjusted r-square and the reduced chi-square values for nonlinear fitting. However statistically speaking, rather than asking whether a particular fit result is good, it is more appropriate to compare two fit results. Spatially in the case of the percolation theory the three parameters used (the percolation threshold, the exponent and the amplitude) are interdependent, i.e. * http://www.originlab.com/

98 CHAPTER 7. EXPERIMENTAL SETUPS
determination of one parameter has direct influence on the others. The results presented in Table 8.4 and Table 8.5 were found by trying several times to fit the data with different initial iteration values and by comparing all the three squares.
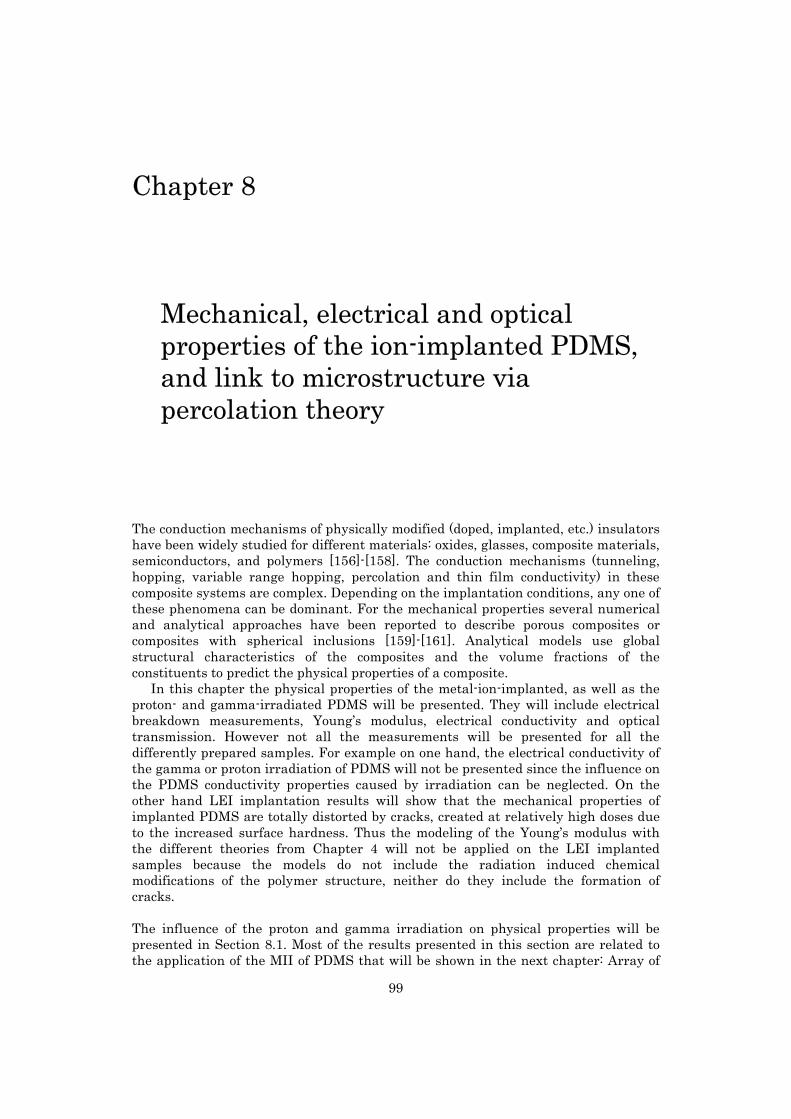
99
Chapter 8
8. Mechanical, electrical and optical properties of the ion-implanted PDMS, and link to microstructure via percolation theory
The conduction mechanisms of physically modified (doped, implanted, etc.) insulators have been widely studied for different materials: oxides, glasses, composite materials, semiconductors, and polymers [156]-[158]. The conduction mechanisms (tunneling, hopping, variable range hopping, percolation and thin film conductivity) in these composite systems are complex. Depending on the implantation conditions, any one of these phenomena can be dominant. For the mechanical properties several numerical and analytical approaches have been reported to describe porous composites or composites with spherical inclusions [159]-[161]. Analytical models use global structural characteristics of the composites and the volume fractions of the constituents to predict the physical properties of a composite.
In this chapter the physical properties of the metal-ion-implanted, as well as the proton- and gamma-irradiated PDMS will be presented. They will include electrical breakdown measurements, Young’s modulus, electrical conductivity and optical transmission. However not all the measurements will be presented for all the differently prepared samples. For example on one hand, the electrical conductivity of the gamma or proton irradiation of PDMS will not be presented since the influence on the PDMS conductivity properties caused by irradiation can be neglected. On the other hand LEI implantation results will show that the mechanical properties of implanted PDMS are totally distorted by cracks, created at relatively high doses due to the increased surface hardness. Thus the modeling of the Young’s modulus with the different theories from Chapter 4 will not be applied on the LEI implanted samples because the models do not include the radiation induced chemical modifications of the polymer structure, neither do they include the formation of cracks. The influence of the proton and gamma irradiation on physical properties will be presented in Section 8.1. Most of the results presented in this section are related to the application of the MII of PDMS that will be shown in the next chapter: Array of
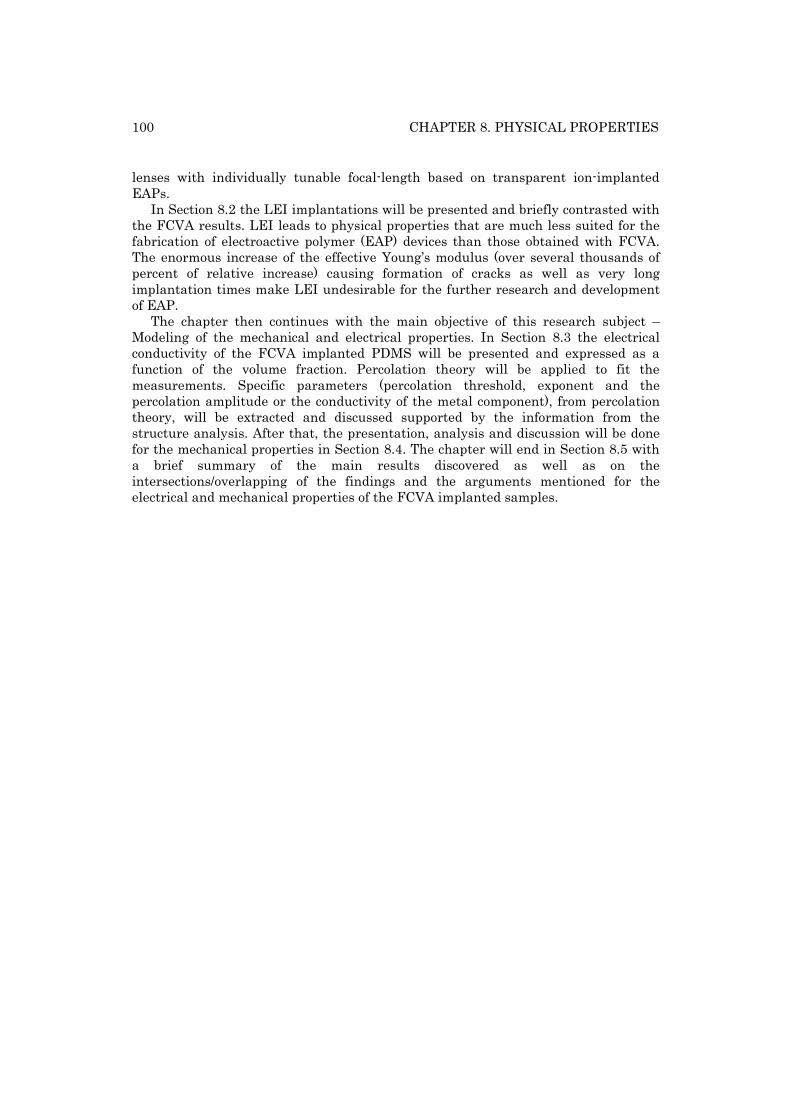
100 CHAPTER 8. PHYSICAL PROPERTIES
lenses with individually tunable focal-length based on transparent ion-implanted EAPs.
In Section 8.2 the LEI implantations will be presented and briefly contrasted with the FCVA results. LEI leads to physical properties that are much less suited for the fabrication of electroactive polymer (EAP) devices than those obtained with FCVA. The enormous increase of the effective Young’s modulus (over several thousands of percent of relative increase) causing formation of cracks as well as very long implantation times make LEI undesirable for the further research and development of EAP.
The chapter then continues with the main objective of this research subject – Modeling of the mechanical and electrical properties. In Section 8.3 the electrical conductivity of the FCVA implanted PDMS will be presented and expressed as a function of the volume fraction. Percolation theory will be applied to fit the measurements. Specific parameters (percolation threshold, exponent and the percolation amplitude or the conductivity of the metal component), from percolation theory, will be extracted and discussed supported by the information from the structure analysis. After that, the presentation, analysis and discussion will be done for the mechanical properties in Section 8.4. The chapter will end in Section 8.5 with a brief summary of the main results discovered as well as on the intersections/overlapping of the findings and the arguments mentioned for the electrical and mechanical properties of the FCVA implanted samples.
101
8.1. Physical properties of irradiated samples – Gamma and proton irradiation
The analysis of the changes in physical properties induced by gamma and proton irradiations was performed in the scope of the development of the tunable micro-optical lenses. The latter will be presented in Chapter 9 as an example of an application made by EAP created by MII of PDMS. A detailed discussion of the effect of irradiation on the physical properties of the implanted and native PDMS is beyond the scope of this thesis. Therefore the results of gamma and proton irradiation will be presented and only shortly discussed.
8.1.1 Gamma irradiation
12 PDMS samples were exposed to up to 12 kGy of gamma radiation (Co60), Figure 8.1. They were analyzed for mechanical, electrical and optical properties before and after the irradiation. The samples were prepared as explained in Section 7.2 (dielectric breakdown), 7.3 (optical) and 7.4 (mechanical). The samples have been irradiated at two different dose rates: 54 Krad/hr (in H2O) for the total ion dose (TID) of 11.8 kGy and 0.6 kGy, and 2.9 Krad/hr (in H2O) for the TID of 0.6 kGy.
Figure 8.1. Different samples tested after the irradiation.
102 CHAPTER 8. PHYSICAL PROPERTIES: GAMMA AND PROTON IRRADIATION
Breakdown Voltage vs. TID
Figure 8.2 shows a sample used for the dielectric breakdown measurements. The samples were prepared as described in Section 7.2. The results are presented in Table 8.1. The initial breakdown voltage was 2.8 kV. Since no important changes were observed (differences within the error) one can conclude that gamma radiation doesn’t have an important influence on the breakdown voltage. Xie et al. showed by the theoretical analysis and experimentally that it is the bandgap that determines the criterion for breaking polymer bonds in electrical breakdown and not the bonding energy of electrons to the polymer [162]. This means that the gamma irradiation mostly does not influence the main polymer structure (CH3)2SiO, but only creates cross-links between them.
Figure 8.2. Breakdown voltage sample.
Table 8.1. Influence of the irradiation on the breakdown voltage.
Radiation in Gy Breakdown voltage in kV11’840 2.6 ± 0.1
572 (18 h) 2.7 ± 0.1 594 (1.1 h) 2.8 ± 0.1
Mechanical properties vs. TID
The initial values of the Young’s modulus and the stress measured before the irradiation were Y = 2 MPa and S = 60 kPa. The results presented in Figure 8.3 show the relative increase of Y and S. The values are averaged over 4 membranes for the each dose.
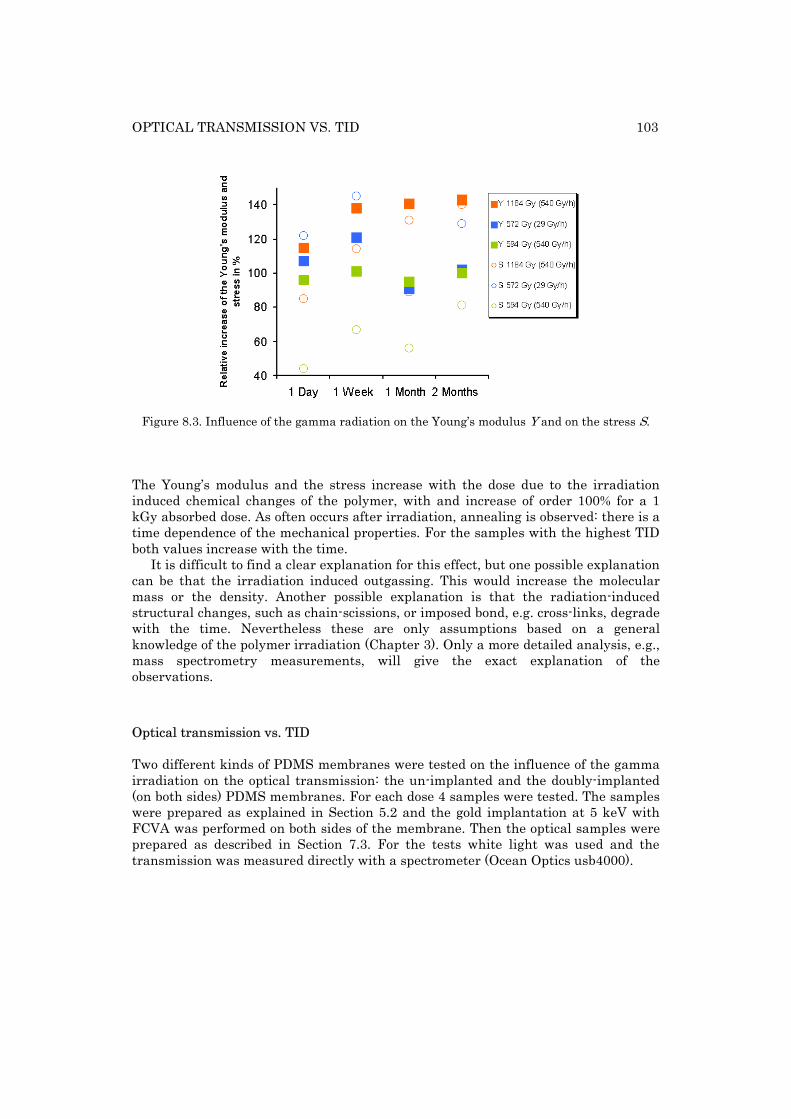
OPTICAL TRANSMISSION VS. TID 103
Figure 8.3. Influence of the gamma radiation on the Young’s modulus Y and on the stress S.
The Young’s modulus and the stress increase with the dose due to the irradiation induced chemical changes of the polymer, with and increase of order 100% for a 1 kGy absorbed dose. As often occurs after irradiation, annealing is observed: there is a time dependence of the mechanical properties. For the samples with the highest TID both values increase with the time.
It is difficult to find a clear explanation for this effect, but one possible explanation can be that the irradiation induced outgassing. This would increase the molecular mass or the density. Another possible explanation is that the radiation-induced structural changes, such as chain-scissions, or imposed bond, e.g. cross-links, degrade with the time. Nevertheless these are only assumptions based on a general knowledge of the polymer irradiation (Chapter 3). Only a more detailed analysis, e.g., mass spectrometry measurements, will give the exact explanation of the observations.
Optical transmission vs. TID
Two different kinds of PDMS membranes were tested on the influence of the gamma irradiation on the optical transmission: the un-implanted and the doubly-implanted (on both sides) PDMS membranes. For each dose 4 samples were tested. The samples were prepared as explained in Section 5.2 and the gold implantation at 5 keV with FCVA was performed on both sides of the membrane. Then the optical samples were prepared as described in Section 7.3. For the tests white light was used and the transmission was measured directly with a spectrometer (Ocean Optics usb4000).
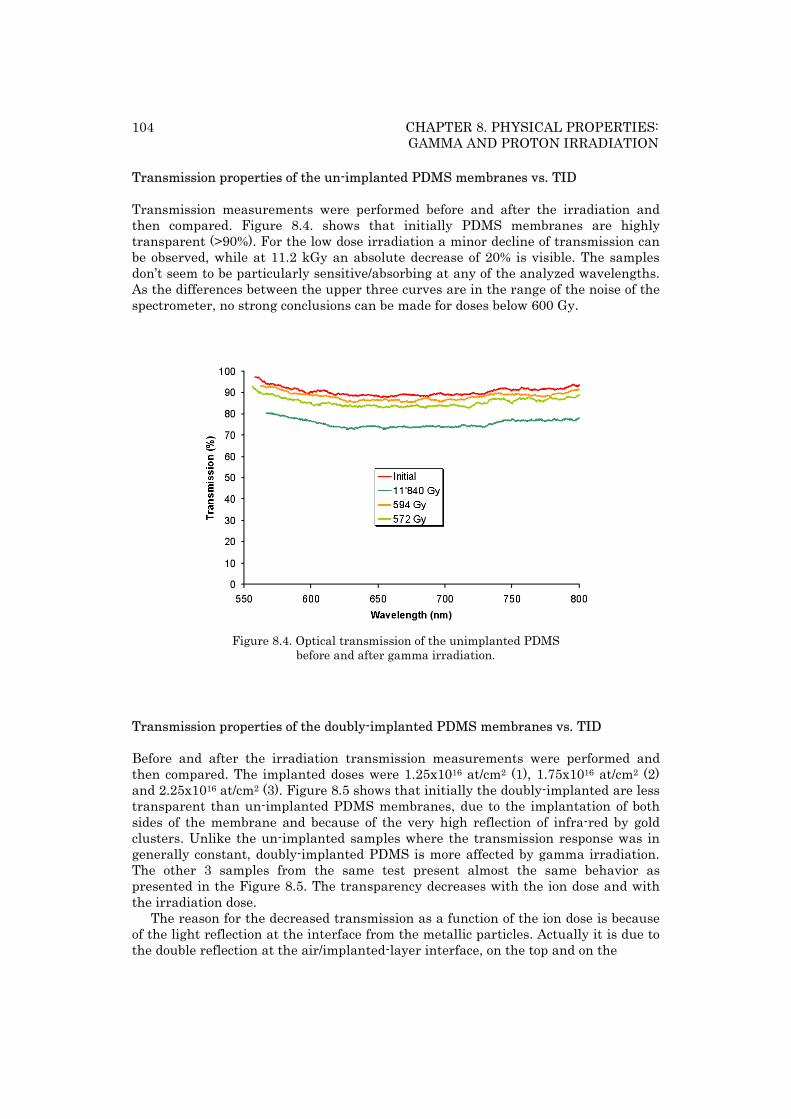
104 CHAPTER 8. PHYSICAL PROPERTIES: GAMMA AND PROTON IRRADIATION
Transmission properties of the un-implanted PDMS membranes vs. TID
Transmission measurements were performed before and after the irradiation and then compared. Figure 8.4. shows that initially PDMS membranes are highly transparent (>90%). For the low dose irradiation a minor decline of transmission can be observed, while at 11.2 kGy an absolute decrease of 20% is visible. The samples don’t seem to be particularly sensitive/absorbing at any of the analyzed wavelengths. As the differences between the upper three curves are in the range of the noise of the spectrometer, no strong conclusions can be made for doses below 600 Gy.
Figure 8.4. Optical transmission of the unimplanted PDMS before and after gamma irradiation.
Transmission properties of the doubly-implanted PDMS membranes vs. TID
Before and after the irradiation transmission measurements were performed and then compared. The implanted doses were 1.25x10¹⁶ at/cm2 (1), 1.75x10¹⁶ at/cm2 (2) and 2.25x10¹⁶ at/cm2 (3). Figure 8.5 shows that initially the doubly-implanted are less transparent than un-implanted PDMS membranes, due to the implantation of both sides of the membrane and because of the very high reflection of infra-red by gold clusters. Unlike the un-implanted samples where the transmission response was in generally constant, doubly-implanted PDMS is more affected by gamma irradiation. The other 3 samples from the same test present almost the same behavior as presented in the Figure 8.5. The transparency decreases with the ion dose and with the irradiation dose.
The reason for the decreased transmission as a function of the ion dose is because of the light reflection at the interface from the metallic particles. Actually it is due to the double reflection at the air/implanted-layer interface, on the top and on the
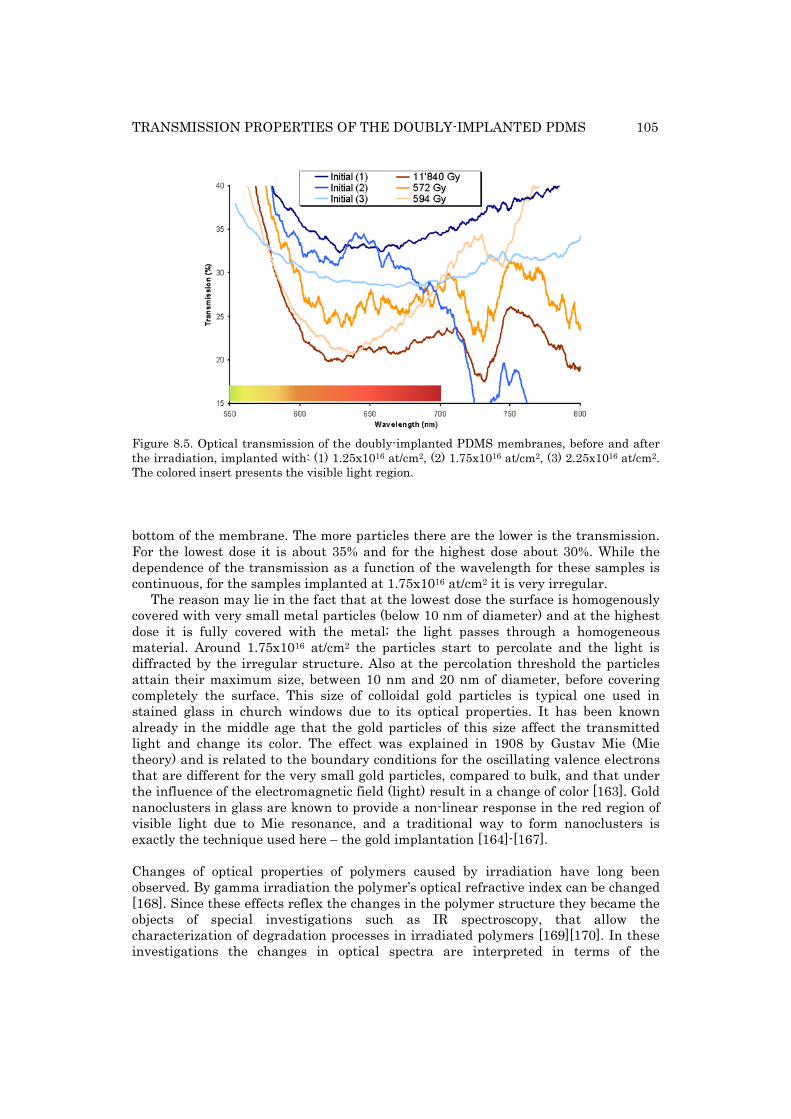
TRANSMISSION PROPERTIES OF THE DOUBLY-IMPLANTED PDMS 105
Figure 8.5. Optical transmission of the doubly-implanted PDMS membranes, before and after the irradiation, implanted with: (1) 1.25x10¹⁶ at/cm2, (2) 1.75x10¹⁶ at/cm2, (3) 2.25x10¹⁶ at/cm2. The colored insert presents the visible light region. bottom of the membrane. The more particles there are the lower is the transmission. For the lowest dose it is about 35% and for the highest dose about 30%. While the dependence of the transmission as a function of the wavelength for these samples is continuous, for the samples implanted at 1.75x10¹⁶ at/cm2 it is very irregular.
The reason may lie in the fact that at the lowest dose the surface is homogenously covered with very small metal particles (below 10 nm of diameter) and at the highest dose it is fully covered with the metal; the light passes through a homogeneous material. Around 1.75x10¹⁶ at/cm2 the particles start to percolate and the light is diffracted by the irregular structure. Also at the percolation threshold the particles attain their maximum size, between 10 nm and 20 nm of diameter, before covering completely the surface. This size of colloidal gold particles is typical one used in stained glass in church windows due to its optical properties. It has been known already in the middle age that the gold particles of this size affect the transmitted light and change its color. The effect was explained in 1908 by Gustav Mie (Mie theory) and is related to the boundary conditions for the oscillating valence electrons that are different for the very small gold particles, compared to bulk, and that under the influence of the electromagnetic field (light) result in a change of color [163]. Gold nanoclusters in glass are known to provide a non-linear response in the red region of visible light due to Mie resonance, and a traditional way to form nanoclusters is exactly the technique used here – the gold implantation [164]-[167]. Changes of optical properties of polymers caused by irradiation have long been observed. By gamma irradiation the polymer’s optical refractive index can be changed [168]. Since these effects reflex the changes in the polymer structure they became the objects of special investigations such as IR spectroscopy, that allow the characterization of degradation processes in irradiated polymers [169][170]. In these investigations the changes in optical spectra are interpreted in terms of the
106 CHAPTER 8. PHYSICAL PROPERTIES: GAMMA AND PROTON IRRADIATION
disappearance of existing chemical groups and structures, and appearance of new ones, resulting from the recombination of transient degradation products. However despite the large amount of relevant experimental results accumulated up to now, the linkage between the observed changes in optical properties and the basic radiochemical processes of polymer degradation by irradiation is still rather inaccurate.
Before implantation, surface roughness of PDMS is very small and has a RMS values around 2 nm. After the implantation it has been shown that the surface roughness increases tremendously due to the deformation of the surface created through the modified mechanical properties of the implanted layer and resulting in a wave-like structure, Section 6.2.3. The implanted membranes with this sort of surface may have advantages but also drawbacks. One of the advantages may be that by controlling the formation of the surface waves one would bring a new dimension in optical fields at nano- and microscale level such as diffraction gratings. But it also may be an important drawback for the imaging.
In the next chapter an application of the MII of PDMS with FCVA will be presented: Array of lenses with individually tunable focal-length based on transparent ion-implanted EAPs. Because of the results obtained here, in this chapter, the doubly-implanted membranes will not be directly used as lenses, but only as actuators for the lenses. The un-implanted PDMS has much better optical properties and can be indirectly tuned by EAP actuators, by means of water pressure in the channels.
8.1.2 Proton Irradiation
A new set of 12 PDMS samples as for gamma were exposed to 1 kGy, 5 kGy and 10 kGy of proton radiation. The proton energy was 3.5 MeV. The samples were analyzed for mechanical, electrical, and optical properties before and after the irradiation. The probes have been radiated with a dose rate at about 690 pA.
Breakdown Voltage vs. TID
The samples were prepared as described in Section 7.2. The results are presented in Table 8.2. The initial breakdown voltage value was 3 kV. Since no important changes were observed (differences within the error) one can conclude that proton radiation doesn’t have any important influences on the breakdown voltage. Table 8.2 . Influence of the proton irradiation on the breakdown voltage.
Radiation in kGy Breakdown voltage in kV
10 2.8 ± 0.1 5 3 ± 0.1 1 2.9 ± 0.1
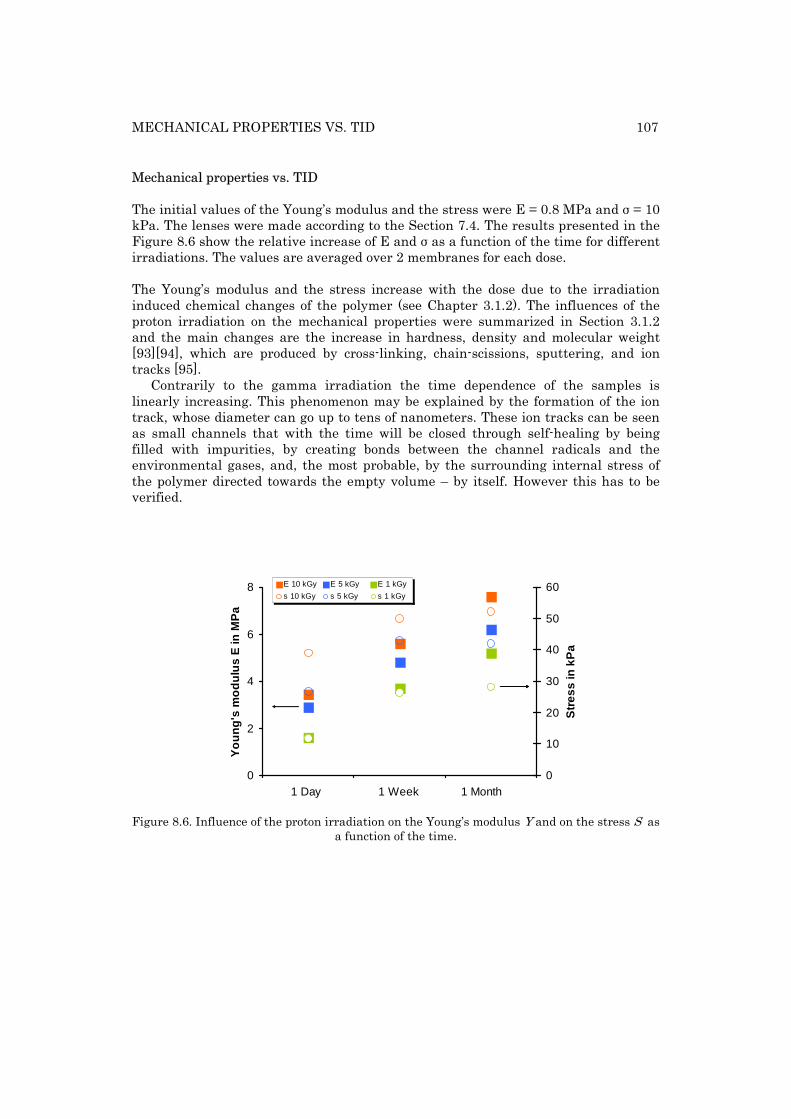
MECHANICAL PROPERTIES VS. TID 107
Mechanical properties vs. TID
The initial values of the Young’s modulus and the stress were E = 0.8 MPa and σ = 10 kPa. The lenses were made according to the Section 7.4. The results presented in the Figure 8.6 show the relative increase of E and σ as a function of the time for different irradiations. The values are averaged over 2 membranes for each dose.
The Young’s modulus and the stress increase with the dose due to the irradiation induced chemical changes of the polymer (see Chapter 3.1.2). The influences of the proton irradiation on the mechanical properties were summarized in Section 3.1.2 and the main changes are the increase in hardness, density and molecular weight [93][94], which are produced by cross-linking, chain-scissions, sputtering, and ion tracks [95].
Contrarily to the gamma irradiation the time dependence of the samples is linearly increasing. This phenomenon may be explained by the formation of the ion track, whose diameter can go up to tens of nanometers. These ion tracks can be seen as small channels that with the time will be closed through self-healing by being filled with impurities, by creating bonds between the channel radicals and the environmental gases, and, the most probable, by the surrounding internal stress of the polymer directed towards the empty volume – by itself. However this has to be verified.
0
2
4
6
8
0.5 1.5 2.5 3.5
Yo
un
g's
mo
du
lus
E in
MP
a
0
10
20
30
40
50
60
Str
ess
in k
Pa
E 10 kGy E 5 kGy E 1 kGy
s 10 kGy s 5 kGy s 1 kGy
1 Day 1 Week 1 Month
Figure 8.6. Influence of the proton irradiation on the Young’s modulus Y and on the stress S as
a function of the time.
108 CHAPTER 8. PHYSICAL PROPERTIES: GAMMA AND PROTON IRRADIATION
Optical transmission vs. TID
For the measurements of the optical properties of the proton irradiated un-implanted and doubly-implanted PDMS membranes the same testing setup as for the gamma samples has been used. In contrast to the gamma irradiation no significant changes of the optical properties were observed after the proton irradiation neither for the un-implanted nor for the doubly-implanted membranes (differences within the sensibility of the spectrometer). Consequently the final conclusion on the possible optical applications remains: For imaging only the un-implanted PDMS membranes should be used as lenses, since they have much better optical properties than the doubly-implanted membranes.
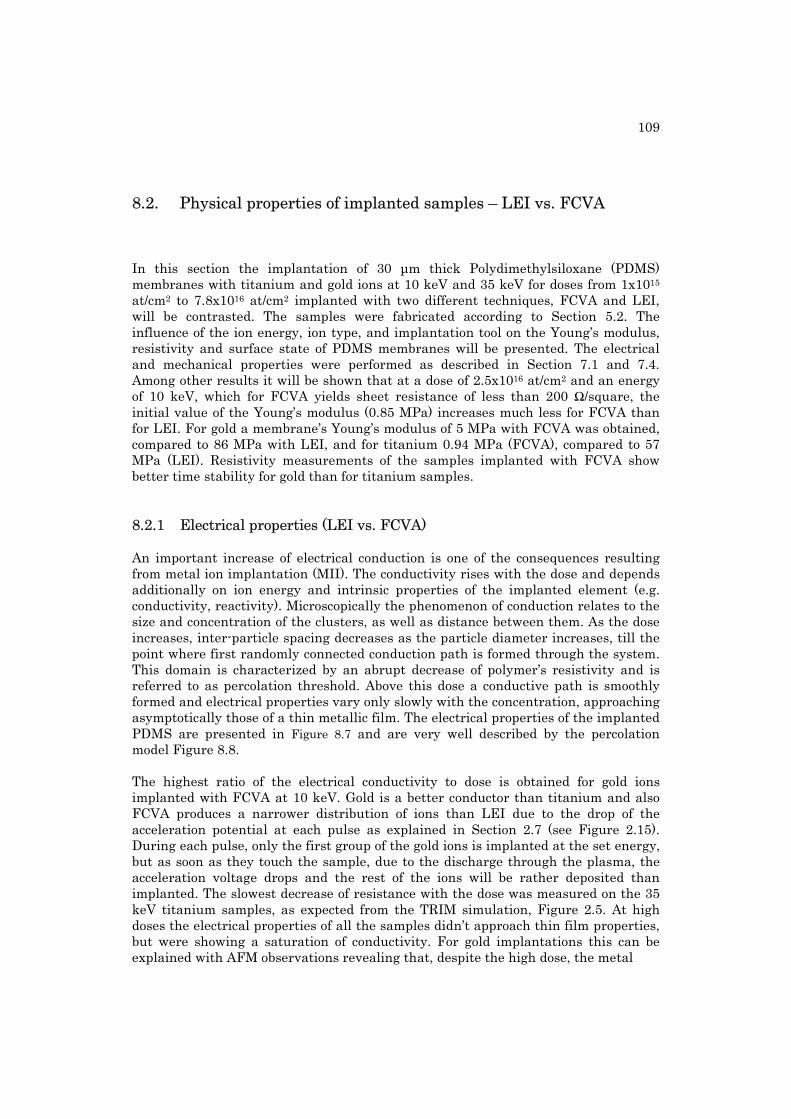
109
8.2. Physical properties of implanted samples – LEI vs. FCVA
In this section the implantation of 30 μm thick Polydimethylsiloxane (PDMS) membranes with titanium and gold ions at 10 keV and 35 keV for doses from 1x10¹⁵ at/cm2 to 7.8x10¹⁶ at/cm2 implanted with two different techniques, FCVA and LEI, will be contrasted. The samples were fabricated according to Section 5.2. The influence of the ion energy, ion type, and implantation tool on the Young’s modulus, resistivity and surface state of PDMS membranes will be presented. The electrical and mechanical properties were performed as described in Section 7.1 and 7.4. Among other results it will be shown that at a dose of 2.5x10¹⁶ at/cm2 and an energy of 10 keV, which for FCVA yields sheet resistance of less than 200 Ω/square, the initial value of the Young’s modulus (0.85 MPa) increases much less for FCVA than for LEI. For gold a membrane’s Young’s modulus of 5 MPa with FCVA was obtained, compared to 86 MPa with LEI, and for titanium 0.94 MPa (FCVA), compared to 57 MPa (LEI). Resistivity measurements of the samples implanted with FCVA show better time stability for gold than for titanium samples.
8.2.1 Electrical properties (LEI vs. FCVA)
An important increase of electrical conduction is one of the consequences resulting from metal ion implantation (MII). The conductivity rises with the dose and depends additionally on ion energy and intrinsic properties of the implanted element (e.g. conductivity, reactivity). Microscopically the phenomenon of conduction relates to the size and concentration of the clusters, as well as distance between them. As the dose increases, inter-particle spacing decreases as the particle diameter increases, till the point where first randomly connected conduction path is formed through the system. This domain is characterized by an abrupt decrease of polymer’s resistivity and is referred to as percolation threshold. Above this dose a conductive path is smoothly formed and electrical properties vary only slowly with the concentration, approaching asymptotically those of a thin metallic film. The electrical properties of the implanted PDMS are presented in Figure 8.7 and are very well described by the percolation model Figure 8.8. The highest ratio of the electrical conductivity to dose is obtained for gold ions implanted with FCVA at 10 keV. Gold is a better conductor than titanium and also FCVA produces a narrower distribution of ions than LEI due to the drop of the acceleration potential at each pulse as explained in Section 2.7 (see Figure 2.15). During each pulse, only the first group of the gold ions is implanted at the set energy, but as soon as they touch the sample, due to the discharge through the plasma, the acceleration voltage drops and the rest of the ions will be rather deposited than implanted. The slowest decrease of resistance with the dose was measured on the 35 keV titanium samples, as expected from the TRIM simulation, Figure 2.5. At high doses the electrical properties of all the samples didn’t approach thin film properties, but were showing a saturation of conductivity. For gold implantations this can be explained with AFM observations revealing that, despite the high dose, the metal
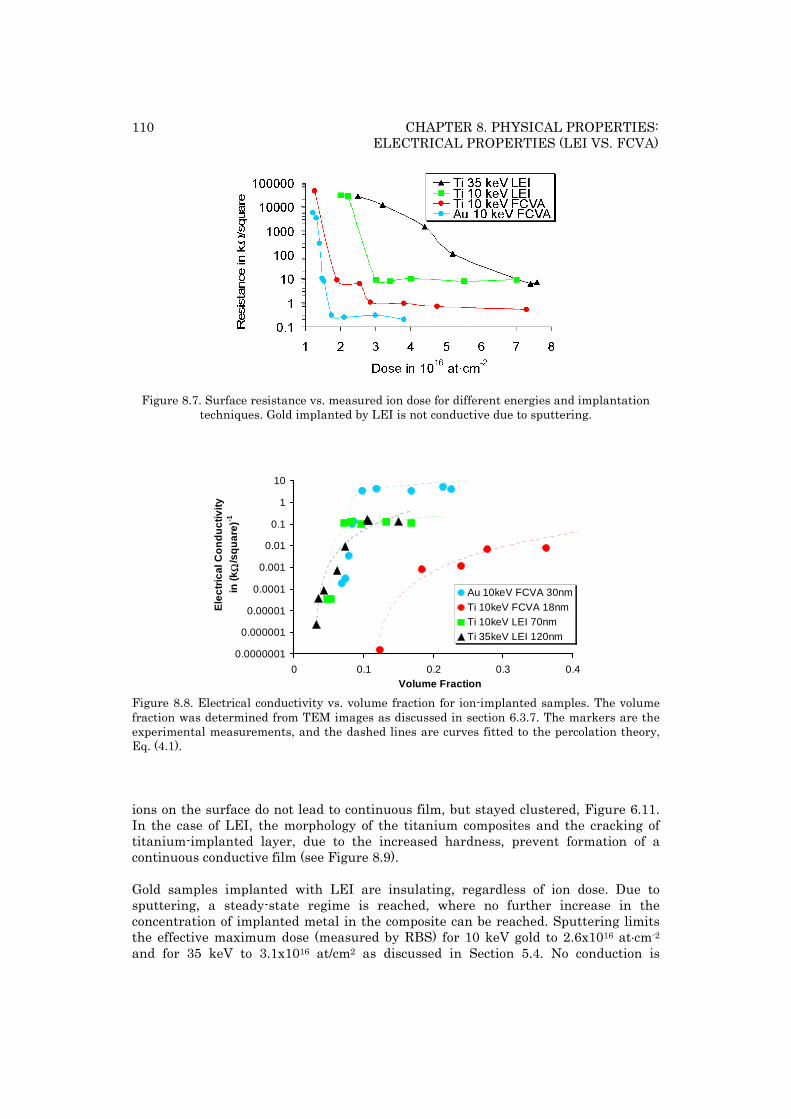
110 CHAPTER 8. PHYSICAL PROPERTIES: ELECTRICAL PROPERTIES (LEI VS. FCVA)
Figure 8.7. Surface resistance vs. measured ion dose for different energies and implantation techniques. Gold implanted by LEI is not conductive due to sputtering.
0.0000001
0.000001
0.00001
0.0001
0.001
0.01
0.1
1
10
0 0.1 0.2 0.3 0.4Volume Fraction
Ele
ctri
cal C
on
du
ctiv
ity
in (k
Ω/s
qu
are)
-1
Au 10keV FCVA 30nmTi 10keV FCVA 18nmTi 10keV LEI 70nmTi 35keV LEI 120nm
Figure 8.8. Electrical conductivity vs. volume fraction for ion-implanted samples. The volume fraction was determined from TEM images as discussed in section 6.3.7. The markers are the experimental measurements, and the dashed lines are curves fitted to the percolation theory, Eq. (4.1). ions on the surface do not lead to continuous film, but stayed clustered, Figure 6.11. In the case of LEI, the morphology of the titanium composites and the cracking of titanium-implanted layer, due to the increased hardness, prevent formation of a continuous conductive film (see Figure 8.9). Gold samples implanted with LEI are insulating, regardless of ion dose. Due to sputtering, a steady-state regime is reached, where no further increase in the concentration of implanted metal in the composite can be reached. Sputtering limits the effective maximum dose (measured by RBS) for 10 keV gold to 2.6x10¹⁶ atÿcm-2 and for 35 keV to 3.1x10¹⁶ at/cm2 as discussed in Section 5.4. No conduction is
111
observed for these samples because the volume fraction of gold is below the percolation threshold. FCVA gold samples do not show the sputtering due to the energy variation during each pulse. Time stability measurements of the conductivity showed that for FCVA implanted samples only the gold samples with doses above 1.75x10¹⁶ at/cm2 retained the initial electrical resistance, Figure 8.10. For the higher does, the conductivity remains constant for more than 3 years [23]. At lower doses the resistivity reaches values above 100 MΩ/square after a few days and continuously degrades due to diffusion of ions and small clusters leads to discontinuity in the conductive network.
For Titanium, only the samples implanted with LEI present long term stability of the conductivity (after 3 years, less than 0.1% change). The FCVA implanted samples became all non-conductive after being exposed to air for a few hours. The reason lies in the oxidation of Titanium, with a half-life of several hours dependent on the dose.
Figure 8.9. Surface cracking of a LEI implanted sample. Implantation energy is 35 keV and the dose is 5x10¹⁶ at/cm2.
Figure 8.10. Time stability of gold implanted PDMS with FCVA at 5 keV; from [23].
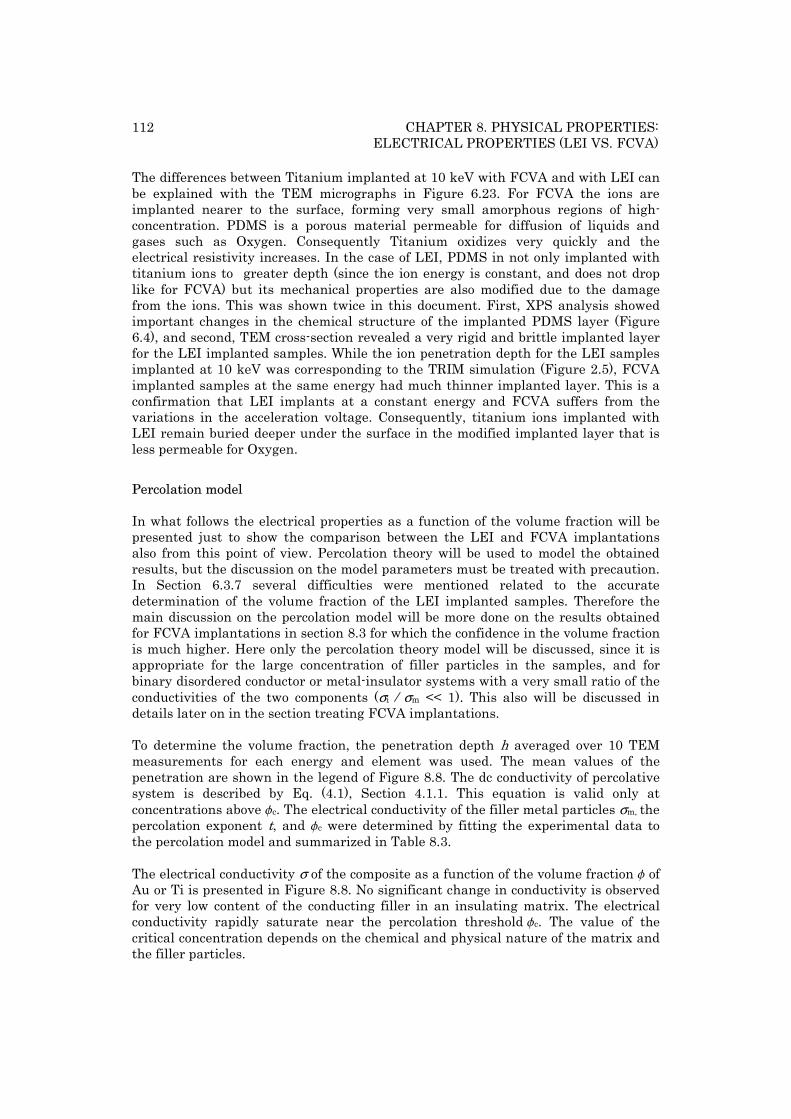
112 CHAPTER 8. PHYSICAL PROPERTIES: ELECTRICAL PROPERTIES (LEI VS. FCVA)
The differences between Titanium implanted at 10 keV with FCVA and with LEI can be explained with the TEM micrographs in Figure 6.23. For FCVA the ions are implanted nearer to the surface, forming very small amorphous regions of high-concentration. PDMS is a porous material permeable for diffusion of liquids and gases such as Oxygen. Consequently Titanium oxidizes very quickly and the electrical resistivity increases. In the case of LEI, PDMS in not only implanted with titanium ions to greater depth (since the ion energy is constant, and does not drop like for FCVA) but its mechanical properties are also modified due to the damage from the ions. This was shown twice in this document. First, XPS analysis showed important changes in the chemical structure of the implanted PDMS layer (Figure 6.4), and second, TEM cross-section revealed a very rigid and brittle implanted layer for the LEI implanted samples. While the ion penetration depth for the LEI samples implanted at 10 keV was corresponding to the TRIM simulation (Figure 2.5), FCVA implanted samples at the same energy had much thinner implanted layer. This is a confirmation that LEI implants at a constant energy and FCVA suffers from the variations in the acceleration voltage. Consequently, titanium ions implanted with LEI remain buried deeper under the surface in the modified implanted layer that is less permeable for Oxygen.
Percolation model
In what follows the electrical properties as a function of the volume fraction will be presented just to show the comparison between the LEI and FCVA implantations also from this point of view. Percolation theory will be used to model the obtained results, but the discussion on the model parameters must be treated with precaution. In Section 6.3.7 several difficulties were mentioned related to the accurate determination of the volume fraction of the LEI implanted samples. Therefore the main discussion on the percolation model will be more done on the results obtained for FCVA implantations in section 8.3 for which the confidence in the volume fraction is much higher. Here only the percolation theory model will be discussed, since it is appropriate for the large concentration of filler particles in the samples, and for binary disordered conductor or metal-insulator systems with a very small ratio of the conductivities of the two components (σi / σm << 1). This also will be discussed in details later on in the section treating FCVA implantations. To determine the volume fraction, the penetration depth h averaged over 10 TEM measurements for each energy and element was used. The mean values of the penetration are shown in the legend of Figure 8.8. The dc conductivity of percolative system is described by Eq. (4.1), Section 4.1.1. This equation is valid only at concentrations above fc. The electrical conductivity of the filler metal particles σm, the percolation exponent t, and fc were determined by fitting the experimental data to the percolation model and summarized in Table 8.3. The electrical conductivity σ of the composite as a function of the volume fraction f of Au or Ti is presented in Figure 8.8. No significant change in conductivity is observed for very low content of the conducting filler in an insulating matrix. The electrical conductivity rapidly saturate near the percolation threshold fc. The value of the critical concentration depends on the chemical and physical nature of the matrix and the filler particles.
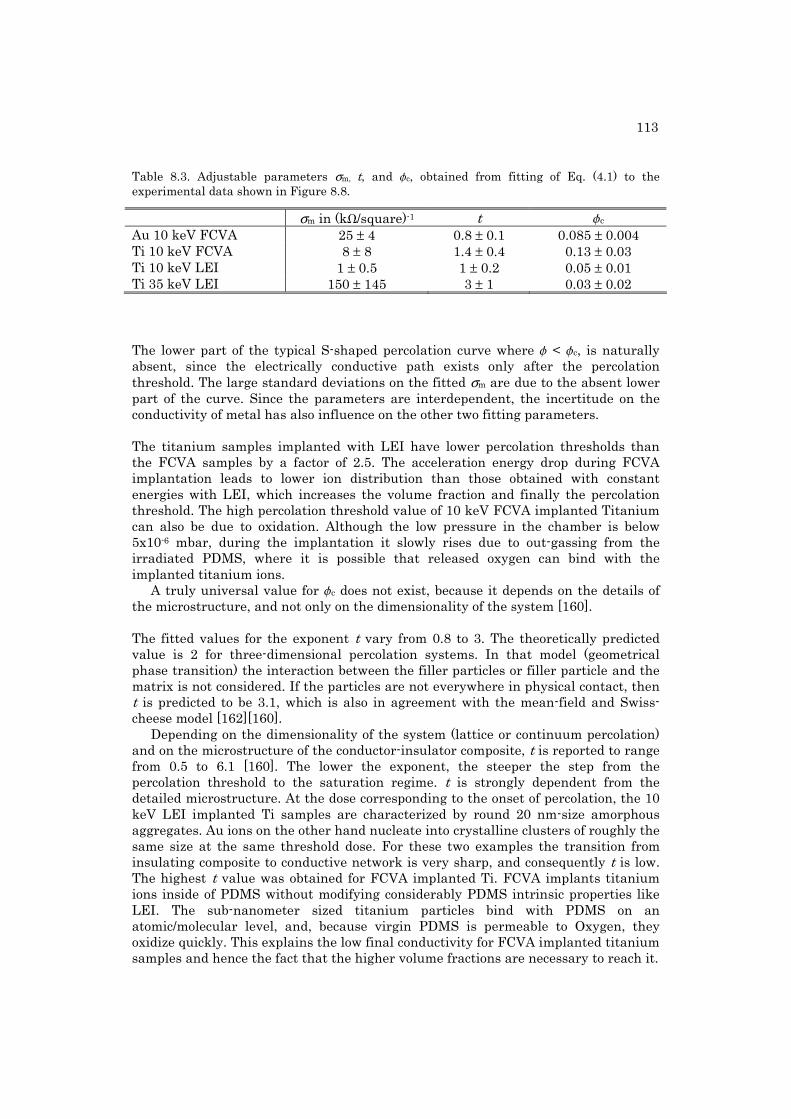
113
Table 8.3. Adjustable parameters σm, t, and fc, obtained from fitting of Eq. (4.1) to the experimental data shown in Figure 8.8.
σm in (kW/square)-1 t fc Au 10 keV FCVA 25 ± 4 0.8 ± 0.1 0.085 ± 0.004 Ti 10 keV FCVA 8 ± 8 1.4 ± 0.4 0.13 ± 0.03 Ti 10 keV LEI 1 ± 0.5 1 ± 0.2 0.05 ± 0.01 Ti 35 keV LEI 150 ± 145 3 ± 1 0.03 ± 0.02
The lower part of the typical S-shaped percolation curve where f < fc, is naturally absent, since the electrically conductive path exists only after the percolation threshold. The large standard deviations on the fitted σm are due to the absent lower part of the curve. Since the parameters are interdependent, the incertitude on the conductivity of metal has also influence on the other two fitting parameters. The titanium samples implanted with LEI have lower percolation thresholds than the FCVA samples by a factor of 2.5. The acceleration energy drop during FCVA implantation leads to lower ion distribution than those obtained with constant energies with LEI, which increases the volume fraction and finally the percolation threshold. The high percolation threshold value of 10 keV FCVA implanted Titanium can also be due to oxidation. Although the low pressure in the chamber is below 5x10⁻⁶ mbar, during the implantation it slowly rises due to out-gassing from the irradiated PDMS, where it is possible that released oxygen can bind with the implanted titanium ions.
A truly universal value for fc does not exist, because it depends on the details of the microstructure, and not only on the dimensionality of the system [160]. The fitted values for the exponent t vary from 0.8 to 3. The theoretically predicted value is 2 for three-dimensional percolation systems. In that model (geometrical phase transition) the interaction between the filler particles or filler particle and the matrix is not considered. If the particles are not everywhere in physical contact, then t is predicted to be 3.1, which is also in agreement with the mean-field and Swiss-cheese model [162][160].
Depending on the dimensionality of the system (lattice or continuum percolation) and on the microstructure of the conductor-insulator composite, t is reported to range from 0.5 to 6.1 [160]. The lower the exponent, the steeper the step from the percolation threshold to the saturation regime. t is strongly dependent from the detailed microstructure. At the dose corresponding to the onset of percolation, the 10 keV LEI implanted Ti samples are characterized by round 20 nm-size amorphous aggregates. Au ions on the other hand nucleate into crystalline clusters of roughly the same size at the same threshold dose. For these two examples the transition from insulating composite to conductive network is very sharp, and consequently t is low. The highest t value was obtained for FCVA implanted Ti. FCVA implants titanium ions inside of PDMS without modifying considerably PDMS intrinsic properties like LEI. The sub-nanometer sized titanium particles bind with PDMS on an atomic/molecular level, and, because virgin PDMS is permeable to Oxygen, they oxidize quickly. This explains the low final conductivity for FCVA implanted titanium samples and hence the fact that the higher volume fractions are necessary to reach it.
114 CHAPTER 8. PHYSICAL PROPERTIES: ELECTRICAL PROPERTIES (LEI VS. FCVA)
Conduction mechanisms
Basic conduction mechanisms in composites are: Schottky emission, Frenkel-Poole emission, tunnel or field emission, constant or variable range hopping, space-charge limited current, Gill current, Mott or Shklovski-Efros and Ohmic conduction [5][27][172]. The different conduction mechanisms in composites can be distinguished from each other by observing their voltage, temperature and time dependence. Typically the Ohmic conduction is several orders of magnitude bigger than the others. Nevertheless since gold implantation with FCVA showed much better results than titanium implantation and LEI implantation (this and next section) decision has been made not to pursue the detailed research in this field.
However when the conducting elements are in geometric contact (Ohmic conduction), the theory predicts that the critical exponent is less than 2 and the current flows through random resistor network [123]. When the conducting elements are not only in geometric contact but are also separated from each other, and there is another conduction mechanism, such as tunneling or hopping conductivity, the theory predicts that the critical exponent is greater than 2. Thus all the composites except titanium implantation with LEI at 35 keV can be characterized by purely Ohmic conduction with different resistor networks. According to the literature the titanium samples at 35 keV should therefore possess other conduction mechanisms. One should note that the conductivity of the gold clusters and titanium amorphous aggregates differ significantly from the bulk values and depend very strongly on the nanostructure. For the titanium and gold implantations at 10 keV, one finds that σm is larger for Gold than for Titanium, as expected since for bulk Gold has higher electrical conductivity than Titanium. However the results also depend on the morphology of the gold composite that differs completely from that of titanium composites.
In the first case the conductive nanoclusters increase in size and at percolation threshold start touching each other forming a conductive path. At this scale level the gold clusters do not exhibit physical bulk properties. It is known for example that only above 10 nm of the diameter gold clusters approach the bulk conductivity [173]. Thus one aspect to obtain a lower electrical conductivity for a group of clusters than for a continuous metal film. Another very important factor for the conductivity through clusters is the contact resistivity [174]. Between each gold cluster there is a limited electrical connection enabled only through the physical contact. Consequently the electrical path consists of highly conductive clusters and a huge number of parallel and serial resistances. The conductivity mechanism of the gold clusters can be interpreted as Ohmic, composed of intrinsic size-dependent conductivity of the clusters and a lot of contact resistances. It is therefore obvious that the resulting conductivity will be lower than that of a bulk.
Titanium on the other hand has a completely different influence on the electrical property of the created composite. The influences of the titanium implantation on the mechanical and structural properties have been discussed above and will also been presented in the next section. The main observation is increased stiffness of the implanted layer and lack of titanium clusters. This is due to chemical reactivity of Titanium. It has a very low electronegativity (1.54). Compared to the PDMS atoms (Si – 1.9, H – 2.2, C – 2.55, O – 3.44) this means that as soon as a titanium ion penetrates inside of PDMS it will bind with surroundings. Therefore titanium
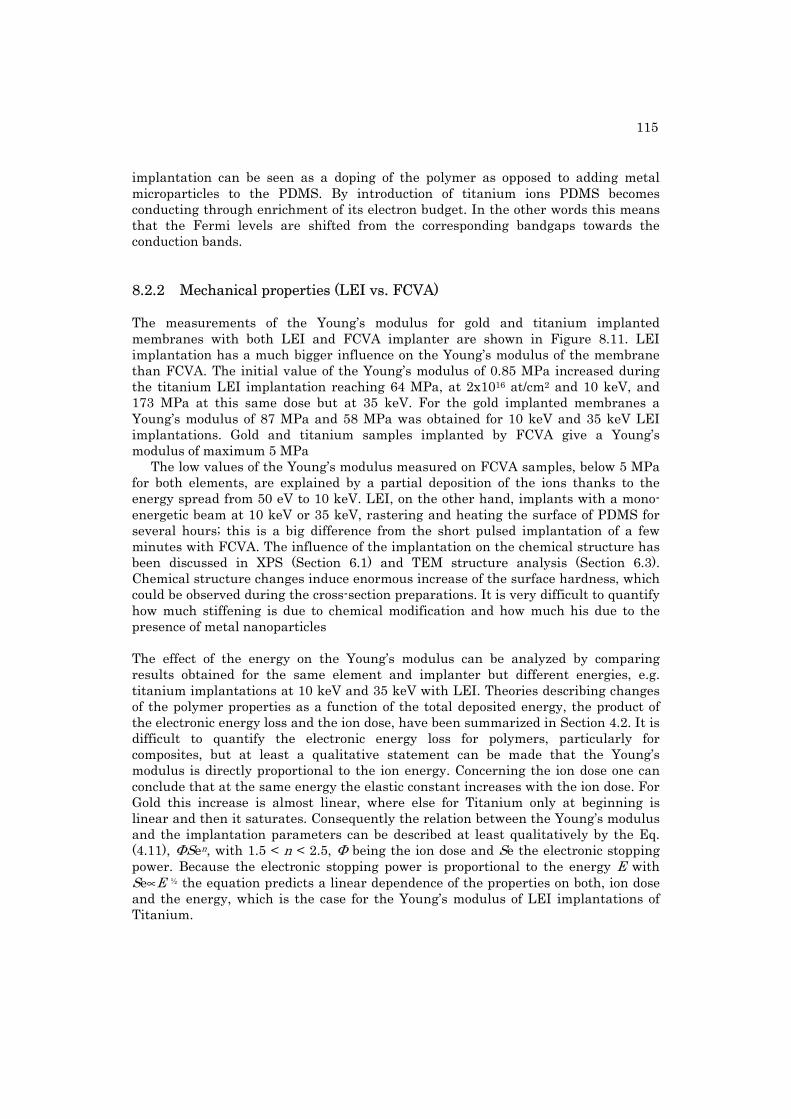
115
implantation can be seen as a doping of the polymer as opposed to adding metal microparticles to the PDMS. By introduction of titanium ions PDMS becomes conducting through enrichment of its electron budget. In the other words this means that the Fermi levels are shifted from the corresponding bandgaps towards the conduction bands.
8.2.2 Mechanical properties (LEI vs. FCVA)
The measurements of the Young’s modulus for gold and titanium implanted membranes with both LEI and FCVA implanter are shown in Figure 8.11. LEI implantation has a much bigger influence on the Young’s modulus of the membrane than FCVA. The initial value of the Young’s modulus of 0.85 MPa increased during the titanium LEI implantation reaching 64 MPa, at 2x10¹⁶ at/cm2 and 10 keV, and 173 MPa at this same dose but at 35 keV. For the gold implanted membranes a Young’s modulus of 87 MPa and 58 MPa was obtained for 10 keV and 35 keV LEI implantations. Gold and titanium samples implanted by FCVA give a Young’s modulus of maximum 5 MPa
The low values of the Young’s modulus measured on FCVA samples, below 5 MPa for both elements, are explained by a partial deposition of the ions thanks to the energy spread from 50 eV to 10 keV. LEI, on the other hand, implants with a mono-energetic beam at 10 keV or 35 keV, rastering and heating the surface of PDMS for several hours; this is a big difference from the short pulsed implantation of a few minutes with FCVA. The influence of the implantation on the chemical structure has been discussed in XPS (Section 6.1) and TEM structure analysis (Section 6.3). Chemical structure changes induce enormous increase of the surface hardness, which could be observed during the cross-section preparations. It is very difficult to quantify how much stiffening is due to chemical modification and how much his due to the presence of metal nanoparticles The effect of the energy on the Young’s modulus can be analyzed by comparing results obtained for the same element and implanter but different energies, e.g. titanium implantations at 10 keV and 35 keV with LEI. Theories describing changes of the polymer properties as a function of the total deposited energy, the product of the electronic energy loss and the ion dose, have been summarized in Section 4.2. It is difficult to quantify the electronic energy loss for polymers, particularly for composites, but at least a qualitative statement can be made that the Young’s modulus is directly proportional to the ion energy. Concerning the ion dose one can conclude that at the same energy the elastic constant increases with the ion dose. For Gold this increase is almost linear, where else for Titanium only at beginning is linear and then it saturates. Consequently the relation between the Young’s modulus and the implantation parameters can be described at least qualitatively by the Eq. (4.11), ΦSen, with 1.5 < n < 2.5, Φ being the ion dose and Se the electronic stopping power. Because the electronic stopping power is proportional to the energy E with Se∝E ½ the equation predicts a linear dependence of the properties on both, ion dose and the energy, which is the case for the Young’s modulus of LEI implantations of Titanium.
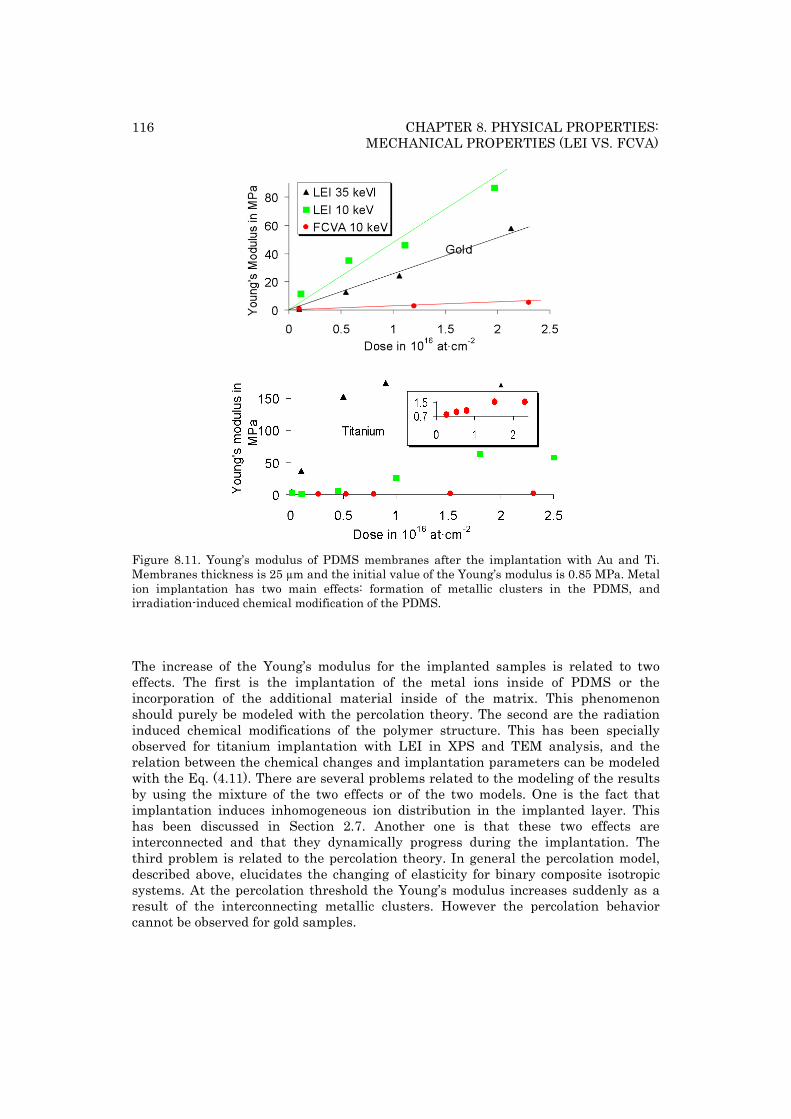
116 CHAPTER 8. PHYSICAL PROPERTIES: MECHANICAL PROPERTIES (LEI VS. FCVA)
Figure 8.11. Young’s modulus of PDMS membranes after the implantation with Au and Ti. Membranes thickness is 25 µm and the initial value of the Young’s modulus is 0.85 MPa. Metal ion implantation has two main effects: formation of metallic clusters in the PDMS, and irradiation-induced chemical modification of the PDMS. The increase of the Young’s modulus for the implanted samples is related to two effects. The first is the implantation of the metal ions inside of PDMS or the incorporation of the additional material inside of the matrix. This phenomenon should purely be modeled with the percolation theory. The second are the radiation induced chemical modifications of the polymer structure. This has been specially observed for titanium implantation with LEI in XPS and TEM analysis, and the relation between the chemical changes and implantation parameters can be modeled with the Eq. (4.11). There are several problems related to the modeling of the results by using the mixture of the two effects or of the two models. One is the fact that implantation induces inhomogeneous ion distribution in the implanted layer. This has been discussed in Section 2.7. Another one is that these two effects are interconnected and that they dynamically progress during the implantation. The third problem is related to the percolation theory. In general the percolation model, described above, elucidates the changing of elasticity for binary composite isotropic systems. At the percolation threshold the Young’s modulus increases suddenly as a result of the interconnecting metallic clusters. However the percolation behavior cannot be observed for gold samples.
117
For gold implantations a linear dependence of Young’s modulus on the ion dose is observed, see Figure 8.11. The Young’s modulus is however bigger for 10 keV than for 35 keV, yet one would expect more damage, hence more stiffening, at higher energies. The reason for the observation lies in the sputtering of the implanted layer. Higher energies lead to higher sputtering yield and consequently to lower ion concentration, Figure 5.5. Figure 5.4 shows that the retained ion concentration inside of PDMS is bigger at 10 keV than at 35 keV. Thus this explains why the highest stiffness is observed at 10 keV.
Beside that there is another effect of the sputtering on the implanted layer. The radiation induced chemical changes of the polymer are also responsible for the increase of the Young’s modulus, Section 2.5. The modification of the chemical structure (increase of molecular weight and density, creation of SiO2, etc.) induces an additional stiffness of the implanted layer that is, in the case of the titanium implantations, released through the cracking of the surface. However due to the sputtering this layer will be removed and consequently the radiation effects on the increase of the Young’s modulus will be reduced. Therefore no cracks could be observed on the gold samples. The percolation theory does neither include sputtering phenomena, as in the case of Gold, nor crack formation, as in the case of Titanium. Even if the mechanical properties, for example of titanium composites, seem to obey percolation theory, the discussion on percolation parameters would be meaningless because it is very difficult to quantify these cracks and to determine their impact on the Young’s modulus. From this reasons the percolation model will be used on the FCVA implanted samples, where the radiation induced chemical modifications of the PDMS can be neglected. It is very difficult to say quantitatively after what conditions these effects can be ignored. Nevertheless no cracks on the surface, no important observations of sputtering, and no significant hardness-cross-section problems insure much better preserved surface state of PDMS implanted with FCVA.
118
8.3. Electrical conductivity of the FCVA implanted samples
In this section the electrical conductivity of gold and titanium implanted samples at 2.5 keV, 5 keV and 10 keV, with doses between 0.5x10¹⁶ at/cm2 and 5x10¹⁶ at/cm2, by using FCVA, will be discussed. The results will be shown as a function of the ion dose but also as a function of the volume fraction, which allows applying of the percolation theory. It will be shown that the electrical conductivity vs. volume fraction curves are well fitted by percolation theory for both metals and all three ion energies, with nearly identical percolation thresholds and exponents.
Mechanical properties will be discussed in Section 8.4 following the same methodology, and the percolation parameters will be contrasted for mechanical and electrical properties (Section 8.5), which to my knowledge has never been done till now on the same systems.
8.3.1 Results
The samples have been prepared as described in Section 7.1, and the volume fraction has been calculated as explained in Section 6.3.7. The electrical measurements of the samples are presented in Figure 8.12. On the top graph (Figure 8.12a) the horizontal axis is the dose. As expected at percolation threshold the electrical conductivity steeply rises. The doses, at which this occurs, range between 0.6x10¹⁶ at/cm2 and 1.3x10¹⁶ at/cm2 and for the same element they increase with the energy. The lowest measurable value for the conductivity was 1.3x10⁻⁵ (kΩ/square)-1. After this domain the conductivity saturates at relatively high values around 1 (kΩ/square)-1. The results obtained for Gold and Titanium are well mixed and it is difficult to extract any other important information out of this presentation. Since the modelling theories from Chapter 4 express the physical properties of composites as a function of volume fraction, the same results are presented in Figure 8.12b but with the horizontal axis being the volume fraction. Here a clear difference between gold and titanium samples can be seen. All data for gold collapses onto one curves, and all data for Titanium collapses onto a second curve. The gold samples possess a lower percolation threshold than titanium samples. This could be predicted from Figure 2.5 presenting gold ions with narrower distributions then titanium ions. However within the group of each element, Au or Ti, no distinctions can be made as a function of energy. Thus, the interpretation of these results is element-, and through that, structure-specific.
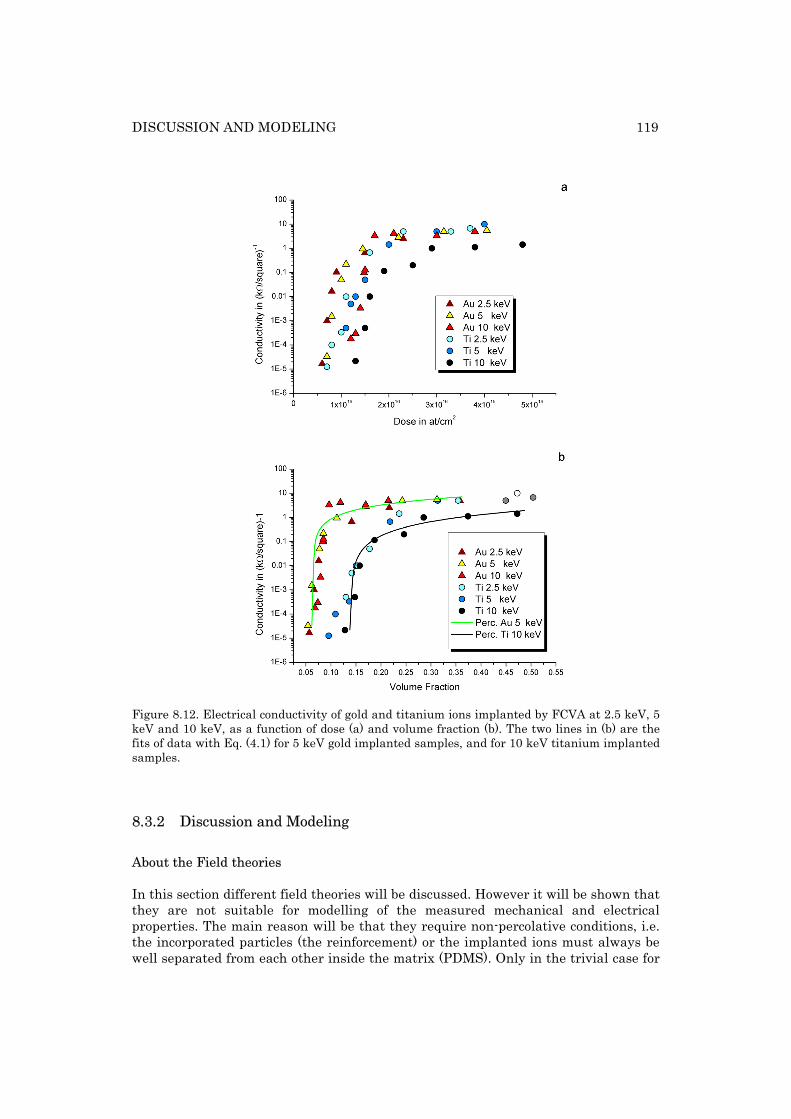
DISCUSSION AND MODELING 119
Figure 8.12. Electrical conductivity of gold and titanium ions implanted by FCVA at 2.5 keV, 5 keV and 10 keV, as a function of dose (a) and volume fraction (b). The two lines in (b) are the fits of data with Eq. (4.1) for 5 keV gold implanted samples, and for 10 keV titanium implanted samples.
8.3.2 Discussion and Modeling
About the Field theories
In this section different field theories will be discussed. However it will be shown that they are not suitable for modelling of the measured mechanical and electrical properties. The main reason will be that they require non-percolative conditions, i.e. the incorporated particles (the reinforcement) or the implanted ions must always be well separated from each other inside the matrix (PDMS). Only in the trivial case for
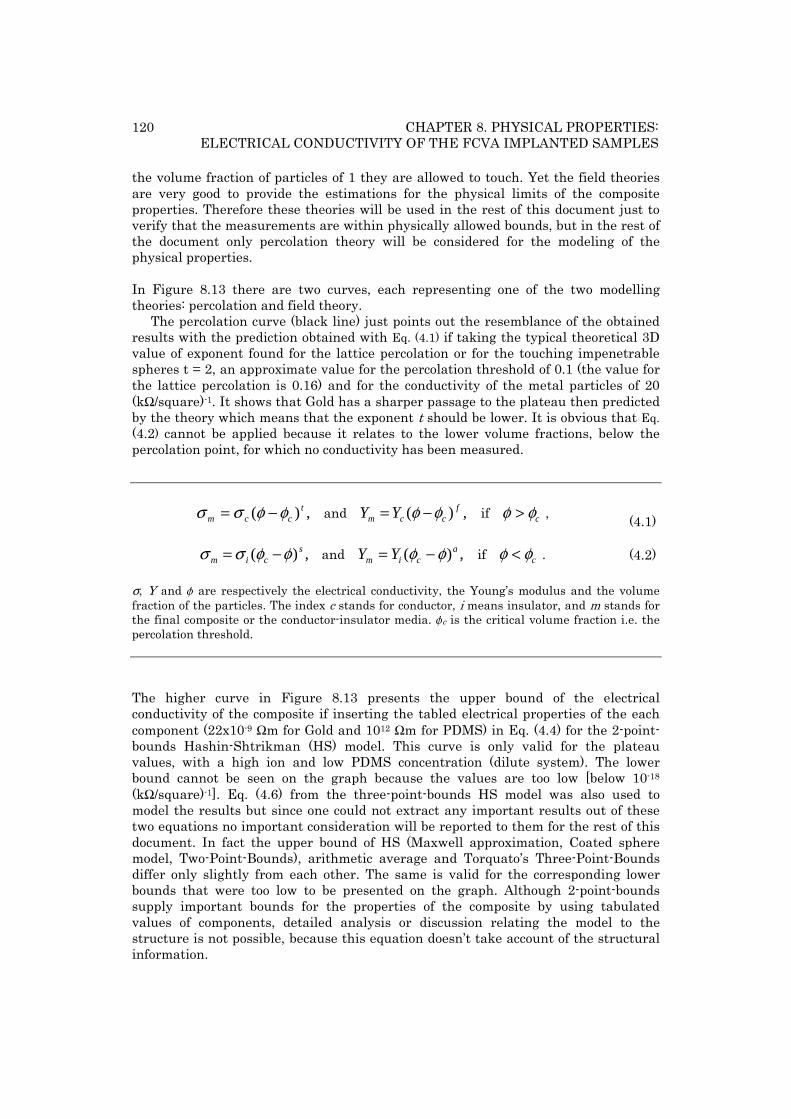
120 CHAPTER 8. PHYSICAL PROPERTIES: ELECTRICAL CONDUCTIVITY OF THE FCVA IMPLANTED SAMPLES
the volume fraction of particles of 1 they are allowed to touch. Yet the field theories are very good to provide the estimations for the physical limits of the composite properties. Therefore these theories will be used in the rest of this document just to verify that the measurements are within physically allowed bounds, but in the rest of the document only percolation theory will be considered for the modeling of the physical properties. In Figure 8.13 there are two curves, each representing one of the two modelling theories: percolation and field theory.
The percolation curve (black line) just points out the resemblance of the obtained results with the prediction obtained with Eq. (4.1) if taking the typical theoretical 3D value of exponent found for the lattice percolation or for the touching impenetrable spheres t = 2, an approximate value for the percolation threshold of 0.1 (the value for the lattice percolation is 0.16) and for the conductivity of the metal particles of 20 (kΩ/square)-1. It shows that Gold has a sharper passage to the plateau then predicted by the theory which means that the exponent t should be lower. It is obvious that Eq. (4.2) cannot be applied because it relates to the lower volume fractions, below the percolation point, for which no conductivity has been measured.
,)( tccm φφσσ −= and ,)( f
ccm YY φφ −= if cφφ > , (4.1)
,)( scim φφσσ −= and ,)( a
cim YY φφ −= if cφφ < . (4.2)
σ, Y and f are respectively the electrical conductivity, the Young’s modulus and the volume fraction of the particles. The index c stands for conductor, i means insulator, and m stands for the final composite or the conductor-insulator media. fc is the critical volume fraction i.e. the percolation threshold.
The higher curve in Figure 8.13 presents the upper bound of the electrical conductivity of the composite if inserting the tabled electrical properties of the each component (22x10-9 Ωm for Gold and 1012 Ωm for PDMS) in Eq. (4.4) for the 2-point-bounds Hashin-Shtrikman (HS) model. This curve is only valid for the plateau values, with a high ion and low PDMS concentration (dilute system). The lower bound cannot be seen on the graph because the values are too low [below 10-18 (kΩ/square)-1]. Eq. (4.6) from the three-point-bounds HS model was also used to model the results but since one could not extract any important results out of these two equations no important consideration will be reported to them for the rest of this document. In fact the upper bound of HS (Maxwell approximation, Coated sphere model, Two-Point-Bounds), arithmetic average and Torquato’s Three-Point-Bounds differ only slightly from each other. The same is valid for the corresponding lower bounds that were too low to be presented on the graph. Although 2-point-bounds supply important bounds for the properties of the composite by using tabulated values of components, detailed analysis or discussion relating the model to the structure is not possible, because this equation doesn’t take account of the structural information.
DISCUSSION AND MODELING 121
Figure 8.13. Electrical conductivity of gold and titanium ions implanted by FCVA at 2.5 keV, 5 keV and 10 keV, as a function of the volume fraction. The green curve is Hashin-Strikman upper bound (Eq. (4.4)) and the black curve is the percolation model (Eq. (4.1)) using the universal exponent t = 2. The exception to this is the Three-Point-Bounds which also include the microstructure parameters zi, hi, Θ, and Ξ (see Section 4.1.3). The latter must be used with caution.
The small number of data points at high doses does not allow making any important statements about the composite structure or properties related to Eq. (4.6) and (4.7) by means of the microstructural parameters zi and hi. The basic idea of the field theory models is to provide estimates of properties by delivering an authorized domain limited through bounds (zi or hi), that describe the nontrivial information about the structure. But concerning the two-point bounds, which relate properties only to the volume fraction, the co-domain is huge and it is valid only in a very dilute limit, i.e. high concentration of PDMS or ions, without percolation and with an isotropic distribution. Conclusively for both, Young’s modulus and electrical conductivity, one can just say for all the measurements that they are within the upper and lower limits of Eq. (4.4) and (4.5). On the other hand three-point bounds equation includes microstrucutral parameters that have been evaluated for simple systems (isotropic medium like lattices, arrays, symmetrical cells, etc.) numerically by different groups and rarely proven experimentally. In what follows it will be shown on an example of conductivity that this kind of models are not well suited to describe the physical properties for the ion implanted PDMS. The reader will understand that similar arguments can also be found and presented for the mechanical properties. Torquato evaluated the three-point contrast bound parameter z by using low density expansion [130]. He found that the leading-order term z(0) of Taylor series expansion is equal to 0, ¼ and 1 if the particle are spherical, needle-like or disks. For the trivial results the Eq. (4.6) and (4.7) resume to the Eq. (4.4) and (4.5). Some of non-trivial cases of z were evaluated among others for random models (symmetric cell material – SCM, identical overlapping and hard spheres – IOS and IHS, polydisperse hard
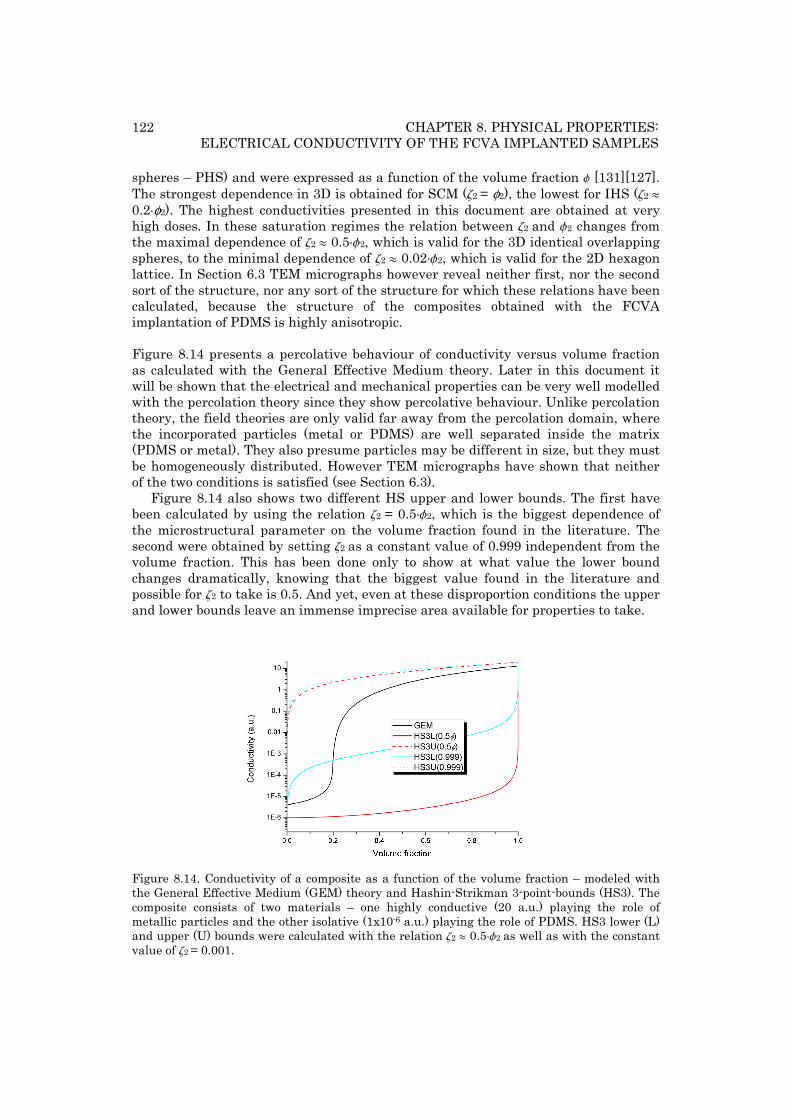
122 CHAPTER 8. PHYSICAL PROPERTIES: ELECTRICAL CONDUCTIVITY OF THE FCVA IMPLANTED SAMPLES
spheres – PHS) and were expressed as a function of the volume fraction f [131][127]. The strongest dependence in 3D is obtained for SCM (z2 = φ2), the lowest for IHS (z2 º 0.2ÿφ2). The highest conductivities presented in this document are obtained at very high doses. In these saturation regimes the relation between z2 and f2 changes from the maximal dependence of z2 º 0.5ÿf2, which is valid for the 3D identical overlapping spheres, to the minimal dependence of z2 º 0.02ÿf2, which is valid for the 2D hexagon lattice. In Section 6.3 TEM micrographs however reveal neither first, nor the second sort of the structure, nor any sort of the structure for which these relations have been calculated, because the structure of the composites obtained with the FCVA implantation of PDMS is highly anisotropic. Figure 8.14 presents a percolative behaviour of conductivity versus volume fraction as calculated with the General Effective Medium theory. Later in this document it will be shown that the electrical and mechanical properties can be very well modelled with the percolation theory since they show percolative behaviour. Unlike percolation theory, the field theories are only valid far away from the percolation domain, where the incorporated particles (metal or PDMS) are well separated inside the matrix (PDMS or metal). They also presume particles may be different in size, but they must be homogeneously distributed. However TEM micrographs have shown that neither of the two conditions is satisfied (see Section 6.3).
Figure 8.14 also shows two different HS upper and lower bounds. The first have been calculated by using the relation z2 = 0.5ÿf2, which is the biggest dependence of the microstructural parameter on the volume fraction found in the literature. The second were obtained by setting z2 as a constant value of 0.999 independent from the volume fraction. This has been done only to show at what value the lower bound changes dramatically, knowing that the biggest value found in the literature and possible for z2 to take is 0.5. And yet, even at these disproportion conditions the upper and lower bounds leave an immense imprecise area available for properties to take.
Figure 8.14. Conductivity of a composite as a function of the volume fraction – modeled with the General Effective Medium (GEM) theory and Hashin-Strikman 3-point-bounds (HS3). The composite consists of two materials – one highly conductive (20 a.u.) playing the role of metallic particles and the other isolative (1x10⁻⁶ a.u.) playing the role of PDMS. HS3 lower (L) and upper (U) bounds were calculated with the relation z2 º 0.5ÿf2 as well as with the constant value of z2 = 0.001.
PERCOLATION THEORY 123
One can see that at very high and very low doses GEM and HS models approach. This fits with the validity of the HS model which demands the particles being well separated from each other. This is only the case at very extreme doses where PDMS or metal particles dominate the volume. Only at the very extreme limits next to 1 or 0 the particles (metal or PDMS) are allowed to touch and the steep HS curve–increase or curve–decrease happens. However one can imagine displacing the latter two in the percolation domain so that graphically this would approach and even superpose the two different models together. From the intuitive point of view this would be correct thing to do, but mathematically difficult.
The differences between the Hashin-Strikman 4-point bounds (not shown in this document) and the 3-point bounds or the 2-point bounds should be very big, since the dependences of a property on the volume fraction (2), or on the structure (3) or on the interactions (4) are very important. And still the domain of possible values that can be considered for a composite property to take is huge. Thus for the electrical as well as for the mechanical properties these theories were used just to verify that the measurements are within physically allowed bounds, but in the rest of the document only percolation theory will be considered for the modeling of the physical properties.
8.3.3 Percolation theory
Percolation theory [114][175], based on the connectivity of elements, can be applied to composites, and is used here to model σ vs. f. For a 2-phase composite, as the volume fraction of one element increases, clusters of this element increase in size until they span the full system at the percolation threshold fC. For conductive particles in an insulating matrix, the governing equation is Eq. (4.1) and (4.2). The conductivity measurements were measured only above percolation threshold, since only then a conductive path was created. The critical volume fraction i.e., the percolation threshold fC, is equal to 0.16 for a system of touching impenetrable spheres. σc is the conductivity of the conductive phase. In basic percolation theory, the exponent t depends only on the dimensionality of the system, with t =1.3 in 2D, and t =2 in 3D (see Section 4.1.1). However in practice no universal values for fC and t are observed, because details of the microstructure lead to different results as reviewed in [176]. fC has been reported from as low as 0.003 for carbon nanotubes [5] and greater than 0.4 for granular metals [176]. Thus I will refer to the simple theoretical values, obtained for lattice percolations and for touching impenetrable spheres analytically or numerically, as “universal” values. In Figure 8.12b, conductivity σ of gold and titanium samples implanted with FCVA was plotted vs. volume fraction f, which is the relevant variable for percolation theory. The two solid lines in the figure are fits to the percolation model Eq. (4.1). The fitting parameters are given in Table 8.4. A clear difference between gold and titanium samples can be seen, and for each metal the data for the three energies now lies on top of each other. The gold and titanium samples have a very different microstructure (see Section 6.3.5) and hence different detailed conduction properties, so a different percolation threshold is expected. Yet for each element, no distinction in σ vs. f data can be seen as a function of energy. The average gold particle size is 5, 8
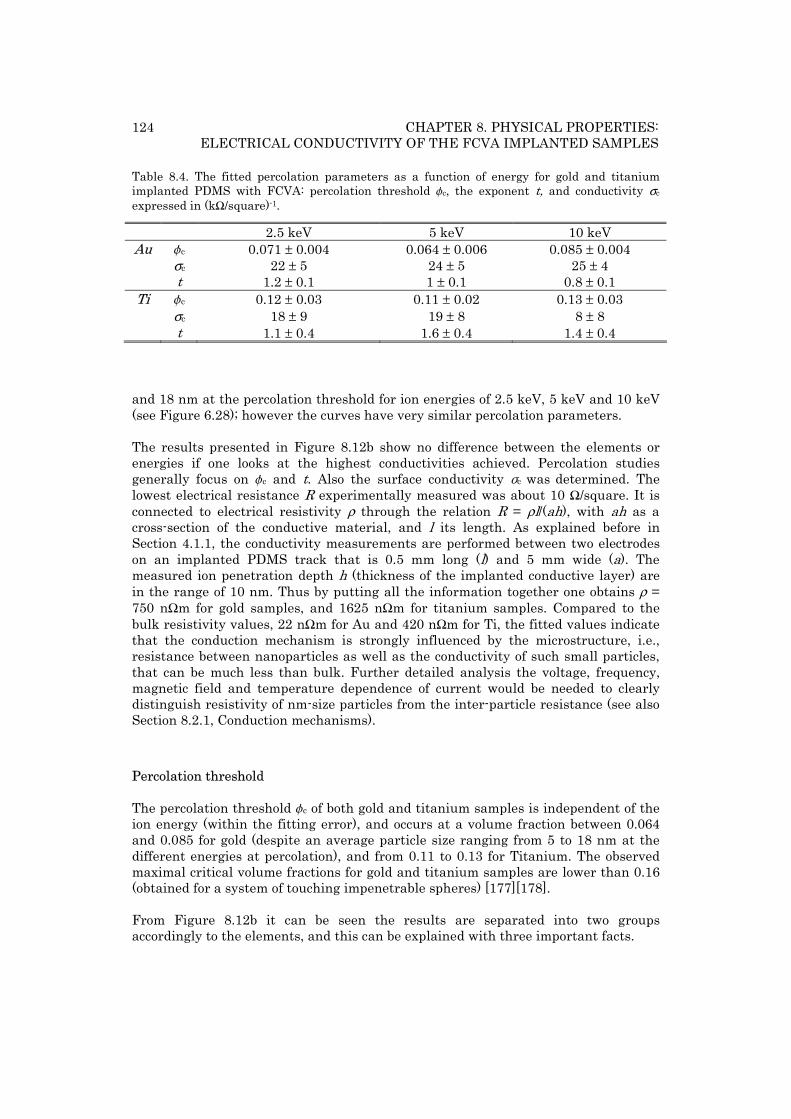
124 CHAPTER 8. PHYSICAL PROPERTIES: ELECTRICAL CONDUCTIVITY OF THE FCVA IMPLANTED SAMPLES
Table 8.4. The fitted percolation parameters as a function of energy for gold and titanium implanted PDMS with FCVA: percolation threshold fc, the exponent t, and conductivity σc expressed in (kΩ/square)-1.
2.5 keV 5 keV 10 keV Au fc 0.071 ± 0.004 0.064 ± 0.006 0.085 ± 0.004
σc 22 ± 5 24 ± 5 25 ± 4 t 1.2 ± 0.1 1 ± 0.1 0.8 ± 0.1
Ti fc 0.12 ± 0.03 0.11 ± 0.02 0.13 ± 0.03 σc 18 ± 9 19 ± 8 8 ± 8 t 1.1 ± 0.4 1.6 ± 0.4 1.4 ± 0.4
and 18 nm at the percolation threshold for ion energies of 2.5 keV, 5 keV and 10 keV (see Figure 6.28); however the curves have very similar percolation parameters. The results presented in Figure 8.12b show no difference between the elements or energies if one looks at the highest conductivities achieved. Percolation studies generally focus on fc and t. Also the surface conductivity σc was determined. The lowest electrical resistance R experimentally measured was about 10 Ω/square. It is connected to electrical resistivity ρ through the relation R = ρl/(ah), with ah as a cross-section of the conductive material, and l its length. As explained before in Section 4.1.1, the conductivity measurements are performed between two electrodes on an implanted PDMS track that is 0.5 mm long (l) and 5 mm wide (a). The measured ion penetration depth h (thickness of the implanted conductive layer) are in the range of 10 nm. Thus by putting all the information together one obtains ρ = 750 nΩm for gold samples, and 1625 nΩm for titanium samples. Compared to the bulk resistivity values, 22 nΩm for Au and 420 nΩm for Ti, the fitted values indicate that the conduction mechanism is strongly influenced by the microstructure, i.e., resistance between nanoparticles as well as the conductivity of such small particles, that can be much less than bulk. Further detailed analysis the voltage, frequency, magnetic field and temperature dependence of current would be needed to clearly distinguish resistivity of nm-size particles from the inter-particle resistance (see also Section 8.2.1, Conduction mechanisms).
Percolation threshold
The percolation threshold fc of both gold and titanium samples is independent of the ion energy (within the fitting error), and occurs at a volume fraction between 0.064 and 0.085 for gold (despite an average particle size ranging from 5 to 18 nm at the different energies at percolation), and from 0.11 to 0.13 for Titanium. The observed maximal critical volume fractions for gold and titanium samples are lower than 0.16 (obtained for a system of touching impenetrable spheres) [177][178]. From Figure 8.12b it can be seen the results are separated into two groups accordingly to the elements, and this can be explained with three important facts.
PERCOLATION THEORY 125
First Au is as bulk around 20 times better conductor than Ti and this has consequences in following manner. During percolation the particles start to touch with each other creating an electrical conductive path that can be presented as a serial connection of resistors. Their resistivity is hinging on two parameters: the implantation-dependent composite structure, and the intrinsic electrical properties of ions, which for Au are better and therefore somewhat higher conductivity results.
Second, considering the intrinsic properties of Ti, it has a lower electronegativity (1.5) compared to Au (2.5), i.e. it oxidizes very fast. Although the implantation is performed below 8x10⁻⁶ mbar, once in atmosphere it forms a protective layer 1-2 nm thick that slowly increases [179]. Also, during the implantation the oxygen may be released out of PDMS and attack the newly formed titanium composite. Therefore the samples have been measured as fast as possible after the implantation. However this phenomenon might be a cause of a shift towards higher volume fractions.
Third, the intrinsic properties of the gold and titanium composite are different. The structure of gold is completely different from that of titanium samples (see Section 6.3.5). Big crystalline gold clusters provide better electrical conductivity than the homogeneous amorphous mixture of PDMS and Titanium, which is the reason of the fast oxidation, and this can lead to the better conductivity properties between the two elements at the same dose. For gold and titanium samples, the percolation thresholds remain stable relative with maximum ion energy. Yet the percolation threshold is related to the ion concentration. Higher energies lead to broader ion distribution, deeper penetration depths and therefore lower concentrations, refer to Figure 2.5. On the other hand, higher energies also increase the hardness of the implanted layer and its density. This will on its turn decrease the ion penetration depth and the ion distribution, and through that cancel the energy influence on these two values. This can explain the constant percolation threshold over a factor of 4 in ion energy.
Balberg et al. have shown that if the particles are not perfectly spherical fC is usually lower than 0.16 [180][181]. Others have found that if the particles are interacting (i.e. Sticky spheres) the effect of attractive forces on impermeable objects is to lower the percolation threshold [182][183]. Since interactions between non-bounded gold clusters are much bigger than those of well bounded titanium particles this may also partially explain such a low threshold for the gold samples.
Another explanation is the fact that metal particles at nanometer scale exhibit different physical properties than bulk [162][184]. It has been shown for instance that below 3 nm gold particles are insulating and that only above 10 nm Gold approaches bulk electrical properties. Higher energies lead to broader ion distribution but also increase ion mobility and possibility to create larger conductive clusters. Since fC and σ are interdependent fitting the values of σ could have an influence on the fitting fC value. The references found in the literature about percolation theory deal with particles in micrometer range, with tabled bulk properties, making them more suitable to extract the universal theoretical values [185].
Rae et al. have shown that the percolation properties of nano-particles are quite different [186]. The percolation threshold is reduced to as low as 2% and has been demonstrated in the case of indium-tin oxide as well as carbon black and carbon nanotubes. This phenomenon relies on electron tunneling to create some level of conductivity that can occur when conductive particles are separated by 10 nm or less.
126 CHAPTER 8. PHYSICAL PROPERTIES: ELECTRICAL CONDUCTIVITY OF THE FCVA IMPLANTED SAMPLES
This has been shortly discussed in Section 8.2.1 “Conduction mechanisms”. Though only further detailed analysis of the conductivity as a function of the voltage, frequency, magnetic field and temperature can possibly clarify or distinguish resistivity of nm-size particles from the inter-particle resistance.
Another difference between the samples presented in this work and the percolation theory or the experiments in the references is the non-isotropy of the composite structure [122]. This is specially pronounced for the gold samples, in which the biggest clusters are found on the surface, and only deep inside PDMS one can observe small clusters. This phenomenon is less pronounced for titanium samples, which have higher fC.
To conclude, although the observed maximal critical volume fractions for gold and titanium samples are lower than 0.16 (obtained for a system of touching impenetrable spheres), there are many results from literature explaining the lower thresholds and yet, the obtained values are in line with what is reported for carbon-powder-rubber based composites [176][187][188].
Exponent
The exponent t ranges for the titanium samples from 1.1 to 1.6 and for the gold implantations from 0.8 to 1.2, with no clear energy dependence (see Table 8.4). In 2D the theoretical value of t is equal to 1.3, and in 3D it is 2. This 2D theoretical value is closer to the measurements and it is very likely that in the 18 nm (at 2.5 keV; 22 nm at 5 keV; 30 nm at 10 keV) thick gold composites with an average clusters’ diameter of 7 nm (11 nm at 5 keV; 19 nm at 10 keV) the conductivity is more two dimensional than three dimensional. However since these samples remain conducting up to uniaxial strains of greater than 100%, conduction cannot be purely 2D, and probably evolves from 2.5D to 2D as the film is stretched
Due to the structure of titanium samples (well distributed and mixed with PDMS without creation of clusters) one expects from these composites exhibit rather a 3D conductivity and thus have a higher exponent. For gold and titanium samples the exponents are lower than the 3D “universal” value of 2. The last two arguments used to explain the low percolation threshold, the non-isotropy and nano-effects, may to some point also explain the low exponents, but they are difficult to quantify.
Experiments have shown that particles with diverse shapes and anisotropic conductivities can lead to different and often anisotropic exponents for transverse and in-plane measurements of conductivity [189]. The higher is the anisotropy, the further away is the exponent from the universal value. As it has been presented in Figure 6.24 and Figure 6.25 titanium ions are well incorporated in the molecular structure of PDMS and form a homogenous composite without creating clusters. They are well distributed under the surface. The exponents are closer to 2. Gold clusters vary in size with depth – they are bigger next to the surface. Their shape is not perfectly spherical, but rather ellipsoidal, elongated parallel to the surface, and according to Deprez et al. [189] lower values of t are expected. Since these effects (anisotropy and polydispersion) increase with energy, this explains the slight decrease of the exponent with the energy. Celzard has shown that isotropy of
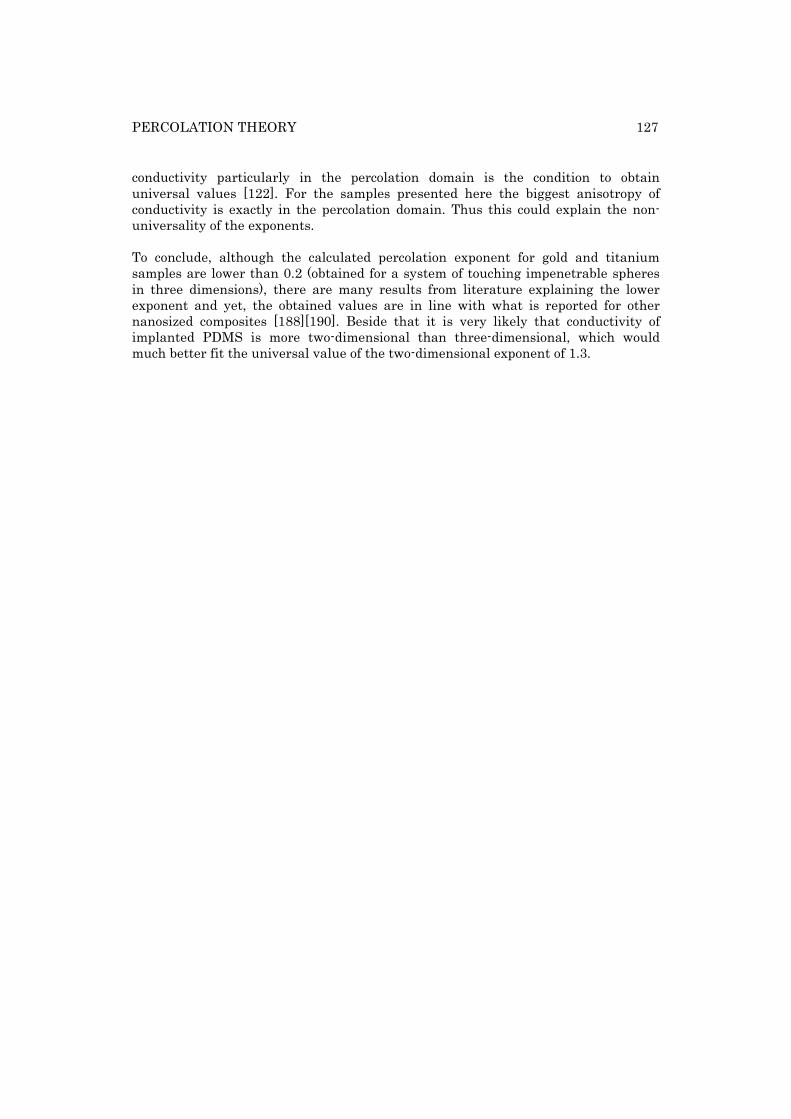
PERCOLATION THEORY 127
conductivity particularly in the percolation domain is the condition to obtain universal values [122]. For the samples presented here the biggest anisotropy of conductivity is exactly in the percolation domain. Thus this could explain the non-universality of the exponents. To conclude, although the calculated percolation exponent for gold and titanium samples are lower than 0.2 (obtained for a system of touching impenetrable spheres in three dimensions), there are many results from literature explaining the lower exponent and yet, the obtained values are in line with what is reported for other nanosized composites [188][190]. Beside that it is very likely that conductivity of implanted PDMS is more two-dimensional than three-dimensional, which would much better fit the universal value of the two-dimensional exponent of 1.3.
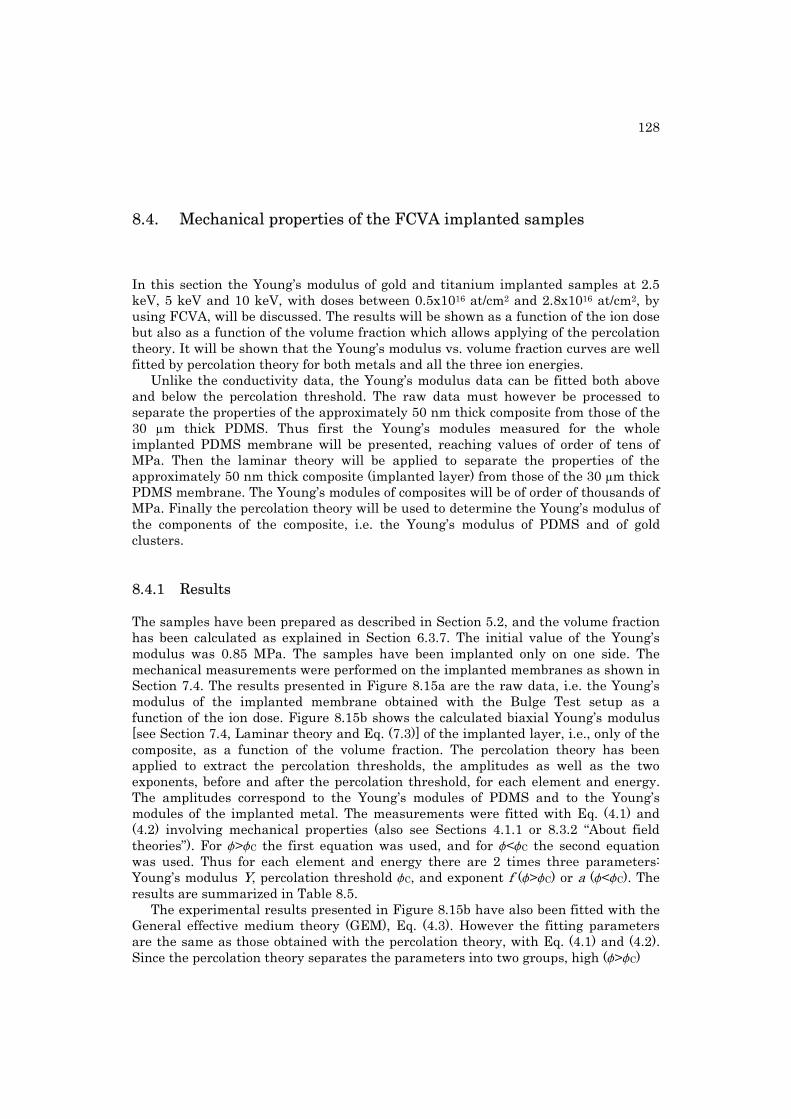
128
8.4. Mechanical properties of the FCVA implanted samples
In this section the Young’s modulus of gold and titanium implanted samples at 2.5 keV, 5 keV and 10 keV, with doses between 0.5x10¹⁶ at/cm2 and 2.8x10¹⁶ at/cm2, by using FCVA, will be discussed. The results will be shown as a function of the ion dose but also as a function of the volume fraction which allows applying of the percolation theory. It will be shown that the Young’s modulus vs. volume fraction curves are well fitted by percolation theory for both metals and all the three ion energies.
Unlike the conductivity data, the Young’s modulus data can be fitted both above and below the percolation threshold. The raw data must however be processed to separate the properties of the approximately 50 nm thick composite from those of the 30 µm thick PDMS. Thus first the Young’s modules measured for the whole implanted PDMS membrane will be presented, reaching values of order of tens of MPa. Then the laminar theory will be applied to separate the properties of the approximately 50 nm thick composite (implanted layer) from those of the 30 µm thick PDMS membrane. The Young’s modules of composites will be of order of thousands of MPa. Finally the percolation theory will be used to determine the Young’s modulus of the components of the composite, i.e. the Young’s modulus of PDMS and of gold clusters.
8.4.1 Results
The samples have been prepared as described in Section 5.2, and the volume fraction has been calculated as explained in Section 6.3.7. The initial value of the Young’s modulus was 0.85 MPa. The samples have been implanted only on one side. The mechanical measurements were performed on the implanted membranes as shown in Section 7.4. The results presented in Figure 8.15a are the raw data, i.e. the Young’s modulus of the implanted membrane obtained with the Bulge Test setup as a function of the ion dose. Figure 8.15b shows the calculated biaxial Young’s modulus [see Section 7.4, Laminar theory and Eq. (7.3)] of the implanted layer, i.e., only of the composite, as a function of the volume fraction. The percolation theory has been applied to extract the percolation thresholds, the amplitudes as well as the two exponents, before and after the percolation threshold, for each element and energy. The amplitudes correspond to the Young’s modules of PDMS and to the Young’s modules of the implanted metal. The measurements were fitted with Eq. (4.1) and (4.2) involving mechanical properties (also see Sections 4.1.1 or 8.3.2 “About field theories”). For f>fC the first equation was used, and for f<fC the second equation was used. Thus for each element and energy there are 2 times three parameters: Young’s modulus Y, percolation threshold fC, and exponent f (f>fC) or a (f<fC). The results are summarized in Table 8.5.
The experimental results presented in Figure 8.15b have also been fitted with the General effective medium theory (GEM), Eq. (4.3). However the fitting parameters are the same as those obtained with the percolation theory, with Eq. (4.1) and (4.2). Since the percolation theory separates the parameters into two groups, high (f>fC)
RESULTS 129
a
b
Figure 8.15. The Young’s modulus of gold and titanium samples implanted by FCVA at 2.5 keV, 5 keV and 10 keV, as a function of dose (a) and volume fraction (b). (a) – The raw Bulge test measurements as a function of the dose. (b) – Young’s modules of the composites, calculated with the Laminar theory, as a function of the volume fraction. The curve in (b) is the fit of data with the General Effective Media, Eq. (4.3), for 5 keV gold implanted samples. and low (f<fC) volume fraction regimes, and because this allows a better structured analysis, only the results obtained with the percolation theory will be discussed. Figure 8.15a shows that the stiffness of the implanted PDMS increases with the dose and with the energy, and saturates at the doses around 2x10¹⁶ at/cm2. The Young’s modules of all membranes are below 6 MPa. The highest and the lowest saturation values are obtained for the membranes implanted with gold ions, 5.5 MPa at 10 keV and 1.2 MPa at 2.5 keV respectively.
130 CHAPTER 8. PHYSICAL PROPERTIES: MECHANICAL PROPERTIES OF THE FCVA IMPLANTED SAMPLES
Table 8.5. The fitted percolation parameters as a function of energy for gold and titanium FCVA implantation: percolation threshold fc, the Young’s modulus Y expressed in MPa and exponents a and f.
2.5 keV 5 keV 10 keV Au f < fc 0.13 ± 0.01 0.13 ± 0.01 0.07 ± 0.01
YPDMS 2 ± 1 3 ± 1 2 ± 1 a 0.9 ± 0.3 0.9 ± 0.3 1.2 ± 0.3
Au f > fc 0.12 ± 0.01 0.12 ± 0.01 0.05 ± 0.01 YAu 1080 ± 270 4850 ± 1210 24700 ± 6180 f 0.2 ± 0.1 0.2 ± 0.1 0.7 ± 0.1
Ti f < fc 0.27 ± 0.02 0.17 ± 0.02 0.12 ± 0.02 YPDMS 1 ± 1 3 ± 1 1 ± 1 a 1.9 ± 0.3 1.3 ± 0.3 2.4 ± 0.3
Ti f > fc 0.24 ± 0.02 0.20 ± 0.02 0.08 ± 0.02 YTi 1700 ± 430 2810 ± 700 4740 ± 1190 f 0.2 ± 0.1 0.1 ± 0.1 0.1 ± 0.1
Figure 8.15b shows that in the percolation region the Young’s modulus of the composite increases, first slowly, and then rapidly, after what it reaches a plateau value. The saturation value depends on energy and reaches the lowest and the highest value for gold implanted samples, 0.6 GPa and 4.7 GPa, at 2.5 keV and 10 keV respectively. For the same element the changes of the Young’s modules increase with the energy. The percolation thresholds are roughly all around 1.5x10¹⁶ at/cm2 except for gold and titanium samples implanted at 10 keV. The samples implanted at the highest energy exhibit properties modifications in a rather linear manner. While for the 2.5 keV implantation the titanium samples have bigger increase of the Young’s modulus then gold samples, at 5 keV and 10 keV it is inverted. Compared with the tabled values for pure Gold and Titanium, which are 80 GPa and 130 GPa, the highest measured values of the composites are roughly 25 times smaller (4.7 GPa and 3.5 GPa, see Table 8.6), and the ratio between the Young’s modules of the two elements changes from 1:1.5 (Au:Ti, bulk) to 1.3:1 (Au:Ti, components). The Young’s modules of composites (implanted layers) were not only calculated with the laminar theory [Section 7.4, Eq. (7.3)] but also with the “roughness-wave” model [Section 2.5.3, Eq. (2.8)], which links wavelength of surface roughness to stiffness. Table 8.6 compares the results obtained in the two different techniques. The first calculation is based respectively on the composite thicknesses presented in Table 6.4. The second model uses the wavelengths listed in Table 6.3. Despite the large estimated error bars on the calculations based on the wavelengths, the Young’s modules determined by two completely different methods are almost the same.
First this is a strong indication that the values used in the discussion and for the further calculations in the percolation theory are correct. The “roughness-wave” model uses the equi-biaxial Young’s model. This also supports the method described in Section 7.4 which allows calculation of the, there defined as, longitudinal biaxial Young’s modulus.
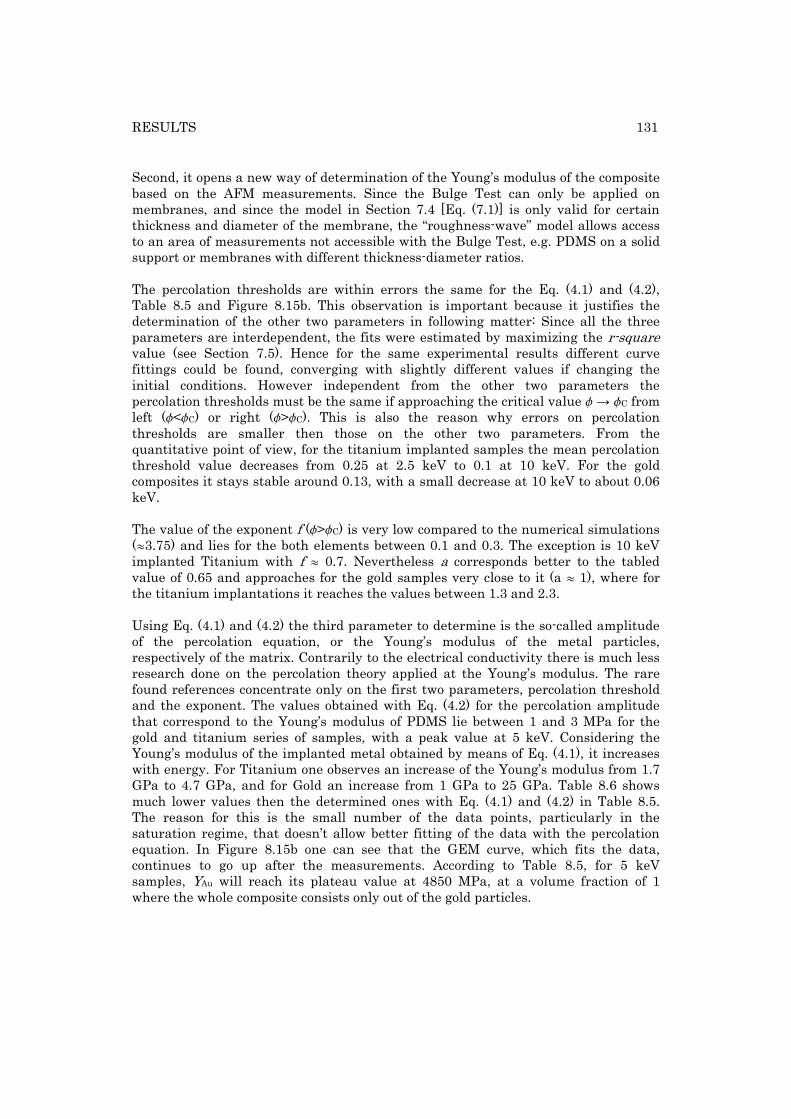
RESULTS 131
Second, it opens a new way of determination of the Young’s modulus of the composite based on the AFM measurements. Since the Bulge Test can only be applied on membranes, and since the model in Section 7.4 [Eq. (7.1)] is only valid for certain thickness and diameter of the membrane, the “roughness-wave” model allows access to an area of measurements not accessible with the Bulge Test, e.g. PDMS on a solid support or membranes with different thickness-diameter ratios. The percolation thresholds are within errors the same for the Eq. (4.1) and (4.2), Table 8.5 and Figure 8.15b. This observation is important because it justifies the determination of the other two parameters in following matter: Since all the three parameters are interdependent, the fits were estimated by maximizing the r-square value (see Section 7.5). Hence for the same experimental results different curve fittings could be found, converging with slightly different values if changing the initial conditions. However independent from the other two parameters the percolation thresholds must be the same if approaching the critical value f → fC from left (f<fC) or right (f>fC). This is also the reason why errors on percolation thresholds are smaller then those on the other two parameters. From the quantitative point of view, for the titanium implanted samples the mean percolation threshold value decreases from 0.25 at 2.5 keV to 0.1 at 10 keV. For the gold composites it stays stable around 0.13, with a small decrease at 10 keV to about 0.06 keV. The value of the exponent f (f>fC) is very low compared to the numerical simulations (º3.75) and lies for the both elements between 0.1 and 0.3. The exception is 10 keV implanted Titanium with f º 0.7. Nevertheless a corresponds better to the tabled value of 0.65 and approaches for the gold samples very close to it (a º 1), where for the titanium implantations it reaches the values between 1.3 and 2.3. Using Eq. (4.1) and (4.2) the third parameter to determine is the so-called amplitude of the percolation equation, or the Young’s modulus of the metal particles, respectively of the matrix. Contrarily to the electrical conductivity there is much less research done on the percolation theory applied at the Young’s modulus. The rare found references concentrate only on the first two parameters, percolation threshold and the exponent. The values obtained with Eq. (4.2) for the percolation amplitude that correspond to the Young’s modulus of PDMS lie between 1 and 3 MPa for the gold and titanium series of samples, with a peak value at 5 keV. Considering the Young’s modulus of the implanted metal obtained by means of Eq. (4.1), it increases with energy. For Titanium one observes an increase of the Young’s modulus from 1.7 GPa to 4.7 GPa, and for Gold an increase from 1 GPa to 25 GPa. Table 8.6 shows much lower values then the determined ones with Eq. (4.1) and (4.2) in Table 8.5. The reason for this is the small number of the data points, particularly in the saturation regime, that doesn’t allow better fitting of the data with the percolation equation. In Figure 8.15b one can see that the GEM curve, which fits the data, continues to go up after the measurements. According to Table 8.5, for 5 keV samples, YAu will reach its plateau value at 4850 MPa, at a volume fraction of 1 where the whole composite consists only out of the gold particles.
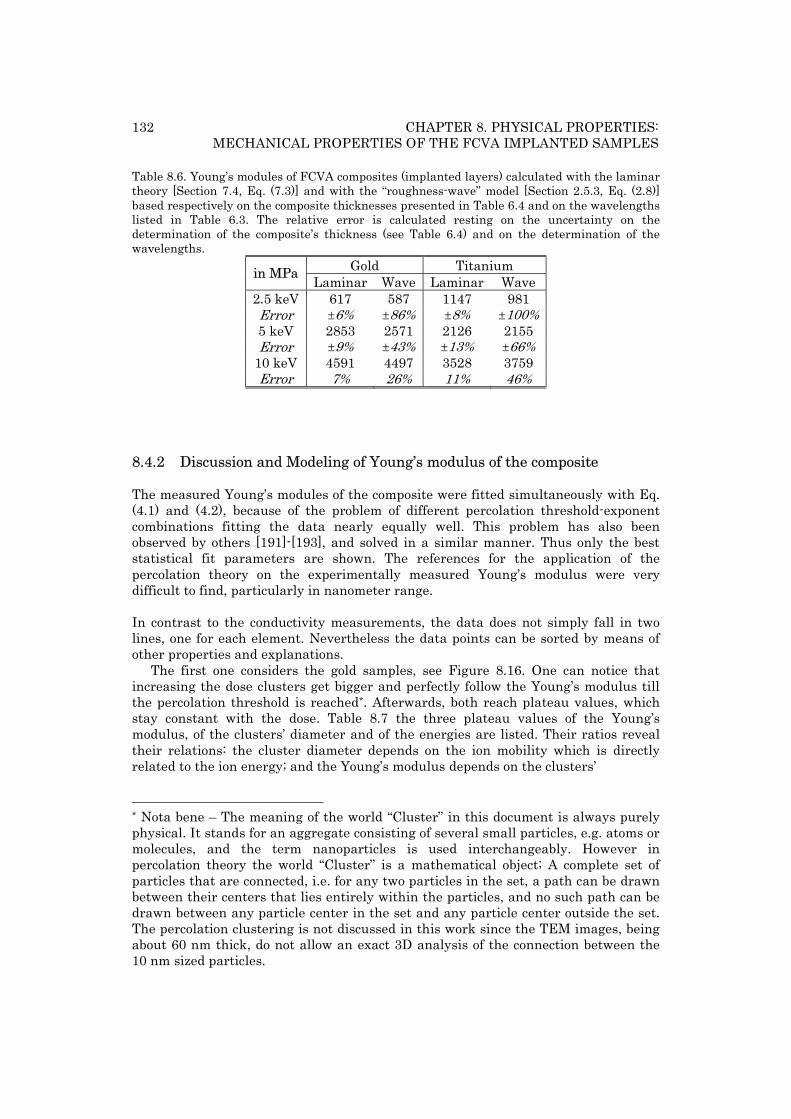
132 CHAPTER 8. PHYSICAL PROPERTIES: MECHANICAL PROPERTIES OF THE FCVA IMPLANTED SAMPLES
Table 8.6. Young’s modules of FCVA composites (implanted layers) calculated with the laminar theory [Section 7.4, Eq. (7.3)] and with the “roughness-wave” model [Section 2.5.3, Eq. (2.8)] based respectively on the composite thicknesses presented in Table 6.4 and on the wavelengths listed in Table 6.3. The relative error is calculated resting on the uncertainty on the determination of the composite’s thickness (see Table 6.4) and on the determination of the wavelengths.
Gold Titanium in MPa Laminar Wave Laminar Wave 2.5 keV 617 587 1147 981 Error ±6% ±86% ±8% ±100%5 keV 2853 2571 2126 2155 Error ±9% ±43% ±13% ±66%
10 keV 4591 4497 3528 3759 Error 7% 26% 11% 46%
8.4.2 Discussion and Modeling of Young’s modulus of the composite
The measured Young’s modules of the composite were fitted simultaneously with Eq. (4.1) and (4.2), because of the problem of different percolation threshold-exponent combinations fitting the data nearly equally well. This problem has also been observed by others [191]-[193], and solved in a similar manner. Thus only the best statistical fit parameters are shown. The references for the application of the percolation theory on the experimentally measured Young’s modulus were very difficult to find, particularly in nanometer range. In contrast to the conductivity measurements, the data does not simply fall in two lines, one for each element. Nevertheless the data points can be sorted by means of other properties and explanations.
The first one considers the gold samples, see Figure 8.16. One can notice that increasing the dose clusters get bigger and perfectly follow the Young’s modulus till the percolation threshold is reached*. Afterwards, both reach plateau values, which stay constant with the dose. Table 8.7 the three plateau values of the Young’s modulus, of the clusters’ diameter and of the energies are listed. Their ratios reveal their relations: the cluster diameter depends on the ion mobility which is directly related to the ion energy; and the Young’s modulus depends on the clusters’
* Nota bene – The meaning of the world “Cluster” in this document is always purely physical. It stands for an aggregate consisting of several small particles, e.g. atoms or molecules, and the term nanoparticles is used interchangeably. However in percolation theory the world “Cluster” is a mathematical object; A complete set of particles that are connected, i.e. for any two particles in the set, a path can be drawn between their centers that lies entirely within the particles, and no such path can be drawn between any particle center in the set and any particle center outside the set. The percolation clustering is not discussed in this work since the TEM images, being about 60 nm thick, do not allow an exact 3D analysis of the connection between the 10 nm sized particles.
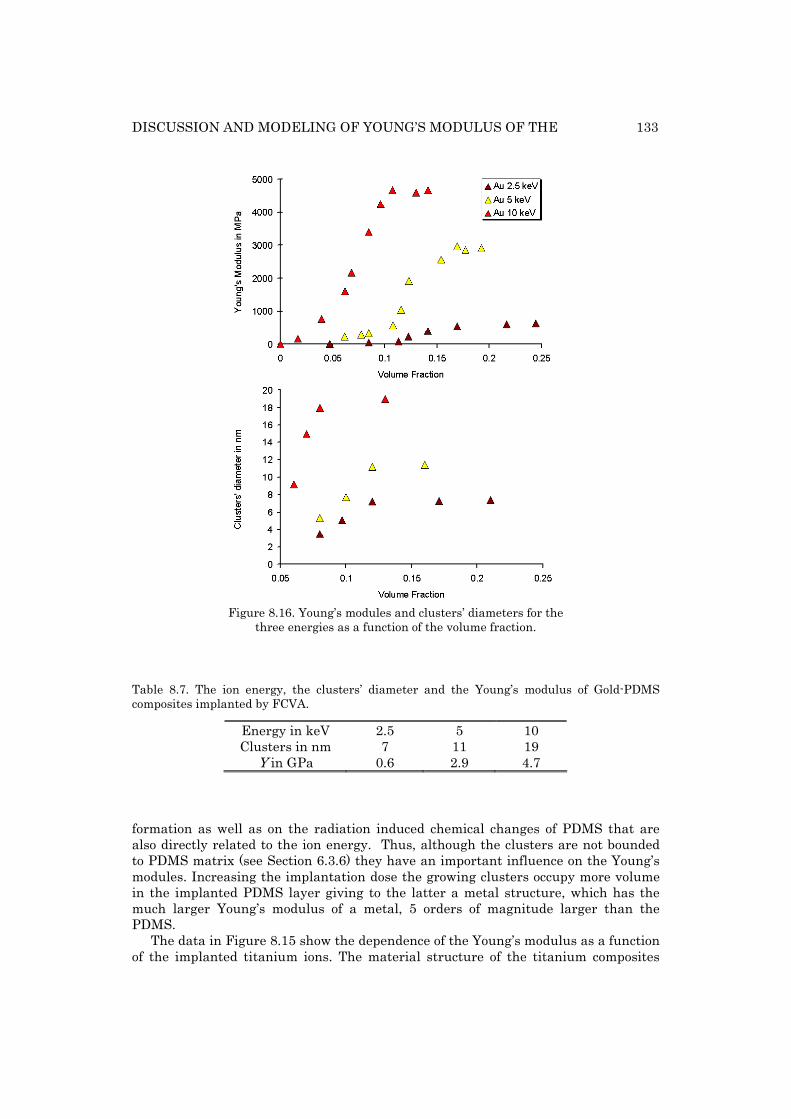
DISCUSSION AND MODELING OF YOUNG’S MODULUS OF THE 133
Figure 8.16. Young’s modules and clusters’ diameters for the
three energies as a function of the volume fraction. Table 8.7. The ion energy, the clusters’ diameter and the Young’s modulus of Gold-PDMS composites implanted by FCVA.
Energy in keV 2.5 5 10 Clusters in nm 7 11 19
Y in GPa 0.6 2.9 4.7 formation as well as on the radiation induced chemical changes of PDMS that are also directly related to the ion energy. Thus, although the clusters are not bounded to PDMS matrix (see Section 6.3.6) they have an important influence on the Young’s modules. Increasing the implantation dose the growing clusters occupy more volume in the implanted PDMS layer giving to the latter a metal structure, which has the much larger Young’s modulus of a metal, 5 orders of magnitude larger than the PDMS.
The data in Figure 8.15 show the dependence of the Young’s modulus as a function of the implanted titanium ions. The material structure of the titanium composites
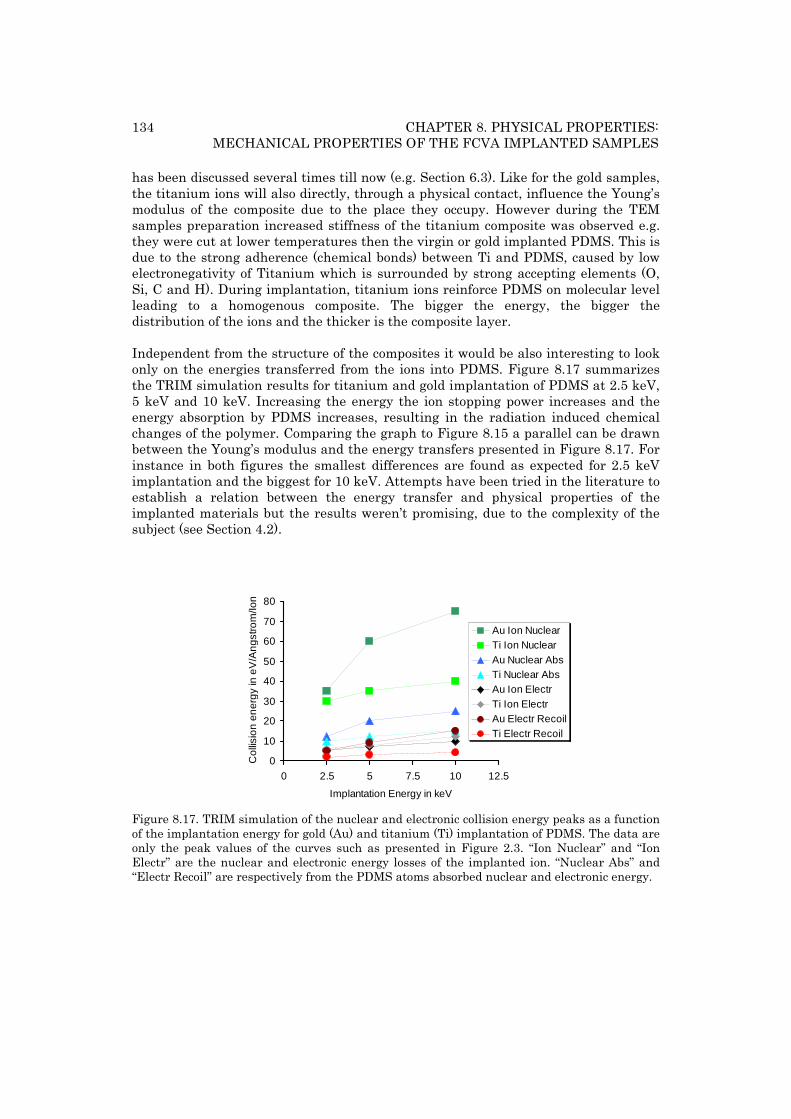
134 CHAPTER 8. PHYSICAL PROPERTIES: MECHANICAL PROPERTIES OF THE FCVA IMPLANTED SAMPLES
has been discussed several times till now (e.g. Section 6.3). Like for the gold samples, the titanium ions will also directly, through a physical contact, influence the Young’s modulus of the composite due to the place they occupy. However during the TEM samples preparation increased stiffness of the titanium composite was observed e.g. they were cut at lower temperatures then the virgin or gold implanted PDMS. This is due to the strong adherence (chemical bonds) between Ti and PDMS, caused by low electronegativity of Titanium which is surrounded by strong accepting elements (O, Si, C and H). During implantation, titanium ions reinforce PDMS on molecular level leading to a homogenous composite. The bigger the energy, the bigger the distribution of the ions and the thicker is the composite layer. Independent from the structure of the composites it would be also interesting to look only on the energies transferred from the ions into PDMS. Figure 8.17 summarizes the TRIM simulation results for titanium and gold implantation of PDMS at 2.5 keV, 5 keV and 10 keV. Increasing the energy the ion stopping power increases and the energy absorption by PDMS increases, resulting in the radiation induced chemical changes of the polymer. Comparing the graph to Figure 8.15 a parallel can be drawn between the Young’s modulus and the energy transfers presented in Figure 8.17. For instance in both figures the smallest differences are found as expected for 2.5 keV implantation and the biggest for 10 keV. Attempts have been tried in the literature to establish a relation between the energy transfer and physical properties of the implanted materials but the results weren’t promising, due to the complexity of the subject (see Section 4.2).
0
10
20
30
40
50
60
70
80
0 2.5 5 7.5 10 12.5
Implantation Energy in keV
Col
lisio
n en
erg
y in
eV
/An
gstro
m/Io
n
Au Ion NuclearTi Ion NuclearAu Nuclear AbsTi Nuclear AbsAu Ion ElectrTi Ion ElectrAu Electr RecoilTi Electr Recoil
Figure 8.17. TRIM simulation of the nuclear and electronic collision energy peaks as a function of the implantation energy for gold (Au) and titanium (Ti) implantation of PDMS. The data are only the peak values of the curves such as presented in Figure 2.3. “Ion Nuclear” and “Ion Electr” are the nuclear and electronic energy losses of the implanted ion. “Nuclear Abs” and “Electr Recoil” are respectively from the PDMS atoms absorbed nuclear and electronic energy.
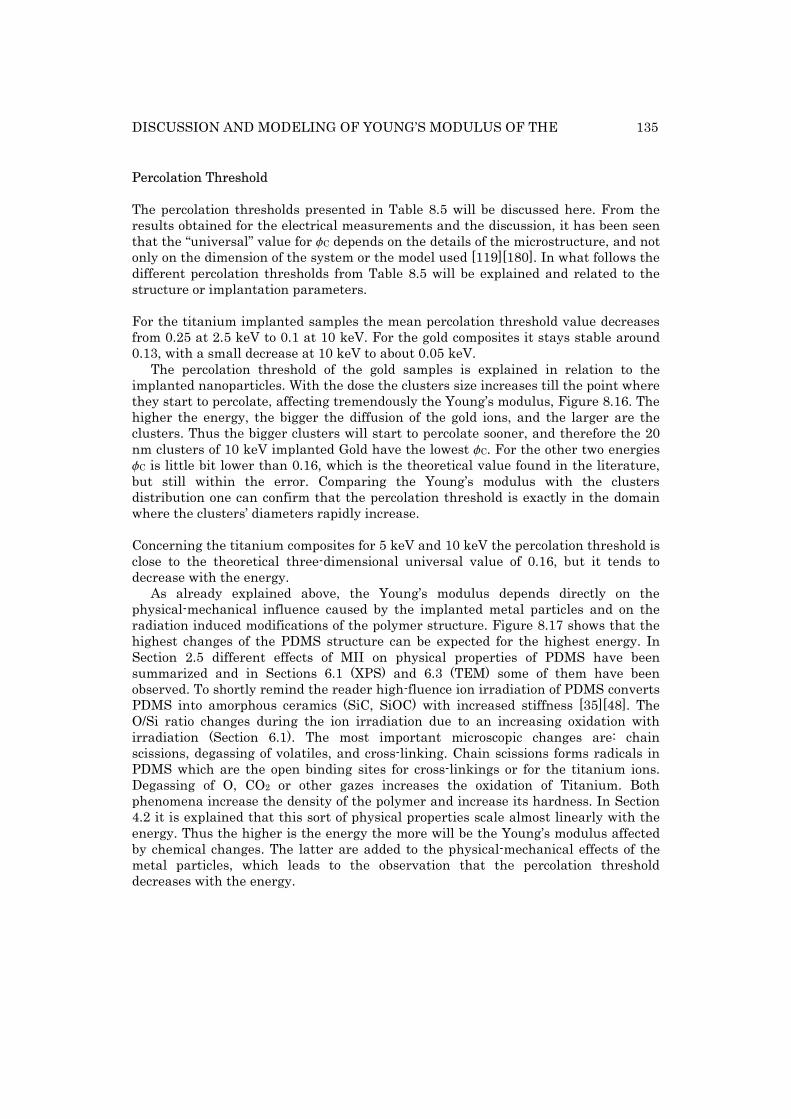
DISCUSSION AND MODELING OF YOUNG’S MODULUS OF THE 135
Percolation Threshold
The percolation thresholds presented in Table 8.5 will be discussed here. From the results obtained for the electrical measurements and the discussion, it has been seen that the “universal” value for fC depends on the details of the microstructure, and not only on the dimension of the system or the model used [119][180]. In what follows the different percolation thresholds from Table 8.5 will be explained and related to the structure or implantation parameters. For the titanium implanted samples the mean percolation threshold value decreases from 0.25 at 2.5 keV to 0.1 at 10 keV. For the gold composites it stays stable around 0.13, with a small decrease at 10 keV to about 0.05 keV.
The percolation threshold of the gold samples is explained in relation to the implanted nanoparticles. With the dose the clusters size increases till the point where they start to percolate, affecting tremendously the Young’s modulus, Figure 8.16. The higher the energy, the bigger the diffusion of the gold ions, and the larger are the clusters. Thus the bigger clusters will start to percolate sooner, and therefore the 20 nm clusters of 10 keV implanted Gold have the lowest fC. For the other two energies fC is little bit lower than 0.16, which is the theoretical value found in the literature, but still within the error. Comparing the Young’s modulus with the clusters distribution one can confirm that the percolation threshold is exactly in the domain where the clusters’ diameters rapidly increase. Concerning the titanium composites for 5 keV and 10 keV the percolation threshold is close to the theoretical three-dimensional universal value of 0.16, but it tends to decrease with the energy.
As already explained above, the Young’s modulus depends directly on the physical-mechanical influence caused by the implanted metal particles and on the radiation induced modifications of the polymer structure. Figure 8.17 shows that the highest changes of the PDMS structure can be expected for the highest energy. In Section 2.5 different effects of MII on physical properties of PDMS have been summarized and in Sections 6.1 (XPS) and 6.3 (TEM) some of them have been observed. To shortly remind the reader high-fluence ion irradiation of PDMS converts PDMS into amorphous ceramics (SiC, SiOC) with increased stiffness [35][48]. The O/Si ratio changes during the ion irradiation due to an increasing oxidation with irradiation (Section 6.1). The most important microscopic changes are: chain scissions, degassing of volatiles, and cross-linking. Chain scissions forms radicals in PDMS which are the open binding sites for cross-linkings or for the titanium ions. Degassing of O, CO2 or other gazes increases the oxidation of Titanium. Both phenomena increase the density of the polymer and increase its hardness. In Section 4.2 it is explained that this sort of physical properties scale almost linearly with the energy. Thus the higher is the energy the more will be the Young’s modulus affected by chemical changes. The latter are added to the physical-mechanical effects of the metal particles, which leads to the observation that the percolation threshold decreases with the energy.
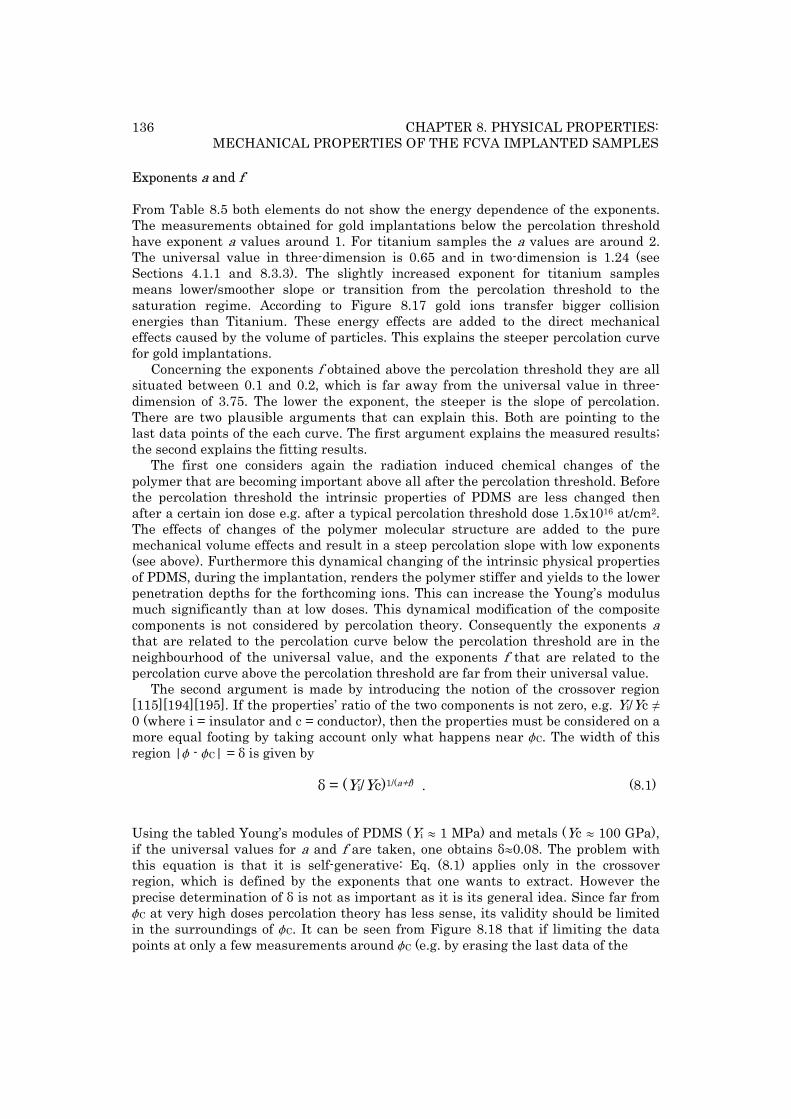
136 CHAPTER 8. PHYSICAL PROPERTIES: MECHANICAL PROPERTIES OF THE FCVA IMPLANTED SAMPLES
Exponents a and f
From Table 8.5 both elements do not show the energy dependence of the exponents. The measurements obtained for gold implantations below the percolation threshold have exponent a values around 1. For titanium samples the a values are around 2. The universal value in three-dimension is 0.65 and in two-dimension is 1.24 (see Sections 4.1.1 and 8.3.3). The slightly increased exponent for titanium samples means lower/smoother slope or transition from the percolation threshold to the saturation regime. According to Figure 8.17 gold ions transfer bigger collision energies than Titanium. These energy effects are added to the direct mechanical effects caused by the volume of particles. This explains the steeper percolation curve for gold implantations.
Concerning the exponents f obtained above the percolation threshold they are all situated between 0.1 and 0.2, which is far away from the universal value in three-dimension of 3.75. The lower the exponent, the steeper is the slope of percolation. There are two plausible arguments that can explain this. Both are pointing to the last data points of the each curve. The first argument explains the measured results; the second explains the fitting results.
The first one considers again the radiation induced chemical changes of the polymer that are becoming important above all after the percolation threshold. Before the percolation threshold the intrinsic properties of PDMS are less changed then after a certain ion dose e.g. after a typical percolation threshold dose 1.5x10¹⁶ at/cm2. The effects of changes of the polymer molecular structure are added to the pure mechanical volume effects and result in a steep percolation slope with low exponents (see above). Furthermore this dynamical changing of the intrinsic physical properties of PDMS, during the implantation, renders the polymer stiffer and yields to the lower penetration depths for the forthcoming ions. This can increase the Young’s modulus much significantly than at low doses. This dynamical modification of the composite components is not considered by percolation theory. Consequently the exponents a that are related to the percolation curve below the percolation threshold are in the neighbourhood of the universal value, and the exponents f that are related to the percolation curve above the percolation threshold are far from their universal value.
The second argument is made by introducing the notion of the crossover region [115][194][195]. If the properties’ ratio of the two components is not zero, e.g. Yi/Yc ≠ 0 (where i = insulator and c = conductor), then the properties must be considered on a more equal footing by taking account only what happens near fC. The width of this region |f - fC| = δ is given by
δ = (Yi/Yc)1/(a+f) .
(8.1)
Using the tabled Young’s modules of PDMS (Yi º 1 MPa) and metals (Yc º 100 GPa), if the universal values for a and f are taken, one obtains δº0.08. The problem with this equation is that it is self-generative: Eq. (8.1) applies only in the crossover region, which is defined by the exponents that one wants to extract. However the precise determination of δ is not as important as it is its general idea. Since far from fC at very high doses percolation theory has less sense, its validity should be limited in the surroundings of fC. It can be seen from Figure 8.18 that if limiting the data points at only a few measurements around fC (e.g. by erasing the last data of the
DISCUSSION AND MODELING OF YOUNG’S MODULUS OF THE 137
Figure 8.18. Principle of the crossover region applied on the Young’s modulus of the titanium implanted PDMS by FCVA at 5 keV and 10 keV. The red and the blue curves represent the fitting curves before and after the removal of the last data (red dot). The shadowed regions illustrate the width of the cross-over regions for δ = 0.08. each curve) the slope of the curve towards the plateau values becomes bigger and the fitted function improves the f exponent to higher values. By removing the last data points for titanium samples there were only three or four measurements left after fC allowing to extract f. For 2.5 keV, 5 keV and 10 keV the found values are 3 ± 0.3 (δ=0.06), 2.8 ± 0.4 (δ=0.04), and 2.7 ± 0.3 (δ=0.06). On the other hand from Figure 8.15 one can notice that this procedure does not change much a values, because below percolation threshold the results are continuously increasing with the dose, without saturation.
Young’s Modules of components
The results presented in Figure 8.15a are the Young’s modules measured for the whole implanted PDMS membrane. The laminar theory was applied to separate the properties of the approximately 50 nm thick composite (implanted layer) from those of the 30 µm thick PDMS membrane and these data are presented in Figure 8.15b.
Here percolation theory was used to determine the Young’s modulus of the components of the composite, i.e. the Young’s modulus of PDMS and of gold clusters (see Table 8.5). Fitting the measurements with Eq. (4.1) and (4.2) it is possible to find the so called amplitudes of percolation – the factors, Yi and Yc, standing before the percolation term |f - fC|. A lot of articles have been published about the percolation related to conductivity and much less related to Young’s modulus, as these publications focussed on the exponent and the percolation threshold. No attention was paid to the amplitudes of percolation – to the mechanical properties of the components. The reason for this probably lies on the difficulty to extract the Young’s modulus of the composite and to define it (planar or transversal), particularly in the anisotropic systems. In Table 8.5 the Young’s modules are presented, obtained by fitting the data with Eq. (4.1) and (4.2) for the two elements and the three energies.
138 CHAPTER 8. PHYSICAL PROPERTIES: CONCLUSION ON THE YOUNG’S MODULUS AND ELECTRICAL
Eq. (4.1) delivers the Young’s modulus of the implanted particles, YAu and YTi, and Eq. (4.2) of PDMS, YPDMS. The initial value of YPDMS is 0.85 MPa. The Young’s modules extracted from the measurements by the percolation theory are not energy dependant and about 2 MPa. Regarding the fitted Young’s modulus of the implanted metal ions, see Table 8.5, in spite of the large uncertainty in the fit, one can observe that it increases with the energy. Since gold and titanium ions form different structures inside of PDMS, the discussion must be done separately.
The Young’s modulus for a bulk piece of Gold lies around 79 GPa. However for gold clusters, obtained from the percolation fits, it increases with cluster size (itself related to the energy, see discussion above), starting at 1 GPa for 7 nm and reaching 25 GPa for 19 nm of cluster’s diameter. Schaefer et al. obtained Young’s modules in the same range (10 GPa for 10 nm) for individual nanometer-size Au clusters that were preformed in the gas phase and deposited on atomically flat substrates [196].
Concerning the titanium ions it has been shown that they are well bonded with PDMS, increasing its hardness during the implantation and creating a homogeneous composite. Since one could not see any agglomeration of Titanium in a form of clusters, one can only conclude that titanium ions bind with PDMS on an atomic/molecular level, together with the open sites or radicals. This prevents obtaining the tabled value of the bulk Titanium of 116 GPa. The found results are rather the results of doped PDMS than those of the microparticle-reinforced PDMS, as it is the case of the gold samples. Not much research has been done on the properties of the pure titanium clusters and I wasn’t able to find any on the mechanical properties [197]. Hence it is difficult to conclude anything from the results. However it is not unnatural that with the energy the size of the Ti-PDMS particles increases; first because of the direct relation to the ion diffusion (mobility) and second because of the indirect effects of the irradiation induced chemical changes of PDMS (e.g. by creating more radicals serving as binding sites for Ti, see above).
Starting with the PDMS initial value of 0.85 MPa the elastic constant increased after the implantation to 2 MPa, which is very reasonable value explained by the radiation effects on the polymer structure. Also the Young’s modules of gold clusters (10 GPa) are in agreement with those found in literature for gold clusters that were preformed in the gas phase and deposited on atomically flat substrates. These results are really nice since to get the Young’s modulus of the components, first the laminar theory was used to extract the Young’s modulus of the composite, and then the percolation theory was used to determine the Young’s modulus of the components of the composite.
8.5. Conclusion on the Young’s modulus and electrical conductivity of the FCVA implanted samples
A unique character is that the implanted PDMS is the one of the rare physical system where the percolation theory can be applied to model two physical properties at once, the Young’s modulus and the electrical conductivity. These two properties are independent from each other, but they are both related to the structure of the composite reflecting the percolation behavior. It is also noteworthy that the size of
DISCUSSION AND MODELING OF YOUNG’S MODULUS OF THE 139
the particles, 2 to 30 nm, very small compared to many percolative systems with µm scale inclusions. In this section the major findings on the Young’s modulus and the electrical conductivity from this chapter will be summarized, compared and discussed. Special attention will be given to the critical explanations describing the different percolation parameters obtained for the two properties and ensuring coherence of the explanations for both conductivity and Young’s modulus. First the better preserved surface state of the implanted PDMS samples with FCVA (no cracks on the surface, no sputtering, and no significant cross-section problems due to the increased hardness), than those implanted with LEI, showed to be better suited for the modeling and the discussion of the physical properties. Thus the discussion and conclusion concerns only FCVA implanted samples. Both the Young’s modules as well as the electrical conductivities are influenced by two implantation induced effects. The first one is the influence of the implanted metal particles on the physical properties (the physico-mechanical changes), and the second is the influence of the radiation induced chemical modifications of the molecular structure of the PDMS (chemical changes). While the physico-mechanical changes influence directly the two properties, by physical contact of the implanted or created particles, the chemical changes only alter directly the Young’s modulus. The direct effect of the molecular structure changes on the electrical conductivity exists, but in this case it is negligible. Consequences of the MII of PDMS are chain-scissions and cross-links resulting in increased polymer stiffness and density. The latter two will then in their turn decrease the ion penetration depth and distribution, and through that change the composite structure (size of the metal particles or their concentration) important for the electrical conductivity. One of the important findings discovered between the electrical conductivity measurements and the structure analysis is that gold ions form clusters that are responsible for the conductivity. Between each gold cluster there is a limited electrical connection enabled only through the physical contact hence having high contact resistance. Consequently the electrical path consists of highly conductive clusters and a huge number of parallel and series resistances. The conductivity mechanism of the gold clusters is Ohmic, composed of intrinsic size-dependent conductivity of the clusters and a lot of contact resistances. It is therefore obvious that the resulting conductivity is lower than that of a bulk.
The morphology of the titanium composites on the other hand leads to a different explanation on the electrical property of the created composite. The main structural observation is increased stiffness of the implanted layer and lack of titanium clusters. This is explained by the chemical reactivity of Titanium. It has a very low electronegativity (1.54). Compared to the PDMS atoms (Si – 1.9, H – 2.2, C – 2.55, O – 3.44) this means that as soon as it penetrates inside of PDMS, titanium ion will bind with the surrounding atoms. Therefore titanium implantation can be rather seen as a doping of the polymer. PDMS becomes conducting through enrichment of its electron budget by introducing titanium ions in its molecular structure. This can be seen as shifting the Fermi levels from the corresponding bandgaps towards the conduction bands.
140 CHAPTER 8. PHYSICAL PROPERTIES: CONCLUSION ON THE YOUNG’S MODULUS AND ELECTRICAL
The volume resistivities calculated from the surface resistivities give 750 nΩm for gold samples, and 1625 nΩm for titanium samples. Compared to the bulk resistivity values, 22 nΩm for Au and 420 nΩm for Ti, the measured values indicate that the conduction mechanism is strongly influenced by the microstructure, i.e., resistance between nanoparticles. Further detailed analysis on the voltage, frequency, magnetic field and temperature dependence of current are needed to clearly distinguish resistivity of nm-size particles from the inter-particle resistance and also determine the conduction mechanism (Ohmic, Mott, Schottky, tunnel etc.). The increase of the Young’s modulus for the implanted samples is related to two effects. The first is the implantation of the metal ions inside of PDMS or the incorporation of the additional material inside of the matrix. This phenomenon should purely be modeled with the percolation theory. The Young’s modulus of the gold implanted samples can be directly related to the cluster size. Increasing the implantation dose the growing clusters occupy more volume in the implanted PDMS layer giving to the latter a metal structure with corresponding Young’s modulus. The same explanation is applied for the titanium samples only that they don’t form clusters but are homogenously reinforcing PDMS on the molecular level leading to a very brittle amorphous material.
The second effect is the radiation induced chemical modification of the polymer structure. This has been specially observed for titanium implantation with LEI in XPS and TEM analysis, and the relation between the chemical changes and implantation parameters can be modeled with special theories. The latter describe changes of the polymer properties as a function of the total deposited energy, the product of the electronic energy loss and the ion dose. According to the theory the Young’s modulus is proportional to ΦSen, with 1.5 < n < 2.5, Φ being the ion dose and Se the electronic stopping power. The electronic stopping power is proportional to the energy E with Se∝E ½, and therefore the equation predicts a linear dependence of the Young’s modulus on both, ion dose and the energy. Beside this qualitative statement it is not possible in any manner to quantify these effects since the electronic energy loss for polymers (and particularly for composites) cannot be determined. TRIM simulations however show that the energy losses follow the measurements.
The Young’s modulus of the composite has been determined. It shows percolation behavior and saturates at high doses. The saturation value depends on energy and reaches the lowest and the highest value for gold implanted samples, respectively 0.6 GPa and 4.7 GPa, at 2.5 keV and 10 keV. As a consequence of the results summarized till this point the highest electrical conductivity and the smallest increase of the Young’s modulus are given with gold implantation at 2.5 keV. The same data was also presented as a function of the volume fraction allowing modeling the results with the percolation theory.
While the percolation threshold, for the Young’s modulus results, decreases with the energy and there is no clear distinction between the elements, the percolation threshold for the electrical conductivity differences the titanium from the gold samples and is independent from the energy. The reason for this different behaviour of the percolation threshold is based on the influences of physico-mechanical (e.g.
DISCUSSION AND MODELING OF YOUNG’S MODULUS OF THE 141
particle’s volume and connectivity) and chemical (e.g. density) changes, as well as the influences of the intrinsic element properties (e.g. bulk conductivity and oxidation) and composite structure (e.g. clusters) on the Young’s modulus and electrical conductivity. For instance the elasticity constant is directly related to the material structure, e.g. particles formation in a form of clusters (Gold) or amorphous aggregates (Titanium), that depend on the energy. The electrical conductivity depends on the connectivity of the particles and on the conduction mechanism, which do not directly depend on the energy. The influence of the particles on the mechanical properties starts already in a continuous manner with already the first implanted ion. However the electrical properties change only after a certain ion concentration has been exceeded in the case of titanium doping, or after a certain particle size, has been reached in the case of the gold clusters. During the determination of the exponents different arguments were used to explain their generally low values and it is important to note here that these explanations are coherent for the electrical and the mechanical properties. For the electrical conductivity three arguments are used: the poly-dispersion of the particles, the anisotropy of the composite and the particle connectivity. The first two also explain the low parameters of the Young’s modulus and do not contradict its discussion. The third one explains the low exponent by the fact that the conductive path is not 3D, but depends on the dose and can also be 2D or perhaps even 1D. This argument involves the conductivity mechanism which does not overlap with any of the Young’s modulus explanations that are rather based on the volume effects of the particles and not on their connectivity.
Regarding the exponents determined for the Young’s modulus, in addition to the first two explanations above, they are explained by the crossover region and the radiation induced chemical changes of the polymer structure. As mentioned earlier in this section the radiation-induced stiffening only indirectly influences the electrical properties by increasing the polymer density during the implantation and through that decreases the ion penetration depth. This has been used to explain the energy independent percolation threshold for each element. Consequently it is compatible with the discussion on the electrical conductivity. The argument based on the crossover region modifies only the Young’s modulus values above the percolation threshold. The values below the threshold stay almost unchanged. Applying the “crossover region”-term on the electrical measurements would leave the results for the gold samples unchanged but it would also increase the conductivity exponent for titanium composites and approach it to the 3D value of 2. Thus for both physical properties the argument of the crossover region can be used and yields sometimes to values proximal to the universal ones. However the problem defining the crossover region has been discussed and this rather new method has been not yet largely accepted in the scientific community. The suggested arguments proposed to explain the percolation parameters obtained for the Young’s modulus and the electrical conductivity measurements do not contradict each other and, when relevant, can be used for both.

143
Chapter 9
9. Application - Array of lenses with individually tunable focal-length based on transparent ion-implanted EAPs
The motivation of the work presented in this document is fabrication of electroactive polymer (EAP) – a material that responds mechanically to electrical stimulation and vice versa – a transducer, as described in chapter 1. The main goal in my project was to analyze, determine and model physical properties of such material, created by metal ion implantation (MII) of Polydimethylsiloxane (PDMS). Till this point of the document this all was presented. It is though essential for the author of this work, as well as for the reader, to return back to the motivation of this project and see a real practical example of EAP.
This chapter presents an application of the electroactive polymer fabricated by metal ion implantation of Polydimethylsiloxane with Filtered Cathode Vacuum Arc (FCVA) implanter: Array of lenses with individually tunable focal-length based on transparent ion-implanted EAPs. Here the fabrication and characterization of 2x2 arrays of mm-diameter PDMS lenses whose focal length can be electrically tuned will be shown. A chip-scale process to microfabricate lens arrays, consisting of a molded socket bonded to a Pyrex chip supporting 4 membrane actuators, will be presented.
The actuators were interconnected via an incompressible fluid. A 30 µm thick PDMS layer was bonded on a Pyrex chip with four through-holes, 1 to 3 mm in diameter. The PDMS layer was implanted on both sides with 5 keV gold ions to define the transparent electrodes for EAP actuation. Applying a voltage to one of the lens/actuators leads to an area expansion and hence to a change in radius of curvature, varying the focal length. The focal length was tuned from 4 mm at 0 V to 8 mm at 1.7 kV.
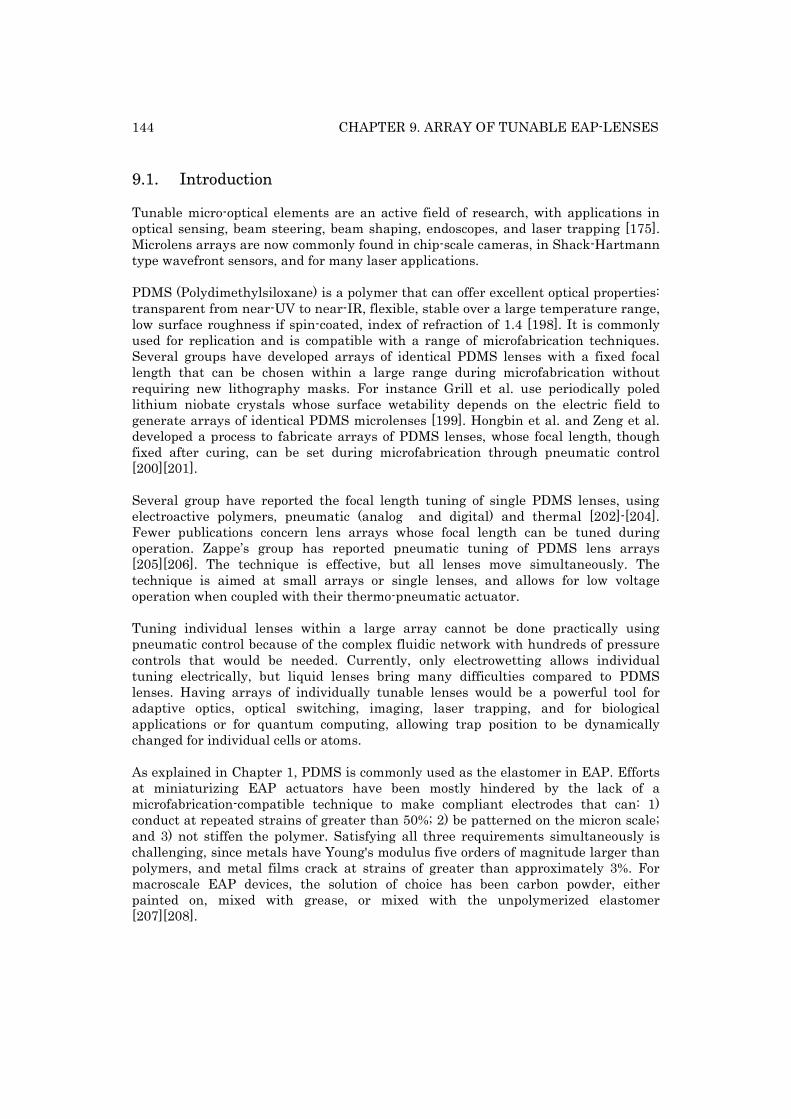
144 CHAPTER 9. ARRAY OF TUNABLE EAP-LENSES
9.1. Introduction
Tunable micro-optical elements are an active field of research, with applications in optical sensing, beam steering, beam shaping, endoscopes, and laser trapping [175]. Microlens arrays are now commonly found in chip-scale cameras, in Shack-Hartmann type wavefront sensors, and for many laser applications. PDMS (Polydimethylsiloxane) is a polymer that can offer excellent optical properties: transparent from near-UV to near-IR, flexible, stable over a large temperature range, low surface roughness if spin-coated, index of refraction of 1.4 [198]. It is commonly used for replication and is compatible with a range of microfabrication techniques. Several groups have developed arrays of identical PDMS lenses with a fixed focal length that can be chosen within a large range during microfabrication without requiring new lithography masks. For instance Grill et al. use periodically poled lithium niobate crystals whose surface wetability depends on the electric field to generate arrays of identical PDMS microlenses [199]. Hongbin et al. and Zeng et al. developed a process to fabricate arrays of PDMS lenses, whose focal length, though fixed after curing, can be set during microfabrication through pneumatic control [200][201]. Several group have reported the focal length tuning of single PDMS lenses, using electroactive polymers, pneumatic (analog and digital) and thermal [202]-[204]. Fewer publications concern lens arrays whose focal length can be tuned during operation. Zappe’s group has reported pneumatic tuning of PDMS lens arrays [205][206]. The technique is effective, but all lenses move simultaneously. The technique is aimed at small arrays or single lenses, and allows for low voltage operation when coupled with their thermo-pneumatic actuator. Tuning individual lenses within a large array cannot be done practically using pneumatic control because of the complex fluidic network with hundreds of pressure controls that would be needed. Currently, only electrowetting allows individual tuning electrically, but liquid lenses bring many difficulties compared to PDMS lenses. Having arrays of individually tunable lenses would be a powerful tool for adaptive optics, optical switching, imaging, laser trapping, and for biological applications or for quantum computing, allowing trap position to be dynamically changed for individual cells or atoms. As explained in Chapter 1, PDMS is commonly used as the elastomer in EAP. Efforts at miniaturizing EAP actuators have been mostly hindered by the lack of a microfabrication-compatible technique to make compliant electrodes that can: 1) conduct at repeated strains of greater than 50%; 2) be patterned on the micron scale; and 3) not stiffen the polymer. Satisfying all three requirements simultaneously is challenging, since metals have Young's modulus five orders of magnitude larger than polymers, and metal films crack at strains of greater than approximately 3%. For macroscale EAP devices, the solution of choice has been carbon powder, either painted on, mixed with grease, or mixed with the unpolymerized elastomer [207][208].
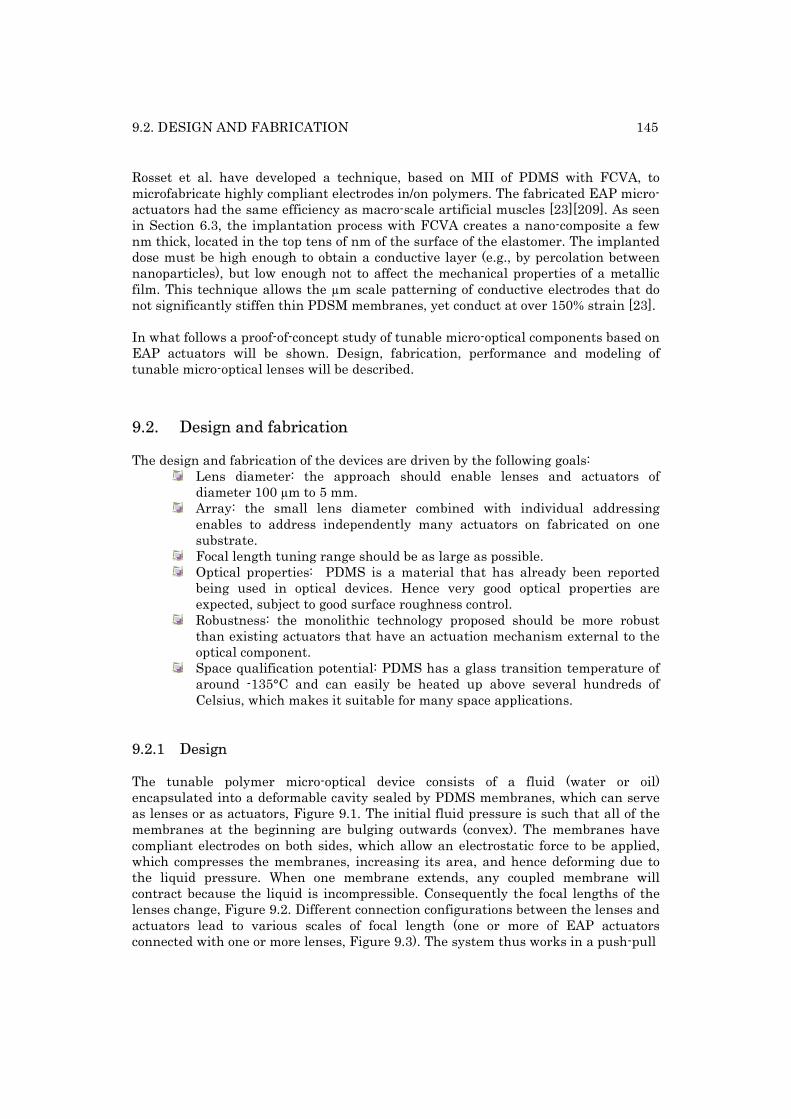
9.2. DESIGN AND FABRICATION 145
Rosset et al. have developed a technique, based on MII of PDMS with FCVA, to microfabricate highly compliant electrodes in/on polymers. The fabricated EAP micro-actuators had the same efficiency as macro-scale artificial muscles [23][209]. As seen in Section 6.3, the implantation process with FCVA creates a nano-composite a few nm thick, located in the top tens of nm of the surface of the elastomer. The implanted dose must be high enough to obtain a conductive layer (e.g., by percolation between nanoparticles), but low enough not to affect the mechanical properties of a metallic film. This technique allows the µm scale patterning of conductive electrodes that do not significantly stiffen thin PDSM membranes, yet conduct at over 150% strain [23]. In what follows a proof-of-concept study of tunable micro-optical components based on EAP actuators will be shown. Design, fabrication, performance and modeling of tunable micro-optical lenses will be described.
9.2. Design and fabrication
The design and fabrication of the devices are driven by the following goals: Lens diameter: the approach should enable lenses and actuators of
diameter 100 µm to 5 mm. Array: the small lens diameter combined with individual addressing
enables to address independently many actuators on fabricated on one substrate.
Focal length tuning range should be as large as possible. Optical properties: PDMS is a material that has already been reported
being used in optical devices. Hence very good optical properties are expected, subject to good surface roughness control.
Robustness: the monolithic technology proposed should be more robust than existing actuators that have an actuation mechanism external to the optical component.
Space qualification potential: PDMS has a glass transition temperature of around -135°C and can easily be heated up above several hundreds of Celsius, which makes it suitable for many space applications.
9.2.1 Design
The tunable polymer micro-optical device consists of a fluid (water or oil) encapsulated into a deformable cavity sealed by PDMS membranes, which can serve as lenses or as actuators, Figure 9.1. The initial fluid pressure is such that all of the membranes at the beginning are bulging outwards (convex). The membranes have compliant electrodes on both sides, which allow an electrostatic force to be applied, which compresses the membranes, increasing its area, and hence deforming due to the liquid pressure. When one membrane extends, any coupled membrane will contract because the liquid is incompressible. Consequently the focal lengths of the lenses change, Figure 9.2. Different connection configurations between the lenses and actuators lead to various scales of focal length (one or more of EAP actuators connected with one or more lenses, Figure 9.3). The system thus works in a push-pull
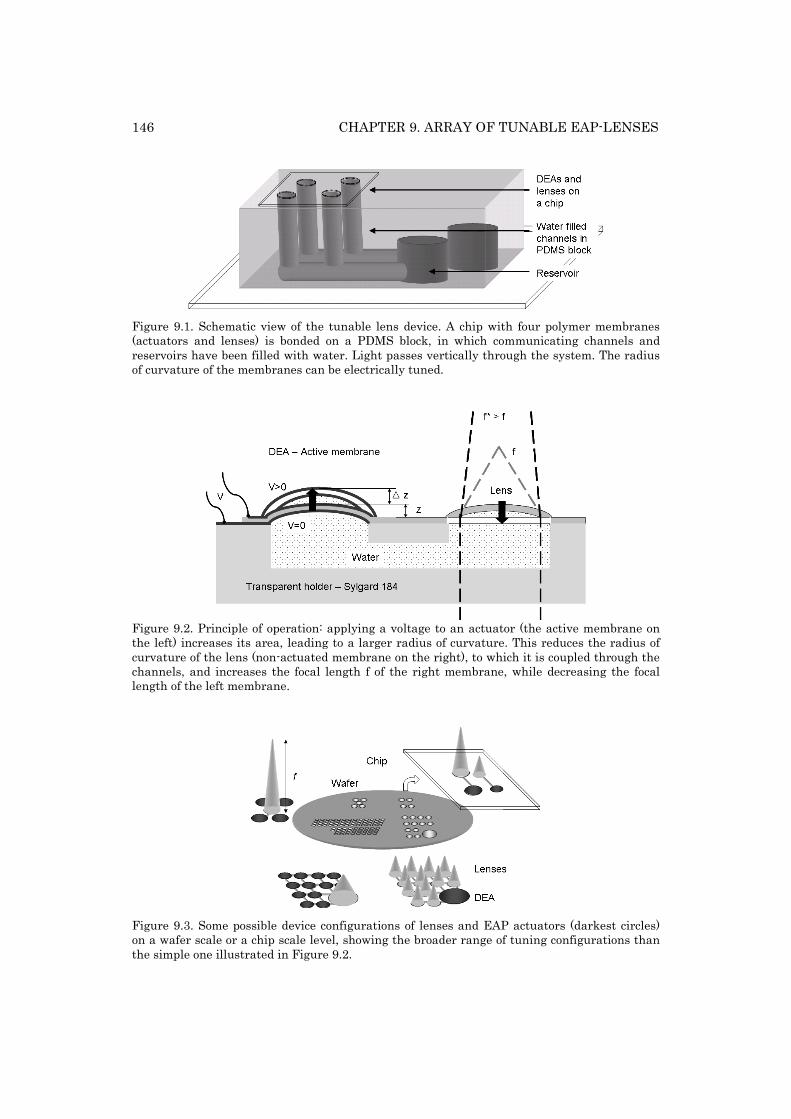
146 CHAPTER 9. ARRAY OF TUNABLE EAP-LENSES
Figure 9.1. Schematic view of the tunable lens device. A chip with four polymer membranes (actuators and lenses) is bonded on a PDMS block, in which communicating channels and reservoirs have been filled with water. Light passes vertically through the system. The radius of curvature of the membranes can be electrically tuned.
Figure 9.2. Principle of operation: applying a voltage to an actuator (the active membrane on the left) increases its area, leading to a larger radius of curvature. This reduces the radius of curvature of the lens (non-actuated membrane on the right), to which it is coupled through the channels, and increases the focal length f of the right membrane, while decreasing the focal length of the left membrane.
Figure 9.3. Some possible device configurations of lenses and EAP actuators (darkest circles) on a wafer scale or a chip scale level, showing the broader range of tuning configurations than the simple one illustrated in Figure 9.2.
9.2. DESIGN AND FABRICATION 147
configuration. For simplicity, I shall focus on a system, as in Figure 9.2, with one active device (EAP actuator) and one passive device (PDMS membrane, the “lens”). The tunable lens system consists of the two main parts:
Chip with PDMS actuators and lenses: consisting of a through-hole Pyrex chip (2x2 cm2) with a soft PDMS (Sylgard 186, Dow Corning) film (20-40 µm) on the top. There are compliant implanted electrodes on the top and bottom of the membrane, as well as wires for connections to power supplies.
Transparent holder: a 7.5 x 2.5 x 0.5 cm3 block molded from of a harder PDMS (Sylgard 184, Dow Corning) containing fluidic channels and reservoirs. The latter are needed in order to control the water pressure in the channels.
9.2.2 Fabrication
Since one of the key factors to obtain large displacements with micro-sized EAP actuators is to have compliant miniaturized electrodes, most of the fabrication methods for the macro-sized EAP actuators (conducting grease or powder) are not applicable. In order to have many independently-addressable actuators on the micron-scale the electrodes must be patternable, and the standard clean-room compatible electrode creation methods, such as metal evaporation, tend to greatly increase the actuator’s rigidity, which negatively affects its performance [14].
The low-energy FCVA ion-implantation of PDMS allows creating highly compliant electrodes. Rosset et al., have made mm-size diaphragm actuators with vertical displacement of more than 25 % of the membrane’s diameter, with response times less than 1 ms, and RC time constants much shorter than mechanical time constants, Figure 9.4 [16]. The fabrication procedure of free standing PDMS thin films on chip is explained in Section 5.2. The fabrication procedure of EAP actuators using ion-implanted PDMS films has been explained in details in [210]. In what follows a modified version of that procedure is presented.
First non-polymerized PDMS is spin-coated to 30 μm on a Polyimide sheet and heated at 100°C during 30 minutes to cure. Then implantation of gold electrodes at 5 keV with FCVA into the PDMS film and deposition of Au contacts (bottom electrodes) are performed (see Figure 9.5: 1 and 3). After the deposition of Au contacts on a 2x2 cm2 through-hole (∅ 1-3 mm) Pyrex chip, the two parts, Pyrex chip and PDMS film, are aligned and bonded together (see Figure 9.5: 2 and 4). Thus the holes of the Pyrex chip determine the diameter of the membranes, i.e. lenses and actuators. At the end implantation and deposition of gold contacts for the top electrodes are performed (see Figure 9.5: 4 and 5). The lenses can be made separately on another chip following the procedure described in Section 5.2, or by using a shadow mask if on the same chip as EAP actuators (to avoid implanting the lenses). In the first case lenses can be made with completely different properties than EAP actuators, which might be useful as it adds flexibility in the choice of films mechanical properties.
The transparent holder (5 x 2.5 x 0.5 cm3) is molded from a harder sort of PDMS (Sylgard 184) and contains different number of channels depending on the chosen
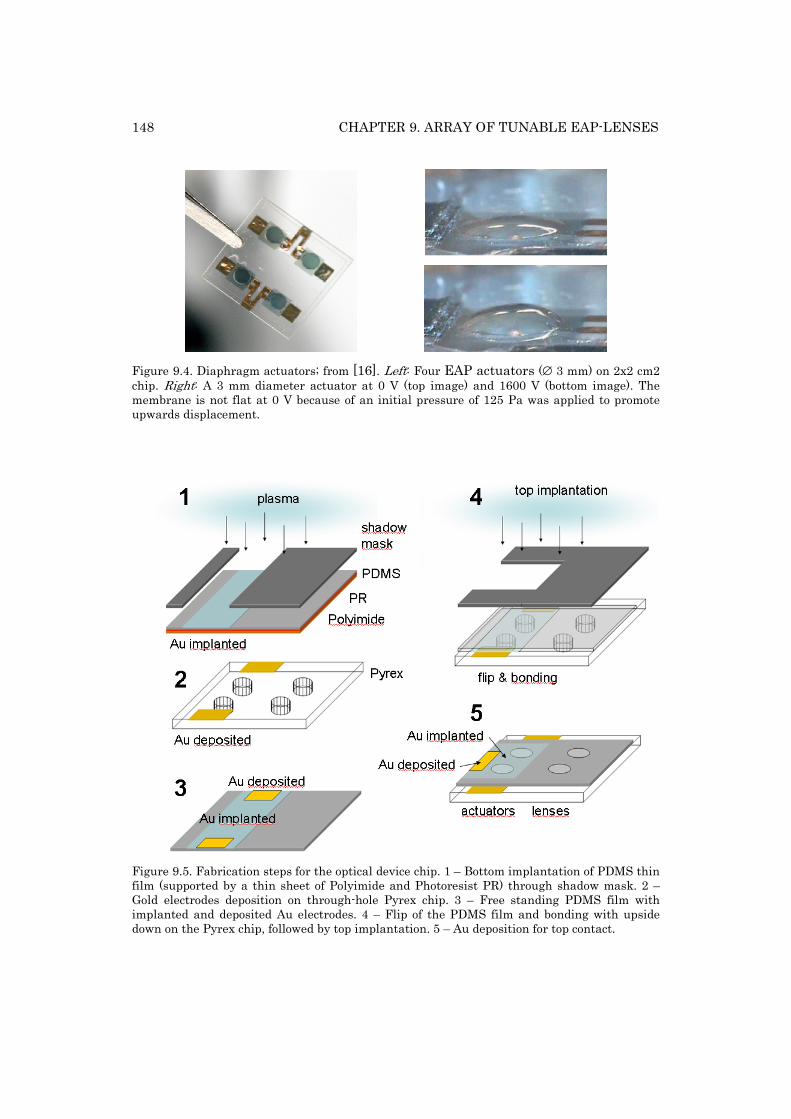
148 CHAPTER 9. ARRAY OF TUNABLE EAP-LENSES
Figure 9.4. Diaphragm actuators; from [16]. Left: Four EAP actuators (∅ 3 mm) on 2x2 cm2 chip. Right: A 3 mm diameter actuator at 0 V (top image) and 1600 V (bottom image). The membrane is not flat at 0 V because of an initial pressure of 125 Pa was applied to promote upwards displacement.
Figure 9.5. Fabrication steps for the optical device chip. 1 – Bottom implantation of PDMS thin film (supported by a thin sheet of Polyimide and Photoresist PR) through shadow mask. 2 – Gold electrodes deposition on through-hole Pyrex chip. 3 – Free standing PDMS film with implanted and deposited Au electrodes. 4 – Flip of the PDMS film and bonding with upside down on the Pyrex chip, followed by top implantation. 5 – Au deposition for top contact.
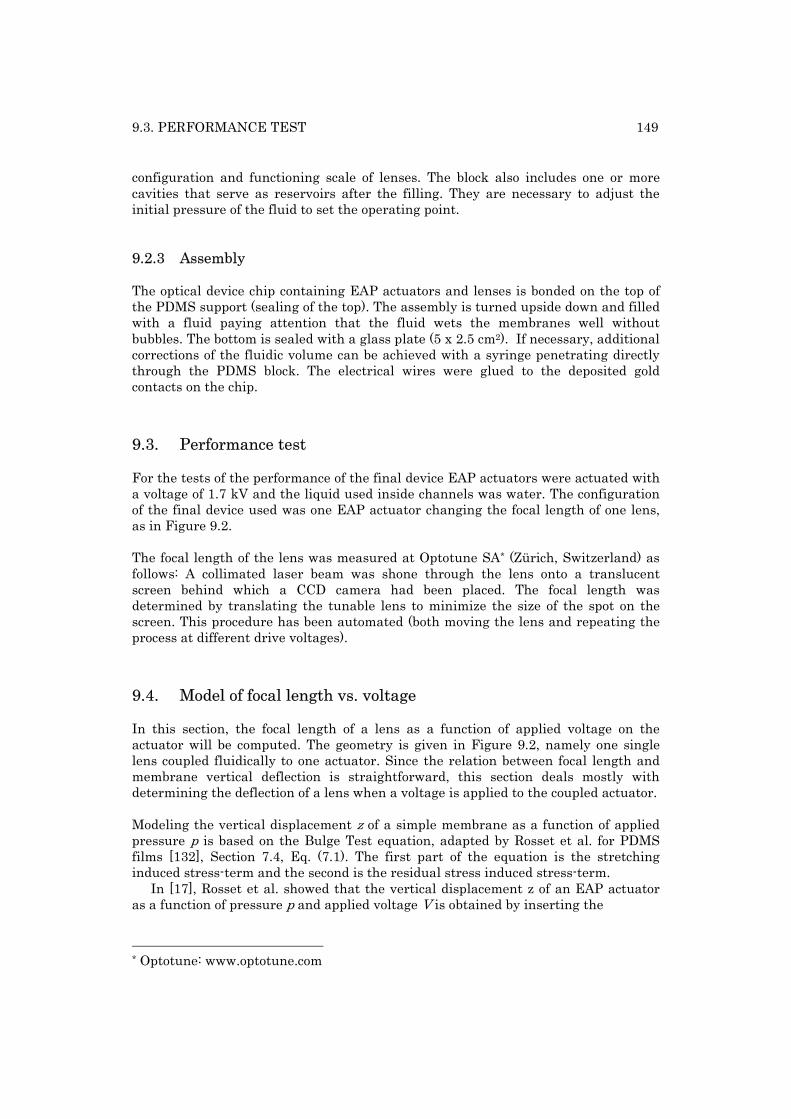
9.3. PERFORMANCE TEST 149
configuration and functioning scale of lenses. The block also includes one or more cavities that serve as reservoirs after the filling. They are necessary to adjust the initial pressure of the fluid to set the operating point.
9.2.3 Assembly
The optical device chip containing EAP actuators and lenses is bonded on the top of the PDMS support (sealing of the top). The assembly is turned upside down and filled with a fluid paying attention that the fluid wets the membranes well without bubbles. The bottom is sealed with a glass plate (5 x 2.5 cm2). If necessary, additional corrections of the fluidic volume can be achieved with a syringe penetrating directly through the PDMS block. The electrical wires were glued to the deposited gold contacts on the chip.
9.3. Performance test
For the tests of the performance of the final device EAP actuators were actuated with a voltage of 1.7 kV and the liquid used inside channels was water. The configuration of the final device used was one EAP actuator changing the focal length of one lens, as in Figure 9.2. The focal length of the lens was measured at Optotune SA* (Zürich, Switzerland) as follows: A collimated laser beam was shone through the lens onto a translucent screen behind which a CCD camera had been placed. The focal length was determined by translating the tunable lens to minimize the size of the spot on the screen. This procedure has been automated (both moving the lens and repeating the process at different drive voltages).
9.4. Model of focal length vs. voltage
In this section, the focal length of a lens as a function of applied voltage on the actuator will be computed. The geometry is given in Figure 9.2, namely one single lens coupled fluidically to one actuator. Since the relation between focal length and membrane vertical deflection is straightforward, this section deals mostly with determining the deflection of a lens when a voltage is applied to the coupled actuator. Modeling the vertical displacement z of a simple membrane as a function of applied pressure p is based on the Bulge Test equation, adapted by Rosset et al. for PDMS films [132], Section 7.4, Eq. (7.1). The first part of the equation is the stretching induced stress-term and the second is the residual stress induced stress-term.
In [17], Rosset et al. showed that the vertical displacement z of an EAP actuator as a function of pressure p and applied voltage V is obtained by inserting the
* Optotune: www.optotune.com
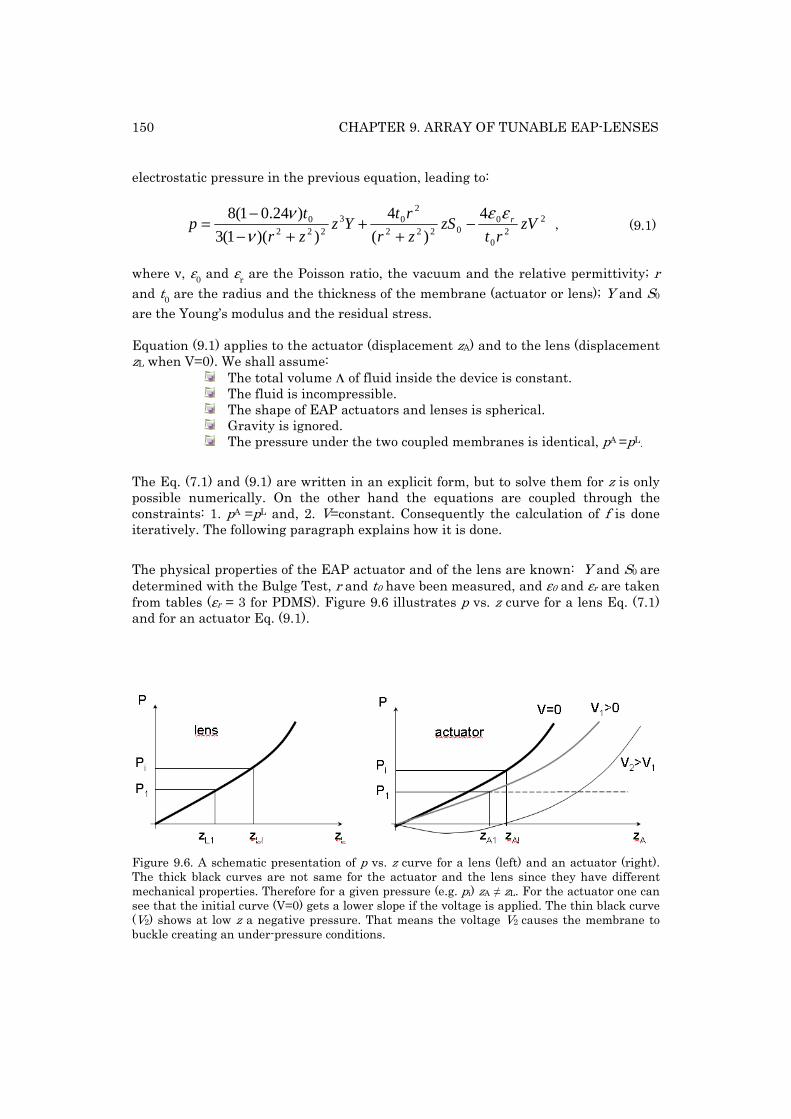
150 CHAPTER 9. ARRAY OF TUNABLE EAP-LENSES
electrostatic pressure in the previous equation, leading to:
22
0
00222
203
2220 4
)(
4
))(1(3
)24.01(8zV
rtzS
zr
rtYz
zr
tp rεε
νν
−+
++−
−= , (9.1)
where ν, ε0 and εr are the Poisson ratio, the vacuum and the relative permittivity; r and t0 are the radius and the thickness of the membrane (actuator or lens); Y and S0 are the Young’s modulus and the residual stress. Equation (9.1) applies to the actuator (displacement zA) and to the lens (displacement zL when V=0). We shall assume:
The total volume Λ of fluid inside the device is constant. The fluid is incompressible. The shape of EAP actuators and lenses is spherical. Gravity is ignored. The pressure under the two coupled membranes is identical, pA =pL.
The Eq. (7.1) and (9.1) are written in an explicit form, but to solve them for z is only possible numerically. On the other hand the equations are coupled through the constraints: 1. pA =pL and, 2. V=constant. Consequently the calculation of f is done iteratively. The following paragraph explains how it is done.
The physical properties of the EAP actuator and of the lens are known: Y and S0 are determined with the Bulge Test, r and t0 have been measured, and ε0 and εr are taken from tables (εr = 3 for PDMS). Figure 9.6 illustrates p vs. z curve for a lens Eq. (7.1) and for an actuator Eq. (9.1).
Figure 9.6. A schematic presentation of p vs. z curve for a lens (left) and an actuator (right). The thick black curves are not same for the actuator and the lens since they have different mechanical properties. Therefore for a given pressure (e.g. pi) zA ≠ zL. For the actuator one can see that the initial curve (V=0) gets a lower slope if the voltage is applied. The thin black curve (V2) shows at low z a negative pressure. That means the voltage V2 causes the membrane to buckle creating an under-pressure conditions.
9.4. MODEL OF FOCAL LENGTH VS. VOLTAGE 151
The procedure for the modeling of focal length will resume in changing the focal length f, that is directly related to the new zL, which will lead to a volume change dΛL. Since V=constant ⇒ dΛL= dΛA, the loss of volume below the lens results in a volume gain below the actuator and through that a new zA can be found. As the new pressure pL under the lens determined through Eq. (7.1) is equal to the new pressure pA under the actuator, the voltage applied on the actuator can be calculated with Eq. (9.1) and by that one obtains f =function(V). Starting with an actuator and a lens for which the physical properties are known, the initial water pressure pi is known and the initial vertical deflections of the lens (zLi) or of the actuator (zAi) can be determined by Eq. (7.1). If pi is not known the measurement of zLi or zAi inserted in Eq. (7.1) allow to determine it. Thus pi, zLi and zAi are given.
An unknown voltage is applied and one observes that zLi changes to zL1 and that pi through Eq. (7.1) becomes p1 (see Figure 9.8). The latter is the same for the lens as for the actuator. This change also induces a variation in the volume dΛL occupied by the lens. As mentioned above the volume Λ of the water is constant. Thus the loss of volume below the lens results in a volume gain below the actuator and through that a new zA1 can be found. A volume of a spherical con is given by
6
)( 22 πzrz +=Λ . (9.2)
Knowing that dΛL = dΛA = ΛLi - ΛL1 = ΛA1 - ΛLi, by replacing the volumes with Eq. (9.2) and by inserting zLi, zL1 and zAi into it one obtains:
3
222
3222
21
93
93 ππ
ππ A
A
AA
rAA
rAArz
++−−
++−⋅= , (9.3)
with A=ΛA1 + ΛLi - ΛL1 .
Finally inserting zA1 and p1 in Eq. (9.1) one obtains the voltage V1 that has been the cause of this change. To summarize: zA1 = function(zLi, zAi, zL1) = function(pi, zL1) and V = function (p1, zA1) = function(pi, zL1) ⇔ zL1 = function(pi, V) ⇒ f = function(zL1) = function(pi, V). Thus the focal length can be determined numerically and by iteration by only knowing the initial pressure and the voltage applied. Once zA1 is obtained (for a given V), zL1 can readily be determined. By numerically and iteratively applying this approach, the lens center height zL1 can be determined as a function of voltage.
The focal length f of a plano-convex spherical lens of radius r and thickness z is given by
)(2
)1(1
)1(1
22 zr
zn
Rn
f +−=−= , (9.4)
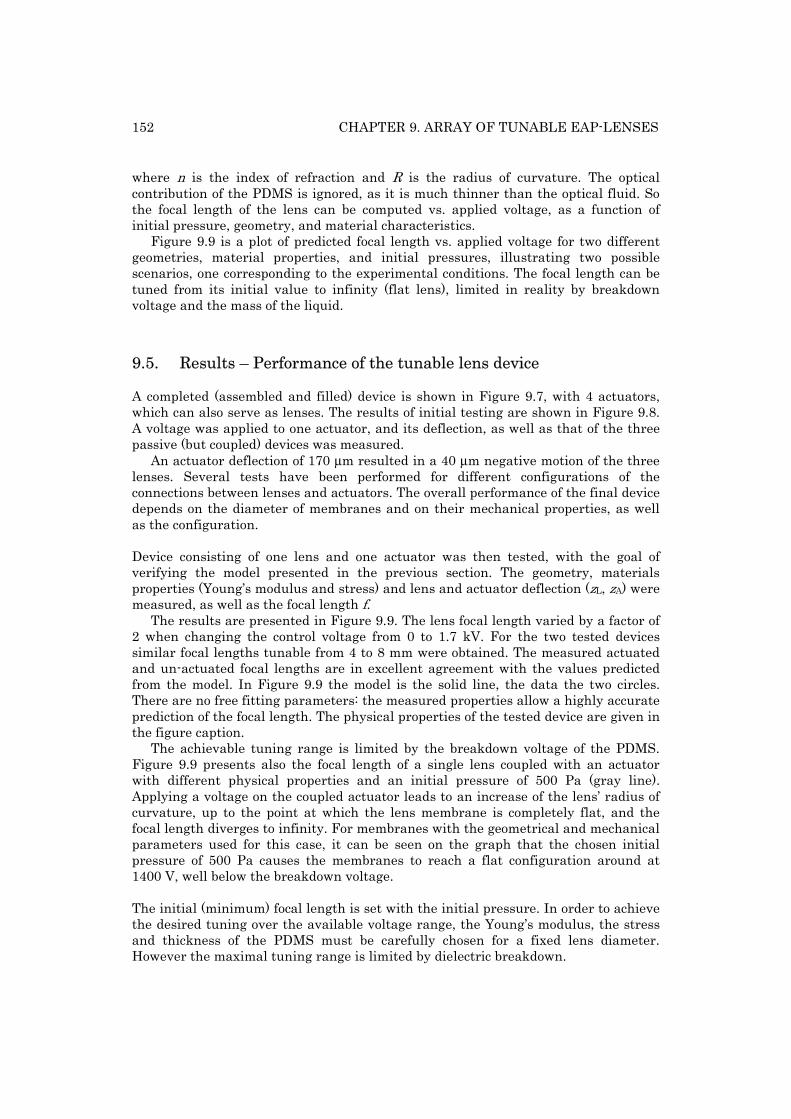
152 CHAPTER 9. ARRAY OF TUNABLE EAP-LENSES
where n is the index of refraction and R is the radius of curvature. The optical contribution of the PDMS is ignored, as it is much thinner than the optical fluid. So the focal length of the lens can be computed vs. applied voltage, as a function of initial pressure, geometry, and material characteristics.
Figure 9.9 is a plot of predicted focal length vs. applied voltage for two different geometries, material properties, and initial pressures, illustrating two possible scenarios, one corresponding to the experimental conditions. The focal length can be tuned from its initial value to infinity (flat lens), limited in reality by breakdown voltage and the mass of the liquid.
9.5. Results – Performance of the tunable lens device
A completed (assembled and filled) device is shown in Figure 9.7, with 4 actuators, which can also serve as lenses. The results of initial testing are shown in Figure 9.8. A voltage was applied to one actuator, and its deflection, as well as that of the three passive (but coupled) devices was measured.
An actuator deflection of 170 μm resulted in a 40 μm negative motion of the three lenses. Several tests have been performed for different configurations of the connections between lenses and actuators. The overall performance of the final device depends on the diameter of membranes and on their mechanical properties, as well as the configuration. Device consisting of one lens and one actuator was then tested, with the goal of verifying the model presented in the previous section. The geometry, materials properties (Young’s modulus and stress) and lens and actuator deflection (zL, zA) were measured, as well as the focal length f.
The results are presented in Figure 9.9. The lens focal length varied by a factor of 2 when changing the control voltage from 0 to 1.7 kV. For the two tested devices similar focal lengths tunable from 4 to 8 mm were obtained. The measured actuated and un-actuated focal lengths are in excellent agreement with the values predicted from the model. In Figure 9.9 the model is the solid line, the data the two circles. There are no free fitting parameters: the measured properties allow a highly accurate prediction of the focal length. The physical properties of the tested device are given in the figure caption.
The achievable tuning range is limited by the breakdown voltage of the PDMS. Figure 9.9 presents also the focal length of a single lens coupled with an actuator with different physical properties and an initial pressure of 500 Pa (gray line). Applying a voltage on the coupled actuator leads to an increase of the lens’ radius of curvature, up to the point at which the lens membrane is completely flat, and the focal length diverges to infinity. For membranes with the geometrical and mechanical parameters used for this case, it can be seen on the graph that the chosen initial pressure of 500 Pa causes the membranes to reach a flat configuration around at 1400 V, well below the breakdown voltage. The initial (minimum) focal length is set with the initial pressure. In order to achieve the desired tuning over the available voltage range, the Young’s modulus, the stress and thickness of the PDMS must be carefully chosen for a fixed lens diameter. However the maximal tuning range is limited by dielectric breakdown.
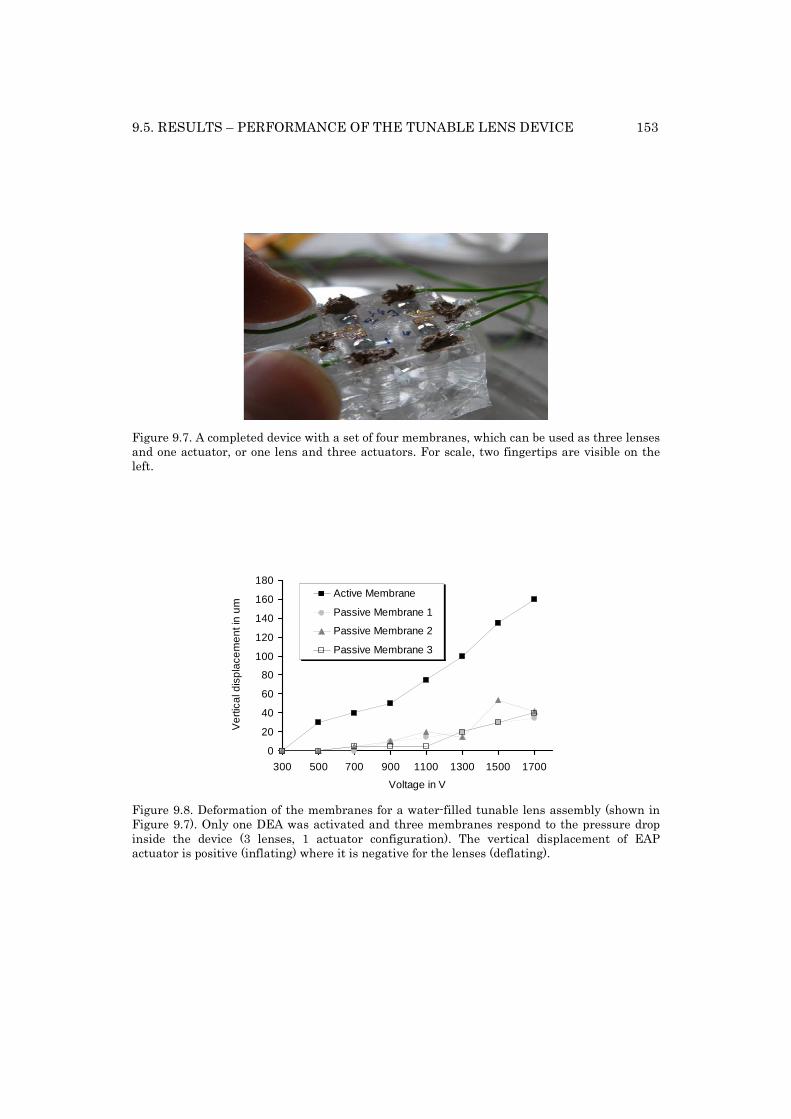
9.5. RESULTS – PERFORMANCE OF THE TUNABLE LENS DEVICE 153
Figure 9.7. A completed device with a set of four membranes, which can be used as three lenses and one actuator, or one lens and three actuators. For scale, two fingertips are visible on the left.
0
20
40
60
80
100
120
140
160
180
300 500 700 900 1100 1300 1500 1700
Voltage in V
Ve
rtica
l dis
pla
cem
ent
in u
m
Active Membrane
Passive Membrane 1
Passive Membrane 2
Passive Membrane 3
Figure 9.8. Deformation of the membranes for a water-filled tunable lens assembly (shown in Figure 9.7). Only one DEA was activated and three membranes respond to the pressure drop inside the device (3 lenses, 1 actuator configuration). The vertical displacement of EAP actuator is positive (inflating) where it is negative for the lenses (deflating).
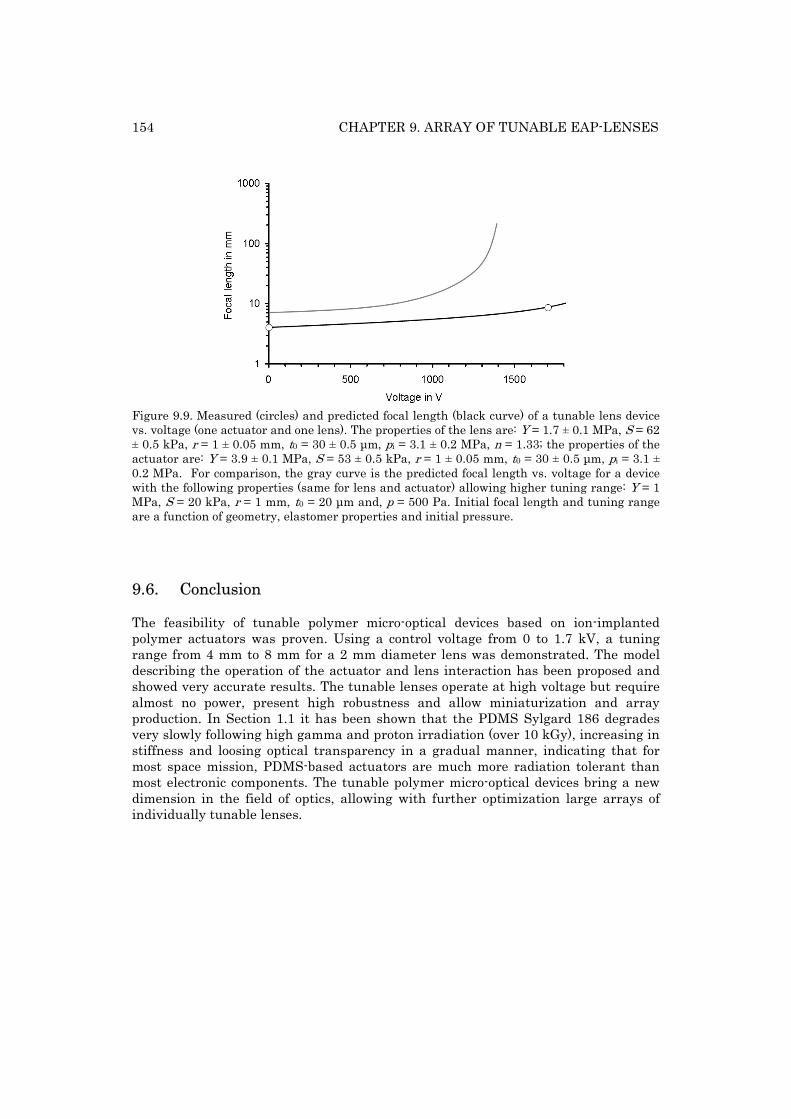
154 CHAPTER 9. ARRAY OF TUNABLE EAP-LENSES
Figure 9.9. Measured (circles) and predicted focal length (black curve) of a tunable lens device vs. voltage (one actuator and one lens). The properties of the lens are: Y = 1.7 ± 0.1 MPa, S = 62 ± 0.5 kPa, r = 1 ± 0.05 mm, t0 = 30 ± 0.5 μm, pi = 3.1 ± 0.2 MPa, n = 1.33; the properties of the actuator are: Y = 3.9 ± 0.1 MPa, S = 53 ± 0.5 kPa, r = 1 ± 0.05 mm, t0 = 30 ± 0.5 μm, pi = 3.1 ± 0.2 MPa. For comparison, the gray curve is the predicted focal length vs. voltage for a device with the following properties (same for lens and actuator) allowing higher tuning range: Y = 1 MPa, S = 20 kPa, r = 1 mm, t0 = 20 μm and, p = 500 Pa. Initial focal length and tuning range are a function of geometry, elastomer properties and initial pressure.
9.6. Conclusion
The feasibility of tunable polymer micro-optical devices based on ion-implanted polymer actuators was proven. Using a control voltage from 0 to 1.7 kV, a tuning range from 4 mm to 8 mm for a 2 mm diameter lens was demonstrated. The model describing the operation of the actuator and lens interaction has been proposed and showed very accurate results. The tunable lenses operate at high voltage but require almost no power, present high robustness and allow miniaturization and array production. In Section 1.1 it has been shown that the PDMS Sylgard 186 degrades very slowly following high gamma and proton irradiation (over 10 kGy), increasing in stiffness and loosing optical transparency in a gradual manner, indicating that for most space mission, PDMS-based actuators are much more radiation tolerant than most electronic components. The tunable polymer micro-optical devices bring a new dimension in the field of optics, allowing with further optimization large arrays of individually tunable lenses.
155
10. Conclusions
Technological Motivation Stretchable electrodes are a topic of very active research, as they are needed for rollable and foldable electronics and displays, polymer actuators, humanoid robotics, and as compliant electrodes for biology. In LMTS, low-energy ion-implantation was shown to be a powerful technique that can be used to fabricate stretchable electrodes on elastomers, and that these electrodes are capable of sustaining uniaxial strains of up to 175% while remaining conductive, and remaining operational after 105 cycles at 30% strain.
The motivation for this thesis was to develop an understanding of why FCVA-implanted electrodes display such impressive properties. What is the microstructure, and what is the link between this microstructure and the macroscopic properties? Answering these questions is both of fundamental importance, and of technological importance, as a deep understanding of the effect of metal ion-implantation on conductivity and stiffness of the metal-polymer composite will allow improved tailoring of the properties of this nanocomposite. Objectives This thesis had three main objectives:
i. Characterization of electrical and mechanical properties of the “Metal-Ion Implanted Polydimethylsiloxane” composite.
ii. Microstructural analysis of the nanocomposite, by TEM, AFM & XPS. iii. Developing a model to link the macroscopic electrical and mechanical
properties to the nm-scale microstructural information. The Major Achievements of the Thesis The main novel contributions of this thesis are:
Comparison of the two ion implantation techniques (LEI and FCVA) used for the implantation of PDMS at 10 keV and 35 keV with gold and
156 CONCLUSIONS
titanium ions, with respect to the electrical and mechanical properties of the composite. - To produce compliant electrodes, FCVA was fond to be much better suited for the low energy metal ion implantation of PDMS than LEI, principally because of the better physical properties and short implantation time.
Comparison of the dose- and the energy- dependence of the FCVA
implantation of PDMS for gold and titanium ions, with respect to the electrical and mechanical properties of the composite. - Gold implantation of PDMS with FCVA at the energy of 2.5 keV and the dose of 1.5x10¹⁶ at/cm2 showed in the same time the highest conductivity and the lowest impact on the Young’s modulus of the composite. This is related to the very different microstructure obtained under the different conditions.
New TEM lamella preparation method adapted for extremely low Young’s
modulus (1 MPa) composites with hard inclusions. - Cryo-Ultra-Microtomy was adapted and used for the preparation of the implanted PDMS samples allowing TEM analysis of the morphology (images with nm resolution, electron diffraction patterns) and of the surface state (images and by observation during cutting) to by performed.
Microstructural analysis of the FCVA produced nanocomposite. - XPS measurements revealed modifications of the chemical structure of PDMS caused by metal ion implantation resulting, together with the implanted ions, in an important surface roughness increase measured by AFM. - TEM images showed that gold implantation leads to Gold-PDMS composite with crystalline gold clusters of tens of nanometers in diameter, and that titanium implantation creates amorphous and brittle Titanium-PDMS layer.
Comparison of the experimental and simulation (TRIM) penetration
depths for the gold and titanium ion implantation at 2.5 keV, 5 keV and 10 keV. - TEM images permitted to determine the penetration depths of the ions and hence the thickness of the created composites. With this information the volume fraction of metal particles could be determined and models describing the physical properties of composites could be applied.
Modeling of the electrical properties of a nano-composite using the
percolation theory for gold and titanium ions. - The percolation theory described very accurately the electrical conductivity of the composite. The percolation parameters were in agreement with results obtained for other nano-systems such as carbon powders composites, and provide insight into conduction mechanisms.
157
Modeling of the mechanical properties of a nano-composite using the percolation theory for gold and titanium ions. - Percolation theory was used together with the laminar theory to determine the Young’s modulus of the composite and of the components (PDMS and gold clusters). The results match well the expectations and findings from literature.
Comparison of the electrical and the mechanical properties on a same
nano-composite using the percolation theory for gold and titanium ions, with respect to the energy. - For the first time the percolation theory was applied to model both the electrical and mechanical properties of the same nanocomposite. The arguments used to explain different results on both properties were discussed and are congruent.
Experimental realization of array of lenses with individually tunable
focal-length based on transparent ion-implanted EAPs, and the development of an accurate performance model. - Using a control voltage from 0 to 1.7 kV, a tuning range from 4 mm to 8 mm for a 2 mm diameter lens was demonstrated and perfectly described with a developed model.
Characterization of Electrical and Mechanical Properties of the Composite PDMS thin films (30 μm thick) were implanted with gold and titanium ions by employing two different implantation instruments. For the ion energies of 10 keV and 35 keV Low Energy Broad Beam Implanter (LEI) was used. It produces a continuous low current ion beam with constant energy leading to long implantation times. For the energies of 2.5 keV, 5 keV and 10 keV Filtered Cathode Vacuum Arc (FCVA) was used. It is characterized by high current ion plasma, time dependent implantation energy and it works in pulsed manner. The implanted elements for both, FCVA and LEI, were Titanium and Gold. Doses ranged from 0.1x10¹⁶ at/cm2 to 7x10¹⁶ at/cm2.
The electrical and mechanical results showed that for the fabrication of the EAP LEI is much less suited than FCVA. First, due to the low ion current the implantation took 10 times longer for LEI than for FCVA. Second, at 35 keV and 10 keV it was shown that LEI implantation of Gold produced sputtering of the implanted layer. As result only limited ion concentrations inside of PDMS could be achieved and the electrical conductivity could not be measured on these samples. The titanium implanted samples presented enormous increase of stiffness. The initial value of the Young’s modulus increased during the titanium implantation from 0.85 MPa to 64 MPa at 10 keV, respectively to 173 MPa at 35 keV, which caused important cracking of the polymer surface. Because the LEI implantation could not deliver appropriate electrical and mechanical properties for any of the elements, the rest of the study was concentrated only on the FCVA implantations.
158 CONCLUSIONS
FCVA implantation led to surface resistivities between 100 Ω/square and 100 MΩ/square. The lower was the implantation energy and the higher was the ion doses, the higher conductivities were obtained. However doses above the percolation threshold also led to an important increase of stiffness. The highest and the lowest Young’s modules were obtained for the gold implantations – 5.5 MPa and 1.2 MPa for the implantations at 10 keV and 2.5 keV. Thus the best conductivity-to-compliance-ratio is obtained with FCVA implantation with Gold at 2.5 keV and doses around 1.5x10¹⁶ at/cm2. Microstructural Analysis of the Composite Three analysis methods were applied to determine the effects of the implantation parameters on the composite structure: XPS, AFM and TEM.
XPS measurements of the LEI implanted titanium samples at 10 keV revealed radiation induced chemical modifications of the implanted layer. While Si concentration could be directly related to that of Ti (supported with the TRIDYN simulation showing that Ti replaces Si), the increase of O concentration is due to the oxidation of Ti as well as a direct uptake by PDMS radicals such as SiO2. O and C curves are results of different physico-chemical interdependent reactions.
AFM height measurements showed important increase of the surface roughness increasing with the energy, and dependant on the dose as well as on the element. The initial surface roughness of 2 nm reached the highest values for LEI implantations (700 nm for Ti at 35 keV and 70 nm for Au at 35 keV) and the lowest for FCVA (30 nm for Ti at 2.5 keV and 15 nm for Au at 2.5 keV). Phase measurements revealed existence of small clusters for the gold implantation with FCVA. The size of the clusters was determined for three different doses and energies. It varies between 10 and 30 nm and corresponds to those obtained through TEM analysis. AFM measurements also allowed extraction of the biaxial Young’s modulus of the implanted layer (composite) which showed to be the same as the one determined through TEM analysis.
Based on cryo-ultramicrotomy, a new TEM sample preparation method was developed that is particularly adapted for extremely low modulus (1 MPa) elastomers with very hard inclusions. It allowed high-resolution TEM cross-section images for microstructural analysis of the implanted layers. For the gold implantations, the images showed Gold-PDMS composites, 30 nm thick, with crystalline gold nanoparticles whose size increases with the dose and the energy. For titanium implantations, an 18 nm thick, nearly homogeneous, amorphous and brittle composite was observed. The penetration depths showed to be in agreement with the TRIM simulations if taking account a small shift of the results explained by the functioning of the simulation program as well as of the implantation instrument.
159
Modeling of the Electrical and Mechanical Properties The TEM images allowed accurate determination of the metal volume fraction of the composite for low-energy implanted samples. The percolation theory was applied relating both the conductivity and the Young’s modulus measurements to the volume fraction. Modeling of Conductivity While the conductivity results as a function of the dose do not allow any distinctions to be made based on the different implantation conditions, the presentation of the same data but as a function of the volume fraction clearly separates titanium from the gold samples. Lowest measurable values for the conductivity, about 1.3x10⁻⁵ (kΩ/square)-1, were measured at the percolation threshold. After this domain the conductivity steeply increases and saturates at around 1 (kΩ/square)-1. The electrical conductivity vs. volume fraction curves are well fitted by percolation theory for both metals and all three ion energies, with nearly identical percolation thresholds and exponents. The gold samples possess a lower percolation threshold (0.07) than titanium samples (0.12), which is due to narrower ion distributions of the gold ions. However within the group of each element no distinctions could be made as a function of energy. All percolation threshold values were lower than 0.16 (obtained for a system of touching impenetrable spheres), but in line with what is reported for carbon-powder based composites.
Transforming the surface resistivity into the volume resistivity both of the components presented higher values than those tabled for the bulk: 750 nΩm instead of 22 nΩm for Gold, and 1625 nΩm instead of 420 nΩm for Titanium. This indicates that the conduction mechanism in the composite is strongly influenced by the microstructure, i.e., resistance between nanoparticles as well as the conductivity of such small particles that can be much less than for bulk. Further detailed analysis the voltage, frequency, magnetic field and temperature dependence of current would be needed to clearly distinguish resistivity of nm-size particles from the inter-particle resistance.
The conduction mechanisms are also one of the main reasons of the observed non-universality of the percolation exponent in the literature as well as in here presented results. The mean value of the exponent found over the three implantation energies was for Gold 1 and for Titanium 1.4, compared to the universal value of 2 obtained for discrete lattice percolation systems. This is in accordance with the literature showing that in continuous percolation systems where the electrical current flows through random resistor networks (Ohmic conductivity) the value is expected to be lower than 2, where else in the case of other conductive mechanisms, e.g. hopping or tunneling, the percolation exponent is greater than 2.
160 CONCLUSIONS
Modeling of Mechanical Properties The Young’s modulus vs. volume fraction curves were also well fitted by percolation theory for both metals and all the three ion energies. Unlike the conductivity data, the Young’s modulus data could be fitted both above and below the percolation threshold. For the first time the laminar theory was applied to separate the properties of the approximately 50 nm thick composite (implanted layer) from those of the 30 µm thick PDMS membrane. The extracted Young’s modulus showed the same values as those found by surface roughness technique (e.g. 617 MPa and 587 MPa for gold composite created at 2.5 keV, or 3528 MPa and 3759 MPa for titanium composite created at 10 keV).
The percolation threshold for gold and titanium composites decreases with the energy: for gold samples the highest and the lowest value is 0.13 and 0.05 found at 2.5 keV and 10 keV; respectively 0.27 and 0.08 for titanium samples. The explanation is based on the size of the gold clusters, or of the titanium aggregates, as well as on the irradiation induced chemical modifications of the PDMS molecular structure (e.g. stiffness or density), both increasing with the energy. Thus higher energy induces faster increase of the Young’s modulus, which results in the lower percolation threshold.
For the first time percolation theory was used to determine the Young’s modulus of the components of the composite, i.e. the Young’s modulus of PDMS and of gold clusters. Starting with the PDMS initial value of 0.85 MPa the elastic constant increased after the implantation to 2 MPa, which is very reasonable value explained by the radiation effects on the polymer structure. Also the Young’s modules of gold clusters (10 GPa) are in agreement with those found in literature for gold clusters that were preformed in the gas phase and deposited on atomically flat substrates. These results are really nice since to get the Young’s modulus of the components, first the laminar theory was used to extract the Young’s modulus of the composite, and then the percolation theory was used to determine the Young’s modulus of the components of the composite.
Percolation exponents for the mechanical properties were determined. While below the percolation threshold the values were in agreement with the universal value of 0.73 (obtained for lattice percolations or for a system of touching impenetrable spheres), above percolation threshold the fitted exponents were far lower than the “universal” 3D value of 3.75, between 0.1 and 0.2. The reason for these results are the increase of the Young’s modulus due to the irradiation induced chemical changes, particularly important at high volume fractions; and the validity domain of the percolation theory (the crossover region), which according to some publications is limited only in the very next surroundings of the percolation threshold and which, if applied on the data, would only influence and increase the exponent above the percolation threshold (e.g. the new value calculated for the titanium samples implanted at 2.5 keV with crossover region was 3 instead of 0.2). Since for the first time the electrical and the mechanical properties were measured and modeled with percolation theory on the same samples, the percolation parameters were compared and discussed. Special attention was given to the critical explanations describing the different percolation parameters obtained for the two properties and ensuring coherence of the explanations for both conductivity and Young’s modulus. For instance the reason for the different behaviour of the
161
percolation threshold is based on the influences of physico-mechanical (e.g. particle’s volume and connectivity) and chemical (e.g. density) changes, as well as the influences of the intrinsic element properties (e.g. bulk conductivity and oxidation) and composite structure (e.g. clusters) on the Young’s modulus and electrical conductivity. While the elasticity constant is directly related to the material structure, e.g. particles formation in a form of clusters (Gold) or amorphous aggregates (Titanium), that depend on the energy, the electrical conductivity depends on the connectivity of the particles and on the conduction mechanism, which do not directly depend on the energy. The influence of the particles on the mechanical properties starts already in a continuous manner with already the first implanted ion. However the electrical properties change only after a certain ion concentration has been exceeded in the case of titanium doping, or after a certain particle size, has been reached in the case of the gold clusters.
The discussion concluded that the suggested arguments proposed to explain the percolation parameters obtained for the Young’s modulus and the electrical conductivity measurements do not contradict each other and, when relevant, can be used for both. Using the Implanted Electrodes to make Arrays of Electrically Tunable Lenses FCVA implantation at 5 keV was employed to create EAPs based on Gold-PDMS composite. They were used to fabricate small arrays of 1 to 3 mm diameter tunable lenses, consisting of EAP actuators bonded to a socket that provides fluidic coupling between devices. The focal length was electrically tuned from 4 mm to 8 mm by applying a voltage from 0 kV to 1.7 kV. These results are very promising and they bring a new dimension in the field of optics, allowing with further optimization large arrays of individually tunable lenses. Also high gamma and proton irradiation (over 10 kGy) of PDMS showed very limited influence on its physical properties (breakdown voltage, stiffness and optical transparency), indicating that for most space missions, PDMS-based actuators are much more radiation tolerant than most electronic components, which opens a free path for the EAPs in this domain. Conclusions and Outlook This work is a study of the fabrication and of properties of stretchable electrodes, consisting of a metal-elastomer nanocomposite created by metal ion implantation (MII) of Polydimethylsiloxane (PDMS). It describes the characterization and modeling of the two main physical properties of these electrodes that are relevant for the performance of the polymer actuators made using these electrodes: the electrode’s Young’s modulus and the electrical conductivity. This work allows understanding the phenomena occurring during the fabrication of the EAP and related to their mechanical and electrical responses. It is not just an
162 CONCLUSIONS
insight in the fabrication technique of the EAP created by MII of PDMS, but this work is one of the foundations of this technology. It provides answers to the questions: Why is FCVA the best implantation technology for this application? What are the best implantation conditions and which structural and physical properties of EAP one can expect to obtain if using them? It relates the electrical and mechanical properties to the implantation parameters such as the energy or the dose, as well as to the two sorts of implanted ions, Gold and Titanium.
In addition to these fundamental results, four new technical methods were developed and directly usable by other researchers in this or other related fields: 1. Preparation method for TEM analysis allowing to cut very soft composites with hard incorporated particles; 2. Exact determination of the Young’s modulus of the nano composite, by using simultaneously the Voigt model (the Laminar theory) and the Bowden model (based on the surface roughness); 3. The Young’s modulus determination of the components of the composite by using the percolation and the laminar theory together; 4. Methodology for designing and fabricating mm-sized tunable optical lenses whose focal length varies from 4 mm to 8 mm by applying a voltage from 0 kV to 1.7 kV.
A lot of work performed during this thesis was not included in this document for reasons of time, place and direct relevance to the central theme. To list a few: 1. Participation in the construction of lab’s FCVA; 2. Tests of MII of PDMS with other elements such as Aluminum, Palladium and Copper; 3. Applications of EAP to other fields such as microfluidics (electrodes for 3D dielectrophoresis, with the lab of Prof. Psaltis, EPFL) or biology (flexible micro-electrodes for sensing of nerve cells, with the lab of Prof. Vörös at the ETHZ). All these points require continued research on the MII of PDMS, e.g. better control of the FCVA implantations, improvement of physical properties by using other elements or even alloys, or size decrease of the patterned electrodes.
The work reported in this thesis will lead to much improved stretchable electrodes. Next steps to continue this research are:
- improve the understanding of the non-universality of the percolation parameters (by determination of the conductivity mechanisms);
- improve the performances of the tunable optical lenses (make arrays and decrease their diameter, lifetime, stability);
- reduce the actuation voltage of the EAP actuators (by increasing the dielectric constant of PDMS or by making multiplayer stacks);
- testing of the response time of the EAP made by MII (related to the dielectric relaxation phenomena);
- introduction of metal-polymers composites created by MII in other fields of science, research or technology by searching for the applications in actuation, sensing, microfluidics, optics, MEMS technology …
… and in all the other domains for which this work may be useful.
163
11. Publications
Published M. Niklaus, S. Rosset, M. Dadras, P. Dubois, and H. Shea, “Microstructure of 5kev gold-implanted polydimethylsiloxane”, Scripta Mater. 59, 893-896 (2008). S. Rosset, M. Niklaus, P. Dubois, and H. Shea, “Metal ion implantation for the Fabrication of Stretchable Electrodes on Elastomers”, Adv. Funct. Mater. 19, 470-478 (2008). S. Rosset, M. Niklaus, P. Dubois, and H. R. Shea, “Mechanical characterization of a dielectric elastomer microactuator with ion-implanted electrodes”, Sensors and Actuators A: Physical 144(1), 185-193 (2008). P. Dubois, S. Rosset, M. Niklaus, M. Dadras, and H. Shea, “Metal Ion Implanted Compliant Electrodes in Dielectric Electroactive Polymer (EAP) Membranes”, Advances in Science and Technology 61, 18-25 (2008). P. Dubois, S. Rosset, M. Niklaus, M. Dadras, and H. Shea “Voltage control of the resonance frequency of dielectric electroactive polymer (DEAP) membranes”, J. of Microelectromech. Syst., 17, 1072-1081 (2008). S. Rosset, M. Niklaus, P. Dubois, and H. Shea, “Large-stroke dielectric elastomer actuators with ion-implanted electrodes”, J. of Microelectromech. Syst. 18, 1300-1308 (2009). J. W. Choi, S. Rosset, M. Niklaus, J. Adleman, H. Shea, and D. Psaltis, “3-dimensional electrode patterning within a microfluidic channel using metal ion implantation”, Lab on a Chip 10, 783-788 (2010). Conference proceedings S. Rosset, M. Niklaus, M. Dadras, P. Dubois, and H. Shea, “Mechanical properties of electroactive polymer microactuators with ion-implanted electrodes”, in: Proceedings of Electroactive Polymer Actuators and Devices (SPIE 2007), San Diego, CA, p.652410-11, (March 2007). M. Niklaus, S. Rosset, M. Dadras, P. Dubois, and H. Shea, “Modification of conductivity and of mechanical properties of electroactive polymer (EAP) thin films by titanium ion implantation”, in: Proceedings of Material Research Society (MRS 2008), Boston, MA, p. 1052-DD03-10, (November 2008).
164 PUBLICATIONS
S. Rosset, M. Niklaus, P. Dubois, and H. Shea, “Ion-implanted compliant and patternable electrodes for miniaturized dielectric elastomer actuators”, in: Proceedings of Electroactive Polymer Actuators and Devices (SPIE 2007), San Diego, CA, p.652410-11, (March 2008). S. Rosset, M. Niklaus, P. Dubois, and H. Shea, "Performance characterization of miniaturized dielectric elastomer actuators fabricated using metal ion implantation", in: Proceedings of IEEE 21st conference on MEMS, Tucson, AZ, (January 2008). M. Niklaus, S. Rosset, P. Dubois, and H. Shea, “Comparison of two Metal Ion Implantation Techniques for Fabrication of Gold and Titanium Based Compliant Electrodes on Polydimethylsiloxane”, in: Proceedings of Material Research Society (MRS 2009), San Francisco, CA, 1188 (April 2009). M. Niklaus, S. Rosset, P. Dubois, and H. Shea, “Ion-implanted compliant electrodes used in dielectric electroactive polymer actuators with large displacement”, in: Proceedings of the Eurosensors XXIII, Lausanne, Switzerland (September 2009). S. Rosset, M. Niklaus, P. Dubois, and H. Shea, “Large stroke miniaturized dielectric elastomer actuators”, in: Proceedings of Transducers conference, Denver, CO, (June 2009). S. Rosset, M. Niklaus, P. Dubois, and H. Shea, “Ion-implanted compliant electrodes for mm-size dielectric elastomer actuators”, in: Proceedings of Electroactive Polymer Actuators and Devices (SPIE 2010), San Diego, CA, vol. 7284 (March 2009). S. Rosset, M. Niklaus, P. Dubois, and H. Shea, “Micromachined Dielectric Elastomer Actuators with Ion Implanted Electrodes”, in: Proceedings of ICMEMS, Chennai, India, (January 2009). M. Niklaus, S. Rosset, and H. Shea, “Array of lenses with individually tunable focal-length based on transparent ion-implanted EAPs”, in: Proceedings of Electroactive Polymer Actuators and Devices (SPIE 2010), San Diego, CA, vol. 7642 (March 2010). S. Akbari, M. Niklaus, and H. Shea, “Arrays of EAP micro-actuators for single-cell stretching applications”, in: Proceedings of Electroactive Polymer Actuators and Devices (SPIE 2010), San Diego, CA, vol. 7642 (March 2010). Submitted or in preparation M. Niklaus and H. Shea, “Electrical and mechanical properties of Gold and Titanium implanted Polydimethylsiloxane: Relation to the energy, dose and structure”, in preparation for Acta Materialia. M. Niklaus and H. Shea, “Conductivity and microstructure of Gold and Titanium implanted Polydimethylsiloxane at 10 and 35 keV”, in preparation for Nuclear Instruments and Methods.
165
12. Acknowledgments
It would be far, far away from the truth if I would not on the first place here list my professor, Herbert Shea. Without him and with some other professor I would have probably never finished my PhD. Only through his help, devoted time, personal work, patience, support, understanding and tolerance I managed to get to the end of this work. Dear Herb, thanks, thanks, thanks … The second most important and responsible person for the work presented here is my ex-colleague Dr. Samuel Rosset. He introduced me into this project, showed me how to use different instruments and generally helped me all the time with all possible things. He was simply a great example of a really good PhD student that I was only trying to follow. Thanks Sam.
And to complete my starting (former) EAP team I want to thank “Professor Tournesol” – Philippe Dubois. He is actually one of the guys responsible for the creation of this project and also one of the responsible persons who chose and took me on the board of this project. I also thank all the other mates, who still work on their projects, for the nice time spent at LMTS: Andres (for his crazy ideas and jokes), Joao (for the senseless laughing), Samin, Vinu, Kaustav, Alexander and our super secretary Myriam. All the other persons mentioned below I would like to thank since in some way or the other (see brackets) they helped me in my work:
Karine, Martine & Marie (big thanks to the secretaries), Jérôme Courbat (general help), Claudio (PC help), Peter (chemistry), Giovanni and Yves (singing in the gray room), Renato (driving car), Alexandra, Danick, Roland, Giepetto, Don, Olivier … and the rest of the SAMLAB crew.
From the technical point of view, special thanks to Massoud Dadras, Mireille Leboeuf and Spassov Vladi. This group of people was also working on the analysis and characterization of materials and they are responsible for teaching me how to use TEM, AFM and SEM, and how to obtain the structures’ results presented in this document.
Also I want to thank Mme. Laub and Valloton Colette at CIME that allowed me the usage of their facilities and helped me with the preparation of my TEM samples. Big thanks to Mr. Winkler Ingolf, a technician responsible for the LEI implantations at the Center for Application of Ion Beams in Materials Research, Forschungszentrum Dresden-Rossendorf (FZR), Germany; to Herr Döbeli who was doing RBS measurements at Paul Scherer Institut; and to Augusto Tazzoli and the team of Prof. G. Meneghesso at the University of Padova, Italy, for performing the gamma and proton irradiation.

166 ACKNOWLEDGMENTS
At the end I thank my wife Pia who helped me in the last three months by not making too much trouble while I was spending a free day more away from home writing my thesis. I also acknowledge the patience during the last months of my three sons Linus-Flinn, Jesper-Luis and Eliot-Sam. I thank my mother Neoldina, who brought me here in this well equipped land with almost no limits, uncle Nelo for baby-sitting and I thank my family in Denmark for their belief in me. And thank everybody else who directly or indirectly helped me and I forgot to put here on the list. Sorry and thanks! I acknowledge financial support from the Swiss National Science Foundation grant #20020-120164. Without SNSF this work, one of the greatest achievements of my life, would not exist.
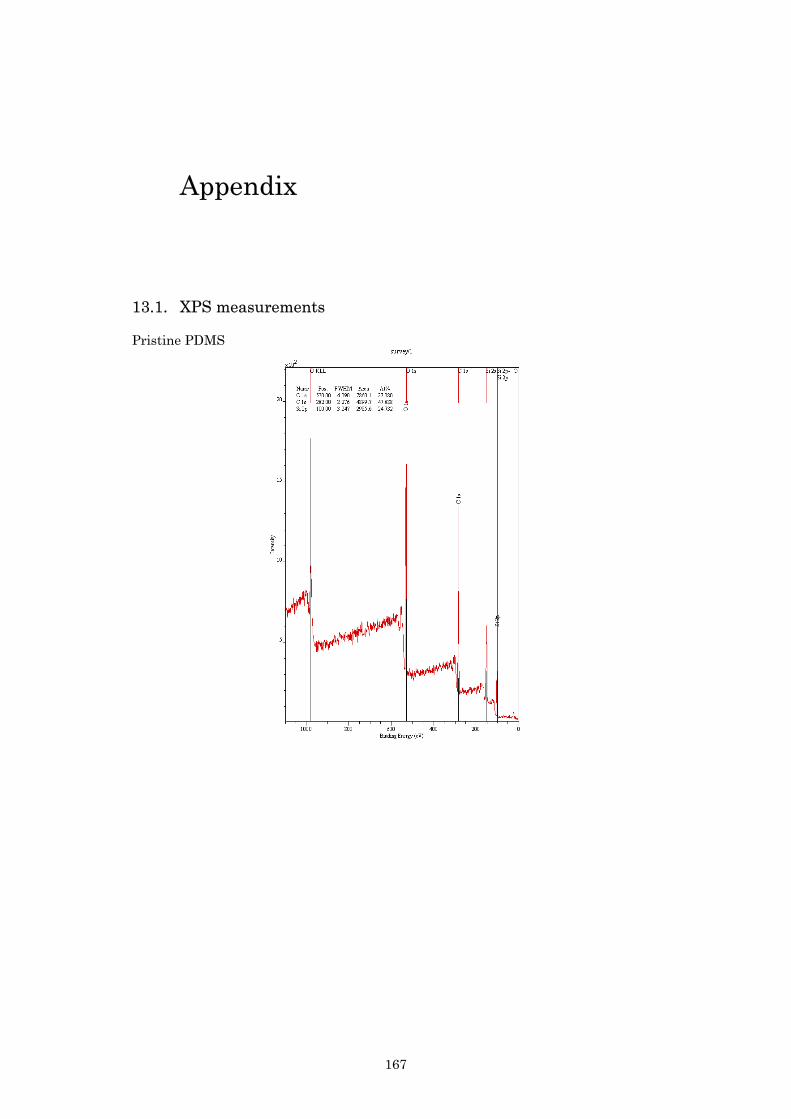
167
13. Appendix
13.1. XPS measurements
Pristine PDMS
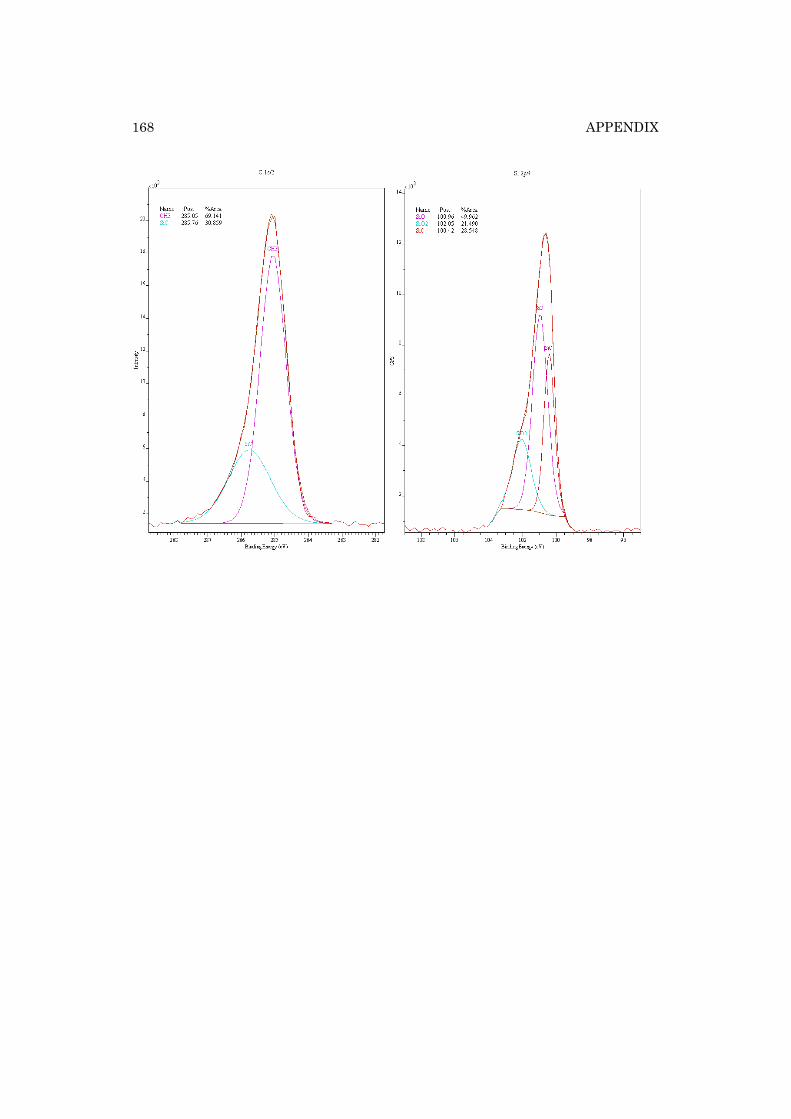
APPENDIX
168
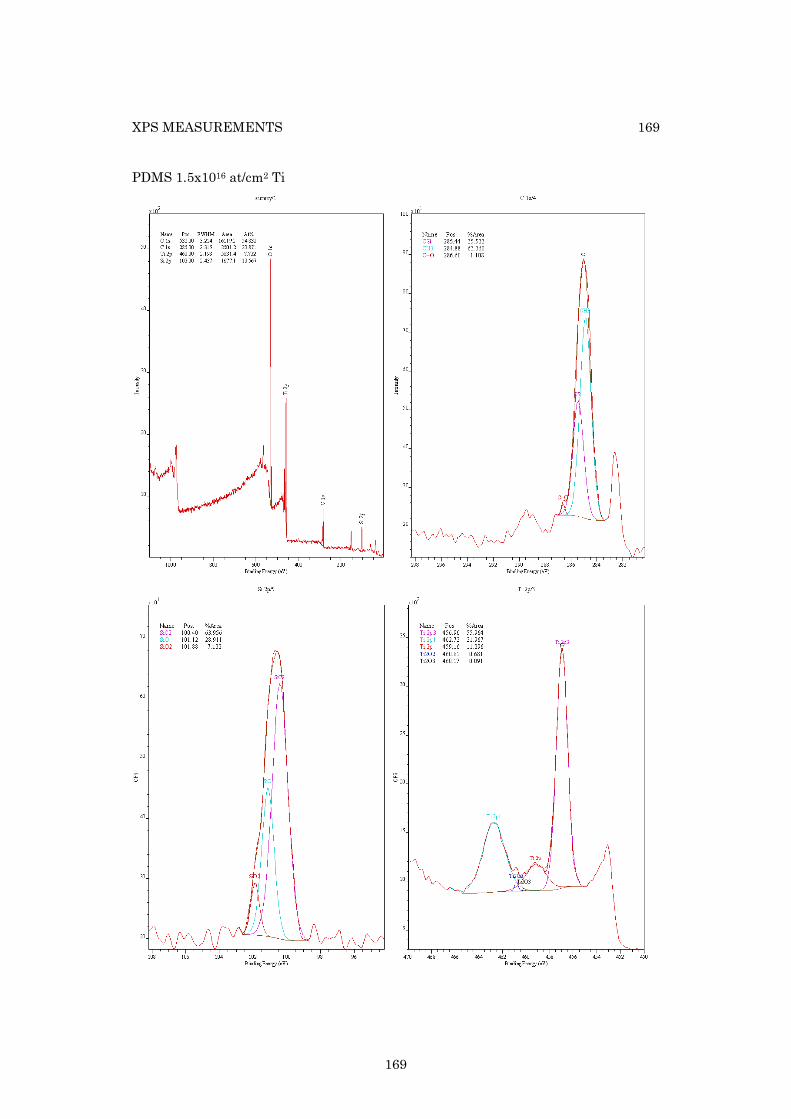
XPS MEASUREMENTS 169
169
PDMS 1.5x10¹⁶ at/cm2 Ti
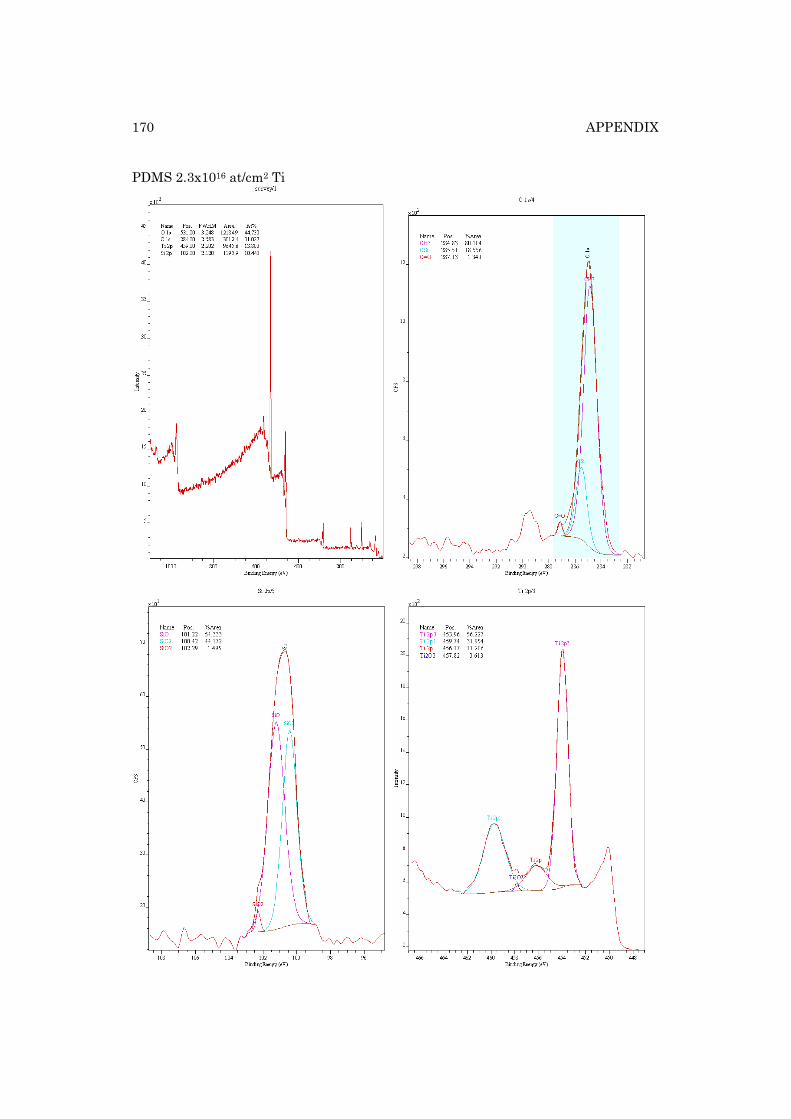
APPENDIX
170
PDMS 2.3x10¹⁶ at/cm2 Ti
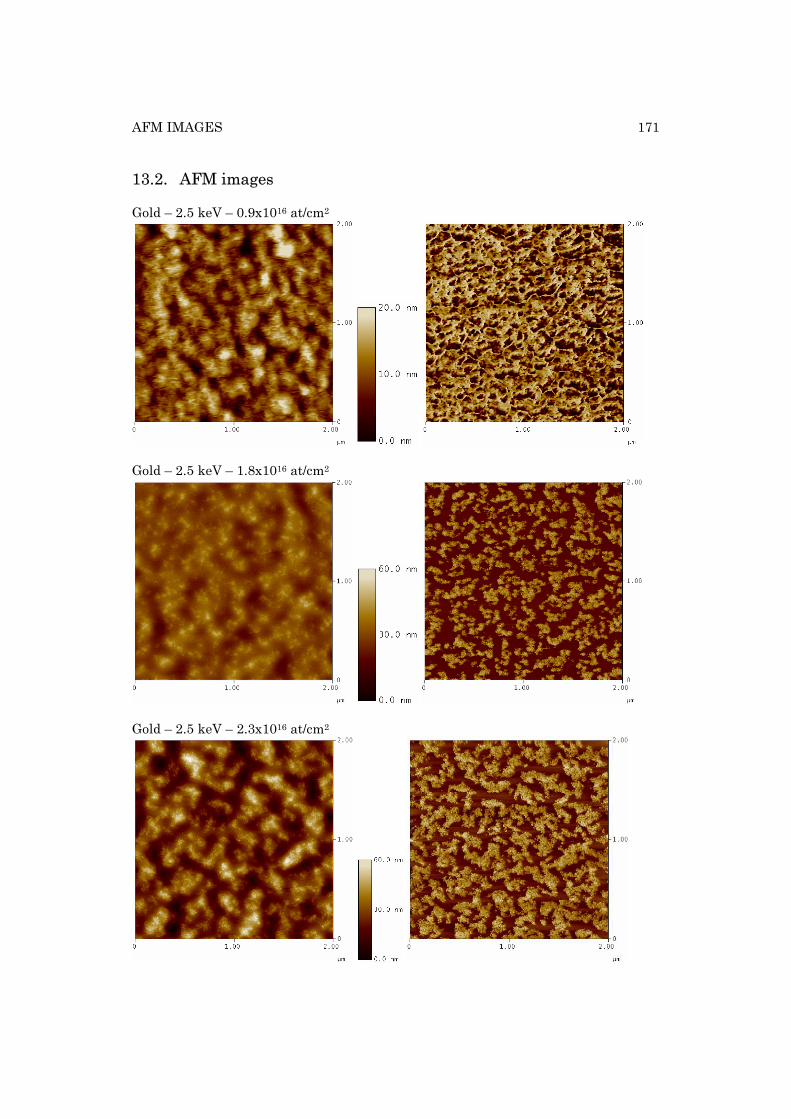
AFM IMAGES
171
13.2. AFM images
Gold – 2.5 keV – 0.9x10¹⁶ at/cm2
Gold – 2.5 keV – 1.8x10¹⁶ at/cm2
Gold – 2.5 keV – 2.3x10¹⁶ at/cm2
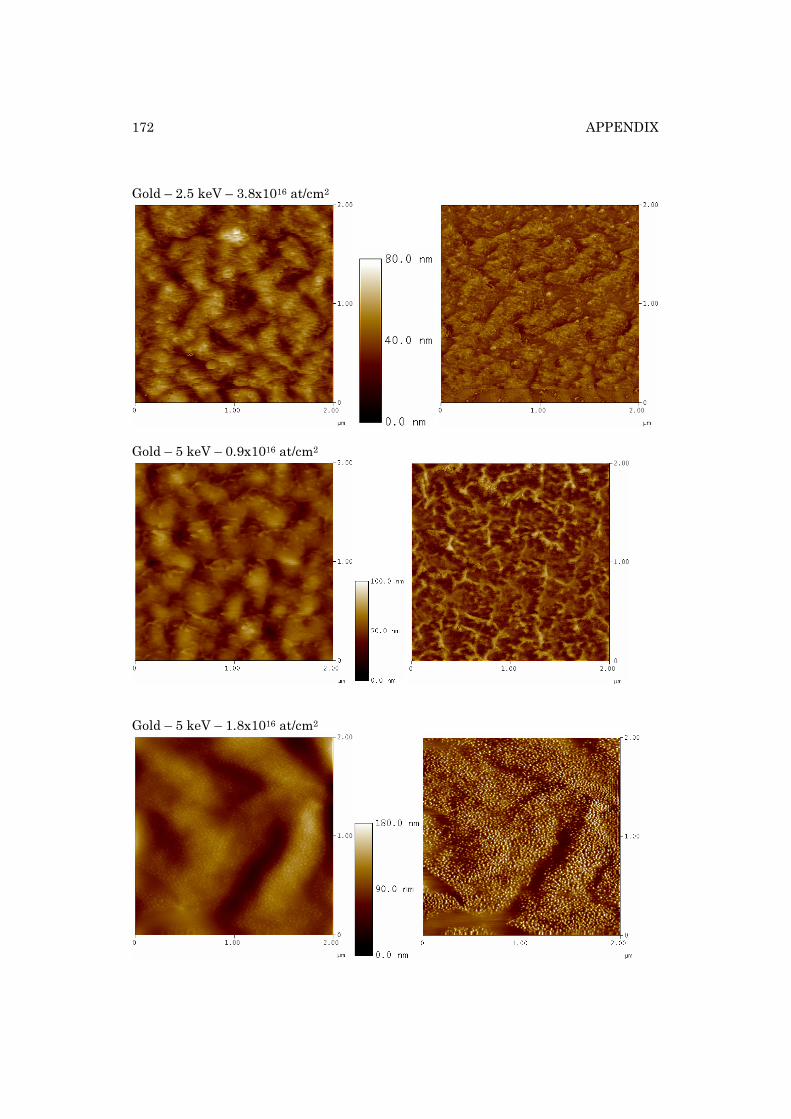
APPENDIX
172
Gold – 2.5 keV – 3.8x10¹⁶ at/cm2
Gold – 5 keV – 0.9x10¹⁶ at/cm2
Gold – 5 keV – 1.8x10¹⁶ at/cm2
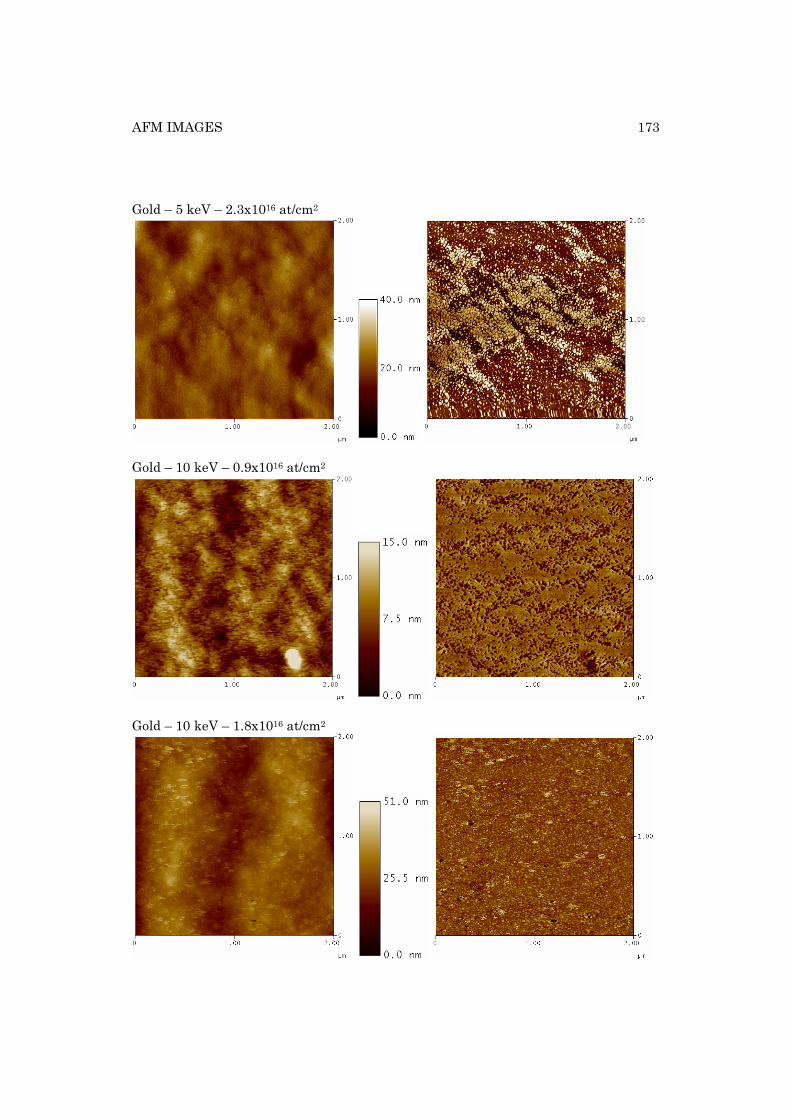
AFM IMAGES
173
Gold – 5 keV – 2.3x10¹⁶ at/cm2
Gold – 10 keV – 0.9x10¹⁶ at/cm2
Gold – 10 keV – 1.8x10¹⁶ at/cm2
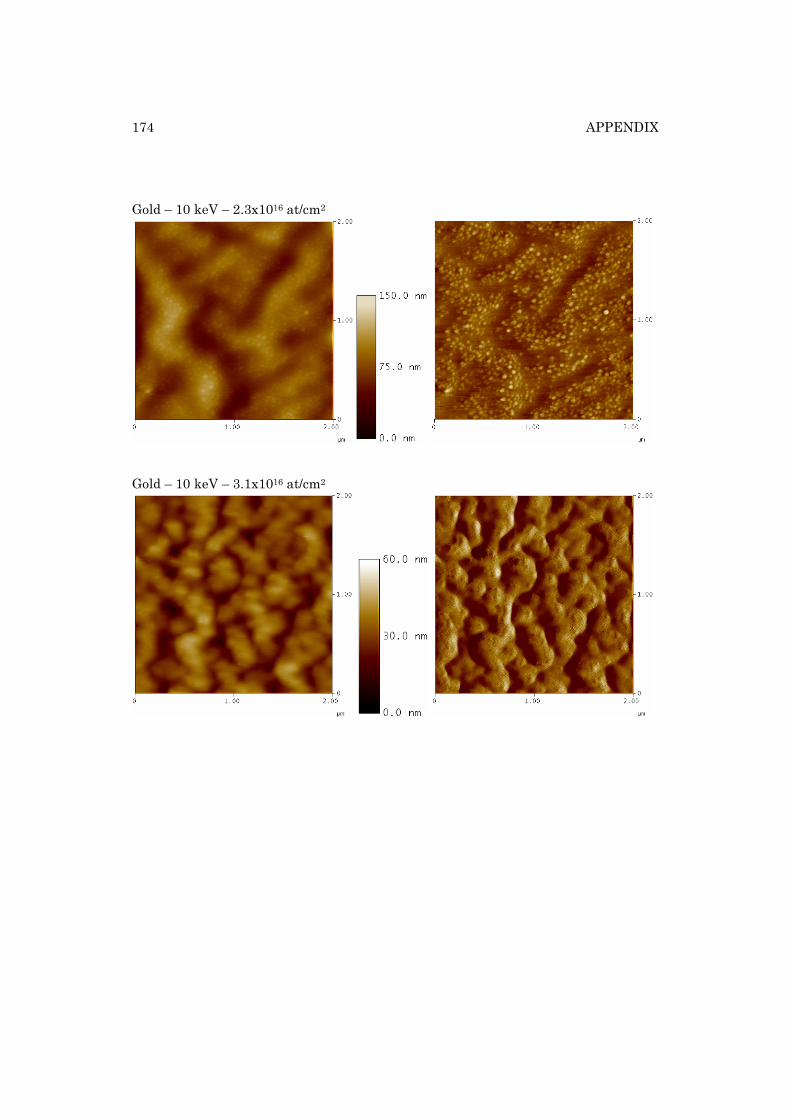
APPENDIX
174
Gold – 10 keV – 2.3x10¹⁶ at/cm2
Gold – 10 keV – 3.1x10¹⁶ at/cm2
175
14. Bibliography
[1] Y. Bar-Cohen, Ed., “EAP as artificial Muscles: Reality potential and Challanges”, SPIE Press Monograph PM136 (2004).
[2] Y. Bar-Cohen, Ed., “Biomimetics: Biologically Inspired Technologies”, CRC Press, Boca Raton (2005).
[3] Y. Bar-Cohen, “Electro-active polymers: Current capabilities and challenges,” in Proceedings of SPIE – The International Society for Optical Engineering 4695, 1, (2002).
[4] R. E. Pelrine et al., “Electrostriction of polymer dielectrics with compliant electrodes as a means of actuation”, Sensors and Actuators A: Physical 64 (1), 77 (1998).
[5] I. Bunget and M. Popescu, “Physics of solid dielectrics”, (eds) Elsevier, Materials Science Monographs 19, (1984).
[6] G. A. Holzapfel, “Nonlinear Solid Mechanics”, JohnWiley, Chichester, (2000). [7] S. Ashley, “Artificial muscles”, Scientific American 289 (4), 52 (2003). [8] Q.M. Zhang et al., “An all-organic composite actuator material with a high dielectric
constant”, Nature 419, 284 (2002). [9] M. Aschwanden et al., “Low voltage, highly tunable diffraction grating based on
dielectric elastomer actuators”, Proceedings of SPIE (EAPAD) 6524, 65241N-10 (2007). [10] G. Kofod et al., “Actuation response of polyacrylate dielectric elastomers”, J. Intell.
Mater. Syst. Struct. 14, 787 (2003). [11] X. Bao et al., "Numerical modelling of single-layer electroactive polymer mirrors for
space applications.," Proceedings SPIE (EAPAD) 5051, 381 (2003). [12] R. Heydt et al., “Design and performance of an electrostrictive-polymerfilm acoustic
actuator,” Journal of Sound and Vibration 215(2), pp. 297–311 (1998). [13] F. Carpi et al., “Dielectric elastomer cylindrical actuators: electromechanical modelling
and experimental evaluation,” Mater. Science. and Engin.: C 24(4), pp. 555–562, (2004). [14] A. Pimpin et al., "Micro electrostrictive actuator with metal compliant electrodes for
flow control applications," Micro Electro Mechanical Systems, 2004. 17th IEEE International Conference on. (MEMS), pp. 478–481 (2004).
[15] P. Dubois et al, “Microactuators Based On Ion-Implanted Dielectric Electroactive Polymer Membranes (EAP)”, Sensors and Actuators A: Physical, Vol. 130-131, pp. 147-154 (2006).
[16] S. Rosset et al., “Large-Stroke Dielectric Elastomer Actuators With Ion-Implanted Electrodes”, JMEMS, vol. 18, no. 6 (2009).
[17] S. Rosset et al., “Mechanical characterization of a dielectric elastomer microactuator with ion-implanted electrodes”, Sensors and Actuators A: Physical 144(1),185, (2008).
[18] M. Niklaus, et al., "Microstructure of 5 keV Gold implanted PDMS", Scripta Materialia 59, 893–896 (2008).
[19] S. P. Lacour et al., ”Design and performance of thin metal film interconnects for skin-like electronic circuit”, IEEE Electron Device Letters 25, 179 (2004).
[20] M. Gonzalez et al., “Design of metal interconnects for stretchable electronic circuits”, Microelectronics Reliability 48, 825 (2008).
[21] M. G. Urdaneta et al.”Stretchable electrodes with high conductivity and photo-patternability”, Advanced Materials 19, 2629 (2007).
[22] M. Niklaus et al., Array of lenses with individually tunable focal-length based on transparent ion-implanted EAP, Proceedings SPIE, Paper 7642-92 (2010).
[23] S. Rosset, et al., “Metal Ion Implantation for the Fabrication of Stretchable Electrodes on Elastomers”, Advanced Functional Materials 19, 470–478, (2008).
BIBLIOGRAPHY
176
[24] G. Kovacs et al., “An arm wrestling robot driven by dielectric elastomer actuators”, Smart Mater. Struct. 16, S306 (2007).
[25] N. Goulbourne et al., “Selfsensing McKibben actuators using dielectric elastomer sensors”, Proc. of SPIE Vol. 6524, 652414, (2007).
[26] A. Pimpin et al., “Microelectrostrictive Actuator With Large Out-of-Plane Deformation for Flow-Control Application”, JMEMS 16, 753 (2007).
[27] D. Fink, “Fundamentals of Ion-Irradiated Polymers”, Springer, Berlin, Germany (2004). [28] “Gamma rays offer new polymers “, Chem. and Engineering News 32 (9), 812 (1954). [29] D. J. T. Hill et al., “Determination of scission and crosslinking in gamma irradiated
butyl rubber”, Radiat. Phys. Chem. 40, 127 (1992). [30] F. Macchi et al., “Chemical defects induced in P(VDF-TrFe) by electron irradiation”,
Radiat. Effects 118, 117 (1991). [31] Y. L. Koo et al. “An experimental investigation on the degradation characteristic of the
outdoor silicone rubber insulator due to sulfate and nitrate ions”, IEEE Annual Report. Conf. on Electr. Insulat. and Dielectric Phenom, Minneapolis, 370-373 (1997).
[32] T. Imakoma et al. “Degradation of silicone rubber housing by ultraviolet radiation”, Proc. of the 4th Intl. Conf. on “Properties and Applications of Dielectric materials”, Brisbane, Australia, IEEE Publication, New York, 1, 304-308 (1994).
[33] Y. Suzuki et al., “Surface modification of silicone rubber by ion implantation”, Nucl. Instr. Meth. B32, 120-124 (1988).
[34] S. Kumagai et al., “Solid residue formation of RTV silicone rubber due to dry-band arcing and thermal decomposition”, IEEE Trans. Dielec. Elec. Insul. 5, 281-289 (1998).
[35] J. Pivin et al., “Ceramic coatings by ion irradiation of polycarbosilanes and polysiloxanes”, Parts I and II. Journal of Mater. Sci. 32, 6163-6182 (1997).
[36] M. Harris et al., “Silicon oxycarbide coatings on graphite fibers: chemistry, processing, and oxidation resistance”, Mater. Sci. Eng. Al95, 223-236 (1995).
[37] T. Venkatesan et al., “Ion-Beam modification of insulators”, P. Mazzoldi, G.W. Arnold, (eds.) Elsevier, Amsterdam, 307 (1987).
[38] A. Anders, “Handbook of Plasma Immersion Ion Implantation and Deposition”, John Wiley & Sons, New York, USA (2000).
[39] J. F. Ziegler et al., “The Stopping and Range of Ions in Solids”, Pergamon, New York, USA (1985).
[40] W. H. Bragg et al, “On the α particles of radium, and their loss of range in passing through various atoms and molecules”, Philosophical Magazine Series 6, 10, 318 (1905).
[41] J. F. Ziegler et al., “The stopping of ions in compounds“, Nucl. Instrum. Meth. Phys. Res. B 35, 215 (1988).
[42] G. Marletta et al., “Chemical reactions and physical property modifications induced by keV ion beams in polymers”, Nucl. Instrum. Meth. Phys. Res. B 46, 295 (1990).
[43] J. P. Biersack et al., “The transport and ranges in matter”, Nucl. Instrum. Methods 174, 257, (1980).
[44] V. Svorcik et al., “Influence of implantation conditions on the surface structure of polypropylene”, Journal of Applied Polymer Science 49 (7), 1299 (1993).
[45] R. G. Wilson, “Ion implantation ranges and range straggles in organic polymers and comparison with calculations”, J. Appl. Phys. 73(5), 2215 (1993).
[46] M. T. Robinson et al., “Computer simulation of atomic displacement cas cades in solids in the binary-collision approximation”, Phys Rev B9, 5008 (1974).
[47] H. Paul et al., “Judging the reliability of stopping power tables and programs for heavy ions”, 5th Intl. Symp. on “Swift Heavy Ions in Matter”, Giardini Naxos, Italy (2002).
[48] D. Fink et al., “Distributions of light ions and foil destruction after irradiation of organic polymers”, J. Appl. Phys. 58, 68—676 (1985).
[49] I. Adesida et al., “The range of light ions in polymeric resists”, J. Appl. Phys. 56, 1801 (1984).
[50] W. Möller et al., “Tridyn-binary collision simulation of atomic collisions and dynamic composition changes in solids”, Computer Physics Communication 51, 355 (1988).
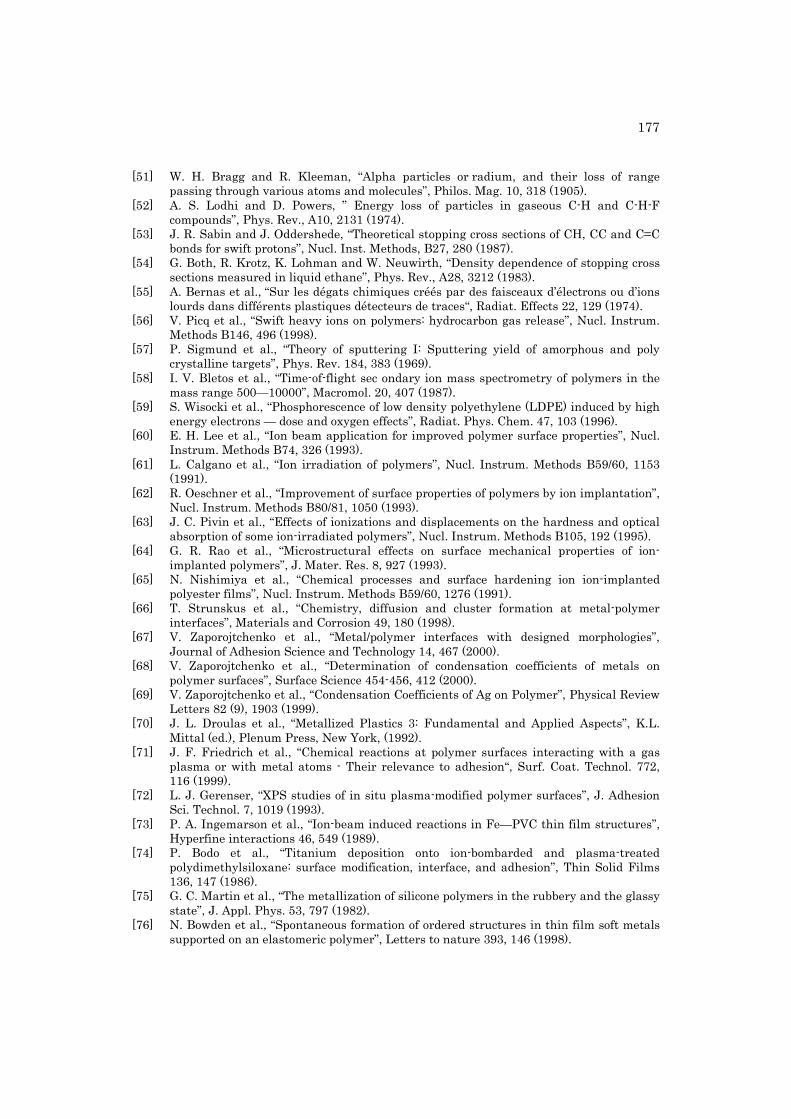
177
[51] W. H. Bragg and R. Kleeman, “Alpha particles or radium, and their loss of range passing through various atoms and molecules”, Philos. Mag. 10, 318 (1905).
[52] A. S. Lodhi and D. Powers, ” Energy loss of particles in gaseous C-H and C-H-F compounds”, Phys. Rev., A10, 2131 (1974).
[53] J. R. Sabin and J. Oddershede, “Theoretical stopping cross sections of CH, CC and C=C bonds for swift protons”, Nucl. Inst. Methods, B27, 280 (1987).
[54] G. Both, R. Krotz, K. Lohman and W. Neuwirth, “Density dependence of stopping cross sections measured in liquid ethane”, Phys. Rev., A28, 3212 (1983).
[55] A. Bernas et al., “Sur les dégats chimiques créés par des faisceaux d’électrons ou d’ions lourds dans différents plastiques détecteurs de traces“, Radiat. Effects 22, 129 (1974).
[56] V. Picq et al., “Swift heavy ions on polymers: hydrocarbon gas release”, Nucl. Instrum. Methods B146, 496 (1998).
[57] P. Sigmund et al., “Theory of sputtering I: Sputtering yield of amorphous and poly crystalline targets”, Phys. Rev. 184, 383 (1969).
[58] I. V. Bletos et al., “Time-of-flight sec ondary ion mass spectrometry of polymers in the mass range 500—10000”, Macromol. 20, 407 (1987).
[59] S. Wisocki et al., “Phosphorescence of low density polyethylene (LDPE) induced by high energy electrons — dose and oxygen effects”, Radiat. Phys. Chem. 47, 103 (1996).
[60] E. H. Lee et al., “Ion beam application for improved polymer surface properties”, Nucl. Instrum. Methods B74, 326 (1993).
[61] L. Calgano et al., “Ion irradiation of polymers”, Nucl. Instrum. Methods B59/60, 1153 (1991).
[62] R. Oeschner et al., “Improvement of surface properties of polymers by ion implantation”, Nucl. Instrum. Methods B80/81, 1050 (1993).
[63] J. C. Pivin et al., “Effects of ionizations and displacements on the hardness and optical absorption of some ion-irradiated polymers”, Nucl. Instrum. Methods B105, 192 (1995).
[64] G. R. Rao et al., “Microstructural effects on surface mechanical properties of ion-implanted polymers”, J. Mater. Res. 8, 927 (1993).
[65] N. Nishimiya et al., “Chemical processes and surface hardening ion ion-implanted polyester films”, Nucl. Instrum. Methods B59/60, 1276 (1991).
[66] T. Strunskus et al., “Chemistry, diffusion and cluster formation at metal-polymer interfaces”, Materials and Corrosion 49, 180 (1998).
[67] V. Zaporojtchenko et al., “Metal/polymer interfaces with designed morphologies”, Journal of Adhesion Science and Technology 14, 467 (2000).
[68] V. Zaporojtchenko et al., “Determination of condensation coefficients of metals on polymer surfaces”, Surface Science 454-456, 412 (2000).
[69] V. Zaporojtchenko et al., “Condensation Coefficients of Ag on Polymer”, Physical Review Letters 82 (9), 1903 (1999).
[70] J. L. Droulas et al., “Metallized Plastics 3: Fundamental and Applied Aspects”, K.L. Mittal (ed.), Plenum Press, New York, (1992).
[71] J. F. Friedrich et al., “Chemical reactions at polymer surfaces interacting with a gas plasma or with metal atoms - Their relevance to adhesion“, Surf. Coat. Technol. 772, 116 (1999).
[72] L. J. Gerenser, “XPS studies of in situ plasma-modified polymer surfaces”, J. Adhesion Sci. Technol. 7, 1019 (1993).
[73] P. A. Ingemarson et al., “Ion-beam induced reactions in Fe—PVC thin film structures”, Hyperfine interactions 46, 549 (1989).
[74] P. Bodo et al., “Titanium deposition onto ion-bombarded and plasma-treated polydimethylsiloxane: surface modification, interface, and adhesion”, Thin Solid Films 136, 147 (1986).
[75] G. C. Martin et al., “The metallization of silicone polymers in the rubbery and the glassy state”, J. Appl. Phys. 53, 797 (1982).
[76] N. Bowden et al., “Spontaneous formation of ordered structures in thin film soft metals supported on an elastomeric polymer”, Letters to nature 393, 146 (1998).
BIBLIOGRAPHY
178
[77] C. M. Stafford et al., “Elastic Moduli of Ultrathin Amorphous Polymer Films”, Macromolecules 39, 5095 (2006).
[78] H. G. Allen, “Analysis and Design of Structural Sandwich Panels”, Pergamon, New York (1969).
[79] M. Ohring, “The Material Science of Thin Films”, Academic, San Diego (1992). [80] I. G. Brown, “Vacuum arc ion sources”, Rev. Sci. Instrumemts 65, 3061 (1994). [81] S. Anders et al., “Influence of residiual gases on cathode spot behaviour”, IEEE
Transactions on Plasma Science 19, 705 (1991). [82] A. Anders et al., “Effect of duct bias on transport of vacuum arc plasmas through curved
magnetic filters”, Journal of Applied Physics 75, 4900 (1994). [83] A. Anders et al., “Transport of vacuum arc plasmas through magnetic macroparticle
filters”, Plasma Sources Science and Technology 4, 1 (1995). [84] I. G. Brown, “Vacuum arc metal plasma production and the transition of processing
mode from metal ion beam to dc metal plasma immersion”, Surface and Coatings Technology 136, 16 (2001).
[85] N. A. Andreucetti et al., “Model linear ethylene–butene copolymers irradiated with γ-rays”, Polymer 40, 3443 (1999).
[86] N. A. Andreucetti et al., “Effect of the phenolic antioxidants on the structure of gamma-irradiated model polyethylene”, Radiat. Phys. Chem. 52, 177 (1998).
[87] S. R. Gomes et al., ”Novel way to control PDMS cross-linking by gamma-irradiation”, Nucl. Instr. and Meth. B 266, 1115 (2007).
[88] D. J. T. Hill et al., “NMR study of the gamma radiolysis of poly(dimethyl siloxane) under vacuum at 303 K”, Polymer 43, 1051 (2002).
[89] D. J. T. Hill et al., “Molecular weight changes and scission and crosslinking in poly(dimethyl siloxane) on gamma radiolysis”, Radiat. Phys. Chem. 62, 11 (2001).
[90] C. Sarmoria et al., “Model for a scission-crosslinking process with both H and Y crosslinks”, Polymer 45, 5661 (2004).
[91] L. Woo et al., “Comparison of electron beam irradiation with gamma processing for medical packaging materials”, Radiat. Phys. Chem. 63, 845 (2002).
[92] A. Mashak et al., “In vitro progesterone release from γ-irradiated cross-linked polydimethylsiloxane”, Radiat. Phys. Chem. 75, 229 (2006).
[93] V. Borjanovic et al., “Influence of proton irradiation on the structure and stability of polydimethylisoxane and polydimethylsiloxane-nanodiamond composite”, J. Vac. Sci. Techn. B 27, 2396 (2009)
[94] R. Huszank et al., “Fabrication of optical devices in poly(dimethylsiloxane) by proton microbeam”, Optics Communications 283, 176 (2010).
[95] R. L. Fleischer et al., “Nuclear Tracks in Solids”, Univ. of Califor. Press, Berkeley (1975).
[96] J. P. Salvetat et al., “Spin and charge dynamics in heavy ion irradiated polyimide kapton”, Nucl. Instrum. Methods B116, 284 (1995).
[97] W. L. Brown et al., „Sputtering of ices: a review”, Nucl. Instr. Meth. 613, 295 (1986). [98] J. Lindhard et al., “Energy dissipation by ions in the keV region”, Phys. Rev. 124, 128
(1961). [99] R. G. Wilson, “Ion implantation ranges and range straggles in organic polymers and
comparison with calculations”, J. Appl. Phys. 73, 2215 (1992). [100] G. Schiwietz et al., “Influence of nuclear track potentials in insulators on the emission of
target Auger electrons”, Phys. Rev. Lett. 69, 628 (1992). [101] M. Toulemonde et al., “Swift heavy ions in insulating and conducting oxides: tracks and
physical properties”, Nucl. Instrum. Methods B91, 108 (1994). [102] F. Studer et al., “Saturation in the damage efficiency in magnetic insulators irradiated
by high energy heavy ions”, Radiat. Eff. Defects Solids 116, 59 (1991). [103] A. Meftah et al., “Swift heavy ions in magnetic insulators: a damage-cross- section
velocity effect”, Phys. Rev. B48, 920 (1993). [104] V. Chailley et al., “Observations by X-ray diffraction of structural changes in mica
irradiated by swift heavy ions”, Nucl. Instrum. Methods B91, 162 (1994).
179
[105] J. C. Maxwell, “Treatise on Electricity and Magnetism”, Clarendon Press. Oxford (1873). [106] G. W. Milton, “The coherent potential approximation is a realizable effective medium
scheme”, Comm. Math. Phys. 99, 463 (1985). [107] S. Torquato, “Effective electrical conductivity of two-phase disordered composite media”,
J.Appl. Phys. 58, 3790 (1985). [108] J. P. Watt et al. “The elastic properties of composite materials”, Revs. Geophys. Space
Phys. 14, 541 (1976). [109] S. Torquato, “Modeling of physical properties of composite materials”, Int. J. Solids
Structures 37, 411 (2000). [110] S. Broadbent et al., “Percolation processes. 1. Crystals and mazes”, Proc. Camb. Phil.
Soc. 53, 629 (1957). [111] M. J. Beran et al., “Statistical Continuum Theories”, Wiley, New York (1968). [112] M. Avellaneda et al., “Iterated homogenization, differential effective medium theory and
applications”, Commun. Pure Appl. Math. 40. 527 (1987). [113] Y. Benveniste et al., “A new approach to the application of Mori-Tanaka’s theory in
composite materials”, Mech. Mater. 6, 147 (1987). [114] S. Kirkpatrick, “Percolation and conduction”, Rev. Mod. Phys. 45,574 (1973). [115] Ce-Wen Nan, “Physics of inhomogeneous inorganic materials” Prog. Mater. Sci. 37, 1
(1993). [116] L. Benguigui et al., “Experimental realization of superelasticity near the percolation
threshold”, Phys. Rev. Lett. 70, 2423 (1993). [117] M. Sahimi et al., “Mechanics or disordered solids II. Percolation on elastic networks
with bond-bending forces”, Phys. Rev. B 47, 703 (1993). [118] K. Golden, “Convexity and exponent inequalities for conduction near percolation”, Phys.
Rev. Lett. 65, 2923 (1990). [119] S. McLachlan et al., “Electrical resistivity of composites”, Jour. Amer. Ceram. Soc. 73,
2187 (1990). [120] S. McLachlan et al., “The temperature and volume fraction dependence of the resistivity
of granular Al-Ge near the percolation threshold” J. Phys. Condens. Matter 5, 4829 (1993).
[121] S. Feng et al., “Transport properties of continuum systems near the percolation threshold”, Phys. Rev. B 35, 197 (1987).
[122] A. Celzard et al., “Non-universal conductivity critical exponents in anisotropic percolating media: a new interpretation”, Physica A 317, 305 (2003).
[123] S. Vionnet-Menot et al., “Tunneling-percolation origin of nonuniversality: Theory and experiments”, Phys. Rev. B 71, 64201 (2005).
[124] J. K. W. Sandler et al., “Ultra-low electrical percolation threshold in carbon-nanotube-epoxy composites”, Polymer 44, 5893 (2003).
[125] D.S. McLachlan, “An equation for the conductivity of binary mixtures with anisotropic grain structures”, J. Phys. C 20, 865 (1987).
[126] Z. Hashin et al., “A variational approach to the theory of the effective magnetic permeability of multiphase materials”, J. Appl. Phys. 33, 3125 (1962).
[127] G.W. Milton et al., ”New bounds on effective elastic moduli of two-component materials”, Proc. L. Soc. Lond. A 380,305 (1982).
[128] C.A. Miller et al., “Effective conductivity of hard-sphere dispersions”, J. Appl Phys. 68, 5486 (1990).
[129] I.M. Ward, J. Sweeney, “An introduction to the mechanical properties of solid polymers”, John Wiley & Sons, 2nd Edition (2004).
[130] S. Torquato, “Bulk properties of two-phase disordered media. II. Effective conductivity of a dilute dispersion of penetrable spheres”, J. Chem. Phys. 83, 4776 (1985).
[131] J. F. Thovert, et al., ”Bounds on the effective properties of polydispersed suspensions of spheres, An evaluation of two relevant morphological parameters”, J. Appl. Phys. 67, 6088 (1990).
[132] S. Rosset et al., “Mechanical properties of electroactive polymer microactuators with ion implanted electrodes”, SPIE proceedings 6524, 652410 (2007).
BIBLIOGRAPHY
180
[133] N. Matsunami et al., “Energy dependence of the ion induced sputtering yields of monoatomic solids”, At. Data Nucl. Data Tables 31, 1 (1984).
[134] Y. Yamamura, N. Itoh, “Sputtering Yield” in “Ion beam assisted film growth”, Elsevier, Amsterdam (1989).
[135] J. F. Moulder, W. F. Stickle, P. E. Sobol, K. D. Bomben, “Handbook of X-ray Photoelectron Spectroscopy”, Perkin-Elmer Corporation, Eden Prairie, MN, (1992).
[136] A. Einstein et al., ”On a Heuristic Viewpoint Concerning the Production and Transformation of Light”, Annalen der Physik 17, 132 (1905).
[137] N. Fairley, A. Carrick, “The Casa Cookbook: Recipes for XPS Data Processing”, Acolyte Science Knutsford, U. K. (2005).
[138] D. Briggs, M.P. Seah, “Practical Surface Analysis“, 2nd ed., Wiley, Chichester (1990). [139] J. Emsley, "Titanium, Nature's Building Blocks: An A-Z Guide to the Elements”, Oxford
University Press, UK, (2001). [140] G. Li et al., “Structural characterization of TiCx films prepared by plasma based ion
implantation”, Thin Solid Films 396, 16 (2001). [141] C. HuaQin et al., “Synthesis of ordered mesoporous bifunctional TiO2–SiO2–polymer
nanocomposites”, J. Mater. Chem. 19, 8610 (2009). [142] H. Zhiyue et al., “Synthesis and photoelectric property of poly (3-
methoxythiophene)/titanium dioxide complexes”, Solar Energy Materials and Solar Cells 94, 755 (2010).
[143] G. Binning et al., “Atomic resolution with atomic force microscope”, Surface Science 189 (C2), 1 (1987).
[144] M. R. VanLandingham et al., “Nanoindentation of polymers: an overview“, Macromolecular Symposia 167, 15 (2001).
[145] A. Strojny et al., “Techniques and considerations for nanoindentation measurements of polymer thin film constitutive properties”, Journal of Adhesion Science and Technology 12, 1299 (1998).
[146] A. G. Every, “Measurement of the near-surface elastic properties of solids and thin supported films”, Measurement Science and Technology 13, R21 (2002).
[147] J. H. Zhao et al., “Thermal stress and glass transition of ultrathin polystyrene films”, Applied Physics Letters 77, 2843 (2000).
[148] W. Yuguang et al., “The nano-structure and properties of Ag-implanted PET”, Surface and coatings technology 157, 262 (2002).
[149] E. Fuchs, H. Oppolzer, H. Rehme, “Particle Beam Microanalysis”, VCH, Weinheim, (1990).
[150] A. Einstein, "Über die von der molekularkinetischen Theorie der Wärme geforderte Bewegung von in ruhenden Flüssigkeiten suspendierten Teilchen", Annalen der Physik 17, 549–560 (1905).
[151] K. C. Russell, “Phase stability under irradiation“, Prog. Matter. Science 28, 229-234 (1984).
[152] E. Bonnotte et al., “Two interferometric methods for the mechanical characterization of thin films by bulging tests”, Journal of material research 12, 2234 (1997).
[153] J.J. Vlassak et al., “A new bulge test technique for the determination of young’s modulus and poisson’s ratio of thin films”, Journal of materials research 7, 3242 (1992).
[154] A.J. Kalkman et al., “High-temperature bulge-test setup for mechanical testing of free-standing thin films”, Review of scientific instruments 74, 1383 (2003).
[155] B. Liu et al., “The effective Young’s modulus of composites beyond the Voigt estimation due to the Poisson effect”, Composites science and technology 69, 2198 (2009).
[156] H. G. Svavarsson et al., “Lithium-diffused and annealed GaAs: Admittance spectroscopy study”, Physical Review B 69, 155209 (2004).
[157] Z. M. Elimat, “AC electrical conductivity of poly(methyl methacrylate)/carbon black composite”, Journal of Applied Physics D 39, 2824 (2006).
[158] K. Nozaki et al., “The determination of the full set of characteristic values of percolation, percolation threshold and critical exponents for the artificial composite with ionic conduction Ag4RbI5-(β-AgI)”, Journal of Physics Cond. Mat. 18, 2191 (2006).
181
[159] T.W. Clyne, P.J. Withers, “An introduction to metal matrix composites”, Cambridge, Cambridge University Press (1993).
[160] S. Torquato, “Random heterogeneous materials: microstructure and macroscopic properties”, New York (NY), Springer (2002).
[161] R. McLaughlin, “A study of the differential scheme for composite materials”, International Journal of Engineering and Science 15, 237 (1977).
[162] H. Xie et al., “The energy criterion for breaking the energy bonds in electrical breakdown process of polymer”, Proc. of the 4th Intl. Conf. on properties and applications of dielectric materials 1, 39 (1994).
[163] G. Mie, „Beiträge zur Optik trüber Medien, speziell kolloidaler Metallösungen“, Annalen der Physik 25, 377 (1908).
[164] G. W. Arnold, “Near-surface nucleation and crystallization of an ion-implanted Lithia-alumina-silica glass”, J. Appl. Phys. 46, 4466 (1975).
[165] A. V. Fedorov et al., “Formation of gold nanoclusters in MgO by ion implantation at elevated temperatures”, Nuclear Instrument and Methods B 166, 215 (2000).
[166] A. Miotello et al., “Formation of silver nanoclusters by excimer–laser interaction in silver-exchanged soda-lime glass”, Appl. Phys. Lett. 79, 2456 (2001).
[167] H.P. Halperin, “Quantum size effects in metal particles”, Review in Modern Physics 58, 533 (1986).
[168] C. Darraud-Taupiac et al., “CR 39 (polydiethylen glycol bis allyl carbonate) under gamma rays and proton beams“, Nuclear Instrument Methods B131, 198 (1997).
[169] D. Fink et al., “Optically absorbing layers on ion beam modified polymers: a study of their evolution and properties”, Nuclear Instrument Methods B32, 125 (1988).
[170] A.M. Guzman et al., “Chemical and physical changesinduced in polyvinylene fluorid by irradiation with high energies”, Nuclear Instrument Methods B7, 468 (1986).
[171] B. I. Halperin et al., “Differences between Lattice and Continuum Percolation Transport Exponents”, Physical Review Letters 54, 2391 (1985).
[172] S.M. Sze, “Physics of semiconductor Devices”, Wiley, New York (1981). [173] R. L. Johnston, “Atomic and molecular clusters”, Taylor and Francis, London (2002). [174] R. Landauer, "Spatial carrier density modulation effects in metallic
conductivity", Physical Review B 14, 1474 (1976). [175] S. Stauffer, A. Aharony, “Introduction to Percolation theory”, Taylor, London, (1994). [176] M. Abkowitz et al., “Common features in the electronic transport behaviour of diverse
glassy solids”, Philosophical Magazine Letters 58, 239 (1988). [177] R. Zallen, “The physics of amourphous solids”, Wiley, New York (1983). [178] H. Sher et al., “Critical Density in Percolation Processes”, Journal of Chemical Physics
53, 3759 (1970). [179] J. Emsley, "Titanium. Nature's Building Blocks: An A-Z Guide to the Elements”, Oxford,
England, UK: Oxford University Press (2001). [180] I. Balberg et al., “Excluded volume and its relation to the onset of percolation”, Phys.
Review B 30, 3933 (1984). [181] I. Balberg et al., “Tunneling and nonuniversal conductivity in composite materials”,
Phys. Rev. Lett. 59, 1305 (1987). [182] N.A. Seaton et al., “Aggregation and percolation in a system of adhesive spheres”, The
Journal of Chemical Physics 86 (8), 4668 (2006). [183] A.L.R. Bug et al., “Do interactions raise or lower a percolation threshold”, Physical
Review Letters 55 (18), 1896 (1985). [184] P. Marquardt et al., “Size-dependent dielectric response of small metal particles”,
Physical Review B 43 (17), 14245 (1991). [185] Nano Letters – http://pubs.acs.org/journal/nalefd [186] A. Rae, "Nanotechnology and Low Temperature Electronics Assembly" and “Nano
Particle Adhesives”, presented at SMTA Pan Pac (2005). [187] G. Kofod et al., “Dielectric properties and electric breakdown strength of a
subpercolative composite of carbon black in thermoplastic copolymer”, Applied Pysics Letters 94, 232905 (2009).
BIBLIOGRAPHY
182
[188] Z.-M. Dang et al. “High-dielectric-permitivity high-elasticity three-component nanocomposites with low percolation threshold and low dielectric loss”, Applied Pysics Letters 94, 042902 (2009).
[189] N. Deprez et al., ”A grain consolidation model for the critical or percolation volume fraction in conductor-insulator mixtures“, J. Phys. 70, 3681 (1991).
[190] M. C. Salvadori et al. ”Conductibg polymer formed by low energy gold ion implantation”, Applied Pysics Letters 93, 073102 (2008).
[191] D. S. McLachlan, “A new interpretation of percolation conductivity results with large critical regimes”, Solid State Commun. 60, 821 (1986).
[192] I. G. Chen et al., “Alternating-current electrical properties of random metal-insulator composites“, J. Mater. Sci. 26, 1565 (1991).
[193] S. Lee et al., ”Experimental observation of nonuniversal behavior of the conductivity exponent for three-dimensional continuum percolation systems”, Phys. Rev. B 34, 6719 (1986).
[194] A. L. Efros et al., “Critical Behaviour of Conductivity and Dielectric Constant near the Metal-Non-Metal Transition Threshold“, Phys. Status Solidi B 76, 475 (1976).
[195] J. P. Straley, “Critical phenomena in resistor networks”, J. Phys. C 9, 783 (1976). [196] D. M. Schaefer et al., “Elastic properties of individual nanometer-size supported gold
clusters”, Phys. Rev. B 51, 5322, (1995). [197] J.-O. Joswig et al., “Size-dependent structural and electronic properties of Tin clusters
(n≤100)”, J. Phys.: Condens. Matter 19, 106207 (2007). [198] C. Friese et al., “Materials, effects and components for tunable micro-optics,” IEEJ
Trans. Electr. Electron. Eng. 2, 232 (2007). [199] S. Grilli et al., “Surface-Charge lithography for direct PDMS micro-patterning”,
Langmuir 24, 13262 (2008). [200] Y. Hongbin et al., “Simple method for fabricating solid microlenses with different focal
lengths”, IEEE Photonics Technology Letters 20, 1624 (2008). [201] X. Zeng et al., “Polydimethlysiloxane microlens arrays fabricated through liquid-phase
photopolymerization and molding”, IEEE/ASME JMEMS 17, 1210 (2008). [202] G.H. Feng and Y.C. Chou, “An eyeball-like biconvex/meniscus lens optical system with
fluidic-controlled focus for tunable lens applications”, Proceedings of Transducers, Denver, CO, USA, p. 2082 (June 2009).
[203] D.W. Lee and Y.H. Cho, “4-bit digital liquid lens for variable focal length”, Proceedings of Transducers 2009, Denver, CO, USA, p.2306 (June 2009).
[204] X. Zeng and H. Jiang, “An endoscope utilizing tunable-focus microlenses actuated through infrared light”, Proceedings of Transducers, Denver, CO, USA, p. 1214 (June 2009).
[205] A. Weber and H. Zappe, “Tunable Pneumatic Microoptics”, IEEE/ASME JMEMS 17, 1218 (2008).
[206] C. Friese and H. Zappe, “Deformable polymer adaptive optical mirrors”, IEEE/ASME JMEMS 17, 11 (2008).
[207] F. Carpi et al., “Electromechanical characterisation of dielectric elastomer planar actuators: comparative evaluation of different electrode materials and different counterloads,” Sensors and Actuators A: Physical 107, 85 (2003).
[208] R. Pelrine, R. Kornbluh, Q. Pei, J. Joseph,“High-speed electrically actuated elastomers with strain greater than 100%”, Science 287, 836 (2000).
[209] R. Kornbluh et al., "Electrostrictive polymer artificial muscle actuators", Proceedings of IEEE Intl. Conference on Robotics and Automation 3, 2147 (1998).
[210] S. Rosset et al. “Ion-implanted compliant and patternable electrodes for miniaturized dielectric elastomer actuators”, Proc. of SPIE Vol. 6927 (2008).
183
15. Curriculum Vitae
Muhamed NIKLAUS
Born 27.07.1978 Swiss citizen
Married [email protected]
3 children
Education
Doctoral School of the Ecole Polytechnique Fédérale 2006 - 2010
de Lausanne (EPFL), Microsystems and –electronics program
Master of Science in Physics (EPFL) 2000 - 2006
Postgraduate course: Industrial Applications of Biotechnology 2004 - 2005
Federal Maturity in Science, Deutsches Gymnasium Biel 1995 - 2000
Professional Experience
Research assistant and Ph.D. student at the Institute of 2006 - 2010
Microengineering, EPFL (Prof. Herbert Shea):
Research on characterization and modelling of physical
properties of metal ion implanted polymers.
Research assistant at the Physical Institute of Complex Matter, 2005 - 2006
EPFL (Prof. Giovanni Dietler): (4 months)
Master thesis on Scaling Properties of DNA analyzed by AFM.
Semester projects at the Integrative Bioscience Institute, EPFL 2004 - 2005
(Prof. Florian Wurm):
184
Proposal of a method for visualization of CHO Cells in PCV. (4 months)
Centrifugation, Sedimentation und Compression of CHO Cells. (4 months)
Practical work at the Chemical Institute ILIS AG, Biel/Bienne 2003
(Dr. Ivan Slacanin): (3 months)
Chemical analyses of natural products und medicaments.
Technical Skills
Programming: C++, Fortran90.
Windows, Linux, Mac, MS Office, Adobe.
Specialized Softwares: Mathematica, Igor, TRIM (Simulation of Ions in Matter).
Clean room standard processing.
Mastery of analytical instruments: SEM, AFM, TEM, XPS, RBS.
Languages
Swiss German: Fluently, written and spoken.
German: Fluently, written and spoken.
French: Fluently, written and spoken.
English: Fluently, written and spoken.
Bosnian (Serbo-Croatian): Mother tongue.
Teaching Activities at EPFL
Supervisor for semester and master students, course-assistant, 2006 - 2010
and expert for oral exams.
Coaching of students and course-assistant. 2001 - 2006
Scientific Exposure
Author of several publications on the subject of ion implanted
electroactive polymers and participant of many conferences.
Member of European Scientific Network for Artificial Muscles.
Related Documents