MARINE ECOLOGY PROGRESS SERIES Mar Ecol Prog Ser Vol. 251: 263–277, 2003 Published April 11 INTRODUCTION Many species of meroplankton, including larvae of marine and anadromous fishes, concentrate in estuar- ies, where there is high productivity and possibly refuge from predation (Day et al. 1989). The spatial distribution of these organisms is shaped by estuarine flow, population-level processes such as mortality, and individual-level processes such as adult spawning and larval behavior. Attention has particularly focused on © Inter-Research 2003 · www.int-res.com *Email: [email protected] Mechanisms promoting upriver transport of larvae of two fish species in the Hudson River estuary Eric T. Schultz 1, *, Kamazima M. M. Lwiza 2 , Megan C. Fencil 1, 3 , Jennifer M. Martin 1, 4 1 Department of Ecology and Evolutionary Biology, University of Connecticut, 75 North Eagleville Road, Storrs, Connecticut 06269-3043, USA 2 Marine Sciences Research Center, State University of New York, Stony Brook, New York 11794-5000, USA 3 Present address: The University of Texas at Austin, Marine Science Institute, 750 Channel View Drive, Port Aransas, Texas 78373-5015, USA 4 Present address: Center for Quantitative Fisheries Ecology, Old Dominion University, Norfolk, Virginia 23529, USA ABSTRACT: Bay anchovy Anchoa mitchilli and naked goby Gobiosoma bosc larvae have been reported to move up-estuary. In the present study, we examined depth preferences and periodic vertical move- ments that might promote such along-estuary transport in these 2 species. We conducted 2 cruises of 3 d each in the Hudson River estuary, USA. The cruises were 1 wk apart, coinciding with spring and neap tides. We sampled every 2 h with an ichthyoplankton trawl to permit tests of time, depth, and lateral position on larval concentration. We also collected data on water-column structure with a CTD, and cur- rent velocity with an acoustic Doppler current profiler (ADCP). We briefly sampled at several sites over a distance of 25 km along the river, and found that larvae of both species were uniformly abundant along this section although salinity decreased sharply with increasing distance upriver. Bay anchovy larvae were more abundant than goby larvae (median concentration 234 vs 6.6 ind. 100 m –3 ). Most sampling was conducted at an oligohaline location (mean salinity = 3 to 5 psu). Larvae were typically more concentrated at greater depths; among anchovy larvae during neap tide conditions, and goby larvae during neap and spring tide conditions, larvae were more concentrated at 6 and 8 m than at the surface by a factor of 2 to 9. Large larvae showed a stronger depth preference than small larvae. During spring tide, the water column was less stratified, and anchovy larvae under these conditions were uniformly distributed vertically. There were slight lateral differences in larval concentration, with fewer larvae in shallow water over the shoals than in similar depths in the main channel. We evaluated periodic cycles in flow and larval dis- tributions via harmonic regression. Tidal constituents of the depth-averaged current flow included the K1 (period = 23.9 h), M2 (period = 12.4 h), and the M4 (period = 6.2 h) tides. Harmonic regression explained > 95% of the observed variability in mean flow. Diel periodicity in depth-averaged larvae con- centration was evident, particularly among large anchovy and goby larvae during neap tide conditions. Larvae were more abundant in the sampled depths at night than during the day by a factor of 3 to 10. There was also diel periodicity in the mean depth of goby larvae, such that larvae were about 2 m shal- lower at night than during the day. There was no periodic variability in the mean depth of anchovy larvae. We suggest that diel periodicity in larval concentration and mean depth reflects diel migration to shallower water at night, noting that temporal variability in net avoidance may also contribute to the periodicity. We conclude that anchovy and goby larvae exhibit a depth distribution and vertical migra- tion behavior that promotes upriver transport. Transport should be most rapid during neap tide periods. KEY WORDS: Estuaries · Selective tidal-stream transport · Fish larvae · Engraulidae · Gobiidae Resale or republication not permitted without written consent of the publisher

Welcome message from author
This document is posted to help you gain knowledge. Please leave a comment to let me know what you think about it! Share it to your friends and learn new things together.
Transcript
MARINE ECOLOGY PROGRESS SERIESMar Ecol Prog Ser
Vol. 251: 263–277, 2003 Published April 11
INTRODUCTION
Many species of meroplankton, including larvae ofmarine and anadromous fishes, concentrate in estuar-ies, where there is high productivity and possibly
refuge from predation (Day et al. 1989). The spatialdistribution of these organisms is shaped by estuarineflow, population-level processes such as mortality, andindividual-level processes such as adult spawning andlarval behavior. Attention has particularly focused on
© Inter-Research 2003 · www.int-res.com*Email: [email protected]
Mechanisms promoting upriver transport of larvaeof two fish species in the Hudson River estuary
Eric T. Schultz1,*, Kamazima M. M. Lwiza2, Megan C. Fencil1, 3, Jennifer M. Martin1, 4
1Department of Ecology and Evolutionary Biology, University of Connecticut, 75 North Eagleville Road, Storrs, Connecticut 06269-3043, USA
2Marine Sciences Research Center, State University of New York, Stony Brook, New York 11794-5000, USA
3Present address: The University of Texas at Austin, Marine Science Institute, 750 Channel View Drive, Port Aransas, Texas 78373-5015, USA
4Present address: Center for Quantitative Fisheries Ecology, Old Dominion University, Norfolk, Virginia 23529, USA
ABSTRACT: Bay anchovy Anchoa mitchilli and naked goby Gobiosoma bosc larvae have been reportedto move up-estuary. In the present study, we examined depth preferences and periodic vertical move-ments that might promote such along-estuary transport in these 2 species. We conducted 2 cruises of 3 deach in the Hudson River estuary, USA. The cruises were 1 wk apart, coinciding with spring and neaptides. We sampled every 2 h with an ichthyoplankton trawl to permit tests of time, depth, and lateralposition on larval concentration. We also collected data on water-column structure with a CTD, and cur-rent velocity with an acoustic Doppler current profiler (ADCP). We briefly sampled at several sites overa distance of 25 km along the river, and found that larvae of both species were uniformly abundant alongthis section although salinity decreased sharply with increasing distance upriver. Bay anchovy larvaewere more abundant than goby larvae (median concentration 234 vs 6.6 ind. 100 m–3). Most sampling wasconducted at an oligohaline location (mean salinity = 3 to 5 psu). Larvae were typically more concentratedat greater depths; among anchovy larvae during neap tide conditions, and goby larvae during neap andspring tide conditions, larvae were more concentrated at 6 and 8 m than at the surface by a factor of 2 to 9.Large larvae showed a stronger depth preference than small larvae. During spring tide, the water columnwas less stratified, and anchovy larvae under these conditions were uniformly distributed vertically.There were slight lateral differences in larval concentration, with fewer larvae in shallow water over theshoals than in similar depths in the main channel. We evaluated periodic cycles in flow and larval dis-tributions via harmonic regression. Tidal constituents of the depth-averaged current flow included theK1 (period = 23.9 h), M2 (period = 12.4 h), and the M4 (period = 6.2 h) tides. Harmonic regressionexplained >95% of the observed variability in mean flow. Diel periodicity in depth-averaged larvae con-centration was evident, particularly among large anchovy and goby larvae during neap tide conditions.Larvae were more abundant in the sampled depths at night than during the day by a factor of 3 to 10.There was also diel periodicity in the mean depth of goby larvae, such that larvae were about 2 m shal-lower at night than during the day. There was no periodic variability in the mean depth of anchovy larvae.We suggest that diel periodicity in larval concentration and mean depth reflects diel migration toshallower water at night, noting that temporal variability in net avoidance may also contribute to theperiodicity. We conclude that anchovy and goby larvae exhibit a depth distribution and vertical migra-tion behavior that promotes upriver transport. Transport should be most rapid during neap tide periods.
KEY WORDS: Estuaries · Selective tidal-stream transport · Fish larvae · Engraulidae · Gobiidae
Resale or republication not permitted without written consent of the publisher
Mar Ecol Prog Ser 251: 263–277, 2003
how larval behaviors, especially depth preferences andperiodic vertical movements, may promote up-estuaryadvection or at least retention in the estuary despitemean seaward flow. We are conducting ongoingresearch on the larval bay anchovy Anchoa mitchilliand the naked goby Gobiosoma bosc in the HudsonRiver estuary with the ultimate goal of predictingalong-estuary movements of larvae based on knowl-edge of larval behavior and estuarine dynamics. In thisstudy we examined larval depth preferences and verti-cal migration patterns.
Efforts to build predictive models of larval distribu-tion must consider several important influences onalong-estuary movement. Previous work has focusedon larval depth distribution; because estuarine flowhas relatively high vertical shear, along-estuary advec-tion will be sensitive to vertical position. Up-estuarytransport is promoted by larval preference for deeperwater, possibly in combination with a migration intoshallower waters during flood tides (referred to asselective tidal stream transport: reviews by Norcross &Shaw 1984 and Boehlert & Mundy 1988; recent find-ings include those of Rowe & Epifanio 1994, Yamashitaet al. 1996, Forward et al. 1999, Jager 1999, Welch etal. 1999, and Grioche et al. 2000). Diel vertical migra-tion can also influence advection (Hill 1991). Thepotential impact of lateral position should be evaluated(e.g. Weinstein et al. 1980, Melville-Smith et al. 1981,Holt et al. 1989, Forward et al. 1999), because along-river flow can have pronounced lateral variability,depending on bathymetry and mixing (Wong 1994,Valle-Levinson & Lwiza 1995, Kasai et al. 2000). Onto-genetic effects on larval depth distributions and migra-tion must also be considered (Fortier & Leggett 1983,Holt et al. 1989, Laprise & Dodson 1989, Rowe & Epi-fanio 1994). Sensory faculties and swimming capabili-ties change dramatically during larval development,and may be expected to affect the distribution of larvaein the water column. A factor that seems to have beengenerally overlooked in studies of estuarine transportis the impact of the spring–neap tidal cycle on verticalmixing. It is well known that stratification tends tobreak down during spring tide conditions because ofturbulent mixing (Webb & D’Elia 1980, Geyer 1995,Peters 1997). Stratification of larvae that is engenderedby depth preference or a habit of vertical migrationmay relax under these conditions as well.
Larval bay anchovy and naked goby are apparentlyretained in estuaries, and possibly advected up-estuary, but how this distribution comes about is poorlyunderstood. The bay anchovy is an estuarine-marinespecies. After overwintering in waters of the continen-tal shelf, adult anchovy concentrate inshore to spawnin estuaries (Vouglitois et al. 1987), with peak spawn-ing occurring in mesohaline water of 13 to 15 psu
(Dovel 1971, 1981). Larvae and young juveniles areextremely abundant in eastern North American estu-aries (McHugh 1967) and play an important role infood-web dynamics in these systems (Baird & Ulano-wicz 1989). Young-of-the-year Anchoa mitchilli arecommon in low-salinity waters up-estuary from re-gions where spawning occurs, suggesting that younganchovy have some means of directed transport (Dovel1981, Loos & Perry 1991, Kimura et al. 2000). Thenaked goby Gobiosoma bosc is an estuarine-residentfish, whose eggs are attached to the inside of hingedoyster shells and guarded by males (Wang & Kernehan1979). After hatching, the larvae move upriver untilthey reach 12 to 15 mm in length and settle to a benthichabitat (Massman et al. 1963, Shenker et al. 1983).
There has been 1 previous effort to determinewhether periodic vertical movements and/or depthpreferences promote along-estuary transport of larvalbay anchovy in the Hudson River estuary (Schultz etal. 2000). That study was designed to account for bothlocal short-term changes (i.e. within a flood–ebb tidalcycle) in the vertical distribution of larvae, as well asalong-river changes in distribution over longer time-scales (i.e. weeks), using a single research vessel. Itwas evident that the 12.5 h periods of sampling at anyone location were too brief to accurately characterizelocal temporal influences on larval abundance.
The study reported herein incorporated several sig-nificant modifications from the previous work. Thepresent study was designed with longer intervals ofvessel-based continuous sampling at a single site inthe oligohaline portion of the river, where larval abun-dance is high. The high abundance of larvae and therarity of eggs in this portion of the river and furtherupriver (Haverstraw Bay: see Dovel 1981, Schmidt1992, Schultz et al. 2000) indicates that transport oflarvae is likely. We timed the 2 sampling intervals(roughly 3 d each) to coincide with spring and neaptidal phases. We sampled larvae in specific depthlayers in the main channel and over the shoals on eachside of the river. We included brief intervals of sam-pling at sites upriver and downriver of our main site toenable us to characterize the along-river gradient inlarval concentration. Along-river gradients can have apronounced effect on local fluctuations in larval abun-dance, as water is driven back and forth along the riverin tidal excursions (Fortier & Leggett 1983, Schultz etal. 2000). We also tested whether spatial and temporalinfluences on larval concentration vary ontogeneti-cally. In addition to the predictions regarding deptheffects and tidal effects, we hypothesized that therewould be lateral differences in concentration (coincid-ing with lateral shifts in tidal flow) and ontogeneticchange, reflecting the greater swimming abilities oflarger larvae. Sampling also included detailed current
264
Schultz et al.: Larval transport in estuaries
profiling. We present a summary of the temporal vari-ability in flow here, so that the periodicity in larval dis-tribution can be referenced to tidal flow. In futurereports the larval data will be combined with a moredetailed flow characterization to project the rate ofalong-river larval transport.
MATERIALS AND METHODS
The sampling program was designed to furnishinformation on temporal variability in larval anchovyconcentrations, water-column structure, and depth-specific flow at a single site on the river. Two cruiseswere conducted from the RV ‘Onrust’ (State Universityof New York). The first cruise (Cruise 1998-C1; abbre-viated henceforth as Cruise 1) lasted about 3 d, and thesecond (Cruise 1998-C2: Cruise 2) about 3.5 d, with a2.5 d gap between cruises. The first cruise was con-ducted during a spring tide, and the second cruise dur-ing a neap tide.
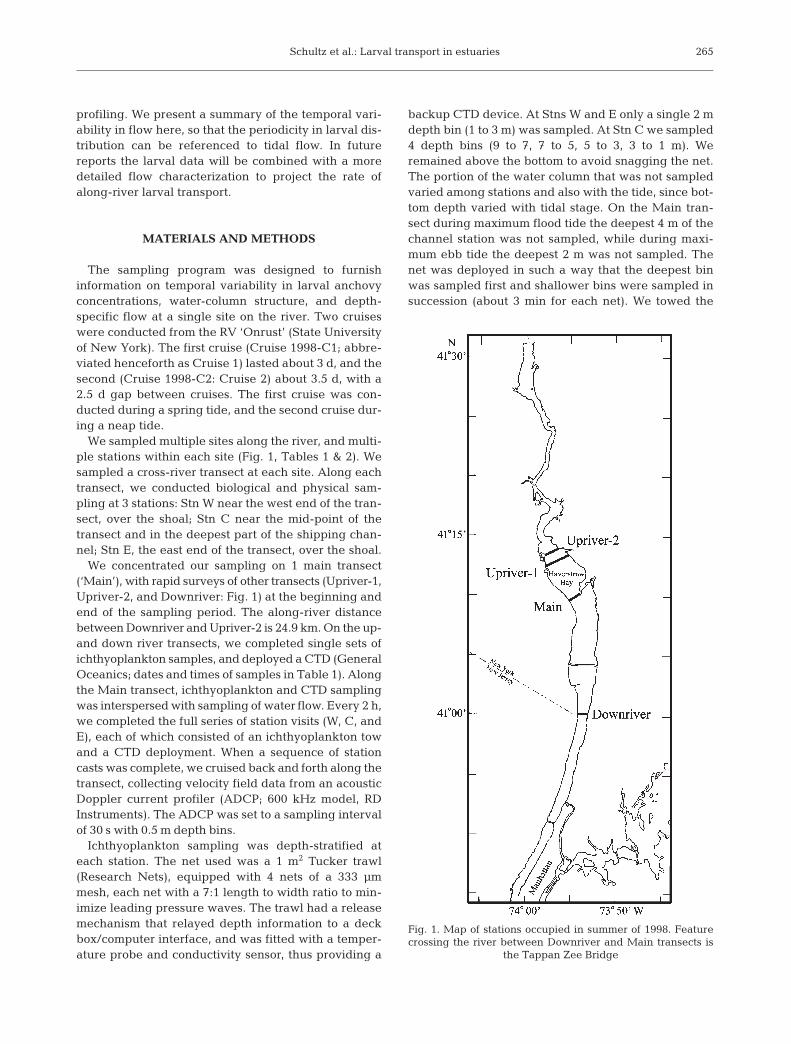
We sampled multiple sites along the river, and multi-ple stations within each site (Fig. 1, Tables 1 & 2). Wesampled a cross-river transect at each site. Along eachtransect, we conducted biological and physical sam-pling at 3 stations: Stn W near the west end of the tran-sect, over the shoal; Stn C near the mid-point of thetransect and in the deepest part of the shipping chan-nel; Stn E, the east end of the transect, over the shoal.
We concentrated our sampling on 1 main transect(‘Main’), with rapid surveys of other transects (Upriver-1,Upriver-2, and Downriver: Fig. 1) at the beginning andend of the sampling period. The along-river distancebetween Downriver and Upriver-2 is 24.9 km. On the up-and down river transects, we completed single sets ofichthyoplankton samples, and deployed a CTD (GeneralOceanics; dates and times of samples in Table 1). Alongthe Main transect, ichthyoplankton and CTD samplingwas interspersed with sampling of water flow. Every 2 h,we completed the full series of station visits (W, C, andE), each of which consisted of an ichthyoplankton towand a CTD deployment. When a sequence of stationcasts was complete, we cruised back and forth along thetransect, collecting velocity field data from an acousticDoppler current profiler (ADCP; 600 kHz model, RDInstruments). The ADCP was set to a sampling intervalof 30 s with 0.5 m depth bins.
Ichthyoplankton sampling was depth-stratified ateach station. The net used was a 1 m2 Tucker trawl(Research Nets), equipped with 4 nets of a 333 µmmesh, each net with a 7:1 length to width ratio to min-imize leading pressure waves. The trawl had a releasemechanism that relayed depth information to a deckbox/computer interface, and was fitted with a temper-ature probe and conductivity sensor, thus providing a
backup CTD device. At Stns W and E only a single 2 mdepth bin (1 to 3 m) was sampled. At Stn C we sampled4 depth bins (9 to 7, 7 to 5, 5 to 3, 3 to 1 m). Weremained above the bottom to avoid snagging the net.The portion of the water column that was not sampledvaried among stations and also with the tide, since bot-tom depth varied with tidal stage. On the Main tran-sect during maximum flood tide the deepest 4 m of thechannel station was not sampled, while during maxi-mum ebb tide the deepest 2 m was not sampled. Thenet was deployed in such a way that the deepest binwas sampled first and shallower bins were sampled insuccession (about 3 min for each net). We towed the
265
Fig. 1. Map of stations occupied in summer of 1998. Featurecrossing the river between Downriver and Main transects is
the Tappan Zee Bridge
Mar Ecol Prog Ser 251: 263–277, 2003
net in an along-river direction. Flow-meter readingswere used to estimate sample volume, which wason average 133 m3 per net. Once the trawl wasretrieved, the ichthyoplankton samples were pre-served in ethanol.
Larvae were identified and counted. Samplesappearing to have >500 anchovy larvae were split forenumeration, but the entire samples were used forenumeration of goby larvae. Larval counts for eachsample were converted to concentration estimates(ind. per 100 m3). For statistical analysis, concentrationwas transformed as log10(concentration + 1). We madeno corrections for escapement.
Larval lengths were measured for up to 50 individu-als selected randomly from each sample. If fewer than50 individuals were in the sample, we measured themall. We measured larvae smaller than ca. 18 mm usingan image-analysis system (Optimas Version 6.1) con-figured to interface with a dissecting microscope at8× magnification (actual magnification on the com-puter monitor: 15×). Larger larvae were measured withcalipers to the nearest 0.1 mm. The abundance of eachsize class of larvae was estimated by multiplying a col-umn vector containing size-class frequencies in themeasured subsample by the total concentration of
larvae in the sample. Length data in the present paperare uncorrected for shrinkage.
We conducted analyses of mean salinity among thedifferent sites along the river, and mean salinity as afunction of depth at Main. Salinity profiles were aver-aged in 2 m depth bins, to correspond to larval sam-pling. Analysis of the CTD data from the second cruisesuggested that the instrument was malfunctioning. Wetherefore used data from the sensor on the TuckerTrawl release mechanism for the second cruise.
We conducted a principal components analysis(PCA) to simplify analysis of ontogenetic changes inbehavior and distribution. The size-class limits weused differed between species (Anchoa mitchilli: ≤8,10, 12, 14, and ≥16 mm; Gobiosoma bosc: ≤4, 5, 6, and7 mm). PCA was conducted on the covariance matrix ofabundance-by-size among samples. The eigenvectorsof the component axes that explained a significantamount of variation in the dataset (up to 80% of thetotal variation) summarized variation in abundance-by-size. We conducted separate analyses for eachcruise, so that the differences in size among samples inan analysis would not be magnified by seasonal sizeincreases. We grouped larvae into 2 sizes (small andlarge) as the result of this analysis (see ‘Results’).
266
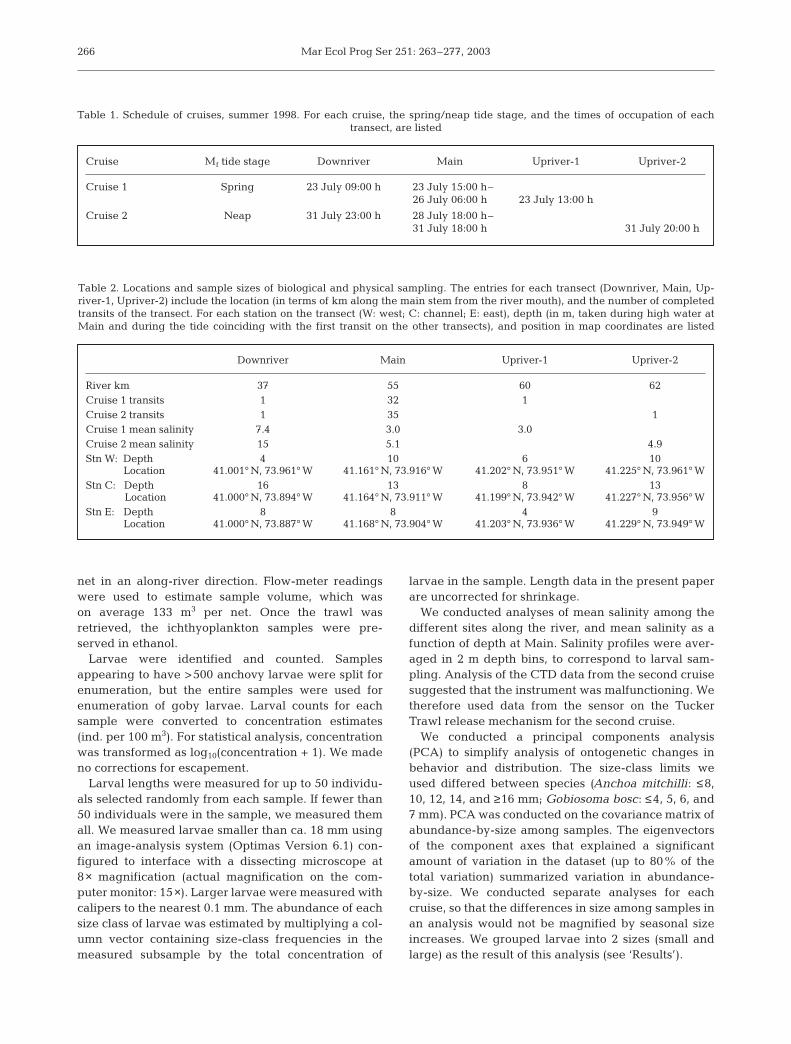
Cruise Mf tide stage Downriver Main Upriver-1 Upriver-2
Cruise 1 Spring 23 July 09:00 h –23 July 15:00 h–26 July 06:00 h 23 July 13:00 h
Cruise 2 Neap 31 July 23:00 h –28 July 18:00 h–31 July 18:00 h 31 July 20:00 h
Table 1. Schedule of cruises, summer 1998. For each cruise, the spring/neap tide stage, and the times of occupation of each transect, are listed
Downriver Main Upriver-1 Upriver-2
River km 37 55 60 62Cruise 1 transits 1 32 1Cruise 2 transits 1 35 1Cruise 1 mean salinity 7.4 3.0 3.0Cruise 2 mean salinity 15 5.1 4.9Stn W: Depth 4 10 6 10
Location 41.001° N, 73.961° W 41.161° N, 73.916° W 41.202° N, 73.951° W 41.225° N, 73.961° WStn C: Depth 16 13 8 13
Location 41.000° N, 73.894° W 41.164° N, 73.911° W 41.199° N, 73.942° W 41.227° N, 73.956° WStn E: Depth 8 8 4 9
Location 41.000° N, 73.887° W 41.168° N, 73.904° W 41.203° N, 73.936° W 41.229° N, 73.949° W
Table 2. Locations and sample sizes of biological and physical sampling. The entries for each transect (Downriver, Main, Up-river-1, Upriver-2) include the location (in terms of km along the main stem from the river mouth), and the number of completedtransits of the transect. For each station on the transect (W: west; C: channel; E: east), depth (in m, taken during high water atMain and during the tide coinciding with the first transit on the other transects), and position in map coordinates are listed
Schultz et al.: Larval transport in estuaries
We evaluated along-river patterns of salinity andlarvae, and the lateral and vertical distribution pattern ofsalinity and larvae at Main. Along-river patterns wereevaluated as a 1-way analysis of variance, treating tran-sect location as a classification variable. For the analysisof salinity and larvae at Main, the depth–station combi-nation was treated as a classification variable with 6levels (‘bins’: Stns E, W, C; with 4 depths at C), and sizeof larvae was treated as a 2-level classification. Salinitypatterns were tested in a 1-way analysis of variance.Larval distribution patterns were tested initially as a2-way analysis of variance. In the event that the distrib-ution across bins differed between size classes (i.e. sig-nificant size × bin interaction), we conducted separatetests of the bin effect on each size class; otherwise wetested for a bin effect on total concentration of larvae.
We used harmonic regression (Bliss 1958, McLellan1965, Batschelet 1979) to fit periodic changes in currentvelocity, larval concentration, and mean larval depth atthe Main transect. Analyses of temporal variability wereconfined to the channel samples. To identify the periodicchanges in current velocity, we conducted harmonicregression on the mean current velocity over the watercolumn. To identify the periodic changes in larval abun-dance and distribution, we conducted harmonic regres-sion on 2 summary variables: (1) larval concentration, asthe mean over all 4 depth bins for each tow; (2) meandepth of larvae (formula in Appendix 1). Mean larvalconcentration changes periodically to the extent thatlarvae migrate into and out of the depth range sampledby our trawl (and also changes with avoidance behavior:see ‘Discussion’). Mean depth changes periodically tothe extent that vertical migration affects the depth dis-tribution within the depth range sampled by our trawl.Either variable alone, or both variables, will changeperiodically if there is vertical migration of larvae.
The statistical model tested for day-to-day changesand 3 tidal constituents: K1, M2, and M4 (Timeperiods = 23.9, 12.4, and 6.2 h, respectively; Pugh 1987).Appendix 2 (regression model construction) describeshow periodic variables were formulated. We evaluatedthe contribution of the M6 component (time period =4.1 h) in preliminary analyses, but subsequently elimi-nated it because it had no explanatory power. Separateanalyses were conducted for each cruise. Day-to-daychanges were included in the regression models using2 variables representing first-order (date, in seconds)and second-order (date2) effects. Collinearity betweenthese 2 variables was eliminated by centering date (i.e.by standardizing as the difference from the mean timeof the cruise) before date2 was calculated. In these shorttime series, K1 tidal constituent effects and diel effects(time period = 24 h) have been aliased, and we havetreated the K1 effects on larval concentration and depthas representative of day/night changes. We report the
estimates of slope for the day-to-day changes, and am-plitude and phase angle for the tidal constituents, ifthey were nominally significant (p < 0.05) based onStudent’s t-tests. We have also corrected for overesti-mates of significance stemming from multiple testingvia a stepwise Bonferroni procedure (Rice 1989).
We tested for an association between current veloc-ity and larval catch features, as predicted by the selec-tive tidal-stream transport model. We tested for aneffect of current on both larval abundance and meandepth, in each case via bivariate regression; along-channel current velocity was the predictor.
Statistical analyses were conducted using Proc GLMand Proc Reg in PC-SAS (Release 8.0, running inMicrosoft Windows Version 4.0.95; © SAS Institute,and Microsoft Corporation).
RESULTS
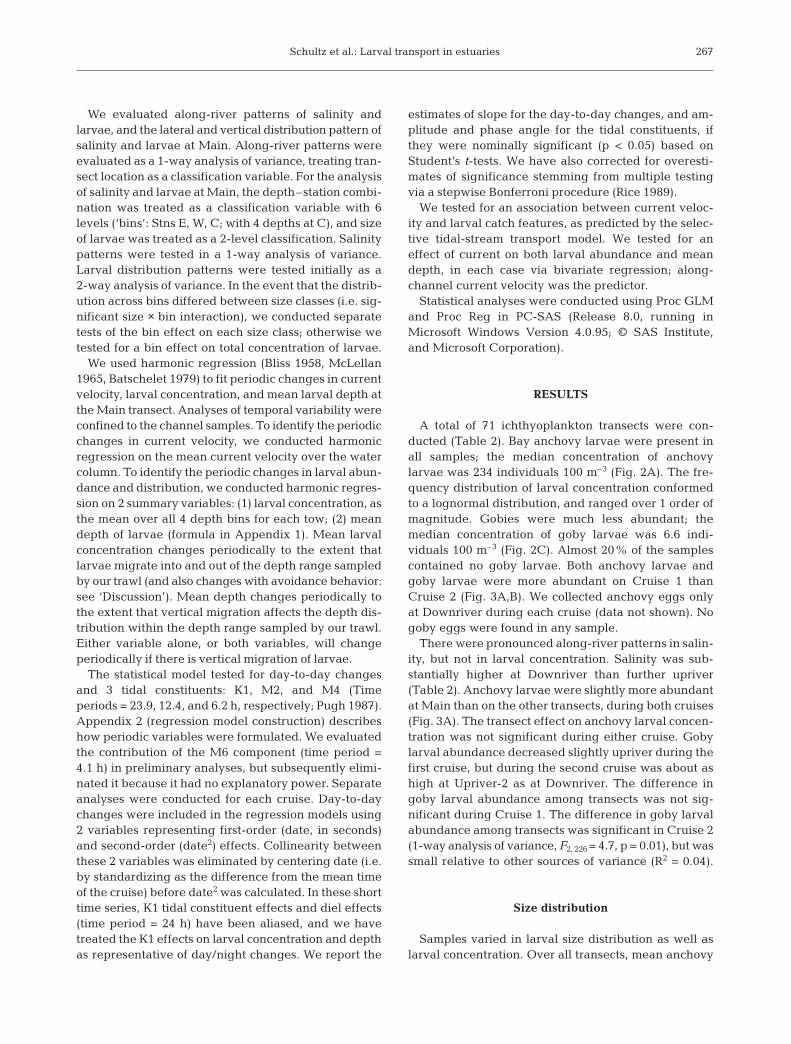
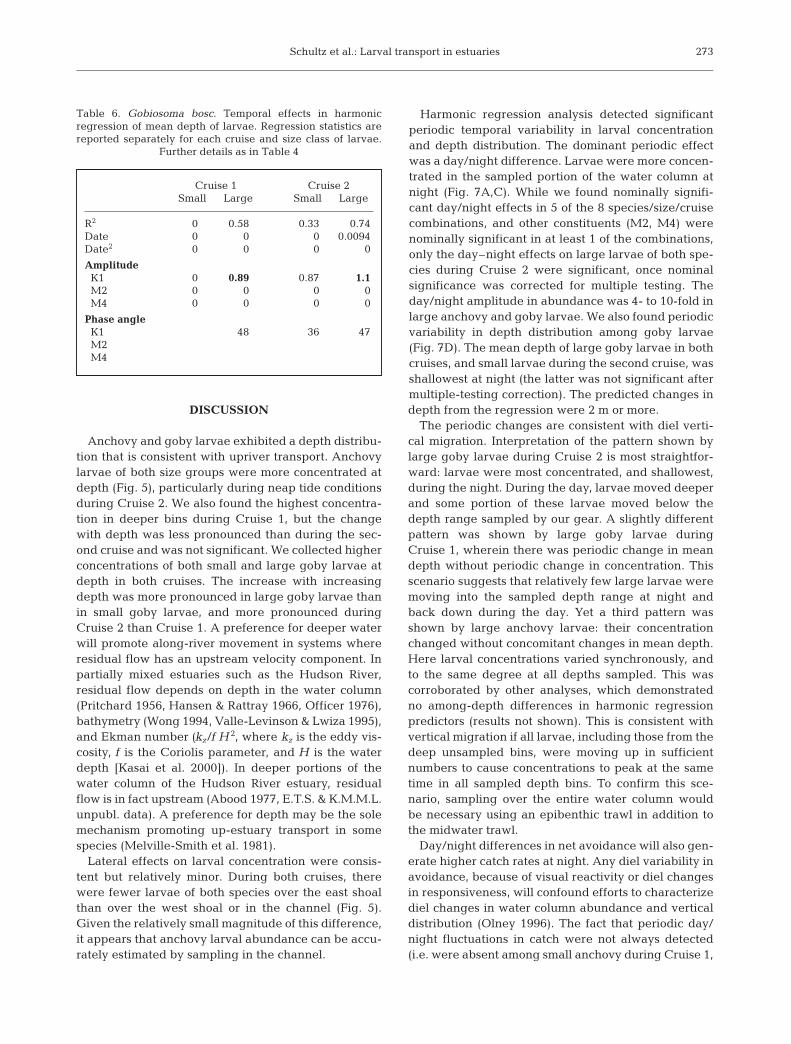
A total of 71 ichthyoplankton transects were con-ducted (Table 2). Bay anchovy larvae were present inall samples; the median concentration of anchovylarvae was 234 individuals 100 m–3 (Fig. 2A). The fre-quency distribution of larval concentration conformedto a lognormal distribution, and ranged over 1 order ofmagnitude. Gobies were much less abundant; themedian concentration of goby larvae was 6.6 indi-viduals 100 m–3 (Fig. 2C). Almost 20% of the samplescontained no goby larvae. Both anchovy larvae andgoby larvae were more abundant on Cruise 1 thanCruise 2 (Fig. 3A,B). We collected anchovy eggs onlyat Downriver during each cruise (data not shown). Nogoby eggs were found in any sample.
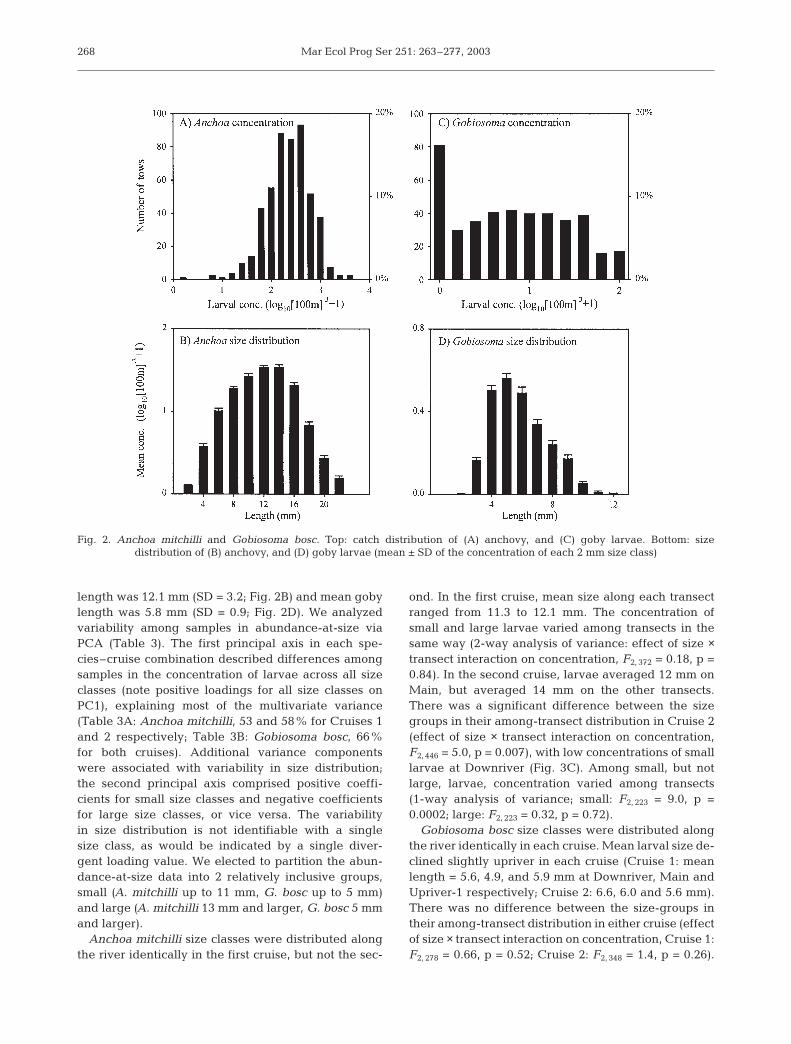
There were pronounced along-river patterns in salin-ity, but not in larval concentration. Salinity was sub-stantially higher at Downriver than further upriver(Table 2). Anchovy larvae were slightly more abundantat Main than on the other transects, during both cruises(Fig. 3A). The transect effect on anchovy larval concen-tration was not significant during either cruise. Gobylarval abundance decreased slightly upriver during thefirst cruise, but during the second cruise was about ashigh at Upriver-2 as at Downriver. The difference ingoby larval abundance among transects was not sig-nificant during Cruise 1. The difference in goby larvalabundance among transects was significant in Cruise 2(1-way analysis of variance, F2, 226 = 4.7, p = 0.01), but wassmall relative to other sources of variance (R2 = 0.04).
Size distribution
Samples varied in larval size distribution as well aslarval concentration. Over all transects, mean anchovy
267
Mar Ecol Prog Ser 251: 263–277, 2003
length was 12.1 mm (SD = 3.2; Fig. 2B) and mean gobylength was 5.8 mm (SD = 0.9; Fig. 2D). We analyzedvariability among samples in abundance-at-size viaPCA (Table 3). The first principal axis in each spe-cies–cruise combination described differences amongsamples in the concentration of larvae across all sizeclasses (note positive loadings for all size classes onPC1), explaining most of the multivariate variance(Table 3A: Anchoa mitchilli, 53 and 58% for Cruises 1and 2 respectively; Table 3B: Gobiosoma bosc, 66%for both cruises). Additional variance componentswere associated with variability in size distribution;the second principal axis comprised positive coeffi-cients for small size classes and negative coefficientsfor large size classes, or vice versa. The variabilityin size distribution is not identifiable with a singlesize class, as would be indicated by a single diver-gent loading value. We elected to partition the abun-dance-at-size data into 2 relatively inclusive groups,small (A. mitchilli up to 11 mm, G. bosc up to 5 mm)and large (A. mitchilli 13 mm and larger, G. bosc 5 mmand larger).
Anchoa mitchilli size classes were distributed alongthe river identically in the first cruise, but not the sec-
ond. In the first cruise, mean size along each transectranged from 11.3 to 12.1 mm. The concentration ofsmall and large larvae varied among transects in thesame way (2-way analysis of variance: effect of size ×transect interaction on concentration, F2, 372 = 0.18, p =0.84). In the second cruise, larvae averaged 12 mm onMain, but averaged 14 mm on the other transects.There was a significant difference between the sizegroups in their among-transect distribution in Cruise 2(effect of size × transect interaction on concentration,F2, 446 = 5.0, p = 0.007), with low concentrations of smalllarvae at Downriver (Fig. 3C). Among small, but notlarge, larvae, concentration varied among transects(1-way analysis of variance; small: F2, 223 = 9.0, p =0.0002; large: F2, 223 = 0.32, p = 0.72).
Gobiosoma bosc size classes were distributed alongthe river identically in each cruise. Mean larval size de-clined slightly upriver in each cruise (Cruise 1: meanlength = 5.6, 4.9, and 5.9 mm at Downriver, Main andUpriver-1 respectively; Cruise 2: 6.6, 6.0 and 5.6 mm).There was no difference between the size-groups intheir among-transect distribution in either cruise (effectof size × transect interaction on concentration, Cruise 1:F2, 278 = 0.66, p = 0.52; Cruise 2: F2, 348 = 1.4, p = 0.26).
268
Fig. 2. Anchoa mitchilli and Gobiosoma bosc. Top: catch distribution of (A) anchovy, and (C) goby larvae. Bottom: size distribution of (B) anchovy, and (D) goby larvae (mean ± SD of the concentration of each 2 mm size class)
Schultz et al.: Larval transport in estuaries
Lateral and vertical distribution of salinity and larvae
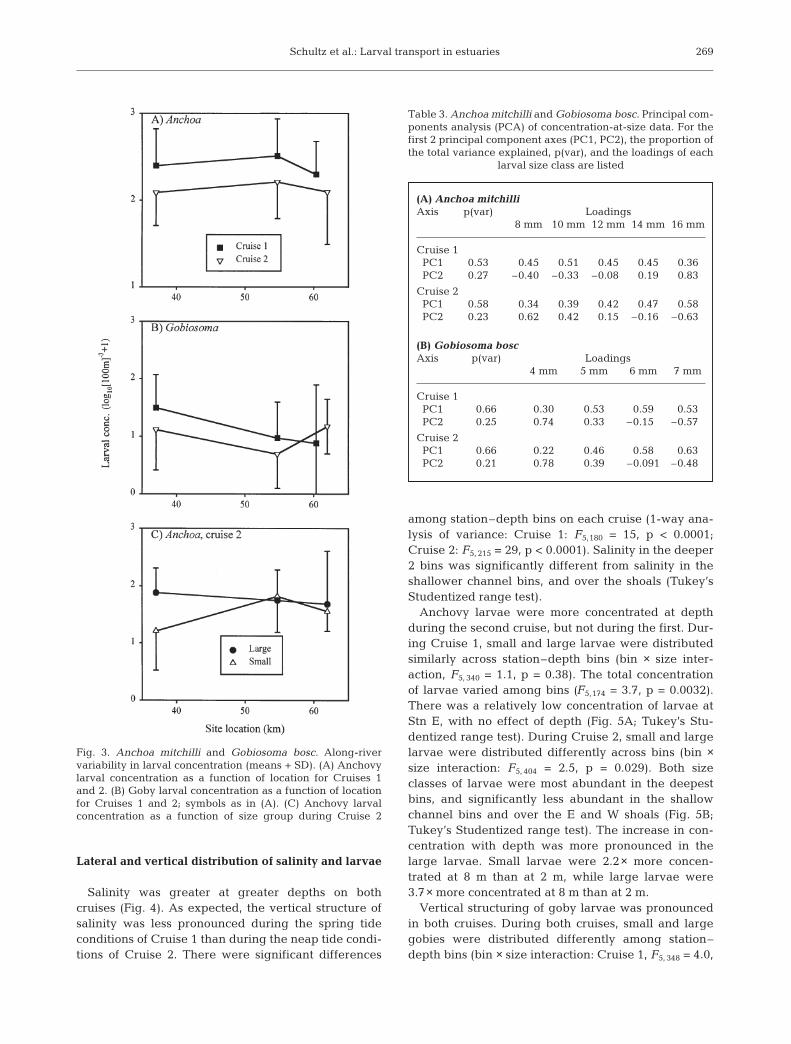
Salinity was greater at greater depths on bothcruises (Fig. 4). As expected, the vertical structure ofsalinity was less pronounced during the spring tideconditions of Cruise 1 than during the neap tide condi-tions of Cruise 2. There were significant differences
among station–depth bins on each cruise (1-way ana-lysis of variance: Cruise 1: F5,180 = 15, p < 0.0001;Cruise 2: F5, 215 = 29, p < 0.0001). Salinity in the deeper2 bins was significantly different from salinity in theshallower channel bins, and over the shoals (Tukey’sStudentized range test).
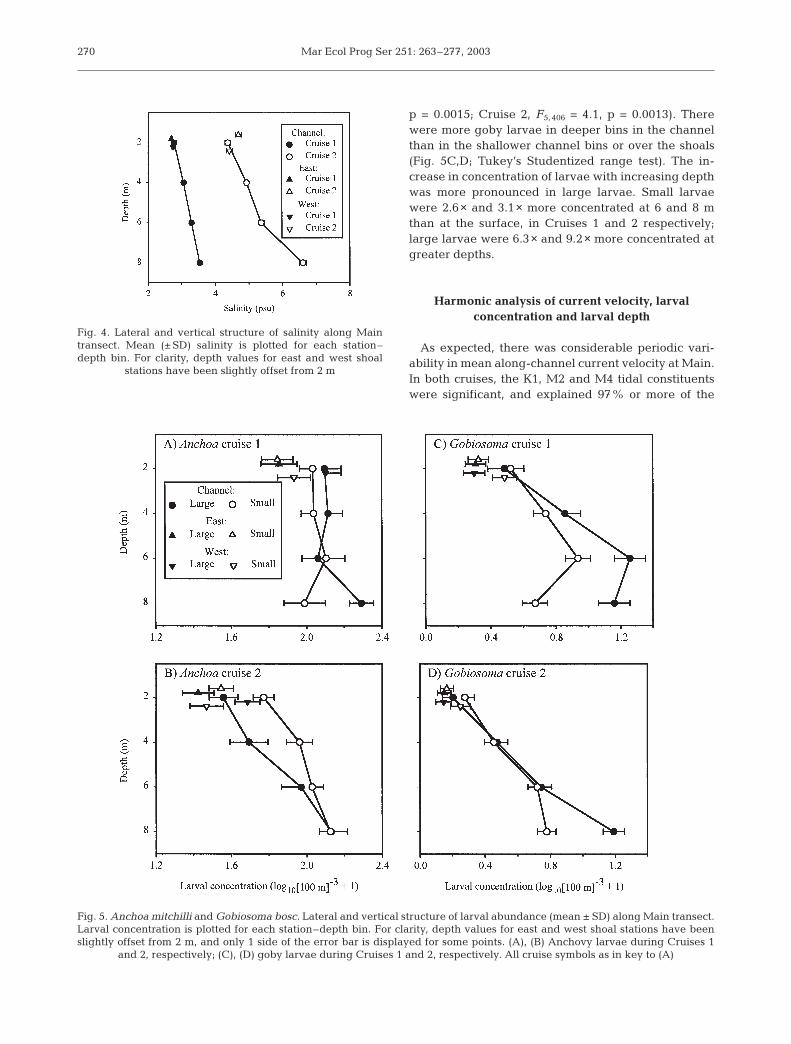
Anchovy larvae were more concentrated at depthduring the second cruise, but not during the first. Dur-ing Cruise 1, small and large larvae were distributedsimilarly across station–depth bins (bin × size inter-action, F5, 340 = 1.1, p = 0.38). The total concentrationof larvae varied among bins (F5,174 = 3.7, p = 0.0032).There was a relatively low concentration of larvae atStn E, with no effect of depth (Fig. 5A; Tukey’s Stu-dentized range test). During Cruise 2, small and largelarvae were distributed differently across bins (bin ×size interaction: F5, 404 = 2.5, p = 0.029). Both sizeclasses of larvae were most abundant in the deepestbins, and significantly less abundant in the shallowchannel bins and over the E and W shoals (Fig. 5B;Tukey’s Studentized range test). The increase in con-centration with depth was more pronounced in thelarge larvae. Small larvae were 2.2× more concen-trated at 8 m than at 2 m, while large larvae were3.7× more concentrated at 8 m than at 2 m.
Vertical structuring of goby larvae was pronouncedin both cruises. During both cruises, small and largegobies were distributed differently among station–depth bins (bin × size interaction: Cruise 1, F5, 348 = 4.0,
269
Fig. 3. Anchoa mitchilli and Gobiosoma bosc. Along-rivervariability in larval concentration (means + SD). (A) Anchovylarval concentration as a function of location for Cruises 1and 2. (B) Goby larval concentration as a function of locationfor Cruises 1 and 2; symbols as in (A). (C) Anchovy larvalconcentration as a function of size group during Cruise 2
(A) Anchoa mitchilliAxis p(var) Loadings
8 mm 10 mm 12 mm 14 mm 16 mm
Cruise 1PC1 0.53 0.45 0.51 0.45 0.45 0.36PC2 0.27 –0.40– –0.33– –0.08– 0.19 0.83
Cruise 2PC1 0.58 0.34 0.39 0.42 0.47 0.58PC2 0.23 0.62 0.42 0.15 –0.16– –0.63–
(B) Gobiosoma boscAxis p(var) Loadings
4 mm 5 mm 6 mm 7 mm
Cruise 1PC1 0.66 0.30 0.53 0.59 0.53PC2 0.25 0.74 0.33 –0.15– –0.57–
Cruise 2PC1 0.66 0.22 0.46 0.58 0.63PC2 0.21 0.78 0.39 –0.091 –0.48–
Table 3. Anchoa mitchilli and Gobiosoma bosc. Principal com-ponents analysis (PCA) of concentration-at-size data. For thefirst 2 principal component axes (PC1, PC2), the proportion ofthe total variance explained, p(var), and the loadings of each
larval size class are listed
Mar Ecol Prog Ser 251: 263–277, 2003
p = 0.0015; Cruise 2, F5, 406 = 4.1, p = 0.0013). Therewere more goby larvae in deeper bins in the channelthan in the shallower channel bins or over the shoals(Fig. 5C,D; Tukey’s Studentized range test). The in-crease in concentration of larvae with increasing depthwas more pronounced in large larvae. Small larvaewere 2.6× and 3.1× more concentrated at 6 and 8 mthan at the surface, in Cruises 1 and 2 respectively;large larvae were 6.3× and 9.2× more concentrated atgreater depths.
Harmonic analysis of current velocity, larvalconcentration and larval depth
As expected, there was considerable periodic vari-ability in mean along-channel current velocity at Main.In both cruises, the K1, M2 and M4 tidal constituentswere significant, and explained 97% or more of the
270
Fig. 4. Lateral and vertical structure of salinity along Maintransect. Mean (± SD) salinity is plotted for each station–depth bin. For clarity, depth values for east and west shoal
stations have been slightly offset from 2 m
Fig. 5. Anchoa mitchilli and Gobiosoma bosc. Lateral and vertical structure of larval abundance (mean ± SD) along Main transect.Larval concentration is plotted for each station–depth bin. For clarity, depth values for east and west shoal stations have beenslightly offset from 2 m, and only 1 side of the error bar is displayed for some points. (A), (B) Anchovy larvae during Cruises 1
and 2, respectively; (C), (D) goby larvae during Cruises 1 and 2, respectively. All cruise symbols as in key to (A)
Schultz et al.: Larval transport in estuaries
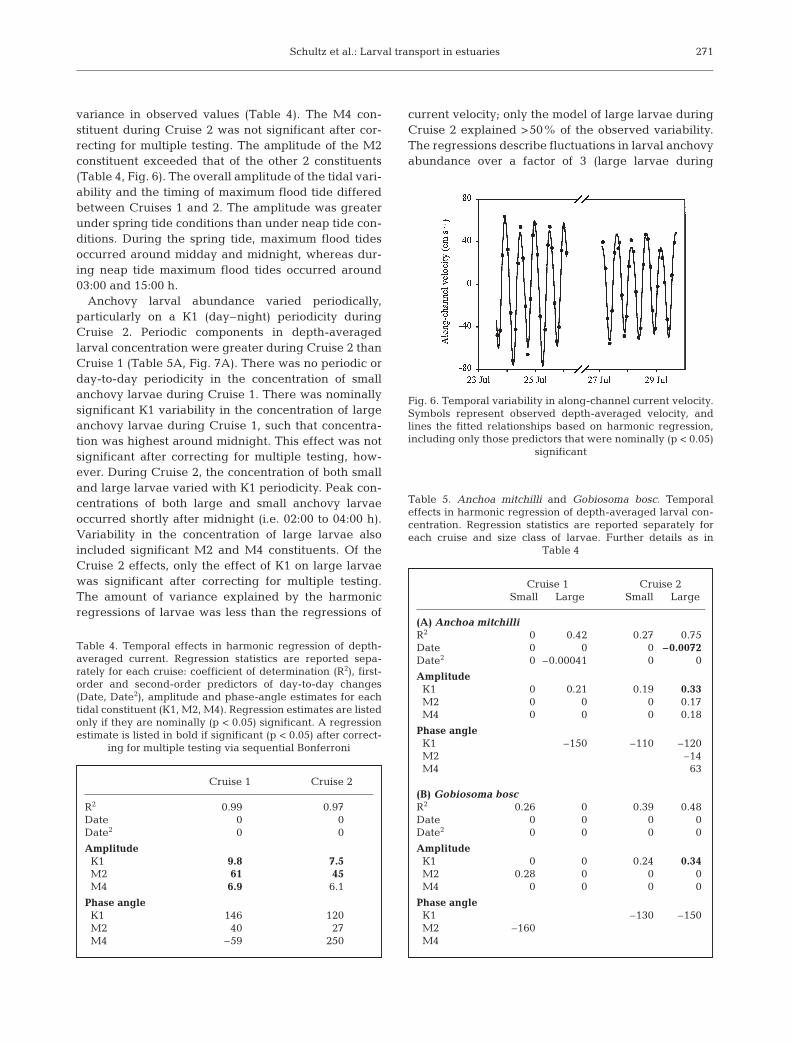
variance in observed values (Table 4). The M4 con-stituent during Cruise 2 was not significant after cor-recting for multiple testing. The amplitude of the M2constituent exceeded that of the other 2 constituents(Table 4, Fig. 6). The overall amplitude of the tidal vari-ability and the timing of maximum flood tide differedbetween Cruises 1 and 2. The amplitude was greaterunder spring tide conditions than under neap tide con-ditions. During the spring tide, maximum flood tidesoccurred around midday and midnight, whereas dur-ing neap tide maximum flood tides occurred around03:00 and 15:00 h.
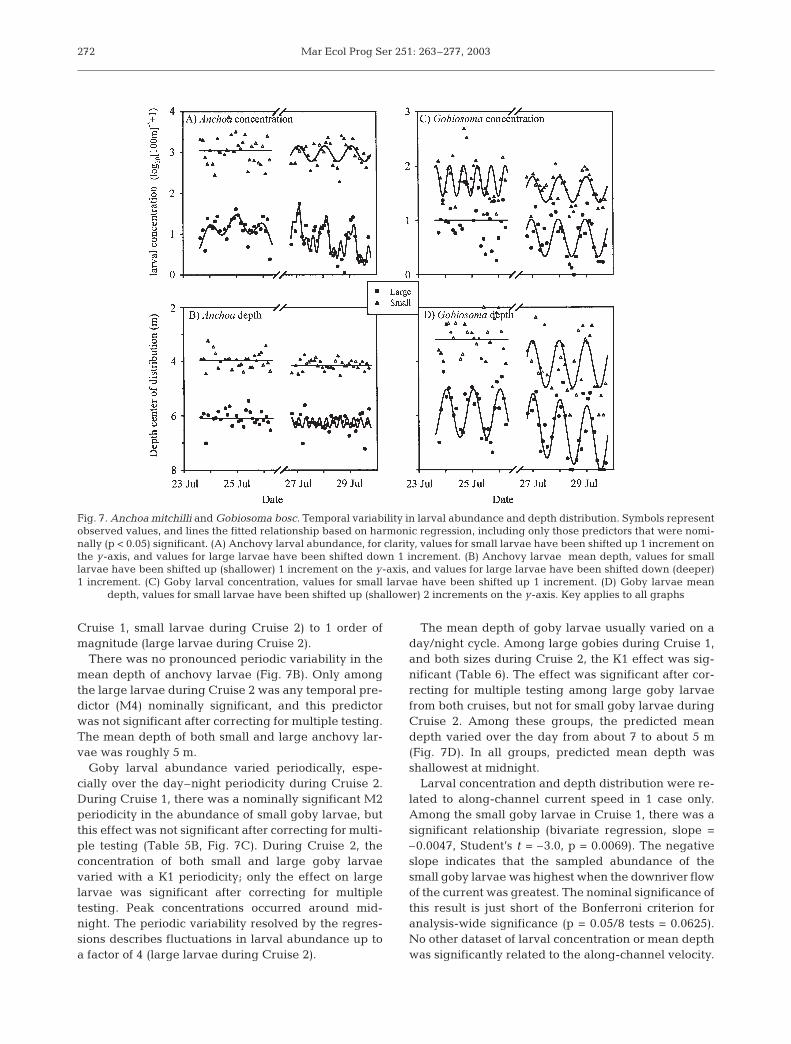
Anchovy larval abundance varied periodically,particularly on a K1 (day–night) periodicity duringCruise 2. Periodic components in depth-averagedlarval concentration were greater during Cruise 2 thanCruise 1 (Table 5A, Fig. 7A). There was no periodic orday-to-day periodicity in the concentration of smallanchovy larvae during Cruise 1. There was nominallysignificant K1 variability in the concentration of largeanchovy larvae during Cruise 1, such that concentra-tion was highest around midnight. This effect was notsignificant after correcting for multiple testing, how-ever. During Cruise 2, the concentration of both smalland large larvae varied with K1 periodicity. Peak con-centrations of both large and small anchovy larvaeoccurred shortly after midnight (i.e. 02:00 to 04:00 h).Variability in the concentration of large larvae alsoincluded significant M2 and M4 constituents. Of theCruise 2 effects, only the effect of K1 on large larvaewas significant after correcting for multiple testing.The amount of variance explained by the harmonicregressions of larvae was less than the regressions of
current velocity; only the model of large larvae duringCruise 2 explained >50% of the observed variability.The regressions describe fluctuations in larval anchovyabundance over a factor of 3 (large larvae during
271
Cruise 1 Cruise 2
R2 0.99 0.97Date 0 0Date2 0 0
AmplitudeK1 9.8 7.5M2 61 45M4 6.9 6.1
Phase angleK1 146 120M2 40 27M4 –59 250
Table 4. Temporal effects in harmonic regression of depth-averaged current. Regression statistics are reported sepa-rately for each cruise: coefficient of determination (R2), first-order and second-order predictors of day-to-day changes(Date, Date2), amplitude and phase-angle estimates for eachtidal constituent (K1, M2, M4). Regression estimates are listedonly if they are nominally (p < 0.05) significant. A regressionestimate is listed in bold if significant (p < 0.05) after correct-
ing for multiple testing via sequential Bonferroni
Fig. 6. Temporal variability in along-channel current velocity.Symbols represent observed depth-averaged velocity, andlines the fitted relationships based on harmonic regression,including only those predictors that were nominally (p < 0.05)
significant
Cruise 1 Cruise 2Small Large Small Large
(A) Anchoa mitchilliR2 0 0.42 0.27 0.75Date 0 0 0 –0.0072Date2 0 –0.00041 0 0
AmplitudeK1 0 0.21 0.19 0.33M2 0 0 0 0.17M4 0 0 0 0.18
Phase angleK1 –150 –110 –120M2 –14M4 63
(B) Gobiosoma boscR2 0.26 0 0.39 0.48Date 0 0 0 0Date2 0 0 0 0
AmplitudeK1 0 0 0.24 0.34M2 0.28 0 0 0M4 0 0 0 0
Phase angleK1 –130 –150M2 –160M4
Table 5. Anchoa mitchilli and Gobiosoma bosc. Temporaleffects in harmonic regression of depth-averaged larval con-centration. Regression statistics are reported separately foreach cruise and size class of larvae. Further details as in
Table 4
Mar Ecol Prog Ser 251: 263–277, 2003
Cruise 1, small larvae during Cruise 2) to 1 order ofmagnitude (large larvae during Cruise 2).
There was no pronounced periodic variability in themean depth of anchovy larvae (Fig. 7B). Only amongthe large larvae during Cruise 2 was any temporal pre-dictor (M4) nominally significant, and this predictorwas not significant after correcting for multiple testing.The mean depth of both small and large anchovy lar-vae was roughly 5 m.
Goby larval abundance varied periodically, espe-cially over the day–night periodicity during Cruise 2.During Cruise 1, there was a nominally significant M2periodicity in the abundance of small goby larvae, butthis effect was not significant after correcting for multi-ple testing (Table 5B, Fig. 7C). During Cruise 2, theconcentration of both small and large goby larvaevaried with a K1 periodicity; only the effect on largelarvae was significant after correcting for multipletesting. Peak concentrations occurred around mid-night. The periodic variability resolved by the regres-sions describes fluctuations in larval abundance up toa factor of 4 (large larvae during Cruise 2).
The mean depth of goby larvae usually varied on aday/night cycle. Among large gobies during Cruise 1,and both sizes during Cruise 2, the K1 effect was sig-nificant (Table 6). The effect was significant after cor-recting for multiple testing among large goby larvaefrom both cruises, but not for small goby larvae duringCruise 2. Among these groups, the predicted meandepth varied over the day from about 7 to about 5 m(Fig. 7D). In all groups, predicted mean depth wasshallowest at midnight.
Larval concentration and depth distribution were re-lated to along-channel current speed in 1 case only.Among the small goby larvae in Cruise 1, there was asignificant relationship (bivariate regression, slope =–0.0047, Student’s t = –3.0, p = 0.0069). The negativeslope indicates that the sampled abundance of thesmall goby larvae was highest when the downriver flowof the current was greatest. The nominal significance ofthis result is just short of the Bonferroni criterion foranalysis-wide significance (p = 0.05/8 tests = 0.0625).No other dataset of larval concentration or mean depthwas significantly related to the along-channel velocity.
272
Fig. 7. Anchoa mitchilli and Gobiosoma bosc. Temporal variability in larval abundance and depth distribution. Symbols representobserved values, and lines the fitted relationship based on harmonic regression, including only those predictors that were nomi-nally (p < 0.05) significant. (A) Anchovy larval abundance, for clarity, values for small larvae have been shifted up 1 increment onthe y-axis, and values for large larvae have been shifted down 1 increment. (B) Anchovy larvae mean depth, values for smalllarvae have been shifted up (shallower) 1 increment on the y-axis, and values for large larvae have been shifted down (deeper)1 increment. (C) Goby larval concentration, values for small larvae have been shifted up 1 increment. (D) Goby larvae mean
depth, values for small larvae have been shifted up (shallower) 2 increments on the y-axis. Key applies to all graphs
Schultz et al.: Larval transport in estuaries
DISCUSSION
Anchovy and goby larvae exhibited a depth distribu-tion that is consistent with upriver transport. Anchovylarvae of both size groups were more concentrated atdepth (Fig. 5), particularly during neap tide conditionsduring Cruise 2. We also found the highest concentra-tion in deeper bins during Cruise 1, but the changewith depth was less pronounced than during the sec-ond cruise and was not significant. We collected higherconcentrations of both small and large goby larvae atdepth in both cruises. The increase with increasingdepth was more pronounced in large goby larvae thanin small goby larvae, and more pronounced duringCruise 2 than Cruise 1. A preference for deeper waterwill promote along-river movement in systems whereresidual flow has an upstream velocity component. Inpartially mixed estuaries such as the Hudson River,residual flow depends on depth in the water column(Pritchard 1956, Hansen & Rattray 1966, Officer 1976),bathymetry (Wong 1994, Valle-Levinson & Lwiza 1995),and Ekman number (kz/f H 2, where kz is the eddy vis-cosity, f is the Coriolis parameter, and H is the waterdepth [Kasai et al. 2000]). In deeper portions of thewater column of the Hudson River estuary, residualflow is in fact upstream (Abood 1977, E.T.S. & K.M.M.L.unpubl. data). A preference for depth may be the solemechanism promoting up-estuary transport in somespecies (Melville-Smith et al. 1981).
Lateral effects on larval concentration were consis-tent but relatively minor. During both cruises, therewere fewer larvae of both species over the east shoalthan over the west shoal or in the channel (Fig. 5).Given the relatively small magnitude of this difference,it appears that anchovy larval abundance can be accu-rately estimated by sampling in the channel.
Harmonic regression analysis detected significantperiodic temporal variability in larval concentrationand depth distribution. The dominant periodic effectwas a day/night difference. Larvae were more concen-trated in the sampled portion of the water column atnight (Fig. 7A,C). While we found nominally signifi-cant day/night effects in 5 of the 8 species/size/cruisecombinations, and other constituents (M2, M4) werenominally significant in at least 1 of the combinations,only the day–night effects on large larvae of both spe-cies during Cruise 2 were significant, once nominalsignificance was corrected for multiple testing. Theday/night amplitude in abundance was 4- to 10-fold inlarge anchovy and goby larvae. We also found periodicvariability in depth distribution among goby larvae(Fig. 7D). The mean depth of large goby larvae in bothcruises, and small larvae during the second cruise, wasshallowest at night (the latter was not significant aftermultiple-testing correction). The predicted changes indepth from the regression were 2 m or more.
The periodic changes are consistent with diel verti-cal migration. Interpretation of the pattern shown bylarge goby larvae during Cruise 2 is most straightfor-ward: larvae were most concentrated, and shallowest,during the night. During the day, larvae moved deeperand some portion of these larvae moved below thedepth range sampled by our gear. A slightly differentpattern was shown by large goby larvae duringCruise 1, wherein there was periodic change in meandepth without periodic change in concentration. Thisscenario suggests that relatively few large larvae weremoving into the sampled depth range at night andback down during the day. Yet a third pattern wasshown by large anchovy larvae: their concentrationchanged without concomitant changes in mean depth.Here larval concentrations varied synchronously, andto the same degree at all depths sampled. This wascorroborated by other analyses, which demonstratedno among-depth differences in harmonic regressionpredictors (results not shown). This is consistent withvertical migration if all larvae, including those from thedeep unsampled bins, were moving up in sufficientnumbers to cause concentrations to peak at the sametime in all sampled depth bins. To confirm this sce-nario, sampling over the entire water column wouldbe necessary using an epibenthic trawl in addition tothe midwater trawl.
Day/night differences in net avoidance will also gen-erate higher catch rates at night. Any diel variability inavoidance, because of visual reactivity or diel changesin responsiveness, will confound efforts to characterizediel changes in water column abundance and verticaldistribution (Olney 1996). The fact that periodic day/night fluctuations in catch were not always detected(i.e. were absent among small anchovy during Cruise 1,
273
Cruise 1 Cruise 2Small Large Small Large
R2 0 0.58 0.33 0.74Date 0 0 0 0.0094Date2 0 0 0 0
AmplitudeK1 0 0.89 0.87 1.1M2 0 0 0 0M4 0 0 0 0
Phase angleK1 48 36 47M2M4
Table 6. Gobiosoma bosc. Temporal effects in harmonicregression of mean depth of larvae. Regression statistics arereported separately for each cruise and size class of larvae.
Further details as in Table 4
Mar Ecol Prog Ser 251: 263–277, 2003
and both sizes of goby during Cruise 2) suggests thatthe diel avoidance component was relatively minor.Note that day/night differences in avoidance may be asmall component of overall avoidance patterns, be-cause larvae may react to pressure waves associatedwith the net and its bridle even at night (Smith &Richardson 1977). We have concluded that larvalavoidance of our gear in the Hudson River is likely tohave been substantially less than reported elsewhere,probably because of higher turbidity.
Following the approach of Leak & Houde (1987), weapplied the avoidance estimates derived by Murphy &Clutter for a tropical anchovy. Using this correction,the overall abundance of large anchovy larvae in oursamples was predicted to be nearly 2 orders of magni-tude greater than the abundance of small larvae, anunrealistic outcome considering that our samples weretaken during the spawning season and anchovy larvalmortality rates are estimated to be 25% d–1 (Houde &Zastrow 1991). We therefore interpret our variations incatch rate as reflective of actual concentrations, but ourconclusions are tempered by the lack of relevant directestimates of avoidance and its day/night variability.
Diel vertical movement in older larval fishes can beassociated with gas bladder inflation. It is logical thatinflation of a gas bladder would facilitate verticalmigration. Larvae of herring and anchovy (Hoss et al.1989, Forward et al. 1994, Uotani et al. 2000), and moreevolutionarily derived bony fish species (Kitajima et al.1998, Shoji et al. 1999) inflate their gas bladder bygulping air at the surface at night, deflating the blad-der during the day. Possible functions of this behaviorinclude nocturnal energy conservation, more efficientpredator evasion, and the facilitation of transport (Hosset al. 1989). Careful examination of Anchoa mitchillilarvae in the Chesapeake Bay revealed that inflatedgas bladders were more prevalent among larger larvae(>11 mm), but were nonetheless observed in half of6 to 7 mm larvae that were captured at night, and inlarvae as small as 4 to 5 mm (North 2001). Thus, virtu-ally all the larvae in our small class would be capableof gas bladder inflation, and these larvae did exhibitdiel migration. Among large larvae, diel migration wasmore pronounced, and North’s (2001) results indicatethat bladder inflation is more prevalent at this size. Thedevelopment of day–night movement in the northernanchovy Engraulis mordax appears to coincide withgas bladder inflation (Hunter & Sanchez 1976). It isnoteworthy that movement to the surface for gas blad-der inflation is not tightly synchronized. Synchronousmovement at dusk would concentrate larvae at the sur-face, which we did not observe. Gas bladder inflationmay facilitate vertical migration in gobies as well.Prominent gas bladders are seen in the smallest gobylarval stages (Lippson & Moran 1974, authors’ pers.
obs.). The paucity of goby larvae in the shallowest binswould suggest that surface inflation is not requiredin this species.
How well do our findings conform to those expectedif vertical migration functions (in part) to facilitatealong-river movement? The temporal changes in larvaldistribution and abundance we observed were notconsistent with strictly tidally entrained migration(selective tidal stream transport). Larval abundancedid not peak during each flood tide, nor were larvaeshallowest during each flood tide. There was no rela-tionship between larval concentration and along-rivercurrent velocity, except in the case of small gobylarvae during Cruise 1. In this case, larvae were mostabundant during each ebbing tide, which would pro-mote downriver movement. Although vertical move-ment was not tidally synchronized, nocturnal upwardmigration was roughly coincident with flood tideduring both Cruise 1 and Cruise 2. Similar combinedflood/ebb M2 tide and day/night effects on vertical dis-tribution have been seen in a variety of estuarine fishlarvae (e.g. Weinstein et al. 1980, Forward et al. 1999,Grioche et al. 2000), while in other species movementswere solely synchronized to the M2 tide (e.g. Fortier &Leggett 1983, Rowe & Epifanio 1994, Jager 1999) orto the day/night cycle (Fortier & Leggett 1983). Dielmigration of the kind we have observed, with move-ment into the water column during night flood tidesand down towards the bottom at other times, can pro-mote upriver transport (Hill 1991).
Whether the vertical migration pattern suggested byour results is likely to promote substantive along-rivertransport, and the relative importance of vertical migra-tion versus simple depth preferences, need to be quan-tified. The next step to be taken with our data is to pro-ject larval advection rates (Rowe & Epifanio 1994,Jager & Mulder 1999) by combining vertical prefer-ences and vertical migration scenarios with informa-tion on local flow retrieved from the ADCP. Suchanalyses were outside the scope of this study.
An intriguing feature of the temporal effects onlarval concentration is the contrast between springtide and neap tide results. The amplitude of periodicchanges in concentration and mean depth, and the de-gree to which there is a preference for greater depths,tended to be smaller during spring tide than neap tide.We suggest that this difference reflects more turbulentmixing during spring tide, with reduced stratificationof the water column and more uniform distribution oflarvae. However, our spring–neap comparison was notreplicated, and satisfactory tests of this possibility willrequire a more dedicated study design. The generalityof this result can be further tested because it generatesa strong prediction: upriver transport should be morepronounced during neap tide periods than during
274
Schultz et al.: Larval transport in estuaries
spring tide periods. Frequent surveys of along-riverdistribution or analyses of individual transport historyvia otolith microchemistry (e.g. Kimura et al. 2000),would be able to test this prediction.
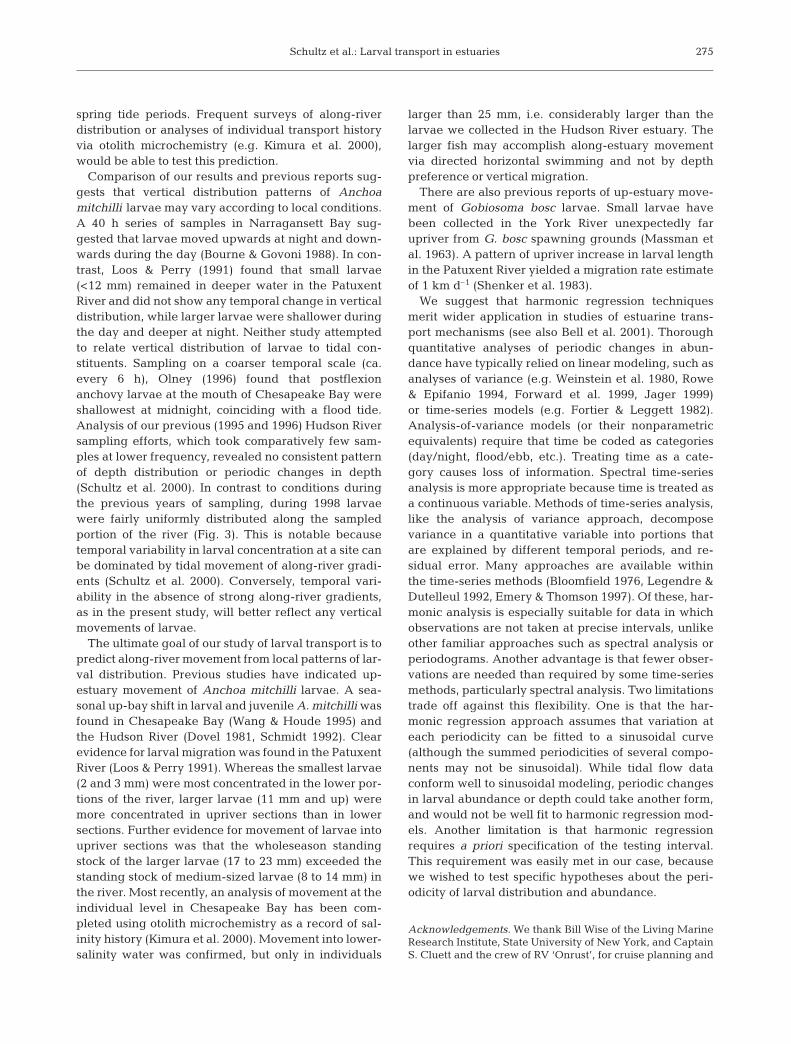
Comparison of our results and previous reports sug-gests that vertical distribution patterns of Anchoamitchilli larvae may vary according to local conditions.A 40 h series of samples in Narragansett Bay sug-gested that larvae moved upwards at night and down-wards during the day (Bourne & Govoni 1988). In con-trast, Loos & Perry (1991) found that small larvae(<12 mm) remained in deeper water in the PatuxentRiver and did not show any temporal change in verticaldistribution, while larger larvae were shallower duringthe day and deeper at night. Neither study attemptedto relate vertical distribution of larvae to tidal con-stituents. Sampling on a coarser temporal scale (ca.every 6 h), Olney (1996) found that postflexionanchovy larvae at the mouth of Chesapeake Bay wereshallowest at midnight, coinciding with a flood tide.Analysis of our previous (1995 and 1996) Hudson Riversampling efforts, which took comparatively few sam-ples at lower frequency, revealed no consistent patternof depth distribution or periodic changes in depth(Schultz et al. 2000). In contrast to conditions duringthe previous years of sampling, during 1998 larvaewere fairly uniformly distributed along the sampledportion of the river (Fig. 3). This is notable becausetemporal variability in larval concentration at a site canbe dominated by tidal movement of along-river gradi-ents (Schultz et al. 2000). Conversely, temporal vari-ability in the absence of strong along-river gradients,as in the present study, will better reflect any verticalmovements of larvae.
The ultimate goal of our study of larval transport is topredict along-river movement from local patterns of lar-val distribution. Previous studies have indicated up-estuary movement of Anchoa mitchilli larvae. A sea-sonal up-bay shift in larval and juvenile A. mitchilli wasfound in Chesapeake Bay (Wang & Houde 1995) andthe Hudson River (Dovel 1981, Schmidt 1992). Clearevidence for larval migration was found in the PatuxentRiver (Loos & Perry 1991). Whereas the smallest larvae(2 and 3 mm) were most concentrated in the lower por-tions of the river, larger larvae (11 mm and up) weremore concentrated in upriver sections than in lowersections. Further evidence for movement of larvae intoupriver sections was that the wholeseason standingstock of the larger larvae (17 to 23 mm) exceeded thestanding stock of medium-sized larvae (8 to 14 mm) inthe river. Most recently, an analysis of movement at theindividual level in Chesapeake Bay has been com-pleted using otolith microchemistry as a record of sal-inity history (Kimura et al. 2000). Movement into lower-salinity water was confirmed, but only in individuals
larger than 25 mm, i.e. considerably larger than thelarvae we collected in the Hudson River estuary. Thelarger fish may accomplish along-estuary movementvia directed horizontal swimming and not by depthpreference or vertical migration.
There are also previous reports of up-estuary move-ment of Gobiosoma bosc larvae. Small larvae havebeen collected in the York River unexpectedly farupriver from G. bosc spawning grounds (Massman etal. 1963). A pattern of upriver increase in larval lengthin the Patuxent River yielded a migration rate estimateof 1 km d–1 (Shenker et al. 1983).
We suggest that harmonic regression techniquesmerit wider application in studies of estuarine trans-port mechanisms (see also Bell et al. 2001). Thoroughquantitative analyses of periodic changes in abun-dance have typically relied on linear modeling, such asanalyses of variance (e.g. Weinstein et al. 1980, Rowe& Epifanio 1994, Forward et al. 1999, Jager 1999)or time-series models (e.g. Fortier & Leggett 1982).Analysis-of-variance models (or their nonparametricequivalents) require that time be coded as categories(day/night, flood/ebb, etc.). Treating time as a cate-gory causes loss of information. Spectral time-seriesanalysis is more appropriate because time is treated asa continuous variable. Methods of time-series analysis,like the analysis of variance approach, decomposevariance in a quantitative variable into portions thatare explained by different temporal periods, and re-sidual error. Many approaches are available withinthe time-series methods (Bloomfield 1976, Legendre &Dutelleul 1992, Emery & Thomson 1997). Of these, har-monic analysis is especially suitable for data in whichobservations are not taken at precise intervals, unlikeother familiar approaches such as spectral analysis orperiodograms. Another advantage is that fewer obser-vations are needed than required by some time-seriesmethods, particularly spectral analysis. Two limitationstrade off against this flexibility. One is that the har-monic regression approach assumes that variation ateach periodicity can be fitted to a sinusoidal curve(although the summed periodicities of several compo-nents may not be sinusoidal). While tidal flow dataconform well to sinusoidal modeling, periodic changesin larval abundance or depth could take another form,and would not be well fit to harmonic regression mod-els. Another limitation is that harmonic regressionrequires a priori specification of the testing interval.This requirement was easily met in our case, becausewe wished to test specific hypotheses about the peri-odicity of larval distribution and abundance.
Acknowledgements. We thank Bill Wise of the Living MarineResearch Institute, State University of New York, and CaptainS. Cluett and the crew of RV ‘Onrust’, for cruise planning and
275
Mar Ecol Prog Ser 251: 263–277, 2003
execution. We are grateful to Tom Wilson and the staff of theOcean Instrument Laboratory, State University of New York,for sampling instrumentation used in this study. Assistancewith the cruises and/or with the larval samples was providedby J. Arora, R. Barboza, M. Berube, B. Doerr, C. Chizinski,C. Delavalle, D. Ely, K. Freidenburg, G. Goad, A. Gospo-darek, N. Henderson, C. Obergfell, T. Hurst, P. Kelly, A.Legassey, V. Mendillo, C. Miller, A. Norton, G. Siena, J. Waiteand S. Zahner. Several individuals provided special technicalassistance, including E. Lorda, W. K. Macy III, C. Obergfell,and J. Young. The Gobiosoma bosc results comprised partof M.C.F.’s honors thesis, written under the auspices of theUConn Honors Program. Several anonymous reviewers pro-vided many constructive suggestions on the manuscript. Theresearch presented in this paper was funded by the HudsonRiver Foundation. This paper is dedicated to the victims of 11September 2001 and their families.
LITERATURE CITED
Abood KA (1977) Evaluation of circulation in partially strati-fied estuaries as typified by the Hudson River. PhD thesis,Rutgers University, New Brunswick, NJ
Baird D, Ulanowicz RE (1989) The seasonal dynamics of theChesapeake Bay ecosystem. Ecol Monogr 59:329–364
Batschelet E (1979) Introduction to mathematics for life scien-tists. Springer-Verlag, Berlin
Bell KN, Cowley PD, Whitfield AK (2001) Seasonality in fre-quency of marine access to an intermittently open estuary:implications for recruitment strategies. Estuar Coast ShelfSci 52:327–337
Bliss CI (1958) Periodic regression in biology and climatology.Bull no 615. Connecticut Agricultural Experiment Station,New Haven
Bloomfield P (1976) Fourier analysis of time series: an intro-duction. John Wiley & Sons, New York
Boehlert GW, Mundy BC (1988) Roles of behavioral and phys-ical factors in larval and juvenile fish recruitment to estu-arine nursery areas. In: Weinstein MP (ed) Larval fish andshellfish transport through inlets. American FisheriesSociety Symposium, Vol 3. American Fisheries Society,Bethesda, MD, p 51–67
Bourne DW, Govoni JJ (1988) Distribution of fish eggs andlarvae and patterns of water circulation in NarragansettBay, 1972–1973. In: Weinstein MP (ed) Larval fish andshellfish transport through inlets, Vol 3. American Fish-eries Society, Bethesda, MD, p 132–148
Day JW Jr, Hall CAS, Kemp WM, Yanez-Arancibia A (1989)Estuarine ecology. John Wiley & Sons, New York
Dovel WL (1971) Fish eggs and larvae of the upper Chesa-peake Bay. Natural Resources Institute Special Report 4.University of Maryland, College Park
Dovel WL (1981) Ichthyoplankton of the Lower Hudson estu-ary, New York. NY Fish Game J 28:21–39
Emery WJ, Thomson RE (1997) Data analysis methods inphysical oceanography. Pergamon Press, Tarrytown, NY
Fortier L, Leggett WC (1982) Fickian transport and the dis-persal of fish larvae in estuaries. Can J Fish Aquat Sci 39:1150–1163
Fortier L, Leggett WC (1983) Vertical migrations and trans-port of larval fish in a partially mixed estuary. Can J FishAquat Sci 40:1543–1555
Forward RB Jr, Hettler WF, Hoss DE (1994) Swimbladderdeflation in the Atlantic menhaden, Brevoortia tyrannus.Fish Bull US Dept Commerce 92:641–646
Forward RB, Jr, Reinsel KA, Peters DS, Tankersley RA and 5others (1999) Transport of fish larvae through a tidal inlet.Fish Oceanogr 8:153–172
Geyer WR (1995) Tide-induced mixing in the Amazon frontalzone. J Geophys Res C Oceans 100:2341–2353
Grioche A, Harlay X, Koubbi P, Lago LF (2000) Verticalmigrations of fish larvae: Eulerian and Lagrangian obser-vations in the eastern English Channel. J Plankton Res 22:1813–1828
Hansen D, Rattray M Jr (1966) New dimensions in estuaryclassification. Limnol Oceanogr 11:319–326
Hill AE (1991) A mechanism for horizontal zooplankton trans-port by vertical migration in tidal currents. Mar Biol 111:485–492
Holt SA, Holt GJ, Arnold CR (1989) Tidal stream transport oflarval fishes into non-stratified estuaries. Rapp. P-V RéunCons Int Explor Mer 191:100–104
Hoss DE, Checkley DM Jr, Settle LR (1989) Diurnal buoyancychanges in larval Atlantic menhaden (Brevoortia tyran-nus). Rapp P-V Réun Cons Int Explor Mer 191:105–111
276
The mean depth of larvae, also known as the depth centerof distribution (ZCD), was estimated as
ZCD = Σ (Pi × Zi) (A1)
where
Pi = (Ci × Hi)�Σ(Ci × Hi) (A2)
i = 1 to n, n is the number of depth strata, Ci is the(log-transformed) concentration of larvae in the i th depthstratum, Hi is the width of the i th depth stratum (always2 m in this case), and Zi is the mean depth of the i th depthstratum (2, 4, 6 or 8 m)
Appendix 1. Mean depth
K1, M2 and M4 tidal constituents were each included asA cos(ωt + φ), where A is the amplitude of the periodicvariability, ω is the angular frequency of the variability(2π/T, where T is the period of the constituent in h), andφ is the phase-shift of the variability with respect to aselected reference time, t0. The t0 used for the phase-shiftestimates is conventionally 00:00 h on January 1 of theyear. Periodic tidal constituents A cos(ωt + φ) can belinearized for inclusion in multiple regression as follows.Because
cos(θ + γ) = cos(θ) cos(γ) – sin(θ) sin(γ) (B1)
each tidal component can be represented in a multipleregression as 2 terms,
α cos(ωt) + β sin(ωt ) (B2)where
α = A cos(φ), β = –A sin(φ) (B3)
The amplitude A is then given by (α2 + β2)_, and φ is arc-tan(β/α). The standard error for A is (SEα
2 + SEβ2)_, where
SEα and SEβ are the standard errors for the regression esti-mates (contra Bliss 1958). The significance of a tidal con-stituent is assessed by Student’s t-test against the nullhypothesis that the value is 0 (1-tailed, because amplitudevalues are always positive)
Appendix 2. Regression model construction
Schultz et al.: Larval transport in estuaries
Houde ED, Zastrow CE (1991) Bay anchovy. In: FunderbuckSL, Jordan SJ, Mihursky JA, Riley D (eds) Habitat re-quirements for Chesapeake Bay living resources. LivingResources Subcommittee, Chesapeake Bay Program, Solo-mons, MD, p 81–811
Hunter JR, Sanchez C (1976) Diel changes in swim bladderinflation of the larvae of the northern anchovy, Engraulismordax. Fish Bull US Dept Commerce 74:847–855
Jager Z (1999) Selective tidal stream transport of flounderlarvae (Platichthys flesus L.) in the Dollard (Ems Estuary).Estuar Coast Shelf Sci 49:347–362
Jager Z, Mulder HPJ (1999) Transport velocity of flounderlarvae (Platichthys flesus L.) in the Dollard (Ems Estuary).Estuar Coast Shelf Sci 49:327–346
Kasai A, Hill A, Fujiwara T, Simpson J (2000) Effects of theearth’s rotation on the circulation in regions of freshwaterinfluence. J Geophys Res C Oceans 105:16961–16969
Kimura R, Secor DH, Houde ED, Piccoli PM (2000) Up-estuarydispersal of young-of-the-year bay anchovy Anchoa mit-chilli in the Chesapeake Bay: inferences from microprobeanalysis of strontium in otoliths. Mar Ecol Prog Ser 208:217–227
Kitajima C, Yamane Y, Matsui S, Yoshimatsu T (1998) Ontoge-netic change in specific gravity in the early stages of theayu Plecoglossus altivelis. Bull Jpn Soc Sci Fish 64:822–829
Laprise R, Dodson JJ (1989) Ontogeny and importance of tidalvertical migrations in the retention of larval smeltOsmerus mordax in a well-mixed estuary. Mar Ecol ProgSer 55:101–111
Leak JC, Houde ED (1987) Cohort growth and survival of bayanchovy Anchoa mitchilli larvae in Biscayne Bay, Florida.Mar Ecol Prog Ser 37:109–122
Legendre P, Dutelleul P (1992) Introduction to the analysis ofperiodic phenomena. In: Ali MA (ed) Rhythms in fishes.Plenum Press, New York, p 11–25
Lippson AJ, Moran RL (1974) Manual for identification ofearly developmental stages of fishes of the Potomac RiverEstuary, Maryland Department of Natural Resources,Baltimore, MD
Loos JJ, Perry ES (1991) Larval migration and mortality ratesof bay anchovy in the Patuxent River. In: Hoyt RD (ed) Lar-val fish recruitment and research in the Americas,National Oceanic Atmospheric Administration TechnicalReport NMFS 95, Washington, DC, p 65–76
Massman WH, Norcross JJ, Joseph EB (1963) Distribution oflarvae of the naked goby, Gobiosoma bosci, in the YorkRiver. Chesapeake Sci 4:120–125
McHugh JL (1967) Estuarine nekton. In: Lauff GH (ed) Estu-aries. American Association for the Advancement of Sci-ence, Washington, DC, p 581–620
McLellan HJ (1965) Elements of physical oceanography.Pergamon Press, Oxford
Melville-Smith R, Baird D, Wooldridge T (1981) The utiliza-tion of tidal currents by the larvae of an estuarine fish.S Afr J Zool 16:10–13
Murphy GI, Clutter RI (1972) Sampling anchovy larvae witha plankton purse seine. Fish Bull US Dept Commerce 70:789–798
Norcross BL, Shaw RF (1984) Oceanic and estuarine transportof fish eggs and larvae: a review. Trans Am Fish Soc 115:155–165
North EW (2001) Transport and retention of fish early-lifestages in Chesapeake Bay: mechanisms and implicationsfor recruitment. PhD thesis, University of Maryland, Col-lege Park
Officer C (1976) Physical oceanography of estuaries (andassociated coastal waters). John Wiley, Chichester
Olney JE (1996) Community structure, small scale patchiness,transport, and feeding of larval fishes in an estuarineplume. PhD thesis, University of Maryland, College Park
Peters H (1997) Observations of stratified turbulent mixingin an estuary: neap-to-spring variations during high riverflow. Estuar Coast Shelf Sci 45:69–88
Pritchard DW (1956) The dynamic structure of a coastal plainestuary. J Mar Res 15:33–42
Pugh DT (1987) Tides, surges and mean sea-level. John Wiley& Sons, New York
Rice WR (1989) Analyzing tables of statistical tests. Evolution43:223–225
Rowe PM, Epifanio CE (1994) Tidal stream transport of weak-fish larvae in Delaware Bay, USA. Mar Ecol Prog Ser 110:105–114
Schmidt RE (1992) Temporal and spatial distribution of bayanchovy eggs through adults in the Hudson River. In:Smith CL (ed) Estuarine research in the 1980’s. State Uni-versity of New York Press, Albany, NY, p 228–241
Schultz ET, Cowen RK, Lwiza KMM, Gospodarek AM (2000)Explaining advection: do larval bay anchovy (Anchoamitchilli) show selective tidal stream transport? ICESJ Mar Sci 57:360–371
Shenker JM, Hepner DJ, Frere PE, Currence LE, WakefieldWW (1983) Upriver migration and abundance of nakedgoby (Gobiosoma bosci) larvae in the Patuxent River estu-ary, Maryland. Estuaries 6:36–42
Shoji J, Maehara T, Tanaka M (1999) Diel vertical movementand feeding rhythm of Japanese Spanish mackerel larvaein the central Seto Inland Sea. Fish Sci 65:726–730
Smith PE, Richardson SL (1977) Standard techniques forpelagic fish egg and larva surveys. Food and AgricultureOrganization of the United Nations, Rome
Uotani I, Fukui A, Osaki K, Ozawa T (2000) Experimentalstudy on the inflation and deflation of gas bladder ofJapanese anchovy, Engraulis japonicus larvae. Bull MarSci 66:97–103
Valle-Levinson A, Lwiza KMM (1995) The effects of channelsand shoals on exchange between the Chesapeake Bayand the adjacent ocean. J Geophys Res C Oceans 100:18551–18563
Vouglitois JJ, Able KW, Kurtz RJ, Tighe KA (1987) Life historyand population dynamics of the bay anchovy in New Jer-sey. Trans Am Fish Soc 116:141–153
Wang SB, Houde ED (1995) Distribution, relative abundance,biomass and production of bay anchovy Anchoa mitchilliin the Chesapeake Bay. Mar Ecol Prog Ser 121:27–38
Wang JC, Kernehan RJ (1979) Fishes of the Delaware estu-aries: a guide to the early life history. EA Communications,Towson, MD
Webb KL, D’Elia CF (1980) Nutrient and oxygen re-distribution during a spring neap tidal cycle. Science 207:983–985
Weinstein MP, Weiss SL, Hodson RG, Gerry LR (1980) Reten-tion of three taxa of postlarval fishes in an intensivelyflushed tidal estuary, Cape Fear River, North Carolina.Fish Bull US Dept Commerce 78:419–436
Welch JM, Forward RB Jr, Howd PA (1999) Behavioral re-sponses of blue crab Callinectes sapidus postlarvae to tur-bulence: implications for selective tidal stream transport.Mar Ecol Prog Ser 179:135–143
Wong KC (1994) On the nature of transverse variability in acoastal plain estuary. J Geophys Res C Oceans 99:14209–14222
Yamashita Y, Tsuruta Y, Yamada H (1996) Transport andsettlement mechanisms of larval stone flounder, Kareiusbicoloratus, into nursery grounds. Fish Oceanogr 5:194–204
277
Editorial responsibility: Otto Kinne (Editor),Oldendorf/Luhe, Germany
Submitted: January 6, 2001; Accepted: December 12, 2002Proofs received from author(s): March 17, 2003
Related Documents