Mechanisms for Fracture and Fatigue-Crack Propagation in a Bulk Metallic Glass C.J. GILBERT, V. SCHROEDER, and R.O. RITCHIE The fracture and fatigue properties of a newly developed bulk metallic glass alloy, Zr 41.2 Ti 13.8 Cu 12.5 Ni 10 Be 22.5 (at. pct), have been examined. Experimental measurements using conventional fatigue precracked compact-tension C(T) specimens (,7-mm thick) indicated that the fully amorphous alloy has a plane-strain fracture toughness comparable to polycrystalline aluminum alloys. However, signifi- cant variability was observed and possible sources are identified. The fracture surfaces exhibited a vein morphology typical of metallic glasses, and, in some cases, evidence for local melting was observed. Attempts were made to rationalize the fracture toughness in terms of a previously developed micromechanical model based on the Taylor instability, as well as on the observation of extensive crack branching and deflection. Upon partial or complete crystallization, however, the alloy was severely embrittled, with toughnesses dropping to ,1 MPa! m. Commensurate with this drop in toughness was a marginal increase in hardness and a reduction in ductility (as measured via depth- sensing indentation experiments). Under cyclic loading, crack-propagation behavior in the amorphous structure was similar to that observed in polycrystalline steel and aluminum alloys. Moreover, the crack-advance mechanism was associated with alternating blunting and resharpening of the crack tip. This was evidenced by striations on fatigue fracture surfaces. Conversely, the (unnotched) stress/life (S/N) properties were markedly different. Crack initiation and subsequent growth occurred quite readily, due to the lack of microstructural barriers that would normally provide local crack-arrest points. This resulted in a low fatigue limit of ,4 pct of ultimate tensile strength. I. INTRODUCTION Even less work has been completed on fracture toughness and fatigue-crack propagation in amorphous metals, aside FIRST developed some 40 years ago, [1] amorphous from early limited studies on thin ribbons. [7,9–19] Moreover, metallic alloys have long represented an intriguing class of since traditional notions of microstructure, crystal defects, potential structural materials. The lack of any long-range and dislocation plasticity (which govern our understanding order and the subsequent absence of microstructure has led of the behavior of crystalline alloys) do not apply, the mecha- to a range of interesting properties. These include near- nisms and microstructural parameters which govern fracture theoretical strength, large elastic deflections, high hardness, toughness and fatigue-crack propagation in metallic glasses excellent wear properties, and good potential for forming are essentially unknown. and shaping. Due to the very high cooling rates (.10 5 The recent development of bulk metallic glass permits, for K/s) necessary to prevent crystallization, however, all prior the first time, detailed measurement of fatigue and fracture attempts to characterize the mechanical properties have been characteristics, as the severe specimen-geometry limitations confined to very thin ribbons or wires (,10 to 100 mm). associated with rapid quenching no longer apply. In recent Indeed, past studies have focused almost exclusively on years, several families of multicomponent metallic alloys constitutive properties, as the restrictive nature of the ribbons have been developed which exhibit exceptional glass-form- made the measurement of fracture and fatigue properties ing ability. These include, for example, Mg-based alloys like very difficult. Mg-Cu-Y, [20] some recently discovered Fe-based alloys, [21] Early studies established that, unlike oxide glasses, metal- and the Zr-Ti-Ni-Cu, Zr-Ti-Ni-Cu-Be, and Zr-Ti-Ni-Cu-Al lic glasses can be quite ductile. [2–5] Flow in metallic glass alloys. [22,23] All exhibit very high resistance to crystallization is often inhomogeneous, particularly at high stresses and in the undercooled liquid state, so that relatively low cooling low temperatures, localizing into slip bands along planes of rates result in a fully amorphous structure (typically ,10 maximum shear. Although the precise flow mechanisms are K/s). For example, the first commercial alloy of Zr 41.2 Ti 13.8- unclear, bubble-raft and computational studies suggest that Cu 12.5 Ni 10 Be 22.5 (at. pct), also known by its trade name they are associated with localized atomic-shear rearrange- VITRELOY,* requires cooling rates of only ,1 K/s. Thus, ments correlated to regions of either excess free volume [4,6,7] or extreme shear-stress concentration. [8] Such flow mecha- *Vitreloy is a trademark of Amorphous Technologies International, Corp. nisms, however, have never been verified experimentally due to both a lack of data and the difficulty in characterizing fully amorphous rods several centimeters in diameter have been produced. [22] Because of its high strength-to-stiffness the internal state at the atomic level. ratio and low damping characteristics, Zr 41.2 Ti 13.8 Cu 12.5 Ni 10 Be 22.5 is now being used to fabricate golf-club heads. C.J. GILBERT, Postdoctoral Research Associate, V. SCHROEDER, Although preliminary studies indicate that Zr 41.2 Ti 13.8- Graduate Student Research Assistant, and R.O. RITCHIE, Professor, are Cu 12.5 Ni 10 Be 22.5 and some related alloys exhibit high fracture with the Department of Materials Science and Mineral Engineering, Univer- toughness, along with fatigue-crack growth properties com- sity of California, Berkeley, CA 94720-1760. Manuscript submitted March 25, 1998. parable to those of high-strength steel and aluminum METALLURGICAL AND MATERIALS TRANSACTIONS A VOLUME 30A, JULY 1999—1739

Welcome message from author
This document is posted to help you gain knowledge. Please leave a comment to let me know what you think about it! Share it to your friends and learn new things together.
Transcript

Mechanisms for Fracture and Fatigue-Crack Propagationin a Bulk Metallic Glass
C.J. GILBERT, V. SCHROEDER, and R.O. RITCHIE
The fracture and fatigue properties of a newly developed bulk metallic glass alloy, Zr41.2Ti13.8Cu12.5
Ni10Be22.5 (at. pct), have been examined. Experimental measurements using conventional fatigueprecracked compact-tension C(T) specimens (,7-mm thick) indicated that the fully amorphous alloyhas a plane-strain fracture toughness comparable to polycrystalline aluminum alloys. However, signifi-cant variability was observed and possible sources are identified. The fracture surfaces exhibited avein morphology typical of metallic glasses, and, in some cases, evidence for local melting wasobserved. Attempts were made to rationalize the fracture toughness in terms of a previously developedmicromechanical model based on the Taylor instability, as well as on the observation of extensivecrack branching and deflection. Upon partial or complete crystallization, however, the alloy wasseverely embrittled, with toughnesses dropping to ,1 MPa!m. Commensurate with this drop intoughness was a marginal increase in hardness and a reduction in ductility (as measured via depth-sensing indentation experiments). Under cyclic loading, crack-propagation behavior in the amorphousstructure was similar to that observed in polycrystalline steel and aluminum alloys. Moreover, thecrack-advance mechanism was associated with alternating blunting and resharpening of the crack tip.This was evidenced by striations on fatigue fracture surfaces. Conversely, the (unnotched) stress/life(S/N) properties were markedly different. Crack initiation and subsequent growth occurred quitereadily, due to the lack of microstructural barriers that would normally provide local crack-arrestpoints. This resulted in a low fatigue limit of ,4 pct of ultimate tensile strength.
I. INTRODUCTION Even less work has been completed on fracture toughnessand fatigue-crack propagation in amorphous metals, asideFIRST developed some 40 years ago,[1] amorphousfrom early limited studies on thin ribbons.[7,9–19] Moreover,metallic alloys have long represented an intriguing class ofsince traditional notions of microstructure, crystal defects,potential structural materials. The lack of any long-rangeand dislocation plasticity (which govern our understandingorder and the subsequent absence of microstructure has ledof the behavior of crystalline alloys) do not apply, the mecha-to a range of interesting properties. These include near-nisms and microstructural parameters which govern fracturetheoretical strength, large elastic deflections, high hardness,toughness and fatigue-crack propagation in metallic glassesexcellent wear properties, and good potential for formingare essentially unknown.and shaping. Due to the very high cooling rates (.105
The recent development of bulk metallic glass permits, forK/s) necessary to prevent crystallization, however, all priorthe first time, detailed measurement of fatigue and fractureattempts to characterize the mechanical properties have beencharacteristics, as the severe specimen-geometry limitationsconfined to very thin ribbons or wires (,10 to 100 mm).associated with rapid quenching no longer apply. In recentIndeed, past studies have focused almost exclusively onyears, several families of multicomponent metallic alloysconstitutive properties, as the restrictive nature of the ribbonshave been developed which exhibit exceptional glass-form-made the measurement of fracture and fatigue propertiesing ability. These include, for example, Mg-based alloys likevery difficult.Mg-Cu-Y,[20] some recently discovered Fe-based alloys,[21]
Early studies established that, unlike oxide glasses, metal-and the Zr-Ti-Ni-Cu, Zr-Ti-Ni-Cu-Be, and Zr-Ti-Ni-Cu-Allic glasses can be quite ductile.[2–5] Flow in metallic glassalloys.[22,23] All exhibit very high resistance to crystallizationis often inhomogeneous, particularly at high stresses andin the undercooled liquid state, so that relatively low coolinglow temperatures, localizing into slip bands along planes ofrates result in a fully amorphous structure (typically ,10maximum shear. Although the precise flow mechanisms areK/s). For example, the first commercial alloy of Zr41.2Ti13.8-unclear, bubble-raft and computational studies suggest thatCu12.5Ni10Be22.5 (at. pct), also known by its trade namethey are associated with localized atomic-shear rearrange-VITRELOY,* requires cooling rates of only ,1 K/s. Thus,ments correlated to regions of either excess free volume[4,6,7]
or extreme shear-stress concentration.[8] Such flow mecha- *Vitreloy is a trademark of Amorphous Technologies International, Corp.nisms, however, have never been verified experimentallydue to both a lack of data and the difficulty in characterizing fully amorphous rods several centimeters in diameter have
been produced.[22] Because of its high strength-to-stiffnessthe internal state at the atomic level.ratio and low damping characteristics, Zr41.2Ti13.8Cu12.5
Ni10Be22.5 is now being used to fabricate golf-club heads.C.J. GILBERT, Postdoctoral Research Associate, V. SCHROEDER, Although preliminary studies indicate that Zr41.2Ti13.8-Graduate Student Research Assistant, and R.O. RITCHIE, Professor, are Cu12.5Ni10Be22.5 and some related alloys exhibit high fracturewith the Department of Materials Science and Mineral Engineering, Univer-
toughness, along with fatigue-crack growth properties com-sity of California, Berkeley, CA 94720-1760.Manuscript submitted March 25, 1998. parable to those of high-strength steel and aluminum
METALLURGICAL AND MATERIALS TRANSACTIONS A VOLUME 30A, JULY 1999—1739

Table I. Elemental Composition in Mass FractionWeight Percent*
Sample Zr Ti Cu Ni Be O N
1 62.60 10.92 12.90 10.00 3.730 0.1011 0.00432 62.40 10.87 12.84 10.20 3.800 0.1076 0.0056
*Courtesy Howmet Research Corporation (Whitehall, MI).
alloys,[24–28] these results are not understood mechanistically.In addition, recent work has demonstrated that, upon partialor full crystallization, the alloy is severely embrittled[24]
(similar to a number of other amorphous alloys).[11,17,29]
Accordingly, the objective of the current study is to quantifythe fracture toughness and fatigue-crack growth propertiesof this bulk metallic glass alloy in further detail and to
Fig. 1—High-resolution transmission electron microscopy, in (a) brightdevelop a mechanistic understanding of fracture and fatigue field and (b) dark field, of the as-received, fully amorphous Zr41.2Ti13.8-in this class of materials. Cu12.5Ni10Be22.5 alloy (courtesy of W.L. Johnson).[32]
II. EXPERIMENTAL PROCEDURES
A. Material and Microstructure
Experiments were performed on as-cast plates (7-mmthick, 40 3 40 mm) of fully amorphous Zr41.2Ti13.8Cu12.5
Ni10Be22.5 in at. pct (Zr62.6Ti11.0Cu13.2Ni9.80Be3.40 in wt pct).Castings were produced by Hitchener Manufacturing Co.(Milford, NH) and were supplied by Amorphous Technolo-gies International (Laguna Niguel, CA). This alloy was origi-nally developed by Peker and Johnson, and processingmethods are described elsewhere.[22] The chemistries of twoseparate batches are shown in Table I (measured using massspectroscopy). Notice that significant amounts of oxygenand nitrogen are present in both heats. These oxygen levels(,3700 ppm) are substantially higher than those reportedby Conner et al. (800 ppm)[26] or by Lowhaphandu et al.(1600 ppm).[28] Typical mechanical and thermal propertiesare listed in Table II.[22,24,30,31]
Fig. 2—High-resolution transmission electron microscopy, in (a) brightfield and (b) dark field, of the Zr41.2Ti13.8Cu12.5Ni10Be22.5 alloy annealed atAs-received plates were found to be fully amorphous,633 K for 12 h (courtesy of W.L. Johnson).[32] Notice the appearance ofas indicated by transmission electron microscopy studieslattice fringes not visible in the as-received structure.(Figure 1).[32] By heat treating specimens in vacuum (,1026
torr) at 633 K, for times ranging from 0.1 to 24 hours, severalpartially crystallized structures were formed. The specimenheat treated at 633 K for 12 hours, for example, consisted microstructure was obtained, containing a Laves phase with
the hcp “MgZn2-type” structure,[34] a phase with the “Al2Cu-of an amorphous matrix containing ,3- to 5-nm-long crys-tallites of a Cu-rich, Ti-rich fcc phase, with an average type” structure, and at least one additional unidentified
phase.[33,36,37] The X-ray diffraction patterns (Cu Ka) corres-spacing of ,20 nm between nanocrystals (Figure 2).[32] Thevolume fraction of the crystalline fcc phase was estimated ponding to each of the heat treatments examined are shown
in Figure 3 and indicate the transition from a fully amorphousfrom X-ray and transmission electron microscopy data tobe less than 5 pct of the sample.[33,34,35] By heat treating at to a fully crystallized microstructure after annealing for 24
hours at 723 K.723 K for 24 hours in vacuum, a fully crystallized multiphase
Table II. Selected Properties of Zr41.2Ti13.8Cu12.5Ni10Be22.5 Bulk Metallic Glass
Young’s Shear Yield Vickers Glass FractureDensity Modulus Modulus Poisson’s Strength Hardness Transition† Toughness*(g/cm3) (GPa) (GPa) Ratio (GPa) (GPa) (K) (MPa!m)
5.9 95 35 0.35 1.9 5.4 ,625 ,55
*Measured at a K˙
of 0.3 MPa!m s21 on a 7-mm-thick, fatigue-precracked compact tension sample.[24]
†Measured at a scan rate of 0.33 K/s.[22]
1740—VOLUME 30A, JULY 1999 METALLURGICAL AND MATERIALS TRANSACTIONS A

testing. Polished surfaces were prepared using standard lap-ping techniques with minimal surface removal (,50 mm).Limited testing was also performed on thinned C(T) samples,due to concern about surface residual stress. In these sam-ples, ,1.5 mm was removed from each surface prior totesting, again using electrodischarge machining. Thisreduced the sample thickness from 7 to 4 mm.
Specimens were cycled under stress-intensity (K ) control,with a test frequency (n) of 25 Hz (sinusoidal waveform),under constant-load-ratio (R) conditions. Testing was per-formed on computer-controlled, servohydraulic mechanicaltesting machines, in general accordance with ASTM stan-dard E647. The load ratio, defined as the ratio of minimumto maximum load in the loading cycle (for tensile loading,equivalent to Kmin/Kmax), was varied from 0.1 to 0.5. Toobtain a wide spectrum of growth rates, samples were firstcycled with a decreasing stress-intensity range (at normal-ized K gradients of 0.08 and 0.2 mm21)* until measured
*Although ASTM E647 specifies a maximum load-shedding rate of 0.08mm21, faster K gradients of up to 0.20 mm21 were found to give identicalresults, as is typical of higher-strength materials.
growth rates were less than 10210 m/cycle. The value of thestress-intensity range at this point was used to operationallydefine the fatigue threshold stress intensity (DKTH ) belowwhich long cracks are essentially dormant. After thresholddetermination, specimens were cycled under increasing DKconditions with the same K gradient, up to growth rates of1027 m/cycle.
Cracks initiated readily from the as-machined notches,and, so, a half-chevrons notch was not necessary to initiateFig. 3—X-ray diffraction patterns corresponding to each of the annealing
conditions examined in this study, indicating the transition from the fully stable cracking. Samples were fatigue precracked for severalamorphous, as-received alloy to the fully crystallized alloy after 24 h at millimeters beyond this notch prior to data collection.*723 K.
*Some specimens were rejected due to cracks which initiated and grewperpendicular to the machined notch. This was only a problem with 7-mm-thick CT samples and appeared to be associated with residual stress.Sequential cutting techniques,[38] for example, revealed compressiveB. Hardness and Contact-Damage Measurementsstresses of ,450 MPa at the surface of some castings.[39]
The Vickers hardness (H ) was determined by indentingThereafter, crack lengths were continuously monitored usingspecimens polished to a ,1 mm finish (Acroscope, Santa
Clara, CA) at a load of 49 N, with measurements averaged unloading elastic-compliance measurements, with a 350 Vover at least 5 indents. This indentation load was selected strain gage attached to the back face of the specimen. Read-in order to minimize chipping when testing the partially ings were checked periodically using a traveling microscope.and fully crystallized specimens. In addition, depth-sensing Optical and compliance measurements were always foundindentation experiments with hardened stainless steel spheri- to be within 2 pct. Data are presented in terms of the growthcal indenters (radius (r) of 3.18 mm) were used to obtain rate per loading cycle (da/dN ) as a function of the alternatingsingle loading-unloading hysteresis curves for a fully amor- stress-intensity range of Kmax 2 Kmin, the latter being com-phous, partially crystallized (633 K for 12 hours) and a fully puted using standard linear-elastic handbook solutions.crystallized (723 K for 24 hours) microstructure. Measure- Fatigue-crack closure, defined in the metals literature asments were performed on a servohydraulic mechanical test premature contact of mating crack faces on unloading, wasframe operating in load control, using a swing-arm displace- also monitored using a strain gage attached to the backment gage resting on the specimen surface for depth sensing. face of the specimen. The closure stress intensity (Kcl) was
approximately defined at the point where the elasticunloading line initially deviated from linearity on a plot of
C. Fatigue-Crack Growth Rate Measurements load (P) vs back-face strain («). Under plane-strain condi-tions, crack closure may generally be considered to ariseFracture toughness and fatigue-crack growth rates werefrom asperity contact some distance behind the crack tip.determined in a room-air environment (22 8C, ,45 pct rela-This reduces the local stress-intensity range actually experi-tive humidity) on 7-mm-thick, 38-mm-wide compact-ten-enced at the crack tip to an effective level (DKeff ) of Kmax 2sion C(T) specimens. Samples were cut from the as-receivedKcl, where Kcl . Kmin.plates using electrodischarge machining. For these speci-
During and after fracture and fatigue experiments, themens, the thickness was not changed significantly from theoriginal castings, and only one face was polished prior to crack profiles and fracture surfaces of selected specimens
METALLURGICAL AND MATERIALS TRANSACTIONS A VOLUME 30A, JULY 1999—1741

were analyzed with both an optical microscope and in thescanning electron microscope (SEM), with the objective ofelucidating the salient mechanisms of fracture and fatigue-crack growth.
D. Variable-Amplitude Fatigue-Crack Growth Behavior
Limited studies were also made of transient crack-growthbehavior following variable-amplitude loading sequences.For variable-amplitude loading tests, crack-growth rateswere measured under constant DK conditions, with R 5 0.1and v 5 25 Hz. Once a steady-state crack growth rate wasachieved, specimens were subjected to a block-loadingsequence in order to examine transient crack-growth behav-ior. Transient data are presented as the growth rate per cycleplotted against crack extension (Da).
E. Fracture Toughness Measurements
Following growth-rate measurements, fracture toughness Fig. 4—Vickers hardness, H, plotted as a function of annealing time, t, forvalues in the fully amorphous structure were determined by specimens heat treated at both 633 and 723 K in vacuum. Data are compared
to the as-received, amorphous sample.monotonically loading the fatigue-precracked specimens tofailure at specified loading rates (K
˙), in general accordance
with ASTM standard E399. However, because fatigue crack-ing was unstable in the partially and fully crystalline struc- cycles (,9 days at 25 Hz). Fracture surfaces of selectedtures due to their extreme brittleness, toughness values were beams were examined after failure via both optical micros-obtained using indentation methods for these microstruc- copy and scanning electron microscopy, in order to discerntures. In each case, measurements were averaged from at the origin and mechanisms of failure. Stress/life (S/N) dataleast five Vickers hardness indents under an indentation are presented in terms of the stress amplitude (sa , equal toload (Pind ) of 49 N. Fracture toughness values (KIc) were 1/2 (smax 2 smin), normalized by the uniaxial tensile strengthcalculated from[40] (su , equal to 1.9 GPa[30]), plotted as a function of the number
of cycles to failure (Nf), where one cycle is defined as a fullstress reversal.KIc 5 x
Pind
c3/2 [1]
where the 2c is the total surface crack length and x is a III. DEFORMATION AND FRACTUREconstant dependent upon indent geometry and material prop- TOUGHNESSerties. For brittle solids, x can be estimated to be 0.016(E/
A. Hardness and Contact DamageH )1/2, where E is the elastic modulus and H is thehardness.[40]
The Vickers hardness increased marginally from 5.37(60.08) GPa in the amorphous structure to 6.17 (60.11)and 6.35 (60.10) GPa in the partially (24 hours at 633F. Stress-Life MeasurementsK) and fully (24 hours at 723 K) crystallized structures,
Fatigue lifetimes (Nf) were measured over a range of respectively. For anneals at 633 K, the majority of thecyclic stresses by cycling 3 3 3 3 50 mm rectangular beams increase in hardness occurred within the first 1 hour of heatin four-point bending, with an inner span (S1) and outer span treatment (Figure 4), coincident with only a slight sharpening(S2) of 10.2 and 20.3 mm, respectively. The specimens, of the X-ray pattern (Figure 3). Other studies of essentiallywhich had been previously polished to an ,1 mm surface the same alloy (Zr41Ti13Cu13Ni10Be23) have reported an evenfinish, were cycled under load control at n 5 25 Hz (sinusoi- higher hardness (,9.5 GPa) after annealing at 930 K fordal waveform) with a load ratio of R 5 0.1 in a room- 2 hours.[36]
air environment (25 8C, ,45 pct relative humidity) on a A catastrophic shear instability in the fully amorphousservohydraulic mechanical test frame. Stresses were calcu- structure severely limits the amount of macroscopic plastic-lated at the tensile surface within the inner span using the ity, or stable elongation after the elastic limit, that can beequation measured with a conventional tensile test.[30] (Note that in
compression, however, plastic strains of several percentagess 5
3P(S2 2 S1)2bh2 [2] are observed.[30]) Because the deformation zone under an
indent is more stable, depth-sensing indentation experimentson selected microstructures were used to measure changeswhere P is the applied load, b is the specimen thickness,
and h is the specimen height. A total of 21 beams were in deformation behavior upon crystallization (Figure 5). Inthe amorphous metal, substantial plastic deformation wastested at maximum stresses ranging from 100 to 1800 MPa
(just below the tensile failure stress), with multiple measure- observed in the form of hysteresis in the loading-unloadingcurve and a permanent depression remained on the specimenments made at each stress when possible. Tests were termi-
nated in cases where failure had not occurred after 2 3 107 surface (Figure 5(a)). After heat treating the sample at 633
1742—VOLUME 30A, JULY 1999 METALLURGICAL AND MATERIALS TRANSACTIONS A

Fig. 5—Depth-sensing indentation measurements and optical micrographs of the remaining hardness impressions of (a) a fully amorphous specimen, (b)a specimen annealed at 633 K for 12 h, and (c) a specimen annealed at 723 K for 24 h.
K for 12 hours (Figures 2 and 3), the degree of hysteresis strain is shown in Figure 6 for the 7-mm-thick specimen,which failed at ,68 MPa!m (K
˙5 0.012 MPa!m s21).was markedly reduced, and a Hertzian ring crack formed
around the indent (Figure 5(b)). Finally, after 24 hours at Thermal exposure, resulting in partial or full crystalliza-tion, led to a dramatic reduction in fracture toughness to723 K, severe cracking was observed under the indent, and
a distinct jump associated with such cracking was recorded ,1 MPa!m (Figure 7). While the toughness of the amor-phous microstructure is comparable to that of a typical poly-at the peak indent load (Figure 5(c)). In this case, the hystere-
sis was associated primarily with cracking rather than plastic crystalline aluminum or steel alloy, the toughness afterpartial or full crystallization is comparable to that of silicadeformation. Consistent with the increase in hardness, the
total penetration depth at peak load decreased from ,140mm in the amorphous structure to ,110 mm in the par-tially (12 hours at 633 K) crystallized microstructure and to,100 mm in the full (24 hours at 723 K) crystallizedmicrostructure.
B. Fracture Toughness
Both the 7-mm and the 4-mm thick C(T) samplesexceeded the plane-strain thickness requirement in ASTME399, i.e., B . 2.5(KIc /sY)2 , 2 mm. Because of crackbranching in the 7-mm-thick specimens, however, these frac-ture toughness values do not strictly conform to ASTME399; we therefore refer to them as KQ rather than KIc.Significant variability was observed in the fracture-tough-ness data. Sources of this variability may be associated withresidual stresses at the surface of castings, compositionalvariation (particularly oxygen), crack branching and liga-ment bridging, and sensitivity to loading rate; these issueare discussed more fully subsequently. The highest measuredvalue was ,68 MPa!m (measured with a 7-mm-thick sam- Fig. 6—A typical plot of load, P, vs back-face strain, «, for a specimenple), and the lowest was ,30 MPa!m (measured with a 4- loaded to failure. Fracture occurred at KQ , 68 MPa!m (at a loading rate,
K˙
, of 0.012 MPa!m s21). Vertical arrow indicates catastrophic failure.mm-thick sample). For example, a plot of load vs back-face
METALLURGICAL AND MATERIALS TRANSACTIONS A VOLUME 30A, JULY 1999—1743

where the fracture toughness dropped from 67 to 14MPa!m after annealing at 713 K for 7 minutes.[17]
Fracture surfaces in the fully amorphous Zr-Ti-Ni-Cu-Bespecimens exhibited a veinlike morphology (Figures 8(a)through (c)), typical of many metallic glasses.[3,5] In someregions, these ridges were quite large and ran nominally paral-lel to the direction of crack propagation (Figures 8(a) and (b)).At higher magnifications, a vein pattern typical of metallic-glass fracture was observed (Figure 8(c)). Stereophotogram-metric investigations of matching fracture surfaces reveal thatthe tips of the ridges in Figure 8(c) match across the fractureplane[41] and show evidence of substantial local necking andplastic deformation. The features in Figure 8(c) have beenlikened to that found after the separation of grease or adhesivefilms.[2,3,42] In some cases, fracture-surface morphologieswere stronglysuggestive of local melting during fracture (Fig-ure 9). In marked contrast, fracture surfaces in the partiallyand fully crystallized structures were relatively featureless atcomparable magnifications (Figure 8(d)).
Fig. 7—Fracture toughness plotted as a function of annealing time forspecimens heat treated at both 633 and 723 K in vacuum. Data are comparedto the as-received, amorphous samples, which were tested at a K
˙of 0.012 IV. FATIGUE-CRACK GROWTH AND STRESS-
to 0.3 MPa!m s21. LIFE BEHAVIOR
A. Fatigue-Crack Growth Rate Behavior
The drastic embrittlement upon crystallization meant thatglass. Similarly, severe embrittlement was observed in amelt-spun ribbon (57 mm thick) of amorphous Ni78Si10B12, stable fatigue cracking was not observed in the annealed
Fig. 8—Scanning electron micrographs at increasing magnification of overload fracture surfaces in (a) through (c) the fully amorphous alloy and (d ) apartially crystallized specimen annealed at 633 K for 12 h. The arrow indicates the direction of crack propagation.
1744—VOLUME 30A, JULY 1999 METALLURGICAL AND MATERIALS TRANSACTIONS A

(a)
Fig. 9—(a) and (b) Scanning electron micrographs of an overload fracturesurface in the as-received, fully amorphous specimen. These morphologiesare strongly suggestive of local melting during fracture. The arrow indicatesthe direction of crack propagation.
samples (specifically, samples annealed at 633 K for 12hours and at 723 K for 24 hours). Any attempt to grow
(b)stable cracks from the machined notches led to catastrophicfailure. Such behavior is typical of very brittle (untoughened) Fig. 10—Results in the form of growth rates, da/dN, plotted as a function
of DK (a) are shown for a range of fully amorphous specimens (R 5 0.1ceramics and is consistent with the precipitous drop in tough-and v 5 25 Hz) and (b) are compared with behavior in a high-strengthness upon crystallization.steel (300-M) and an age-hardened aluminum alloy (2090-T81). Also shownIn the fully amorphous metal, however, stable fatigue- in (b) are the striation spacing measurements and prediction from the crack-
crack growth was readily characterized under cyclic loading. tip opening displacement model (Eq. [6]).Growth rates are plotted against DK in Figure 10(a), for aspecimen tested at R 5 0.1 and v 5 25 Hz. Unlike mostprevious results for metallic glasses, these data represent da
dN5 C8 DKm [3]crack growth under plane-strain conditions (Table III). The
growth-rate behavior is compared to that of an ultrahigh-strength steel (300-M, quenched, and 200 8C-tempered Si- (where m is the crack-growth exponent and C8 is a scaling
constant), the exponent m in the midrange of growth ratesmodified 4340)[43] and an age-hardened aluminum alloy(2090-T81)[44] in Figure 10(b). It is apparent that the cyclic (,10210 to 1027 m/cycle) lies in the range of m , 2 to 5
(Figure 10 and Table III), typical of ductile crystalline metalscrack growth rates in the amorphous metal are comparable tothose observed in traditional polycrystalline metallic alloys. in this regime. These values of m are in marked contrast to
the fatigue properties of ceramics[46] and oxide glass,[47]Indeed, when these data are regression fit to a simple Parispower-law equation,[45] where m typically lies in the range of m , 15 to 50. Values
METALLURGICAL AND MATERIALS TRANSACTIONS A VOLUME 30A, JULY 1999—1745

Table III. Fatigue-Crack Growth Properties of Metallic Glasses (at R 5 0.1)
Thickness, C8DKTHB (m/cycle)
Alloy Reference (mm) (MPa!m)2m m (MPa!m)
Pd80Si20 15 ,60 to 65 — 4 9Ni39Fe38P14B6Al3 9 ,43 2.8 3 10210 2.25 6Fe40Ni40P14B6 11 10 5.8 3 10211 3.85 2Co72.15Fe5.85Mo2B15Si5 16 30 1.2 3 10211 3.3 7Co76.05Fe1.95Mn4B12Si6 16 30 1.4 3 10213 5.7 5Ni78Si10B12 17, 18, 19 52 to 57 2.5 3 10210 2.2 0.5Zr41.2Ti13.8Cu12.5Ni10Be22.5 this study ,7000 1.6 3 10211 2.7 1 to 3
1.7 3 10213 4.96.3 3 10212 3.4
of DKTH in the metallic glass ranged from ,1 to 3 As the load ratio was increased to R 5 0.5, cyclic crackgrowth rates were accelerated and fatigue thresholds wereMPa!m, again comparable to many high-strength steel and
aluminum alloys. These data are compared in Table III to reduced, similar to trends observed in ductile crystallinemetals at near-threshold growth rates (Figure 12) and to aresults from the only other known fatigue-crack propagation
measurements in metallic glass, all of which were performed rapidly quenched Ni78Si10B12 glass alloy (57-mm thick).[19]
These data can be expressed in terms of a modified Parison rapidly quenched, thin ribbons.[9,11,15–19]
Several points should be noted here. First, whereas in power-law relationship, which includes the effect of bothDK and Kmax:[48]fatigue, growth rates (at 25 Hz and R 5 0.1) approach
catastrophic failure at DK , 12 MPa!m (K˙
, 600MPa!m s21 at instability), under monotonic loading, frac- da
dN5 C(Kmax)n(DK )p [4]
ture toughnesses as high as ,68 MPa!m (K˙
, 0.012MPa!m s21) are measured (Figure 6). Preliminary experi- where n and p are experimentally determined crack-growthmental work suggests that fracture toughness may depend exponents and C is a scaling constant independent of Kmax,strongly on the loading rate. In Figure 11, for example, DK, and R. In this form, m 5 n 1 p and C 5 C8(1 2 R)n
fracture toughness is plotted in terms of loading rate for A regression fit of Eq. [4] to the data in Figure 12 yieldsboth 7- and 4-mm-thick specimens. Also included on this values of C 5 4.1 3 10212, n 5 2.3, and p 5 1.2 (units:plot are the points of criticality as measured during fatigue m/cycle, MPa!m).tests at 25 Hz. While there may be a trend toward lower The effect of load-ratio changes on fatigue-crack propaga-toughness with a higher loading rate, scatter in the data make tion in crystalline metals (at intermediate-to-low growthany conclusions difficult. Second, significant scatter wasobserved in the crack-growth data from specimen to speci-men in the 7-mm-thick samples. This is believed to be associ-ated with the presence of compressive residual stresses inthe surface layers of the heats.
Fig. 12—Results in the form of growth rates, da/dN, plotted as a functionof DK are shown in the fully amorphous structure for load ratios of R 50.1 and 0.5 (v 5 25 Hz). As the load ratio was increased to R 5 0.5, cycliccrack growth rates are accelerated and fatigue thresholds, DKTH, reduced,Fig. 11—Variation in the measured fracture toughness, KQ , of the fully
amorphous alloy from both toughness tests and the instability in fatigue- similar to behavior in ductile crystalline metals at near-threshold growthrates.crack propagation tests, as a function of the loading rate, K
˙.
1746—VOLUME 30A, JULY 1999 METALLURGICAL AND MATERIALS TRANSACTIONS A
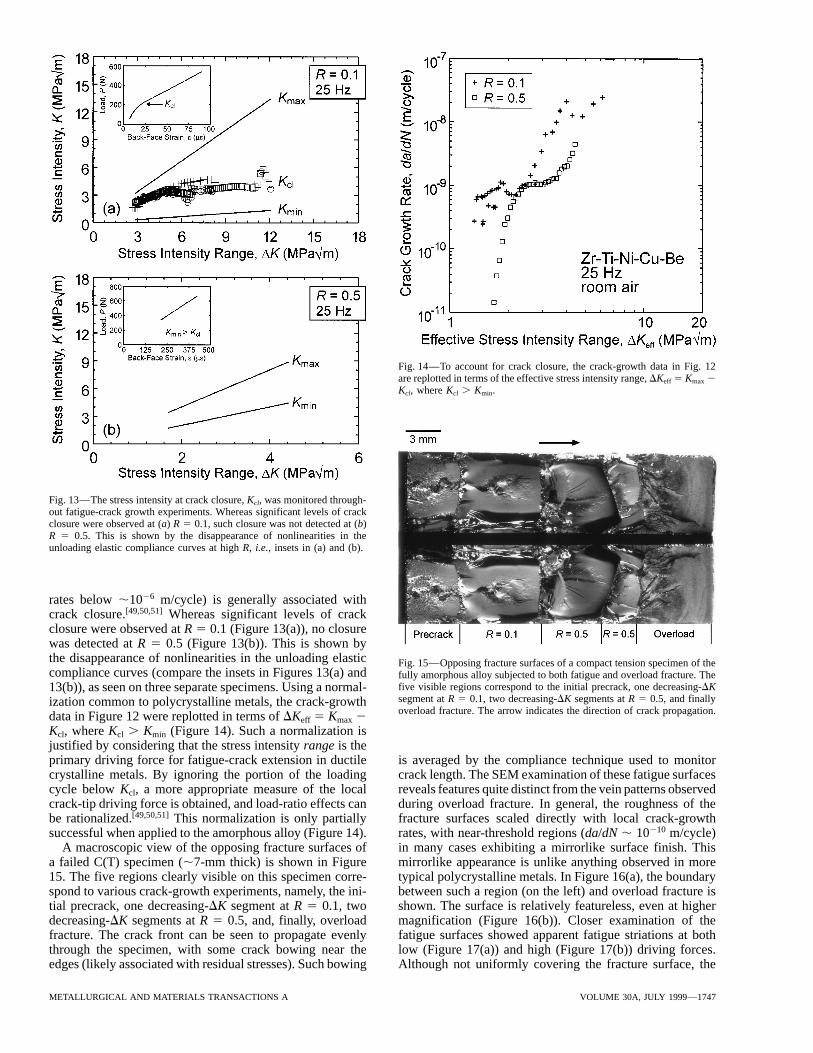
Fig. 14—To account for crack closure, the crack-growth data in Fig. 12are replotted in terms of the effective stress intensity range, DKeff 5 Kmax 2Kcl, where Kcl . Kmin.
Fig. 13—The stress intensity at crack closure, Kcl, was monitored through-out fatigue-crack growth experiments. Whereas significant levels of crackclosure were observed at (a) R 5 0.1, such closure was not detected at (b)R 5 0.5. This is shown by the disappearance of nonlinearities in theunloading elastic compliance curves at high R, i.e., insets in (a) and (b).
rates below ,1026 m/cycle) is generally associated withcrack closure.[49,50,51] Whereas significant levels of crackclosure were observed at R 5 0.1 (Figure 13(a)), no closurewas detected at R 5 0.5 (Figure 13(b)). This is shown bythe disappearance of nonlinearities in the unloading elastic Fig. 15—Opposing fracture surfaces of a compact tension specimen of thecompliance curves (compare the insets in Figures 13(a) and fully amorphous alloy subjected to both fatigue and overload fracture. The
five visible regions correspond to the initial precrack, one decreasing-DK13(b)), as seen on three separate specimens. Using a normal-segment at R 5 0.1, two decreasing-DK segments at R 5 0.5, and finallyization common to polycrystalline metals, the crack-growthoverload fracture. The arrow indicates the direction of crack propagation.data in Figure 12 were replotted in terms of DKeff 5 Kmax 2
Kcl, where Kcl . Kmin (Figure 14). Such a normalization isjustified by considering that the stress intensity range is theprimary driving force for fatigue-crack extension in ductile is averaged by the compliance technique used to monitor
crack length. The SEM examination of these fatigue surfacescrystalline metals. By ignoring the portion of the loadingcycle below Kcl, a more appropriate measure of the local reveals features quite distinct from the vein patterns observed
during overload fracture. In general, the roughness of thecrack-tip driving force is obtained, and load-ratio effects canbe rationalized.[49,50,51] This normalization is only partially fracture surfaces scaled directly with local crack-growth
rates, with near-threshold regions (da/dN , 10210 m/cycle)successful when applied to the amorphous alloy (Figure 14).A macroscopic view of the opposing fracture surfaces of in many cases exhibiting a mirrorlike surface finish. This
mirrorlike appearance is unlike anything observed in morea failed C(T) specimen (,7-mm thick) is shown in Figure15. The five regions clearly visible on this specimen corre- typical polycrystalline metals. In Figure 16(a), the boundary
between such a region (on the left) and overload fracture isspond to various crack-growth experiments, namely, the ini-tial precrack, one decreasing-DK segment at R 5 0.1, two shown. The surface is relatively featureless, even at higher
magnification (Figure 16(b)). Closer examination of thedecreasing-DK segments at R 5 0.5, and, finally, overloadfracture. The crack front can be seen to propagate evenly fatigue surfaces showed apparent fatigue striations at both
low (Figure 17(a)) and high (Figure 17(b)) driving forces.through the specimen, with some crack bowing near theedges (likely associated with residual stresses). Such bowing Although not uniformly covering the fracture surface, the
METALLURGICAL AND MATERIALS TRANSACTIONS A VOLUME 30A, JULY 1999—1747

Fig. 17—Scanning electron micrographs of fatigue fracture surfaces in thefully amorphous alloy grown at R 5 0.1, v 5 25 Hz. In (a), DK , 3MPa!m and da/dN , 10210 m/cycle, whereas in (b), DK , 10 MPa!mand da/dN , 1028 m/cycle. The arrow indicates the direction of crackpropagation.
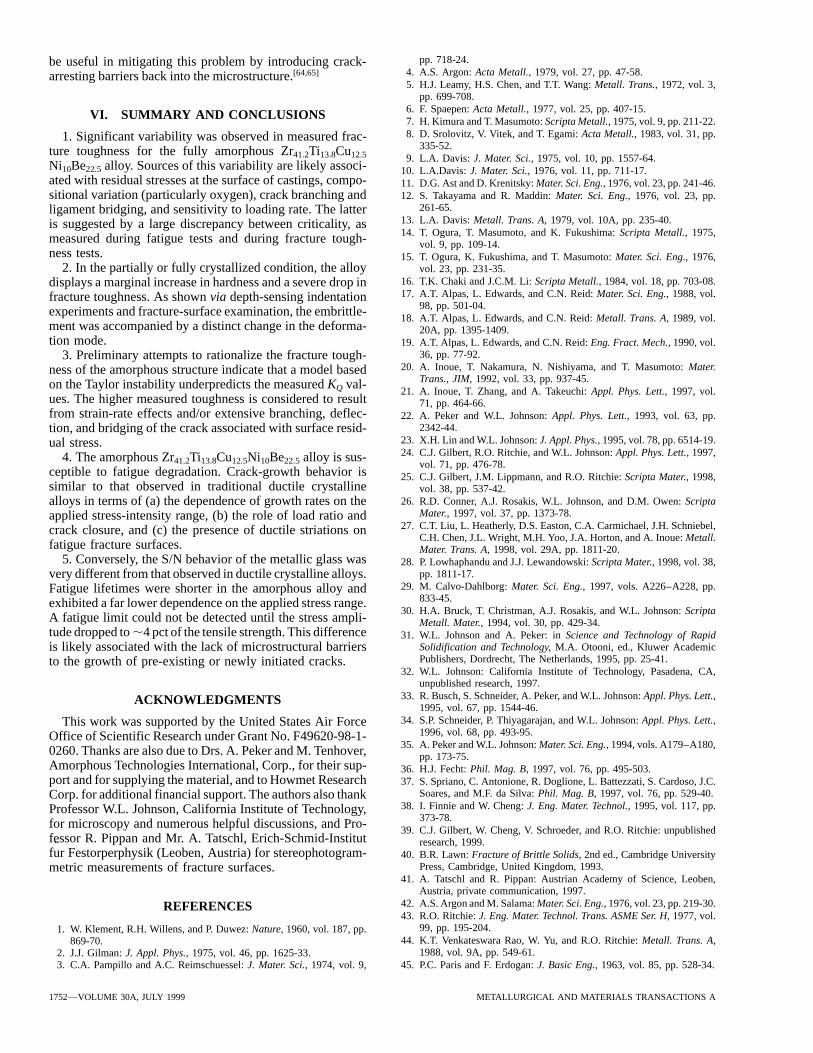
in a source of crack bridging (Figure 18) and, in somecases, multiple crack branches. The large degree of slip-band formation, which has been observed ahead of fatiguecracks in thin sheets of rapidly quenched amorphous met-als,[15,18] was not observed in the present alloy, presumablybecause deformation was constrained under plane-strain con-ditions. It is significant to note that, as in polycrystallinemetallic alloys, the source of crack closure appeared to bethese tortuous, branching crack paths and the rough fracturemorphologies (Figure 18). When the minimum stress inten-sity exceeded Kcl at higher load ratios, however, such closurewas not observed (Figure 13(b)). Note that such branching,as mentioned previously, was not observed in the 4-mm-thick samples, where the surface layers (and accompanyingresidual stresses) were machined off.
B. Variable-Amplitude Fatigue-Crack Growth Behavior
Results of the variable-amplitude fatigue experiments,specifically involving low-high block overload sequences,are shown in Figure 19(a) for an abrupt transition in DKfrom ,3.2 MPa!m (near threshold) to ,5.5 MPa!m (R5 0.1, v 5 25 Hz). Immediately after the increase in DK,the growth rate markedly increased and then graduallyFig. 16—(a) Scanning electron micrograph of the boundary between near-
threshold fatigue (on the left) and final fracture (on the right). The near- decayed to a new steady-state value. A steady state wasthreshold fatigue region (at DK , 3 Mpa!m) has a macroscopic mirrorlike reached after ,1 mm of crack extension at a growth rateappearance and is nearly featureless, even at higher magnification in (b). some two orders of magnitude less than the initial transientThe arrow indicates direction of crack propagation.
(Figure 19(a)). The SEM examination of the fracture surfaceindicated a distinct change in surface appearance associatedwith this transient (Figure 19(b)). The almost featureless
striation spacing scales with growth rates, as plotted in Figure near-threshold fatigue region (where da/dN , 10210 m/10. Moreover, consistent with measurements in rapidly cycle) precedes a sharp transition to a rougher surface associ-quenched Ni-Fe-[19] and Ni-Si-B-[18] based metallic glasses, ated with the higher transient growth rates (,1027 m/cycle).the striation spacings significantly overestimate the macro- The growth-rate behavior is similar to transients observedscopic growth rates. Such overestimation is typical of metal- in ductile crystalline alloys following block overloads[52] andlic materials at growth rates below ,1026 m/cycle and is is similar to behavior measured in a rapidly quenched, thinassociated with nonuniform crack extension along the sheet (,30 mm thickness) of a Co-Fe-Mo-B-Si metalliccrack front. glass.[16]
Optical microscopic and SEM analysis of crack profilesrevealed that fatigue cracks did not generally propagate con-
C. S/N Behaviortinuously in the 7-mm-thick specimens. Substantial crackdeflection and branching were observed (Figure 18). Flaws The normalized stress amplitude (sa /su) is plotted against
cycles to failure in Figure 20(a). Results for the Zr41.2Ti13.8-frequently nucleated ahead of the main crack, creating largeregions of material that spanned the crack faces, resulting Cu12.5Ni10Be22.5 alloy are again compared to those for the
1748—VOLUME 30A, JULY 1999 METALLURGICAL AND MATERIALS TRANSACTIONS A
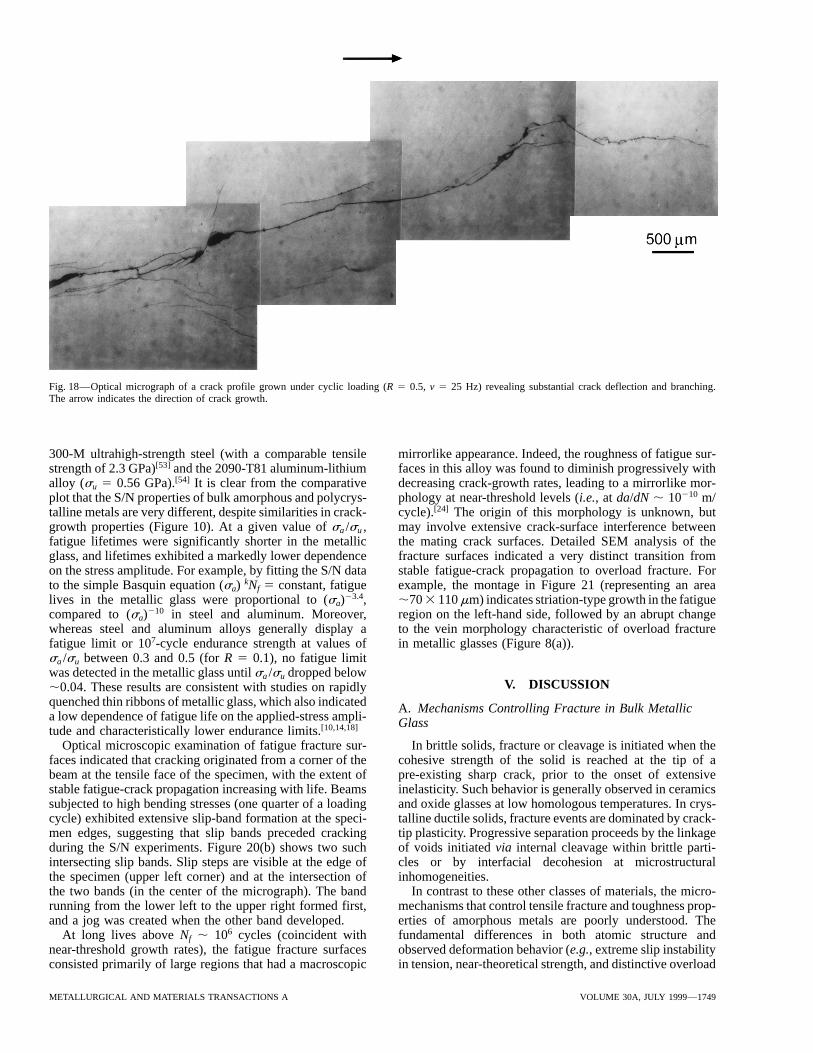
Fig. 18—Optical micrograph of a crack profile grown under cyclic loading (R 5 0.5, v 5 25 Hz) revealing substantial crack deflection and branching.The arrow indicates the direction of crack growth.
300-M ultrahigh-strength steel (with a comparable tensile mirrorlike appearance. Indeed, the roughness of fatigue sur-faces in this alloy was found to diminish progressively withstrength of 2.3 GPa)[53] and the 2090-T81 aluminum-lithium
alloy (su 5 0.56 GPa).[54] It is clear from the comparative decreasing crack-growth rates, leading to a mirrorlike mor-phology at near-threshold levels (i.e., at da/dN , 10210 m/plot that the S/N properties of bulk amorphous and polycrys-
talline metals are very different, despite similarities in crack- cycle).[24] The origin of this morphology is unknown, butmay involve extensive crack-surface interference betweengrowth properties (Figure 10). At a given value of sa /su ,
fatigue lifetimes were significantly shorter in the metallic the mating crack surfaces. Detailed SEM analysis of thefracture surfaces indicated a very distinct transition fromglass, and lifetimes exhibited a markedly lower dependence
on the stress amplitude. For example, by fitting the S/N data stable fatigue-crack propagation to overload fracture. Forexample, the montage in Figure 21 (representing an areato the simple Basquin equation (sa) kNf 5 constant, fatigue
lives in the metallic glass were proportional to (sa)23.4, ,70 3 110 mm) indicates striation-type growth in the fatigueregion on the left-hand side, followed by an abrupt changecompared to (sa)210 in steel and aluminum. Moreover,
whereas steel and aluminum alloys generally display a to the vein morphology characteristic of overload fracturein metallic glasses (Figure 8(a)).fatigue limit or 107-cycle endurance strength at values of
sa /su between 0.3 and 0.5 (for R 5 0.1), no fatigue limitwas detected in the metallic glass until sa /su dropped below
V. DISCUSSION,0.04. These results are consistent with studies on rapidlyquenched thin ribbons of metallic glass, which also indicated A. Mechanisms Controlling Fracture in Bulk Metallica low dependence of fatigue life on the applied-stress ampli- Glasstude and characteristically lower endurance limits.[10,14,18]
Optical microscopic examination of fatigue fracture sur- In brittle solids, fracture or cleavage is initiated when thecohesive strength of the solid is reached at the tip of afaces indicated that cracking originated from a corner of the
beam at the tensile face of the specimen, with the extent of pre-existing sharp crack, prior to the onset of extensiveinelasticity. Such behavior is generally observed in ceramicsstable fatigue-crack propagation increasing with life. Beams
subjected to high bending stresses (one quarter of a loading and oxide glasses at low homologous temperatures. In crys-talline ductile solids, fracture events are dominated by crack-cycle) exhibited extensive slip-band formation at the speci-
men edges, suggesting that slip bands preceded cracking tip plasticity. Progressive separation proceeds by the linkageof voids initiated via internal cleavage within brittle parti-during the S/N experiments. Figure 20(b) shows two such
intersecting slip bands. Slip steps are visible at the edge of cles or by interfacial decohesion at microstructuralinhomogeneities.the specimen (upper left corner) and at the intersection of
the two bands (in the center of the micrograph). The band In contrast to these other classes of materials, the micro-mechanisms that control tensile fracture and toughness prop-running from the lower left to the upper right formed first,
and a jog was created when the other band developed. erties of amorphous metals are poorly understood. Thefundamental differences in both atomic structure andAt long lives above Nf , 106 cycles (coincident with
near-threshold growth rates), the fatigue fracture surfaces observed deformation behavior (e.g., extreme slip instabilityin tension, near-theoretical strength, and distinctive overloadconsisted primarily of large regions that had a macroscopic
METALLURGICAL AND MATERIALS TRANSACTIONS A VOLUME 30A, JULY 1999—1749

Fig. 19—(a) Results for a low-high block overload sequence are shownfor an abrupt transition in DK from ,3.2 to ,5.5 MPa!m (R 5 0.1, v 525 Hz) in the metallic glass. (b) A scanning electron micrograph of thefracture surface in this region indicates a distinct change in contrast associ-ated with this overload. The arrow indicates the direction of crackpropagation.
Fig. 20—(a) S/N data as the stress amplitude, sa 5 1/2 (smax 2 smin),normalized by the tensile strength, su , plotted as a function of the numberof cycles to failure, Nf , for the bulk metallic glass. Data are compared tohigh-strength steel (300-M) and aluminum (2090-T81) alloys. (b) A scan-fracture surface morphologies) make it clear that such mech- ning electron micrograph showing evidence of slip-band formation at the
anisms are quite distinct from tensile fracture in crystalline edge of an S/N specimen.metals, ceramics, or oxide glasses. Indeed, largely due tothe vein morphology (Figures 8(a) through (c)) commonlyobserved on failure surfaces in metallic glasses,[3,5] some this process dominates, the critical fracture event is associ-have suggested that fracture in these materials is a variant ated with the onset of this instability, governed by the surfaceof the Taylor instability.[3,42] Well studied in the fluids and tension of the fluid and the applied pressure gradient. Theadhesives literature, this instability is associated with the notion that material local to the crack tip is softened, possiblytendency of a fluid meniscus (under a positive pressure due to adiabatic heating[5,58] or a strain-softening phenome-gradient), propagating in the direction of its convex curva- non,[6,42] is supported by the fracture-surface appearanceture, to break up into a series of fingers which penetrate the (Figure 9). In addition, recent measurements have detectedfluid meniscus. The process is considered to generate the significant temperature elevations during deformation[58]
ubiquitous vein morphology as the material between the and fracture.[59]
fingers necks down to failure. The vein markings are compa- Argon and Salama[42] developed a model for the fracturerable to those observed during the separation of oil or grease toughness of metallic glasses based on the resistance of afilms[55] and adhesive films[56] and to those associated with blunt crack to this instability. By determining the criticalintergranular fracture by diffusional flow at high homolo- crack-tip opening displacement (d) at the onset of the insta-
bility, they develop an expression for the fracture toughness:gous temperatures in some metals[56] and ceramics.[57] When
1750—VOLUME 30A, JULY 1999 METALLURGICAL AND MATERIALS TRANSACTIONS A
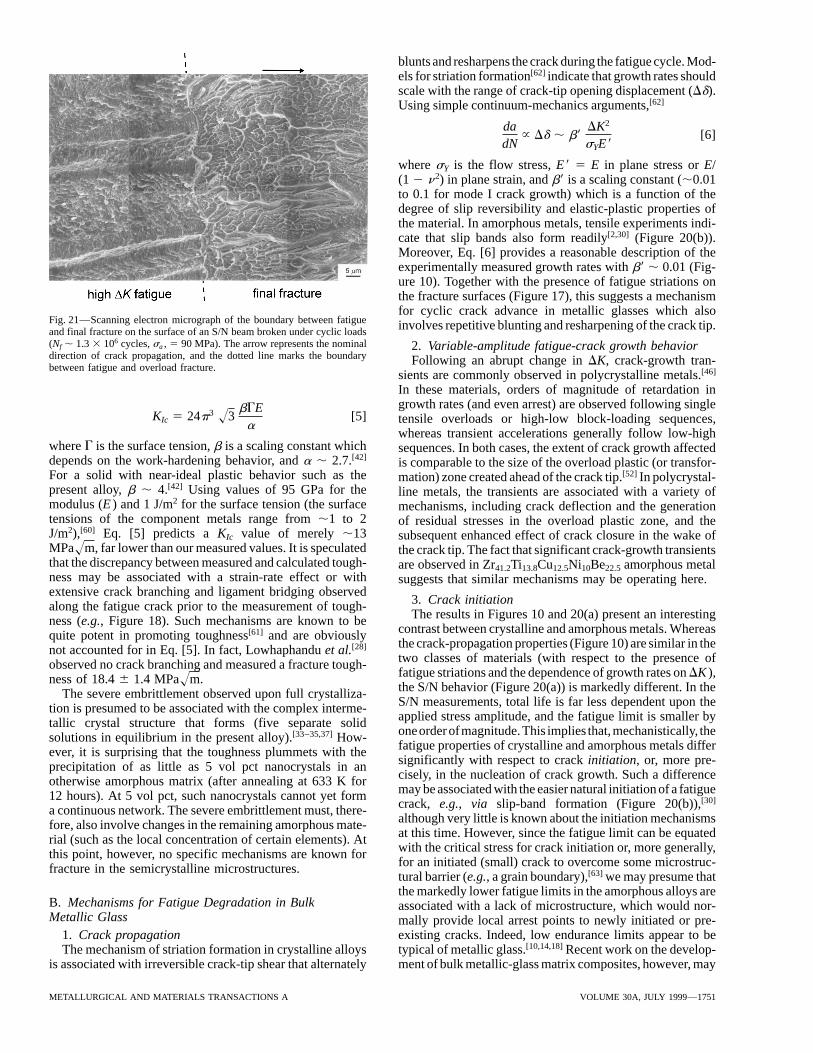
blunts and resharpens the crack during the fatigue cycle. Mod-els for striation formation[62] indicate that growth rates shouldscale with the range of crack-tip opening displacement (Dd).Using simple continuum-mechanics arguments,[62]
dadN
} Dd , b8DK2
sYE8[6]
where sY is the flow stress, E8 5 E in plane stress or E/(1 2 n 2) in plane strain, and b8 is a scaling constant (,0.01to 0.1 for mode I crack growth) which is a function of thedegree of slip reversibility and elastic-plastic properties ofthe material. In amorphous metals, tensile experiments indi-cate that slip bands also form readily[2,30] (Figure 20(b)).Moreover, Eq. [6] provides a reasonable description of theexperimentally measured growth rates with b8 , 0.01 (Fig-ure 10). Together with the presence of fatigue striations onthe fracture surfaces (Figure 17), this suggests a mechanismfor cyclic crack advance in metallic glasses which also
Fig. 21—Scanning electron micrograph of the boundary between fatigue involves repetitive blunting and resharpening of the crack tip.and final fracture on the surface of an S/N beam broken under cyclic loads(Nf , 1.3 3 106 cycles, sa , 5 90 MPa). The arrow represents the nominal 2. Variable-amplitude fatigue-crack growth behaviordirection of crack propagation, and the dotted line marks the boundary Following an abrupt change in DK, crack-growth tran-between fatigue and overload fracture.
sients are commonly observed in polycrystalline metals.[46]
In these materials, orders of magnitude of retardation ingrowth rates (and even arrest) are observed following single
KIc 5 24p3 !3bGE
a[5] tensile overloads or high-low block-loading sequences,
whereas transient accelerations generally follow low-highwhere G is the surface tension, b is a scaling constant which sequences. In both cases, the extent of crack growth affecteddepends on the work-hardening behavior, and a , 2.7.[42] is comparable to the size of the overload plastic (or transfor-For a solid with near-ideal plastic behavior such as the mation) zone created ahead of the crack tip.[52] In polycrystal-present alloy, b , 4.[42] Using values of 95 GPa for the line metals, the transients are associated with a variety ofmodulus (E ) and 1 J/m2 for the surface tension (the surface mechanisms, including crack deflection and the generationtensions of the component metals range from ,1 to 2 of residual stresses in the overload plastic zone, and theJ/m2),[60] Eq. [5] predicts a KIc value of merely ,13 subsequent enhanced effect of crack closure in the wake ofMPa!m, far lower than our measured values. It is speculated the crack tip. The fact that significant crack-growth transientsthat the discrepancy between measured and calculated tough- are observed in Zr41.2Ti13.8Cu12.5Ni10Be22.5 amorphous metalness may be associated with a strain-rate effect or with suggests that similar mechanisms may be operating here.extensive crack branching and ligament bridging observed
3. Crack initiationalong the fatigue crack prior to the measurement of tough-The results in Figures 10 and 20(a) present an interestingness (e.g., Figure 18). Such mechanisms are known to be
contrast between crystalline and amorphous metals. Whereasquite potent in promoting toughness[61] and are obviouslythe crack-propagation properties (Figure 10) are similar in thenot accounted for in Eq. [5]. In fact, Lowhaphandu et al.[28]
two classes of materials (with respect to the presence ofobserved no crack branching and measured a fracture tough-fatigue striations and the dependence of growth rates on DK ),ness of 18.4 6 1.4 MPa!m.the S/N behavior (Figure 20(a)) is markedly different. In theThe severe embrittlement observed upon full crystalliza-S/N measurements, total life is far less dependent upon thetion is presumed to be associated with the complex interme-applied stress amplitude, and the fatigue limit is smaller bytallic crystal structure that forms (five separate solidoneorder ofmagnitude. This implies that, mechanistically, thesolutions in equilibrium in the present alloy).[33–35,37] How-fatigue properties of crystalline and amorphous metals differever, it is surprising that the toughness plummets with thesignificantly with respect to crack initiation, or, more pre-precipitation of as little as 5 vol pct nanocrystals in ancisely, in the nucleation of crack growth. Such a differenceotherwise amorphous matrix (after annealing at 633 K formay be associated with the easier natural initiation of a fatigue12 hours). At 5 vol pct, such nanocrystals cannot yet formcrack, e.g., via slip-band formation (Figure 20(b)),[30]
a continuous network. The severe embrittlement must, there-although very little is known about the initiation mechanismsfore, also involve changes in the remaining amorphous mate-at this time. However, since the fatigue limit can be equatedrial (such as the local concentration of certain elements). Atwith the critical stress for crack initiation or, more generally,this point, however, no specific mechanisms are known forfor an initiated (small) crack to overcome some microstruc-fracture in the semicrystalline microstructures.tural barrier (e.g., a grain boundary),[63] we may presume thatthe markedly lower fatigue limits in the amorphous alloys are
B. Mechanisms for Fatigue Degradation in Bulk associated with a lack of microstructure, which would nor-Metallic Glass mally provide local arrest points to newly initiated or pre-
existing cracks. Indeed, low endurance limits appear to be1. Crack propagationThe mechanism of striation formation in crystalline alloys typical of metallic glass.[10,14,18] Recent work on the develop-
ment of bulk metallic-glass matrix composites, however, mayis associated with irreversible crack-tip shear that alternately
METALLURGICAL AND MATERIALS TRANSACTIONS A VOLUME 30A, JULY 1999—1751
pp. 718-24.be useful in mitigating this problem by introducing crack-4. A.S. Argon: Acta Metall., 1979, vol. 27, pp. 47-58.arresting barriers back into the microstructure.[64,65]
5. H.J. Leamy, H.S. Chen, and T.T. Wang: Metall. Trans., 1972, vol. 3,pp. 699-708.
6. F. Spaepen: Acta Metall., 1977, vol. 25, pp. 407-15.VI. SUMMARY AND CONCLUSIONS 7. H. Kimura and T. Masumoto: Scripta Metall., 1975, vol. 9, pp. 211-22.8. D. Srolovitz, V. Vitek, and T. Egami: Acta Metall., 1983, vol. 31, pp.1. Significant variability was observed in measured frac-
335-52.ture toughness for the fully amorphous Zr41.2Ti13.8Cu12.5 9. L.A. Davis: J. Mater. Sci., 1975, vol. 10, pp. 1557-64.Ni10Be22.5 alloy. Sources of this variability are likely associ- 10. L.A.Davis: J. Mater. Sci., 1976, vol. 11, pp. 711-17.ated with residual stresses at the surface of castings, compo- 11. D.G. Ast and D. Krenitsky: Mater. Sci. Eng., 1976, vol. 23, pp. 241-46.sitional variation (particularly oxygen), crack branching and 12. S. Takayama and R. Maddin: Mater. Sci. Eng., 1976, vol. 23, pp.
261-65.ligament bridging, and sensitivity to loading rate. The latter13. L.A. Davis: Metall. Trans. A, 1979, vol. 10A, pp. 235-40.is suggested by a large discrepancy between criticality, as14. T. Ogura, T. Masumoto, and K. Fukushima: Scripta Metall., 1975,measured during fatigue tests and during fracture tough- vol. 9, pp. 109-14.
ness tests. 15. T. Ogura, K. Fukushima, and T. Masumoto: Mater. Sci. Eng., 1976,2. In the partially or fully crystallized condition, the alloy vol. 23, pp. 231-35.
16. T.K. Chaki and J.C.M. Li: Scripta Metall., 1984, vol. 18, pp. 703-08.displays a marginal increase in hardness and a severe drop in17. A.T. Alpas, L. Edwards, and C.N. Reid: Mater. Sci. Eng., 1988, vol.fracture toughness. As shown via depth-sensing indentation
98, pp. 501-04.experiments and fracture-surface examination, the embrittle-18. A.T. Alpas, L. Edwards, and C.N. Reid: Metall. Trans. A, 1989, vol.
ment was accompanied by a distinct change in the deforma- 20A, pp. 1395-1409.tion mode. 19. A.T. Alpas, L. Edwards, and C.N. Reid: Eng. Fract. Mech., 1990, vol.
36, pp. 77-92.3. Preliminary attempts to rationalize the fracture tough-20. A. Inoue, T. Nakamura, N. Nishiyama, and T. Masumoto: Mater.ness of the amorphous structure indicate that a model based
Trans., JIM, 1992, vol. 33, pp. 937-45.on the Taylor instability underpredicts the measured KQ val-21. A. Inoue, T. Zhang, and A. Takeuchi: Appl. Phys. Lett., 1997, vol.
ues. The higher measured toughness is considered to result 71, pp. 464-66.from strain-rate effects and/or extensive branching, deflec- 22. A. Peker and W.L. Johnson: Appl. Phys. Lett., 1993, vol. 63, pp.
2342-44.tion, and bridging of the crack associated with surface resid-23. X.H. Lin and W.L. Johnson: J. Appl. Phys., 1995, vol. 78, pp. 6514-19.ual stress.24. C.J. Gilbert, R.O. Ritchie, and W.L. Johnson: Appl. Phys. Lett., 1997,4. The amorphous Zr41.2Ti13.8Cu12.5Ni10Be22.5 alloy is sus-
vol. 71, pp. 476-78.ceptible to fatigue degradation. Crack-growth behavior is 25. C.J. Gilbert, J.M. Lippmann, and R.O. Ritchie: Scripta Mater., 1998,similar to that observed in traditional ductile crystalline vol. 38, pp. 537-42.
26. R.D. Conner, A.J. Rosakis, W.L. Johnson, and D.M. Owen: Scriptaalloys in terms of (a) the dependence of growth rates on theMater., 1997, vol. 37, pp. 1373-78.applied stress-intensity range, (b) the role of load ratio and
27. C.T. Liu, L. Heatherly, D.S. Easton, C.A. Carmichael, J.H. Schniebel,crack closure, and (c) the presence of ductile striations onC.H. Chen, J.L. Wright, M.H. Yoo, J.A. Horton, and A. Inoue: Metall.
fatigue fracture surfaces. Mater. Trans. A, 1998, vol. 29A, pp. 1811-20.5. Conversely, the S/N behavior of the metallic glass was 28. P. Lowhaphandu and J.J. Lewandowski: Scripta Mater., 1998, vol. 38,
pp. 1811-17.very different from that observed in ductile crystalline alloys.29. M. Calvo-Dahlborg: Mater. Sci. Eng., 1997, vols. A226–A228, pp.Fatigue lifetimes were shorter in the amorphous alloy and
833-45.exhibited a far lower dependence on the applied stress range.30. H.A. Bruck, T. Christman, A.J. Rosakis, and W.L. Johnson: Scripta
A fatigue limit could not be detected until the stress ampli- Metall. Mater., 1994, vol. 30, pp. 429-34.tude dropped to ,4 pct of the tensile strength. This difference 31. W.L. Johnson and A. Peker: in Science and Technology of Rapid
Solidification and Technology, M.A. Otooni, ed., Kluwer Academicis likely associated with the lack of microstructural barriersPublishers, Dordrecht, The Netherlands, 1995, pp. 25-41.to the growth of pre-existing or newly initiated cracks.
32. W.L. Johnson: California Institute of Technology, Pasadena, CA,unpublished research, 1997.
33. R. Busch, S. Schneider, A. Peker, and W.L. Johnson: Appl. Phys. Lett.,ACKNOWLEDGMENTS1995, vol. 67, pp. 1544-46.
34. S.P. Schneider, P. Thiyagarajan, and W.L. Johnson: Appl. Phys. Lett.,This work was supported by the United States Air Force1996, vol. 68, pp. 493-95.Office of Scientific Research under Grant No. F49620-98-1-
35. A. Peker and W.L. Johnson: Mater. Sci. Eng., 1994, vols. A179–A180,0260. Thanks are also due to Drs. A. Peker and M. Tenhover, pp. 173-75.Amorphous Technologies International, Corp., for their sup- 36. H.J. Fecht: Phil. Mag. B, 1997, vol. 76, pp. 495-503.port and for supplying the material, and to Howmet Research 37. S. Spriano, C. Antonione, R. Doglione, L. Battezzati, S. Cardoso, J.C.
Soares, and M.F. da Silva: Phil. Mag. B, 1997, vol. 76, pp. 529-40.Corp. for additional financial support. The authors also thank38. I. Finnie and W. Cheng: J. Eng. Mater. Technol., 1995, vol. 117, pp.Professor W.L. Johnson, California Institute of Technology,
373-78.for microscopy and numerous helpful discussions, and Pro- 39. C.J. Gilbert, W. Cheng, V. Schroeder, and R.O. Ritchie: unpublishedfessor R. Pippan and Mr. A. Tatschl, Erich-Schmid-Institut research, 1999.fur Festorperphysik (Leoben, Austria) for stereophotogram- 40. B.R. Lawn: Fracture of Brittle Solids, 2nd ed., Cambridge University
Press, Cambridge, United Kingdom, 1993.metric measurements of fracture surfaces.41. A. Tatschl and R. Pippan: Austrian Academy of Science, Leoben,
Austria, private communication, 1997.42. A.S. Argon and M. Salama: Mater. Sci. Eng., 1976, vol. 23, pp. 219-30.REFERENCES43. R.O. Ritchie: J. Eng. Mater. Technol. Trans. ASME Ser. H, 1977, vol.
99, pp. 195-204.1. W. Klement, R.H. Willens, and P. Duwez: Nature, 1960, vol. 187, pp.44. K.T. Venkateswara Rao, W. Yu, and R.O. Ritchie: Metall. Trans. A,869-70.
1988, vol. 9A, pp. 549-61.2. J.J. Gilman: J. Appl. Phys., 1975, vol. 46, pp. 1625-33.3. C.A. Pampillo and A.C. Reimschuessel: J. Mater. Sci., 1974, vol. 9, 45. P.C. Paris and F. Erdogan: J. Basic Eng., 1963, vol. 85, pp. 528-34.
1752—VOLUME 30A, JULY 1999 METALLURGICAL AND MATERIALS TRANSACTIONS A

55. G.I. Taylor: Proc. R. Soc. London, 1950, vol. A201, pp. 192-96.46. C.J. Gilbert, R.H. Dauskardt, R.W. Steinbrech, R.N. Petrany, and R.O.Ritchie: J. Mater. Sci., 1995, vol. 30, pp. 643-54. 56. R.J. Fields and M.F. Ashby: Phil. Mag., 1976, vol. 33, pp. 33-48.
57. R.L. Tsai and R. Raj: Acta Metall., 1982, vol. 30, pp. 1043-58.47. S.J. Dill, S.J. Bennison, and R.H. Dauskardt: J. Am. Ceram. Soc.,1997, vol. 80, pp. 773-76. 58. H.A. Bruck, A.J. Rosakis, and W.L. Johnson: J. Mater. Res., 1996,
vol. 11, pp. 503-11.48. R.H. Dauskardt, M.R. James, J.R. Porter, and R.O. Ritchie: J. Am.Ceram. Soc., 1992, vol. 75, pp. 759-71. 59. C.J. Gilbert, J.W. Ager III, V. Schroeder, J.P. Lloyd, J.R. Graham, and
R.O. Ritchie: Appl. Phys. Lett., 1999, in press.49. W. Elber: Eng. Fract. Mech., 1970, vol. 2, pp. 37-45.50. R.A. Schmidt and P.C. Paris: Progress in Flaw Growth and Fracture 60. M.A. LaMadrid, S.D. O’Connor, A. Peker, W.L. Johnson, and J.D.
Baldeschwieler: J. Mater. Res., 1996, vol. 11, pp. 1494-99.Toughness Testing, ASTM, Philadelphia, PA, 1973, pp. 79-94.51. S. Suresh and R.O. Ritchie: in Fatigue Crack Growth Threshold Con- 61. R.O. Ritchie: Mater. Sci. Eng., 1988, vol. A103, pp. 15-28.
62. F.A. McClintock and R.M.N. Pelloux: “Boeing Scientific Researchcepts, D.L. Davidson and S. Suresh, eds., TMS-AIME, Warrendale,PA, 1984, pp. 227-61. Laboratories Document D1-82-0708”, 1968, cited in R.M.N. Pelloux:
Trans. ASM, 1969, vol. 62, pp. 281-85.52. C.M. Ward-Close, A.F. Blom, and R.O. Ritchie: Eng. Fract. Mech.,1989, vol. 32, pp. 613-38. 63. K.J. Miller: Fat. Fract. Eng. Mater. Struct., 1987, vol. 10, pp.
93-113.53. W.F. Brown, Jr.: Aerospace Structural Metals Handbook, Metals andCeramics Information Center, Syracuse, NY, 1989, vol. code 1224, 64. H. Choi-Yim, R. Busch, and W.L. Johnson: J. Appl. Phys., 1998, vol.
83, pp. 7993-97.pp. 1-30.54. K.T. Venkateswara Rao and R.O. Ritchie: Int. Mater. Rev., 1992, vol. 65. R.B. Dandliker, R.D. Conner, and W.L. Johnson: J. Mater. Res., 1998,
vol. 13, pp. 2896-2901.37, pp. 153-85.
METALLURGICAL AND MATERIALS TRANSACTIONS A VOLUME 30A, JULY 1999—1753
Related Documents