Pak J Commer Soc Sci Pakistan Journal of Commerce and Social Sciences 2014, Vol. 8 (3), 867-886 Measurement and Policy Implications of NAIRU in SAARC Countries Shabbir Ahmad Gondal Department of Economics, University of Sargodha, Sargodha. Pakistan Email:[email protected] Zakir Hussain Government College University, Faisalabad, Pakistan Email:[email protected] Rana Ejaz Ali Khan Department of Economics, The Islamia University of Bahawalpur, Bahawalpur. Pakistan Email: [email protected] Abstract The study mainly focused on the estimation and implementation of the concept of non- accelerating inflation rate of unemployment (NAIRU) in prominent SAARC countries (Pakistan, Bangladesh, India, Sri Lanka and Nepal) by using a panel dataset during 1971- 2012. Three approaches (i.e. the pooled OLS, the fixed effect, the random effect) were applied for empirical analysis. On the whole, the estimated values of NAIRU were reported 6.80 percent (with supply shocks) and 6.71 percent (without supply shocks) in these countries. The study also reported the values of NAIRU for Pakistan (6.73 percent), Bangladesh (7.85 percent), India (6.06 percent), Sri Lanka (6.04 percent) and Nepal (6.81 percent) separately. Furthermore, it was observed that when actual unemployment rate was below the reported value of NAIRU, there was a pressure on inflation rate to rise and vice versa (ceteris paribus) in these countries. The results were found significant in all the facets of the study. The study not only highlighted the policy implications but also suggested a comprehensive package of policy recommendations to address the problems of inflation and unemployment in SAARC countries. Keywords: NAIRU, Phillips curve, trade-off, inflation, unemployment, supply shocks. 1. Introduction In macroeconomic theory, attention is mainly focused on the factors that affect fluctuations in national aggregate economic performance of an economy (Berndt, 1991). Inflation and unemployment, the chief reflectors of economic performance of an economy (Ball & Mankiw, 2002) preoccupied and perplexed economists, statesmen, journalists, housewives, and everyone else (Tobin, 1980). The emergence of the concept of Philips curve (1958) provoked researchers to interpret the relationship between inflation and unemployment in various perspectives. This led to multiple discoveries in Economics literature (Robert, 1997). The empirical relationship between inflation and unemployment was investigated to control both inflation and unemployment or at least

Welcome message from author
This document is posted to help you gain knowledge. Please leave a comment to let me know what you think about it! Share it to your friends and learn new things together.
Transcript
Pak J Commer Soc Sci Pakistan Journal of Commerce and Social Sciences 2014, Vol. 8 (3), 867-886
Measurement and Policy Implications of NAIRU in SAARC Countries
Shabbir Ahmad Gondal
Department of Economics, University of Sargodha, Sargodha. Pakistan Email:[email protected]
Zakir Hussain
Government College University, Faisalabad, Pakistan Email:[email protected]
Rana Ejaz Ali Khan
Department of Economics, The Islamia University of Bahawalpur, Bahawalpur. Pakistan Email: [email protected]
Abstract The study mainly focused on the estimation and implementation of the concept of non-accelerating inflation rate of unemployment (NAIRU) in prominent SAARC countries (Pakistan, Bangladesh, India, Sri Lanka and Nepal) by using a panel dataset during 1971-2012. Three approaches (i.e. the pooled OLS, the fixed effect, the random effect) were applied for empirical analysis. On the whole, the estimated values of NAIRU were reported 6.80 percent (with supply shocks) and 6.71 percent (without supply shocks) in these countries. The study also reported the values of NAIRU for Pakistan (6.73 percent), Bangladesh (7.85 percent), India (6.06 percent), Sri Lanka (6.04 percent) and Nepal (6.81 percent) separately. Furthermore, it was observed that when actual unemployment rate was below the reported value of NAIRU, there was a pressure on inflation rate to rise and vice versa (ceteris paribus) in these countries. The results were found significant in all the facets of the study. The study not only highlighted the policy implications but also suggested a comprehensive package of policy recommendations to address the problems of inflation and unemployment in SAARC countries. Keywords: NAIRU, Phillips curve, trade-off, inflation, unemployment, supply shocks. 1. Introduction In macroeconomic theory, attention is mainly focused on the factors that affect fluctuations in national aggregate economic performance of an economy (Berndt, 1991). Inflation and unemployment, the chief reflectors of economic performance of an economy (Ball & Mankiw, 2002) preoccupied and perplexed economists, statesmen, journalists, housewives, and everyone else (Tobin, 1980). The emergence of the concept of Philips curve (1958) provoked researchers to interpret the relationship between inflation and unemployment in various perspectives. This led to multiple discoveries in Economics literature (Robert, 1997). The empirical relationship between inflation and unemployment was investigated to control both inflation and unemployment or at least
Measurement and Policy Implications of NAIRU
868
one evil generally in developed countries (Dua, 2006). Unfortunately, a little attention was devoted to this area of research in developing countries in general and South Asian countries (Sri Lanka, Pakistan, Bangladesh and India) in particular (Subhani et al., 2011). The present study was an effort to fill this gap at least in prominent SAARC countries (Pakistan, Bangladesh, India, Sri Lanka and Nepal)1. The inflationary pressure and alarming unemployment situation remained the most challenging problems for poverty-stricken member countries of South Asian Association of Regional Cooperation (SAARC) during the study period (1971-20012). Low unemployment rate associated with optimum inflation rate was imperative for economic development in these countries. The empirical evidences showed that the concept of non-accelerating inflation rate of unemployment (NAIRU) could be used as an effective tool to control inflationary pressures and high unemployment rates not only in advanced economies but also in developing economies (Debasish and Champa, 2010). The present study was probably the first compact effort to expose and exploit this situation in prominent SAARC countries (Pakistan, Bangladesh, India, Sri Lanka and Nepal). It was hoped that empirical findings of the present study would provide a deep insight and sound perception for self-sustained economic development in these countries. Moreover, the concept of NAIRU had been frequently used for international and inter-temporal comparison among different countries (Gianella et al., 2008). It was also pointed that supply shocks always played a vital role in determination of NAIRU, which in turn played a significant role in fixing the direction of inflation rate (Gordon, 1997, 2013; Ball & Mankiw, 2002 and Staiger et al., 1997). The study certainly enabled researchers to make an international and inter-temporal comparison of economic performance in the selected prominent SAARC countries during 1971-2012. The study was comprehensive in the sense that it investigated NAIRU with country effect and without country effect; it also examined NAIRU with supply shocks (one of the major determinants of NAIRU) and without supply shocks in the concerned countries. In the end, the study not only highlighted the policy implications but it also suggested a comprehensive package of policy recommendations to combat the pathetic situation of inflation and unemployment in prominent SAARC countries. It was hoped that findings of the study would provide a fascinating road-map for planners and policy- makers to put the economies of these countries on the glorious path of economic stability. The study mainly focused on the following objectives in prominent SAARC countries (Pakistan, Bangladesh, India, Sri Lanka and Nepal) during 1971-2012: Estimate NAIRU without country effect. Suggest NAIRU with country effect. Calculate NAIRU without supply shocks. Estimate NAIRU with supply shocks Investigate empirically the consequences of estimated parameters.
1 All SARRC countries could not be included in this study due to paucity of data.
Gondal et al
869
Highlight the policy implications and suggest policy recommendations to control inflation and unemployment.
The study was organized such that section 2 consisted of literature review; section 3 discussed materials and methods; section 4 examined empirical findings and section 5 contained conclusions, policy implications and recommendations. 2. Review of Literature The concept of NAIRU was originated by the philosophical, theoretical and empirical foundations of Phillips curve (1958), Laubach (2001) and Pallis & Katsouli (2003). Hence prior to examine the viewpoints of renowned researchers about NAIRU, it looked appropriate to analyze the literature review on Phillips curve for a clear perception of the concept of NAIRU. Historical evolution of Phillips curve revealed that Phillips (1958) was far from the first to describe the relationship between inflation and unemployment. On the contrary, many economists like Hume (1752), Attwood (1816), Fisher (1926), Sultan (1957) etc. pointed out the relationship between inflation and unemployment in their studies which eventually led to the introduction of Phillips curve in 1958 (Humphrey, 1986). The Phillips version (1958) appeared in his celebrated article “The Relationship between Unemployment and the Rate of Change of Monetary Wage Rates in UK, 1861-1957.” Phillips suggested the existence of a stable empirical relation (i.e. trade-off) between money wage rates and unemployment rate in UK economy, which in turn, was the indication of effective usage of this relationship in macroeconomic policies. The post-Phillips versions reported “intellectual debate” about the nature, scope and status of Phillips curve. Friedman (1968), Fisher (1973), Modigliani (1977) and Taylor (1979) suggested long run vertical Phillips curve which was the indication of ineffectiveness of macroeconomic policies due to absence of trade-off between inflation rate and unemployment rate. On the other hands, the studies by well-known researchers based on time-series data and panel data suggested that Phillips curve was alive and well, and it could provide the basic insight for effective government policies, Gordon (2013). Though non-accelerating inflation rate of unemployment (NAIRU) was the by-product of Phillips curve (1958), yet it had been at the heart of macro-economic debates since seminal contributions of Friedman (1968) and Phelps (1967, 1968) to introduce the concept of natural unemployment rate (NUR). It was true illustration of the fact that sometimes by-products appear more valuable than their origin. Turner et al. (2001) contended that the concept of NAIRU served as benchmark for transparent policy advices. “The presence of NAIRU reported immediate implications for carrying out of economic policies” (Pallis & Katsouli, 2003).Because of its vital importance to macro-economic policies, the estimation of NAIRU, its determinants and its policy implications had been the hot cake in the recent studies of renowned researchers. The studies were reviewed on the basis of both types of data (i.e. time series data and panel data) for complete comprehension. On the basis of time series data, Friedman (1968), Phelps (1968), Cromb (1993), Dixon (1995), Gordon (1997), Staiger et. al. (1997), Ball & Mankiw (2002), Debasish & Champa (2010), Zaman et al. (2011) and Gordon (2013) calculated NAIRU and investigated its policy implications in different economies. Similarly, Turner et al. (2001), Pallis & Katsouli (2003), Pallis (2006), Stephanides (2006), Gianella et al. (2008) analyzed the concept of NAIRU on the basis of panel data
Measurement and Policy Implications of NAIRU
870
in 21 OECD countries, G7 countries (UK, USA, Australia, Germany, Italy, Canada and France), European Community, European Union, 25 member-states of European Union, (Japan, European Union, USA) and 23 OECD countries respectively. In summary, it was perceived that non-accelerating inflation rate of unemployment (NAIRU) was associated with stable inflation rate; when actual unemployment rate was below it, there was an upward pressure on inflation rate; contrarily, when actual unemployment rate was above it, there was a downward pressure on inflation rate. Furthermore, NAIRU had been considered as one of the most useful indicators for policymakers in a variety of ways. The empirical evidences suggested it a reliable predictor of changes in the inflation rate which in turn provided a solid and useful guideline for macro-policy makers, Gordon (2013). 3. Materials and Methods Authentic data, well-defined model specification and appropriate estimation techniques are imperative for a research study of high impact factor. All these integral components of the study were discussed as under. 3.1 Data Selection A long and balanced panel dataset was used in the present study. Dataset consisted of five prominent SAARC countries (Pakistan, Bangladesh, India, Sri Lanka and Nepal) and forty two time periods (1971-2012). The data were taken from International Financial Statistics (IFS), World Development Indicators (World Bank), Economy Watch and Economic Surveys/Statistical Bulletins / Handbooks of Statistics of SAARC countries. 3.2 Panel Data Analysis Panel data were analyzed under three types of statistics in the present study; overall, between, and within. “Overall” statistics were based on nT observations (ordinary statistics), “between” statistics were calculated on the basis of summary statistics of entities (n) regardless of time period, while “within” statistics were based on summary statistics of time periods (T) regardless of entities. The use of panel data conceived several advantages (Baltagi, 2005) and (Hsiao, 2005). Nevertheless, Panel data analysis was not free from limitations (Baltagi, 2005). The critical appraisal revealed that though panel data were not a panacea which solved all econometric problems, yet panel data techniques were superior to time series or cross section techniques, Griffiths (2001). 3.3 Theoretical Framework The study investigated various models by applying the following approaches: The Pooled OLS Approach The Fixed Effect Approach The Random Effect Approach
It was perceived that in the absence of individual effects (group effects, time effects, or both) or heterogeneity, the pooled OLS was considered an appropriate approach for efficient and consistent parameter estimates. In case of heterogeneity, individual effects were examined either by fixed effect approach or by random effect approach. Fixed effect approach was applied if intercepts varied across group or time period, whereas random
Gondal et al
871
effect approach was applied to explore the differences in error variance components across individual or time period. Fixed effect approach provided better results when individual specific effect was time invariant and being correlated with other regressors was a part of intercept. On the other hands, random effect approach was applied when individual specific effect was not correlated with other regressors and was considered a part of error term in the model. 3.4 Selection of Appropriate Approach The study applied F- test to select an appropriate approach between the fixed effect model (FEM) and the pooled OLS technique, whereas Breusch and Pagan Lagrangian Multiplier Test (1980) was applied to select an appropriate approach between the random effect model (REM) and the pooled OLS technique. The Pooled OLS regression technique was considered an appropriate approach if null hypothesis was not rejected in either of the test (Baltagi, 2005 and Greene 2008). The Hausman Specification Test (1978) was applied to choose between random effect model and fixed effect model. The study found that if null hypothesis (i.e. the individual effects were uncorrelated with the other regressors) was rejected, a fixed effect model was recommended for panel estimation and vice versa (Park, 2011, Baltagi, 2005). 3.5 Stationarity Check Distinguished applied researchers considered unit root tests imperative to address spurious regressions in panel data analysis. The study applied unit root tests suggested by Levin-Lin & Chu (2002) and Pesaran & Shin (2003) to check stationarity in available dataset for empirical analysis. 3.6 Diagnostic Tests & Remedial Measures The study reported that the presence of heteroskedasticity, autocorrelation and multicollinearity always resulted in the biased and misleading results (Salvatore 2013). To address these problems, Modified Wald test, Modified Wooldridge test and the value of Variance Inflating Factor (VIF) were applied respectively. The Driscoll-Kraay standard error was estimated to exclude the effects of autocorrelation and heteroskedasticity in the data. Exclusion of variable / variables remained the practice to avoid multicollinearity in the study. 3.7 Specification of Models The basic hypotheses conceived the relationship between change in inflation rate and lagged unemployment rate for investigation of non-accelerating inflation rate of unemployment (NAIRU) without supply shocks (with country effect and without country effect), and with supply shocks in prominent SAARC countries during the study period (1971-2012). Accordingly models were specified for estimation, evaluation and results interpretations. (Description of the variables was given in Appendix: 1) Model (i): The relationship between change in inflation rate and lagged unemployment rate provided the foundation to suggest the value of non- accelerating inflation rate of unemployment (NAIRU) in the countries concerned (Staiger et al., 1997; Gordon, 1997, 3013). Accordingly, the following econometric equation was developed to investigate the
Measurement and Policy Implications of NAIRU
872
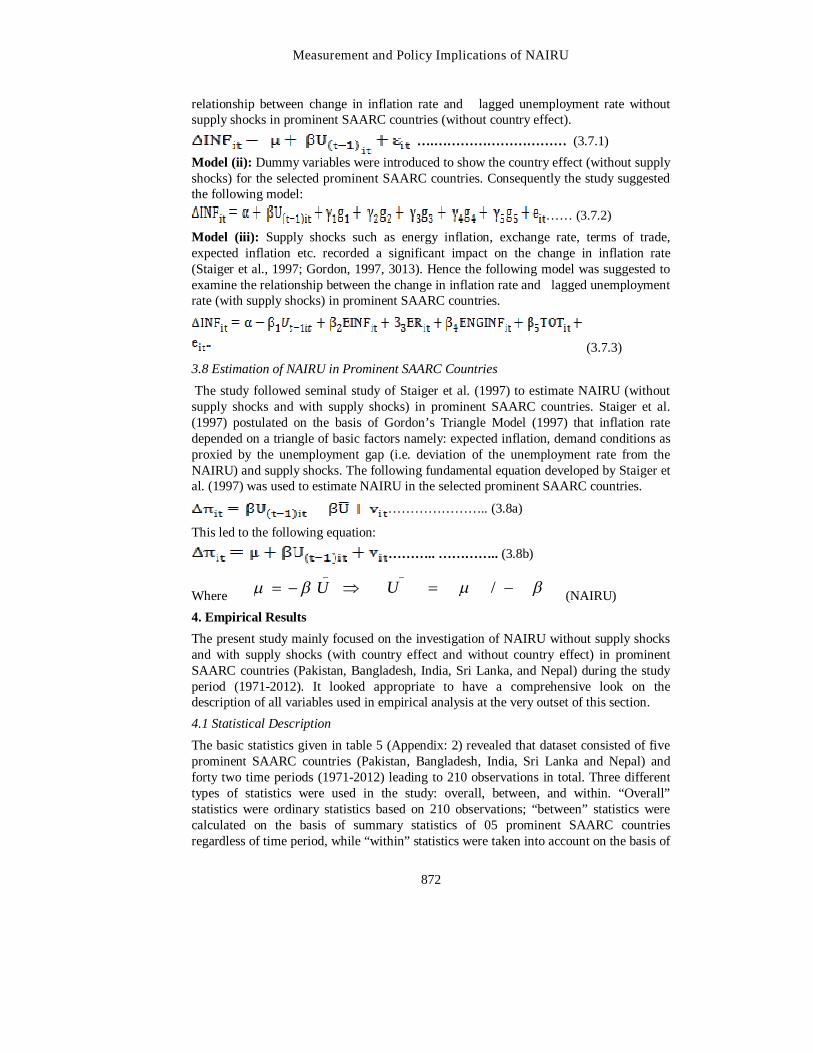
relationship between change in inflation rate and lagged unemployment rate without supply shocks in prominent SAARC countries (without country effect).
….………………………… (3.7.1) Model (ii): Dummy variables were introduced to show the country effect (without supply shocks) for the selected prominent SAARC countries. Consequently the study suggested the following model:
…… (3.7.2) Model (iii): Supply shocks such as energy inflation, exchange rate, terms of trade, expected inflation etc. recorded a significant impact on the change in inflation rate (Staiger et al., 1997; Gordon, 1997, 3013). Hence the following model was suggested to examine the relationship between the change in inflation rate and lagged unemployment rate (with supply shocks) in prominent SAARC countries.
(3.7.3) 3.8 Estimation of NAIRU in Prominent SAARC Countries The study followed seminal study of Staiger et al. (1997) to estimate NAIRU (without supply shocks and with supply shocks) in prominent SAARC countries. Staiger et al. (1997) postulated on the basis of Gordon’s Triangle Model (1997) that inflation rate depended on a triangle of basic factors namely: expected inflation, demand conditions as proxied by the unemployment gap (i.e. deviation of the unemployment rate from the NAIRU) and supply shocks. The following fundamental equation developed by Staiger et al. (1997) was used to estimate NAIRU in the selected prominent SAARC countries.
………………….. (3.8a)
This led to the following equation: ……….. ………….. (3.8b)
Where
_
U _
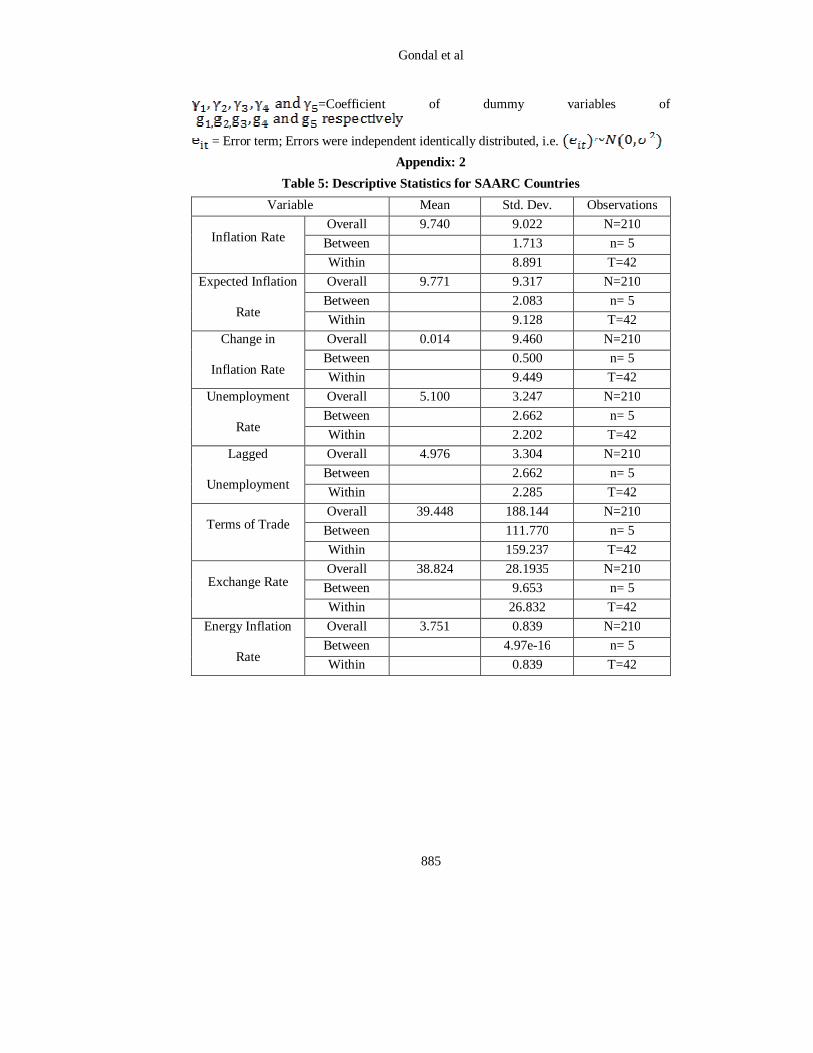
/U (NAIRU) 4. Empirical Results The present study mainly focused on the investigation of NAIRU without supply shocks and with supply shocks (with country effect and without country effect) in prominent SAARC countries (Pakistan, Bangladesh, India, Sri Lanka, and Nepal) during the study period (1971-2012). It looked appropriate to have a comprehensive look on the description of all variables used in empirical analysis at the very outset of this section. 4.1 Statistical Description The basic statistics given in table 5 (Appendix: 2) revealed that dataset consisted of five prominent SAARC countries (Pakistan, Bangladesh, India, Sri Lanka and Nepal) and forty two time periods (1971-2012) leading to 210 observations in total. Three different types of statistics were used in the study: overall, between, and within. “Overall” statistics were ordinary statistics based on 210 observations; “between” statistics were calculated on the basis of summary statistics of 05 prominent SAARC countries regardless of time period, while “within” statistics were taken into account on the basis of
Gondal et al
873
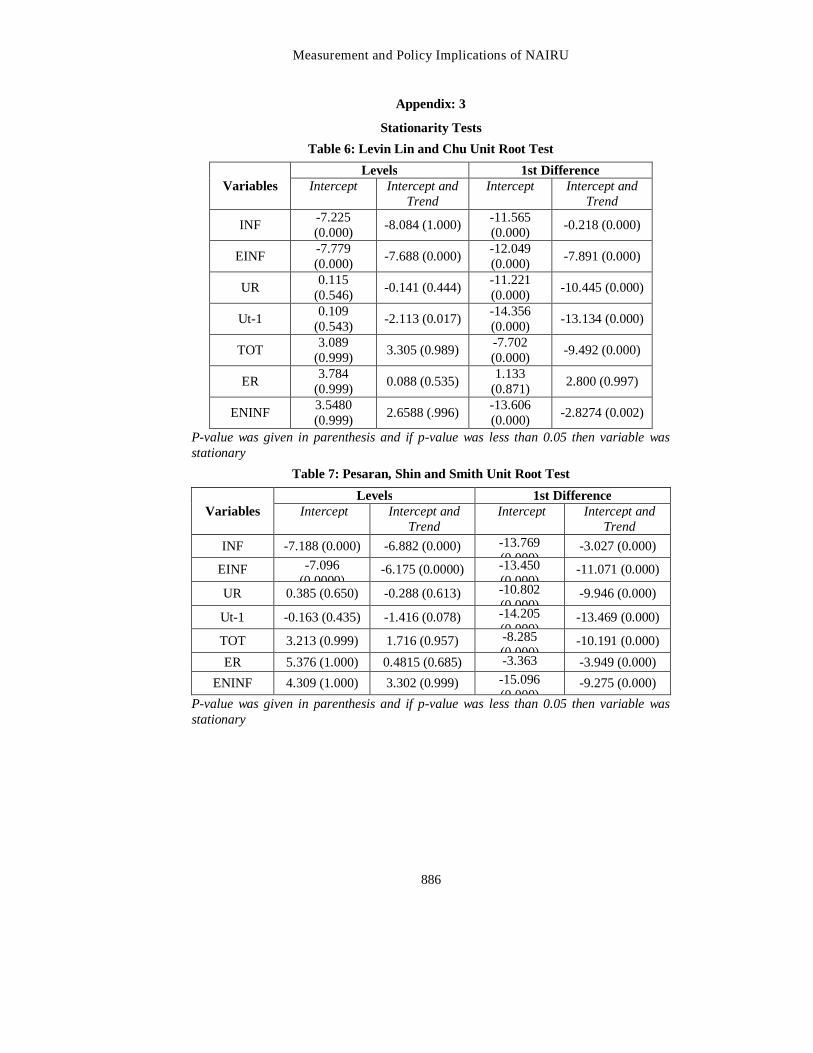
summary statistics of 42 time periods (1971-2012) regardless of country. The characteristics of individual variables in selected SAARC countries were investigated on the basis of their mean and standard deviations. All the variables were measured in percentage terms. A bird’s eye view of descriptive statistics reflected not only economic performance of prominent SAARC countries but it also confirmed economic theory with expected signs. For instance, mean value of unemployment rate was recorded 5.1 percent which was the indication of upward pressure on inflation rate in SAARC countries during the study period2. Similarly the mean and standard deviation values of other variables established a strong footing for further empirical analysis in the study. 4.2 Stationarity Check The literature review revealed that the studies of high impact factor showed serious concern about the presence of non stationarity, and in turn, spurious results in panel data analysis. These studies suggested various tests to check stationarity in panel datasets. The present study applied the tests proposed by Levin-Lin & Chu (2002) and Pesaran & Shin (2003).The results of these tests were reported in tables 6 and 7 (Appendix: 3). The results of both unit root tests revealed that all the variables of the dataset of the study were either stationary at level, I (0) or at first difference I(1). Hence every possibility of spurious regressions was avoided at the very outset in the study. It motivated to proceed for further empirical evidences, inferences, policy implications and finally policy recommendations. 4.3 Non-Accelerating Inflation Rate of Unemployment (NAIRU) in SAARC Countries Staiger et al. (1997) suggested that NAIRU could be estimated by establishing relationship between change in inflation rate and lagged unemployment rate such that change in inflation rate was considered as dependent variable and lagged unemployment rate was taken as explanatory variable. The present study followed this mechanism to investigate NAIRU in the selected SAARC countries. 4.3.1 Relationship between Change in Inflation Rate and Lagged Unemployment Rate without Supply Shocks (Without Country Effect) The selection criteria suggested fixed effect technique to show the relationship between change in inflation rate and lagged unemployment rate in the concerned countries during the study period (1971-2012). Change in inflation rate was considered as dependent variable. After the removal of heteroskedasticity and autocorrelation3, the results were reported in table 1.
2 Unemployment rate (5.1 percent) was less than the estimated value of NAIRU (6.71 percent) in the present study which reported upward inflation pressure in the countries concerned during the study period. 3See remedial measures discussed under 3.6.
Measurement and Policy Implications of NAIRU
874
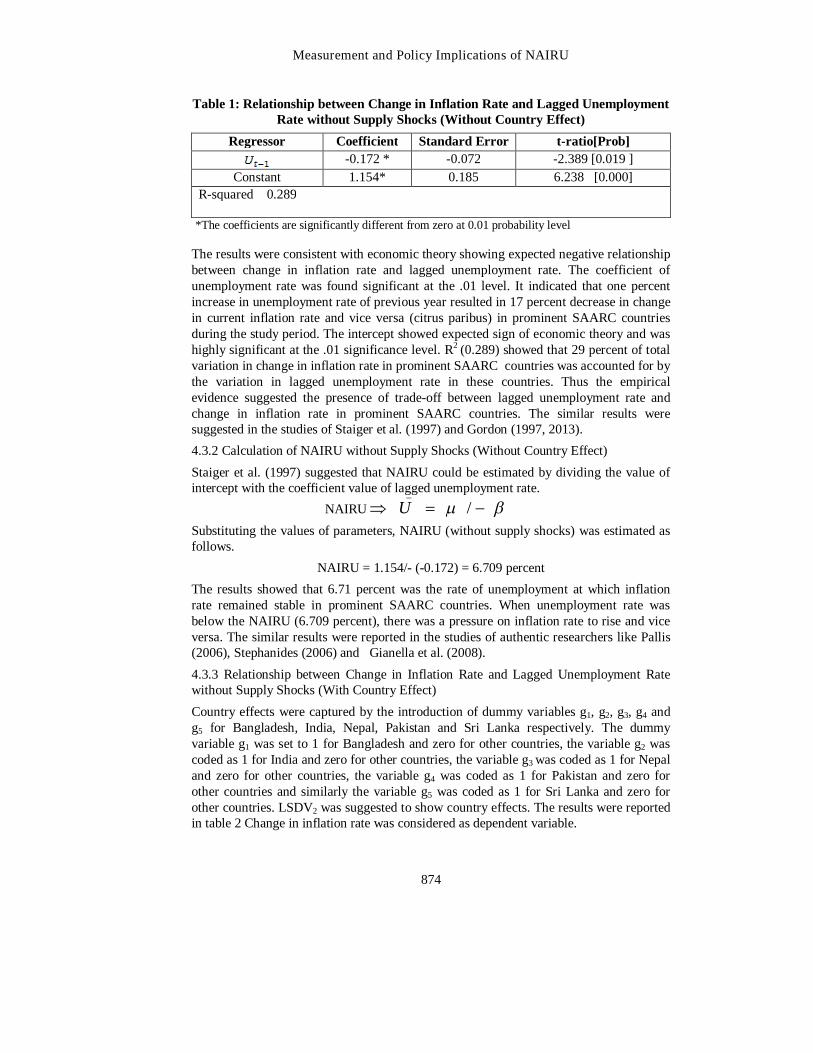
Table 1: Relationship between Change in Inflation Rate and Lagged Unemployment Rate without Supply Shocks (Without Country Effect)
Regressor Coefficient Standard Error t-ratio[Prob]
-0.172 * -0.072 -2.389 [0.019 ] Constant 1.154* 0.185 6.238 [0.000]
R-squared 0.289
*The coefficients are significantly different from zero at 0.01 probability level
The results were consistent with economic theory showing expected negative relationship between change in inflation rate and lagged unemployment rate. The coefficient of unemployment rate was found significant at the .01 level. It indicated that one percent increase in unemployment rate of previous year resulted in 17 percent decrease in change in current inflation rate and vice versa (citrus paribus) in prominent SAARC countries during the study period. The intercept showed expected sign of economic theory and was highly significant at the .01 significance level. R2 (0.289) showed that 29 percent of total variation in change in inflation rate in prominent SAARC countries was accounted for by the variation in lagged unemployment rate in these countries. Thus the empirical evidence suggested the presence of trade-off between lagged unemployment rate and change in inflation rate in prominent SAARC countries. The similar results were suggested in the studies of Staiger et al. (1997) and Gordon (1997, 2013). 4.3.2 Calculation of NAIRU without Supply Shocks (Without Country Effect) Staiger et al. (1997) suggested that NAIRU could be estimated by dividing the value of intercept with the coefficient value of lagged unemployment rate. NAIRU Substituting the values of parameters, NAIRU (without supply shocks) was estimated as follows.
NAIRU = 1.154/- (-0.172) = 6.709 percent The results showed that 6.71 percent was the rate of unemployment at which inflation rate remained stable in prominent SAARC countries. When unemployment rate was below the NAIRU (6.709 percent), there was a pressure on inflation rate to rise and vice versa. The similar results were reported in the studies of authentic researchers like Pallis (2006), Stephanides (2006) and Gianella et al. (2008). 4.3.3 Relationship between Change in Inflation Rate and Lagged Unemployment Rate without Supply Shocks (With Country Effect) Country effects were captured by the introduction of dummy variables g1, g2, g3, g4 and g5 for Bangladesh, India, Nepal, Pakistan and Sri Lanka respectively. The dummy variable g1 was set to 1 for Bangladesh and zero for other countries, the variable g2 was coded as 1 for India and zero for other countries, the variable g3 was coded as 1 for Nepal and zero for other countries, the variable g4 was coded as 1 for Pakistan and zero for other countries and similarly the variable g5 was coded as 1 for Sri Lanka and zero for other countries. LSDV2 was suggested to show country effects. The results were reported in table 2 Change in inflation rate was considered as dependent variable.
_
/U
Gondal et al
875
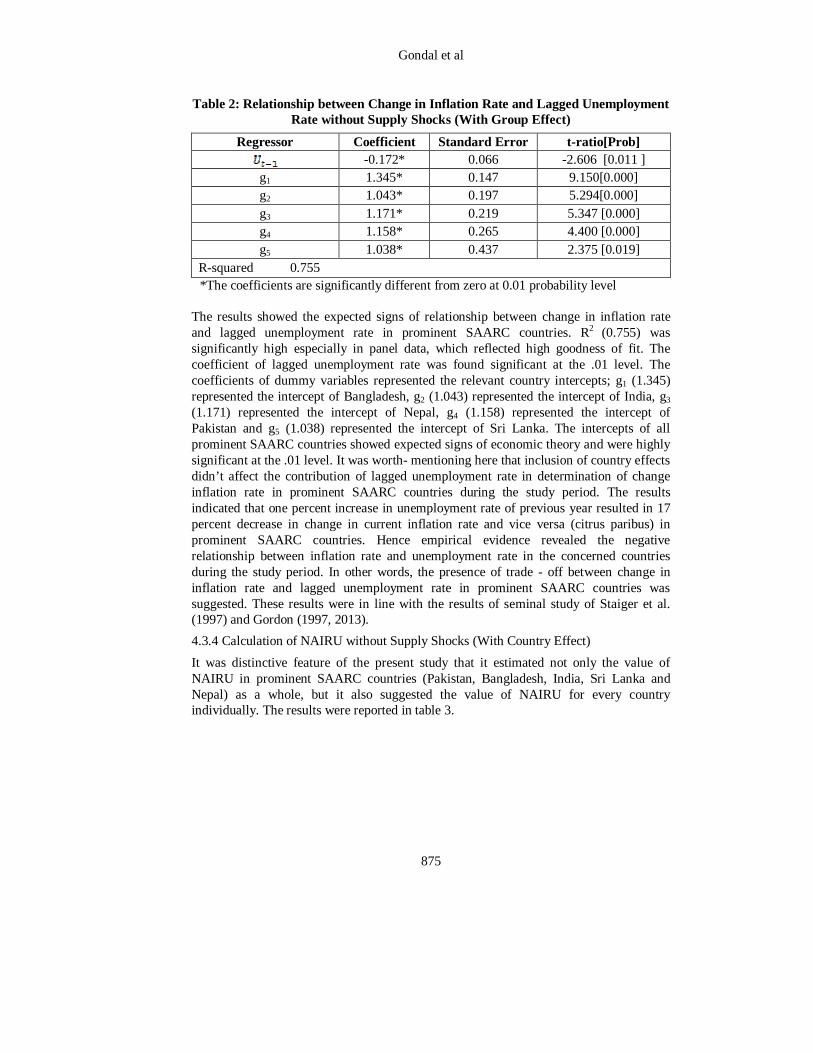
Table 2: Relationship between Change in Inflation Rate and Lagged Unemployment Rate without Supply Shocks (With Group Effect)
Regressor Coefficient Standard Error t-ratio[Prob]
-0.172* 0.066 -2.606 [0.011 ] g1 1.345* 0.147 9.150[0.000] g2 1.043* 0.197 5.294[0.000] g3 1.171* 0.219 5.347 [0.000] g4 1.158* 0.265 4.400 [0.000] g5 1.038* 0.437 2.375 [0.019]
R-squared 0.755 *The coefficients are significantly different from zero at 0.01 probability level
The results showed the expected signs of relationship between change in inflation rate and lagged unemployment rate in prominent SAARC countries. R2 (0.755) was significantly high especially in panel data, which reflected high goodness of fit. The coefficient of lagged unemployment rate was found significant at the .01 level. The coefficients of dummy variables represented the relevant country intercepts; g1 (1.345) represented the intercept of Bangladesh, g2 (1.043) represented the intercept of India, g3 (1.171) represented the intercept of Nepal, g4 (1.158) represented the intercept of Pakistan and g5 (1.038) represented the intercept of Sri Lanka. The intercepts of all prominent SAARC countries showed expected signs of economic theory and were highly significant at the .01 level. It was worth- mentioning here that inclusion of country effects didn’t affect the contribution of lagged unemployment rate in determination of change inflation rate in prominent SAARC countries during the study period. The results indicated that one percent increase in unemployment rate of previous year resulted in 17 percent decrease in change in current inflation rate and vice versa (citrus paribus) in prominent SAARC countries. Hence empirical evidence revealed the negative relationship between inflation rate and unemployment rate in the concerned countries during the study period. In other words, the presence of trade - off between change in inflation rate and lagged unemployment rate in prominent SAARC countries was suggested. These results were in line with the results of seminal study of Staiger et al. (1997) and Gordon (1997, 2013). 4.3.4 Calculation of NAIRU without Supply Shocks (With Country Effect) It was distinctive feature of the present study that it estimated not only the value of NAIRU in prominent SAARC countries (Pakistan, Bangladesh, India, Sri Lanka and Nepal) as a whole, but it also suggested the value of NAIRU for every country individually. The results were reported in table 3.
Measurement and Policy Implications of NAIRU
876
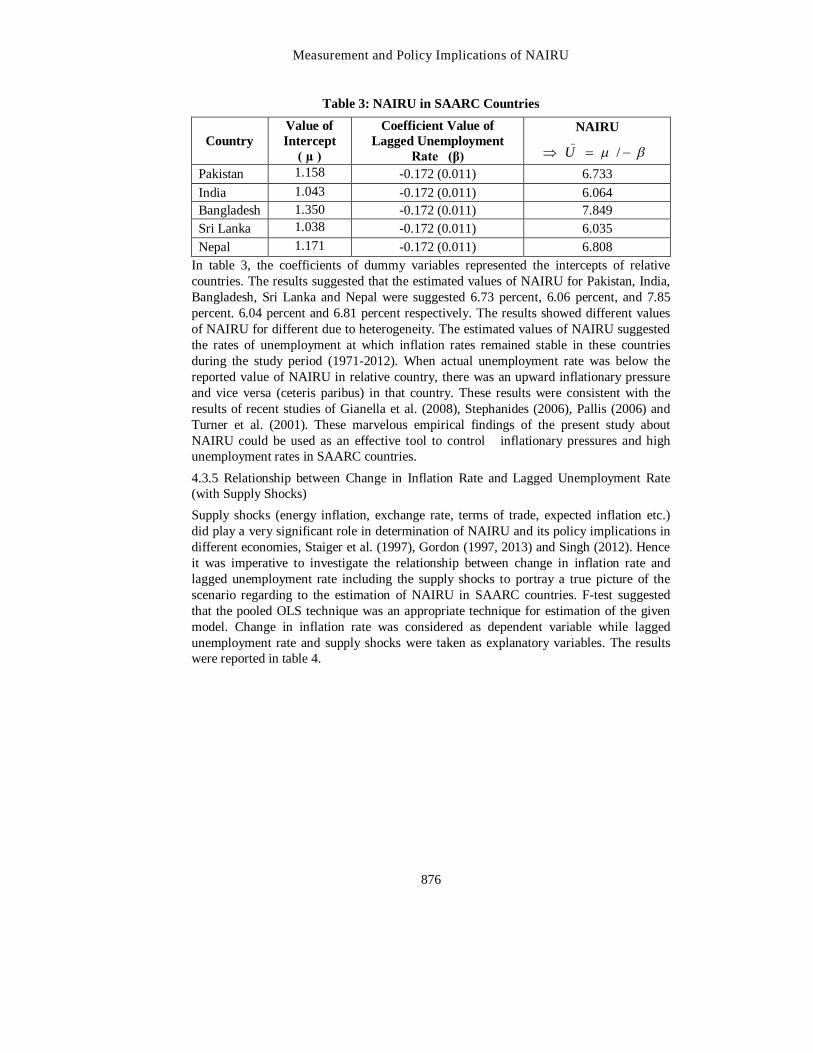
Table 3: NAIRU in SAARC Countries
Country Value of Intercept
( µ )
Coefficient Value of Lagged Unemployment
Rate (β)
NAIRU _
/U
Pakistan 1.158 (0.000)
-0.172 (0.011) 6.733 India 1.043
(0.000) -0.172 (0.011) 6.064
Bangladesh 1.350 (0.000)
-0.172 (0.011) 7.849 Sri Lanka 1.038
(0.019) -0.172 (0.011) 6.035
Nepal 1.171 (0.000)
-0.172 (0.011) 6.808 In table 3, the coefficients of dummy variables represented the intercepts of relative countries. The results suggested that the estimated values of NAIRU for Pakistan, India, Bangladesh, Sri Lanka and Nepal were suggested 6.73 percent, 6.06 percent, and 7.85 percent. 6.04 percent and 6.81 percent respectively. The results showed different values of NAIRU for different due to heterogeneity. The estimated values of NAIRU suggested the rates of unemployment at which inflation rates remained stable in these countries during the study period (1971-2012). When actual unemployment rate was below the reported value of NAIRU in relative country, there was an upward inflationary pressure and vice versa (ceteris paribus) in that country. These results were consistent with the results of recent studies of Gianella et al. (2008), Stephanides (2006), Pallis (2006) and Turner et al. (2001). These marvelous empirical findings of the present study about NAIRU could be used as an effective tool to control inflationary pressures and high unemployment rates in SAARC countries. 4.3.5 Relationship between Change in Inflation Rate and Lagged Unemployment Rate (with Supply Shocks) Supply shocks (energy inflation, exchange rate, terms of trade, expected inflation etc.) did play a very significant role in determination of NAIRU and its policy implications in different economies, Staiger et al. (1997), Gordon (1997, 2013) and Singh (2012). Hence it was imperative to investigate the relationship between change in inflation rate and lagged unemployment rate including the supply shocks to portray a true picture of the scenario regarding to the estimation of NAIRU in SAARC countries. F-test suggested that the pooled OLS technique was an appropriate technique for estimation of the given model. Change in inflation rate was considered as dependent variable while lagged unemployment rate and supply shocks were taken as explanatory variables. The results were reported in table 4.
Gondal et al
877
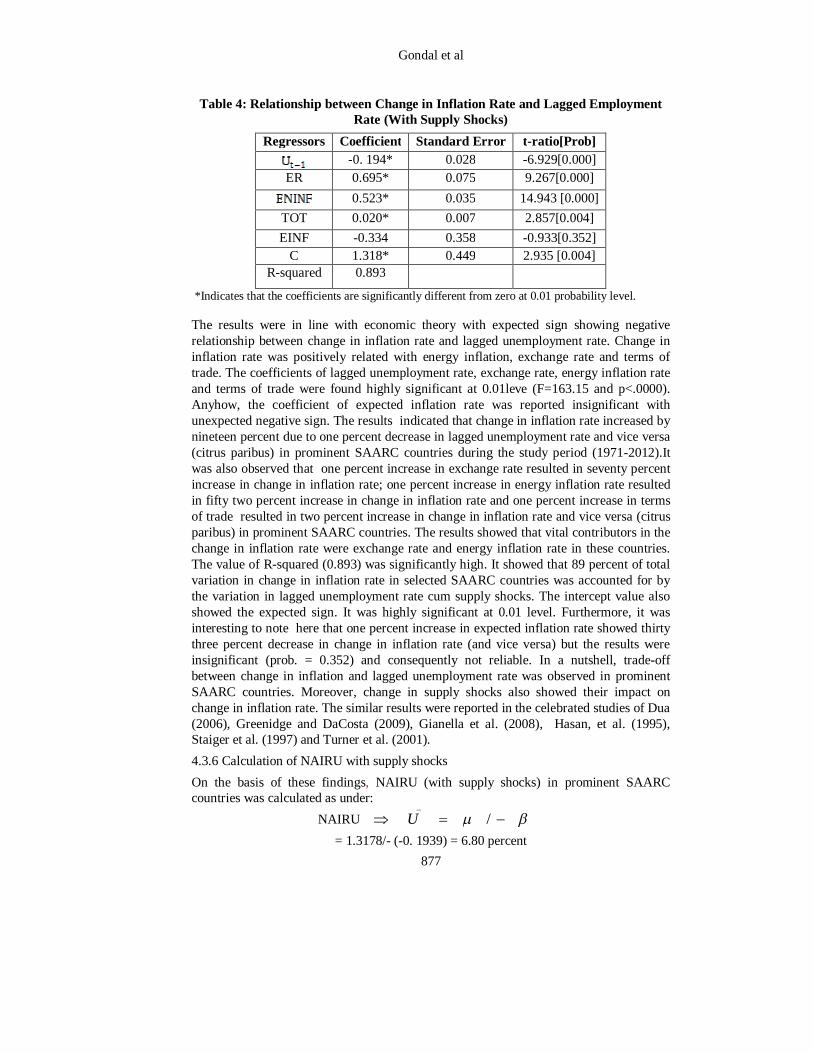
Table 4: Relationship between Change in Inflation Rate and Lagged Employment Rate (With Supply Shocks)
Regressors Coefficient Standard Error t-ratio[Prob]
-0. 194* 0.028 -6.929[0.000] ER 0.695* 0.075 9.267[0.000]
0.523* 0.035 14.943 [0.000] TOT 0.020* 0.007 2.857[0.004] EINF -0.334 0.358 -0.933[0.352]
C 1.318* 0.449 2.935 [0.004] R-squared 0.893
*Indicates that the coefficients are significantly different from zero at 0.01 probability level.
The results were in line with economic theory with expected sign showing negative relationship between change in inflation rate and lagged unemployment rate. Change in inflation rate was positively related with energy inflation, exchange rate and terms of trade. The coefficients of lagged unemployment rate, exchange rate, energy inflation rate and terms of trade were found highly significant at 0.01leve (F=163.15 and p<.0000). Anyhow, the coefficient of expected inflation rate was reported insignificant with unexpected negative sign. The results indicated that change in inflation rate increased by nineteen percent due to one percent decrease in lagged unemployment rate and vice versa (citrus paribus) in prominent SAARC countries during the study period (1971-2012).It was also observed that one percent increase in exchange rate resulted in seventy percent increase in change in inflation rate; one percent increase in energy inflation rate resulted in fifty two percent increase in change in inflation rate and one percent increase in terms of trade resulted in two percent increase in change in inflation rate and vice versa (citrus paribus) in prominent SAARC countries. The results showed that vital contributors in the change in inflation rate were exchange rate and energy inflation rate in these countries. The value of R-squared (0.893) was significantly high. It showed that 89 percent of total variation in change in inflation rate in selected SAARC countries was accounted for by the variation in lagged unemployment rate cum supply shocks. The intercept value also showed the expected sign. It was highly significant at 0.01 level. Furthermore, it was interesting to note here that one percent increase in expected inflation rate showed thirty three percent decrease in change in inflation rate (and vice versa) but the results were insignificant (prob. = 0.352) and consequently not reliable. In a nutshell, trade-off between change in inflation and lagged unemployment rate was observed in prominent SAARC countries. Moreover, change in supply shocks also showed their impact on change in inflation rate. The similar results were reported in the celebrated studies of Dua (2006), Greenidge and DaCosta (2009), Gianella et al. (2008), Hasan, et al. (1995), Staiger et al. (1997) and Turner et al. (2001). 4.3.6 Calculation of NAIRU with supply shocks On the basis of these findings, NAIRU (with supply shocks) in prominent SAARC countries was calculated as under:
NAIRU _
/U = 1.3178/- (-0. 1939) = 6.80 percent
Measurement and Policy Implications of NAIRU
878
The results showed that 6.80 percent was the rate of unemployment at which inflation rate remained stable in prominent SAARC countries during the study period (1971-2012). When unemployment rate was below this non-accelerating inflation rate of unemployment (NAIRU), there was a pressure on inflation rate to rise, and in turn unemployment rate converged to 6.80 percent (citrus paribus) and vice versa. These results were in line with the results of the studies like Cromb (1993), Gianella et al. (2008), Gordon (1997, 2013), Mankiw (2002), Staiger et al. (1997) and Turner et al. (2001). These empirical evidences provided a guide-line especially in framing monetary policy and labour policy to embrace self-sustained economic development by controlling adverse inflation pressure and higher unemployment in SAARC countries. 5. Conclusion The study examined the concept of NAIRU with country effect / without country effect and with supply shocks/ without supply shocks in the selected SAARC countries (Pakistan, Bangladesh, India, Sri Lanka and Nepal) during the study period (1971-2012). The study perceived that the relationship between change in inflation rate and lagged unemployment rate was the pre-requisite for estimation of NAIRU. The results were highly significant at 0.01leve. Keeping in view this entire scenario, the estimated values of NAIRU were reported 6.80 percent and 6.71 percent with supply shocks and without supply shocks respectively. Keeping in view the country effect, the estimated values of NAIRU were suggested 6.73 percent, 7.85 percent, 6.06 percent, 6.04 percent and 6.81 percent for Pakistan, Bangladesh, India, Sri Lanka and Nepal respectively. These findings exposed the unemployment rate which ensured a stable inflation rate in these countries during the study period. The study also noted that when actual unemployment rate was below the reported values of NAIRU, there was a pressure on inflation rate to rise and vice versa (ceteris paribus) in these countries. 5.1 Policy Implications The study perceived inflation rate were largely a labour market phenomenon and unemployment rate appeared as a good predictor of inflation rate. It was observed that when any conscious effort by the government (monetary policy/fiscal policy) resulted in lower unemployment rate than NAIRU, it led to higher inflation rate and vice versa. Higher aggregate demand due to monetary policy or fiscal policy enabled firms to charge higher prices while wages initially lagged behind. As a result, inflation rate increased and real wage rate declined. Lower real wage rate provided an incentive for firms to hire more workers which resulted in lower unemployment rate. These incompatible wage- setting aspirations and price-setting plans were resolved through a wage price spiral which resulted in higher unemployment rate. This convergence of unemployment rate to NAIRU led to stable inflation rate at which expected inflation rate was equal to actual inflation rate. Furthermore, the study suggested that it was the rate of cyclical unemployment i.e. fluctuations in total unemployment around the natural rate (not the rate of total unemployment) which appeared as the true reflector of the inflationary pressures in the economy. If output was above the optimum level and rate of total unemployment remained below the NAIRU, the tightness of labour market resulted in rapid rise in wages and consequently upward inflationary pressure was reported in the economy. Contrarily if output was above the optimum level and rate of total
Gondal et al
879
unemployment exceeded the NAIRU, the slackness of labour market showed downward inflationary pressure in the economy. Thus the study argued that changes in the inflation rate were largely affected by the changes in labour market. Consequently no remedial measure was effective to control inflation rate without structural changes in the labor market. 5.2 Policy Recommendations Keeping in view the given scenario, the study suggested the following policy recommendations. 1. The concept of NAIRU could be used as a major forecasting tool of inflationary
pressure by monetary authorities in the concerned SAARC countries. Unemployment below the NAIRU was the reflection of upwards inflationary pressure and vice versa.
2. The combined efforts of the governments and the central banks of the concerned SAARC countries were recommended for solid and effective use of NAIRU in policy framework.
3. Some serious labour market imperfections like Job mismatches of workers, institutional barriers, unemployment compensation allowances etc. were observed in these countries.
a. Job mismatches problem could be addressed by the provision of education, training, transportation and accommodation facilities.
b. Fair, equitable and transparent labour policy was suggested to overcome the institutional barriers in these countries.
c. Higher wage subsidy was recommended to bring the free loaders (the individuals receiving unemployment compensation or welfare allowances) into the network of productive labour force.
4. On the jobs trainings were recommended to avoid structural unemployment. As a result NAIRU would decrease which would result in stable inflation at lower unemployment rate.
5. The central banks of the SAARC countries were suggested to focus not only on inflation targeting through monetary policy but they were recommended to focus on investment targeting and unemployment targeting strategies with the collaboration of commercial banks.
6. Micro financing and self-employment schemes were a fascinating experience by countries like Bangladesh. These schemes were recommended to be launched in all the concerned SAARC countries immediately.
7. Inequalities must be removed by effective policies to reduce the value of NAIRU which would in turn lead to optimum inflation rate with lower unemployment rate.
8. Human capital formation was recommended to ensure the optimum value of NARU. Consequently a favourable and sustained inflation rate would be possible at comparatively lower unemployment rate.
9. Last but not least, effective measures by the governments (through charming incentives) were recommended to avoid brain drain in the selected prominent
Measurement and Policy Implications of NAIRU
880
SAARC countries. The presence of the most experienced, the most talented, the most efficient and the most skilled labour force would be the guarantee of reduction in the value of NAIRU which would ensure the optimum stable inflation rate associated with the most favourable lower unemployment rate in these countries.
REFERENCES
Attwood, T. (1816). The Remedy or Thoughts on the Present Distresses, Second edition, with additions. London. Ball and Mankiw (2002). The NAIRU in Theory and Practice. Journal of Economic Perspectives, 16(4), 115-136. Baltagi, B. H. (2005). Econometric Analysis of Panel Data. John Wiley & Sons Ltd, West Sussex, England. Berndt, E. R. (1991). The Practice of Econometrics: Classic and Contemporary, Addison. Wesely Publishing Company, New York. Breusch, T. S. and Pagan, A. R. (1980). The Lagrange Multiplier Test and its Applications to Model Specification in Econometrics. Review of Economic Studies 47, 239–253. Cameron, A. Colin and Trivedi, P. (2009). Micro Econometrics Using Stata. TX: Stata Press. Cromb, R. (1993). A Survey of Recent Econometric Work on the NAIRU. Journal of Economic Studies, 20(1/2), 27-51. Debasish K. D. and Champa, B. D. (2010). Labour Market Dynamics in Bangladesh: Estimation of Phillips Curve and Analysis of Wage Inequality. LAP LAMBERT Academic Publishing, Germany. Dholakia, Ravindra, H. and Sapre, Amey A. (2011). Speed of Adjustment and Inflation: Unemployment Trade off in Developing Countries-Case of India. Journal of Quantitative Economics, 10(1), 1-16. Dickey, D.A. and Fuller, W. A. (1979). Distribution of the Estimator for Autoregressive Time Series with a Unit Root. Journal of the American Statistical Association, 74, 427-431. DiNardo J. and Moore M. P. (1999). The Phillips Curve is Back? Using Panel Data to Analyze the Relationship between Unemployment and Inflation in an Open Economy. NBER Working Paper No. 7328. Dixon, H. (1995). Of Coconuts, Decomposition, and the Jackass: The Genealogy of the Natural Rate, In R. Cross (ed.), the Natural Rate of Unemployment, Cambridge University Press, Cambridge, 57-76. Dua, P. (2006). Inflation-Unemployment Trade-off in Asia, presented at the Project Link Meeting held at Geneva under United Nations. Fisher, I. (1926). A Statistical Relation between Unemployment and Price Changes. International Labour Review, 13(6), 785-792.
Gondal et al
881
Fisher, I. (1973). I Discovered the Phillips Curve “A Statistical Relation between Unemployment and Price Changes”. Journal of Political Economy, 81(2), 496-502. Friedman, M. (1968). The Role of Monetary Policy. The American Economic Review, 58(1), 1-17. Gianella, C., Koske,. Rusticelli, E. and Chatal, O. (2008). What Drives the NAIRU? Evidence from a Panel of OECD Countries, OECD Economics Department Working Papers, No. 649, OECD. Gordon, R. J. (1997). The Time-Varying NAIRU and Its Implications for Economic Policy. Journal of Economic Perspectives, 11(1), 11-32. Gordon, Robert J. (2013). The Phillips Curve is Alive and Well: Inflation and the NAIRU During the Slow Recovery, Working Paper 19390, National Bureau of Economic Research, 1050 Massachusetts Avenue Cambridge, MA 02138 Greene, W. H. (2008). Econometric Analysis, 6th ed. Upper Saddle River, NJ: Prentice Hall. Greenidge, K. and DaCosta, D. (2009). Determinants of Inflation in Selected Caribbean Countries. Business, Finance and Economics in Emerging Economies, 4(2), 371-397. Griffiths, W. E., Hill, R. C. and Judge, G. G. (2001). Learning and Practicing Econometrics. John Wiley& Sons, New York. Gujarati, D. N. (2012). Basic Econometrics, Fourth Edition. The McGraw Hill Education. Harris, R. D. and Tzavalis E. (1999). Inference for Unit Roots in Dynamic Panels where the Time Dimension is Fixed. Journal of Econometrics 91(2), 201-226. Hasan, M. A., Khan, A. H., Pasha, H. A. and Rasheed, M. A. (1995). What Explains the Current High Rate of Inflation in Pakistan. The Pakistan Development Review, 34(4), 927-943. Hsiao, C. (2005). Why Panel Data. The Singapore Economic Review, 50(2), 143-154. Hausman, J. A. (1978). Specification Tests in Econometrics, Econometrica, 46, 1251-1271. Huang, H. and Yeh, C. (2014). Inflation Targeting on Unemployment Rates: A Quartile Treatment Effect Approach. Applied Economics Letters, 21(7), 453-458. Hume, D. (1752). Of Money, Reprinted in his writings on Economics. Edited by Eugene Rotwein. Madison: University of Wisconsin Press. Humphrey (1986). A History of the Philips Curve from Trade Offs to Policy Ineffectiveness, Federal Reserve Bank of Richmond. Islam, F., Shahbaz, M. and Shabbir, M. (2011). Phillips Curve in a Small Open Economy: A Time Series Exploration of North Cyprus. [Online] Available: http://mpra.ub.uni-muenchen.de/28397 Katria, S., Bhutto, N. A., Butt, F. Domki, A. A. and Ali Hyder (2011). Is there any Tradeoff between Inflation and Unemployment? The Case of SAARC Countries. Proceedings of 2nd International Conference on Business Management. 28 March, Lahore. Kennedy, P. (2008). A Guide to Econometrics, 6th ed. Malden, MA: Blackwell
Measurement and Policy Implications of NAIRU
882
Publishing. Hasan, M. A. and Khan, A. H. (1988). Is There a Phillips Curve in Pakistan. The Pakistan Development Review, 27(4), 839-851. Laubach, T. (2001). Measuring the NAIRU: Evidence from Seven Economies. Review of Economics and Statistics, 83(2), 218-231. Laxton, D., Rose, D. and Tetlow R. (1993). Is the Canadian Phillips Curve Non-Linear. Bank of Canada Working Paper No.93-7. Lee. J. and Nelson, C. R. (2007). Expectation Horizon and the Phillips Curve: The Solution to an Empirical Puzzle. Journal of Applied Econometrics, 22(1), 161-178. Levin, A., Lin, C. F. and Chu, C. (2002). Unit Root Test in Panel Data: Asymptotic and Finite Sample Properties, Journal of Econometrics, 108, 1-25. Lipsey, R. G. (1960). The Relationship between Unemployment and the Rate of Change of Money Wage Rates in the U.K. Economica, 27, 1-31. Lucas, R. E. and Rapping, L. A. (1969). Price Expectations and the Phillips Curve. American Economic Review, 59(3), 342-351. MacKinnon, J. G. (1996). Numerical Distribution Functions for Unit Root and Cointegration Tests. Journal of Applied Econometrics 11, 601-618. McAdam, P. and McMorrow, K. (2003). The NAIRU Concept: Measurement Uncertainties, Hysteresis and Economic Policy Role, Economic Papers. No 136. September. Brussels: European Commission. Meyer, L. (1999). Q. & A. on the topic of “Economic Outlook and Challenges Facing Monetary Policy”, Speech before the Philadelphia Council for Business Economics, September 8, 1999. Modigliani, F. (1977), The Monetarist Controversy or Should We Forsake Stabilization Policies. American Economic Review, 67(2), 1-19. Nepal Rastra Bank (2007). Inflation in Nepal. Research Department, Nepal Rastra Bank Kathmandu, Nepal. Okun, A. M. (1962). Potential GNP: Its Measurement and Significance. Proceeding of the Business and Economics Section of the American Statistical Association, Washington, D.C. 98-104. Katsouli, E. and Pallis, D. (2003). Estimating the NAIRU in the 15 European Union Member Countries. Review of Economic Sciences, 3, 53-66. Pallis, D. (2006). The Trade-off between Inflation and Unemployment in the New European Union Member States. International Journal of Finance and Economics, 1, 80-88. Park, H. M. (2011). Regression Models for Panel Data Using Stata, International University of Japan. [Online] Available: http://www.iuj.ac.jp/faculty/kucc625 Paul, R. Kumar (2011). Econometric Analysis Using Panel Data, I.A.S.R.I. Library Avenue, New Dehli. Pesaran, M. H., Shin, Y. and Smith, R. P. (1999). Pooled Mean Group Estimation of Dynamic Heterogeneous Panels. Journal of the American Statistical Association, 94,
Gondal et al
883
621-634. Phelps, E. (1968). Money-Wage Dynamics and Labor Market Equilibrium. Journal of Political Economy, Part 2(76), 678-711. Phillips, A.W. (1958). The Relation between Unemployment and the Rate of Change of Money Wage Rates in the United Kingdom, Economica, 25, 283-299. King, R. G., Stock, J. H. and Watson, M. W. (1995). Temporary Instability of the Unemployment Relationship. Economic Perspectives of the Federal Reserve Bank of Chicago. Ray, L. (2011). Estimation of Phillips Curve in Indian context. Journal of Economic Research, 3(2), 28-51. Richardson, P., Boone, L., Giorno, C., Meacci, M., Rae, D. and Turner, D. (2000). The Concept, Policy Use and Measurement of Structural Unemployment: Estimating a Time Varying NAIRU across 21 OECD Countries. OECD Economics Department Working Papers. No. 250. Roberts, J. M. (1997). The Wage Curve and the Phillips Curve, Federal Reserve Board, Finance and Economics Discussion Series, WP No. 97-57. Salvatore, D. (2013). Managerial Economics in a Global Economy, 7th edition, Oxford University Press, USA. Samuelson, P. A. and Solow, R. M. (1960). Analytical Aspects of Anti-Inflation Policy, American Economic Review, 50 (2), 177-194. Sekaran, U. (1992). Research Methods for Business, 2nd Edition, Wiley & Sons Inc., New York. Singh, B. K. (2012). An Assessment of Inflation Modeling in India. Indian Council for Research on International Economic Relations, Working Paper 259. Staiger, D., Stock J. H., and Watson, M. W. (1997). The NAIRU, Unemployment and Monetary Policy. The Journal of Economic Perspective, 11(1), 33-49 Stephanides, G. (2006). Measuring the NAIRU: Evidence from the European Union, USA and Japan. International Research Journal of Finance and Economics, 1(3), 29-35. Stigler, S. M. (1980). Stigler's Law of Eponymy, In Science and Social Structure, A Festschrift for Robert K. Merton. NY: New York Academy of Sciences. Stiglitz, J. (1997). Reflections on the Natural Rate Hypothesis, Journal of Economic Perspectives, 11(1), 3-10. Storm, S. and Naastepad, C. W. M. (2008). The NAIRU Reconsidered: Why Labour Market Deregulation May Raise Unemployment. International Review of Applied Economics, 22(5), 527-544. Subhani, I. M. and Osman, A. (2011). The South Asian Phillips Curve: Assessing the Gordon Triangle. European Journal of Economics, Finance and Administrative Sciences, 36, 110-114. Suits, D. B. (1984). Dummy Variables: Mechanics V. Interpretation, Review of Economics & Statistics, 66(1), 177-180. Sultan, P. (1957). Labor Economics, New York: Henry Holt and Company, Inc.
Measurement and Policy Implications of NAIRU
884
Taylor, J. B. (1979). Estimation and Control of Macroeconomic Model with Rational Expectations. Econometrica, 47(5), 1267-1286. Tobin, J. (1995). The Natural Rate as New Classical Macroeconomics, In R. Cross (ed.), The Natural Rate of Unemployment, Cambridge University Press, pp.32-42. Tobin, J. (1980). Stabilization Policy Ten Years After, Brooking Papers on Economic Activity, 19-85. Tootell, G. M. B. (1994). Restructuring, the NAIRU, and the Phillips Curve. New England Economic Review of the Federal Reserve Bank of Boston, 31-44. Turner, D., Boone, L., Giorno, C., Meacci, M., Rae, R. and Richardson, P. (2001). Estimating the Structural Rate of unemployment for the OECD Countries. OECD Economic Studies, 33(2), 171-216. Vogel, L. (2008). The Relationship between the Hybrid New Keynesian Phillips Curve and the NAIRU over Time, DEP Discussion Papers Macroeconomics and Finance Series 3/2008 Walsh, C. E. (2006). Optimal Monetary Policy with the Cost Channel (with Federico Ravenna). Journal of Monetary Economics 53, 199-216. Wasserfallen, W. (1988). Trends, Random Walks, and the Expectations-Augmented Phillips Curve: Evidence from Six Countries. Journal of Money, Credit and Banking, 20 (3), 306-318. Weiner, S. E. (1993). New Estimates of the Natural Rate of Unemployment. Economic Review of the Federal Reserve Bank of Kansas city, 78(4), 53-72. Wooldridge, J. M. (2010). Econometric Analysis of Cross Section and Panel Data. MIT Press. Zaman, K., Khan, M. M., Ahmad, M. and Ikram, W. (2011). Inflation, Unemployment and the NAIRU in Pakistan (1975-2009). International Journal of Economics and Finance, 3(1), 245-254.
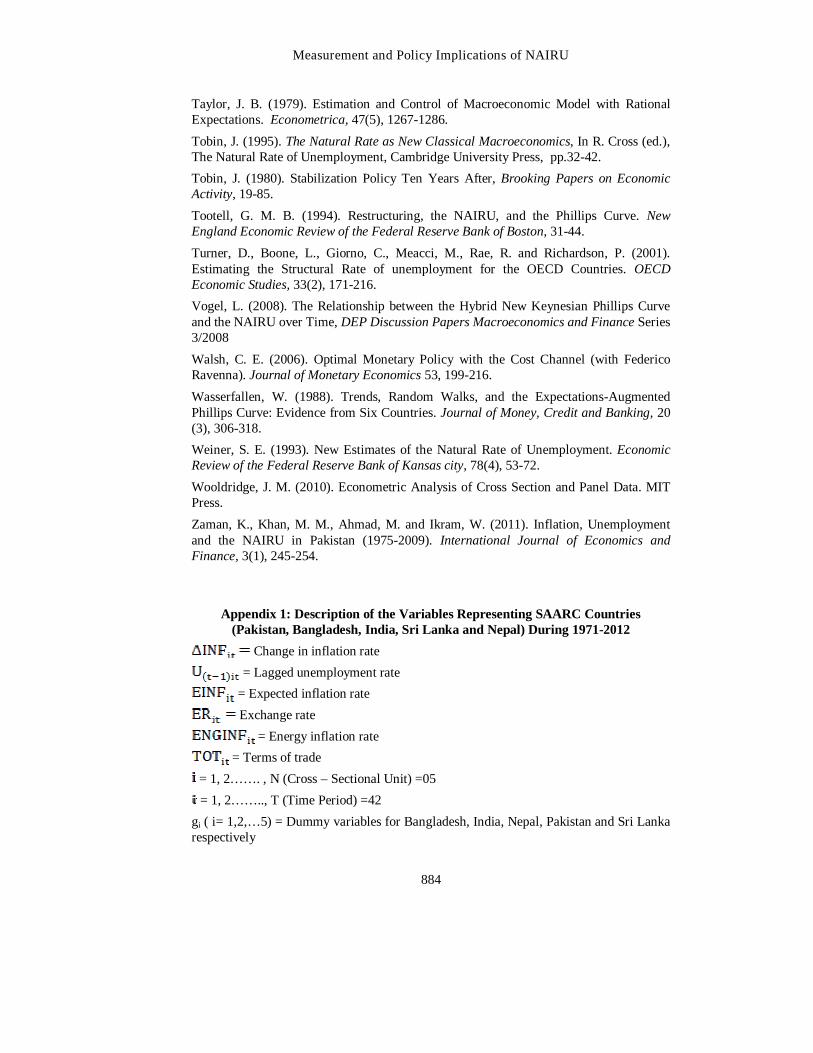
Appendix 1: Description of the Variables Representing SAARC Countries (Pakistan, Bangladesh, India, Sri Lanka and Nepal) During 1971-2012
Change in inflation rate = Lagged unemployment rate
= Expected inflation rate Exchange rate
= Energy inflation rate = Terms of trade
= 1, 2……. , N (Cross – Sectional Unit) =05 = 1, 2…….., T (Time Period) =42
gi ( i= 1,2,…5) = Dummy variables for Bangladesh, India, Nepal, Pakistan and Sri Lanka respectively
Gondal et al
885
=Coefficient of dummy variables of
= Error term; Errors were independent identically distributed, i.e. Appendix: 2
Table 5: Descriptive Statistics for SAARC Countries Variable Mean Std. Dev. Observations
Inflation Rate Overall 9.740 9.022 N=210
Between 1.713 n= 5 Within 8.891 T=42
Expected Inflation
Rate
Overall 9.771 9.317 N=210 Between 2.083 n= 5 Within 9.128 T=42
Change in
Inflation Rate
Overall 0.014 9.460 N=210 Between 0.500 n= 5 Within 9.449 T=42
Unemployment
Rate
Overall 5.100 3.247 N=210 Between 2.662 n= 5 Within 2.202 T=42
Lagged
Unemployment
Overall 4.976 3.304 N=210 Between 2.662 n= 5 Within 2.285 T=42
Terms of Trade Overall 39.448 188.144 N=210
Between 111.770 n= 5 Within 159.237 T=42
Exchange Rate Overall 38.824 28.1935 N=210
Between 9.653 n= 5 Within 26.832 T=42
Energy Inflation
Rate
Overall 3.751 0.839 N=210 Between 4.97e-16 n= 5 Within 0.839 T=42
Measurement and Policy Implications of NAIRU
886
Appendix: 3
Stationarity Tests Table 6: Levin Lin and Chu Unit Root Test
Variables Levels 1st Difference
Intercept Intercept and Trend
Intercept Intercept and Trend
INF -7.225 (0.000) -8.084 (1.000) -11.565
(0.000) -0.218 (0.000)
EINF -7.779 (0.000) -7.688 (0.000) -12.049
(0.000) -7.891 (0.000)
UR 0.115 (0.546) -0.141 (0.444) -11.221
(0.000) -10.445 (0.000)
Ut-1 0.109 (0.543) -2.113 (0.017) -14.356
(0.000) -13.134 (0.000)
TOT 3.089 (0.999) 3.305 (0.989) -7.702
(0.000) -9.492 (0.000)
ER 3.784 (0.999) 0.088 (0.535) 1.133
(0.871) 2.800 (0.997)
ENINF 3.5480 (0.999) 2.6588 (.996) -13.606
(0.000) -2.8274 (0.002)
P-value was given in parenthesis and if p-value was less than 0.05 then variable was stationary
Table 7: Pesaran, Shin and Smith Unit Root Test
Variables Levels 1st Difference
Intercept Intercept and Trend
Intercept Intercept and Trend
INF -7.188 (0.000) -6.882 (0.000) -13.769 (0.000)
-3.027 (0.000)
EINF -7.096 (0.0000)
-6.175 (0.0000) -13.450 (0.000)
-11.071 (0.000)
UR 0.385 (0.650) -0.288 (0.613) -10.802 (0.000)
-9.946 (0.000)
Ut-1 -0.163 (0.435) -1.416 (0.078) -14.205 (0.000)
-13.469 (0.000)
TOT 3.213 (0.999) 1.716 (0.957) -8.285 (0.000)
-10.191 (0.000) ER 5.376 (1.000) 0.4815 (0.685) -3.363
(0.000) -3.949 (0.000)
ENINF 4.309 (1.000) 3.302 (0.999) -15.096 (0.000)
-9.275 (0.000) P-value was given in parenthesis and if p-value was less than 0.05 then variable was stationary
Related Documents