Quality Engineering in Manufacturing (MEM – 601)

Welcome message from author
This document is posted to help you gain knowledge. Please leave a comment to let me know what you think about it! Share it to your friends and learn new things together.
Transcript

Quality Engineering in Manufacturing (MEM – 601)
Unit I: Quality Engineering
An overall quality system
Quality engineering in production design
Quality engineering in design of production processes.
Unit II: Loss Function and Quality Level
Derivation and use of quadratic loss function
Eco. consequences of tightening tolerances as a means to improve quality
Evaluations and types tolerances (N-type, S-type and L-type)
Tolerance design and tolerancing:
Functional limits
Tolerance design for N-type, L-type and S-type characteristics.
Unit III: Allocation for Multiple Components; Parameter and Tolerance Design
Introduction to parameter design Signal to noise ratios Parameter design strategy Some of the case studies on parameter and tolerance designs
Unit IV: Analysis of Variance (ANOVA) NO-way ANOVA One-way ANOVA
Two-way ANOVA
Critique of F-test ANOVA for four level factors Multiple level factors.
Unit V: Orthogonal Arrays
Typical test strategies – Better strategies, Efficient strategies
Steps in designing
Conducting and analyzing an experiment
Interpolation of experimental results
Interpretation methods
Percent contributor
Estimating the mean

Unit VI: IS-9000 Quality System Six-sigma
Bench marking
Quality circles
Brain Storming
Fishbone diagram
Problem analysis
Recommended Books:
1. Quality Engineering in Production Systems; G. Taguchi, A. Elsayed et al; McGraw Hill Intl. Edition,1989 2. Taguchi Techniques for Quality Engineering; Phillip J. Ross; McGraw Hill, Intl. 2nd Ed, 1995. 3. Quality Management; Kanishka Bedi; Oxford University Press; 10th Edition, 2013. 4. Taguchi Methods Explained: Practical Steps to Robust Design; Papan P. Bagchi; Prentice Hall Pvt. Ltd., New Delhi. 5. Design of Experiments using the Taguchi Approach; Ranjit K. Roy; John Wiley & sons Inc. 2001.
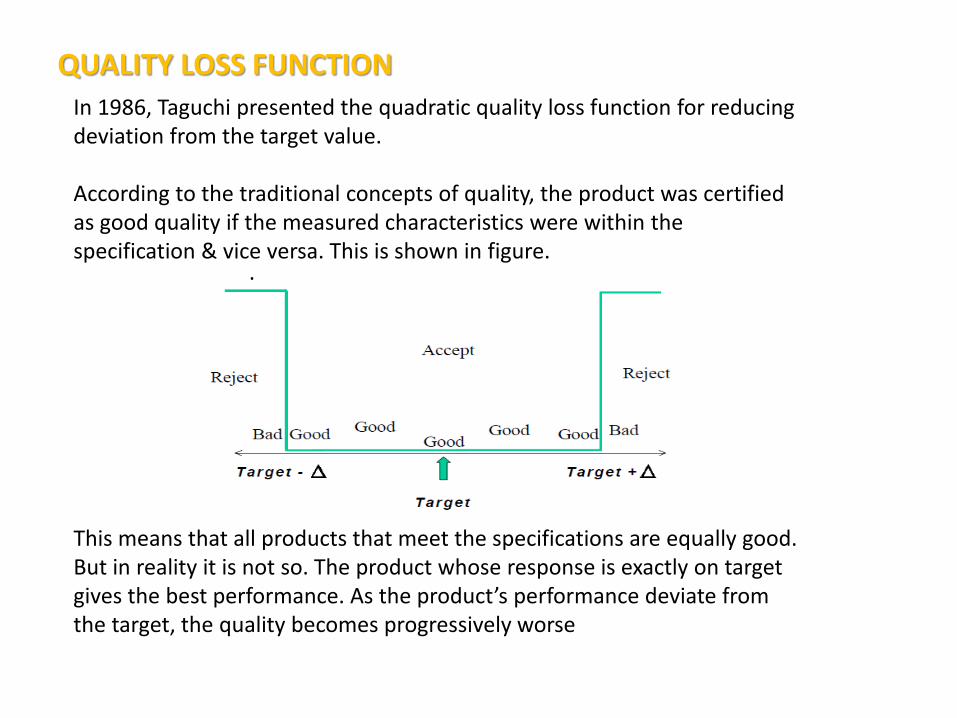
QUALITY LOSS FUNCTION
In 1986, Taguchi presented the quadratic quality loss function for reducing deviation from the target value. According to the traditional concepts of quality, the product was certified as good quality if the measured characteristics were within the specification & vice versa. This is shown in figure. This means that all products that meet the specifications are equally good. But in reality it is not so. The product whose response is exactly on target gives the best performance. As the product’s performance deviate from the target, the quality becomes progressively worse
.

According to Taguchi’s viewpoint, the quality loss function is a measure for the evaluation of deviations from the target values of the product, even when these lie within specifications. The quality loss function focuses on the economic and societal penalties incurred as a result of purchasing a nonconforming product. The loss refers to the cost that is incurred by society when the consumer uses a product whose quality characteristics differ from the nominal. The concept of societal loss is a departure from traditional thinking. Taguchi identifies these losses to society not only in terms of rejection, scrap, or rework, excessive costs of operating the product but also in terms of pollution that is added to the environment, products that wear out too quickly, or other negative effects that occur.
Dr. G. Taguchi developed a systemized statistical approach to product and process improvement
The approach emphasizes moving quality upstream to the design phase
Based on the notion that minimizing variation is the primary means of improving quality
Special attention is given to designing systems such that their performance is insensitive to environmental changes

Taguchi's philosophy involves three central ideas: 1. Products and processes should be designed so that they are robust to external sources of variability. 2. Exptl design methods are engg. tool to help accomplish this objective. 3. Operation on-target is more imp. than conformance to specifications. In order to reduce expected losses with respect to the quadratic loss function, the process mean should be close to the target and process standard deviation should be small. Thus, if the quality characteristic concentrates on the target value with minimum standard deviation, then it is said that the product has minimum quality loss. The quadratic quality loss function has been applied in online and off-line quality control, for obtaining the economic design of control charts, of sampling plans, and of specification limits.

To quantify loss to society, Taguchi used the concept of a quadratic loss function (QLF). Figure S7.2 shows Taguchi’s concept of a quadratic loss function.
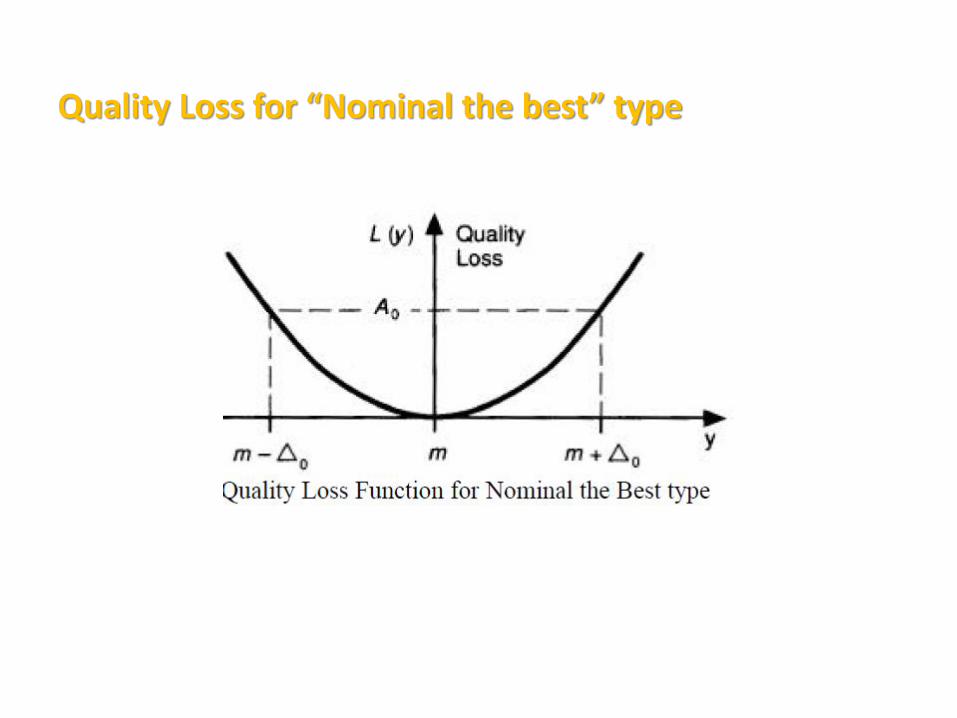
Quality Loss for “Nominal the best” type

Quality Loss for “the smaller the better” type
Eg: Radiation leakage from a microwave oven, Response time of computer, Pollution from automobile etc.
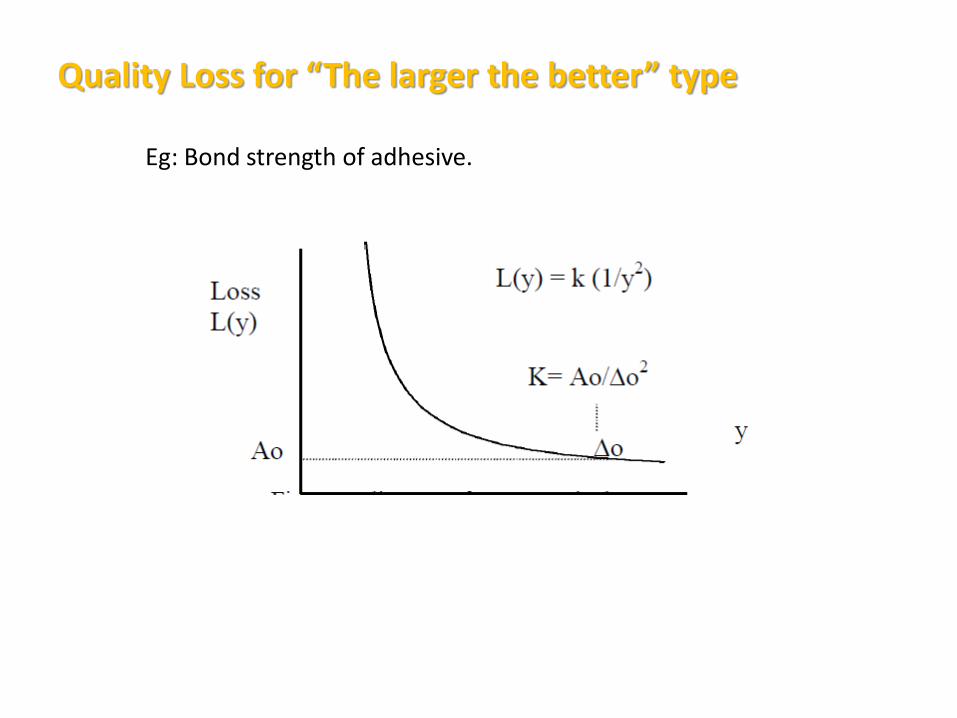
Quality Loss for “The larger the better” type
Eg: Bond strength of adhesive.

Derivation and use of quadratic loss function
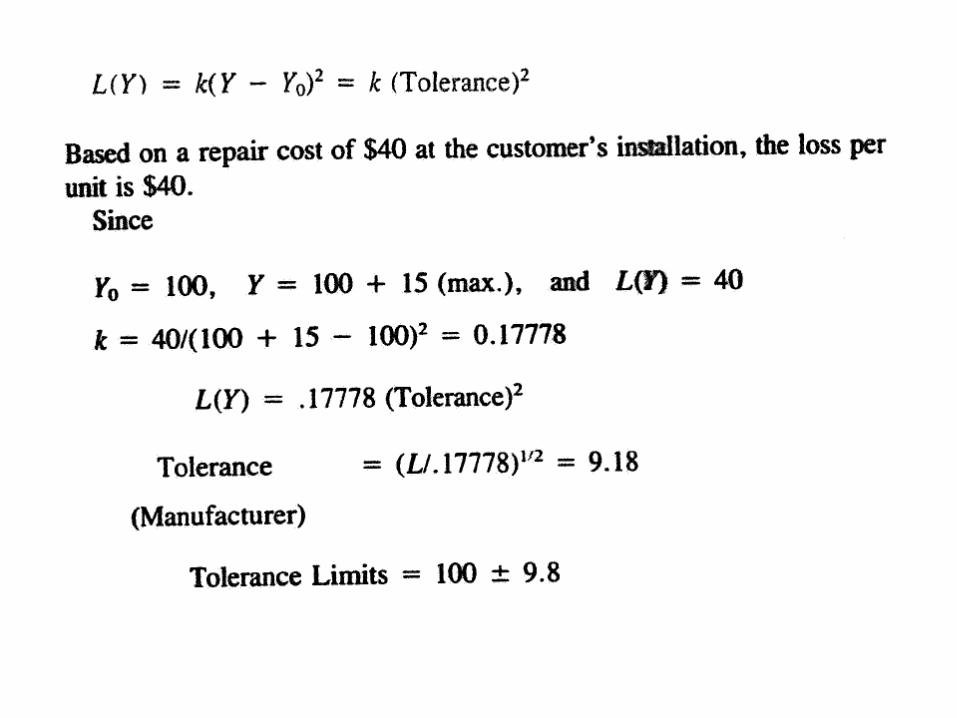
The taguchi Loss function L(y) is represented as
L(Y) = K x (y-m)2, Where, K is the constant whose value is dependent on the cost structure of the process Y is the value of the quality characteristic, and
m is the target value of the quality characteristic The term (y-m) represents the deviation of the quality characteristic from the target value. target value . At zero deviation, the performance is on target, and the loss is zero.

The loss function represented by the above Eqn is shown in the figure. It possesses the following characteristics: The loss must be zero when the quality characteristic of a product meets its target value The magnitude of the loss increases rapidly as the quality characteristic deviates from its target value. The loss function must be a continuous (second order) function of the deviation from target value, and differential everywhere.
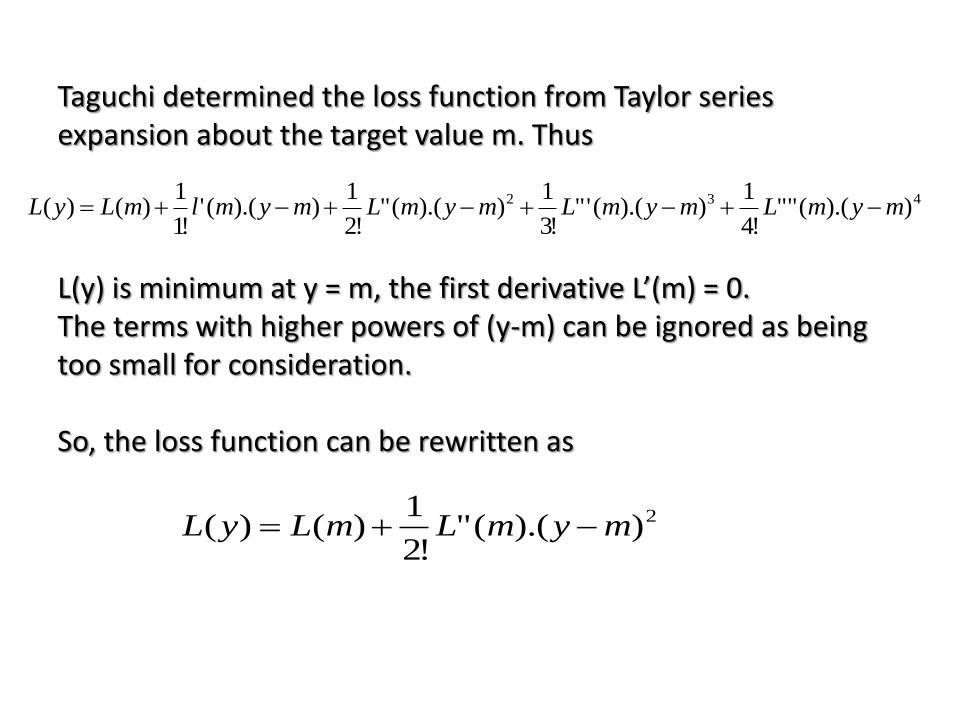
Taguchi determined the loss function from Taylor series expansion about the target value m. Thus L(y) is minimum at y = m, the first derivative L’(m) = 0. The terms with higher powers of (y-m) can be ignored as being too small for consideration. So, the loss function can be rewritten as
432 )).((""!4
1)).(('"
!3
1)).(("
!2
1)).(('
!1
1)()( mymLmymLmymLmymlmLyL
2)).(("!2
1)()( mymLmLyL
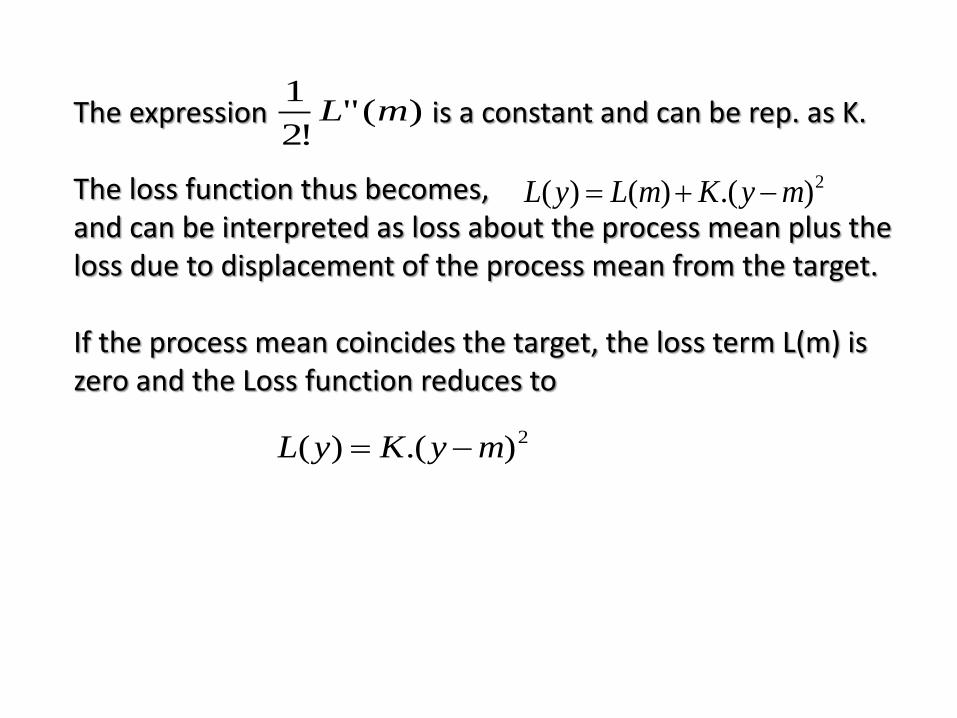
The expression is a constant and can be rep. as K. The loss function thus becomes, and can be interpreted as loss about the process mean plus the loss due to displacement of the process mean from the target. If the process mean coincides the target, the loss term L(m) is zero and the Loss function reduces to
2).()( myKyL
)("!2
1mL
2).()()( myKmLyL
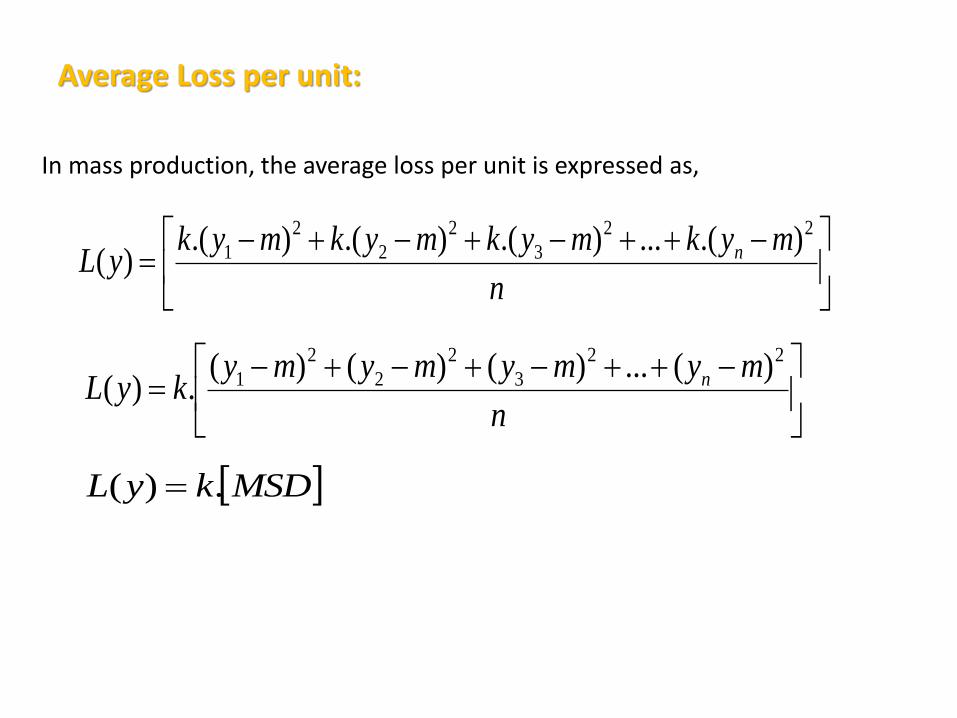
Average Loss per unit:
In mass production, the average loss per unit is expressed as,
n
mykmykmykmykyL n
22
3
2
2
2
1 ).(...).().().()(
n
mymymymykyL n
22
3
2
2
2
1 )(...)()()(.)(
MSDkyL .)(
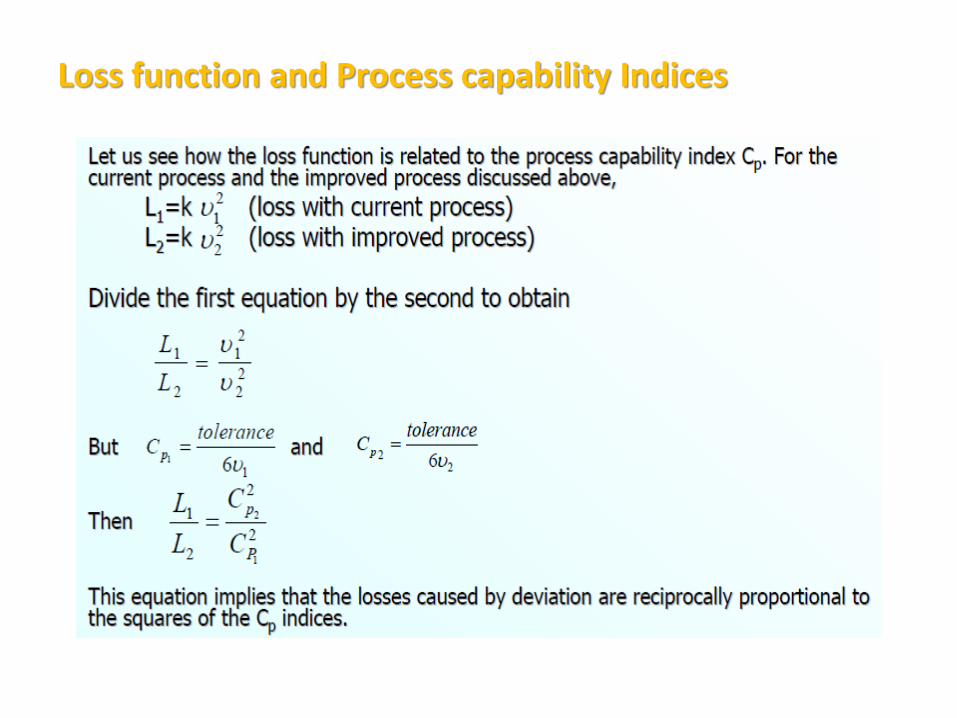
Loss function and Process capability Indices
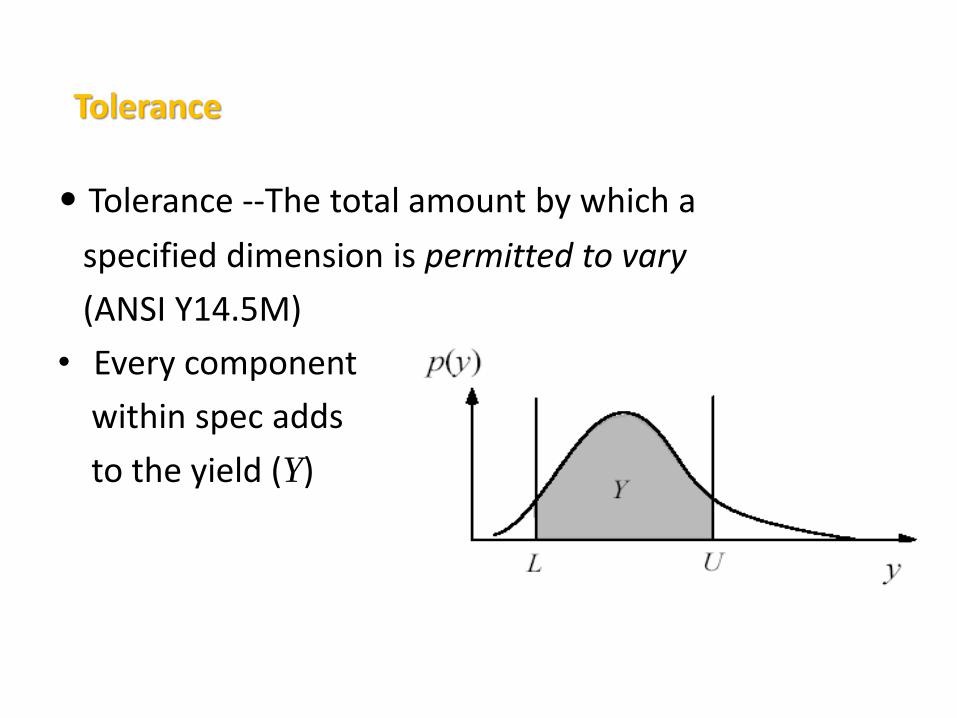
Tolerance
• Tolerance --The total amount by which a
specified dimension is permitted to vary
(ANSI Y14.5M)
• Every component
within spec adds
to the yield (Y)
Economic consequences of tightening tolerances as a
means to improve quality
The tolerance assignment approach used by most organizations offers opportunities to reduce cost and improve quality through tolerance relaxation. While quality improvement based on relaxed tolerances seems counterintuitive, a quick look at how tolerances are assigned and the consequences of overly-stringent tolerances reveal why this is so. We assign tolerances to nominal dimensions to make parts producible and interchangeable. Tolerances are generally inversely proportional to manufacturing cost, and this is due to the fact that tighter tolerances are usually more difficult to achieve. Manufacturing costs generally increase as tolerances are tightened, and so does rejection likelihood. From a cost perspective, we want tolerances to be as large as possible (consistent with assembly and performance requirements).

The process variance can be lowered by tightening the process tolerance, with extra cost incurred. In case the conventional on-line PCI is used for process capability analysis during the product development, designer engineers naturally intend to raise the PCI value by locating the process mean near the target value, and by reducing the tolerance value to ensure a better product quality. However, simply increasing the PCI value can easily create additional and unnecessary production costs that result from extra efforts and expensive devices for ensuring tolerance control.

The tolerance cost can be formulated in various function expressions. To evaluate the tolerance cost, the tolerance cost function as
developed in the literature [Chase et al., 1990) is adopted Where, a, b, and c are the coefficients for the tolerance cost function, and t is the process tolerance. From the above cost expression, it can be noted that a tight process tolerance results in a higher tolerance cost, due to additional manufacturing operations, more expensive equipment needed and slower production rates, while a loose process tolerance results in a lower tolerance cost
tcebaTCM ..)(

The designers would most likely establish the process mean as close as possible to the design target , within the process feasible range, and attempt to decrease the process variance as much as possible within the process capability limits in order to attain a higher PCI value. In other words, with the exclusive use of the process mean and process tolerance as the determinants of conventional PCI, regardless of the cost impact on customer and production, there is a tendency for designers to position the process mean as close to the target value as possible, and solely cut down the process tolerance to lower capability limit in order to increase the PCI value.

Reducing the process variance is normally completed by tightening the tolerance value through tolerance design which usually involves additional cost. Therefore, in addition to the constraints from feasible ranges and capability limits, the influence exerted by the relevant costs representing the selected process mean and process tolerance, should be considered as well. The costs related to process mean and process tolerance must be contained in PCI expression, when referred to as off-line process capability analysis, during product design and process planning.

Problem 1:

The average loss per unit is
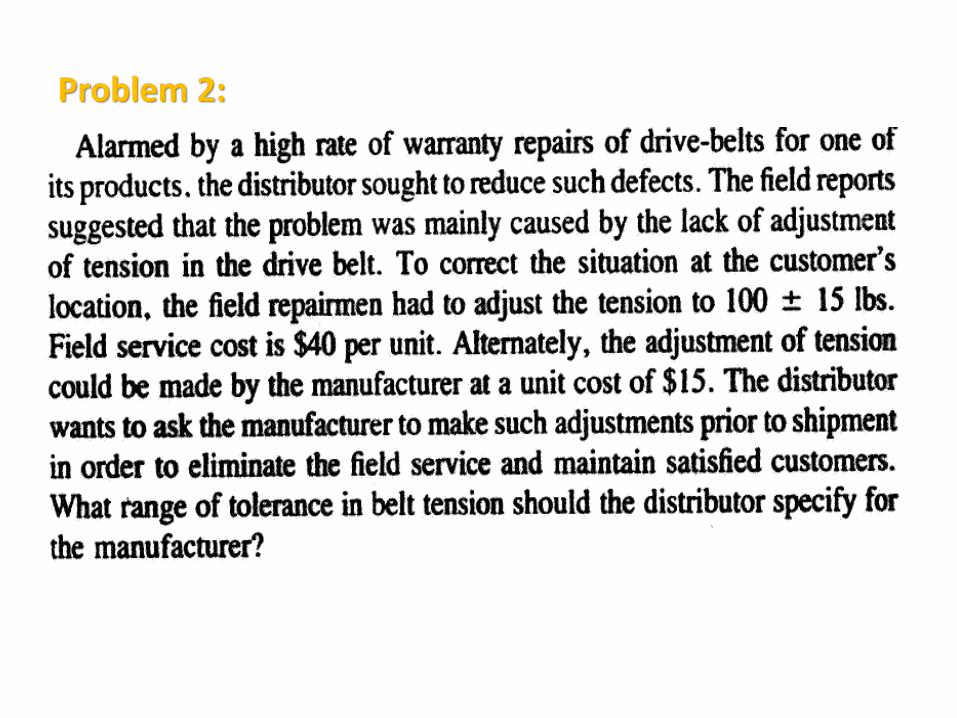
Problem 2:


A spring is used in the operation of a camera shutter. The manufacturing process suffers from a degree of variability, in terms of the spring constant (measured in oz/in), which significantly effects the accuracy of the shutter times. The functional limits for this spring constant are m±0.3oz/in (m=0.5oz/in), and the average cost for repairing or replacing a camera with a defective spring is Rs. 20. What is the loss function? Hence, what is the loss associated with producing a spring of constant 0.25oz/in versus the loss associated with one at 0.435oz/in.

Suppose you are manufacturing green paint. To determine a specification for the pigment, you must determine both a functional tolerance and customer loss. The functional tolerance, Δ0 is a value for every product characteristic at which 50% of customers view the product as defective. The customer loss, A0, is the average loss occurring at this point. Your target is 200g of pigment in each gallon of paint. The average cost to the consumer is $10 per gallon from returns or adjusting the pigment. The paint becomes unsatisfactory if it is out of the range . Calculate the loss imparted to society from a gallon of paint with only 185g of pigment.

This figure is a rough approximation of the cost imparted to society from poor quality.
Evaluations of tolerances (N-type, S-type and L-type)
The literature indicates three type of tolerances: the nominal - the best (N-type) the smaller - the better (S-Type) the larger – the better (L-Type) “The nominal - the best” type is required in many cases when a nominal characteristic can vary in two directions.
Tolerance design and tolerancing:
Tolerance design is used to determine and analyze tolerances around the optimal settings recommended by the parameter design. The purpose of tolerance design is to set acceptance regions for the design parameters. Tolerance design is required if the reduced variation obtained by the parameter design does not meet the required performance. The tolerance is usually given in the form of an upper and lower bound. Tolerance is needed because the excessive variations in the design parameter, which corresponds to larger a;, will lead to excessive variability of the quality characteristics, a;. As a result, we get an unacceptable quality loss. Therefore, tolerance limits should be set to limit the variations of design parameters. Typically, tightening tolerances mean purchasing better- grade materials, components, or machinery, which increases cost.
Functional limits
Tolerance design for N-type characteristics
Tolerance design for L-type characteristics
Tolerance design for S-type characteristics

Robust design
According to Taguchi’s quality engineering philosophy and methodology, there are three important steps in designing a product or process: System design, Parameter design and Tolerance design.
SYSTEM DESIGN The aim of system design is to create a product that indeed possesses the properties intended for it at the planning stage. This involves the development of a prototype, choice of materials, parts, components, assembly system and manufacturing processes, so that the product fulfils the specified conditions and tolerances at the lowest costs.

PARAMETER DESIGN:
Parameter design tries to determine the connections between controllable and noise factors, in order to ascertain the best combination of factor levels in the manufacturing process, having the purpose of achieving robustness, and improving quality, without increasing costs. TOLERANCE DESIGN: Tolerance design tries to narrow the ranges of the operating conditions, so that the most economical tolerances are obtained.


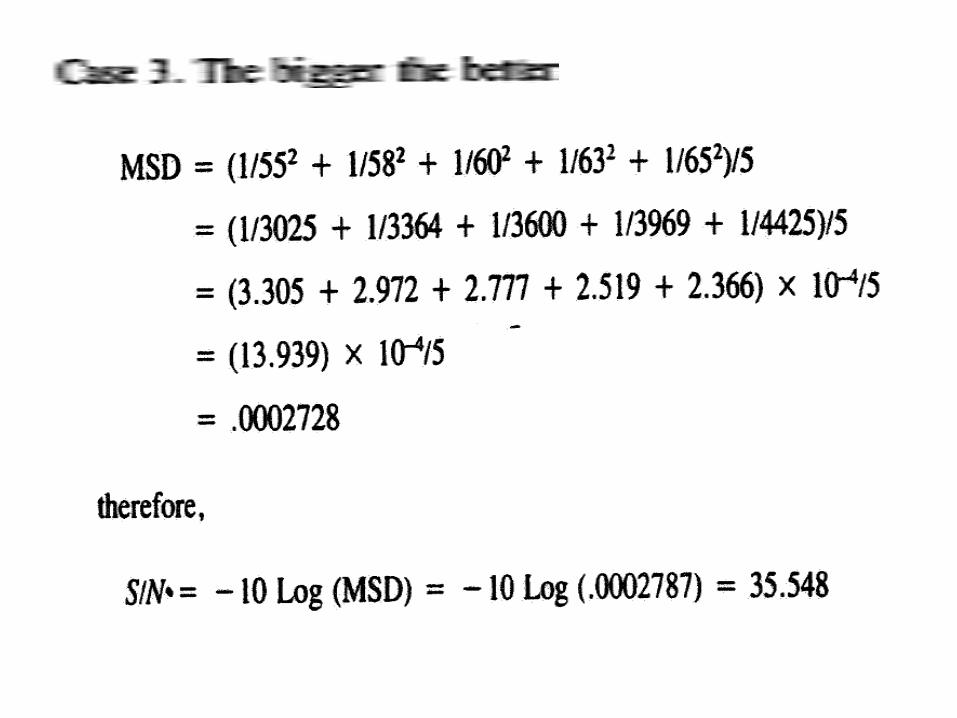
Signal to Noise (S/N) Ratio
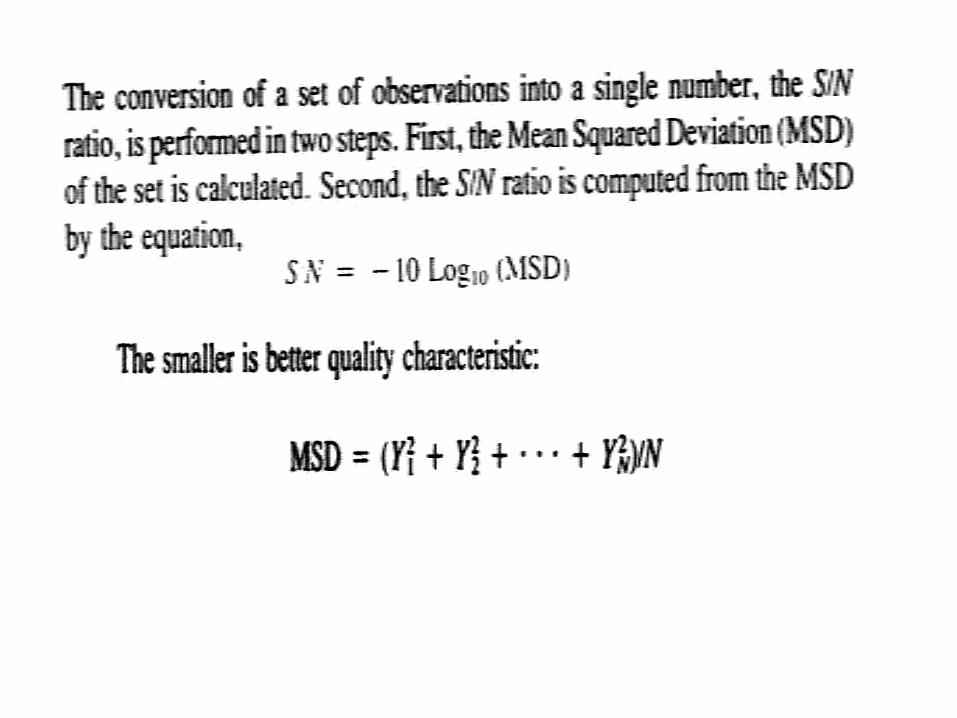
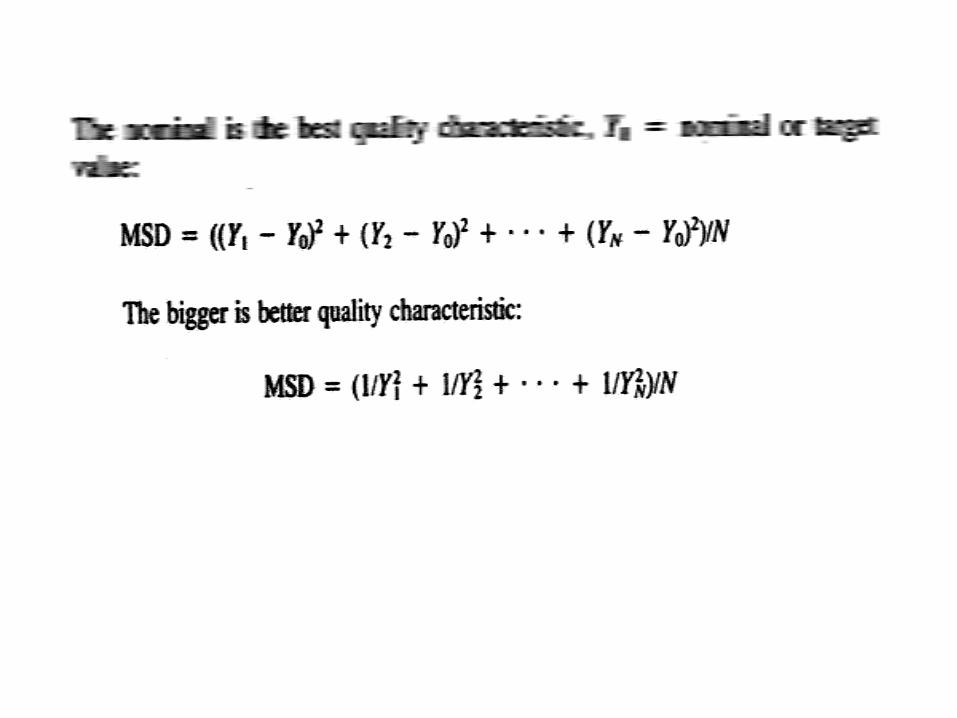


Computation of S/N Ratios:


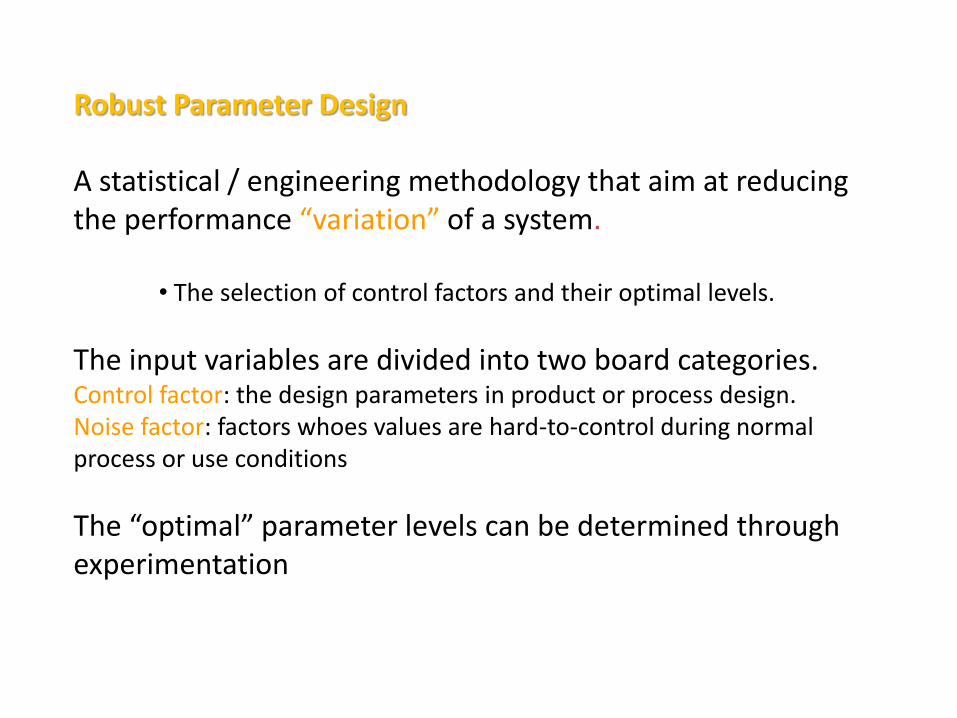
Robust Parameter Design A statistical / engineering methodology that aim at reducing the performance “variation” of a system.
• The selection of control factors and their optimal levels.
The input variables are divided into two board categories. Control factor: the design parameters in product or process design. Noise factor: factors whoes values are hard-to-control during normal process or use conditions
The “optimal” parameter levels can be determined through experimentation
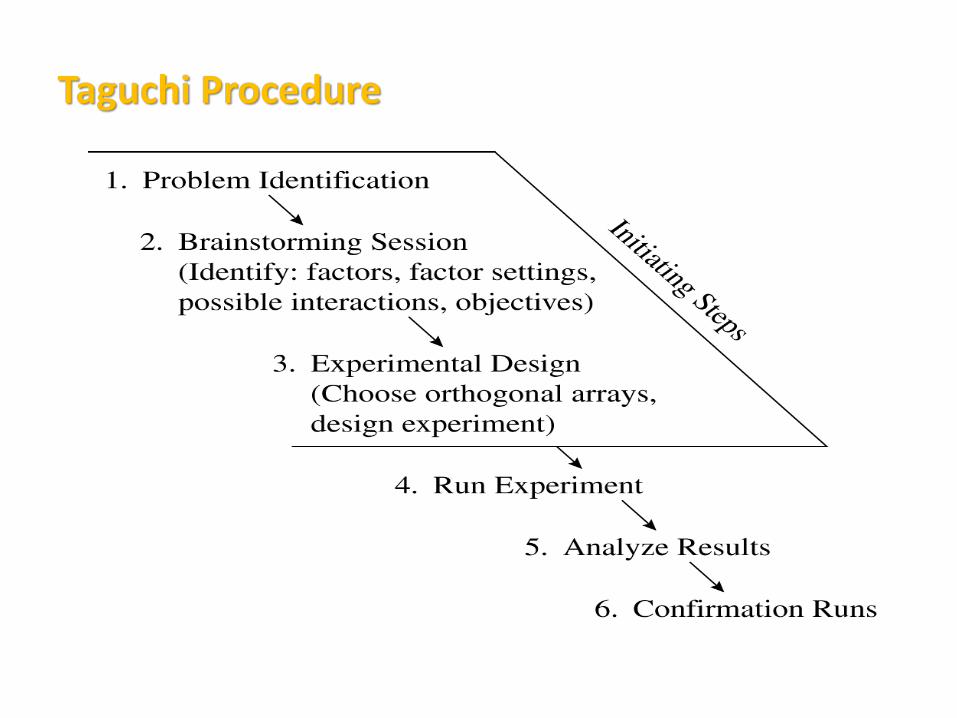
Taguchi Procedure
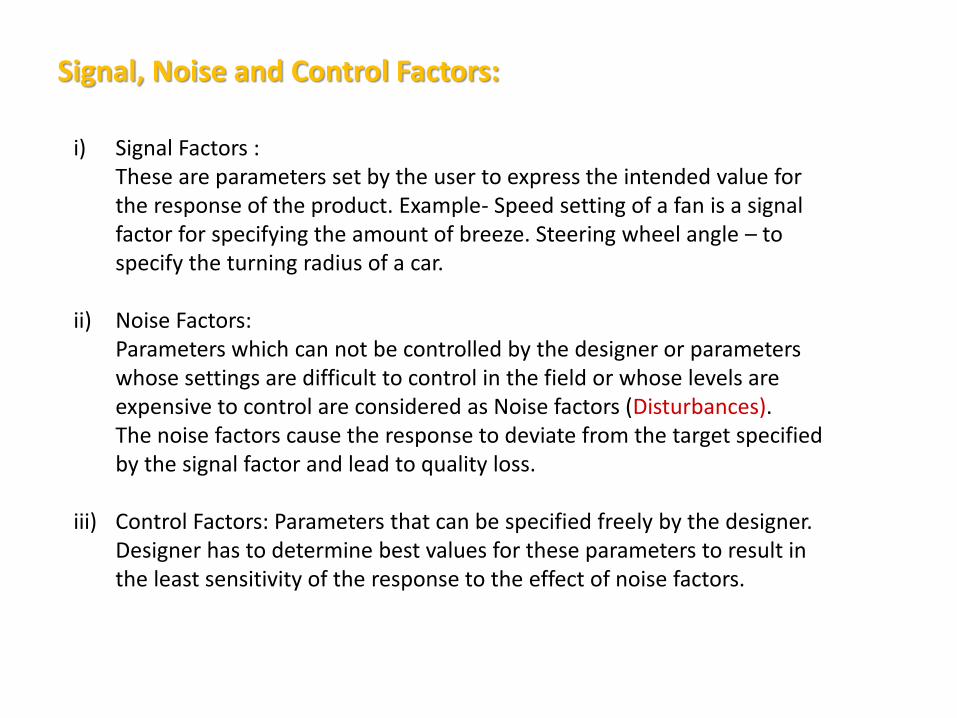
Signal, Noise and Control Factors:
i) Signal Factors : These are parameters set by the user to express the intended value for
the response of the product. Example- Speed setting of a fan is a signal factor for specifying the amount of breeze. Steering wheel angle – to specify the turning radius of a car.
ii) Noise Factors: Parameters which can not be controlled by the designer or parameters
whose settings are difficult to control in the field or whose levels are expensive to control are considered as Noise factors (Disturbances).
The noise factors cause the response to deviate from the target specified by the signal factor and lead to quality loss.
iii) Control Factors: Parameters that can be specified freely by the designer.
Designer has to determine best values for these parameters to result in the least sensitivity of the response to the effect of noise factors.

Case studies on parameter and tolerance designs
Analysis of Variance (ANOVA)
A technique which subdivides the total variation of a set of data into meaningful component parts associated with specific sources of variation for the purpose of testing some hypothesis on the parameters of the model or estimating variance components.
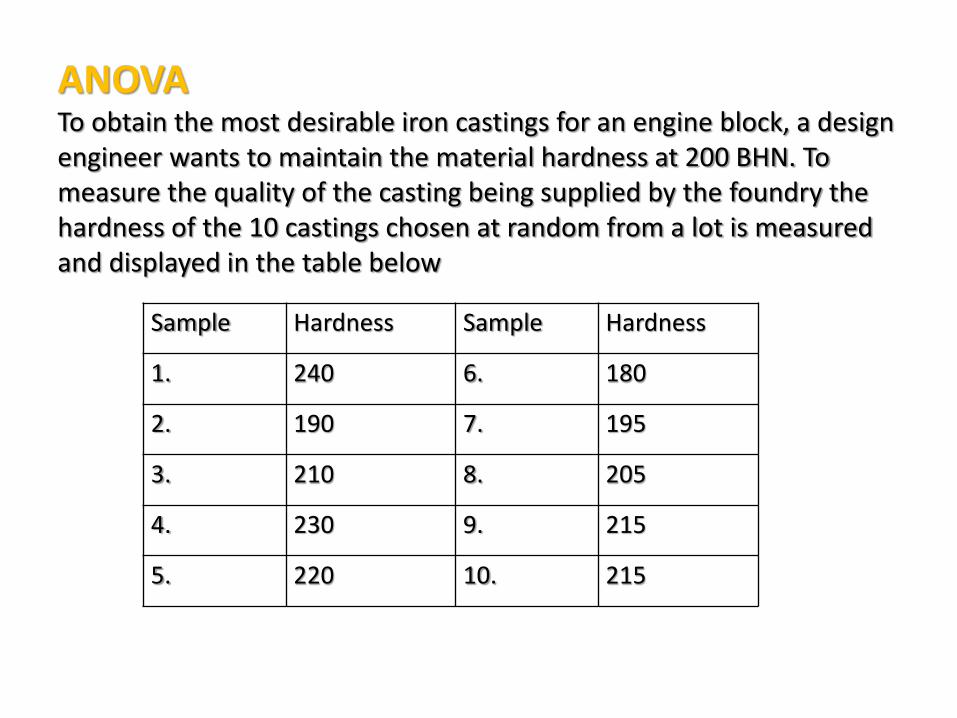
ANOVA To obtain the most desirable iron castings for an engine block, a design engineer wants to maintain the material hardness at 200 BHN. To measure the quality of the casting being supplied by the foundry the hardness of the 10 castings chosen at random from a lot is measured and displayed in the table below
Sample Hardness Sample Hardness
1. 240 6. 180
2. 190 7. 195
3. 210 8. 205
4. 230 9. 215
5. 220 10. 215
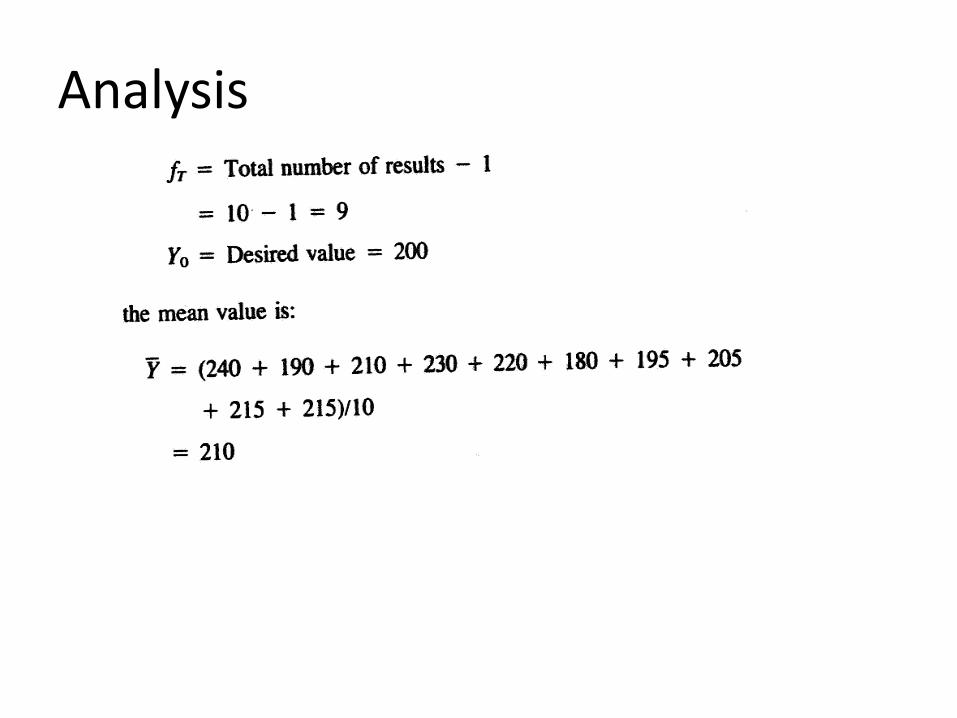
Analysis

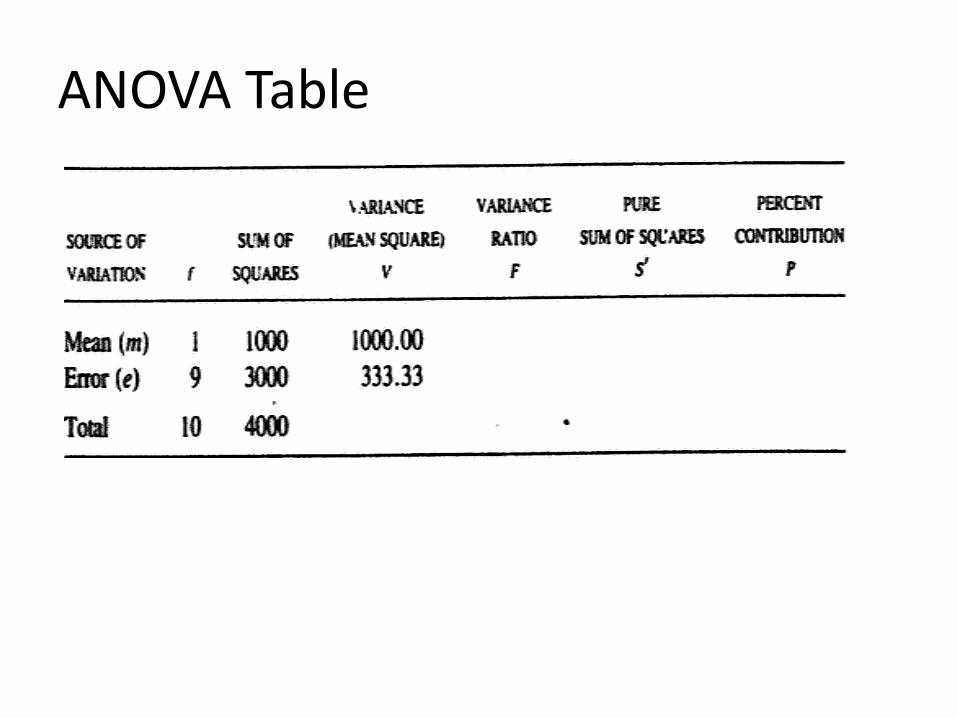
ANOVA Table


Pure sum of Squares


Two way ANOVA (2-Factor, 2- Level)
Design of Experiments
A designed experiment is an experiment where one or more variables, called independent variables, believed to have an effect on the experimental outcome are identified and manipulated according to a predetermined plan. Data collected from a designed experiment can be analyzed statistically to determine the effect of the independent variables, or combinations of more than one independent variable. Experiment design: The arrangement in which an experimental program is to be conducted, and the selection of the versions (levels) of one or more factors or factor combinations to be included in the experiment. The statistically designed experiment is able to extract a maximum amount of information from a limited set of observations Factor: An assignable cause which may affect the responses (test results) and of which different versions (levels) are included in the experiment.

Full And Fractional Factorial Designs:
Factorial experiments: Experiments in which all possible treatment combinations formed from two or more factors, each being studied at two or more versions (levels), are examined so that interactions (differential effects) as well as main effects can be estimated. Full factorial experiments are those where at least one observation is obtained for every possible combination of experimental variables. For example, if A has 2 levels, B has 3 levels and Chas 5 levels, a full factorial experiment would have at least 2x3x5=30 observations. Fractional factorial or fractional replicate are experiments where there are some combinations of experimental variables where observations were not obtained. Such experiments may not allow the estimation of every interaction. However, when carefully planned, the experimenter can often obtain all of the information needed at a significant savings. Balanced Design: An experimental design where all cells (i.e. treatment combinations) have the same number of observations.
Response variable: The variable (output(s) of a process ) being investigated , also called the dependent variable.
Primary variables: (aka main factors, main effects, inner array) The controllable variables believed most likely to have an effect. These may be quantitative, such as temperature, pressure, or speed, or they may be qualitative such as vendor, production method, or operator.
Background variables: (aka subsidiary factors, outer array) Variables, identified by the designers of the experiment, which may have an effect but either can not or should not be deliberately manipulated or held constant. The effect of background variables can contaminate primary variable effects unless they are properly handled.
Experimental error: In any given experimental situation, a great many variables may be potential sources of variation. So many, in fact, that no experiment could be designed that deals with every possible source of variation explicitly.

Treatment : A treatment is the factor being investigated (material, environmental condition, etc.) in a single factor experiment. In factorial experiments (where several variables are being investigated at the same time) we speak of a treatment combination (Also known as a run) and we mean the prescribed levels of the factors to be applied to an experimental unit.
Interaction: A condition where the effect of one factor depends on the level of another factor.
Replication Replication—The collection of more than one observation for the same set of experimental conditions. Replication allows the experimenter to estimate experimental error. If variation exists when all experimental conditions are held constant, the cause must be something other than the variables being controlled by the experimenter. Experimental error can be estimated without replicating the entire experiment. Replication also serves to decrease bias due to uncontrolled factors.

Randomization A schedule for allocating treatment material and for conducting treatment combinations in a DOE such that the conditions in one run neither depend on the conditions of the previous run nor predict the conditions in the subsequent runs. In order to eliminate bias from the experiment, variables not specifically controlled as factors should be randomized. This means that allocations of specimens to treatments should be made using some mechanical method of randomization, such as a random numbers table. Randomization also assures valid estimates of experimental error.

Developing a Cause-and-Effect Diagram:
1. Construct A Straight Horizontal Line (Right Facing)
2. Write Quality Characteristic At Right
3. Draw 45° Lines From Main Horizontal (4 Or 5) For Major Categories: Manpower, Materials, Machines, Methods And Environment
4. Add Possible Causes By Connecting Horizontal Lines To 45° "Main Cause" Rays
5. Add More Detailed Potential Causes Using Angled Rays To Horizontal Possible Cause Lines
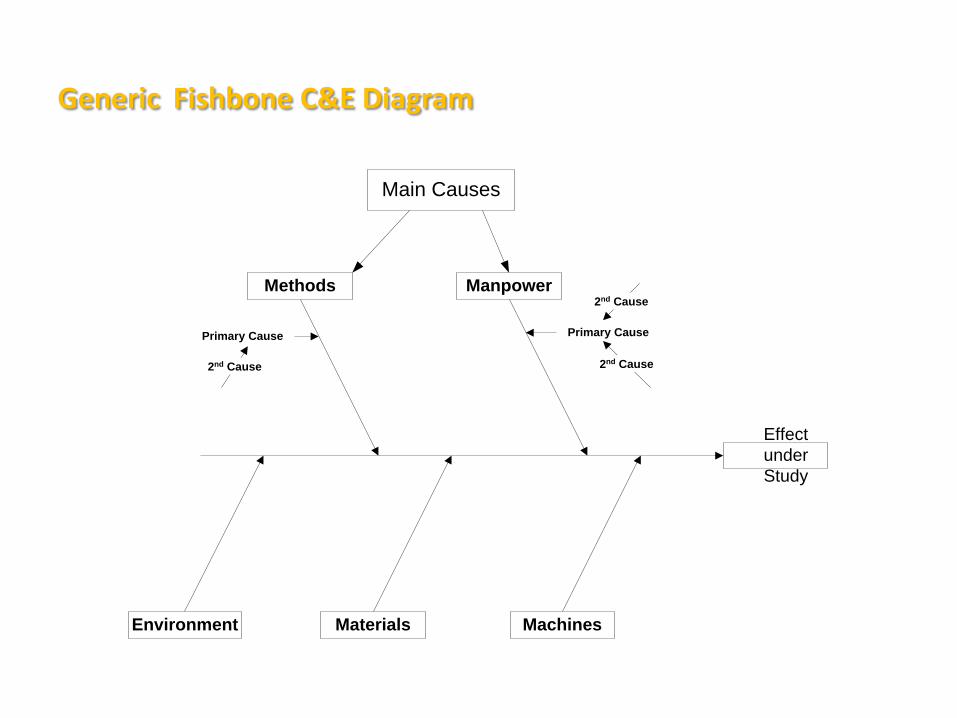
Generic Fishbone C&E Diagram
Methods Manpower
Materials Machines
Effect
under
Study
Environment
Main Causes
Primary Cause Primary Cause
2nd Cause 2nd Cause
2nd Cause

Building the ‘Experiment’ Working From a Cause & Effect Diagram
Fine Grained
Chemical Yield
Raw Material
Reaction
TransportationMoisture
ContentCatalyzer
CrystallizationPackage
Over Weight
Shortage of
Weight
Discharge
Method
Sol. A Conc.
Sol. B Temp.
pH
Time
Stir RPM
Sol A
Pour Speed
Quality
Type
Quantity
Spillage
Road
Container
Cover
Time
Concentration
Temperature
Weight Size
Maint. Of
Balance
Accuracy of
Balance
Operator
Type of
Balance
Method of
Weighing
‘Mother Crystal’
Steam
Press.
Steam
Flow
RPM of
Dryer
Charge Speed
Wet Powder
Temperature

Related Documents