McGraw-Hill/Irwin The O’Leary Series © 2002 The McGraw-Hill Companies, Inc. All rights reserved. Microsoft Excel 2002 Lab 2 Charting Worksheet Data

McGraw-Hill/Irwin The O’Leary Series © 2002 The McGraw-Hill Companies, Inc. All rights reserved. Microsoft Excel 2002 Lab 2 Charting Worksheet Data.
Dec 15, 2015
Welcome message from author
This document is posted to help you gain knowledge. Please leave a comment to let me know what you think about it! Share it to your friends and learn new things together.
Transcript
McGraw-Hill/Irwin
The O’Leary Series
© 2002 The McGraw-Hill Companies, Inc. All rights reserved.
Microsoft Excel 2002
Lab 2
Charting Worksheet Data
The O’Leary Series
© 2002 The McGraw-Hill Companies, Inc. All rights reserved.
2
McGraw-Hill/Irwin
ObjectivesObjectives
1. Select a chart data range.2. Change the type of chart.3. Move the chart location.4. Format chart elements.5. Add chart titles and move the legend.6. Create a combination chart.7. Change worksheet data.8. Add data labels, text boxes, and arrows.9. Create, explode, and rotate a pie chart.10. Apply patterns and color.11. Size and align a sheet on a page.12. Add predefined headers and footers.13. Document, preview and print a workbook.
Linda Mehlinger
12 objectives on a slide
The O’Leary Series
© 2002 The McGraw-Hill Companies, Inc. All rights reserved.
3
McGraw-Hill/Irwin
ConceptsConcepts
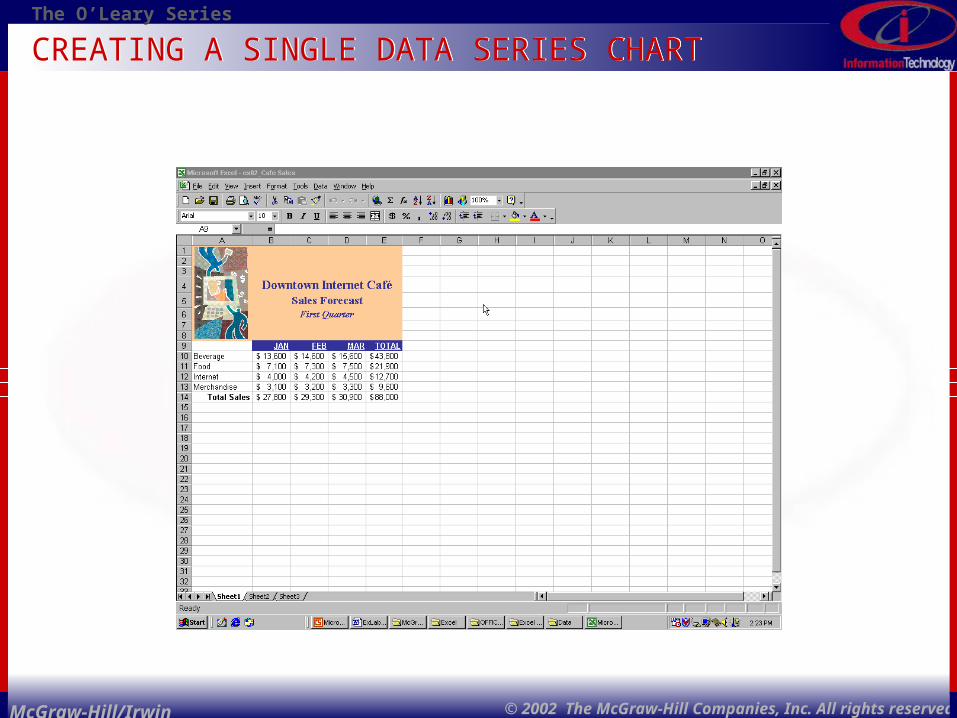
1. Chart - Visual representation of data that is used to convey information in an easy-to-understand and attractive manner.
2. Chart Elements - Chart elements consist of a number of parts that are used to graphically display the worksheet data.
3. Chart Objects - A graphic object that is created using charting features included in Excel.
4. Group - Because it consists of many separate objects a chart object is a group.
Linda Mehlinger
Numbers and links on this page.
The O’Leary Series
© 2002 The McGraw-Hill Companies, Inc. All rights reserved.
4
McGraw-Hill/Irwin
ConceptsConcepts
5. Data Label - Data labels provide additional information about a data marker.
6. Text Box -A rectangular object in which you type text.
7. Header and Footer - Lines of text displayed below the top margin or above the bottom margin of each page are called headers and footers.
Linda Mehlinger
Numbers and links on this page.
The O’Leary Series
© 2002 The McGraw-Hill Companies, Inc. All rights reserved.
5
McGraw-Hill/Irwin
OutlineOutline
• Learning About Charts• Creating a Single Data Series Chart
– Selecting the Data to Chart– Using Chart Wizard– Moving and Sizing a Chart
– Changing the Chart Location • Creating a Multiple Data Series Chart
– Changing the Chart Type– Adding Chart Title– Moving the Legend– Formatting Chart Elements– Changing Orientation
The O’Leary Series
© 2002 The McGraw-Hill Companies, Inc. All rights reserved.
6
McGraw-Hill/Irwin
OutlineOutline
• Creating a New Chart from an Existing Chart– Copying a Chart
– Creating Combination Chart
– Adding Data Labels
– Changing Data Series Fill Colors
– Changing Plot Area Colors
– Changing Worksheet Data
– Adding a Text Box
– Adding Arrows
The O’Leary Series
© 2002 The McGraw-Hill Companies, Inc. All rights reserved.
7
McGraw-Hill/Irwin
OutlineOutline
• Creating and Formatting a Pie Chart– Selecting the Pie Chart Data
– Formatting the Pie Chart
– Exploding and Rotating the Pie
– Applying Patterns and Color
– Documenting a Workbook
The O’Leary Series
© 2002 The McGraw-Hill Companies, Inc. All rights reserved.
8
McGraw-Hill/Irwin
OutlineOutline
• Preparing the Workbook for Printing– Previewing the Workbook
– Sizing the Worksheet
– Aligning a Sheet on a Page
– Adding Predefined Headers and Footers
– Printing the Workbook
• Lab Review

The O’Leary Series
© 2002 The McGraw-Hill Companies, Inc. All rights reserved.
9
McGraw-Hill/Irwin
LEARNING ABOUT CHARTSLEARNING ABOUT CHARTS
The O’Leary Series
© 2002 The McGraw-Hill Companies, Inc. All rights reserved.
10
McGraw-Hill/Irwin
• Visual representation of data that is used to convey information
• Type of chart depends on data you are charting• Includes standard charts and professionally
designed built-in custom charts
Concept 1: CHARTConcept 1: CHART
The O’Leary Series
© 2002 The McGraw-Hill Companies, Inc. All rights reserved.
11
McGraw-Hill/Irwin
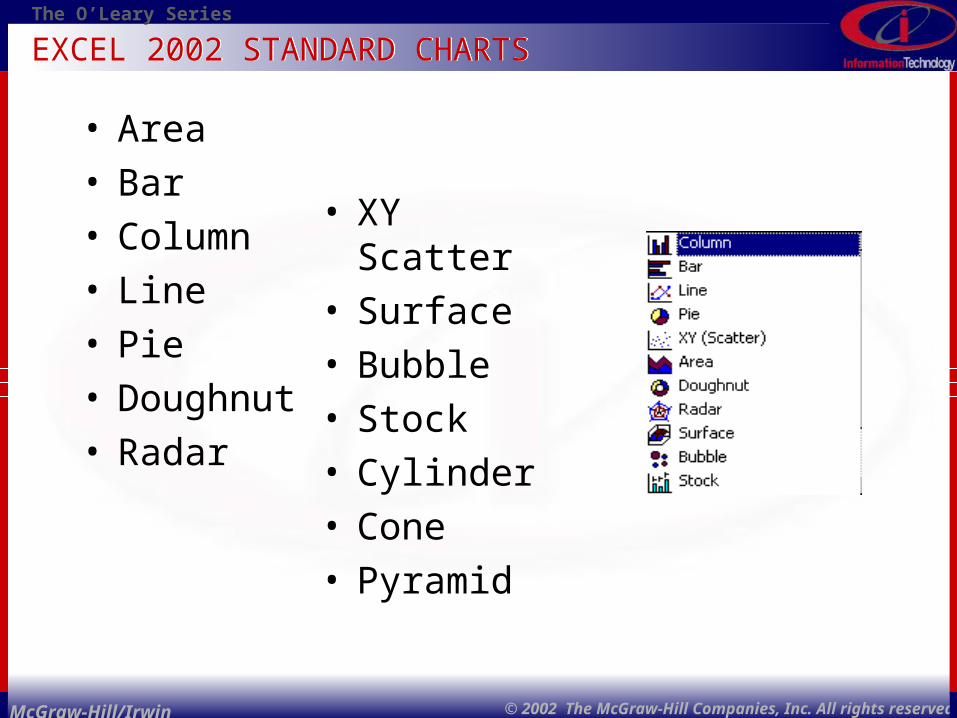
EXCEL 2002 STANDARD CHARTSEXCEL 2002 STANDARD CHARTS
• Area• Bar• Column• Line• Pie• Doughnut• Radar
• XY Scatter• Surface• Bubble• Stock• Cylinder• Cone• Pyramid
The O’Leary Series
© 2002 The McGraw-Hill Companies, Inc. All rights reserved.
12
McGraw-Hill/Irwin
CREATING A SINGLE DATA SERIES CHARTCREATING A SINGLE DATA SERIES CHART
The O’Leary Series
© 2002 The McGraw-Hill Companies, Inc. All rights reserved.
13
McGraw-Hill/Irwin
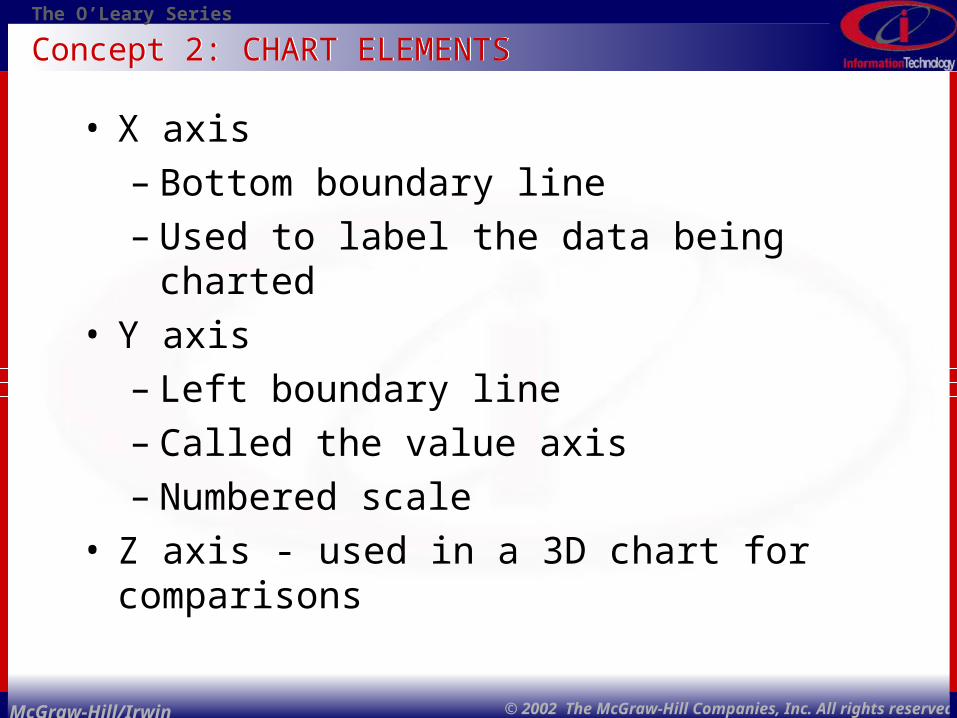
Concept 2: CHART ELEMENTSConcept 2: CHART ELEMENTS
• X axis – Bottom boundary line – Used to label the data being charted
• Y axis – Left boundary line– Called the value axis– Numbered scale
• Z axis - used in a 3D chart for comparisons
The O’Leary Series
© 2002 The McGraw-Hill Companies, Inc. All rights reserved.
14
McGraw-Hill/Irwin
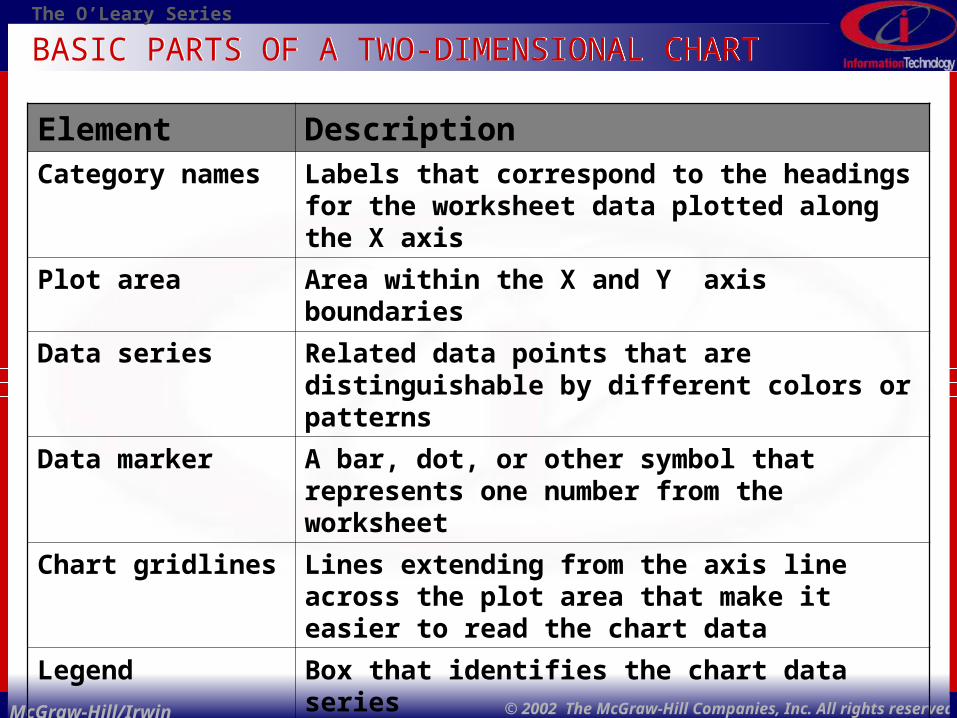
BASIC PARTS OF A TWO-DIMENSIONAL CHARTBASIC PARTS OF A TWO-DIMENSIONAL CHART
Element DescriptionCategory names Labels that correspond to the headings for the
worksheet data plotted along the X axis
Plot area Area within the X and Y axis boundaries
Data series Related data points that are distinguishable by different colors or patterns
Data marker A bar, dot, or other symbol that represents one number from the worksheet
Chart gridlines Lines extending from the axis line across the plot area that make it easier to read the chart data
Legend Box that identifies the chart data series
Chart title Descriptive label that explains the content of the chart
Category-axis title Descriptive label along the X axis
Value-axis title Descriptive label along the Y axis
The O’Leary Series
© 2002 The McGraw-Hill Companies, Inc. All rights reserved.
15
McGraw-Hill/Irwin
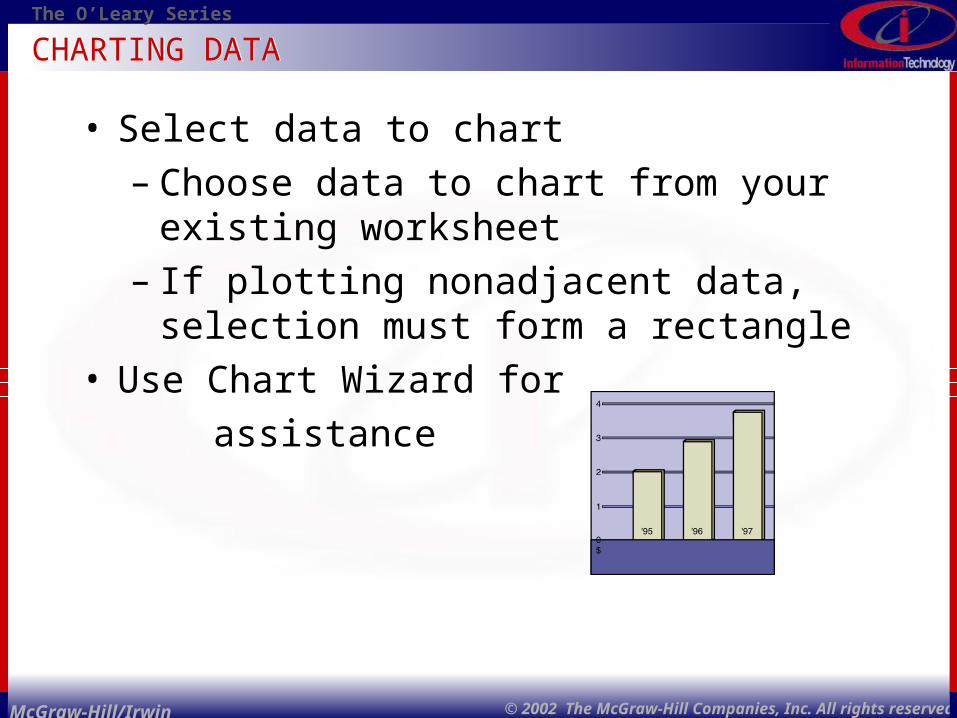
CHARTING DATACHARTING DATA
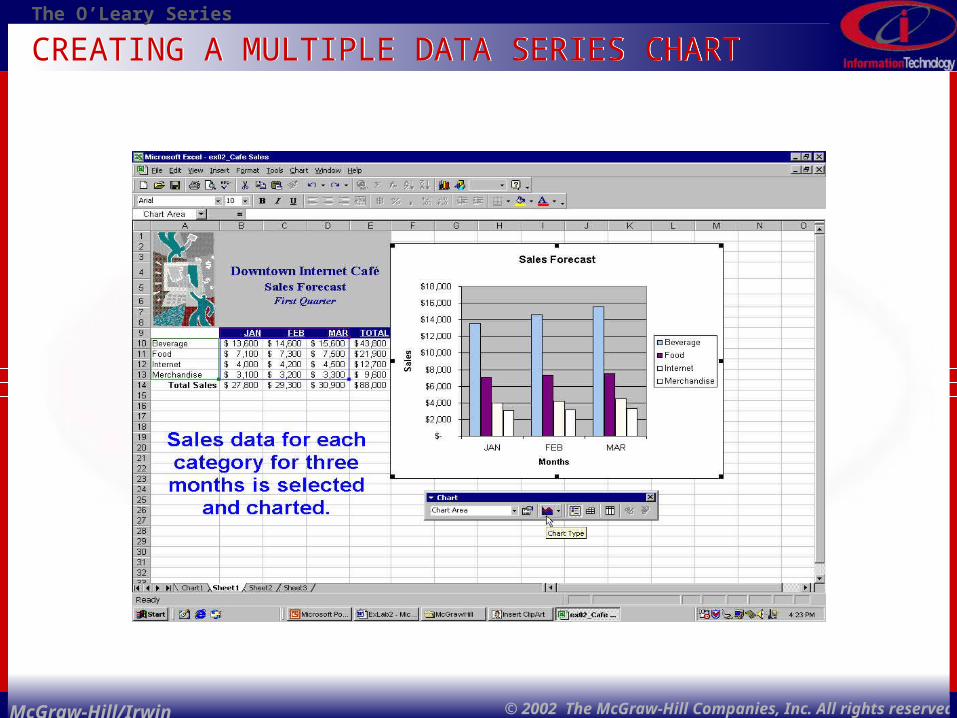
• Select data to chart– Choose data to chart from your existing
worksheet– If plotting nonadjacent data, selection must
form a rectangle• Use Chart Wizard for
assistance
The O’Leary Series
© 2002 The McGraw-Hill Companies, Inc. All rights reserved.
16
McGraw-Hill/Irwin
USING CHART WIZARDUSING CHART WIZARD
1. Select data range first2. Choose Chart type - default is column chart3. Verify or change source data
The O’Leary Series
© 2002 The McGraw-Hill Companies, Inc. All rights reserved.
17
McGraw-Hill/Irwin
USING CHART WIZARDUSING CHART WIZARD
4. Choose chart options and change if necessary Titles Axis Gridlines Legend Data labels Data table
5. Specify chart location
The O’Leary Series
© 2002 The McGraw-Hill Companies, Inc. All rights reserved.
18
McGraw-Hill/Irwin
• Chart object– Graphic object that is created using charting
features– Can be inserted into a worksheet or into a
special chart• Embedded chart
– Becomes part of of the worksheet– Can be sized and moved
Concept 3: CHART OBJECTSConcept 3: CHART OBJECTS
The O’Leary Series
© 2002 The McGraw-Hill Companies, Inc. All rights reserved.
19
McGraw-Hill/Irwin
CHARTINGCHARTING
• Moving and sizing a chart– Chart tips displayed within the chart– Can move entire chart if Chart Area is
displayed• Changing chart location
– Can move to a separate sheet– When chart is selected, Data menu changes to
Chart menu
The O’Leary Series
© 2002 The McGraw-Hill Companies, Inc. All rights reserved.
20
McGraw-Hill/Irwin
CREATING A MULTIPLE DATA SERIES CHARTCREATING A MULTIPLE DATA SERIES CHART
The O’Leary Series
© 2002 The McGraw-Hill Companies, Inc. All rights reserved.
21
McGraw-Hill/Irwin
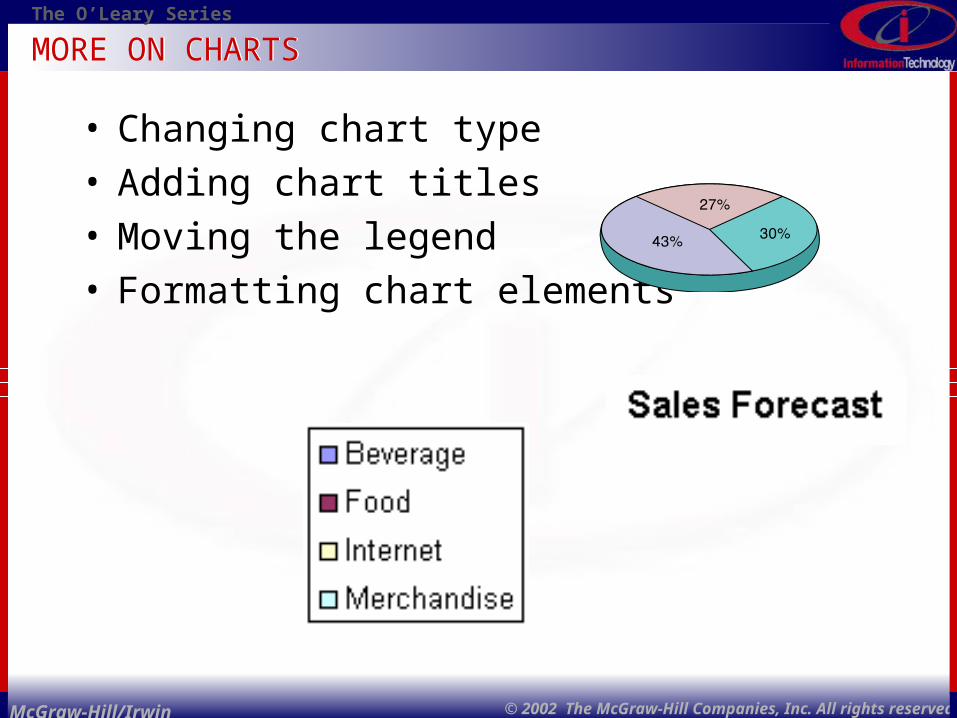
MORE ON CHARTSMORE ON CHARTS
• Changing chart type• Adding chart titles• Moving the legend• Formatting chart elements
The O’Leary Series
© 2002 The McGraw-Hill Companies, Inc. All rights reserved.
22
McGraw-Hill/Irwin
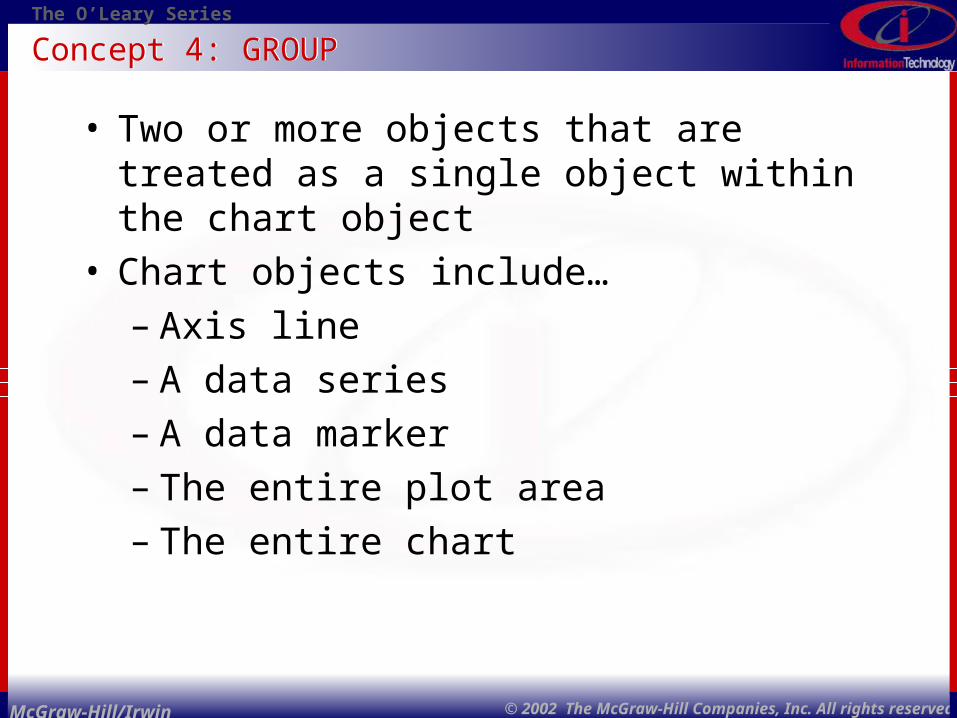
• Two or more objects that are treated as a single object within the chart object
• Chart objects include…– Axis line– A data series– A data marker– The entire plot area– The entire chart
Concept 4: GROUPConcept 4: GROUP

The O’Leary Series
© 2002 The McGraw-Hill Companies, Inc. All rights reserved.
23
McGraw-Hill/Irwin
CHANGING ORIENTATIONCHANGING ORIENTATION
The O’Leary Series
© 2002 The McGraw-Hill Companies, Inc. All rights reserved.
24
McGraw-Hill/Irwin
CREATING A NEW CHART FROM AN EXISTING CHARTCREATING A NEW CHART FROM AN EXISTING CHART
• Copying a chart• Creating a combination chart
– Uses two or more chart types to emphasize different information
– Makes it easy to see comparisons– Shows different types of data in a single chart

The O’Leary Series
© 2002 The McGraw-Hill Companies, Inc. All rights reserved.
25
McGraw-Hill/Irwin
• Provide additional information about a data marker
• Consist of …– Value of the marker– Name of the data series or category– A percent value– A bubble size
Concept 5: DATA LABELConcept 5: DATA LABEL

The O’Leary Series
© 2002 The McGraw-Hill Companies, Inc. All rights reserved.
26
McGraw-Hill/Irwin
SERIES FORMULASERIES FORMULA
The O’Leary Series
© 2002 The McGraw-Hill Companies, Inc. All rights reserved.
27
McGraw-Hill/Irwin
CHANGES TO THE CHARTCHANGES TO THE CHART
• Changing data series fill colors
• Changing plot area colors• Changing worksheet data
The O’Leary Series
© 2002 The McGraw-Hill Companies, Inc. All rights reserved.
28
McGraw-Hill/Irwin
Concept 6: TEXT BOXConcept 6: TEXT BOX
• A rectangular object in which you type text– Added to sheet or embedded chart
• Includes word wrap
The O’Leary Series
© 2002 The McGraw-Hill Companies, Inc. All rights reserved.
29
McGraw-Hill/Irwin
CREATING AND FROMATTING A PIE CHARTCREATING AND FROMATTING A PIE CHART
• Selecting data for a pie chart• Formatting the pie chart• Exploding and rotating
the pie chart• Applying patterns and color
The O’Leary Series
© 2002 The McGraw-Hill Companies, Inc. All rights reserved.
30
McGraw-Hill/Irwin
• Previewing the workbook• Sizing the worksheet• Aligning a sheet on a page
PREPARING THE WORKBOOK FOR PRINTINGPREPARING THE WORKBOOK FOR PRINTING
The O’Leary Series
© 2002 The McGraw-Hill Companies, Inc. All rights reserved.
31
McGraw-Hill/Irwin
Concept 7: HEADER AND FOOTERConcept 7: HEADER AND FOOTER
• Header – Lines that appear at the top of the page• Footer – Lines that appear at the bottom of the
page• Common information are date and page number• Use predefined text or enter custom text• Can be formatted
The O’Leary Series
© 2002 The McGraw-Hill Companies, Inc. All rights reserved.
32
McGraw-Hill/Irwin
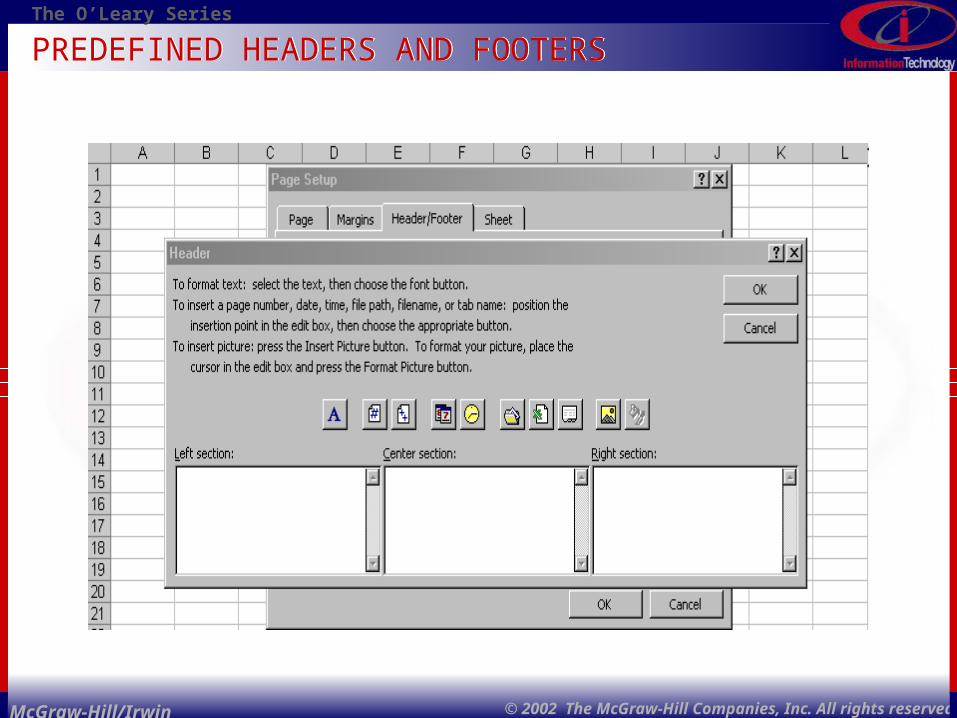
PREDEFINED HEADERS AND FOOTERSPREDEFINED HEADERS AND FOOTERS
The O’Leary Series
© 2002 The McGraw-Hill Companies, Inc. All rights reserved.
33
McGraw-Hill/Irwin
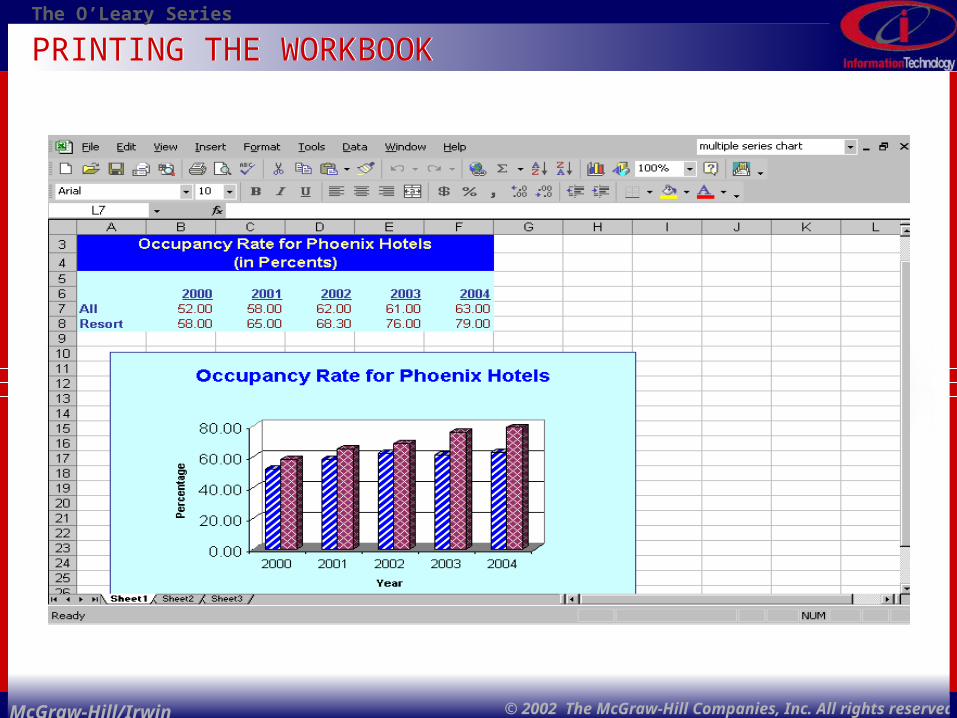
PRINTING THE WORKBOOKPRINTING THE WORKBOOK
The O’Leary Series
© 2002 The McGraw-Hill Companies, Inc. All rights reserved.
34
McGraw-Hill/Irwin
• Category-axis title - A label that describes the X axis.
• Category name - Labels displayed along the X axis in a chart to identify the data being plotted
• Chart - A visual representation of data in a worksheet.
• Chart gridlines - Lines extending from the axis lines across the plot area that make it easier to read and evaluate the chart data
Key TermsKey Terms
The O’Leary Series
© 2002 The McGraw-Hill Companies, Inc. All rights reserved.
35
McGraw-Hill/Irwin
Key TermsKey Terms
• Chart object - One type of graphic object that is created using charting features included in Excel 2002.
• Chart title - Appears at the top of a chart and is used to describe the contents of the chart.
• Column chart - A chart that displays data as vertical columns.
• Combination chart - A chart type that includes mixed data markers, such as both columns and lines.
• Data label - Labels for data points or bars that show the values being plotted on a chart.
The O’Leary Series
© 2002 The McGraw-Hill Companies, Inc. All rights reserved.
36
McGraw-Hill/Irwin
Key TermsKey Terms
• Data marker - Represents a data series on a chart. It can be a symbol, color, or pattern, depending upon the type of chart.
• Data series - The numbers to be charted. • Embedded chart - A chart that is inserted into
another file. • Explode - To separate a wedge of a pie chart
slightly from the other wedges in the pie. • Footer - A line (or several lines) of text that
appears at the bottom of each page just above the bottom margin.
The O’Leary Series
© 2002 The McGraw-Hill Companies, Inc. All rights reserved.
37
McGraw-Hill/Irwin
Key TermsKey Terms
• Explode - To separate a wedge of a pie chart slightly from the other wedges in the pie.
• Footer - A line (or several lines) of text that appears at the bottom of each page just above the bottom margin.
• Group - An object that contains other objects. • Header - A line of text that appears at the top of
each page just below the top margin. • Legend - A brief description of the symbols used
in a chart that represent the data ranges.
The O’Leary Series
© 2002 The McGraw-Hill Companies, Inc. All rights reserved.
38
McGraw-Hill/Irwin
Key TermsKey Terms
• Margins - The blank space around the edge of the paper.
• Plot area - The area of the chart bounded by the axes.
• Series formula - A formula that links a chart object to the source worksheet.
• Stack - The order in which objects are added in layers to the worksheet.
• Text box - A rectangular object in which you type text.
• Value axis - Y axis of a chart that usually contains numerical values.
The O’Leary Series
© 2002 The McGraw-Hill Companies, Inc. All rights reserved.
39
McGraw-Hill/Irwin
• Value-axis title - A label that describes the values on the Y axis.
• Word wrap - Feature that automatically determines when to begin the next line of text.
• X axis - The bottom boundary line of a chart • Y axis - The left boundary line of a chart• Z axis - The left boundary line of a 3-D chart
Key TermsKey Terms
The O’Leary Series
© 2002 The McGraw-Hill Companies, Inc. All rights reserved.
40
McGraw-Hill/Irwin
Discussion QuestionsDiscussion Questions
1. Define each of the following terms and discuss how they are related to one another: chart type, chart element, and chart object.
2. Discuss how column and bar charts represent data. How do they differ from pie charts?
3. What type of information would best be represented by a line chart?
4. Describe how a 3-D column chart differs from a 2-D column chart.
The O’Leary Series
© 2002 The McGraw-Hill Companies, Inc. All rights reserved.
41
McGraw-Hill/Irwin
Frequently Asked QuestionsFrequently Asked Questions
• When would I use an Excel chart?• Can I select my entire worksheet and make it a
chart?• Is there an easy way to create an Excel chart?• What is an embedded chart?• How do I know the right chart to select?
The O’Leary Series
© 2002 The McGraw-Hill Companies, Inc. All rights reserved.
42
McGraw-Hill/Irwin
Frequently Asked QuestionsFrequently Asked Questions
• I don't like the colors used in my chart when I use the chart wizard. How do I change them?
• How can I get the word "CONFIDENTIAL" to appear at the bottom of every worksheet?
• When I print my worksheet, it does not fit on a single page. Any suggestions?
The O’Leary Series
© 2002 The McGraw-Hill Companies, Inc. All rights reserved.
43
McGraw-Hill/Irwin
Frequently Asked QuestionsFrequently Asked Questions
• How can I enhance the appearance of my worksheet and chart?
• How do I know what my worksheet will look like before I print it?
The O’Leary Series
© 2002 The McGraw-Hill Companies, Inc. All rights reserved.
44
McGraw-Hill/Irwin
Web LinksWeb Links
• Using Formulas Tutorial– http://lacher.com/toc/tutusing.htm
• Excel Tutorials – Creating Charts– http://www.studyfinance.com/lessons/excel/less
on05.html• Creating Formulas
– http://members.tripod.com/summersm/formulas.html
The O’Leary Series
© 2002 The McGraw-Hill Companies, Inc. All rights reserved.
45
McGraw-Hill/Irwin
Web LinksWeb Links
• Charting with Excel 2000– http://www.winplanet.com/winplanet
/tutorials/1182/1/• Excel Pie Charts
– http://www.zdnet.com/zdhelp/stories/main/0,5594,2448914-5,00.html
• Microsoft Excel Charts– http://www.utexas.edu/cc/training/handouts/
excelchart/
The O’Leary Series
© 2002 The McGraw-Hill Companies, Inc. All rights reserved.
46
McGraw-Hill/Irwin
Web LinksWeb Links
• Plotting Excel Charts– http://www.zdnet.com/zdhelp/stories/main/0,55
94,2448914,00.html• EXCEL Charts: Column, Bar, Pie and Line
– http://www.econ.ucdavis.edu/faculty/cameron/excel/excharts.html
Related Documents