MATLAB ® Creating Graphical User Interfaces R2014b

Welcome message from author
This document is posted to help you gain knowledge. Please leave a comment to let me know what you think about it! Share it to your friends and learn new things together.
Transcript

MATLAB®
Creating Graphical User Interfaces
R2014b

How to Contact MathWorks
Latest news: www.mathworks.com
Sales and services: www.mathworks.com/sales_and_services
User community: www.mathworks.com/matlabcentral
Technical support: www.mathworks.com/support/contact_us
Phone: 508-647-7000
The MathWorks, Inc.3 Apple Hill DriveNatick, MA 01760-2098
MATLAB® Creating Graphical User Interfaces© COPYRIGHT 2000–2014 by The MathWorks, Inc.The software described in this document is furnished under a license agreement. The software may be usedor copied only under the terms of the license agreement. No part of this manual may be photocopied orreproduced in any form without prior written consent from The MathWorks, Inc.FEDERAL ACQUISITION: This provision applies to all acquisitions of the Program and Documentationby, for, or through the federal government of the United States. By accepting delivery of the Programor Documentation, the government hereby agrees that this software or documentation qualifies ascommercial computer software or commercial computer software documentation as such terms are usedor defined in FAR 12.212, DFARS Part 227.72, and DFARS 252.227-7014. Accordingly, the terms andconditions of this Agreement and only those rights specified in this Agreement, shall pertain to andgovern the use, modification, reproduction, release, performance, display, and disclosure of the Programand Documentation by the federal government (or other entity acquiring for or through the federalgovernment) and shall supersede any conflicting contractual terms or conditions. If this License failsto meet the government's needs or is inconsistent in any respect with federal procurement law, thegovernment agrees to return the Program and Documentation, unused, to The MathWorks, Inc.
Trademarks
MATLAB and Simulink are registered trademarks of The MathWorks, Inc. Seewww.mathworks.com/trademarks for a list of additional trademarks. Other product or brandnames may be trademarks or registered trademarks of their respective holders.Patents
MathWorks products are protected by one or more U.S. patents. Please seewww.mathworks.com/patents for more information.

Revision History
November 2000 Online Only New for MATLAB 6.0 (Release 12)June 2001 Online Only Revised for MATLAB 6.1 (Release 12.1)July 2002 Online Only Revised for MATLAB 6.6 (Release 13)June 2004 Online Only Revised for MATLAB 7.0 (Release 14)October 2004 Online Only Revised for MATLAB 7.0.1 (Release 14SP1)March 2005 Online Only Revised for MATLAB 7.0.4 (Release 14SP2)September 2005 Online Only Revised for MATLAB 7.1 (Release 14SP3)March 2006 Online Only Revised for MATLAB 7.2 (Release 2006a)May 2006 Online Only Revised for MATLAB 7.2September 2006 Online Only Revised for MATLAB 7.3 (Release 2006b)March 2007 Online Only Revised for MATLAB 7.4 (Release 2007a)September 2007 Online Only Revised for MATLAB 7.5 (Release 2007b)March 2008 Online Only Revised for MATLAB 7.6 (Release 2008a)October 2008 Online Only Revised for MATLAB 7.7 (Release 2008b)March 2009 Online Only Revised for MATLAB 7.8 (Release 2009a)September 2009 Online Only Revised for MATLAB 7.9 (Release 2009b)March 2010 Online Only Revised for MATLAB 7.10 (Release 2010a)September 2010 Online Only Revised for MATLAB 7.11 (Release 2010b)April 2011 Online Only Revised for MATLAB 7.12 (Release 2011a)September 2011 Online Only Revised for MATLAB 7.13 (Release 2011b)March 2012 Online Only Revised for MATLAB 7.14 (Release 2012a)September 2012 Online Only Revised for MATLAB 8.0 (Release 2012b)March 2013 Online Only Revised for MATLAB 8.1 (Release 2013a)September 2013 Online Only Revised for MATLAB 8.2 (Release 2013b)March 2014 Online Only Revised for MATLAB 8.3 (Release 2014a)October 2014 Online Only Revised for MATLAB 8.4 (Release 2014b)


v
Contents
Introduction to Creating GUIs
About GUIs in MATLAB Software1
What Is a GUI? . . . . . . . . . . . . . . . . . . . . . . . . . . . . . . . . . . 1-2
How Does a GUI Work? . . . . . . . . . . . . . . . . . . . . . . . . . . 1-4
Ways to Build MATLAB GUIs . . . . . . . . . . . . . . . . . . . . . . 1-5
How to Create a GUI with GUIDE2
Create a Simple GUIDE GUI . . . . . . . . . . . . . . . . . . . . . . 2-2Open a New GUI in the GUIDE Layout Editor . . . . . . . 2-2Set the GUI Figure Size in GUIDE . . . . . . . . . . . . . . . . 2-5Layout the Simple GUIDE GUI . . . . . . . . . . . . . . . . . . 2-6Code the Simple GUIDE GUI Behavior . . . . . . . . . . . . 2-16Open and Run the Simple GUIDE GUI . . . . . . . . . . . . 2-22
Files Generated by GUIDE . . . . . . . . . . . . . . . . . . . . . . . 2-24Code Files and FIG-Files . . . . . . . . . . . . . . . . . . . . . . . 2-24GUI Code File Structure . . . . . . . . . . . . . . . . . . . . . . . 2-25Adding Callback Templates to an Existing GUI Code
File . . . . . . . . . . . . . . . . . . . . . . . . . . . . . . . . . . . . . 2-25About GUIDE-Generated Callbacks . . . . . . . . . . . . . . 2-26

vi Contents
A Simple Programmatic GUI3
Create a Simple Programmatic GUI . . . . . . . . . . . . . . . . 3-2Create a Code File for the Simple Programmatic GUI . . 3-3Create a Figure for the Simple Programmatic GUI . . . . 3-3Add Components to the Simple Programmatic GUI . . . . 3-4Code the Simple Programmatic GUI Behavior . . . . . . . . 3-6Verify Code and Run the Simple Programmatic GUI . . . 3-9
Create GUIs with GUIDE
What Is GUIDE?4
GUIDE: Getting Started . . . . . . . . . . . . . . . . . . . . . . . . . . 4-2GUI Layout . . . . . . . . . . . . . . . . . . . . . . . . . . . . . . . . . . 4-2GUI Programming . . . . . . . . . . . . . . . . . . . . . . . . . . . . . 4-2
GUIDE Tools Summary . . . . . . . . . . . . . . . . . . . . . . . . . . . 4-3
GUIDE Preferences and Options5
GUIDE Preferences . . . . . . . . . . . . . . . . . . . . . . . . . . . . . . 5-2Set Preferences . . . . . . . . . . . . . . . . . . . . . . . . . . . . . . . 5-2Confirmation Preferences . . . . . . . . . . . . . . . . . . . . . . . 5-2Backward Compatibility Preference . . . . . . . . . . . . . . . 5-4All Other Preferences . . . . . . . . . . . . . . . . . . . . . . . . . . 5-4
GUIDE Options . . . . . . . . . . . . . . . . . . . . . . . . . . . . . . . . . 5-8The GUI Options Dialog Box . . . . . . . . . . . . . . . . . . . . . 5-8Resize Behavior . . . . . . . . . . . . . . . . . . . . . . . . . . . . . . . 5-9Command-Line Accessibility . . . . . . . . . . . . . . . . . . . . . 5-9
vii
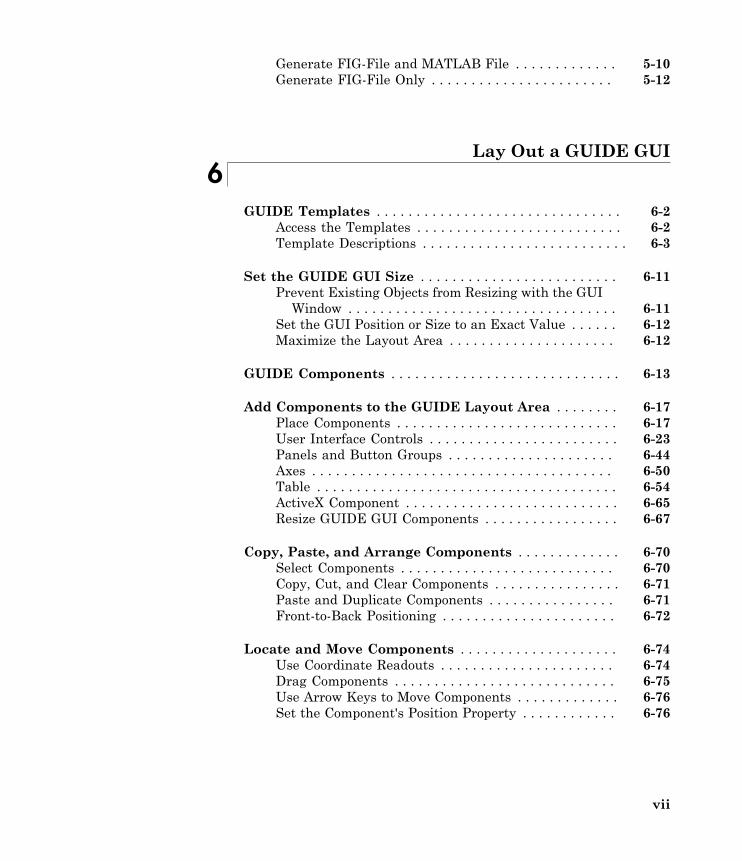
Generate FIG-File and MATLAB File . . . . . . . . . . . . . 5-10Generate FIG-File Only . . . . . . . . . . . . . . . . . . . . . . . 5-12
Lay Out a GUIDE GUI6
GUIDE Templates . . . . . . . . . . . . . . . . . . . . . . . . . . . . . . . 6-2Access the Templates . . . . . . . . . . . . . . . . . . . . . . . . . . 6-2Template Descriptions . . . . . . . . . . . . . . . . . . . . . . . . . . 6-3
Set the GUIDE GUI Size . . . . . . . . . . . . . . . . . . . . . . . . . 6-11Prevent Existing Objects from Resizing with the GUI
Window . . . . . . . . . . . . . . . . . . . . . . . . . . . . . . . . . . 6-11Set the GUI Position or Size to an Exact Value . . . . . . 6-12Maximize the Layout Area . . . . . . . . . . . . . . . . . . . . . 6-12
GUIDE Components . . . . . . . . . . . . . . . . . . . . . . . . . . . . . 6-13
Add Components to the GUIDE Layout Area . . . . . . . . 6-17Place Components . . . . . . . . . . . . . . . . . . . . . . . . . . . . 6-17User Interface Controls . . . . . . . . . . . . . . . . . . . . . . . . 6-23Panels and Button Groups . . . . . . . . . . . . . . . . . . . . . 6-44Axes . . . . . . . . . . . . . . . . . . . . . . . . . . . . . . . . . . . . . . 6-50Table . . . . . . . . . . . . . . . . . . . . . . . . . . . . . . . . . . . . . . 6-54ActiveX Component . . . . . . . . . . . . . . . . . . . . . . . . . . . 6-65Resize GUIDE GUI Components . . . . . . . . . . . . . . . . . 6-67
Copy, Paste, and Arrange Components . . . . . . . . . . . . . 6-70Select Components . . . . . . . . . . . . . . . . . . . . . . . . . . . 6-70Copy, Cut, and Clear Components . . . . . . . . . . . . . . . . 6-71Paste and Duplicate Components . . . . . . . . . . . . . . . . 6-71Front-to-Back Positioning . . . . . . . . . . . . . . . . . . . . . . 6-72
Locate and Move Components . . . . . . . . . . . . . . . . . . . . 6-74Use Coordinate Readouts . . . . . . . . . . . . . . . . . . . . . . 6-74Drag Components . . . . . . . . . . . . . . . . . . . . . . . . . . . . 6-75Use Arrow Keys to Move Components . . . . . . . . . . . . . 6-76Set the Component's Position Property . . . . . . . . . . . . 6-76
viii Contents
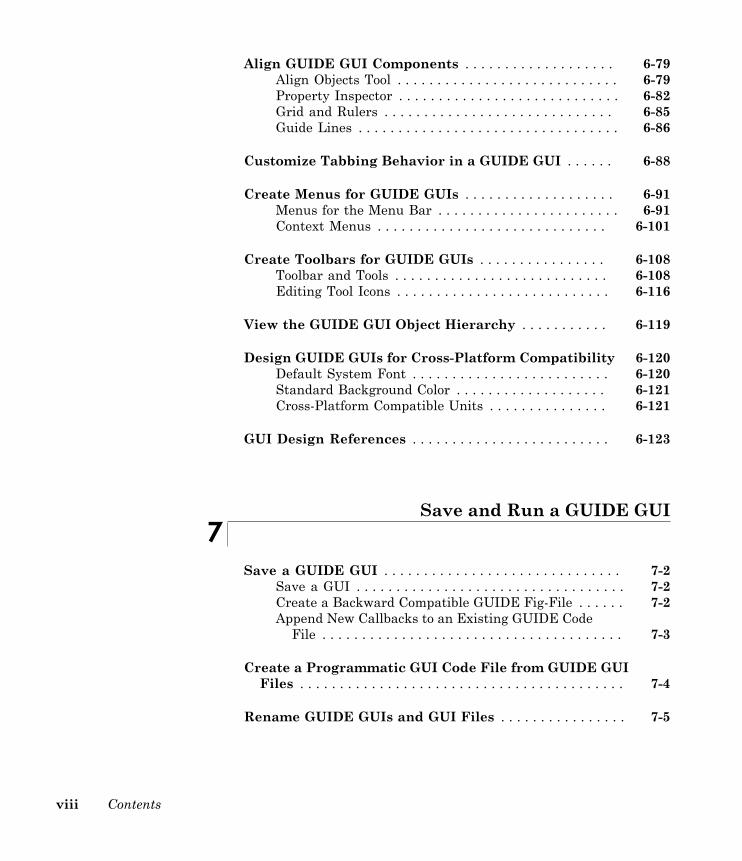
Align GUIDE GUI Components . . . . . . . . . . . . . . . . . . . 6-79Align Objects Tool . . . . . . . . . . . . . . . . . . . . . . . . . . . . 6-79Property Inspector . . . . . . . . . . . . . . . . . . . . . . . . . . . . 6-82Grid and Rulers . . . . . . . . . . . . . . . . . . . . . . . . . . . . . 6-85Guide Lines . . . . . . . . . . . . . . . . . . . . . . . . . . . . . . . . . 6-86
Customize Tabbing Behavior in a GUIDE GUI . . . . . . 6-88
Create Menus for GUIDE GUIs . . . . . . . . . . . . . . . . . . . 6-91Menus for the Menu Bar . . . . . . . . . . . . . . . . . . . . . . . 6-91Context Menus . . . . . . . . . . . . . . . . . . . . . . . . . . . . . 6-101
Create Toolbars for GUIDE GUIs . . . . . . . . . . . . . . . . 6-108Toolbar and Tools . . . . . . . . . . . . . . . . . . . . . . . . . . . 6-108Editing Tool Icons . . . . . . . . . . . . . . . . . . . . . . . . . . . 6-116
View the GUIDE GUI Object Hierarchy . . . . . . . . . . . 6-119
Design GUIDE GUIs for Cross-Platform Compatibility 6-120Default System Font . . . . . . . . . . . . . . . . . . . . . . . . . 6-120Standard Background Color . . . . . . . . . . . . . . . . . . . 6-121Cross-Platform Compatible Units . . . . . . . . . . . . . . . 6-121
GUI Design References . . . . . . . . . . . . . . . . . . . . . . . . . 6-123
Save and Run a GUIDE GUI7
Save a GUIDE GUI . . . . . . . . . . . . . . . . . . . . . . . . . . . . . . 7-2Save a GUI . . . . . . . . . . . . . . . . . . . . . . . . . . . . . . . . . . 7-2Create a Backward Compatible GUIDE Fig-File . . . . . . 7-2Append New Callbacks to an Existing GUIDE Code
File . . . . . . . . . . . . . . . . . . . . . . . . . . . . . . . . . . . . . . 7-3
Create a Programmatic GUI Code File from GUIDE GUIFiles . . . . . . . . . . . . . . . . . . . . . . . . . . . . . . . . . . . . . . . . . 7-4
Rename GUIDE GUIs and GUI Files . . . . . . . . . . . . . . . . 7-5

ix
Programming a GUIDE GUI8
Write Callbacks Using the GUIDE Workflow . . . . . . . . . 8-2Callbacks for Different User Actions . . . . . . . . . . . . . . . 8-2GUIDE-Generated Callback Functions and Property
Values . . . . . . . . . . . . . . . . . . . . . . . . . . . . . . . . . . . . 8-4GUIDE Callback Syntax . . . . . . . . . . . . . . . . . . . . . . . . 8-5Renaming and Removing GUIDE-Generated Callbacks . 8-5
Initialize a GUIDE GUI . . . . . . . . . . . . . . . . . . . . . . . . . . . 8-7Opening Function . . . . . . . . . . . . . . . . . . . . . . . . . . . . . 8-7Output Function . . . . . . . . . . . . . . . . . . . . . . . . . . . . . 8-10
Callbacks for Specific Components . . . . . . . . . . . . . . . . 8-12How to Use the Example Code . . . . . . . . . . . . . . . . . . 8-12Push Button . . . . . . . . . . . . . . . . . . . . . . . . . . . . . . . . 8-13Toggle Button . . . . . . . . . . . . . . . . . . . . . . . . . . . . . . . 8-13Radio Button . . . . . . . . . . . . . . . . . . . . . . . . . . . . . . . . 8-14Check Box . . . . . . . . . . . . . . . . . . . . . . . . . . . . . . . . . . 8-14Edit Text . . . . . . . . . . . . . . . . . . . . . . . . . . . . . . . . . . . 8-15Slider . . . . . . . . . . . . . . . . . . . . . . . . . . . . . . . . . . . . . . 8-16List Box . . . . . . . . . . . . . . . . . . . . . . . . . . . . . . . . . . . . 8-17Pop-Up Menu . . . . . . . . . . . . . . . . . . . . . . . . . . . . . . . 8-19Panel . . . . . . . . . . . . . . . . . . . . . . . . . . . . . . . . . . . . . . 8-21Button Group . . . . . . . . . . . . . . . . . . . . . . . . . . . . . . . 8-22Menu Item . . . . . . . . . . . . . . . . . . . . . . . . . . . . . . . . . 8-23Table . . . . . . . . . . . . . . . . . . . . . . . . . . . . . . . . . . . . . . 8-26Axes . . . . . . . . . . . . . . . . . . . . . . . . . . . . . . . . . . . . . . 8-27
Examples of GUIDE GUIs . . . . . . . . . . . . . . . . . . . . . . . . 8-30
Examples of GUIDE GUIs9
Modal Dialog Box in a GUIDE GUI . . . . . . . . . . . . . . . . . 9-2About the Example . . . . . . . . . . . . . . . . . . . . . . . . . . . . 9-2Set Up the Close Confirmation Dialog Box . . . . . . . . . . 9-2Set Up a GUI with a Close Button . . . . . . . . . . . . . . . . 9-3
x Contents
Run the Close Confirmation GUI . . . . . . . . . . . . . . . . . 9-4How the Close Confirmation GUIs Work . . . . . . . . . . . . 9-5
GUI For Managing Persistent Data . . . . . . . . . . . . . . . . . 9-7About the Example . . . . . . . . . . . . . . . . . . . . . . . . . . . . 9-7Calling Syntax . . . . . . . . . . . . . . . . . . . . . . . . . . . . . . . 9-8MAT-file Validation . . . . . . . . . . . . . . . . . . . . . . . . . . . . 9-9GUI Behavior . . . . . . . . . . . . . . . . . . . . . . . . . . . . . . . 9-10Overall GUI Characteristics . . . . . . . . . . . . . . . . . . . . 9-17
GUI That Accepts Parameters and Generates Plots . . 9-20About the Example . . . . . . . . . . . . . . . . . . . . . . . . . . . 9-20GUI Design . . . . . . . . . . . . . . . . . . . . . . . . . . . . . . . . . 9-22Validate GUI Input as Numbers . . . . . . . . . . . . . . . . . 9-24Plot Push Button Behavior . . . . . . . . . . . . . . . . . . . . . 9-27
Synchronized Data Presentations in a GUIDE GUI . . . 9-30About the Example . . . . . . . . . . . . . . . . . . . . . . . . . . . 9-30Recreate the GUI . . . . . . . . . . . . . . . . . . . . . . . . . . . . 9-32
Interactive List Box in a GUIDE GUI . . . . . . . . . . . . . . 9-46About the Example . . . . . . . . . . . . . . . . . . . . . . . . . . . 9-46Implement the List Box GUI . . . . . . . . . . . . . . . . . . . . 9-47
Plot Workspace Variables in a GUIDE GUI . . . . . . . . . 9-52About the Example . . . . . . . . . . . . . . . . . . . . . . . . . . . 9-52Read Workspace Variables . . . . . . . . . . . . . . . . . . . . . 9-53Read Selections from List Box . . . . . . . . . . . . . . . . . . . 9-54
GUI for Setting Simulink Model Parameters . . . . . . . . 9-57About the Example . . . . . . . . . . . . . . . . . . . . . . . . . . . 9-57How to Use the Simulink Parameters GUI . . . . . . . . . 9-58Run the GUI . . . . . . . . . . . . . . . . . . . . . . . . . . . . . . . . 9-59Program the Slider and Edit Text Components . . . . . . 9-60Run the Simulation from the GUI . . . . . . . . . . . . . . . . 9-62Remove Results from List Box . . . . . . . . . . . . . . . . . . 9-64Plot Results Data . . . . . . . . . . . . . . . . . . . . . . . . . . . . 9-64The GUI Help Button . . . . . . . . . . . . . . . . . . . . . . . . . 9-66Close the GUI . . . . . . . . . . . . . . . . . . . . . . . . . . . . . . . 9-66The List Box Callback and Create Function . . . . . . . . 9-67
Animation with Slider Controls in a GUIDE GUI . . . . 9-68About the Example . . . . . . . . . . . . . . . . . . . . . . . . . . . 9-68

xi
Design the 3-D Globe GUI . . . . . . . . . . . . . . . . . . . . . 9-69Graphics Techniques Used in the 3-D Globe GUI . . . . 9-74
Automatically Refresh Plot in a GUIDE GUI . . . . . . . . 9-79About the Example . . . . . . . . . . . . . . . . . . . . . . . . . . . 9-79How the GUI Implements the Timer . . . . . . . . . . . . . . 9-81
Create GUIs Programmatically
Lay Out a Programmatic GUI10
Structure of a Programmatic GUI File . . . . . . . . . . . . . 10-2File Organization . . . . . . . . . . . . . . . . . . . . . . . . . . . . 10-2File Template . . . . . . . . . . . . . . . . . . . . . . . . . . . . . . . 10-2Run the GUI . . . . . . . . . . . . . . . . . . . . . . . . . . . . . . . . 10-3
Create Figures for Programmatic GUIs . . . . . . . . . . . . 10-4
Programmatic Components . . . . . . . . . . . . . . . . . . . . . . 10-6
Add Components to a Programmatic GUI . . . . . . . . . . 10-9Add User Interface Controls to a Programmatic GUI . . 10-9Add Panels and Button Groups . . . . . . . . . . . . . . . . . 10-29Add Axes . . . . . . . . . . . . . . . . . . . . . . . . . . . . . . . . . . 10-35Add ActiveX Controls . . . . . . . . . . . . . . . . . . . . . . . . 10-38
Layout a GUI Programmatically . . . . . . . . . . . . . . . . . 10-40Component Placement and Sizing . . . . . . . . . . . . . . . 10-40Managing the Layout in Resizable GUIs . . . . . . . . . . 10-45Manage the Stacking Order of Grouped Components . 10-48
Adjust Programmatic GUI Layouts Interactively . . . 10-49Set Positions of Components Interactively . . . . . . . . . 10-50Align Components . . . . . . . . . . . . . . . . . . . . . . . . . . . 10-60Set Colors Interactively . . . . . . . . . . . . . . . . . . . . . . . 10-67Set Font Characteristics Interactively . . . . . . . . . . . . 10-68

xii Contents
Customize Tabbing Behavior in a Programmatic GUI 10-71How Tabbing Works . . . . . . . . . . . . . . . . . . . . . . . . . 10-71Default Tab Order . . . . . . . . . . . . . . . . . . . . . . . . . . . 10-71Change the Tab Order in the uipanel . . . . . . . . . . . . 10-73
Create Menus for Programmatic GUIs . . . . . . . . . . . . 10-75Add Menu Bar Menus . . . . . . . . . . . . . . . . . . . . . . . . 10-75Add Context Menus to a Programmatic GUI . . . . . . . 10-82
Create Toolbars for Programmatic GUIs . . . . . . . . . . 10-88Use the uitoolbar Function . . . . . . . . . . . . . . . . . . . . 10-88Commonly Used Properties . . . . . . . . . . . . . . . . . . . . 10-88Toolbars . . . . . . . . . . . . . . . . . . . . . . . . . . . . . . . . . . . 10-89Display and Modify the Standard Toolbar . . . . . . . . . 10-92
Fonts and Colors for Cross-Platform Compatibility . 10-94Default System Font . . . . . . . . . . . . . . . . . . . . . . . . . 10-94Standard Background Color . . . . . . . . . . . . . . . . . . . 10-95
Code a Programmatic GUI11
Initialize a Programmatic GUI . . . . . . . . . . . . . . . . . . . 11-2Examples . . . . . . . . . . . . . . . . . . . . . . . . . . . . . . . . . . . 11-2
Write Callbacks Using the Programmatic Workflow . . 11-5Callbacks for Different User Actions . . . . . . . . . . . . . . 11-5How to Specify Callback Property Values . . . . . . . . . . 11-7Callback Syntax . . . . . . . . . . . . . . . . . . . . . . . . . . . . . 11-9
Manage Application-Defined Data12
Share Data Among Callbacks . . . . . . . . . . . . . . . . . . . . . 12-2Overview of Data Sharing Techniques . . . . . . . . . . . . . 12-2Store Data in UserData or Other Object Properties . . . 12-3Store Data as Application Data . . . . . . . . . . . . . . . . . . 12-4

xiii
Create Nested Callback Functions (ProgrammaticGUIs) . . . . . . . . . . . . . . . . . . . . . . . . . . . . . . . . . . . . 12-5
Store Data Using the guidata Function . . . . . . . . . . . . 12-6Sharing Data Among Multiple GUIDE GUIs . . . . . . . . 12-9
Manage Callback Execution13
Interrupt Callback Execution . . . . . . . . . . . . . . . . . . . . 13-2Control Callback Execution and Interruption . . . . . . . 13-2Control Program Execution Using Timer Objects . . . . 13-10
Examples of GUIs Created Programmatically14
Axes, Menus, and Toolbars in Programmatic GUIs . . . 14-2About the Example . . . . . . . . . . . . . . . . . . . . . . . . . . . 14-2View the Example Code . . . . . . . . . . . . . . . . . . . . . . . 14-3Generate the Graphing Commands and Data . . . . . . . 14-3Create the GUI and Its Components . . . . . . . . . . . . . . 14-4Initialize the GUI . . . . . . . . . . . . . . . . . . . . . . . . . . . . 14-7Define the Callbacks . . . . . . . . . . . . . . . . . . . . . . . . . . 14-8Updating the Plot . . . . . . . . . . . . . . . . . . . . . . . . . . . 14-11
Synchronized Data Presentations in a ProgrammaticGUI . . . . . . . . . . . . . . . . . . . . . . . . . . . . . . . . . . . . . . . . 14-12
Techniques Illustrated in the Example . . . . . . . . . . . 14-12About the Example . . . . . . . . . . . . . . . . . . . . . . . . . . 14-12View the Example Code . . . . . . . . . . . . . . . . . . . . . . 14-14Set Up and Interact with the uitable . . . . . . . . . . . . . 14-14
Lists of Items in a Programmatic GUI . . . . . . . . . . . . 14-20About the Example . . . . . . . . . . . . . . . . . . . . . . . . . . 14-20View the Example Code . . . . . . . . . . . . . . . . . . . . . . 14-21Use the GUI . . . . . . . . . . . . . . . . . . . . . . . . . . . . . . . 14-22Program List Master . . . . . . . . . . . . . . . . . . . . . . . . . 14-25Add an “Import from File” Option to List Master . . . . 14-31

xiv Contents
Add a “Rename List” Option to List Master . . . . . . . . 14-31
GUI That Accepts and Returns Arguments . . . . . . . . 14-32About the Example . . . . . . . . . . . . . . . . . . . . . . . . . . 14-32Copy and View the Color Palette Code . . . . . . . . . . . 14-34Local Function Summary for Color Palette . . . . . . . . 14-34Code File Organization . . . . . . . . . . . . . . . . . . . . . . . 14-35GUI Programming Techniques . . . . . . . . . . . . . . . . . 14-36
Apps15
Find Apps . . . . . . . . . . . . . . . . . . . . . . . . . . . . . . . . . . . . . . . . . 15-2
View App File List . . . . . . . . . . . . . . . . . . . . . . . . . . . . . . . . . . 15-3Before Installing . . . . . . . . . . . . . . . . . . . . . . . . . . . . . . . . . 15-3After Installing . . . . . . . . . . . . . . . . . . . . . . . . . . . . . . . . . . 15-3
Run, Uninstall, Reinstall, and Install Apps . . . . . . . . . . . . . 15-5Run App . . . . . . . . . . . . . . . . . . . . . . . . . . . . . . . . . . . . . . . 15-5Install or Reinstall App . . . . . . . . . . . . . . . . . . . . . . . . . . . . 15-5Uninstall App . . . . . . . . . . . . . . . . . . . . . . . . . . . . . . . . . . . 15-6
Install Apps in a Shared Network Location . . . . . . . . . . . . . 15-7
Change Apps Installation Folder . . . . . . . . . . . . . . . . . . . . . . 15-8
Packaging GUIs as Apps16
Apps Overview . . . . . . . . . . . . . . . . . . . . . . . . . . . . . . . . . . . . . 16-2What Is an App? . . . . . . . . . . . . . . . . . . . . . . . . . . . . . . . . . 16-2Where to Get Apps . . . . . . . . . . . . . . . . . . . . . . . . . . . . . . . 16-2Why Create an App? . . . . . . . . . . . . . . . . . . . . . . . . . . . . . . 16-3Best Practices and Requirements for Creating an App . . . . . 16-4
Package Apps . . . . . . . . . . . . . . . . . . . . . . . . . . . . . . . . . . . . . . 16-5

xv
Modify Apps . . . . . . . . . . . . . . . . . . . . . . . . . . . . . . . . . . . . . . . 16-7
Share Apps . . . . . . . . . . . . . . . . . . . . . . . . . . . . . . . . . . . . . . . . 16-8
MATLAB App Installer File — mlappinstall . . . . . . . . . . . . . 16-9
Dependency Analysis . . . . . . . . . . . . . . . . . . . . . . . . . . . . . . . 16-10

xvi

Introduction to Creating GUIs


1
About GUIs in MATLAB Software
• “What Is a GUI?” on page 1-2• “How Does a GUI Work?” on page 1-4• “Ways to Build MATLAB GUIs” on page 1-5
1 About GUIs in MATLAB Software
1-2
What Is a GUI?
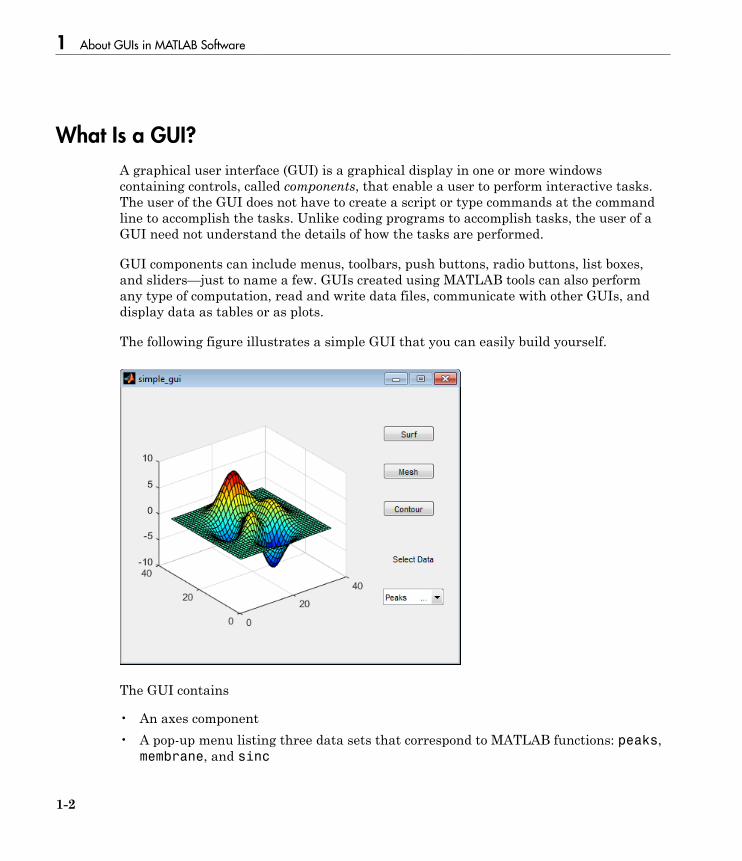
A graphical user interface (GUI) is a graphical display in one or more windowscontaining controls, called components, that enable a user to perform interactive tasks.The user of the GUI does not have to create a script or type commands at the commandline to accomplish the tasks. Unlike coding programs to accomplish tasks, the user of aGUI need not understand the details of how the tasks are performed.
GUI components can include menus, toolbars, push buttons, radio buttons, list boxes,and sliders—just to name a few. GUIs created using MATLAB tools can also performany type of computation, read and write data files, communicate with other GUIs, anddisplay data as tables or as plots.
The following figure illustrates a simple GUI that you can easily build yourself.
The GUI contains
• An axes component• A pop-up menu listing three data sets that correspond to MATLAB functions: peaks,
membrane, and sinc

What Is a GUI?
1-3
• A static text component to label the pop-up menu• Three buttons that provide different kinds of plots: surface, mesh, and contour
When you click a push button, the axes component displays the selected data set usingthe specified type of 3-D plot.

1 About GUIs in MATLAB Software
1-4
How Does a GUI Work?
Typically, GUIs wait for an end user to manipulate a control, and then respond to eachuser action in turn. Each control, and the GUI itself, has one or more callbacks, namedfor the fact that they “call back” to MATLAB to ask it to do things. A particular useraction, such as pressing a screen button, or passing the cursor over a component, triggersthe execution of each callback. The GUI then responds to these events. You, as the GUIcreator, write callbacks that define what the components do to handle events.
This kind of programming is often referred to as event-driven programming. In event-driven programming, callback execution is asynchronous, that is, events external to thesoftware trigger callback execution. In the case of MATLAB GUIs, most events are userinteractions with the GUI, but the GUI can respond to other kinds of events as well, forexample, the creation of a file or connecting a device to the computer.
You can code callbacks in two distinct ways:
• As MATLAB language functions stored in files• As strings containing MATLAB expressions or commands (such as 'c = sqrt(a*a
+ b*b);'or 'print')
Using functions stored in code files as callbacks is preferable to using strings, becausefunctions have access to arguments and are more powerful and flexible. You cannotuse MATLAB scripts (sequences of statements stored in code files that do not definefunctions) as callbacks.
Although you can provide a callback with certain data and make it do anything you want,you cannot control when callbacks execute. That is, when your GUI is being used, youhave no control over the sequence of events that trigger particular callbacks or whatother callbacks might still be running at those times. This distinguishes event-drivenprogramming from other types of control flow, for example, processing sequential datafiles.

Ways to Build MATLAB GUIs
1-5
Ways to Build MATLAB GUIs
A MATLAB GUI is a figure window to which you add user-operated components. You canselect, size, and position these components as you like. Using callbacks you can make thecomponents do what you want when the user clicks or manipulates the components withkeystrokes.
You can build MATLAB GUIs in two ways:
• Use GUIDE (GUI Development Environment), an interactive GUI construction kit.
This approach starts with a figure that you populate with components from within agraphic layout editor. GUIDE creates an associated code file containing callbacks forthe GUI and its components. GUIDE saves both the figure (as a FIG-file) and the codefile. Opening either one also opens the other to run the GUI.
• Create code files that generate GUIs as functions or scripts (programmatic GUIconstruction).
Using this approach, you create a code file that defines all component propertiesand behaviors. When a user executes the file, it creates a figure, populates it withcomponents, and handles user interactions. Typically, the figure is not saved betweensessions because the code in the file creates a new one each time it runs.
The code files of the two approaches look different. Programmatic GUI files are generallylonger, because they explicitly define every property of the figure and its controls, aswell as the callbacks. GUIDE GUIs define most of the properties within the figure itself.They store the definitions in its FIG-file rather than in its code file. The code file containscallbacks and other functions that initialize the GUI when it opens.
You can create a GUI with GUIDE and then modify it programmatically. However, youcannot create a GUI programmatically and then modify it with GUIDE.
The GUI-building technique you choose depends on your experience, your preferences,and the kind of application you need the GUI to operate. This table outlines somepossibilities.
Type of GUI Technique
Dialog box MATLAB software provides a selection ofstandard dialog boxes that you can createwith a single function call. For an example,
1 About GUIs in MATLAB Software
1-6
Type of GUI Technique
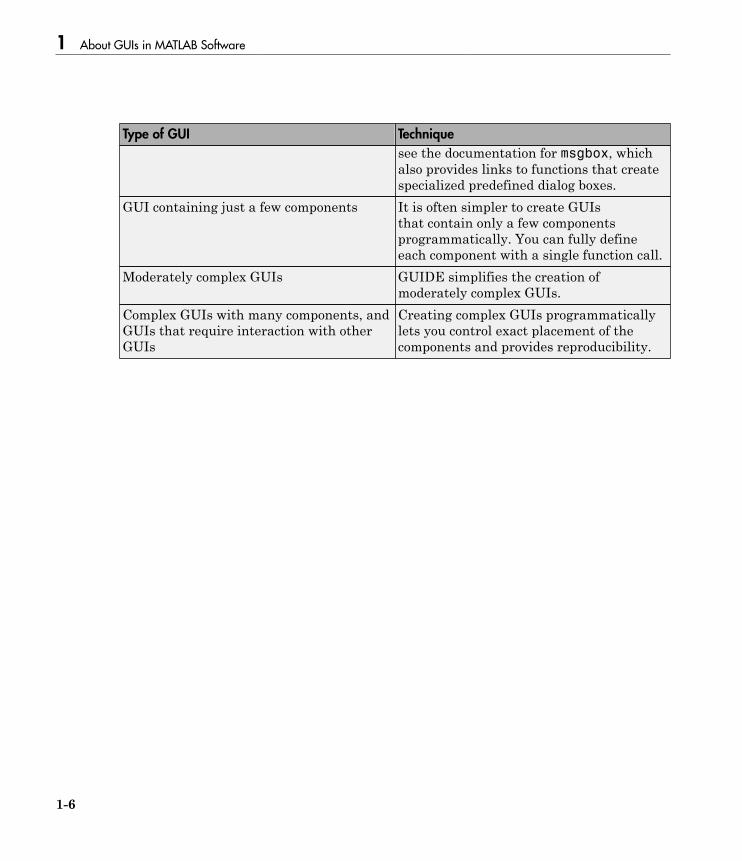
see the documentation for msgbox, whichalso provides links to functions that createspecialized predefined dialog boxes.
GUI containing just a few components It is often simpler to create GUIsthat contain only a few componentsprogrammatically. You can fully defineeach component with a single function call.
Moderately complex GUIs GUIDE simplifies the creation ofmoderately complex GUIs.
Complex GUIs with many components, andGUIs that require interaction with otherGUIs
Creating complex GUIs programmaticallylets you control exact placement of thecomponents and provides reproducibility.

2
How to Create a GUI with GUIDE
2 How to Create a GUI with GUIDE
2-2
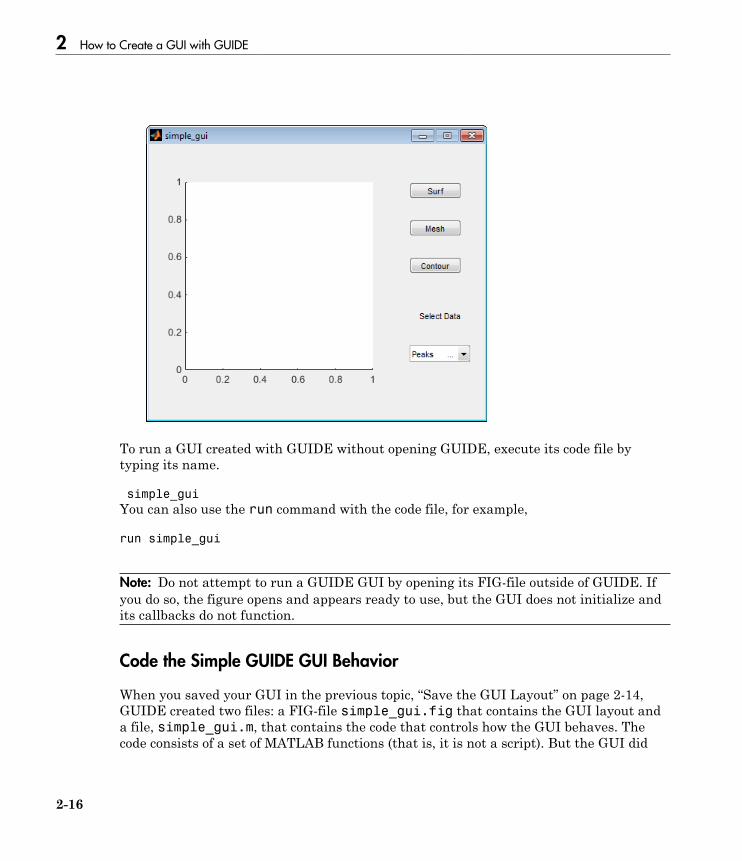
Create a Simple GUIDE GUI
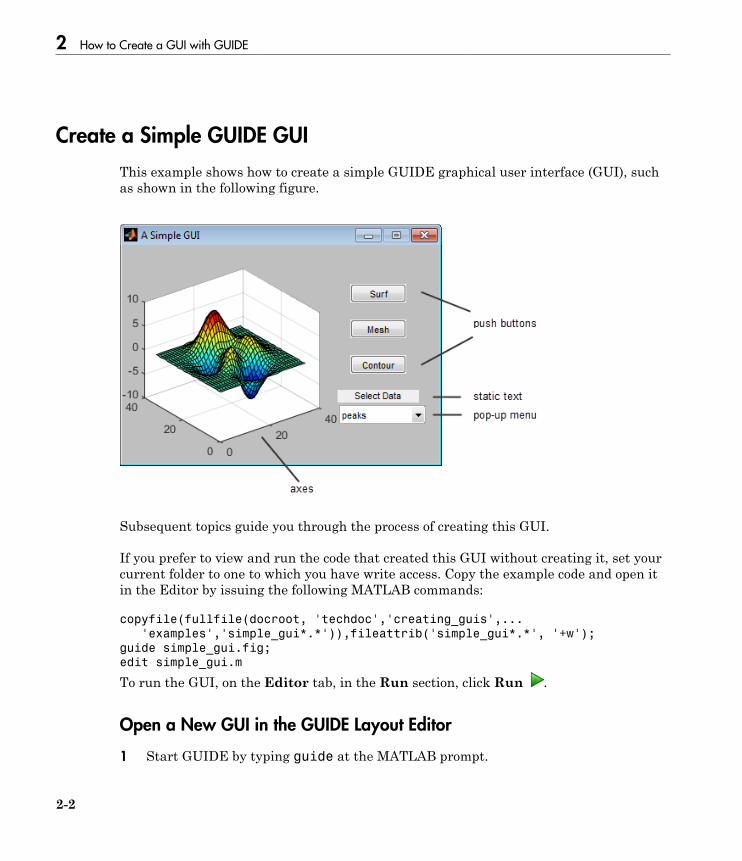
This example shows how to create a simple GUIDE graphical user interface (GUI), suchas shown in the following figure.
Subsequent topics guide you through the process of creating this GUI.
If you prefer to view and run the code that created this GUI without creating it, set yourcurrent folder to one to which you have write access. Copy the example code and open itin the Editor by issuing the following MATLAB commands:
copyfile(fullfile(docroot, 'techdoc','creating_guis',...
'examples','simple_gui*.*')),fileattrib('simple_gui*.*', '+w');
guide simple_gui.fig;
edit simple_gui.m
To run the GUI, on the Editor tab, in the Run section, click Run .
Open a New GUI in the GUIDE Layout Editor
1 Start GUIDE by typing guide at the MATLAB prompt.

Create a Simple GUIDE GUI
2-3
2 In the GUIDE Quick Start dialog box, select the Blank GUI (Default) template,and then click OK.

2 How to Create a GUI with GUIDE
2-4
3 Display the names of the GUI components in the component palette:
a Select File > Preferences > GUIDE.b Select Show names in component palette.c Click OK.

Create a Simple GUIDE GUI
2-5
Set the GUI Figure Size in GUIDE
Set the size of the GUI by resizing the grid area in the Layout Editor. Click the lower-right corner and drag it until the GUI is approximately 3 in. high and 4 in. wide. Ifnecessary, make the window larger.

2 How to Create a GUI with GUIDE
2-6
Layout the Simple GUIDE GUI
Add, align, and label the components in the GUI.
1 Add the three push buttons to the GUI. Select the push button tool from thecomponent palette at the left side of the Layout Editor and drag it into the layoutarea. Create three buttons, positioning them approximately as shown in thefollowing figure.
Create a Simple GUIDE GUI
2-7
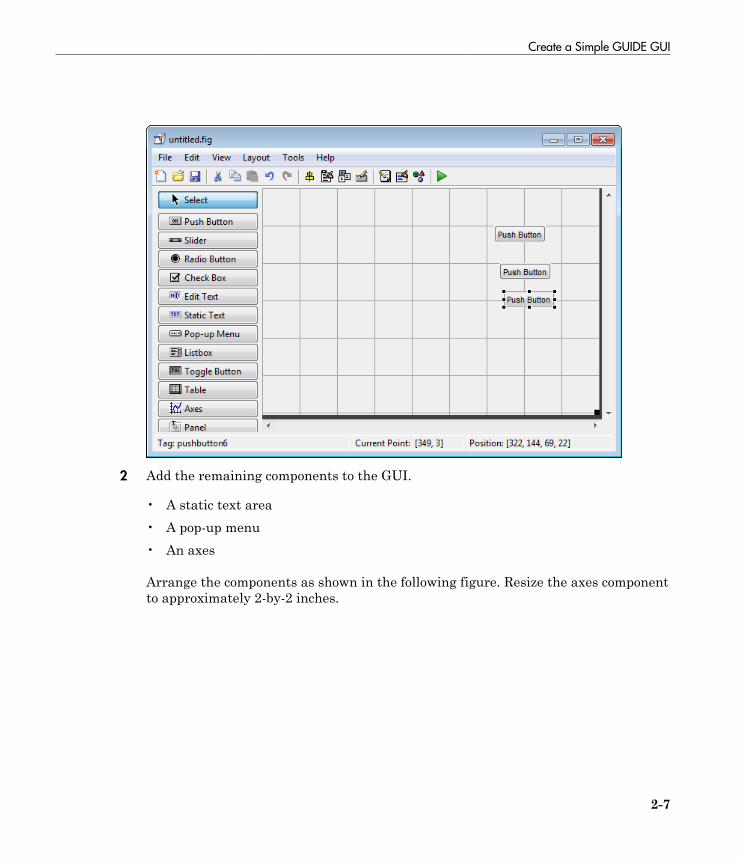
2 Add the remaining components to the GUI.
• A static text area• A pop-up menu• An axes
Arrange the components as shown in the following figure. Resize the axes componentto approximately 2-by-2 inches.
2 How to Create a GUI with GUIDE
2-8
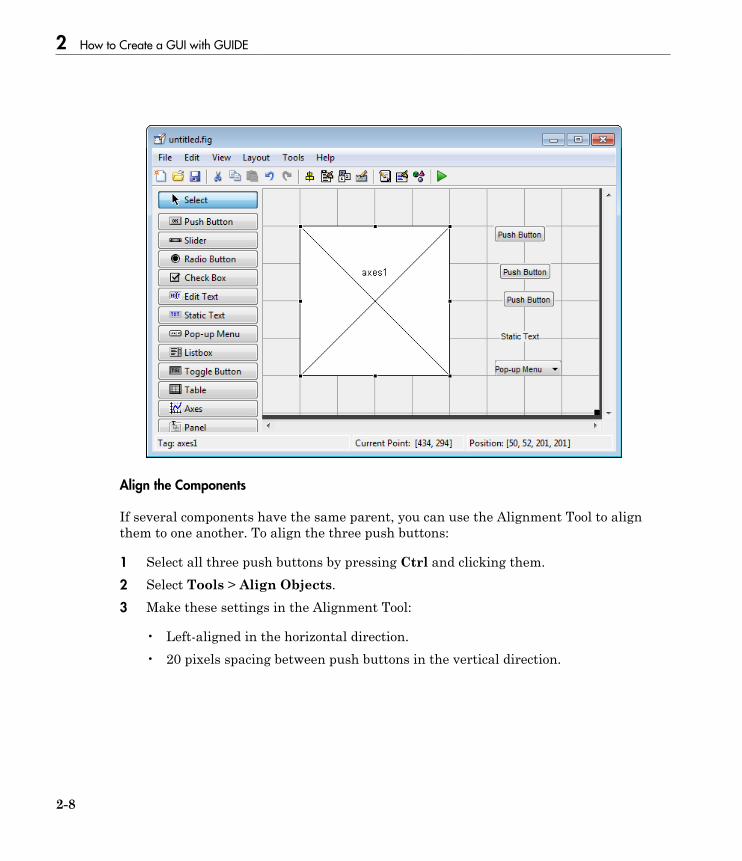
Align the Components
If several components have the same parent, you can use the Alignment Tool to alignthem to one another. To align the three push buttons:
1 Select all three push buttons by pressing Ctrl and clicking them.2 Select Tools > Align Objects.3 Make these settings in the Alignment Tool:
• Left-aligned in the horizontal direction.• 20 pixels spacing between push buttons in the vertical direction.

Create a Simple GUIDE GUI
2-9
4 Click OK.

2 How to Create a GUI with GUIDE
2-10
Label the Push Buttons
Each of the three push buttons specifies a plot type: surf, mesh, and contour. This topicshows you how to label the buttons with those options.
1 Select View > Property Inspector.

Create a Simple GUIDE GUI
2-11
2 In the layout area, click the top push button.
3 In the Property Inspector, select the String property, and then replace the existingvalue with the word Surf.
4 Click outside the String field. The push button label changes to Surf.

2 How to Create a GUI with GUIDE
2-12
5 Click each of the remaining push buttons in turn and repeat steps 3 and 4. Label themiddle push button Mesh, and the bottom button Contour.
List Pop-Up Menu Items
The pop-up menu provides a choice of three data sets: peaks, membrane, and sinc. Thesedata sets correspond to MATLAB functions of the same name. This topic shows you howto list those data sets as choices in the pop-menu.
1 In the layout area, click the pop-up menu.2 In the Property Inspector, click the button next to String. The String dialog box
displays.
Create a Simple GUIDE GUI
2-13
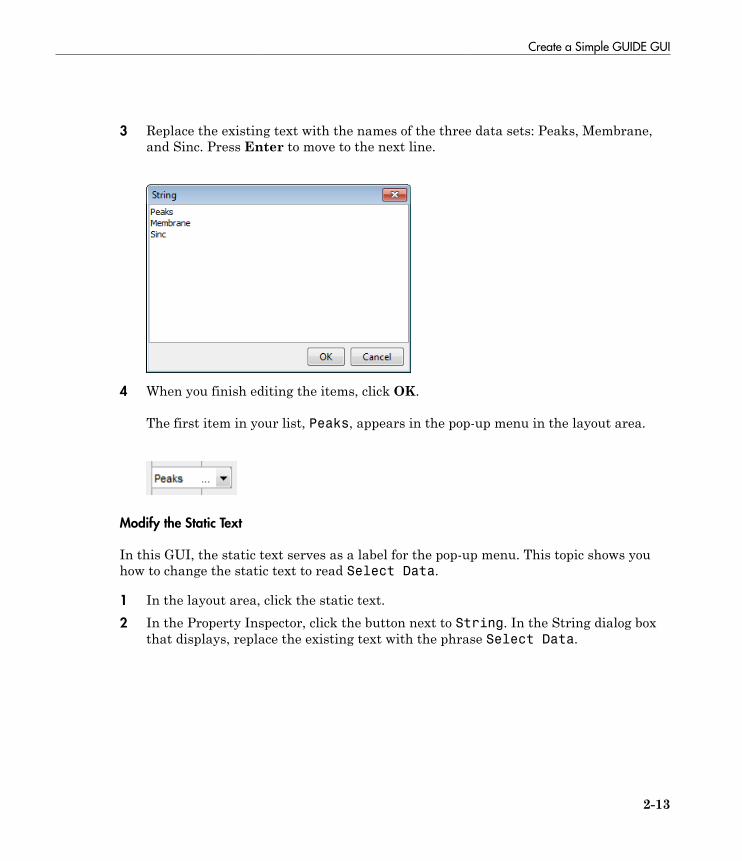
3 Replace the existing text with the names of the three data sets: Peaks, Membrane,and Sinc. Press Enter to move to the next line.
4 When you finish editing the items, click OK.
The first item in your list, Peaks, appears in the pop-up menu in the layout area.
Modify the Static Text
In this GUI, the static text serves as a label for the pop-up menu. This topic shows youhow to change the static text to read Select Data.
1 In the layout area, click the static text.2 In the Property Inspector, click the button next to String. In the String dialog box
that displays, replace the existing text with the phrase Select Data.

2 How to Create a GUI with GUIDE
2-14
3 Click OK.
The phrase Select Data appears in the static text component above the pop-upmenu.
Save the GUI Layout
When you save a GUI, GUIDE creates two files, a FIG-file and a code file. The FIG-file,with extension .fig, is a binary file that contains a description of the layout. The codefile, with extension .m, contains MATLAB functions that control the GUI behavior.
1 Save and activate your GUI by selecting Tools > Run.2 GUIDE displays a dialog box displaying: “Activating will save changes to your figure
file and MATLAB code. Do you wish to continue?
Create a Simple GUIDE GUI
2-15
Click Yes.3 GUIDE opens a Save As dialog box in your current folder and prompts you for a
FIG-file name.4 Browse to any folder for which you have write privileges, and then enter the file
name simple_gui for the FIG-file. GUIDE saves both the FIG-file and the code fileusing this name.
5 If the folder in which you save the GUI is not on the MATLAB path, GUIDE opensa dialog box, giving you the option of changing the current folder to the foldercontaining the GUI files, or adding that folder to the top or bottom of the MATLABpath.
6 GUIDE saves the files simple_gui.fig and simple_gui.m, and then activates theGUI. It also opens the GUI code file in your default editor.
The GUI opens in a new window. Notice that the GUI lacks the standard menu barand toolbar that MATLAB figure windows display. You can add your own menus andtoolbar buttons with GUIDE, but by default a GUIDE GUI includes none of thesecomponents.
When you run simple_gui, you can select a data set in the pop-up menu and clickthe push buttons, but nothing happens. This is because the code file contains nostatements to service the pop-up menu and the buttons.
2 How to Create a GUI with GUIDE
2-16
To run a GUI created with GUIDE without opening GUIDE, execute its code file bytyping its name.
simple_gui
You can also use the run command with the code file, for example,
run simple_gui
Note: Do not attempt to run a GUIDE GUI by opening its FIG-file outside of GUIDE. Ifyou do so, the figure opens and appears ready to use, but the GUI does not initialize andits callbacks do not function.
Code the Simple GUIDE GUI Behavior
When you saved your GUI in the previous topic, “Save the GUI Layout” on page 2-14,GUIDE created two files: a FIG-file simple_gui.fig that contains the GUI layout anda file, simple_gui.m, that contains the code that controls how the GUI behaves. Thecode consists of a set of MATLAB functions (that is, it is not a script). But the GUI did
Create a Simple GUIDE GUI
2-17
not respond because the functions contain no statements that perform actions yet. Thistopic shows you how to add code to the file to make the GUI do things.
Generate Data to Plot
This topic shows you how to generate the data to be plotted when the GUI user clicksa button. The opening function generates this data by calling MATLAB functions. Theopening function, which initializes a GUI when it opens, is the first callback in everyGUIDE-generated GUI code file.
In this example, you add code that creates three data sets to the opening function. Thecode uses the MATLAB functions peaks, membrane, and sinc.
1 Display the opening function in the MATLAB Editor.
If the file simple_gui.m is not already open in the editor, open from the LayoutEditor by selecting View > Editor.
2 On the EDITOR tab, in the NAVIGATE section, click Go To, and then selectsimple_gui_OpeningFcn.
The cursor moves to the opening function, which contains this code:% --- Executes just before simple_gui is made visible.
function simple_gui_OpeningFcn(hObject, eventdata, handles, varargin)
% This function has no output args, see OutputFcn.
% hObject handle to figure
% eventdata reserved - to be defined in a future version of MATLAB
% handles structure with handles and user data (see GUIDATA)
% varargin command line arguments to simple_gui (see VARARGIN)
% Choose default command line output for simple_gui
handles.output = hObject;
% Update handles structure
guidata(hObject, handles);
% UIWAIT makes simple_gui wait for user response (see UIRESUME)
% uiwait(handles.figure1);
3 Create data for the GUI to plot by adding the following code to the opening functionimmediately after the comment that begins % varargin...
% Create the data to plot.
handles.peaks=peaks(35);
handles.membrane=membrane;
[x,y] = meshgrid(-8:.5:8);
r = sqrt(x.^2+y.^2) + eps;
sinc = sin(r)./r;

2 How to Create a GUI with GUIDE
2-18
handles.sinc = sinc;
% Set the current data value.
handles.current_data = handles.peaks;
surf(handles.current_data)
The first six executable lines create the data using the MATLAB functions peaks,membrane, and sinc. They store the data in the handles structure, an argumentprovided to all callbacks. Callbacks for the push buttons can retrieve the data fromthe handles structure.
The last two lines create a current data value and set it to peaks, and then displaythe surf plot for peaks. The following figure shows how the GUI now looks when itfirst displays.
Code Pop-Up Menu Behavior
The pop-up menu presents options for plotting the data. When the GUI user selectsone of the three plots, MATLAB software sets the pop-up menu Value property tothe index of the selected string. The pop-up menu callback reads the pop-up menuValue property to determine the item that the menu currently displays , and setshandles.current_data accordingly.

Create a Simple GUIDE GUI
2-19
1 Display the pop-up menu callback in the MATLAB Editor. In the GUIDE LayoutEditor, right-click the pop-up menu component, and then select View Callbacks >Callback.
GUIDE displays the GUI code file in the Editor, and moves the cursor to the pop-menu callback, which contains this code:
% --- Executes on selection change in popupmenu1.
function popupmenu1_Callback(hObject, eventdata, handles)
% hObject handle to popupmenu1 (see GCBO)
% eventdata reserved - to be defined in a future version of MATLAB
% handles structure with handles and user data (see GUIDATA)
2 Add the following code to the popupmenu1_Callback after the comment that begins% handles...

2 How to Create a GUI with GUIDE
2-20
This code first retrieves two pop-up menu properties:
• String — a cell array that contains the menu contents• Value — the index into the menu contents of the selected data set
The code then uses a switch statement to make the selected data set the currentdata. The last statement saves the changes to the handles structure.
% Determine the selected data set.
str = get(hObject, 'String');
val = get(hObject,'Value');
% Set current data to the selected data set.
switch str{val};
case 'Peaks' % User selects peaks.
handles.current_data = handles.peaks;
case 'Membrane' % User selects membrane.
handles.current_data = handles.membrane;
case 'Sinc' % User selects sinc.
handles.current_data = handles.sinc;
end
% Save the handles structure.
guidata(hObject,handles)
Code Push Button Behavior
Each of the push buttons creates a different type of plot using the data specified bythe current selection in the pop-up menu. The push button callbacks get data from thehandles structure and then plot it.
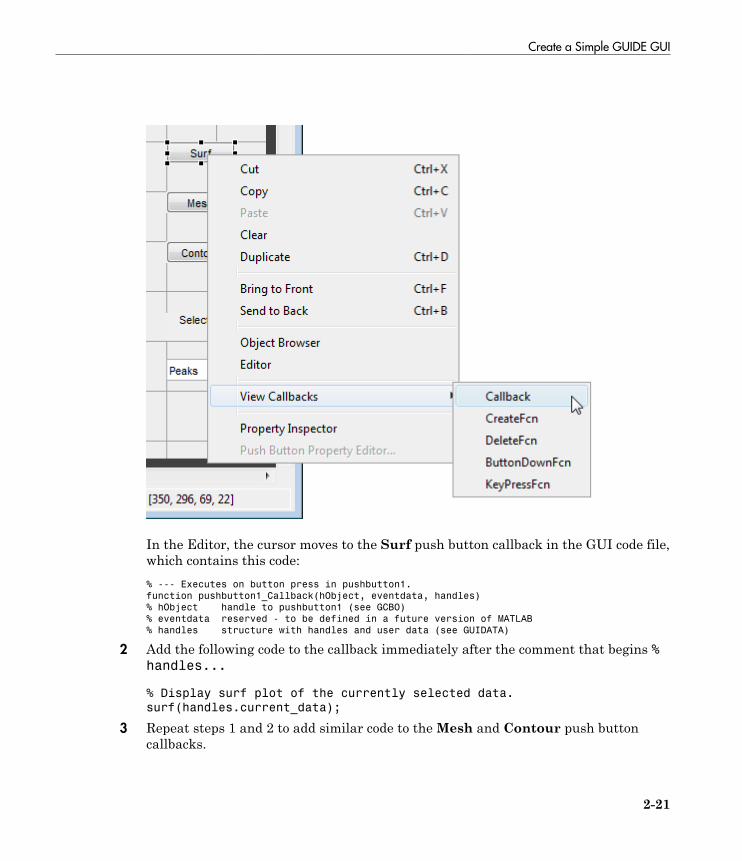
1 Display the Surf push button callback in the MATLAB Editor. In the Layout Editor,right-click the Surf push button, and then select View Callbacks > Callback.
Create a Simple GUIDE GUI
2-21
In the Editor, the cursor moves to the Surf push button callback in the GUI code file,which contains this code:% --- Executes on button press in pushbutton1.
function pushbutton1_Callback(hObject, eventdata, handles)
% hObject handle to pushbutton1 (see GCBO)
% eventdata reserved - to be defined in a future version of MATLAB
% handles structure with handles and user data (see GUIDATA)
2 Add the following code to the callback immediately after the comment that begins %handles...
% Display surf plot of the currently selected data.
surf(handles.current_data);
3 Repeat steps 1 and 2 to add similar code to the Mesh and Contour push buttoncallbacks.

2 How to Create a GUI with GUIDE
2-22
• Add this code to the Mesh push button callback, pushbutton2_Callback:
% Display mesh plot of the currently selected data.
mesh(handles.current_data);
• Add this code to the Contour push button callback, pushbutton3_Callback:
% Display contour plot of the currently selected data.
contour(handles.current_data);
4 Save your code by selecting File > Save.
Open and Run the Simple GUIDE GUI
In “Code the Simple GUIDE GUI Behavior” on page 2-16, you programmed the pop-up menu and the push buttons. You also created data for them to use and initialized thedisplay. Now you can run your GUI and see how it works.
1 Run your GUI from the Layout Editor by selecting Tools > Run.
2 In the pop-up menu, select Membrane, and then click the Mesh button. The GUIdisplays a mesh plot of the MathWorks® L-shaped Membrane logo.

Create a Simple GUIDE GUI
2-23
3 Try other combinations before closing the GUI.

2 How to Create a GUI with GUIDE
2-24
Files Generated by GUIDE
In this section...
“Code Files and FIG-Files” on page 2-24“GUI Code File Structure” on page 2-25“Adding Callback Templates to an Existing GUI Code File” on page 2-25“About GUIDE-Generated Callbacks” on page 2-26
Code Files and FIG-Files
By default, the first time you save or run a GUI, GUIDE stores the GUI in two files:
• A FIG-file, with extension .fig, that contains a complete description of the GUIlayout and each UI component, such as push buttons, axes, panels, menus, and so on.The FIG-file is a binary file and you cannot modify it except by changing the layout inGUIDE. FIG-files are specializations of MAT-files. See “Writing Custom Applicationsto Read and Write MAT-Files” for more information.
• A code file, with extension .m, that initially contains initialization code and templatesfor some callbacks that control GUI behavior. You generally add callbacks you writefor your UI components to this file. As the callbacks are functions, the GUI code filecan never be a MATLAB script.
When you save your GUI the first time, GUIDE automatically opens the code file inyour default editor.
The FIG-file and the code file must have the same name. These two files usually residein the same folder, and correspond to the tasks of laying out and programming the GUI.When you lay out the GUI in the Layout Editor, your components and layout is stored inthe FIG-file. When you program the GUI, your code is stored in the corresponding codefile.
If your GUI includes ActiveX® components, GUIDE also generates a file for each ActiveXcomponent.
For more information about FIG-files and code files, see “Save a GUIDE GUI”.

Files Generated by GUIDE
2-25
GUI Code File Structure
The GUI code file that GUIDE generates is a function file. The name of the main functionis the same as the name of the code file. For example, if the name of the code file ismygui.m, then the name of the main function is mygui. Each callback in the file is a localfunction of that main function.
When GUIDE generates a code file, it automatically includes templates for the mostcommonly used callbacks for each component. The code file also contains initializationcode, as well as an opening function callback and an output function callback. It is yourjob to add code to the component callbacks for your GUI to work as you want. You canalso add code to the opening function callback and the output function callback. The GUIcode file orders functions as shown in the following table.
Section Description
Comments Displayed at the command line in response to the helpcommand. Edit comments as necessary for your GUI.
Initialization GUIDE initialization tasks. Do not edit this code.Opening function Performs your initialization tasks before the GUI user has
access to the GUI.Output function Returns outputs to the MATLAB command line after the
opening function returns control and before control returns tothe command line.
Component and figurecallbacks
Control the behavior of the GUI figure and of individualcomponents. MATLAB software calls a callback in response to aparticular event for a component or for the figure itself.
Utility/helperfunctions
Perform miscellaneous functions not directly associated with anevent for the figure or a component.
Adding Callback Templates to an Existing GUI Code File
When you save the GUI, GUIDE automatically adds templates for some callbacks to thecode file. If you want to add other callbacks to the file, you can easily do so.
Within GUIDE, you can add a local callback function template to the code in any of thefollowing ways. Select the component for which you want to add the callback, and then:

2 How to Create a GUI with GUIDE
2-26
• Right-click the mouse button, and from the View callbacks submenu, select thedesired callback.
• From View > View Callbacks, select the desired callback.• Double-click a component to show its properties in the Property Inspector. In the
Property Inspector, click the pencil-and-paper icon next to the name of thecallback you want to install in the code file.
• For toolbar buttons, in the Toolbar Editor, click the View button next to ClickedCallback (for Push Tool buttons) or On Callback, or Off Callback (for ToggleTools).
When you perform any of these actions, GUIDE adds the callback template to the GUIcode file, saves it, and opens it for editing at the callback you just added. If you select acallback that currently exists in the GUI code file, GUIDE adds no callback, but saves thefile and opens it for editing at the callback you select.
For more information, see “GUIDE-Generated Callback Functions and Property Values”on page 8-4.
About GUIDE-Generated Callbacks
Callbacks created by GUIDE for UI components are similar to callbacks createdprogrammatically, with certain differences.
• GUIDE generates callbacks as function templates within the GUI code file, which UIcomponents call via function handles.
GUIDE names callbacks based on the callback type and the component Tag property.For example, togglebutton1_Callback is such a default callback name. If youchange a component Tag, GUIDE renames all its callbacks in the code file to containthe new tag. You can change the name of a callback, replace it with another function,or remove it entirely using the Property Inspector.
• GUIDE provides three arguments to callbacks, always named the same.• You can append arguments to GUIDE-generated callbacks, but never alter or remove
the ones that GUIDE places there.• You can rename a GUIDE-generated callback by editing its name or by changing the
component Tag.• You can delete a callback from a component by clearing it from the Property
Inspector; this action does not remove anything from the code file.

Files Generated by GUIDE
2-27
• You can specify the same callback function for multiple components to enable them toshare code.
After you delete a component in GUIDE, all callbacks it had remain in the code file.If you are sure that no other component uses the callbacks, you can then remove thecallback code manually. For details, see “Renaming and Removing GUIDE-GeneratedCallbacks” on page 8-5.

2-28

3
A Simple Programmatic GUI

3 A Simple Programmatic GUI
3-2
Create a Simple Programmatic GUI
This example shows how to create a simple programmatic GUI, such as shown here.
Subsequent topics guide you through the process of creating this GUI.
If you prefer to view and run the code that created this GUI without creating it, set yourcurrent folder to one to which you have write access. Copy the example code and open itin the Editor by issuing the following MATLAB commands:
copyfile(fullfile(docroot, 'techdoc','creating_guis',...
'examples','simple_gui2*.*')), fileattrib('simple_gui2*.*', '+w');
edit simple_gui2.m
To run the GUI, on the Editor tab, in the Run section, click Run .

Create a Simple Programmatic GUI
3-3
Create a Code File for the Simple Programmatic GUI
Create a function file (as opposed to a script file, which contains a sequence of MATLABcommands but does not define functions).
1 At the MATLAB prompt, type edit.2 Type the following statement in the first line of the Editor.
function simple_gui2
3 Following the function statement, type these comments, ending with a blank line.(The comments display at the command line in response to the help command.)
% SIMPLE_GUI2 Select a data set from the pop-up menu, then
% click one of the plot-type push buttons. Clicking the button
% plots the selected data in the axes.
(Leave a blank line here)
4 At the end of the file, after the blank line, add an end statement.
Note You need the end statement to specify the end of the function because theexample uses nested functions. To learn more, see “Nested Functions”.
5 Save the file in your current folder or at a location that is on your MATLAB path.
Create a Figure for the Simple Programmatic GUI
Add the following lines before the end statement in your file to create a figure andposition it on the screen. (In MATLAB software, a GUI is a figure. )
% Create and then hide the GUI as it is being constructed.
f = figure('Visible','off','Position',[360,500,450,285]);
The call to the figure function uses two property/value pairs:
• The Visible property makes the GUI invisible so that the GUI user cannot see thecomponents being added or initialized.
When the GUI has all its components and is initialized, the example makes it visible.• The Position property is a four-element vector that specifies the location of the GUI
on the screen and its size: [distance from left, distance from bottom, width, height].Default units are pixels.

3 A Simple Programmatic GUI
3-4
Add Components to the Simple Programmatic GUI
Create the push buttons, static text, pop-up menu, and axes components to the GUI.
1 Following the call to figure, add these statements to your code file to create threepush button components.
% Construct the components.
hsurf = uicontrol('Style','pushbutton',...
'String','Surf','Position',[315,220,70,25]);
hmesh = uicontrol('Style','pushbutton',...
'String','Mesh','Position',[315,180,70,25]);
hcontour = uicontrol('Style','pushbutton',...
'String','Countour','Position',[315,135,70,25]);
Each statement uses a series of uicontrol property/value pairs to define a pushbutton:
• The Style property specifies that the uicontrol is a push button.• The String property specifies the label on each push button: Surf, Mesh, and
Contour.• The Position property specifies the location of each push button within the GUI
and its size: [distance from left, distance from bottom, width, height]. Defaultunits for push buttons are pixels.
Each uicontrol call returns the handle of the push button created.2 Add the pop-up menu and its static text label to your GUI by adding these
statements to the code file following the push button definitions. The first statementcreates a popup menu and the second statement creates a text component thatserves as a label for the popup menu.
htext = uicontrol('Style','text','String','Select Data',...
'Position',[325,90,60,15]);
hpopup = uicontrol('Style','popupmenu',...
'String',{'Peaks','Membrane','Sinc'},...
'Position',[300,50,100,25]);
The pop-up menu component String property uses a cell array to specify the threeitems in the pop-up menu: Peaks, Membrane, and Sinc.
The text component, the String property specifies instructions for the GUI user.

Create a Simple Programmatic GUI
3-5
For both components, the Position property specifies the location of eachcomponent within the GUI and its size: [distance from left, distance from bottom,width, height]. Default units for these components are pixels.
3 Add the axes to the GUI by adding this statement to the code file.
ha = axes('Units','pixels','Position',[50,60,200,185]);
The Units property specifies pixels so that the axes has the same units as the othercomponents.
4 Following all the component definitions, add this line to the code file to align allcomponents, except the axes, along their centers.
align([hsurf,hmesh,hcontour,htext,hpopup],'Center','None');
5 Add this command following the align command.
%Make the GUI visible.
f.Visible = 'on';
Your code file should look like this:
function simple_gui2
% SIMPLE_GUI2 Select a data set from the pop-up menu, then
% click one of the plot-type push buttons. Clicking the button
% plots the selected data in the axes.
% Create and then hide the GUI as it is being constructed.
f = figure('Visible','off','Position',[360,500,450,285]);
% Construct the components.
hsurf = uicontrol('Style','pushbutton','String','Surf',...
'Position',[315,220,70,25]);
hmesh = uicontrol('Style','pushbutton','String','Mesh',...
'Position',[315,180,70,25]);
hcontour = uicontrol('Style','pushbutton',...
'String','Countour',...
'Position',[315,135,70,25]);
htext = uicontrol('Style','text','String','Select Data',...
'Position',[325,90,60,15]);
hpopup = uicontrol('Style','popupmenu',...
'String',{'Peaks','Membrane','Sinc'},...
'Position',[300,50,100,25]);
ha = axes('Units','Pixels','Position',[50,60,200,185]);

3 A Simple Programmatic GUI
3-6
align([hsurf,hmesh,hcontour,htext,hpopup],'Center','None');
%Make the GUI visible.
f.Visible = 'on';
end
6 Run your code by typing simple_gui2 at the command line. You can select a dataset in the pop-up menu and click the push buttons, but nothing happens. Thisis because there is no callback code in the file to service the pop-up menu or thebuttons.
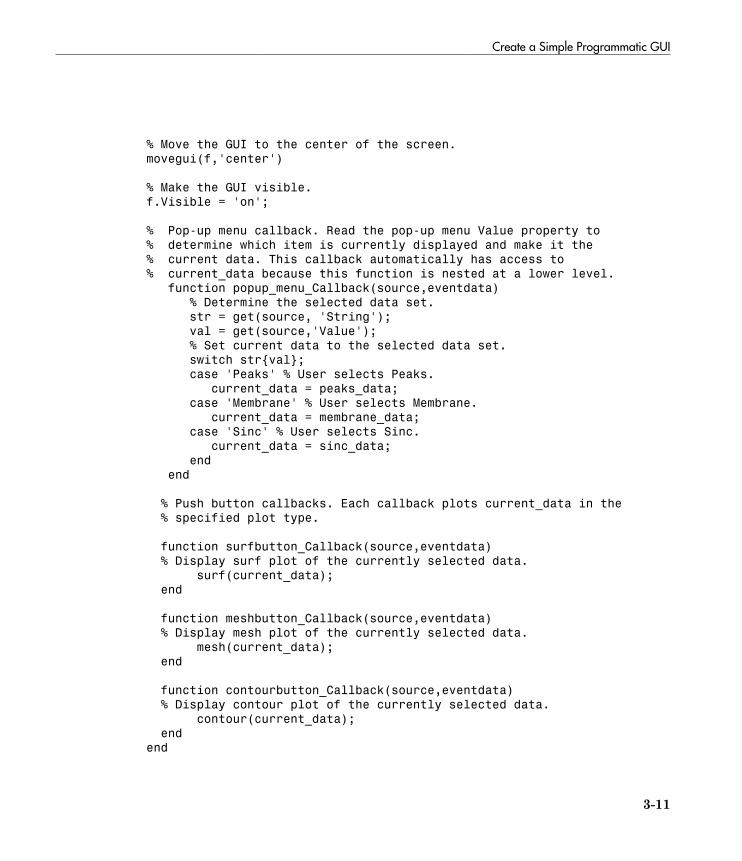
Code the Simple Programmatic GUI Behavior
Program the Pop-Up Menu
The pop-up menu enables users to select the data to plot. When a GUI user selects oneof the three data sets in the pop-up menu, MATLAB software sets the pop-up menuValue property to the index of the selected string. The pop-up menu callback reads thepop-up menu Value property to determine which item is currently displayed and setscurrent_data accordingly.

Create a Simple Programmatic GUI
3-7
Add the following callback to your file following the initialization code and before thefinal end statement.% Pop-up menu callback. Read the pop-up menu Value property to
% determine which item is currently displayed and make it the
% current data. This callback automatically has access to
% current_data because this function is nested at a lower level.
function popup_menu_Callback(source,eventdata)
% Determine the selected data set.
str = source.String;
val = source.Value;
% Set current data to the selected data set.
switch str{val};
case 'Peaks' % User selects Peaks.
current_data = peaks_data;
case 'Membrane' % User selects Membrane.
current_data = membrane_data;
case 'Sinc' % User selects Sinc.
current_data = sinc_data;
end
end
Program the Push Buttons
Each of the three push buttons creates a different type of plot using the data specifiedby the current selection in the pop-up menu. The push button callbacks plot the datain current_data. They automatically have access to current_data because they arenested at a lower level.
Add the following callbacks to your file following the pop-up menu callback and beforethe final end statement.
% Push button callbacks. Each callback plots current_data in the
% specified plot type.
function surfbutton_Callback(source,eventdata)
% Display surf plot of the currently selected data.
surf(current_data);
end
function meshbutton_Callback(source,eventdata)
% Display mesh plot of the currently selected data.
mesh(current_data);
end
function contourbutton_Callback(source,eventdata)
% Display contour plot of the currently selected data.
contour(current_data);

3 A Simple Programmatic GUI
3-8
end
Program the Callbacks
When the GUI user selects a data set from the pop-up menu or clicks one of the pushbuttons, MATLAB software executes the callback associated with that particular event.Use each component's Callback property to specify the name of the callback with whicheach event is associated.
1 To the uicontrol statement that defines the Surf push button, add the property/value pair
'Callback',{@surfbutton_Callback}
so that the statement looks like this:
hsurf = uicontrol('Style','pushbutton','String','Surf',...
'Position',[315,220,70,25],...
'Callback',{@surfbutton_Callback});
Callback is the name of the property. surfbutton_Callback is the name of thecallback that services the Surf push button.
2 To the uicontrol statement that defines the Mesh push button, add the property/value pair
'Callback',@meshbutton_Callback
3 To the uicontrol statement that defines the Contour push button, add theproperty/value pair
'Callback',@contourbutton_Callback
4 To the uicontrol statement that defines the pop-up menu, add the property/valuepair
'Callback',@popup_menu_Callback
For more information, see “Write Callbacks Using the Programmatic Workflow” on page11-5.
Initialize the Simple Programmatic GUI
Initialize the GUI, so it is ready for the user when the code makes the GUI visible.Make the GUI behave properly when it is resized by changing the component and figureunits to normalized. This causes the components to resize when the GUI is resized.

Create a Simple Programmatic GUI
3-9
Normalized units map the lower-left corner of the figure window to (0,0) and the upper-right corner to (1.0, 1.0).
Replace this code in editor:
% Make the GUI visible.
f.Visible = 'on';
with this code:
% Initialize the GUI.
% Change units to normalized so components resize automatically.
set([f,hsurf,hmesh,hcontour,htext,hpopup],'Units','normalized');
% Generate the data to plot.
peaks_data = peaks(35);
membrane_data = membrane;
[x,y] = meshgrid(-8:.5:8);
r = sqrt(x.^2+y.^2) + eps;
sinc_data = sin(r)./r;
% Create a plot in the axes.
current_data = peaks_data;
surf(current_data);
% Assign the GUI a name to appear in the window title.
f.Name = 'Simple GUI';
% Move the GUI to the center of the screen.
movegui(f,'center')
% Make the GUI visible.
f.Visible = 'on';
Verify Code and Run the Simple Programmatic GUI
Make sure your code appears as it should, and then run it.
1 Verify that your code file looks like this:
function simple_gui2
% SIMPLE_GUI2 Select a data set from the pop-up menu, then
% click one of the plot-type push buttons. Clicking the button
% plots the selected data in the axes.

3 A Simple Programmatic GUI
3-10
% Create and then hide the GUI as it is being constructed.
f = figure('Visible','off','Position',[360,500,450,285]);
% Construct the components.
hsurf = uicontrol('Style','pushbutton',...
'String','Surf','Position',[315,220,70,25],...
'Callback',@surfbutton_Callback);
hmesh = uicontrol('Style','pushbutton',...
'String','Mesh','Position',[315,180,70,25],...
'Callback',@meshbutton_Callback);
hcontour = uicontrol('Style','pushbutton',...
'String','Countour','Position',[315,135,70,25],...
'Callback',@contourbutton_Callback);
htext = uicontrol('Style','text','String','Select Data',...
'Position',[325,90,60,15]);
hpopup = uicontrol('Style','popupmenu',...
'String',{'Peaks','Membrane','Sinc'},...
'Position',[300,50,100,25],...
'Callback',@popup_menu_Callback);
ha = axes('Units','pixels','Position',[50,60,200,185]);
align([hsurf,hmesh,hcontour,htext,hpopup],'Center','None');
% Initialize the GUI.
% Change units to normalized so components resize automatically.
f.Units = 'normalized';
hsurf.Units = 'normalized';
hmesh.Units = 'normalized';
hcontour.Units = 'normalized';
htext.Units = 'normalized';
hpopup.Units = 'normalized';
% Generate the data to plot.
peaks_data = peaks(35);
membrane_data = membrane;
[x,y] = meshgrid(-8:.5:8);
r = sqrt(x.^2+y.^2) + eps;
sinc_data = sin(r)./r;
% Create a plot in the axes.
current_data = peaks_data;
surf(current_data);
% Assign the GUI a name to appear in the window title.
f.Name = 'Simple GUI';
Create a Simple Programmatic GUI
3-11
% Move the GUI to the center of the screen.
movegui(f,'center')
% Make the GUI visible.
f.Visible = 'on';
% Pop-up menu callback. Read the pop-up menu Value property to
% determine which item is currently displayed and make it the
% current data. This callback automatically has access to
% current_data because this function is nested at a lower level.
function popup_menu_Callback(source,eventdata)
% Determine the selected data set.
str = get(source, 'String');
val = get(source,'Value');
% Set current data to the selected data set.
switch str{val};
case 'Peaks' % User selects Peaks.
current_data = peaks_data;
case 'Membrane' % User selects Membrane.
current_data = membrane_data;
case 'Sinc' % User selects Sinc.
current_data = sinc_data;
end
end
% Push button callbacks. Each callback plots current_data in the
% specified plot type.
function surfbutton_Callback(source,eventdata)
% Display surf plot of the currently selected data.
surf(current_data);
end
function meshbutton_Callback(source,eventdata)
% Display mesh plot of the currently selected data.
mesh(current_data);
end
function contourbutton_Callback(source,eventdata)
% Display contour plot of the currently selected data.
contour(current_data);
end
end

3 A Simple Programmatic GUI
3-12
2 Run your code by typing simple_gui2 at the command line. The initialization codecauses it to display the default peaks data with the surf function, making the GUIlook like this.
3 In the pop-up menu, select Membrane, and then click the Mesh button. The GUIdisplays a mesh plot of the MathWorks L-shaped Membrane logo.
4 Try other combinations before closing the GUI.5 Type help simple_gui2 at the command line. MATLAB software displays the help
text.
help simple_gui2
SIMPLE_GUI2 Select a data set from the pop-up menu, then
click one of the plot-type push buttons. Clicking the button
plots the selected data in the axes.

Create GUIs with GUIDE


4
What Is GUIDE?
• “GUIDE: Getting Started” on page 4-2• “GUIDE Tools Summary” on page 4-3

4 What Is GUIDE?
4-2
GUIDE: Getting Started
In this section...
“GUI Layout” on page 4-2“GUI Programming” on page 4-2
GUI Layout
GUIDE, the MATLAB graphical user interface development environment, provides a setof tools for creating graphical user interfaces (GUIs). These tools simplify the process oflaying out and programming GUIs.
Using the GUIDE Layout Editor, you can populate a GUI by clicking and dragging GUIcomponents—such as axes, panels, buttons, text fields, sliders, and so on—into the layoutarea. You also can create menus and context menus for the GUI. From the Layout Editor,you can size the GUI, modify component look and feel, align components, set tab order,view a hierarchical list of the component objects, and set GUI options.
GUI Programming
GUIDE automatically generates a program file containing MATLAB functions thatcontrols how the GUI operates. This code file provides code to initialize the GUI andcontains a framework for the GUI callbacks—the routines that execute when a userinteracts with a GUI component. Use the MATLAB Editor to add code to the callbacks toperform the actions you want the GUI to perform.
Note MATLAB software provides a selection of standard dialog boxes that you can createwith a single function call. For an example, see the documentation for msgbox, whichalso provides links to functions that create specialized predefined dialog boxes.

GUIDE Tools Summary
4-3
GUIDE Tools Summary
The GUIDE tools are available from the Layout Editor shown in the figure below. Thetools are called out in the figure and described briefly below. Subsequent sections showyou how to use them.
Use This Tool... To...
Layout Editor Select components from the component palette, at the left side ofthe Layout Editor, and arrange them in the layout area. See “Add

4 What Is GUIDE?
4-4
Use This Tool... To...
Components to the GUIDE Layout Area” on page 6-17 for moreinformation.
Figure ResizeTab
Set the size at which the GUI is initially displayed when you run it.See “Set the GUIDE GUI Size” on page 6-11 for more information.
Menu Editor Create menus and context, i.e., pop-up, menus. See “Create Menus forGUIDE GUIs” on page 6-91 for more information.
Align Objects Align and distribute groups of components. Grids and rulers alsoenable you to align components on a grid with an optional snap-to-gridcapability. See “Align GUIDE GUI Components” on page 6-79 formore information.
Tab OrderEditor
Set the tab and stacking order of the components in your layout. See“Customize Tabbing Behavior in a GUIDE GUI” on page 6-88 formore information.
Toolbar Editor Create Toolbars containing predefined and custom push buttons andtoggle buttons. See “Create Toolbars for GUIDE GUIs” on page 6-108for more information.
Icon Editor Create and modify icons for tools in a toolbar. See “Create Toolbars forGUIDE GUIs” on page 6-108 for more information.
PropertyInspector
Set the properties of the components in your layout. It provides a list ofall the properties you can set and displays their current values.
Object Browser Display a hierarchical list of the objects in the GUI. See “View theGUIDE GUI Object Hierarchy” on page 6-119 for more information.
Run Save and run the current GUI.Editor Display, in your default editor, the code file associated with the GUI.
See “Files Generated by GUIDE” on page 2-24 for more information.PositionReadouts
Continuously display the mouse cursor position and the positions ofselected objects

5
GUIDE Preferences and Options
• “GUIDE Preferences” on page 5-2• “GUIDE Options” on page 5-8

5 GUIDE Preferences and Options
5-2
GUIDE Preferences
In this section...
“Set Preferences” on page 5-2“Confirmation Preferences” on page 5-2“Backward Compatibility Preference” on page 5-4“All Other Preferences” on page 5-4
Set Preferences
You can set preferences for GUIDE. From the MATLAB Home tab, in the Environmentsection, click Preferences. These preferences apply to GUIDE and to all GUIs youcreate.
The preferences are in different locations within the Preferences dialog box:
Confirmation Preferences
GUIDE provides two confirmation preferences. You can choose whether you want todisplay a confirmation dialog box when you
• Activate a GUI from GUIDE.• Export a GUI from GUIDE.• Change a callback signature generated by GUIDE.
In the Preferences dialog box, click MATLAB > General > Confirmation Dialogsto access the GUIDE confirmation preferences. Look for the word GUIDE in the Toolcolumn.
GUIDE Preferences
5-3
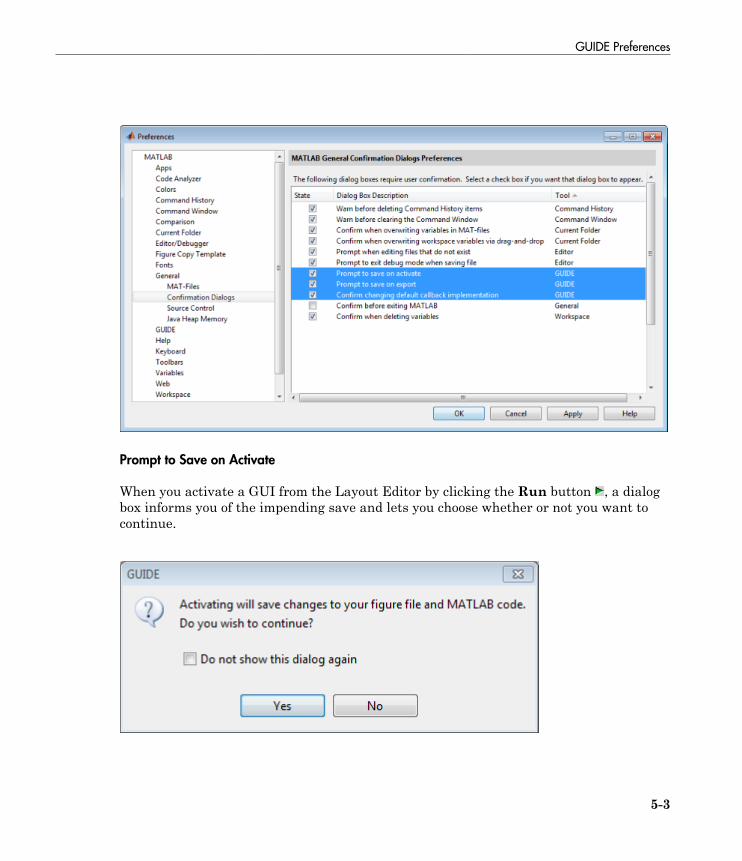
Prompt to Save on Activate
When you activate a GUI from the Layout Editor by clicking the Run button , a dialogbox informs you of the impending save and lets you choose whether or not you want tocontinue.

5 GUIDE Preferences and Options
5-4
Prompt to Save on Export
From the Layout Editor, when you select File > Export, a dialog box informs you of theimpending save and lets you choose whether or not you want to continue.
For more information on exporting a GUI, see “Create a Programmatic GUI Code Filefrom GUIDE GUI Files” on page 7-4.
Backward Compatibility Preference
MATLAB Version 5 or Later Compatibility
GUI FIG-files created or modified with MATLAB 7.0 or a later version are notautomatically compatible with Version 6.5 and earlier versions. GUIDE automaticallygenerates FIG-files, which are a kind of MAT-file, to hold layout information for GUIs.
To make a FIG-file backward compatible, from the Layout Editor, select File >Preferences > General > MAT-Files, and then select MATLAB Version 5 or later(save -v6).
Note: The -v6 option discussed in this section is obsolete and will be removed in a futureversion of MATLAB.
All Other Preferences
GUIDE provides other preferences, for the Layout Editor interface and for inserting codecomments. In the Preferences dialog box, click GUIDE to access these preferences.

GUIDE Preferences
5-5
The following topics describe the preferences in this dialog:
• “Show Names in Component Palette” on page 5-5• “Show File Extension in Window Title” on page 5-6• “Show File Path in Window Title” on page 5-6• “Add Comments for Newly Generated Callback Functions” on page 5-6
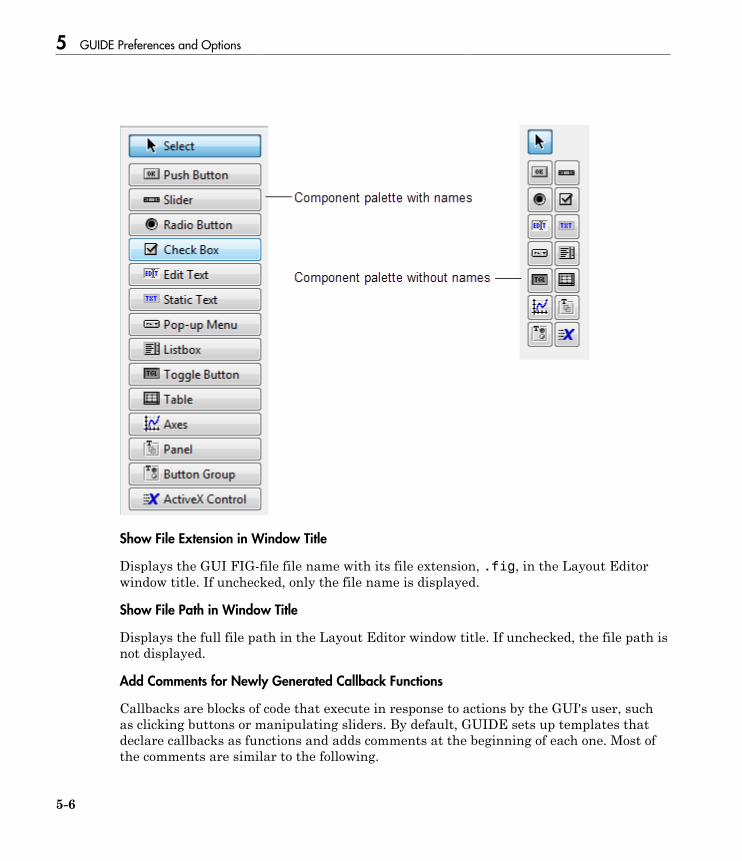
Show Names in Component Palette
Displays both icons and names in the component palette, as shown below. Whenunchecked, the icons alone are displayed in two columns, with tooltips.
5 GUIDE Preferences and Options
5-6
Show File Extension in Window Title
Displays the GUI FIG-file file name with its file extension, .fig, in the Layout Editorwindow title. If unchecked, only the file name is displayed.
Show File Path in Window Title
Displays the full file path in the Layout Editor window title. If unchecked, the file path isnot displayed.
Add Comments for Newly Generated Callback Functions
Callbacks are blocks of code that execute in response to actions by the GUI's user, suchas clicking buttons or manipulating sliders. By default, GUIDE sets up templates thatdeclare callbacks as functions and adds comments at the beginning of each one. Most ofthe comments are similar to the following.

GUIDE Preferences
5-7
% --- Executes during object deletion, before destroying properties.
function figure1_DeleteFcn(hObject, eventdata, handles)
% hObject handle to figure1 (see GCBO)
% eventdata reserved - to be defined in a future version of MATLAB
% handles structure with handles and user data (see GUIDATA)
Some callbacks are added automatically because their associated components are partof the original GUIDE template that you chose. Other commonly used callbacks areadded automatically when you add components. You can also add callbacks explicitly byselecting them from View > View Callbacks menu or on the component's context menu.
If you deselect this preference, GUIDE includes comments only for callbacks that areautomatically included to support the original GUIDE template. GUIDE does not includecomments for callbacks subsequently added to the code.
See “Write Callbacks Using the GUIDE Workflow” for more information about callbacksand about the arguments described in the preceding comments.

5 GUIDE Preferences and Options
5-8
GUIDE Options
In this section...
“The GUI Options Dialog Box” on page 5-8“Resize Behavior” on page 5-9“Command-Line Accessibility” on page 5-9“Generate FIG-File and MATLAB File” on page 5-10“Generate FIG-File Only” on page 5-12
The GUI Options Dialog Box
You can use the GUI Options dialog box to configure various behaviors that are specificto the GUIDE GUI you are creating. These options take effect when you next save theGUI.
Access the dialog box from the GUIDE Layout Editor by selecting Tools > GUI Options.
GUIDE Options
5-9
Resize Behavior
You can control whether users can resize the figure window containing your GUI andhow MATLAB handles resizing. GUIDE provides three options:
• Non-resizable — Users cannot change the window size (default).• Proportional — The software automatically rescales the components in the GUI in
proportion to the new figure window size.• Other (Use SizeChangedFcn) — Program the GUI to behave in a certain way when
users resize the figure window.
The first two options set figure and component properties appropriately and require noother action. Other (Use SizeChangedFcn) requires you to write a callback routinethat recalculates sizes and positions of the components based on the new figure size. Fora discussion and examples of using a SizeChangedFcn, see the GUIDE examples “Panel”on page 8-21 and “GUI For Managing Persistent Data” on page 9-7.
Command-Line Accessibility
You can restrict access to a GUI figure from the command line or from a code file withthe GUIDE Command-line accessibility options.
Unless you explicitly specify a figure handle, many commands, such as plot, alter thecurrent figure (the figure specified by the root CurrentFigure property and returned bythe gcf command). The current figure is usually the figure that is most recently created,drawn into, or mouse-clicked. You can programmatically designate a figure h (where h isits handle) as the current figure in four ways:
1 set(groot,'CurrentFigure',h) — Makes figure h current, but does not changeits visibility or stacking with respect to other figures
2 figure(h) — Makes figure h current, visible, and displayed on top of other figures3 axes(h) — Makes existing axes h the current axes and displays the figure
containing it on top of other figures4 plot(h,...), or any plotting function that takes an axes as its first argument, also
makes existing axes h the current axes and displays the figure containing it on top ofother figures
The gcf function returns the handle of the current figure.

5 GUIDE Preferences and Options
5-10
h = gcf
For a GUI created in GUIDE, set the Command-line accessibility option to preventusers from inadvertently changing the appearance or content of a GUI by executingcommands at the command line or from a script or function, such as plot. The followingtable briefly describes the four options for Command-line accessibility.
Option Description
Callback (GUI becomes CurrentFigure within Callbacks)
The GUI can be accessed only from withina GUI callback. The GUI cannot beaccessed from the command line or from ascript. This is the default.
Off (GUI never becomes CurrentFigure)
The GUI can not be accessed from acallback, the command line, or a script,without the handle.
On (GUI may become Current Figurefrom Command Line)
The GUI can be accessed from a callback,from the command line, and from a script.
Other (Use settings from PropertyInspector)
You control accessibility by setting theHandleVisibility and IntegerHandleproperties from the Property Inspector.
Generate FIG-File and MATLAB File
Select Generate FIG-file and MATLAB file in the GUI Options dialog box if youwant GUIDE to create both the FIG-file and the GUI code file (this is the default). Onceyou have selected this option, you can select any of the following items in the frame toconfigure GUI code:
• “Generate Callback Function Prototypes” on page 5-10• “GUI Allows Only One Instance to Run (Singleton)” on page 5-11• “Use System Color Scheme for Background” on page 5-11
See “Files Generated by GUIDE” on page 2-24 for information about these files.
Generate Callback Function Prototypes
If you select Generate callback function prototypes in the GUI Options dialog,GUIDE adds templates for the most commonly used callbacks to the GUI code for mostcomponents you add to the GUI. You must then write the code for these callbacks.

GUIDE Options
5-11
GUIDE also adds a callback whenever you edit a callback routine from the LayoutEditor's right-click context menu and when you add menus to the GUI using the MenuEditor.
See “Write Callbacks Using the GUIDE Workflow” for general information aboutcallbacks.
Note This option is available only if you first select the Generate FIG-file andMATLAB file option.
GUI Allows Only One Instance to Run (Singleton)
This option allows you to select between two behaviors for the GUI figure:
• Allow MATLAB software to display only one instance of the GUI at a time.• Allow MATLAB software to display multiple instances of the GUI.
If you allow only one instance, the software reuses the existing GUI figure whenever thecommand to run the GUI is issued. If a GUI already exists, the software brings it to theforeground rather than creating a new figure.
If you clear this option, the software creates a new GUI figure whenever you issue thecommand to run the GUI.
Even if you allow only one instance of a GUI to run at once, initialization can take placeeach time you invoke it from the command line. For example, the code in an OpeningFcnwill run each time a GUIDE GUI runs unless you take steps to prevent it from doing so.Adding a flag to the handles structure is one way to control such behavior. You can dothis in the OpeningFcn, which can run initialization code if this flag doesn't yet existand skip that code if it does.
Note This option is available only if you first select the Generate FIG-file andMATLAB file option.
Use System Color Scheme for Background
The default color used for GUI components is system dependent. This option enablesyou to make the figure background color the same as the default component backgroundcolor.

5 GUIDE Preferences and Options
5-12
To ensure that the figure background matches the color of the components, select Usesystem color scheme for background in the GUI Options dialog.
Note This option is available only if you first select the Generate FIG-file andMATLAB file option.
Generate FIG-File Only
The Generate FIG-file only option enables you to open figures and GUIs to performlimited editing. These can be any figures and need not be GUIs. GUIs need not have beengenerated using GUIDE. This mode provides limited editing capability and may be usefulfor GUIs generated in MATLAB Versions 5.3 and earlier. See the guide function formore information.
GUIDE selects Generate FIG-file only as the default if you do one of the following:
• Start GUIDE from the command line by providing one or more figure handles asarguments.
guide(fh)
In this case, GUIDE selects Generate FIG-file only, even when a code file with acorresponding name exists in the same folder.
• Start GUIDE from the command line and provide the name of a FIG-file for which nocode file with the same name exists in the same folder.
guide('myfig.fig')
• Use the GUIDE Open Existing GUI tab to open a FIG-file for which no code filewith the same name exists in the same folder.
When you save the figure or GUI with Generate FIG-file only selected, GUIDE savesonly the FIG-file. You must update any corresponding code files yourself, as appropriate.
If you want GUIDE to manage the GUI code file for you, change the selectionto Generate FIG-file and MATLAB file before saving the GUI. If there is nocorresponding code file in the same location, GUIDE creates one. If a code file with thesame name as the original figure or GUI exists in the same folder, GUIDE overwrites it.To prevent overwriting an existing file, save the GUI using Save As from the File menu.Select another file name for the two files. GUIDE updates variable names in the newcode file as appropriate.

GUIDE Options
5-13
Callbacks for GUIs without Code
Even when there is no code file associated with a GUI FIG-file, you can still providecallbacks for GUI components to make them perform actions when used. In the PropertyInspector, you can type callbacks in the form of strings, built-in functions, or MATLABcode file names; when the GUI runs, it will execute them if possible. If the callback is afile name, it can include arguments to that function. For example, setting the Callbackproperty of a push button to sqrt(2) causes the result of the expression to display in theCommand Window:
ans =
1.4142
Any file that a callback executes must be in the current folder or on the MATLAB path.For more information on how callbacks work, see “Write Callbacks Using the GUIDEWorkflow” on page 8-2

5-14

6
Lay Out a GUIDE GUI
• “GUIDE Templates” on page 6-2• “Set the GUIDE GUI Size” on page 6-11• “GUIDE Components” on page 6-13• “Add Components to the GUIDE Layout Area” on page 6-17• “Copy, Paste, and Arrange Components” on page 6-70• “Locate and Move Components” on page 6-74• “Align GUIDE GUI Components” on page 6-79• “Customize Tabbing Behavior in a GUIDE GUI” on page 6-88• “Create Menus for GUIDE GUIs” on page 6-91• “Create Toolbars for GUIDE GUIs” on page 6-108• “View the GUIDE GUI Object Hierarchy” on page 6-119• “Design GUIDE GUIs for Cross-Platform Compatibility” on page 6-120• “GUI Design References” on page 6-123

6 Lay Out a GUIDE GUI
6-2
GUIDE Templates
In this section...
“Access the Templates” on page 6-2“Template Descriptions” on page 6-3
Access the Templates
GUIDE provides several templates that you can modify to create your own GUIs. Thetemplates are fully functional GUIs; they are already programmed.
You can access the templates in two ways:
• From the MATLAB toolstrip, on the HOME tab, in the FILE section, selectNew >Graphical User Interface
• If the Layout Editor is already open, select File > New.
In either case, GUIDE displays the GUIDE Quick Start dialog box with the CreateNew GUI tab selected as shown in the following figure. This tab contains a list of theavailable templates.

GUIDE Templates
6-3
To use a template:
1 Select a template in the left pane. A preview displays in the right pane.2 Optionally, name your GUI now by selecting Save new figure as and typing the
name in the field to the right. GUIDE saves the GUI before opening it in the LayoutEditor. If you choose not to name the GUI at this point, GUIDE prompts you to saveit and give it a name the first time you run the GUI.
3 Click OK to open the GUI template in the Layout Editor.
Template Descriptions
GUIDE provides four fully functional templates. They are described in the followingsections:
• “Blank GUI” on page 6-3• “GUI with Uicontrols” on page 6-4• “GUI with Axes and Menu” on page 6-6• “Modal Question Dialog” on page 6-8
“Out of the box,” none of the GUI templates include a menu bar or a toolbar. Neither canthey dock in the MATLAB desktop. You can, however, override these GUIDE defaults toprovide and customize these controls. See the sections “Create Menus for GUIDE GUIs”on page 6-91 and “Create Toolbars for GUIDE GUIs” on page 6-108 for details.
Note To see how the template GUIs work, you can view their code and look at theircallbacks. You can also modify the callbacks for your own purposes. To view the code filefor any of these templates, open the template in the Layout Editor and click the Editorbutton on the toolbar.
Blank GUI
The blank GUI template displayed in the Layout Editor is shown in the following figure.
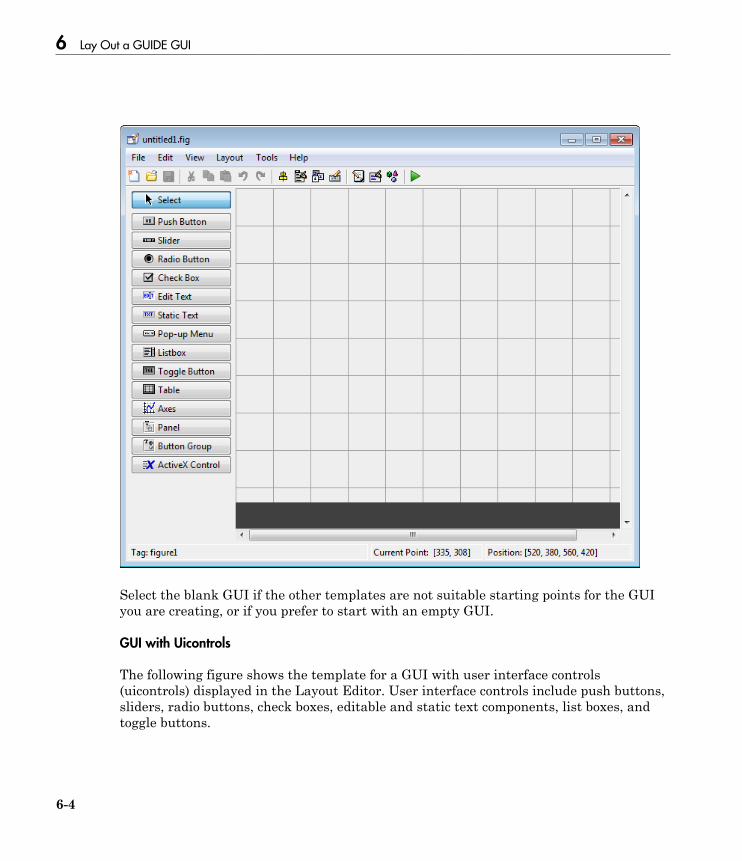
6 Lay Out a GUIDE GUI
6-4
Select the blank GUI if the other templates are not suitable starting points for the GUIyou are creating, or if you prefer to start with an empty GUI.
GUI with Uicontrols
The following figure shows the template for a GUI with user interface controls(uicontrols) displayed in the Layout Editor. User interface controls include push buttons,sliders, radio buttons, check boxes, editable and static text components, list boxes, andtoggle buttons.

GUIDE Templates
6-5
When you run the GUI by clicking the Run button , the GUI appears as shown in thefollowing figure.

6 Lay Out a GUIDE GUI
6-6
When a user enters values for the density and volume of an object, and clicks theCalculate button, the GUI calculates the mass of the object and displays the result nextto Mass(D*V).
To view the code for these user interface controls, open the template in the Layout Editorand click the Editor button on the toolbar.
GUI with Axes and Menu
The template for a GUI with axes and menu is shown in the following figure.

GUIDE Templates
6-7
When you run the GUI by clicking the Run button on the toolbar, the GUI displays aplot of five lines, each of which is generated from random numbers using the MATLABrand(5) command. The following figure shows an example.

6 Lay Out a GUIDE GUI
6-8
You can select other plots in the pop-up menu. Clicking the Update button displays thecurrently selected plot on the axes.
The GUI also has a File menu with three items:
• Open displays a dialog box from which you can open files on your computer.• Print opens the Print dialog box. Clicking OK in the Print dialog box prints the
figure.• Close closes the GUI.
To view the code for these menu choices, open the template in the Layout Editor and clickthe Editor button on the toolbar.
Modal Question Dialog
The modal question dialog template displayed in the Layout Editor is shown in thefollowing figure.
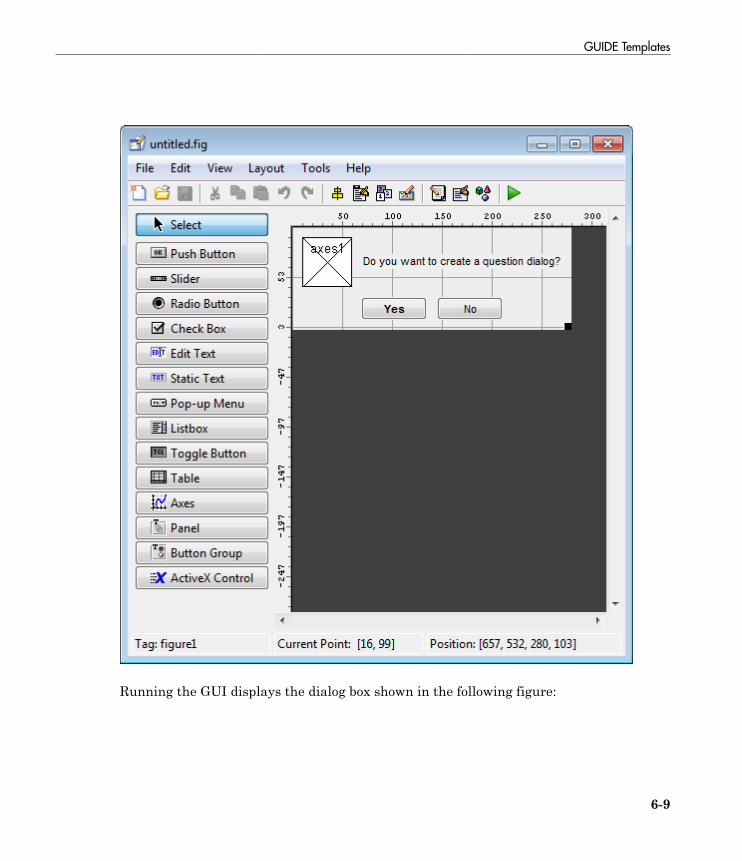
GUIDE Templates
6-9
Running the GUI displays the dialog box shown in the following figure:

6 Lay Out a GUIDE GUI
6-10
The GUI returns the text string Yes or No, depending on which button you click.
Select this template if you want your GUI to return a string or to be modal.
Modal GUIs are blocking, which means that the current code file stops executinguntil the GUI restores execution; this means that the user cannot interact with otherMATLAB windows until one of the buttons is clicked.
To view the code for these capabilities, open the template in the Layout Editor and clickthe Editor button on the toolbar. See “Modal Dialog Box in a GUIDE GUI” on page9-2 for an example of using this template with another GUI. Also see the figureWindowStyle property for more information.
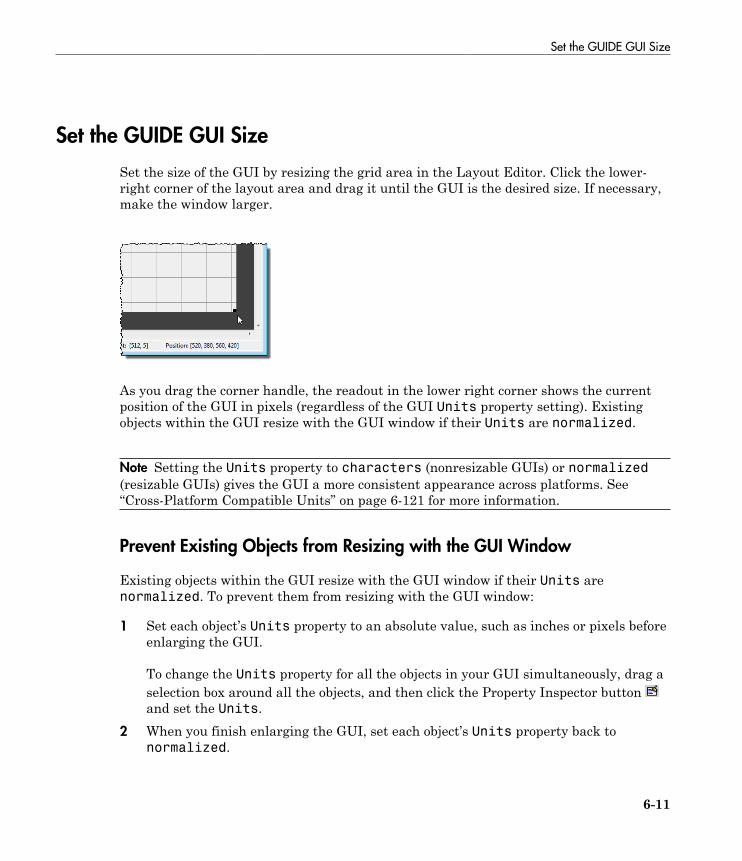
Set the GUIDE GUI Size
6-11
Set the GUIDE GUI Size
Set the size of the GUI by resizing the grid area in the Layout Editor. Click the lower-right corner of the layout area and drag it until the GUI is the desired size. If necessary,make the window larger.
As you drag the corner handle, the readout in the lower right corner shows the currentposition of the GUI in pixels (regardless of the GUI Units property setting). Existingobjects within the GUI resize with the GUI window if their Units are normalized.
Note Setting the Units property to characters (nonresizable GUIs) or normalized(resizable GUIs) gives the GUI a more consistent appearance across platforms. See“Cross-Platform Compatible Units” on page 6-121 for more information.
Prevent Existing Objects from Resizing with the GUI Window
Existing objects within the GUI resize with the GUI window if their Units arenormalized. To prevent them from resizing with the GUI window:
1 Set each object’s Units property to an absolute value, such as inches or pixels beforeenlarging the GUI.
To change the Units property for all the objects in your GUI simultaneously, drag aselection box around all the objects, and then click the Property Inspector button and set the Units.
2 When you finish enlarging the GUI, set each object’s Units property back tonormalized.
6 Lay Out a GUIDE GUI
6-12
Set the GUI Position or Size to an Exact Value
1 In the Layout Editor, open the Property Inspector for the figure by clicking the button (with no components selected).
2 In the Property Inspector, scroll to the Units property and note whether the currentsetting is characters or normalized.
3 Click the down arrow at the far right in the Units row, and select inches.4 In the Property Inspector, display the Position property elements by clicking the +
sign to the left of Position.5 Change the x and y coordinates to the point where you want the lower-left corner of
the GUI to appear, and its width and height.6 Reset the Units property to its previous setting, as noted in step 2.
Maximize the Layout Area
You can make maximum use of space within the Layout Editor by hiding the GUIDEtoolbar and status bar, and showing only tool icons, as follows:
1 From the View menu, deselect Show Toolbar.2 From the View menu, deselect Show Status Bar.3 Select File > Preferences, and then clear Show names in component palette
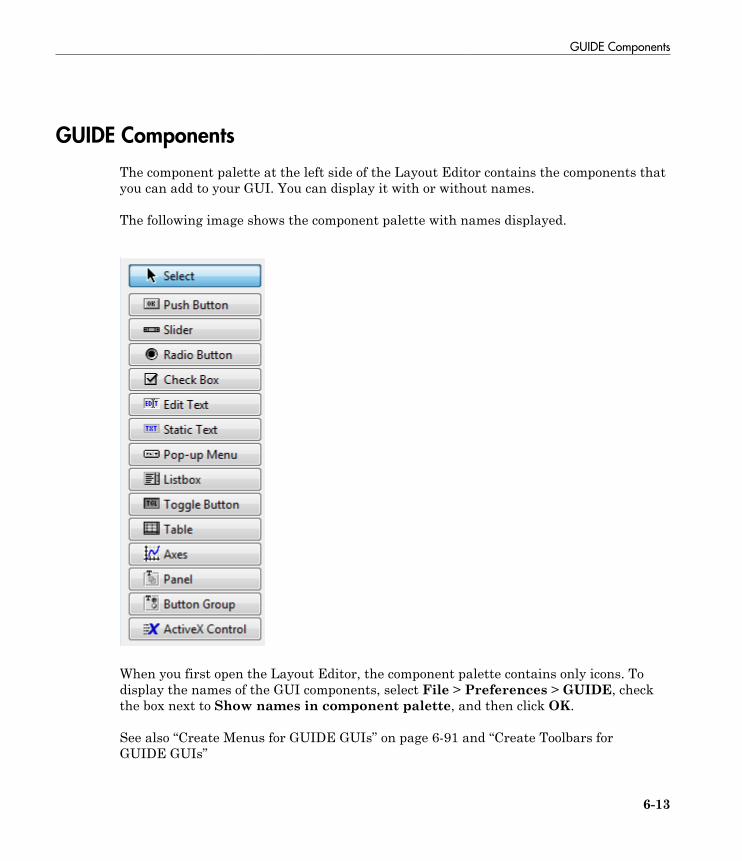
GUIDE Components
6-13
GUIDE Components
The component palette at the left side of the Layout Editor contains the components thatyou can add to your GUI. You can display it with or without names.
The following image shows the component palette with names displayed.
When you first open the Layout Editor, the component palette contains only icons. Todisplay the names of the GUI components, select File > Preferences > GUIDE, checkthe box next to Show names in component palette, and then click OK.
See also “Create Menus for GUIDE GUIs” on page 6-91 and “Create Toolbars forGUIDE GUIs”

6 Lay Out a GUIDE GUI
6-14
Component Icon Description
“Push Button”on page 6-25
Push buttons generate an action when clicked. Forexample, an OK button might apply settings and closea dialog box. When you click a push button, it appearsdepressed; when you release the mouse button, the pushbutton appears raised.
“Slider” on page6-27
Sliders accept numeric input within a specified range byenabling the user to move a sliding bar, which is calleda slider or thumb. Users move the slider by clicking theslider and dragging it, by clicking in the trough, or byclicking an arrow. The location of the slider indicates therelative location within the specified range.
“Radio Button”on page 6-29
Radio buttons are similar to check boxes, but radio buttonsare typically mutually exclusive within a group of relatedradio buttons. That is, when you select one button thepreviously selected button is deselected. To activate aradio button, click the mouse button on the object. Thedisplay indicates the state of the button. Use a buttongroup to manage mutually exclusive radio buttons.
“Check Box” onpage 6-31
Check boxes can generate an action when checked andindicate their state as checked or not checked. Checkboxes are useful when providing the user with a number ofindependent choices, for example, displaying a toolbar.
“Edit Text” onpage 6-32
Edit text components are fields that enable users to enteror modify text strings. Use edit text when you want textas input. Users can enter numbers but you must convertthem to their numeric equivalents.
“Static Text” onpage 6-34
Static text controls display lines of text. Static text istypically used to label other controls, provide directions tothe user, or indicate values associated with a slider. Userscannot change static text interactively.
“Pop-Up Menu”on page 6-36
Pop-up menus open to display a list of choices when usersclick the arrow.
“List Box” onpage 6-38
List boxes display a list of items and enable users to selectone or more items.

GUIDE Components
6-15
Component Icon Description
“Toggle Button”on page 6-41
Toggle buttons generate an action and indicate whetherthey are turned on or off. When you click a toggle button,it appears depressed, showing that it is on. When yourelease the mouse button, the toggle button remainsdepressed until you click it a second time. When you doso, the button returns to the raised state, showing that itis off. Use a button group to manage mutually exclusivetoggle buttons.
“Table” on page6-54
Use the table button to create a table component. Refer tothe uitable function for more information on using thiscomponent.
“Axes” on page6-50
Axes enable your GUI to display graphics such as graphsand images. Like all graphics objects, axes have propertiesthat you can set to control many aspects of its behaviorand appearance.
“Panel” on page6-45
Panels arrange GUI components into groups. By visuallygrouping related controls, panels can make the userinterface easier to understand. A panel can have a titleand various borders.
Panel children can be user interface controls and axes aswell as button groups and other panels. The position ofeach component within a panel is interpreted relative tothe panel. If you move the panel, its children move with itand maintain their positions on the panel.
“Button Group”on page 6-48
Button groups are like panels but are used to manageexclusive selection behavior for radio buttons and togglebuttons.
“Create Toolbarsfor GUIDEGUIs” on page6-108
You can create toolbars containing push buttons andtoggle buttons. Use the GUIDE Toolbar Editor to createtoolbar buttons. Choose between predefined buttons, suchas Save and Print, and buttons that you customize withyour own icons and callbacks.

6 Lay Out a GUIDE GUI
6-16
Component Icon Description
“ActiveXComponent” onpage 6-65
ActiveX components enable you to display ActiveX controlsin your GUI. They are available only on the Microsoft®
Windows® platform.
An ActiveX control can be the child only of a figure, i.e., ofthe GUI itself. It cannot be the child of a panel or buttongroup.

Add Components to the GUIDE Layout Area
6-17
Add Components to the GUIDE Layout Area
In this section...
“Place Components” on page 6-17“User Interface Controls” on page 6-23“Panels and Button Groups” on page 6-44“Axes” on page 6-50“Table” on page 6-54“ActiveX Component” on page 6-65“Resize GUIDE GUI Components” on page 6-67
Place Components
The component palette at the left side of the Layout Editor contains the components thatyou can add to your GUI.
Note See “Create Menus for GUIDE GUIs” on page 6-91 for information about addingmenus to a GUI. See “Create Toolbars for GUIDE GUIs” on page 6-108 for informationabout working with the toolbar.
To place components in the GUIDE layout area and give each component a uniqueidentifier, follow these steps:
1 Display component names on the palette.
a On the MATLAB Home tab, in the Environment section, click Preferences.b In the Preferences dialog box, click GUIDE.c Select Show Names in Component Palette, and then click OK .
2 Place components in the layout area according to your design.
• Drag a component from the palette and drop it in the layout area.• Click a component in the palette and move the cursor over the layout area. The
cursor changes to a cross. Click again to add the component in its default size, orclick and drag to size the component as you add it.
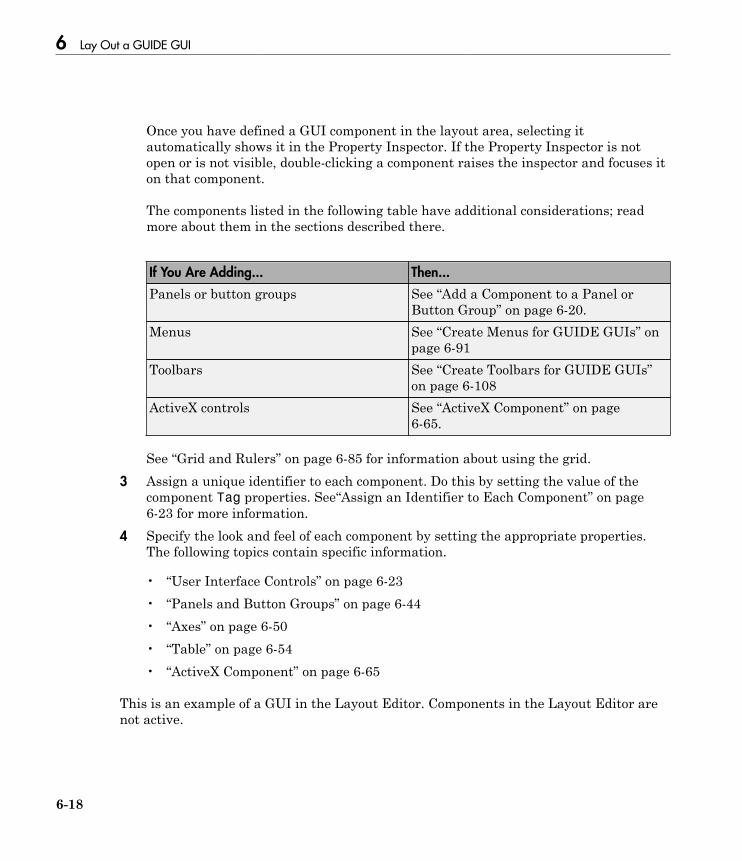
6 Lay Out a GUIDE GUI
6-18
Once you have defined a GUI component in the layout area, selecting itautomatically shows it in the Property Inspector. If the Property Inspector is notopen or is not visible, double-clicking a component raises the inspector and focuses iton that component.
The components listed in the following table have additional considerations; readmore about them in the sections described there.
If You Are Adding... Then...
Panels or button groups See “Add a Component to a Panel orButton Group” on page 6-20.
Menus See “Create Menus for GUIDE GUIs” onpage 6-91
Toolbars See “Create Toolbars for GUIDE GUIs”on page 6-108
ActiveX controls See “ActiveX Component” on page6-65.
See “Grid and Rulers” on page 6-85 for information about using the grid.3 Assign a unique identifier to each component. Do this by setting the value of the
component Tag properties. See“Assign an Identifier to Each Component” on page6-23 for more information.
4 Specify the look and feel of each component by setting the appropriate properties.The following topics contain specific information.
• “User Interface Controls” on page 6-23• “Panels and Button Groups” on page 6-44• “Axes” on page 6-50• “Table” on page 6-54• “ActiveX Component” on page 6-65
This is an example of a GUI in the Layout Editor. Components in the Layout Editor arenot active.
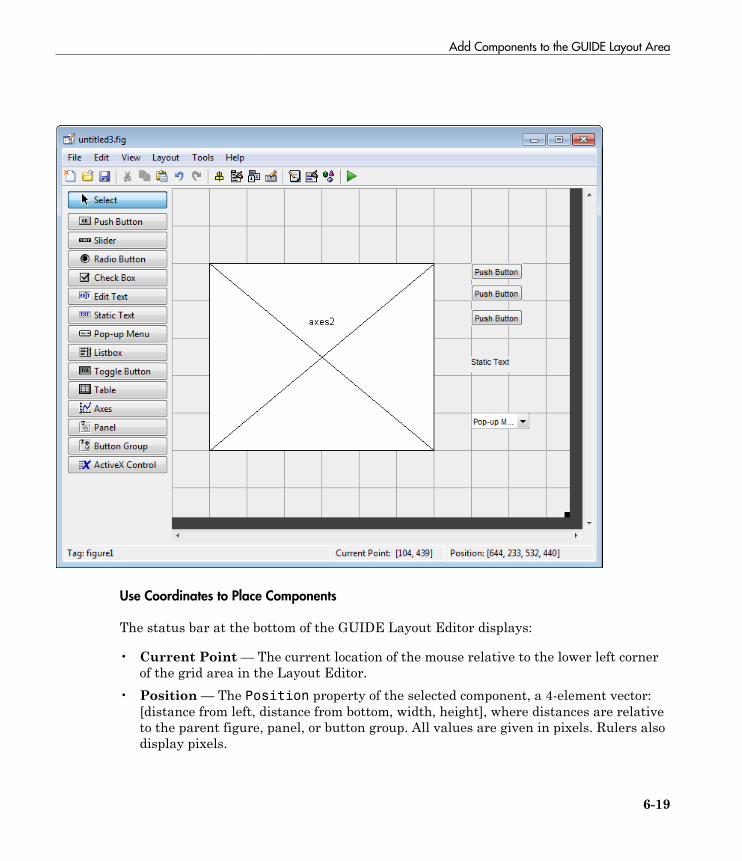
Add Components to the GUIDE Layout Area
6-19
Use Coordinates to Place Components
The status bar at the bottom of the GUIDE Layout Editor displays:
• Current Point — The current location of the mouse relative to the lower left cornerof the grid area in the Layout Editor.
• Position — The Position property of the selected component, a 4-element vector:[distance from left, distance from bottom, width, height], where distances are relativeto the parent figure, panel, or button group. All values are given in pixels. Rulers alsodisplay pixels.

6 Lay Out a GUIDE GUI
6-20
If you select a single component and move it, the first two elements of the position vector(distance from left, distance from bottom) are updated as you move the component. Ifyou resize the component, the last two elements of the position vector (width, height) areupdated as you change the size. The first two elements may also change if you resize thecomponent such that the position of its lower left corner changes. If no components areselected, the position vector is that of the figure.
For more information, see “Use Coordinate Readouts” on page 6-74.
Add a Component to a Panel or Button Group
To add a component to a panel or button group, select the component in the componentpalette then move the cursor over the desired panel or button group. The position of thecursor determines the component's parent.
GUIDE highlights the potential parent as shown in the following figure. The highlightindicates that if you drop the component or click the cursor, the component will be a childof the highlighted panel, button group, or figure.

Add Components to the GUIDE Layout Area
6-21
Note Assign a unique identifier to each component in your panel or button group bysetting the value of its Tag property. See “Assign an Identifier to Each Component” onpage 6-23 for more information.

6 Lay Out a GUIDE GUI
6-22
Include Existing Components in Panels and Button Groups
When you add a new component or drag an existing component to a panel or buttongroup, it will become a member, or child, of the panel or button group automatically,whether fully or partially enclosed by it. However, if the component is not entirelycontained in the panel or button group, it appears to be clipped in the Layout Editor.When you run the GUI, the entire component is displayed and straddles the panel orbutton group border. The component is nevertheless a child of the panel and behavesaccordingly. You can use the Object Browser to determine the child objects of a panel orbutton group. “View the GUIDE GUI Object Hierarchy” on page 6-119 tells you how.
You can add a new panel or button group to a GUI in order to group any of its existingcontrols. In order to include such controls in a new panel or button group, do thefollowing. The instructions refer to panels, but you do the same for components insidebutton groups.
1 Select the New Panel or New Button Group tool and drag out a rectangle to have thesize and position you want.
The panel will not obscure any controls within its boundary unless they are axes,tables, or other panels or button groups. Only overlap panels you want to nest, andthen make sure the overlap is complete.
2 You can use Send Backward or Send to Back on the Layout menu to layer thenew panel behind components you do not want it to obscure, if your layout has thisproblem. As you add components to it or drag components into it, the panel willautomatically layer itself behind them.
Now is a good time to set the panel's Tag and String properties to whatever youwant them to be, using the Property Inspector.
3 Open the Object Browser from the View menu and find the panel you just added.Use this tool to verify that it contains all the controls you intend it to group together.If any are missing, perform the following steps.
4 Drag controls that you want to include but don't fit within the panel inside it topositions you want them to have. Also, slightly move controls that are already intheir correct positions to group them with the panel.
The panel highlights when you move a control, indicating it now contains the control.The Object Browser updates to confirm the relationship. If you now move the panel,its child controls move with it.
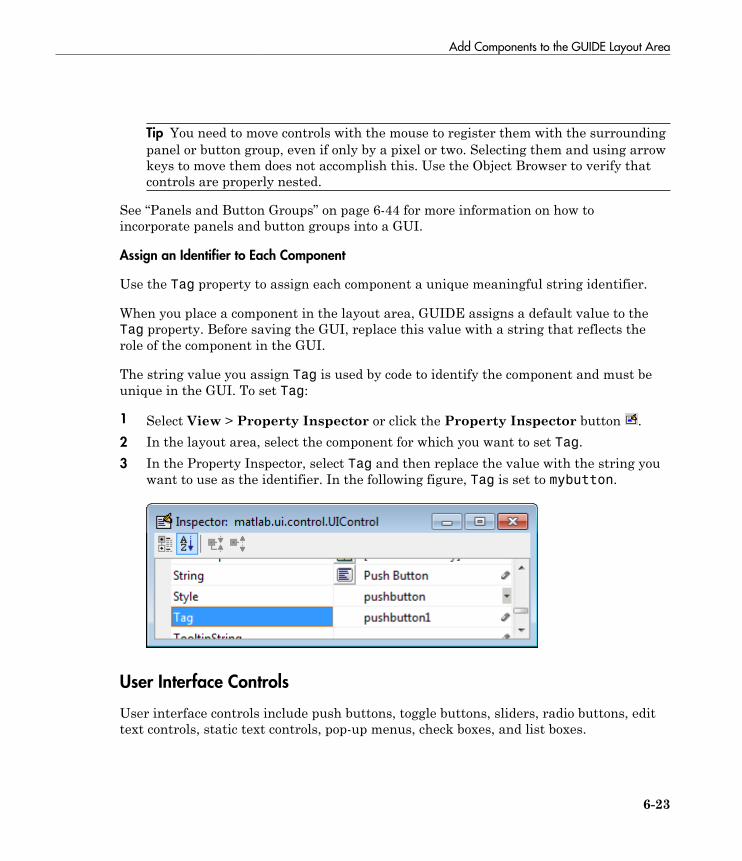
Add Components to the GUIDE Layout Area
6-23
Tip You need to move controls with the mouse to register them with the surroundingpanel or button group, even if only by a pixel or two. Selecting them and using arrowkeys to move them does not accomplish this. Use the Object Browser to verify thatcontrols are properly nested.
See “Panels and Button Groups” on page 6-44 for more information on how toincorporate panels and button groups into a GUI.
Assign an Identifier to Each Component
Use the Tag property to assign each component a unique meaningful string identifier.
When you place a component in the layout area, GUIDE assigns a default value to theTag property. Before saving the GUI, replace this value with a string that reflects therole of the component in the GUI.
The string value you assign Tag is used by code to identify the component and must beunique in the GUI. To set Tag:
1 Select View > Property Inspector or click the Property Inspector button .2 In the layout area, select the component for which you want to set Tag.3 In the Property Inspector, select Tag and then replace the value with the string you
want to use as the identifier. In the following figure, Tag is set to mybutton.
User Interface Controls
User interface controls include push buttons, toggle buttons, sliders, radio buttons, edittext controls, static text controls, pop-up menus, check boxes, and list boxes.

6 Lay Out a GUIDE GUI
6-24
To define user interface controls, you must set certain properties. To do this:
1 Use the Property Inspector to modify the appropriate properties. Open the PropertyInspector by selecting View > Property Inspector or by clicking the Property
Inspector button .2 In the layout area, select the component you are defining.
Subsequent topics describe commonly used properties of user interface controls and offera simple example for each kind of control:
• “Commonly Used Properties” on page 6-24• “Push Button” on page 6-25• “Slider” on page 6-27• “Radio Button” on page 6-29• “Check Box” on page 6-31• “Edit Text” on page 6-32• “Static Text” on page 6-34• “Pop-Up Menu” on page 6-36• “List Box” on page 6-38• “Toggle Button” on page 6-41
Note: See “GUIDE Components” on page 6-13 for descriptions of these components. See“Callbacks for Specific Components” on page 8-12 for basic examples of programmingthese components.
Commonly Used Properties
The most commonly used properties needed to describe a user interface control are shownin the following table. Instructions for a particular control may also list properties thatare specific to that control.
Property Value Description
Enable on, inactive, off. Defaultis on.
Determines whether thecontrol is available to the user

Add Components to the GUIDE Layout Area
6-25
Property Value Description
Max Scalar. Default is 1. Maximum value.Interpretation depends on thetype of component.
Min Scalar. Default is 0. Minimum value.Interpretation depends on thetype of component.
Position 4-element vector: [distancefrom left, distance frombottom, width, height].
Size of the component and itslocation relative to its parent.
String String. Can also be a cellarray or character array ofstrings.
Component label. For listboxes and pop-up menus it isa list of the items.
Units characters, centimeters,inches, normalized,pixels, points. Default ischaracters.
Units of measurement usedto interpret the Positionproperty vector
Value Scalar or vector Value of the component.Interpretation depends on thetype of component.
For a complete list of properties and for more information about the properties listed inthe table, see Uicontrol Properties.
Push Button
To create a push button with label Button 1, as shown in this figure:

6 Lay Out a GUIDE GUI
6-26
• Specify the push button label by setting the String property to the desired label, inthis case, Button 1.
To display the & character in a label, use two & characters in the string. The wordsremove, default, and factory (case sensitive) are reserved. To use one of these as alabel, prepend a backslash (\) to the string. For example, \remove yields remove.
The push button accommodates only a single line of text. If you specify more thanone line, only the first line is shown. If you create a push button that is too narrow toaccommodate the specified String, MATLAB software truncates the string with anellipsis.
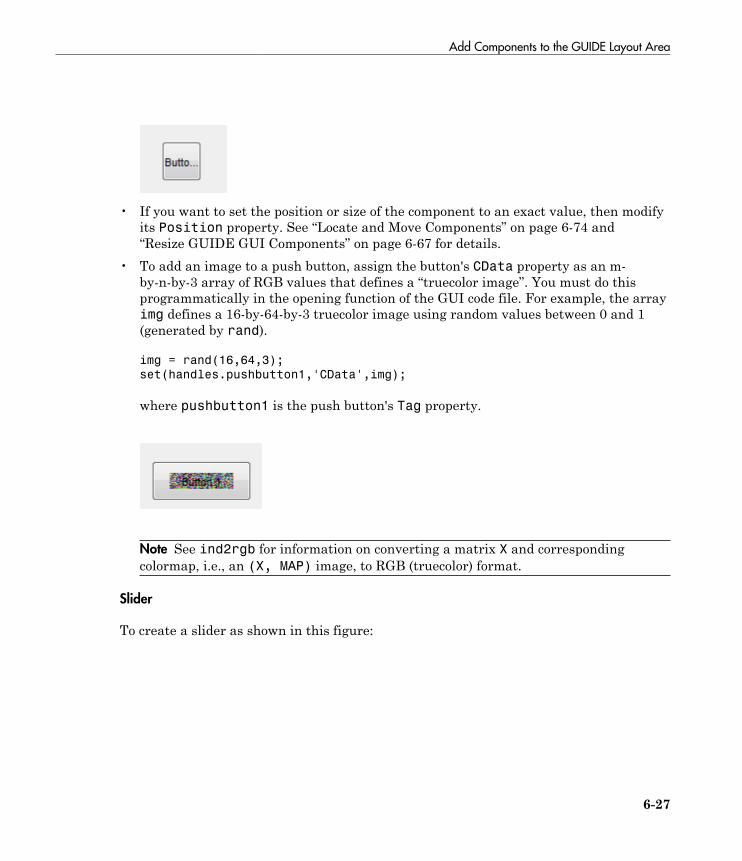
Add Components to the GUIDE Layout Area
6-27
• If you want to set the position or size of the component to an exact value, then modifyits Position property. See “Locate and Move Components” on page 6-74 and“Resize GUIDE GUI Components” on page 6-67 for details.
• To add an image to a push button, assign the button's CData property as an m-by-n-by-3 array of RGB values that defines a “truecolor image”. You must do thisprogrammatically in the opening function of the GUI code file. For example, the arrayimg defines a 16-by-64-by-3 truecolor image using random values between 0 and 1(generated by rand).
img = rand(16,64,3);
set(handles.pushbutton1,'CData',img);
where pushbutton1 is the push button's Tag property.
Note See ind2rgb for information on converting a matrix X and correspondingcolormap, i.e., an (X, MAP) image, to RGB (truecolor) format.
Slider
To create a slider as shown in this figure:

6 Lay Out a GUIDE GUI
6-28
• Specify the range of the slider by setting its Min property to the minimum value ofthe slider and its Max property to the maximum value. The Min property must be lessthan Max.
• Specify the value indicated by the slider when it is created by setting the Valueproperty to the appropriate number. This number must be less than or equal to Maxand greater than or equal to Min. If you specify Value outside the specified range, theslider is not displayed.
• The slider Value changes by a small amount when a user clicks the arrow button,and changes by a larger amount when the user clicks the trough (also calledthe channel). Control how the slider responds to these actions by setting theSliderStep property. Specify SliderStep as a two-element vector, [minor_stepmajor_step], where minor_step is less than or equal to major_step. Becausespecifying very small values can cause unpredictable slider behavior, make bothminor_step and major_step greater than 1e-6. Set major_step to the proportionof the range that clicking the trough moves the slider thumb. Setting it to 1 or highercauses the thumb to move to Max or Min when the trough is clicked.
As major_step increases, the thumb grows longer. When major_step is 1, thethumb is half as long as the trough. When major_step is greater than 1, thethumb continues to grow, slowly approaching the full length of the trough. When aslider serves as a scroll bar, you can uses this behavior to indicate how much of thedocument is currently visible by changing the value of major_step.

Add Components to the GUIDE Layout Area
6-29
• If you want to set the location or size of the component to an exact value, then modifyits Position property. See “Locate and Move Components” on page 6-74 and“Resize GUIDE GUI Components” on page 6-67 for details.
The slider component provides no text description or data entry capability. Use a“Static Text” on page 6-34 component to label the slider. Use an “Edit Text” onpage 6-32 component to enable a user to input a value to apply to the slider.
Note: On Mac platforms, the height of a horizontal slider is constrained. If the heightyou set in the position vector exceeds this constraint, the displayed height of the slideris the maximum allowed. The height element of the position vector is not changed.
Radio Button
To create a radio button with label Indent nested functions, as shown in this figure:
• Specify the radio button label by setting the String property to the desired label, inthis case, Indent nested functions.

6 Lay Out a GUIDE GUI
6-30
To display the & character in a label, use two & characters in the string. The wordsremove, default, and factory (case sensitive) are reserved. To use one of these as alabel, prepend a backslash (\) to the string. For example, \remove yields remove.
The radio button accommodates only a single line of text. If you specify more thanone line, only the first line is shown. If you create a radio button that is too narrow toaccommodate the specified String, MATLAB software truncates the string with anellipsis.
• Create the radio button with the button selected by setting its Value property to thevalue of its Max property (default is 1). Set Value to Min (default is 0) to leave theradio button unselected. Correspondingly, when the user selects the radio button, thesoftware sets Value to Max, and to Min when the user deselects it.
• If you want to set the position or size of the component to an exact value, then modifyits Position property. See “Locate and Move Components” on page 6-74 and“Resize GUIDE GUI Components” on page 6-67 for details.
• To add an image to a radio button, assign the button's CData property an m-by-n-by-3 array of RGB values that defines a “truecolor image”. You must do thisprogrammatically in the opening function of the GUI code file. For example, the arrayimg defines a 16-by-24-by-3 truecolor image using random values between 0 and 1(generated by rand).
img = rand(16,24,3);
set(handles.radiobutton1,'CData',img);

Add Components to the GUIDE Layout Area
6-31
Note To manage exclusive selection of radio buttons and toggle buttons, put them in abutton group. See “Button Group” on page 6-48 for more information.
Check Box
To create a check box with label Display file extension that is initially checked, asshown in this figure:
• Specify the check box label by setting the String property to the desired label, in thiscase, Display file extension.
To display the & character in a label, use two & characters in the string. The wordsremove, default, and factory (case sensitive) are reserved. To use one of these as alabel, prepend a backslash (\) to the string. For example, \remove yields remove.
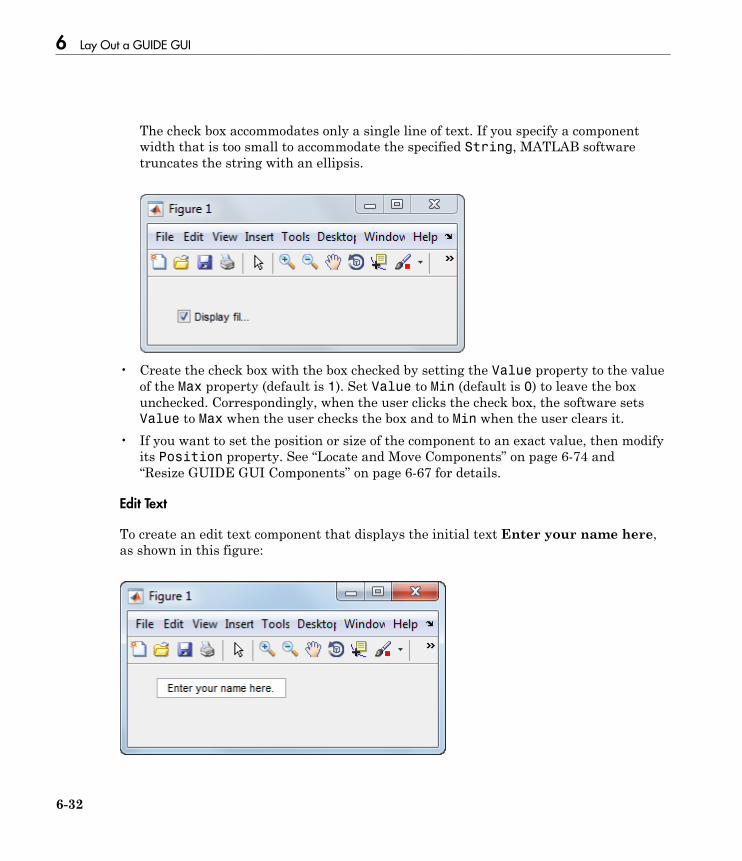
6 Lay Out a GUIDE GUI
6-32
The check box accommodates only a single line of text. If you specify a componentwidth that is too small to accommodate the specified String, MATLAB softwaretruncates the string with an ellipsis.
• Create the check box with the box checked by setting the Value property to the valueof the Max property (default is 1). Set Value to Min (default is 0) to leave the boxunchecked. Correspondingly, when the user clicks the check box, the software setsValue to Max when the user checks the box and to Min when the user clears it.
• If you want to set the position or size of the component to an exact value, then modifyits Position property. See “Locate and Move Components” on page 6-74 and“Resize GUIDE GUI Components” on page 6-67 for details.
Edit Text
To create an edit text component that displays the initial text Enter your name here,as shown in this figure:
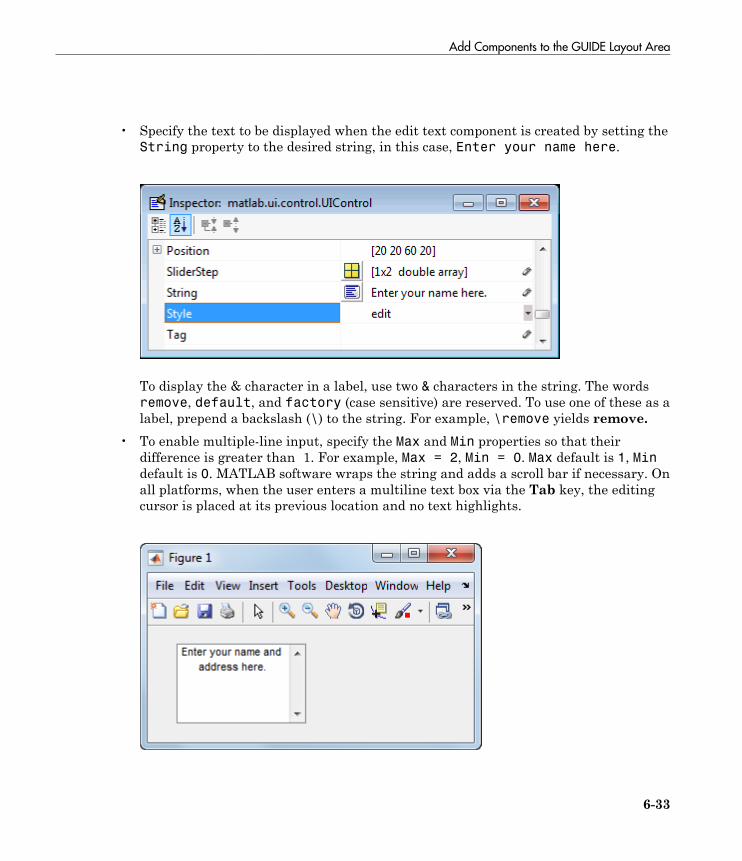
Add Components to the GUIDE Layout Area
6-33
• Specify the text to be displayed when the edit text component is created by setting theString property to the desired string, in this case, Enter your name here.
To display the & character in a label, use two & characters in the string. The wordsremove, default, and factory (case sensitive) are reserved. To use one of these as alabel, prepend a backslash (\) to the string. For example, \remove yields remove.
• To enable multiple-line input, specify the Max and Min properties so that theirdifference is greater than 1. For example, Max = 2, Min = 0. Max default is 1, Mindefault is 0. MATLAB software wraps the string and adds a scroll bar if necessary. Onall platforms, when the user enters a multiline text box via the Tab key, the editingcursor is placed at its previous location and no text highlights.

6 Lay Out a GUIDE GUI
6-34
If Max-Min is less than or equal to 1, the edit text component admits only a singleline of input. If you specify a component width that is too small to accommodate thespecified string, MATLAB software displays only part of the string. The user canuse the arrow keys to move the cursor through the entire string. On all platforms,when the user enters a single-line text box via the Tab key, the entire contents ishighlighted and the editing cursor is at the end (right side) of the string.
• If you want to set the position or size of the component to an exact value, then modifyits Position property. See “Locate and Move Components” on page 6-74 and“Resize GUIDE GUI Components” on page 6-67 for details.
• You specify the text font to display in the edit box by typing the name of a fontresiding on your system into the FontName entry in the Property Inspector. OnMicrosoft Windows platforms, the default is MS Sans Serif; on Macintosh andUNIX® platforms, the default is Helvetica.
Tip To find out what fonts are available, type uisetfont at the MATLAB prompt; adialog displays containing a list box from which you can select and preview availablefonts. When you select a font, its name and other characteristics are returned ina structure, from which you can copy the FontName string and paste it into theProperty Inspector. Not all fonts listed may be available to users of your GUI on theirsystems.
Static Text
To create a static text component with text Select a data set, as shown in this figure:

Add Components to the GUIDE Layout Area
6-35
• Specify the text that appears in the component by setting the component Stringproperty to the desired text, in this case Select a data set.
To display the & character in a list item, use two & characters in the string. Thewords remove, default, and factory (case sensitive) are reserved. To use one ofthese as a label, prepend a backslash (\) to the string. For example, \remove yieldsremove.
If your component is not wide enough to accommodate the specified String,MATLAB software wraps the string.

6 Lay Out a GUIDE GUI
6-36
• If you want to set the position or size of the component to an exact value, then modifyits Position property. See “Locate and Move Components” on page 6-74 and“Resize GUIDE GUI Components” on page 6-67 for details.
• You can specify a text font, including its FontName, FontWeight, FontAngle,FontSize, and FontUnits properties. For details, see the previous topic, “EditText” on page 6-32, and for a programmatic approach, the section “Setting FontCharacteristics” on page 10-14.
Pop-Up Menu
To create a pop-up menu (also known as a drop-down menu or combo box) with itemsone, two, three, and four, as shown in this figure:
• Specify the pop-up menu items to be displayed by setting the String property to thedesired items. Click the

Add Components to the GUIDE Layout Area
6-37
button to the right of the property name to open the Property Inspector editor.
To display the & character in a menu item, use two & characters in the string. Thewords remove, default, and factory (case sensitive) are reserved. To use one ofthese as a label, prepend a backslash (\) to the string. For example, \remove yieldsremove.
If the width of the component is too small to accommodate one or more of the specifiedstrings, MATLAB software truncates those strings with an ellipsis.
• To select an item when the component is created, set Value to a scalar that indicatesthe index of the selected list item, where 1 corresponds to the first item in the list. Ifyou set Value to 2, the menu looks like this when it is created:

6 Lay Out a GUIDE GUI
6-38
• If you want to set the position and size of the component to exact values, then modifyits Position property. See “Locate and Move Components” on page 6-74 and“Resize GUIDE GUI Components” on page 6-67 for details. The height of a pop-up menu is determined by the font size. The height you set in the position vector isignored.
Note The pop-up menu does not provide for a label. Use a “Static Text” on page6-34 component to label the pop-up menu.
List Box
To create a list box with items one, two, three, and four, as shown in this figure:

Add Components to the GUIDE Layout Area
6-39
• Specify the list of items to be displayed by setting the String property to the desiredlist. Use the Property Inspector editor to enter the list. You can open the editor by
clicking the button to the right of the property name.

6 Lay Out a GUIDE GUI
6-40
To display the & character in a label, use two & characters in the string. The wordsremove, default, and factory (case sensitive) are reserved. To use one of these as alabel, prepend a backslash (\) to the string. For example, \remove yields remove.
If the width of the component is too small to accommodate one or more of the specifiedstrings, MATLAB software truncates those strings with an ellipsis.
• Specify selection by using the Value property together with the Max and Minproperties.
• To select a single item when the component is created, set Value to a scalar thatindicates the index of the selected list item, where 1 corresponds to the first itemin the list.
• To select more than one item when the component is created, set Value to a vectorof indices of the selected items. Value = [1,3] results in the following selection.

Add Components to the GUIDE Layout Area
6-41
To enable selection of more than one item, you must specify the Max and Minproperties so that their difference is greater than 1. For example, Max = 2, Min= 0. Max default is 1, Min default is 0.
• If you want no initial selection, set the Max and Min properties to enable multipleselection, i.e., Max - Min > 1, and then set the Value property to an emptymatrix [].
• If the list box is not large enough to display all list entries, you can set theListBoxTop property to the index of the item you want to appear at the top when thecomponent is created.
• If you want to set the position or size of the component to an exact value, then modifyits Position property. See “Locate and Move Components” on page 6-74and“Resize GUIDE GUI Components” on page 6-67 for details.
Note The list box does not provide for a label. Use a “Static Text” on page 6-34component to label the list box.
Toggle Button
To create a toggle button with label Left/Right Tile, as shown in this figure:

6 Lay Out a GUIDE GUI
6-42
• Specify the toggle button label by setting its String property to the desired label, inthis case, Left/Right Tile.
To display the & character in a label, use two & characters in the string. The wordsremove, default, and factory (case sensitive) are reserved. To use one of these as alabel, prepend a backslash (\) to the string. For example, \remove yields remove.
The toggle button accommodates only a single line of text. If you specify more thanone line, only the first line is shown. If you create a toggle button that is too narrow toaccommodate the specified String, MATLAB software truncates the string with anellipsis.

Add Components to the GUIDE Layout Area
6-43
• Create the toggle button with the button selected (depressed) by setting its Valueproperty to the value of its Max property (default is 1). Set Value to Min (default is 0)to leave the toggle button unselected (raised). Correspondingly, when the user selectsthe toggle button, MATLAB software sets Value to Max, and to Min when the userdeselects it. The following figure shows the toggle button in the depressed position.
• If you want to set the position or size of the component to an exact value, then modifyits Position property. See “Locate and Move Components” on page 6-74 and“Resize GUIDE GUI Components” on page 6-67 for details.
• To add an image to a toggle button, assign the button's CData property an m-by-n-by-3 array of RGB values that defines a “truecolor image”. You must do thisprogrammatically in the opening function of the GUI code file. For example, the arrayimg defines a 16-by-64-by-3 truecolor image using random values between 0 and 1(generated by rand).
img = rand(16,64,3);
set(handles.togglebutton1,'CData',img);
where togglebutton1 is the toggle button's Tag property.

6 Lay Out a GUIDE GUI
6-44
Note To manage exclusive selection of radio buttons and toggle buttons, put them in abutton group. See “Button Group” on page 6-48 for more information.
Panels and Button Groups
Panels and button groups are containers that arrange GUI components into groups.If you move the panel or button group, its children move with it and maintain theirpositions relative to the panel or button group.
To define panels and button groups, you must set certain properties. To do this:
1 Use the Property Inspector to modify the appropriate properties. Open the PropertyInspector by selecting View > Property Inspector or by clicking the PropertyInspector button .
2 In the layout area, select the component you are defining.
Note See “GUIDE Components” on page 6-13 for descriptions of these components.See “Callbacks for Specific Components” on page 8-12 for basic examples ofprogramming these components.
Subsequent topics describe commonly used properties of panels and button groups andoffer a simple example for each component.
• “Commonly Used Properties” on page 6-44• “Panel” on page 6-45• “Button Group” on page 6-48
Commonly Used Properties
The most commonly used properties needed to describe a panel or button group areshown in the following table:
Property Values Description
Position 4-element vector: [distancefrom left, distance frombottom, width, height].
Size of the component andits location relative to itsparent.

Add Components to the GUIDE Layout Area
6-45
Property Values Description
Title String Component label.TitlePosition lefttop, centertop,
righttop, leftbottom,centerbottom,rightbottom. Default islefttop.
Location of title string inrelation to the panel orbutton group.
Units characters,centimeters, inches,normalized, pixels,points. Default ischaracters.
Units of measurement usedto interpret the Positionproperty vector
For a complete list of properties and for more information about the properties listed inthe table, see the Uipanel Properties and Uibuttongroup Properties.
Panel
To create a panel with title My Panel as shown in the following figure:
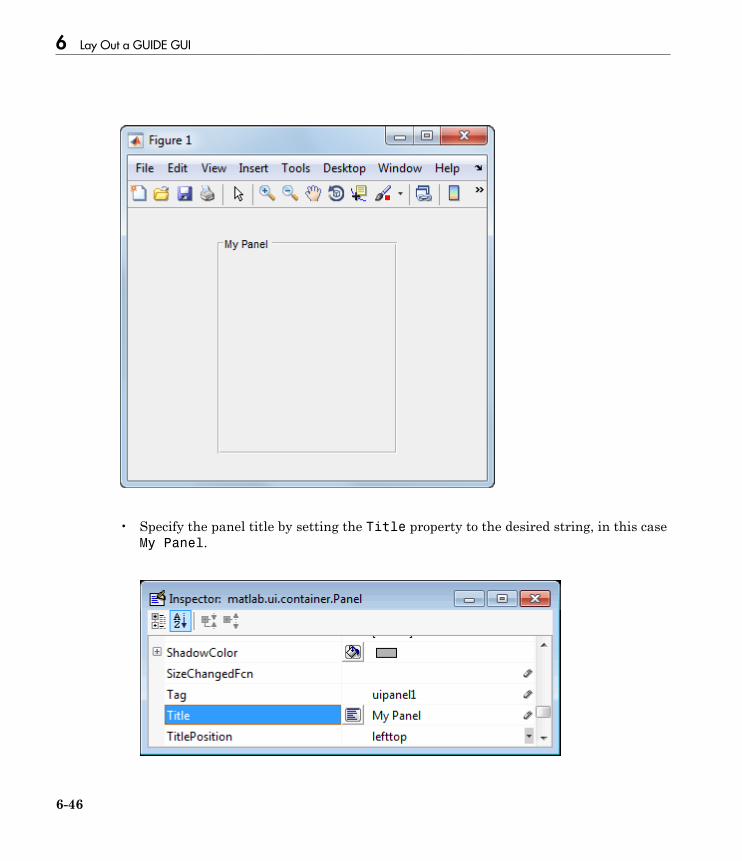
6 Lay Out a GUIDE GUI
6-46
• Specify the panel title by setting the Title property to the desired string, in this caseMy Panel.

Add Components to the GUIDE Layout Area
6-47
To display the & character in the title, use two & characters in the string. The wordsremove, default, and factory (case sensitive) are reserved. To use one of these as alabel, prepend a backslash (\) to the string. For example, \remove yields remove.
• Specify the location of the panel title by selecting one of the availableTitlePosition property values from the pop-up menu, in this case lefttop. Youcan position the title at the left, middle, or right of the top or bottom of the panel.
• If you want to set the position or size of the panel to an exact value, then modify itsPosition property. See “Locate and Move Components” on page 6-74 and “ResizeGUIDE GUI Components” on page 6-67 for details.
Note For more information and additional tips and techniques, see “Add a Componentto a Panel or Button Group” on page 6-20 and the uipanel documentation.

6 Lay Out a GUIDE GUI
6-48
Button Group
To create a button group with title My Button Group as shown in the following figure:
• Specify the button group title by setting the Title property to the desired string, inthis case My Button Group.

Add Components to the GUIDE Layout Area
6-49
To display the & character in the title, use two & characters in the string. The wordsremove, default, and factory (case sensitive) are reserved. To use one of these as alabel, prepend a backslash (\) to the string. For example, \remove yields remove.
• Specify the location of the button group title by selecting one of the availableTitlePosition property values from the pop-up menu, in this case lefttop. Youcan position the title at the left, middle, or right of the top or bottom of the buttongroup.

6 Lay Out a GUIDE GUI
6-50
• If you want to set the position or size of the button group to an exact value, thenmodify its Position property. See “Locate and Move Components” on page 6-74and “Resize GUIDE GUI Components” on page 6-67 for details.
Note For more information and additional tips and techniques, see “Add aComponent to a Panel or Button Group” on page 6-20 and the uibuttongroupdocumentation.
Axes
Axes enable your GUI to display graphics such as graphs and images using commandssuch as: plot, surf, line, bar, polar, pie, contour, and mesh.
To define an axes, you must set certain properties. To do this:
1 Use the Property Inspector to modify the appropriate properties. Open the PropertyInspector by selecting View > Property Inspector or by clicking the PropertyInspector button .
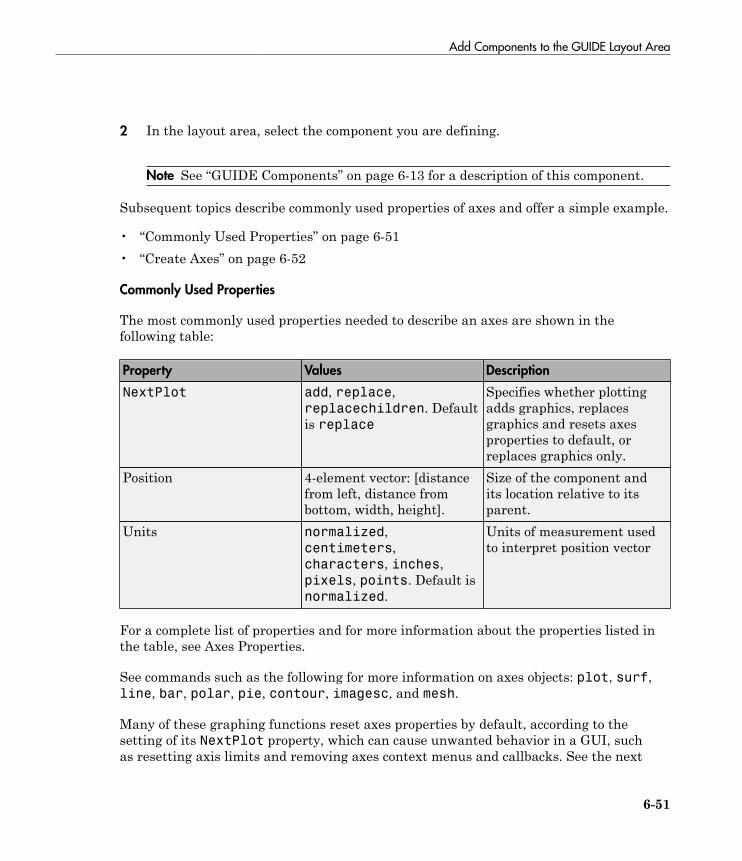
Add Components to the GUIDE Layout Area
6-51
2 In the layout area, select the component you are defining.
Note See “GUIDE Components” on page 6-13 for a description of this component.
Subsequent topics describe commonly used properties of axes and offer a simple example.
• “Commonly Used Properties” on page 6-51• “Create Axes” on page 6-52
Commonly Used Properties
The most commonly used properties needed to describe an axes are shown in thefollowing table:
Property Values Description
NextPlot add, replace,replacechildren. Defaultis replace
Specifies whether plottingadds graphics, replacesgraphics and resets axesproperties to default, orreplaces graphics only.
Position 4-element vector: [distancefrom left, distance frombottom, width, height].
Size of the component andits location relative to itsparent.
Units normalized,centimeters,characters, inches,pixels, points. Default isnormalized.
Units of measurement usedto interpret position vector
For a complete list of properties and for more information about the properties listed inthe table, see Axes Properties.
See commands such as the following for more information on axes objects: plot, surf,line, bar, polar, pie, contour, imagesc, and mesh.
Many of these graphing functions reset axes properties by default, according to thesetting of its NextPlot property, which can cause unwanted behavior in a GUI, suchas resetting axis limits and removing axes context menus and callbacks. See the next
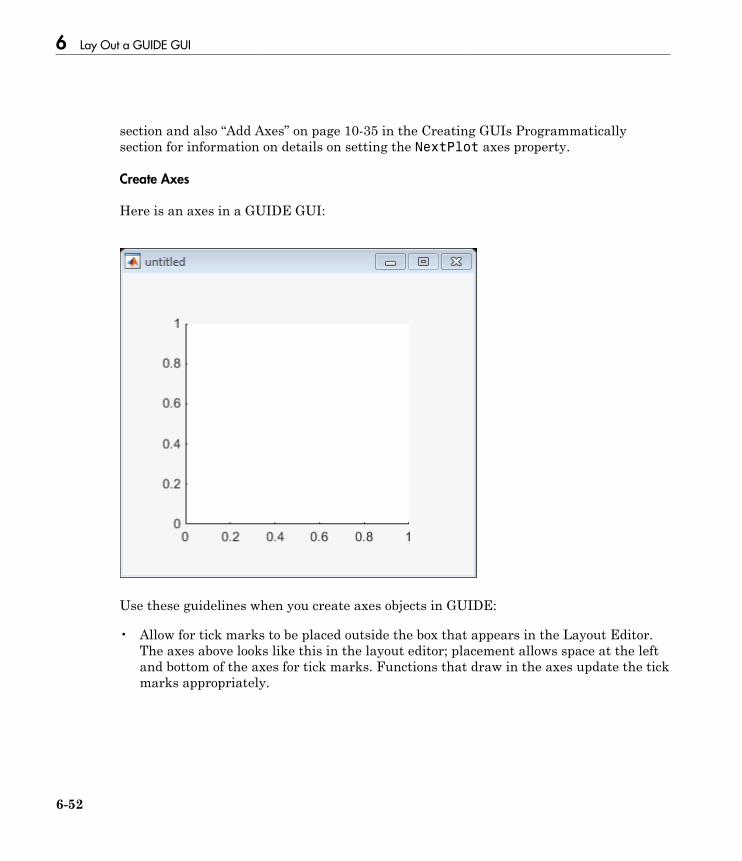
6 Lay Out a GUIDE GUI
6-52
section and also “Add Axes” on page 10-35 in the Creating GUIs Programmaticallysection for information on details on setting the NextPlot axes property.
Create Axes
Here is an axes in a GUIDE GUI:
Use these guidelines when you create axes objects in GUIDE:
• Allow for tick marks to be placed outside the box that appears in the Layout Editor.The axes above looks like this in the layout editor; placement allows space at the leftand bottom of the axes for tick marks. Functions that draw in the axes update the tickmarks appropriately.

Add Components to the GUIDE Layout Area
6-53
• Use the title, xlabel, ylabel, zlabel, and text functions in the GUI code file tolabel an axes component. For example,
xlh = (axes_handle,'Years')
labels the X-axis as Years. The handle of the X-axis label is xlh.
The words remove, default, and factory (case sensitive) are reserved. To useone of these in component text, prepend a backslash (\) to the string. For example,\remove yields remove.

6 Lay Out a GUIDE GUI
6-54
• If you want to set the position or size of the axes to an exact value, then modify itsPosition property. See “Locate and Move Components” on page 6-74 and “ResizeGUIDE GUI Components” on page 6-67 for details.
• If you customize axes properties, some of them (or example, callbacks, fontcharacteristics, and axis limits and ticks) may get reset to default every time youdraw a graph into the axes when the NextPlot property has its default value of'replace'. To keep customized properties as you want them, set NextPlot to'replacechildren' in the Property Inspector, as shown here.
Table
Tables enable you to display data in a two dimensional table. You can use the PropertyInspector to get and set the object property values.
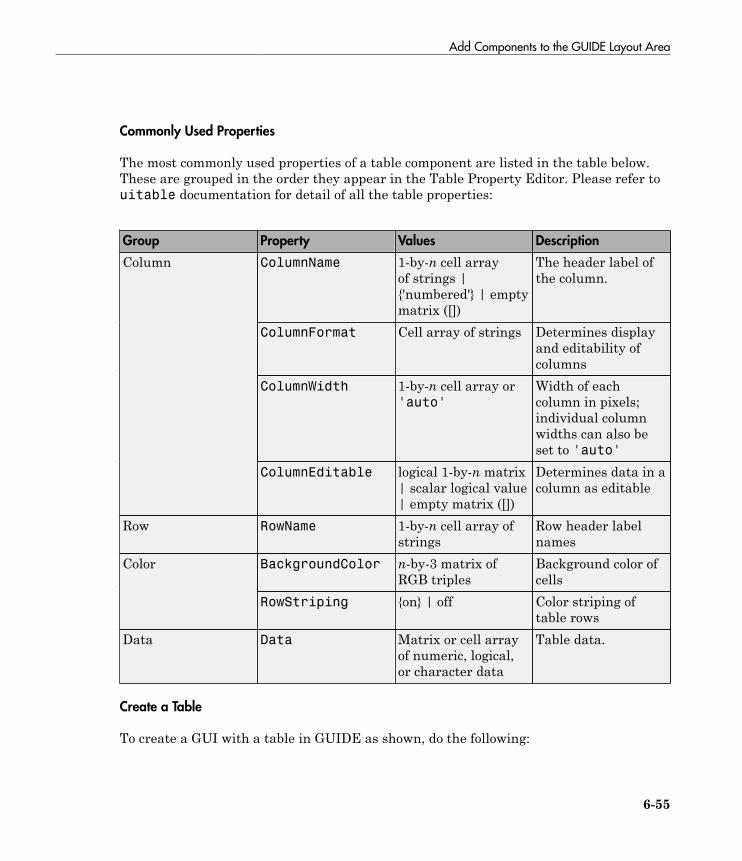
Add Components to the GUIDE Layout Area
6-55
Commonly Used Properties
The most commonly used properties of a table component are listed in the table below.These are grouped in the order they appear in the Table Property Editor. Please refer touitable documentation for detail of all the table properties:
Group Property Values Description
ColumnName 1-by-n cell arrayof strings |{'numbered'} | emptymatrix ([])
The header label ofthe column.
ColumnFormat Cell array of strings Determines displayand editability ofcolumns
ColumnWidth 1-by-n cell array or'auto'
Width of eachcolumn in pixels;individual columnwidths can also beset to 'auto'
Column
ColumnEditable logical 1-by-n matrix| scalar logical value| empty matrix ([])
Determines data in acolumn as editable
Row RowName 1-by-n cell array ofstrings
Row header labelnames
BackgroundColor n-by-3 matrix ofRGB triples
Background color ofcells
Color
RowStriping {on} | off Color striping oftable rows
Data Data Matrix or cell arrayof numeric, logical,or character data
Table data.
Create a Table
To create a GUI with a table in GUIDE as shown, do the following:

6 Lay Out a GUIDE GUI
6-56
Drag the table icon on to the Layout Editor and right click in the table. From the table’scontext menu, select Table Property Editor. You can also select Table PropertyEditor from the Tools menu when you select a table by itself.

Add Components to the GUIDE Layout Area
6-57
Use the Table Property Editor
When you open it this way, the Table Property Editor displays the Column pane. Youcan also open it from the Property Inspector by clicking one of its Table Property Editor
icons , in which case the Table Property Editor opens to display the pane appropriatefor the property you clicked.
Clicking items in the list on the left hand side of the Table Property Editor changes thecontents of the pane to the right . Use the items to activate controls for specifying thetable's Columns, Rows, Data, and Color options.
The Columns and Rows panes each have a data entry area where you can type namesand set properties. on a per-column or per-row basis. You can edit only one row or column

6 Lay Out a GUIDE GUI
6-58
definition at a time. These panes contain a vertical group of five buttons for editing andnavigating:
Button Purpose Accelerator Keys
Windows Macintosh
Insert Inserts a new column or row definitionentry below the current one
Insert Insert
Delete Deletes the current column or rowdefinition entry (no undo)
Ctrl+D Cmd+D
Copy Inserts a Copy of the selected entry in anew row below it
Ctrl+P Cmd+P
Up Moves selected entry up one row Ctrl+uparrow
Cmd+uparrow
Down Moves selected entry down one row Ctrl+downarrow
Cmd+downarrow
Keyboard equivalents only operate when the cursor is in the data entry area. In additionto those listed above, typing Ctrl+T or Cmd+T selects the entire field containing thecursor for editing (if the field contains text).
To save changes to the table you make in the Table Property Editor, click OK, or clickApply commit changes and keep on using the Table Property Editor.
Set Column Properties
Click Insert to add two more columns.

Add Components to the GUIDE Layout Area
6-59
Select Show names entered below as the column headers and set the ColumnNameby entering Rate, Amount, Available, and Fixed/Adj in Name group. for the Availableand Fixed/Adj columns set the ColumnEditable property to on. Lastly set theColumnFormat for the four columns

6 Lay Out a GUIDE GUI
6-60
For the Rate column, select Numeric. For the Amount Column select Custom and in theCustom Format Editor, choose Bank.

Add Components to the GUIDE Layout Area
6-61
Leave the Available column at the default value. This allows MATLAB to chose basedon the value of the Data property of the table. For the Fixed/Adj column select ChoiceList to create a pop-up menu. In the Choice List Editor, click Insert to add a secondchoice and type Fixed and Adjustable as the 2 choices.

6 Lay Out a GUIDE GUI
6-62
Note: For a user to select items from a choice list, the ColumnEditable property of thecolumn that the list occupies must be set to 'true'. The pop-up control only appearswhen the column is editable.
Set Row Properties
In the Row tab, leave the default RowName, Show numbered row headers.

Add Components to the GUIDE Layout Area
6-63
Set Data Properties
Use the Data property to specify the data in the table. Create the data in the commandwindow before you specify it in GUIDE. For this example, type:
dat = {6.125, 456.3457, true, 'Fixed';...
6.75, 510.2342, false, 'Adjustable';...
7, 658.2, false, 'Fixed';};
In the Table Property Editor, select the data that you defined and select Change datavalue to the selected workspace variable below.
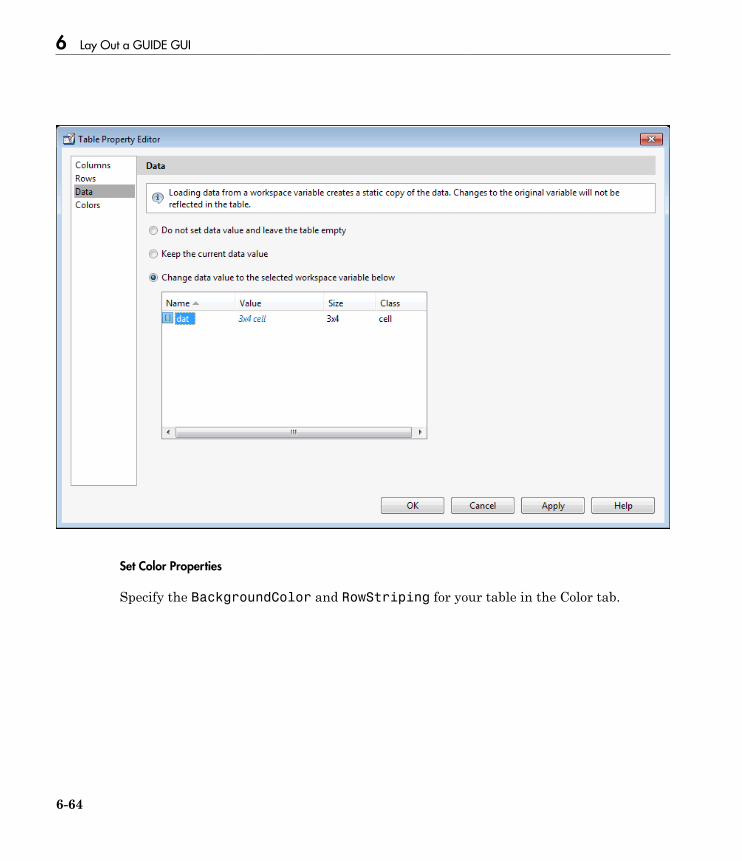
6 Lay Out a GUIDE GUI
6-64
Set Color Properties
Specify the BackgroundColor and RowStriping for your table in the Color tab.

Add Components to the GUIDE Layout Area
6-65
You can change other uitable properties to the table via the Property Inspector.
ActiveX Component
When you drag an ActiveX component from the component palette into the layout area,GUIDE opens a dialog box, similar to the following, that lists the registered ActiveXcontrols on your system.
Note If MATLAB software is not installed locally on your computer — for example, ifyou are running the software over a network — you might not find the ActiveX controldescribed in this example. To register the control, see “Registering Controls and Servers”.

6 Lay Out a GUIDE GUI
6-66
1 Select the desired ActiveX control. The right panel shows a preview of the selectedcontrol.
2 Click Create. The control appears as a small box in the Layout Editor.3 Resize the control to approximately the size of the square shown in the preview pane.
You can do this by clicking and dragging a corner of the control, as shown in thefollowing figure.

Add Components to the GUIDE Layout Area
6-67
When you select an ActiveX control, you can open the ActiveX Property Editor by right-clicking and selecting ActiveX Property Editor from the context menu or clicking theTools menu and selecting it from there.
Note: What an ActiveX Property Editor contains and looks like is dependent on whatuser controls that the authors of the particular ActiveX object have created and storedin the GUI for the object. In some cases, a GUI without controls or no GUI at all appearswhen you select this menu item.
Resize GUIDE GUI Components
You can resize components in one of the following ways:
• “Drag a Corner of the Component” on page 6-67• “Set the Component's Position Property” on page 6-68
Drag a Corner of the Component
Select the component you want to resize. Click one of the corner handles and drag it untilthe component is the desired size.

6 Lay Out a GUIDE GUI
6-68
Set the Component's Position Property
Select one or more components that you want to resize. Then select View > PropertyInspectoror click the Property Inspector button .
1 In the Property Inspector, scroll to the Units property and note whether the currentsetting is characters or normalized. Click the button next to Units and thenchange the setting to inches from the pop-up menu.

Add Components to the GUIDE Layout Area
6-69
2 Click the + sign next to Position. The Property Inspector displays the elements ofthe Position property.
3 Type the width and height you want the components to be.4 Reset the Units property to its previous setting, either characters or
normalized.
Note To select multiple components, they must have the same parent. That is, they mustbe contained in the same figure, panel, or button group. See “Select Components” on page6-70 for more information. Setting the Units property to characters (nonresizableGUIs) or normalized (resizable GUIs) gives the GUI a more consistent appearanceacross platforms. See “Cross-Platform Compatible Units” on page 6-121 for moreinformation.

6 Lay Out a GUIDE GUI
6-70
Copy, Paste, and Arrange Components
This topic provides basic information about selecting, copying, pasting, and deletingcomponents in the layout area.
In this section...
“Select Components” on page 6-70“Copy, Cut, and Clear Components” on page 6-71“Paste and Duplicate Components” on page 6-71“Front-to-Back Positioning” on page 6-72
Select Components
You can select components in the layout area in the following ways:
• Click a single component to select it.• Press Ctrl+A to select all child objects of the figure. This does not select components
that are child objects of panels or button groups.• Click and drag the cursor to create a rectangle that encloses the components you want
to select. If the rectangle encloses a panel or button group, only the panel or buttongroup is selected, not its children. If the rectangle encloses part of a panel or buttongroup, only the components within the rectangle that are child objects of the panel orbutton group are selected.
• Select multiple components using the Shift and Ctrl keys.
In some cases, a component may lie outside its parent's boundary. Such a component isnot visible in the Layout Editor but can be selected by dragging a rectangle that enclosesit or by selecting it in the Object Browser. Such a component is visible in the active GUI.
See “View the GUIDE GUI Object Hierarchy” on page 6-119 for information about theObject Browser.
Note You can select multiple components only if they have the same parent. Todetermine the child objects of a figure, panel, or button group, use the Object Browser.
Copy, Paste, and Arrange Components
6-71
Copy, Cut, and Clear Components
Use standard menu and pop-up menu commands, toolbar icons, keyboard keys, andshortcut keys to copy, cut, and clear components.
Copy
Copying places a copy of the selected components on the clipboard. A copy of a panel orbutton group includes its children.
Cut
Cutting places a copy of the selected components on the clipboard and deletes them fromthe layout area. If you cut a panel or button group, you also cut its children.
Clear
Clearing deletes the selected components from the layout area. It does not place a copy ofthe components on the clipboard. If you clear a panel or button group, you also clear itschildren.
Paste and Duplicate Components
Paste
Use standard menu and pop-up menu commands, toolbar icons, and shortcut keys topaste components. GUIDE pastes the contents of the clipboard to the location of the lastmouse click. It positions the upper-left corner of the contents at the mouse click.
Consecutive pastes place each copy to the lower right of the last one.
Duplicate
Select one or more components that you want to duplicate, then do one of the following:
• Copy and paste the selected components as described above.• Select Edit > Duplicate. Duplicate places the copy to the lower right of the original.• Right-click and drag the component to the desired location. The position of the cursor
when you drop the components determines the parent of all the selected components.

6 Lay Out a GUIDE GUI
6-72
Look for the highlight as described in “Add a Component to a Panel or Button Group”on page 6-20.
Front-to-Back Positioning
You can group components inside of panels and button groups. Doing so can enhance theappearance of your GUI and make it easier to navigate.
Use the Object Browser to control the front-to-back order, or stacking order, of panels,button groups, and the components they contain:
1 Select View > Object Browser.2 In the layout, select the component you want to appear on top and move it slightly
over the component you want to appear behind it. Moving a component slightly overanother one makes the top component become a child of the one behind it. Noticethat the listing of components in the Object Browser changes when you do this. Thecomponent you move to the top in the layout becomes indented and is listed belowthe component that is behind it. This reflects the new parent and child order.
For example, selecting and moving this button slightly over the panel ensures that itappears on top of the panel in the GUI.
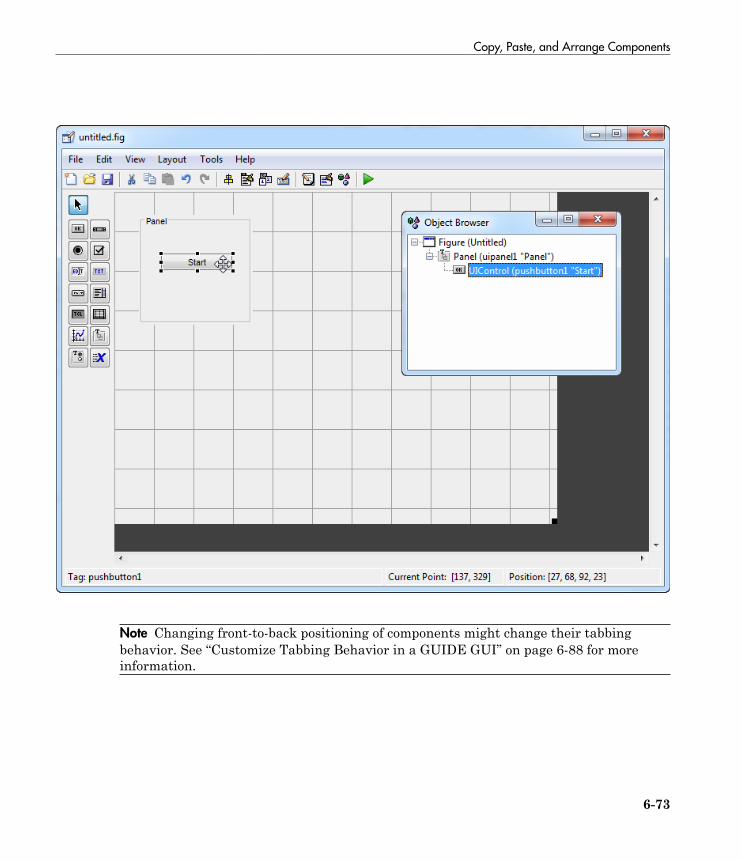
Copy, Paste, and Arrange Components
6-73
Note Changing front-to-back positioning of components might change their tabbingbehavior. See “Customize Tabbing Behavior in a GUIDE GUI” on page 6-88 for moreinformation.
6 Lay Out a GUIDE GUI
6-74
Locate and Move Components
You can locate or move components in one of the following ways:
In this section...
“Use Coordinate Readouts” on page 6-74“Drag Components” on page 6-75“Use Arrow Keys to Move Components” on page 6-76“Set the Component's Position Property” on page 6-76
Another topic that may be of interest is
• “Align GUIDE GUI Components” on page 6-79
Use Coordinate Readouts
Coordinate readouts indicate where a component is placed and where the mouse pointeris located. Use these readouts to position and align components manually. The Positionreadout shows the position of the selected component as the vector, [x y widthheight]. These values are displayed in units of pixels, regardless of the coordinate unitsyou select for the component.
The Current Point readout displays the current mouse position in pixels.
The size of this push button is 101-by-38 pixels. The lower left corner of the button islocated at x,y = (50,260). The mouse pointer is located at x,y = (156,255).

Locate and Move Components
6-75
When you select multiple components, the Position readout displays numbers for x, y,width and height only if the objects have the same respective values; in all other casesit displays 'MULTI'.
Drag Components
Select one or more components that you want to move, then drag them to the desiredposition and drop them. You can move components from the figure into a panel or buttongroup. You can move components from a panel or button group into the figure or intoanother panel or button group.
The position of the cursor when you drop the components also determines the parent ofall the selected components. Look for the highlight as described in “Add a Component toa Panel or Button Group” on page 6-20.

6 Lay Out a GUIDE GUI
6-76
In some cases, one or more of the selected components may lie outside its parent'sboundary. Such a component is not visible in the Layout Editor but can be selected bydragging a rectangle that encloses it or by selecting it in the Object Browser. Such acomponent is visible in the active GUI.
See “View the GUIDE GUI Object Hierarchy” on page 6-119 for information about theObject Browser.
Note To select multiple components, they must have the same parent. That is, they mustbe contained in the same figure, panel, or button group.
Use Arrow Keys to Move Components
Select one or more components that you want to move, then press and hold the arrowkeys until the components have moved to the desired position. Note that the componentsremain children of the figure, panel, or button group from which you move them, even ifthey move outside its boundaries.
Set the Component's Position Property
Select one or more components that you want to move. Then open the Property Inspectorfrom the View menu or by clicking the Property Inspector button .
1 In the Property Inspector, scroll to the Units property and note whether the currentsetting is characters or normalized. Click the button next to Units and thenchange the setting to inches from the pop-up menu.

Locate and Move Components
6-77
2 Click the + sign next to Position. The Property Inspector displays the elements ofthe Position property.

6 Lay Out a GUIDE GUI
6-78
3 If you have selected
• Only one component, type the x and y coordinates of the point where you wantthe lower-left corner of the component to appear.
• More than one component, type either the x or the y coordinate to align thecomponents along that dimension.
4 Reset the Units property to its previous setting, either characters ornormalized.
Note Setting the Units property to characters (nonresizable GUIs) or normalized(resizable GUIs) gives the GUI a more consistent appearance across platforms. See“Cross-Platform Compatible Units” on page 6-121 for more information.

Align GUIDE GUI Components
6-79
Align GUIDE GUI Components
In this section...
“Align Objects Tool” on page 6-79“Property Inspector” on page 6-82“Grid and Rulers” on page 6-85“Guide Lines” on page 6-86
Align Objects Tool
The Align Objects tool enables you to position objects with respect to each other and toadjust the spacing between selected objects. The specified alignment operations applyto all components that are selected when you press the Apply button. To open the AlignObjects tool in the GUIDE Layout Editor, select Tools > Align Objects.
Note To select multiple components, they must have the same parent. That is, they mustbe contained in the same figure, panel, or button group. See “Select Components” on page6-70 for more information.

6 Lay Out a GUIDE GUI
6-80
The Align Objects tool provides two types of alignment operations:
• Align — Align all selected components to a single reference line.• Distribute — Space all selected components uniformly with respect to each other.
Both types of alignment can be applied in the vertical and horizontal directions. In manycases, it is better to apply alignments independently to the vertical and horizontal usingtwo separate steps.
Align Options
There are both vertical and horizontal align options. Each option aligns selectedcomponents to a reference line, which is determined by the bounding box that enclosesthe selected objects. For example, the following picture of the layout area shows thebounding box (indicated by the dashed line) formed by three selected push buttons.

Align GUIDE GUI Components
6-81
All of the align options (vertical top, center, bottom and horizontal left, center, right)place the selected components with respect to the corresponding edge (or center) of thisbounding box.
Distribute Options
Distributing components adds equal space between all components in the selected group.The distribute options operate in two different modes:
• Equally space selected components within the bounding box (default)• Space selected components to a specified value in pixels (check Set spacing and
specify a pixel value)
Both modes enable you to specify how the spacing is measured, as indicated by thebutton labels on the alignment tool. These options include spacing measured with respectto the following edges:
• Vertical — inner, top, center, and bottom• Horizontal — inner, left, center, and right

6 Lay Out a GUIDE GUI
6-82
Property Inspector
About the Property Inspector
In GUIDE, as in MATLAB generally, you can see and set most components' propertiesusing the Property Inspector. To open it from the GUIDE Layout Editor, do any of thefollowing:
• Select the component you want to inspect, or double-click it to open the PropertyInspector and bring it to the foreground
• Select View > Property Inspector.• Click the Property Inspector button
The Property Inspector window opens, displaying the properties of the selectedcomponent. For example, here is a view of a push button's properties.

Align GUIDE GUI Components
6-83
Scroll down to see additional properties. Click any property value or icon to set its value.
The Property Inspector provides context-sensitive help for individual properties. To seea definition of any property, right-click the name or value in the Property Inspector andclick the What's This? menu item that appears. A context-sensitive help window opensdisplaying the definition of the property.

6 Lay Out a GUIDE GUI
6-84

Align GUIDE GUI Components
6-85
Use the Property Inspector to Align Components
The Property Inspector enables you to align components by setting their Positionproperties. A component's Position property is a 4-element vector that specifies thelocation of the component on the GUI and its size: [distance from left, distance frombottom, width, height]. The values are given in the units specified by the Units propertyof the component.
1 Select the components you want to align. See “Select Components” on page 6-70 forinformation.
2 Select View > Property Inspector or click the Property Inspector button .3 In the Property Inspector, scroll to the Units property and note its current setting,
then change the setting to inches.4 Scroll to the Position property. This figure shows the Position property for
multiple components of the same size.
5 Change the value of x to align their left sides. Change the value of y to align theirbottom edges. For example, setting x to 2.0 aligns the left sides of the components 2inches from the left side of the GUI.
6 When the components are aligned, change the Units property back to its originalsetting.
Grid and Rulers
The layout area displays a grid and rulers to facilitate component layout. Grid lines arespaced at 50-pixel intervals by default and you can select from a number of other values

6 Lay Out a GUIDE GUI
6-86
ranging from 10 to 200 pixels. You can optionally enable snap-to-grid, which causes anyobject that is moved close to a grid line to jump to that line. Snap-to-grid works with orwithout a visible grid.
Use the Grid and Rulers dialog (select Tools > Grid and Rulers) to:
• Control visibility of rulers, grid, and guide lines• Set the grid spacing• Enable or disable snap-to-grid
Guide Lines
The Layout Editor has both vertical and horizontal snap-to guide lines. Components snapto the line when you move them close to the line.
Guide lines are useful when you want to establish a reference for component alignmentat an arbitrary location in the Layout Editor.
Creating Guide Lines
To create a guide line, click the top or left ruler and drag the line into the layout area.

Align GUIDE GUI Components
6-87
6 Lay Out a GUIDE GUI
6-88
Customize Tabbing Behavior in a GUIDE GUI
A GUI's tab order is the order in which components of the GUI acquire focus when a userpresses the Tab key on the keyboard. Focus is generally denoted by a border or a dottedborder.
You can set, independently, the tab order of components that have the same parent. TheGUI figure and each panel and button group in it has its own tab order. For example, youcan set the tab order of components that have the figure as a parent. You can also set thetab order of components that have a panel or button group as a parent.
If, in tabbing through the components at the figure level, a user tabs to a panel or buttongroup, then subsequent tabs sequence through the components of the panel or buttongroup before returning to the level from which the panel or button group was reached.
Note Axes cannot be tabbed. From GUIDE, you cannot include ActiveX components inthe tab order.
When you create a GUI, GUIDE sets the tab order at each level to be the order in whichyou add components to that level in the Layout Editor. This may not be the best order forthe user.
Note Tab order also affects the stacking order of components. If components overlap,those that appear lower in the tabbing order, are drawn on top of those that appearhigher in the order. See “Front-to-Back Positioning” on page 6-72 for more information.
The figure in the following GUI contains an axes component, a slider, a panel, statictext, and a pop-up menu. Of these, only the slider, the panel, and the pop-up menu atthe figure level can be tabbed. The panel contains three push buttons, which can all betabbed.

Customize Tabbing Behavior in a GUIDE GUI
6-89
To examine and change the tab order of the panel components, click the panelbackground to select it, then select Tools > Tab Order Editor in the Layout Editor.

6 Lay Out a GUIDE GUI
6-90
The Tab Order Editor displays the panel's components in their current tab order. Tochange the tab order, select a component and press the up or down arrow to move thecomponent up or down in the list. If you set the tab order for the first three componentsin the example to be
1 Surf push button2 Contour push button3 Mesh push button
the user first tabs to the Surf push button, then to the Contour push button, and thento the Mesh push button. Subsequent tabs sequence through the remaining componentsat the figure level.

Create Menus for GUIDE GUIs
6-91
Create Menus for GUIDE GUIs
In this section...
“Menus for the Menu Bar” on page 6-91“Context Menus” on page 6-101
You can use GUIDE to give GUIs menu bars with pull-down menus as well as contextmenus that you attach to components. You can create both types of menus using theMenu Editor. Access the Menu Editor from the Tools menu or click the Menu Editor
button .
Menus for the Menu Bar

6 Lay Out a GUIDE GUI
6-92
• “How Menus Affect Figure Docking” on page 6-92• “Add Standard Menus to the Menu Bar” on page 6-93• “Create a Menu” on page 6-93• “Add Items to a Menu” on page 6-95• “Additional Drop-Down Menus” on page 6-98• “Cascading Menus” on page 6-98
When you create a drop-down menu, GUIDE adds its title to the GUI menu bar. Youthen can create menu items for that menu. Each menu item can have a cascading menu,also known as a submenu, and these items can have cascading menus, and so on.
How Menus Affect Figure Docking
By default, when you create a GUI with GUIDE, it does not create a menu bar for thatGUI. You might not need menus for your GUI, but if you want the user to be able to dockor undock the GUI, it must contain a menu bar or a toolbar. This is because docking iscontrolled by the docking icon, a small curved arrow near the upper-right corner of themenu bar or the toolbar, as the following illustration shows.
Figure windows with a standard menu bar also have a Desktop menu from which theuser can dock and undock them.
To display the docking arrow and the Desktop > Dock Figure menu item, use theProperty Inspector to set the figure property DockControls to 'on'. You must also setthe MenuBar and/or ToolBar figure properties to 'figure' to display docking controls.
The WindowStyle figure property also affects docking behavior. The default is'normal', but if you change it to 'docked', then the following applies:

Create Menus for GUIDE GUIs
6-93
• The GUI opens docked in the desktop when you run it.• The DockControls property is set to 'on' and cannot be turned off until
WindowStyle is no longer set to 'docked'.• If you undock a GUI created with WindowStyle 'docked', it will have not have a
docking arrow unless the figure displays a menu bar or a toolbar (either standard orcustomized). When it has no docking arrow, users can undock it from the desktop, butwill be unable to redock it there.
However, when you provide your own menu bar or toolbar using GUIDE, it can displaythe docking arrow if you want the GUI to be dockable. See the following sections and“Create Toolbars for GUIDE GUIs” on page 6-108 for details.
Note: GUIs that are modal dialogs (figures with WindowStyle set to 'modal') cannothave menu bars, toolbars, or docking controls.
For more information, see the DockControls, MenuBar, ToolBar, and WindowStyleproperty descriptions in Figure Properties.
Add Standard Menus to the Menu Bar
The figure MenuBar property controls whether your GUI displays the MATLAB standardmenus on the menu bar. GUIDE initially sets the value of MenuBar to none. If you wantyour GUI to display the MATLAB standard menus, use the Property Inspector to setMenuBar to figure.
• If the value of MenuBar is none, GUIDE automatically adds a menu bar that displaysonly the menus you create.
• If the value of MenuBar is figure, the GUI displays the MATLAB standard menusand GUIDE adds the menus you create to the right side of the menu bar.
In either case, you can enable users of your GUI to dock and undock it using its dockingarrow by setting the figure's DockControls property to 'on'.
Create a Menu
1 Start a new menu by clicking the New Menu button in the toolbar. A menu title,Untitled 1, appears in the left pane of the dialog box.

6 Lay Out a GUIDE GUI
6-94
Note By default, GUIDE selects the Menu Bar tab when you open the Menu Editor.
2 Click the menu title to display a selection of menu properties in the right pane.

Create Menus for GUIDE GUIs
6-95
3 Fill in the Label and Tag fields for the menu. For example, set Label to File andset Tag to file_menu. Click outside the field for the change to take effect.
Label is a string that specifies the text label for the menu item. To display the &character in a label, use two & characters in the string. The words remove, default,and factory (case sensitive) are reserved. To use one of these as labels, prepend abackslash (\) to the string. For example, \remove yields remove.
Tag is a string that is an identifier for the menu object. It is used in the code toidentify the menu item and must be unique in the GUI.
Add Items to a Menu
Use the New Menu Item tool to create menu items that are displayed in the drop-downmenu.
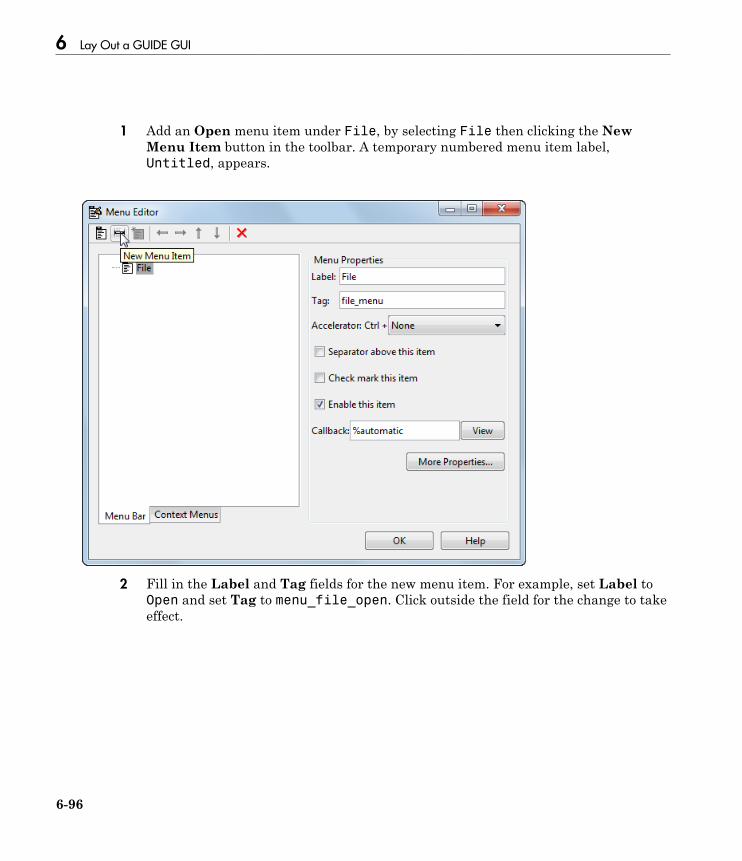
6 Lay Out a GUIDE GUI
6-96
1 Add an Open menu item under File, by selecting File then clicking the NewMenu Item button in the toolbar. A temporary numbered menu item label,Untitled, appears.
2 Fill in the Label and Tag fields for the new menu item. For example, set Label toOpen and set Tag to menu_file_open. Click outside the field for the change to takeeffect.

Create Menus for GUIDE GUIs
6-97
You can also
• Choose an alphabetic keyboard accelerator for the menu item with the Acceleratorpop-up menu. In combination with Ctrl, this is the keyboard equivalent for a menuitem that does not have a child menu. Note that some accelerators may be used forother purposes on your system and that other actions may result.
• Display a separator above the menu item by checking Separator above this item.• Display a check next to the menu item when the menu is first opened by checking
Check mark this item. A check indicates the current state of the menu item. Seethe example in “Add Items to the Context Menu” on page 6-103.
• Enable this item when the menu is first opened by checking Enable this item. Thisallows the user to select this item when the menu is first opened. If you clear thisoption, the menu item appears dimmed when the menu is first opened, and the usercannot select it.

6 Lay Out a GUIDE GUI
6-98
• Specify a string for the routine, i.e., the Callback, that performs the actionassociated with the menu item. If you have not yet saved the GUI, the default value is%automatic. When you save the GUI, and if you have not changed this field, GUIDEautomatically sets the value using a combination of the Tag field and the GUI filename. See “Menu Item” on page 8-23 for more information about specifying thisfield and for programming menu items.
The View button displays the callback, if there is one, in an editor. If you have not yetsaved the GUI, GUIDE prompts you to save it.
• Open the Property Inspector, where you can change all menu properties, by clickingthe More Properties button. For detailed information about the properties, seeUimenu Properties.
Note See “Menu Item” on page 8-23 and “How to Update a Menu Item Check” onpage 8-25 for programming information and basic examples.
Additional Drop-Down Menus
To create additional drop-down menus, use the New Menu button in the same way youdid to create the File menu. For example, the following figure also shows an Edit drop-down menu.
Cascading Menus
To create a cascading menu, select the menu item that will be the title for the cascadingmenu, then click the New Menu Item button. In the example below, Copy is a cascadingmenu.

Create Menus for GUIDE GUIs
6-99
Note See “Menu Item” on page 8-23 for information about programming menu items.
The following Menu Editor illustration shows three menus defined for the figure menubar.
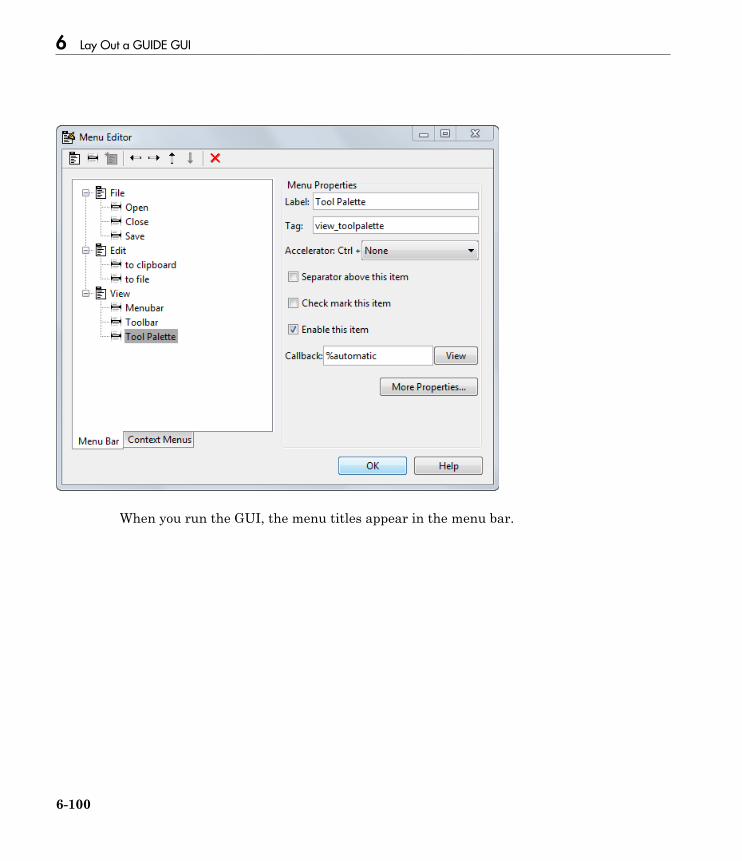
6 Lay Out a GUIDE GUI
6-100
When you run the GUI, the menu titles appear in the menu bar.
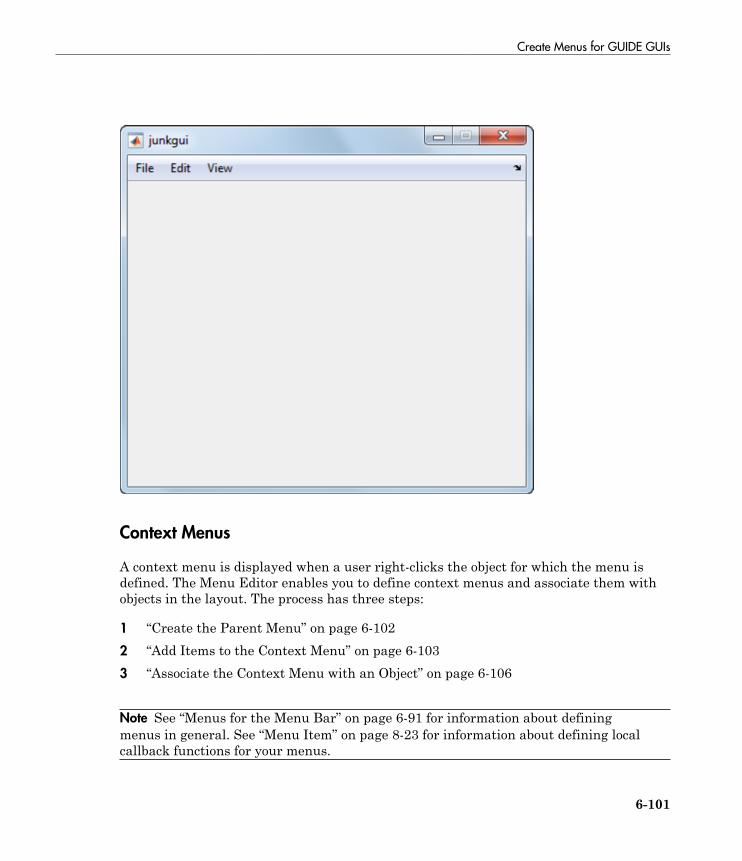
Create Menus for GUIDE GUIs
6-101
Context Menus
A context menu is displayed when a user right-clicks the object for which the menu isdefined. The Menu Editor enables you to define context menus and associate them withobjects in the layout. The process has three steps:
1 “Create the Parent Menu” on page 6-1022 “Add Items to the Context Menu” on page 6-1033 “Associate the Context Menu with an Object” on page 6-106
Note See “Menus for the Menu Bar” on page 6-91 for information about definingmenus in general. See “Menu Item” on page 8-23 for information about defining localcallback functions for your menus.

6 Lay Out a GUIDE GUI
6-102
Create the Parent Menu
All items in a context menu are children of a menu that is not displayed on the figuremenu bar. To define the parent menu:
1 Select the Menu Editor's Context Menus tab and select the New Context Menubutton from the toolbar.
2 Select the menu, and in the Tag field type the context menu tag(axes_context_menu in this example).

Create Menus for GUIDE GUIs
6-103
Add Items to the Context Menu
Use the New Menu Item button to create menu items that are displayed in the contextmenu.
1 Add a Blue background color menu item to the menu by selectingaxes_context_menu and clicking the New Menu Item tool. A temporarynumbered menu item label, Untitled, appears.

6 Lay Out a GUIDE GUI
6-104
2 Fill in the Label and Tag fields for the new menu item. For example, set Label toBlue background color and set Tag to blue_background. Click outside thefield for the change to take effect.

Create Menus for GUIDE GUIs
6-105
You can also modify menu items in these ways:
• Display a separator above the menu item by checking Separator above this item.• Display a check next to the menu item when the menu is first opened by checking
Check mark this item. A check indicates the current state of the menu item. Seethe example in “Add Items to the Context Menu” on page 6-103. See “How toUpdate a Menu Item Check” on page 8-25 for a code example.
• Enable this item when the menu is first opened by checking Enable this item. Thisallows the user to select this item when the menu is first opened. If you clear thisoption, the menu item appears dimmed when the menu is first opened, and the usercannot select it.
• Specify a Callback for the menu that performs the action associated with the menuitem. If you have not yet saved the GUI, the default value is %automatic. When yousave the GUI, and if you have not changed this field, GUIDE automatically creates a

6 Lay Out a GUIDE GUI
6-106
callback in the code file using a combination of the Tag field and the GUI file name.The callback's name does not display in the Callback field of the Menu Editor, butselecting the menu item does trigger it.
You can also type an unquoted string into the Callback field to serve as a callback. Itcan be any valid MATLAB expression or command. For example, the string
set(gca, 'Color', 'y')
sets the current axes background color to yellow. However, the preferred approach toperforming this operation is to place the callback in the GUI code file. This avoids theuse of gca, which is not always reliable when several figures or axes exist. Here is aversion of this callback coded as a function in the GUI code file:
function axesyellow_Callback(hObject, eventdata, handles)
% hObject handle to axesyellow (see GCBO)
% eventdata reserved - to be defined in a future version of MATLAB
% handles structure with handles and user data (see GUIDATA)
set(handles.axes1,'Color','y')
This code sets the background color of the GUI axes with Tag axes1 no matter towhat object the context menu is attached to.
If you enter a callback string in the Menu Editor, it overrides the callback for the itemin the code file, if any has been saved. If you delete a string you have entered in theCallback field, the callback for the item in the GUI code file (if any) is executed whenGUI runs and the item is selected.
See “Menu Item” on page 8-23 for more information about specifying this field andfor programming menu items. For another example of programming context menus inGUIDE, see “Synchronized Data Presentations in a GUIDE GUI” on page 9-30.
The View button displays the callback, if there is one, in an editor. If you have not yetsaved the GUI, GUIDE prompts you to save it.
• Open the Property Inspector, where you can change all menu properties exceptcallbacks, by clicking the More Properties button. For detailed information aboutthese properties, see Uicontextmenu Properties.
Associate the Context Menu with an Object
1 In the Layout Editor, select the object for which you are defining the context menu.2 Use the Property Inspector to set this object's UIContextMenu property to the name
of the desired context menu.

Create Menus for GUIDE GUIs
6-107
The following figure shows the UIContextMenu property for the axes object with Tagproperty axes1.
In the GUI code file, complete the local callback function for each item in the contextmenu. Each callback executes when a user selects the associated context menu item. See“Menu Item” on page 8-23 for information on defining the syntax.
Note See “Menu Item” on page 8-23 and “How to Update a Menu Item Check” onpage 8-25 for programming information and basic examples.

6 Lay Out a GUIDE GUI
6-108
Create Toolbars for GUIDE GUIs
In this section...
“Toolbar and Tools” on page 6-108“Editing Tool Icons” on page 6-116
Toolbar and Tools
You can add a toolbar to a GUI you create in GUIDE with the Toolbar Editor, which youopen from the GUIDE Layout Editor toolbar.
You can also open the Toolbar Editor from the Tools menu.

Create Toolbars for GUIDE GUIs
6-109
The Toolbar Editor gives you interactive access to all the features of the uitoolbar,uipushtool, and uitoggletool functions. It only operates in the context of GUIDE;you cannot use it to modify any of the built-in MATLAB toolbars. However, you can usethe Toolbar Editor to add, modify, and delete a toolbar from any GUI in GUIDE.
Currently, you can add one toolbar to your GUI in GUIDE. However, your GUI can alsoinclude the standard MATLAB figure toolbar. If you need to, you can create a toolbarthat looks like a normal figure toolbar, but customize its callbacks to make tools (such aspan, zoom, and open) behave in specific ways.
Note: You do not need to use the Toolbar Editor if you simply want your GUI to havea standard figure toolbar. You can do this by setting the figure's ToolBar property to'figure', as follows:

6 Lay Out a GUIDE GUI
6-110
1 Open the GUI in GUIDE.
2 From the View menu, open Property Inspector.3 Set the ToolBar property to 'figure' using the drop-down menu.4 Save the figureIf you later want to remove the figure toolbar, set the ToolBar property to 'auto' andresave the GUI. Doing this will not remove or hide your custom toolbar, should the GUIhave one. See “Create Toolbars for Programmatic GUIs” on page 10-88 for moreinformation about making toolbars manually.
If you want users to be able to dock and undock a GUI on the MATLAB desktop, it musthave a toolbar or a menu bar, which can either be the standard ones or ones you create inGUIDE. In addition, the figure property DockControls must be turned on. For details,see “How Menus Affect Figure Docking” on page 6-92.
Use the Toolbar Editor
The Toolbar Editor contains three main parts:
• The Toolbar Layout preview area on the top• The Tool Palette on the left• Two tabbed property panes on the right

Create Toolbars for GUIDE GUIs
6-111
To add a tool, drag an icon from the Tool Palette into the Toolbar Layout (whichinitially contains the text prompt shown above), and edit the tool's properties in the ToolProperties pane.
When you first create a GUI, no toolbar exists on it. When you open the Toolbar Editorand place the first tool, a toolbar is created and a preview of the tool you just addedappears in the top part of the window. If you later open a GUI that has a toolbar, theToolbar Editor shows the existing toolbar, although the Layout Editor does not.
Add Tools
You can add a tool to a toolbar in three ways:
• Drag and drop tools from the Tool Palette.

6 Lay Out a GUIDE GUI
6-112
• Select a tool in the palette and click the Add button.• Double-click a tool in the palette.
Dragging allows you to place a tool in any order on the toolbar. The other two methodsplace the tool to the right of the right-most tool on the Toolbar Layout. The new tool isselected (indicated by a dashed box around it) and its properties are shown in the ToolProperties pane. You can select only one tool at a time. You can cycle through the ToolPalette using the tab key or arrow keys on your computer keyboard. You must haveplaced at least one tool on the toolbar.
After you place tools from the Tool Palette into the Toolbar Layout area, the ToolbarEditor shows the properties of the currently selected tool, as the following illustrationshows.

Create Toolbars for GUIDE GUIs
6-113
Predefined and Custom Tools
The Toolbar Editor provides two types of tools:
• Predefined tools, having standard icons and behaviors• Custom tools, having generic icons and no behaviors
Predefined Tools
The set of icons on the bottom of the Tool Palette represent standard MATLAB figuretools. Their behavior is built in. Predefined tools that require an axes (such as pan andzoom) do not exhibit any behavior in GUIs lacking axes. The callback(s) defining thebehavior of the predefined tool are shown as %default, which calls the same functionthat the tool calls in standard figure toolbars and menus (to open files, save figures,change modes, etc.). You can change %default to some other callback to customize thetool; GUIDE warns you that you will modify the behavior of the tool when you change acallback field or click the View button next to it, and asks if you want to proceed or not.Custom Tools
The two icons at the top of the Tool Palette create pushtools and toggletools. Thesehave no built-in behavior except for managing their appearance when clicked on andoff. Consequently, you need to provide your own callback(s) when you add one to yourtoolbar. In order for custom tools to respond to clicks, you need to edit their callbacks tocreate the behaviors you desire. Do this by clicking the View button next to the callbackin the Tool Properties pane, and then editing the callback in the Editor window.
Add and Remove Separators
Separators are vertical bars that set off tools, enabling you to group them visually. Youcan add or remove a separator in any of three ways:
• Right-click on a tool's preview and select Show Separator, which toggles itsseparator on and off.
• Check or clear the check box Separator to the left in the tool's property pane.• Change the Separator property of the tool from the Property Inspector
After adding a separator, that separator appears in the Toolbar Layout to the left ofthe tool. The separator is not a distinct object or icon; it is a property of the tool.
Move Tools
You can reorder tools on the toolbar in two ways:

6 Lay Out a GUIDE GUI
6-114
• Drag a tool to a new position.• Select a tool in the toolbar and click one of the arrow buttons below the right side of
the toolbar.
If a tool has a separator to its left, the separator moves with the tool.
Remove Tools
You can remove tools from the toolbar in three ways:
• Select a tool and press the Delete key.• Select a tool and click the Delete button on the GUI.• Right-click a tool and select Delete from the context menu.
You cannot undo any of these actions.
Edit a Tool’s Properties
You edit the appearance and behavior of the currently selected tool using the ToolProperties pane, which includes controls for setting the most commonly used toolproperties:
• CData — The tool’s icon• Tag — The internal name for the tool• Enable — Whether users can click the tool• Separator — A bar to the left of the icon for setting off and grouping tools• Clicked Callback — The function called when users click the tool• Off Callback (uitoggletool only) — The function called when the tool is put in the off
state• On Callback (uitoggletool only) — The function called when the tool is put in the on
state
See “Write Callbacks Using the GUIDE Workflow” on page 8-2 for details onprogramming the tool callbacks. You can also access these and other properties of theselected tool with the Property Inspector. To open the Property Inspector, click the MoreProperties button on the Tool Properties pane.
Edit Tool Icons
To edit a selected toolbar icon, click the Edit button in the Tool Properties pane, nextto CData (icon) or right-click the Toolbar Layout and select Edit Icon from the

Create Toolbars for GUIDE GUIs
6-115
context menu. The Icon Editor opens with the tool’s CData loaded into it. For informationabout editing icons, see “Use the Icon Editor” on page 6-116.
Edit Toolbar Properties
If you click an empty part of the toolbar or click the Toolbar Properties tab, you canedit two of its properties:
• Tag — The internal name for the toolbar• Visible — Whether the toolbar is displayed in your GUI
The Tag property is initially set to uitoolbar1. The Visible property is set to on.When on, the Visible property causes the toolbar to be displayed on the GUI regardlessof the setting of the figure’s Toolbar property. If you want to toggle a custom toolbar asyou can built-in ones (from the View menu), you can create a menu item, a check box, orother control to control its Visible property.
To access nearly all the properties for the toolbar in the Property Inspector, click MoreProperties.
Test Your Toolbar
To try out your toolbar, click the Run button in the Layout Editor. The software asks ifyou want to save changes to its .fig file first.
Remove a Toolbar
You can remove a toolbar completely—destroying it—from the Toolbar Editor, leavingyour GUI without a toolbar (other than the figure toolbar, which is not visible by default).The are two ways to remove a toolbar:
•Click the Remove button on the right end of the toolbar.
• Right-click a blank area on the toolbar and select Remove Toolbar from the contextmenu.
If you remove all the individual tools in the ways shown in “Remove Tools” on page6-114 without removing the toolbar itself, your GUI will contain an empty toolbar.
Close the Toolbar Editor
You can close the Toolbar Editor window in two ways:
• Press the OK button.
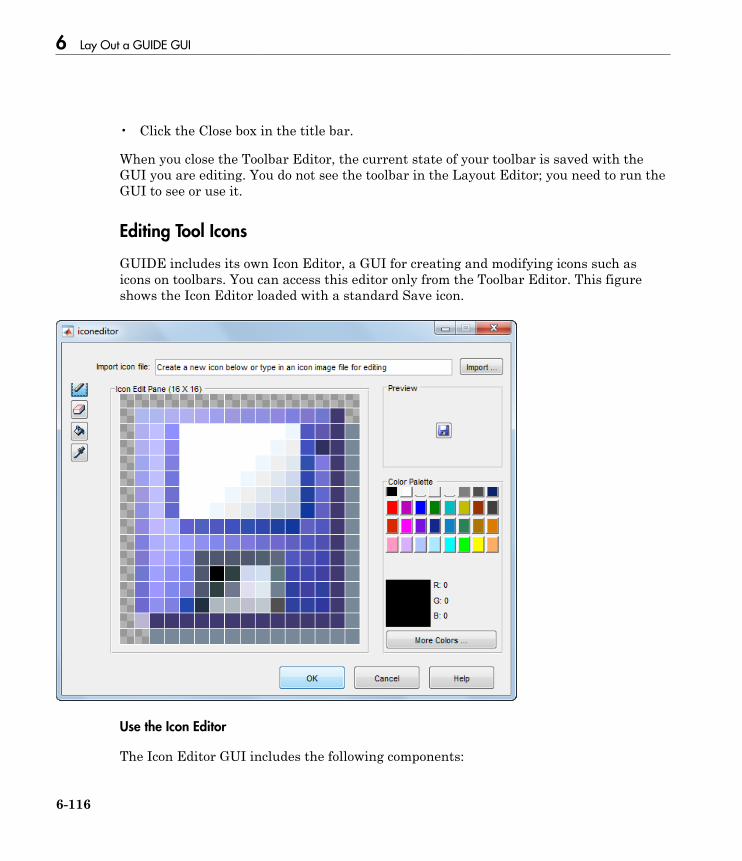
6 Lay Out a GUIDE GUI
6-116
• Click the Close box in the title bar.
When you close the Toolbar Editor, the current state of your toolbar is saved with theGUI you are editing. You do not see the toolbar in the Layout Editor; you need to run theGUI to see or use it.
Editing Tool Icons
GUIDE includes its own Icon Editor, a GUI for creating and modifying icons such asicons on toolbars. You can access this editor only from the Toolbar Editor. This figureshows the Icon Editor loaded with a standard Save icon.
Use the Icon Editor
The Icon Editor GUI includes the following components:
Create Toolbars for GUIDE GUIs
6-117
• Icon file name — The icon image file to be loaded for editing• Import button — Opens a file dialog to select an existing icon file for editing• Drawing tools — A group of four tools on the left side for editing icons
• Pencil tool — Color icon pixels by clicking or dragging• Eraser tool — Erase pixels to be transparent by clicking or dragging• Paint bucket tool — Flood regions of same-color pixels with the current color• Pick color tool — Click a pixel or color palette swatch to define the current color
• Icon Edit pane — A n-by-m grid where you color an icon• Preview pane — A button with a preview of current state of the icon• Color Palette — Swatches of color that the pencil and paint tools can use• More Colors button — Opens the Colors dialog box for choosing and defining colors• OK button — Dismisses the GUI and returns the icon in its current state• Cancel button — Closes the GUI without returning the icon
To work with the Icon Editor,
1 Open the Icon Editor for a selected tool’s icon.2 Using the Pencil tool, color the squares in the grid:
• Click a color cell in the palette.• That color appears in the Color Palette preview swatch.• Click in specific squares of the grid to transfer the selected color to those squares.• Hold down the left mouse button and drag the mouse over the grid to transfer the
selected color to the squares that you touch.• Change a color by writing over it with another color.
3 Using the Eraser tool, erase the color in some squares
• Click the Eraser button on the palette.• Click in specific squares to erase those squares.• Click and drag the mouse to erase the squares that you touch.• Click a another drawing tool to disable the Eraser.
4 Click OK to close the GUI and return the icon you created or click Cancel to closethe GUI without modifying the selected tool’s icon.

6 Lay Out a GUIDE GUI
6-118
The Toolbar Editor and Icon Editor are shown together below.

View the GUIDE GUI Object Hierarchy
6-119
View the GUIDE GUI Object Hierarchy
The Object Browser displays a hierarchical list of the objects in the figure, including bothcomponents and menus. As you lay out your GUI, check the object hierarchy periodically,especially if your GUI contains menus, panes, or button groups. Open it from View >
Object Browser or by click the Object Browser icon on the GUIDE toolbar.
The following illustration shows a figure object and its child objects. It also shows thechild objects of a uipanel.
To determine a component's place in the hierarchy, select it in the Layout Editor. It isautomatically selected in the Object Browser. Similarly, if you select an object in theObject Browser, it is automatically selected in the Layout Editor.

6 Lay Out a GUIDE GUI
6-120
Design GUIDE GUIs for Cross-Platform Compatibility
In this section...
“Default System Font” on page 6-120“Standard Background Color” on page 6-121“Cross-Platform Compatible Units” on page 6-121
Default System Font
By default, user interface controls (uicontrols) use the default font for the platform onwhich they are running. For example, when displaying your GUI on PCs, uicontrolsuse MS San Serif. When your GUI runs on a different platform, it uses that computer'sdefault font. This provides a consistent look with respect to your GUI and otherapplication GUIs.
If you have set the FontName property to a named font and want to return to the defaultvalue, you can set the property to the string default. This ensures that the softwareuses the system default at run-time.
You can use the Property Inspector to set this property:
As an alternative, use the set command to set the property in the GUI code file.For example, if there is a push button in your GUI and its handle is stored in thepushbutton1 field of the handles structure, then the statement
Design GUIDE GUIs for Cross-Platform Compatibility
6-121
set(handles.pushbutton1,'FontName','default')
sets the FontName property to use the system default.
Specify a Fixed-Width Font
If you want to use a fixed-width font for a user interface control, set its FontNameproperty to the string fixedwidth. This special identifier ensures that your GUI usesthe standard fixed-width font for the target platform.
You can find the name of the fixed-width font that is used on a given platform byquerying the root FixedWidthFontName property.
get(groot,'FixedWidthFontName')
Use a Specific Font Name
You can specify an actual font name (such as Times or Courier) for the FontNameproperty. However, doing so may cause your GUI to not look as you intended when runon a different computer. If the target computer does not have the specified font, it willsubstitute another font that may not look good in your GUI or may not be the standardfont used for GUIs on that system. Also, different versions of the same named font mayhave different size requirements for a given set of characters.
Standard Background Color
The default component background color is the standard system background color onwhich the GUI is running. This color varies on different computer systems, e.g., thestandard shade of gray on the PC differs from that on UNIX system, and may not matchthe default GUI background color.
If you use the default component background color, you can use that same color as thebackground color for your GUI. This provides a consistent look with respect to your GUIand other application GUIs. To do this in GUIDE, check Options > Use system colorscheme for background on the Layout Editor Tools menu.
Note This option is available only if you first select the Generate FIG-file andMATLAB File option.
Cross-Platform Compatible Units

6 Lay Out a GUIDE GUI
6-122
Cross-platform compatible GUIs should look correct on computers having different screensizes and resolutions. Since the size of a pixel can vary on different computer displays,using the default figure Units of pixels does not produce a GUI that looks the same onall platforms.
For this reason, GUIDE defaults the Units property for the figure to characters.
System-Dependent Units
Character units are defined by characters from the default system font. The widthof a character unit equals the width of the letter x in the system font. The height ofa character unit is the distance between the baselines of two lines of text. Note thatcharacter units are not square.
Units and Resize Behavior
If you set your GUI's resize behavior from the GUI Options dialog box, GUIDEautomatically sets the units for the GUI's components in a way that maintains theintended look and feel across platforms. To specify the resize behavior option, selectTools > GUI Options, and select an item from the Resize behavior pop-up menu:
• If you choose Non-resizable, GUIDE defaults the component units to characters.• If you choose Proportional, GUIDE defaults the component units to normalized.• If you choose Other (Use SizeChangedFcn), GUIDE defaults the component units
to characters. However, you must provide a SizeChangedFcn callback to customizethe GUI's resize behavior.
The Non-resizable and Proportional options enable your GUI to automaticallyadjust the size and relative spacing of components when the GUI displays on differentcomputers.
Note GUIDE does not automatically adjust component units if you modify the figure'sResize property programmatically or in the Property Inspector.
At times, it might be convenient to use a more familiar unit of measure, e.g., inches orcentimeters, when you are laying out the GUI. However, to preserve the look of yourGUI on different computers, remember to change the figure Units property back tocharacters, and the components' Units properties to characters (nonresizable GUIs)or normalized (resizable GUIs) before you save the GUI.
GUI Design References
6-123
GUI Design References
Many Web sites such as the following provide guidelines for designing GUIs:
• AskTog — Essays on good design and a list of First Principles for good user interfacedesign. The author, Bruce Tognazzini, is a well-respected user interface designer.http://www.asktog.com/basics/firstPrinciples.html.
• GUI Design Handbook — A detailed guide to the use of GUI controls. http://www.fast-consulting.com/desktop.htm.
• Usability Glossary — An extensive glossary of terms related to GUI design, usability,and related topics. http://www.usabilityfirst.com/glossary/main.cgi.
• UsabilityNet — Covers design principles, user-centered design, and other usabilityand design-related topics. http://www.usabilitynet.org/management/b_design.htm.

6-124

7
Save and Run a GUIDE GUI
• “Save a GUIDE GUI” on page 7-2• “Create a Programmatic GUI Code File from GUIDE GUI Files” on page 7-4• “Rename GUIDE GUIs and GUI Files” on page 7-5

7 Save and Run a GUIDE GUI
7-2
Save a GUIDE GUI
In this section...
“Save a GUI” on page 7-2“Create a Backward Compatible GUIDE Fig-File” on page 7-2“Append New Callbacks to an Existing GUIDE Code File” on page 7-3
Save a GUI
To save a GUI in GUIDE, use any of the following methods:
• On the Layout Editor toolbar, click Save or Run .• On the Layout Editor menu bar, select the FileSave or Save as options
Note: GUIDE GUIs cannot run correctly from a private folder.
Create a Backward Compatible GUIDE Fig-File
GUI FIG-files that are created or modified with MATLAB 7.0 or a later MATLABversion, are not automatically compatible with Version 6.5 and earlier versions.
To make a FIG-file (which is a kind of MAT-file) backward compatible:
1 From the Layout editor, select File > Preferences.2 Select MATLAB > General > MAT-Files.3 Select MATLAB Version 5 or later (save -v6)
Because Button groups, panels and tables were introduced in MATLAB 7, you should notuse them in GUIs that you expect to run in earlier MATLAB versions.
Note The -v6 option is obsolete and will be removed in a future version of MATLAB

Save a GUIDE GUI
7-3
Append New Callbacks to an Existing GUIDE Code File
If you save a GUIDE gui to an existing file, GUIDE displays a dialog box that asks you ifyou want to replace the existing FIG-file. If you click Yes, GUIDE displays a dialog thatasks if you want to replace the existing code file or append to it. The most common choiceis Replace.
If you choose Append, GUIDE adds callbacks to the existing code file for components inthe current layout that are not present within it. Before you append the new components,ensure that their Tag properties do not duplicate Tag values that appear in callbackfunction names in the existing code file.
7 Save and Run a GUIDE GUI
7-4
Create a Programmatic GUI Code File from GUIDE GUI Files
You can export a GUI (FIG-file and code file) to a single programmatic code file. The coderecreates the GUI layout programmatically. When a user runs this file, it generates theGUI figure; no preexisting FIG-file is required.
To export a GUI that is open in GUIDE, select File > Export.
If the GUI contains binary data (for example, icons or UserData), exporting it sometimesalso generates a MAT-file containing that data. When a user runs the exported GUI, itreads the MAT-file and loads the data it contains. The MAT-file must be on the MATLABsearch path at that time.

Rename GUIDE GUIs and GUI Files
7-5
Rename GUIDE GUIs and GUI Files
To rename a GUI, rename the GUI FIG-file using Save As from the Layout Editor Filemenu. GUIDE renames both the FIG-file and the GUI code file, updates any callbackproperties that contain the old name to use the new name, and updates all instances ofthe file name in the body of the code.
Note: Do not rename GUI files by changing their names outside of GUIDE or the GUIwill not function properly.

7-6
8
Programming a GUIDE GUI
• “Write Callbacks Using the GUIDE Workflow” on page 8-2• “Initialize a GUIDE GUI” on page 8-7• “Callbacks for Specific Components” on page 8-12• “Examples of GUIDE GUIs” on page 8-30

8 Programming a GUIDE GUI
8-2
Write Callbacks Using the GUIDE Workflow
In this section...
“Callbacks for Different User Actions” on page 8-2“GUIDE-Generated Callback Functions and Property Values” on page 8-4“GUIDE Callback Syntax” on page 8-5“Renaming and Removing GUIDE-Generated Callbacks” on page 8-5
Callbacks for Different User Actions
UI and graphics components have certain properties that you can associate with specificcallback functions. Each of these properties corresponds to a specific user action. Forexample, a uicontrol has a property called Callback. You can set the value of thisproperty to be a handle to a callback function, an anonymous function, or a stringcontaining MATLAB commands. Setting this property makes your GUI respond whenthe user interacts with the uicontrol. If the Callback property has no specified value, thennothing happens when the end user interacts with the uicontrol.
This table lists the callback properties that are available, the user actions that triggerthe callback function, and the most common UI and graphics components that use them.
Callback Property User Action Components That Use This Property
ButtonDownFcn End user presses a mouse buttonwhile the pointer is on thecomponent or figure.
axes, figure, uibuttongroup,uicontrol, uipanel, uitable,
Callback End user triggers the component.For example: selecting a menuitem, moving a slider, or pressinga push button.
uicontextmenu, uicontrol,uimenu
CellEditCallback End user edits a value in a tablewhose cells are editable.
uitable
CellSelectionCallbackEnd user selects cells in a table. uitable
ClickedCallback End user clicks the push tool ortoggle tool with the left mousebutton.
uitoggletool, uipushtool
CloseRequestFcn The figure closes. figure

Write Callbacks Using the GUIDE Workflow
8-3
Callback Property User Action Components That Use This Property
CreateFcn Callback executes when MATLABcreates the object, but before it isdisplayed.
axes, figure, uibuttongroup,uicontextmenu, uicontrol,uimenu, uipushtool, uipanel,uitable, uitoggletool,uitoolbar
DeleteFcn Callback executes just beforeMATLAB deletes the figure.
axes, figure, uibuttongroup,uicontextmenu, uicontrol,uimenu, uipushtool, uipanel,uitable, uitoggletool,uitoolbar
KeyPressFcn End user presses a keyboard keywhile the pointer is on the object.
figure, uicontrol, uipanel,uipushtool, uitable,uitoolbar
KeyReleaseFcn End user releases a keyboard keywhile the pointer is on the object.
figure, uicontrol, uitable
OffCallback Executes when the State of atoggle tool changes to 'off'.
uitoggletool
OnCallback Executes when the State of atoggle tool changes to 'on'.
uitoggletool
SizeChangedFcn End user resizes a button group,figure, or panel whose Resizeproperty is 'on'.
figure, uipanel,uibuttongroup
SelectionChangedFcnEnd user selects a different radiobutton or toggle button within abutton group.
uibuttongroup
WindowButtonDownFcnEnd user presses a mouse buttonwhile the pointer is in the figurewindow.
figure
WindowButtonMotionFcnEnd user moves the pointer withinthe figure window.
figure
WindowButtonUpFcnEnd user releases a mouse button. figure
WindowKeyPressFcnEnd user presses a key while thepointer is on the figure or any ofits child objects.
figure
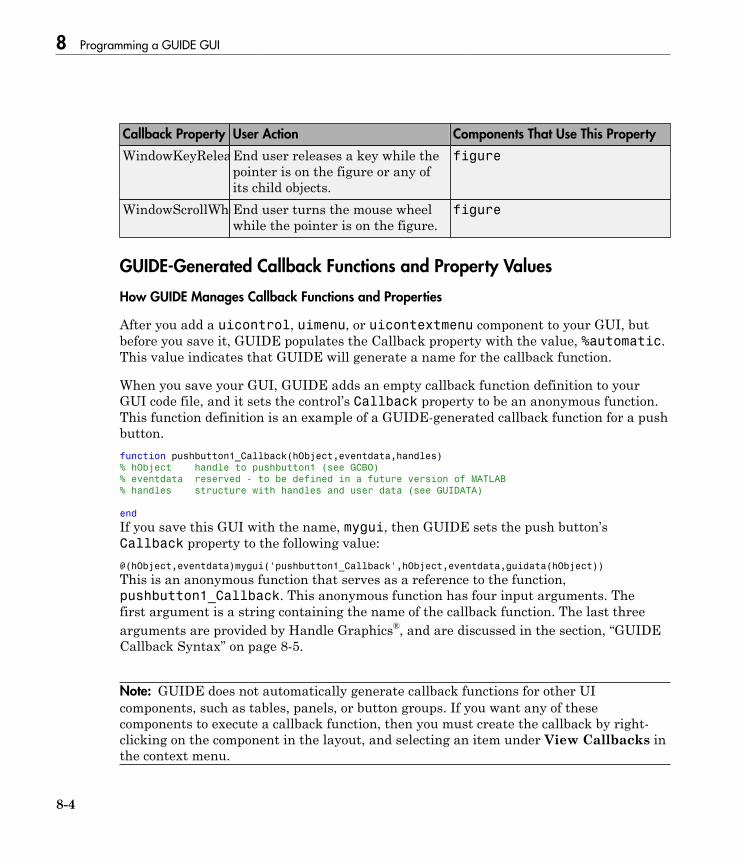
8 Programming a GUIDE GUI
8-4
Callback Property User Action Components That Use This Property
WindowKeyReleaseFcnEnd user releases a key while thepointer is on the figure or any ofits child objects.
figure
WindowScrollWheelFcnEnd user turns the mouse wheelwhile the pointer is on the figure.
figure
GUIDE-Generated Callback Functions and Property Values
How GUIDE Manages Callback Functions and Properties
After you add a uicontrol, uimenu, or uicontextmenu component to your GUI, butbefore you save it, GUIDE populates the Callback property with the value, %automatic.This value indicates that GUIDE will generate a name for the callback function.
When you save your GUI, GUIDE adds an empty callback function definition to yourGUI code file, and it sets the control’s Callback property to be an anonymous function.This function definition is an example of a GUIDE-generated callback function for a pushbutton.function pushbutton1_Callback(hObject,eventdata,handles)
% hObject handle to pushbutton1 (see GCBO)
% eventdata reserved - to be defined in a future version of MATLAB
% handles structure with handles and user data (see GUIDATA)
end
If you save this GUI with the name, mygui, then GUIDE sets the push button’sCallback property to the following value:@(hObject,eventdata)mygui('pushbutton1_Callback',hObject,eventdata,guidata(hObject))
This is an anonymous function that serves as a reference to the function,pushbutton1_Callback. This anonymous function has four input arguments. Thefirst argument is a string containing the name of the callback function. The last threearguments are provided by Handle Graphics®, and are discussed in the section, “GUIDECallback Syntax” on page 8-5.
Note: GUIDE does not automatically generate callback functions for other UIcomponents, such as tables, panels, or button groups. If you want any of thesecomponents to execute a callback function, then you must create the callback by right-clicking on the component in the layout, and selecting an item under View Callbacks inthe context menu.

Write Callbacks Using the GUIDE Workflow
8-5
GUIDE Callback Syntax
All callbacks in a GUIDE GUI must accept at least three input arguments:
• hObject — Handle to the UI component that triggered the callback.• eventdata — A variable that contains detailed information about specific mouse or
keyboard actions.• handles — A struct that contains handles to all the objects in the GUI. GUIDE
uses the guidata function to store and maintain this structure.
For the callback function to accept additional arguments, you must put the additionalarguments at the end of the argument list in the function definition.
The eventdata Argument
The eventdata argument provides detailed information to certain callback functions.For example, if the end user triggers the KeyPressFcn, then MATLAB providesinformation regarding the specific key (or combination of keys) that the end userpressed. If eventdata is not available to the callback function, then MATLAB passesit as an empty array. The following table lists the callbacks and components that useeventdata.
Callback Property Name Component
WindowKeyPressFcn
WindowKeyReleaseFcn
WindowScrollWheel
figure
KeyPressFcn figure, uicontrol, uitableKeyReleaseFcn figure, uicontrol, uitableSelectionChangedFcn uibuttongroup
CellEditCallback
CellSelectionCallback
uitable
Renaming and Removing GUIDE-Generated Callbacks
Renaming Callbacks
GUIDE creates the name of a callback function by combining the component’s Tagproperty and the callback property name. If you change the component’s Tag value, thenGUIDE changes the callback's name the next time you save the GUI.

8 Programming a GUIDE GUI
8-6
If you decide to change the Tag value after saving the GUI, then GUIDE updates thefollowing items (assuming that all components have unique Tag values).
• Component's callback function definition• Component’s callback property value• References in the code file to the corresponding field in the handles structure
To rename a callback function without changing the component’s Tag property:
1 Change the name in the callback function definition.2 Update the component’s callback property by changing the first argument passed
to the anonymous function. For example, the original callback property for a pushbutton might look like this:
@(hObject,eventdata)mygui('pushbutton1_Callback',...
hObject,eventdata,guidata(hObject))
In this example, you must change the string, 'pushbutton1_Callback' to the newfunction name.
3 Change all other references to the old function name to the new function name in theGUI code file.
Deleting Callbacks
You can delete a callback function when you want to remove or change the function thatexecutes when the end user performs a specific action. To delete a callback function:
1 Search and replace all instances that refer to the callback function in your code.2 Open the GUI in GUIDE and replace all instances that refer to the callback function
in the Property Inspector.3 Delete the callback function.
More About• “Anonymous Functions”

Initialize a GUIDE GUI
8-7
Initialize a GUIDE GUI
In this section...
“Opening Function” on page 8-7“Output Function” on page 8-10
Opening Function
The opening function is the first callback in every GUI code file. It is executed just beforethe GUI is made visible to the user, but after all the components have been created, i.e.,after the components' CreateFcn callbacks, if any, have been run.
You can use the opening function to perform your initialization tasks before the userhas access to the GUI. For example, you can use it to create data or to read data from anexternal source. GUI command-line arguments are passed to the opening function.
Function Naming and Template
GUIDE names the opening function by appending _OpeningFcn to the name of the GUI.This is an example of an opening function template as it might appear in the mygui codefile.% --- Executes just before mygui is made visible.
function mygui_OpeningFcn(hObject, eventdata, handles, varargin)
% This function has no output args, see OutputFcn.
% hObject handle to figure
% eventdata reserved - to be defined in a future version of MATLAB
% handles structure with handles and user data (see GUIDATA)
% varargin command line arguments to mygui (see VARARGIN)
% Choose default command line output for mygui
handles.output = hObject;
% Update handles structure
guidata(hObject, handles);
% UIWAIT makes mygui wait for user response (see UIRESUME)
% uiwait(handles.mygui);
Input Arguments
The opening function has four input arguments hObject, eventdata, handles, andvarargin. The first three are the same as described in “GUIDE Callback Syntax”

8 Programming a GUIDE GUI
8-8
on page 8-5. the last argument, varargin, enables you to pass arguments from thecommand line to the opening function. The opening function can take actions withthem (for example, setting property values) and also make the arguments available tocallbacks by adding them to the handles structure.
For more information about using varargin, see the varargin reference page and“Support Variable Number of Inputs”.
Passing Object Properties to an Opening Function
You can pass a property name/value pair for any component as two successive commandline arguments and set that value in the opening function. If you are setting a figureproperty, GUIDE handles this automatically. For example, my_gui('Position',[71.8 44.9 74.8 19.7]) opens the GUI at the specified position, since Position is avalid figure property (in character units, the default).
You can define new names for properties or combinations of them. For example, you canmake your GUI accept an alias for a figure property as a convenience to the user. Forexample, you might want the user to be able to open the GUI with a Title argumentinstead of calling it Name, which is the property that specifies the name on the GUI's titlebar. To do this, you must provide code in its OpeningFcn to set theName figure property.The following example illustrates how to do this.
If you pass an input argument that is not a valid figure property, your code mustrecognize its name and use the name/value pair to set the appropriate property on thecorrect object. Otherwise, the argument is ignored. The following example is from theopening function for the Modal Question Dialog GUI template, available from the GUIDEQuick Start dialog box. The added code opens the modal dialog with a message, specifiedfrom the command line or by another GUI that calls this one. For example,
mygui('String','Do you want to exit?')
displays the text 'Do you want to exit?' on the GUI. To do this, you need tocustomize the opening function because 'String' is not a valid figure property, it is astatic text property. The Modal Question Dialog template file contains the following code,which
• Uses the nargin function to determine the number of user-specified arguments(which do not include hObject, eventdata, and handles)
• Parses varargin to obtain property name/value pairs, converting each name string tolower case

Initialize a GUIDE GUI
8-9
• Handles the case where the argument 'title' is used as an alias for the figure Nameproperty
• Handles the case 'string' , assigning the following value as a String property tothe appropriate static text object
function modalgui_OpeningFcn(hObject, eventdata, handles, varargin)
.
.
.
% Insert custom Title and Text if specified by the user
% Hint: when choosing keywords, be sure they are not easily confused
% with existing figure properties. See the output of set(figure) for
% a list of figure properties.
if(nargin > 3)
for index = 1:2:(nargin-3),
if nargin-3==index, break, end
switch lower(varargin{index})
case 'title'
set(hObject, 'Name', varargin{index+1});
case 'string'
set(handles.text1, 'String', varargin{index+1});
end
end
end
.
.
.
The if block loops through the odd elements of varargin checking for property namesor aliases, and the case blocks assign the following (even) varargin element as a valueto the appropriate property of the figure or one of its components. You can add morecases to handle additional property assignments that you want the opening function toperform.
Initial Template Code
Initially, the input function template contains these lines of code:
• handles.output = hObject adds a new element, output, to the handlesstructure and assigns it the value of the input argument hObject, which is thehandle of the figure, i.e., the handle of the GUI. This handle is used later by theoutput function.
• guidata(hObject,handles) saves the handles structure. You must use theguidata function to save any changes that you make to the handles structure. It isnot sufficient just to set the value of a handles field.
• uiwait(handles.mygui), initially commented out, blocks GUI execution untiluiresume is called or the GUI is deleted. Note that uiwait allows the user access to

8 Programming a GUIDE GUI
8-10
other MATLAB windows. Remove the comment symbol for this statement if you wantthe GUI to be blocking when it opens.
Output Function
The output function returns, to the command line, outputs that are generated during itsexecution. It is executed when the opening function returns control and before controlreturns to the command line. This means that you must generate the outputs in theopening function, or call uiwait in the opening function to pause its execution whileother callbacks generate outputs.
Function Naming and Template
GUIDE names the output function by appending _OutputFcn to the name of the GUI.This is an example of an output function template as it might appear in the mygui codefile.% --- Outputs from this function are returned to the command line.
function varargout = mygui_OutputFcn(hObject, eventdata,...
handles)
% varargout cell array for returning output args (see VARARGOUT);
% hObject handle to figure
% eventdata reserved - to be defined in a future version of MATLAB
% handles structure with handles and user data (see GUIDATA)
% Get default command line output from handles structure
varargout{1} = handles.output;
Input Arguments
The output function has three input arguments: hObject, eventdata, and handles.They are the same as described in “GUIDE Callback Syntax” on page 8-5.
Output Arguments
The output function has one output argument, varargout, which it returns to thecommand line. By default, the output function assigns handles.output to varargout.So the default output is the handle to the GUI, which was assigned to handles.outputin the opening function.
You can change the output by taking one of these actions:
• Change the value of handles.output. It can be any valid MATLAB value includinga structure or cell array.
Initialize a GUIDE GUI
8-11
• Add output arguments to varargout. The varargout argument is a cell array. Itcan contain any number of output arguments. By default, GUIDE creates just oneoutput argument, handles.output. To create an additional output argument, createa new field in the handles structure and add it to varargout using a commandsimilar to
varargout{2} = handles.second_output;

8 Programming a GUIDE GUI
8-12
Callbacks for Specific Components
Coding the behavior of a UI component involves specific tasks that are unique to the typeof component you are working with. This topic contains simple examples of callbacks foreach type of component. The examples are written for GUIDE unless otherwise stated.For general information about coding callbacks, see “Write Callbacks Using the GUIDEWorkflow” or “Write Callbacks Using the Programmatic Workflow”.
In this section...
“How to Use the Example Code” on page 8-12“Push Button” on page 8-13“Toggle Button” on page 8-13“Radio Button” on page 8-14“Check Box” on page 8-14“Edit Text” on page 8-15“Slider” on page 8-16“List Box” on page 8-17“Pop-Up Menu” on page 8-19“Panel” on page 8-21“Button Group” on page 8-22“Menu Item” on page 8-23“Table” on page 8-26“Axes” on page 8-27
How to Use the Example Code
If you are working in GUIDE, then right-click on the component in your layout and selectthe appropriate callback property from the View Callbacks menu. Doing so createsan empty callback function that is automatically associated with the component. Thespecific function name that GUIDE creates is based on the component’s Tag property, soyour function name might be slightly different than the function name in the examplecode. Do not change the function name that GUIDE creates in your code. To use theexample code in your GUI, copy the code from the example’s function body into yourfunction’s body.

Callbacks for Specific Components
8-13
If you are creating a GUI programmatically, (without GUIDE), then you can adapt theexample code into your GUI. To adapt an example into your code, omit the third inputargument, handles, from the function definition. Also, replace any references to thehandles array with the appropriate object handle. To associate the callback functionwith the component, set the component's callback property to be a handle to the callbackfunction. For example, this command creates a push button component and sets theCallback property to be a handle to the function, pushbutton1_callback.pb =
uicontrol('Style','pushbutton','Callback',@pushbutton1_Callback);
Push Button
This code is an example of a push button callback function in GUIDE. Associate thisfunction with the push button Callback property to make it execute when the end userclicks on the push button.
function pushbutton1_Callback(hObject, eventdata, handles)
% hObject handle to pushbutton1 (see GCBO)
% eventdata reserved - to be defined in a future version of MATLAB
% handles structure with handles and user data (see GUIDATA)
display('Goodbye');
close(gcf);
The first line of code, display('Goodbye'), displays the string, 'Goodbye', in theCommand Window. The next line gets a handle to the GUI window using gcf and thencloses it.
Toggle Button
This code is an example of an example of a toggle button callback function in GUIDE.Associate this function with the toggle button Callback property to make it executewhen the end user clicks on the toggle button.
function togglebutton1_Callback(hObject,eventdata,handles)
% hObject handle to togglebutton1 (see GCBO)
% eventdata reserved - to be defined in a future version of MATLAB
% handles structure with handles and user data (see GUIDATA)
% Hint: get(hObject,'Value') returns toggle state of togglebutton1
button_state = get(hObject,'Value');
if button_state == get(hObject,'Max')
display('down');

8 Programming a GUIDE GUI
8-14
elseif button_state == get(hObject,'Min')
display('up');
end
The toggle button’s Value property matches the Min property when the toggle buttonis up. The Value changes to the Max value when the toggle button is depressed. Thiscallback function gets the toggle button’s Value property and then compares it with theMax and Min properties. If the button is depressed, then the function displays 'down' inthe Command Window. If the button is up, then the function displays 'up'.
Radio Button
This code is an example of a radio button callback function in GUIDE. Associate thisfunction with the radio button Callback property to make it execute when the end userclicks on the radio button.
function radiobutton1_Callback(hObject, eventdata, handles)
% hObject handle to radiobutton1 (see GCBO)
% eventdata reserved - to be defined in a future version of MATLAB
% handles structure with handles and user data (see GUIDATA)
% Hint: get(hObject,'Value') returns toggle state of radiobutton1
if (get(hObject,'Value') == get(hObject,'Max'))
display('Selected');
else
display('Not selected');
end
The radio button’s Value property matches the Min property when the radio button isnot selected. The Value changes to the Max value when the radio button is selected. Thiscallback function gets the radio button’s Value property and then compares it with theMax and Min properties. If the button is selected, then the function displays 'Selected'in the Command Window. If the button is not selected, then the function displays 'Notselected'.
Note Use a button group to manage exclusive selection behavior for radio buttons. See“Button Group” on page 8-22 for more information.
Check Box

Callbacks for Specific Components
8-15
This code is an example of a check box callback function in GUIDE. Associate thisfunction with the check box Callback property to make it execute when the end userclicks on the check box.
function checkbox1_Callback(hObject, eventdata, handles)
% hObject handle to checkbox1 (see GCBO)
% eventdata reserved - to be defined in a future version of MATLAB
% handles structure with handles and user data (see GUIDATA)
% Hint: get(hObject,'Value') returns toggle state of checkbox1
if (get(hObject,'Value') == get(hObject,'Max'))
display('Selected');
else
display('Not selected');
end
The check box’s Value property matches the Min property when the check box is notselected. The Value changes to the Max value when the check box is selected. Thiscallback function gets the check box’s Value property and then compares it with the Maxand Min properties. If the check box is selected, the function displays 'Selected' in theCommand Window. If the check box is not selected, it displays 'Not selected'.
Edit Text
This code is an example of an edit text box callback function in GUIDE. Associate thisfunction with the edit text box Callback property to make it execute when the end usertypes characters in the text box.
function edit1_Callback(hObject, eventdata, handles)
% hObject handle to edit1 (see GCBO)
% eventdata reserved - to be defined in a future version of MATLAB
% handles structure with handles and user data (see GUIDATA)
% Hints: get(hObject,'String') returns contents of edit1 as text
% str2double(get(hObject,'String')) returns contents as double
input = get(hObject,'String');
display(input);
When the end user types characters inside the edit text box and presses the Enter key,the callback function retrieves the string value and displays it in the Command Window.

8 Programming a GUIDE GUI
8-16
To enable users to enter multiple lines of text, set the Max and Min properties to numericvalues that satisfy Max - Min > 1. For example, set Max to 2, and Min to 0 to satisfythe inequality. In this case, the callback function triggers when the end user clicks on anarea in the GUI that is outside of the edit text box.
Retrieve Numeric Values
If you want to interpret the contents of an edit text box as numeric values, then convertthe characters to numbers using the str2double function. The str2double functionreturns NaN for nonnumeric input.
This code is an example of an edit text box callback function that interprets the user’sinput as numeric values.
function edit1_Callback(hObject, eventdata, handles)
% hObject handle to edit1 (see GCBO)
% eventdata reserved - to be defined in a future version of MATLAB
% handles structure with handles and user data (see GUIDATA)
% Hints: get(hObject,'String') returns contents of edit1 as text
% str2double(get(hObject,'String')) returns contents as a double
input = str2double(get(hObject,'string'));
if isnan(input)
errordlg('You must enter a numeric value','Invalid Input','modal')
uicontrol(hObject)
return
else
display(input);
end
When the end user enters values into the edit text box and presses the Enter key, thecallback function gets the value of the String property and converts it to a numericvalue. Then, it checks to see if the value is NaN (nonnumeric). If the input is NaN, thenthe callback presents an error dialog box.
Slider
This code is an example of a slider callback function in GUIDE. Associate this functionwith the slider Callback property to make it execute when the end user moves theslider.
function slider1_Callback(hObject, eventdata, handles)

Callbacks for Specific Components
8-17
% hObject handle to slider1 (see GCBO)
% eventdata reserved - to be defined in a future version of MATLAB
% handles structure with handles and user data (see GUIDATA)
% Hints: get(hObject,'Value') returns position of slider
% get(hObject,'Min') and get(hObject,'Max') to determine...
slider_value = get(hObject,'Value');
display(slider_value);
When the end user moves the slider, the callback function gets the current value of theslider and displays it in the Command Window. By default, the slider’s range is [0, 1]. Tomodify the range, set the slider’s Max and Min properties to the maximum and minimumvalues, respectively.
List Box
Populate Items in the List Box
If you are developing a GUI using GUIDE, use the list box CreateFcn callback to additems to the list box.
This code is an example of a list box CreateFcn callback that populates the list box withthe items, Red, Green, and Blue.
function listbox1_CreateFcn(hObject, eventdata, handles)
% hObject handle to listbox1 (see GCBO)
% eventdata reserved - to be defined in a future version of MATLAB
% handles empty - handles not created until after all CreateFcns
% Hint: listbox controls usually have a white background on Windows.
if ispc && isequal(get(hObject,'BackgroundColor'), ...
get(0,'defaultUicontrolBackgroundColor'))
set(hObject,'BackgroundColor','white');
end
set(hObject,'String',{'Red';'Green';'Blue'});
The last line, set(hObject,'String',{'Red';'Green';'Blue'}), populates thecontents of the list box.
If you are developing a GUI programmatically (without GUIDE), then populate the listbox when you create it. For example:
function mygui()

8 Programming a GUIDE GUI
8-18
figure
uicontrol('Style','Listbox',...
'String',{'Red';'Green';'Blue'},...
'Position',[40 70 80 50]);
end
Change the Selected Item
When the end user selects a list box item, the list box’s Value property changes to anumber that corresponds to the item’s position in the list. For example, a value of 1corresponds to the first item in the list. If you want to change the selection in your GUIcode, then change the Value property to another number between 1 and the number ofitems in the list.
For example, you can use the handles structure in GUIDE to access the list box andchange the Value property:
set(handles.listbox1,'Value',2)
The first argument, handles.listbox1, might be different in your code, depending onthe value of the list box Tag property.
Write the Callback Function
This code is an example of a list box callback function in GUIDE. Associate this functionwith the list box Callback property to make it execute when a selects an item in the listbox.
function listbox1_Callback(hObject, eventdata, handles)
% hObject handle to listbox1 (see GCBO)
% eventdata reserved - to be defined in a future version of MATLAB
% handles structure with handles and user data (see GUIDATA)
% Hints: contents = cellstr(get(hObject,'String')) returns contents
% contents{get(hObject,'Value')} returns selected item from listbox1
items = get(hObject,'String');
index_selected = get(hObject,'Value');
item_selected = items{index_selected};
display(item_selected);
When the end user selects an item in the list box, the callback function performs thefollowing tasks:
• Gets all the items in the list box and stores them in the variable, items.
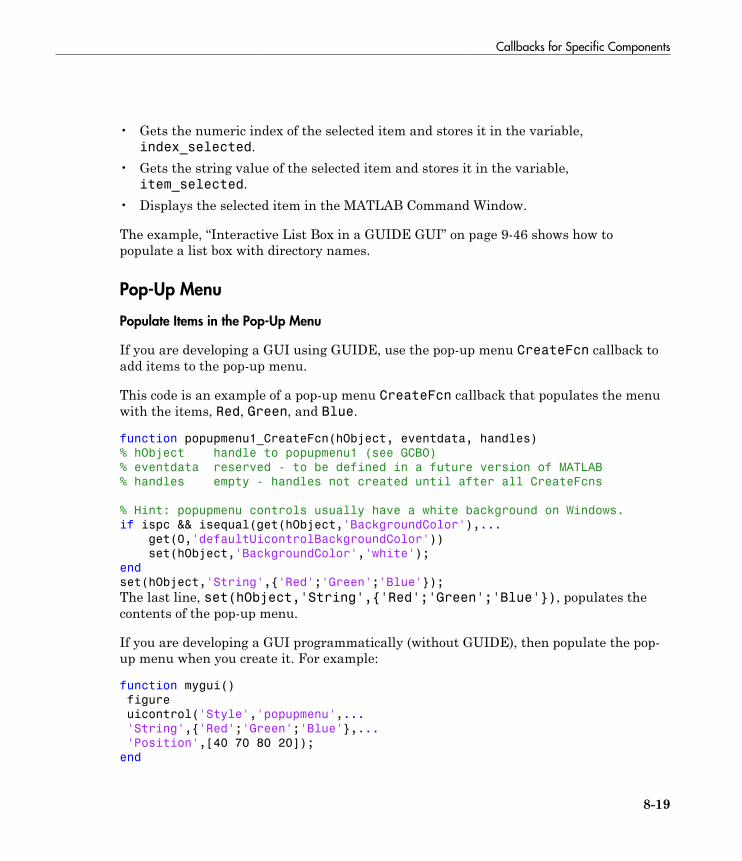
Callbacks for Specific Components
8-19
• Gets the numeric index of the selected item and stores it in the variable,index_selected.
• Gets the string value of the selected item and stores it in the variable,item_selected.
• Displays the selected item in the MATLAB Command Window.
The example, “Interactive List Box in a GUIDE GUI” on page 9-46 shows how topopulate a list box with directory names.
Pop-Up Menu
Populate Items in the Pop-Up Menu
If you are developing a GUI using GUIDE, use the pop-up menu CreateFcn callback toadd items to the pop-up menu.
This code is an example of a pop-up menu CreateFcn callback that populates the menuwith the items, Red, Green, and Blue.
function popupmenu1_CreateFcn(hObject, eventdata, handles)
% hObject handle to popupmenu1 (see GCBO)
% eventdata reserved - to be defined in a future version of MATLAB
% handles empty - handles not created until after all CreateFcns
% Hint: popupmenu controls usually have a white background on Windows.
if ispc && isequal(get(hObject,'BackgroundColor'),...
get(0,'defaultUicontrolBackgroundColor'))
set(hObject,'BackgroundColor','white');
end
set(hObject,'String',{'Red';'Green';'Blue'});
The last line, set(hObject,'String',{'Red';'Green';'Blue'}), populates thecontents of the pop-up menu.
If you are developing a GUI programmatically (without GUIDE), then populate the pop-up menu when you create it. For example:
function mygui()
figure
uicontrol('Style','popupmenu',...
'String',{'Red';'Green';'Blue'},...
'Position',[40 70 80 20]);
end

8 Programming a GUIDE GUI
8-20
Change the Selected Item
When the end user selects an item, the pop-up menu’s Value property changes to anumber that corresponds to the item’s position in the menu. For example, a value of 1corresponds to the first item in the list. If you want to change the selection in your GUIcode, then change the Value property to another number between 1 and the number ofitems in the menu.
For example, you can use the handles structure in GUIDE to access the pop-up menuand change the Value property:
set(handles.popupmenu1,'Value',2)
The first argument, handles.popupmenu1, might be different in your code, dependingon the value of the pop-up menu Tag property.
Write the Callback Function
This code is an example of a pop-up menu callback function in GUIDE. Associate thisfunction with the pop-up menu Callback property to make it execute when the end userselects an item from the menu.
function popupmenu1_Callback(hObject, eventdata, handles)
% hObject handle to popupmenu1 (see GCBO)
% eventdata reserved - to be defined in a future version of MATLAB
% handles structure with handles and user data (see GUIDATA)
% Hints: contents = cellstr(get(hObject,'String')) returns contents...
% contents{get(hObject,'Value')} returns selected item...
items = get(hObject,'String');
index_selected = get(hObject,'Value');
item_selected = items{index_selected};
display(item_selected);
When the end user selects an item in the pop-up menu, the callback function performsthe following tasks:
• Gets all the items in the pop-up menu and stores them in the variable, items.• Gets the numeric index of the selected item and stores it in the variable,
index_selected.• Gets the string value of the selected item and stores it in the variable,
item_selected.• Displays the selected item in the MATLAB Command Window.
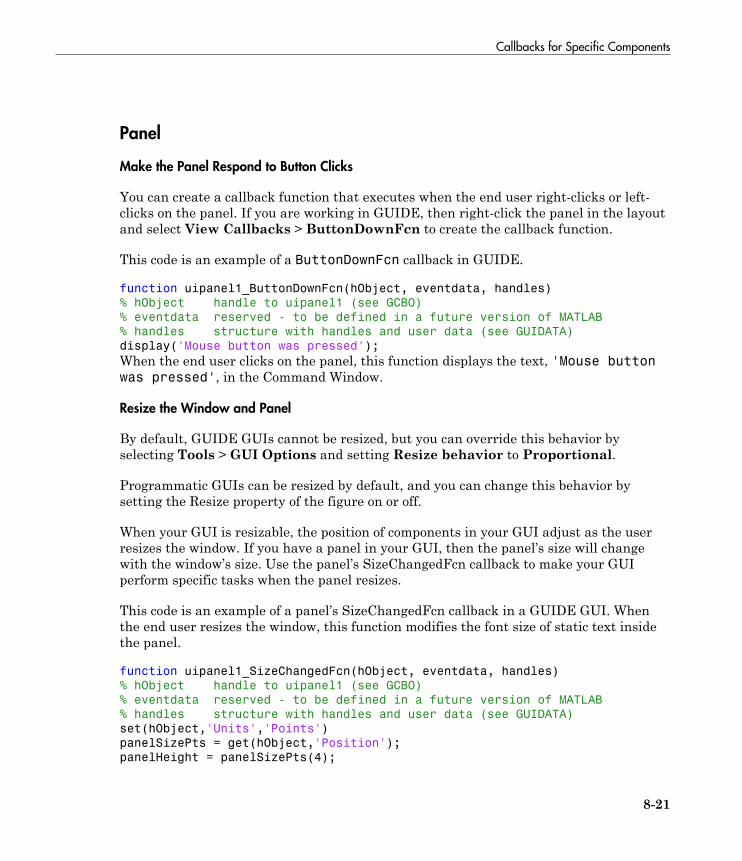
Callbacks for Specific Components
8-21
Panel
Make the Panel Respond to Button Clicks
You can create a callback function that executes when the end user right-clicks or left-clicks on the panel. If you are working in GUIDE, then right-click the panel in the layoutand select View Callbacks > ButtonDownFcn to create the callback function.
This code is an example of a ButtonDownFcn callback in GUIDE.
function uipanel1_ButtonDownFcn(hObject, eventdata, handles)
% hObject handle to uipanel1 (see GCBO)
% eventdata reserved - to be defined in a future version of MATLAB
% handles structure with handles and user data (see GUIDATA)
display('Mouse button was pressed');
When the end user clicks on the panel, this function displays the text, 'Mouse buttonwas pressed', in the Command Window.
Resize the Window and Panel
By default, GUIDE GUIs cannot be resized, but you can override this behavior byselecting Tools > GUI Options and setting Resize behavior to Proportional.
Programmatic GUIs can be resized by default, and you can change this behavior bysetting the Resize property of the figure on or off.
When your GUI is resizable, the position of components in your GUI adjust as the userresizes the window. If you have a panel in your GUI, then the panel’s size will changewith the window’s size. Use the panel’s SizeChangedFcn callback to make your GUIperform specific tasks when the panel resizes.
This code is an example of a panel’s SizeChangedFcn callback in a GUIDE GUI. Whenthe end user resizes the window, this function modifies the font size of static text insidethe panel.
function uipanel1_SizeChangedFcn(hObject, eventdata, handles)
% hObject handle to uipanel1 (see GCBO)
% eventdata reserved - to be defined in a future version of MATLAB
% handles structure with handles and user data (see GUIDATA)
set(hObject,'Units','Points')
panelSizePts = get(hObject,'Position');
panelHeight = panelSizePts(4);

8 Programming a GUIDE GUI
8-22
set(hObject,'Units','normalized');
newFontSize = 10 * panelHeight / 115;
texth = findobj('Tag','text1');
set(texth,'FontSize',newFontSize);
If your GUI has nested panels, then they will resize from the inside-out (in child-to-parent order).
Note: To make the text inside a panel resize automatically, set the fontUnits propertyto 'normalized'.
Button Group
Button groups are similar to panels, but they also manage exclusive selection of radiobuttons and toggle buttons. When a button group contains multiple radio buttons ortoggle buttons, the button group allows the end user to select only one of them.
Do not code callbacks for the individual buttons that are inside a button group. Instead,use the button group’s SelectionChangedFcn callback to respond when the end userselects a button.
This code is an example of a button group SelectionChangedFcn callback thatmanages two radio buttons and two toggle buttons.
function uibuttongroup1_SelectionChangedFcn(hObject, eventdata, handles)
% hObject handle to the selected object in uibuttongroup1
% eventdata structure with the following fields
% EventName: string 'SelectionChanged' (read only)
% OldValue: handle of the previously selected object or empty
% NewValue: handle of the currently selected object
% handles structure with handles and user data (see GUIDATA)
switch get(eventdata.NewValue,'Tag') % Get Tag of selected object.
case 'radiobutton1'
display('Radio button 1');
case 'radiobutton2'
display('Radio button 2');
case 'togglebutton1'
display('Toggle button 1');
case 'togglebutton2'
display('Toggle button 2');
end

Callbacks for Specific Components
8-23
When the end user selects a radio button or toggle button in the button group, thisfunction determines which button the user selected based on the button’s Tag property.Then, it executes the code inside the appropriate case.
Note: The button group’s SelectedObject property contains a handle to the buttonthat user selected. You can use this property elsewhere in your GUI code to determinewhich button the user selected.
Menu Item
The code in this section contains example callback functions that respond when the enduser selects Edit > Copy > To File in this menu.

8 Programming a GUIDE GUI
8-24
% --------------------------------------------------------------------
function edit_menu_Callback(hObject, eventdata, handles)
% hObject handle to edit_menu (see GCBO)
% eventdata reserved - to be defined in a future version of MATLAB
% handles structure with handles and user data (see GUIDATA)
display('Edit menu selected');
% --------------------------------------------------------------------
function copy_menu_item_Callback(hObject, eventdata, handles)

Callbacks for Specific Components
8-25
% hObject handle to copy_menu_item (see GCBO)
% eventdata reserved - to be defined in a future version of MATLAB
% handles structure with handles and user data (see GUIDATA)
display('Copy menu item selected');
% --------------------------------------------------------------------
function tofile_menu_item_Callback(hObject, eventdata, handles)
% hObject handle to tofile_menu_item (see GCBO)
% eventdata reserved - to be defined in a future version of MATLAB
% handles structure with handles and user data (see GUIDATA)
[filename,path] = uiputfile('myfile.m','Save file name');
The function names might be different in your GUI, depending on the tag names youspecify in the GUIDE Menu Editor.
The callback functions trigger in response to these actions:
• When the end user selects the Edit menu, the edit_menu_Callback functiondisplays the text, 'Edit menu selected', in the MATLAB Command Window.
• When the end user hovers the mouse over the Copy menu item, thecopy_menu_item_Callback function displays the text, 'Copy menu itemselected', in the MATLAB Command Window.
• When the end user clicks and releases the mouse button on the To File menu item,the tofile_menu_item_Callback function displays a dialog box that prompts theend user to select a destination folder and file name.
The tofile_menu_item_Callback function calls the uiputfile function to promptthe end user to supply a destination file and folder. If you want to create a menu itemthat prompts the user for an existing file, for example, if your GUI has an Open Filemenu item, then use the uigetfile function.
When you create a cascading menu like this one, the intermediate menu items triggerwhen the mouse hovers over them. The final, terminating, menu item triggers when themouse button releases over the menu item.
How to Update a Menu Item Check
You can add a check mark next to a menu item to indicate that an option is enabled. InGUIDE, you can select Check mark this item in the Menu Editor to make the menuitem checked by default. Each time the end user selects the menu item, the callbackfunction can turn the check on or off.
This code shows how to change the check mark next to a menu item.

8 Programming a GUIDE GUI
8-26
if strcmp(get(hObject,'Checked'),'on')
set(hObject,'Checked','off');
else
set(hObject,'Checked','on');
end
The strcmp function compares two strings and returns true when they match. In thiscase, it returns true when the menu item’s Checked property matches the string, 'on'.
See “Create Menus for GUIDE GUIs” for more information about creating menu items inGUIDE. See “Create Menus for Programmatic GUIs” for more information about creatingmenu items programmatically.
Table
This code is an example of the table callback function, CellSelectionCallback.Associate this function with the table CellSelectionCallback property to make itexecute when the end user selects cells in the table.
function uitable1_CellSelectionCallback(hObject, eventdata, handles)
% hObject handle to uitable1 (see GCBO)
% eventdata structure with the following fields
% Indices: row and column indices of the cell(s) currently selected
% handles structure with handles and user data (see GUIDATA)
data = get(hObject,'Data');
indices = eventdata.Indices;
r = indices(:,1);
c = indices(:,2);
linear_index = sub2ind(size(data),r,c);
selected_vals = data(linear_index);
selection_sum = sum(sum(selected_vals))
When the end user selects cells in the table, this function performs the following tasks:
• Gets all the values in the table and stores them in the variable, data.• Gets the indices of the selected cells. These indices correspond to the rows and
columns in data.• Converts the row and column indices into linear indices. The linear indices allow you
to select multiple elements in an array using one command.• Gets the values that the end user selected and stores them in the variable,
selected_vals.

Callbacks for Specific Components
8-27
• Sums all the selected values and displays the result in the Command Window.
This code is an example of the table callback function, CellEditCallback. Associatethis function with the table CellEditCallback property to make it execute when theend user edits a cell in the table.
function uitable1_CellEditCallback(hObject, eventdata, handles)
% hObject handle to uitable1 (see GCBO)
% eventdata structure with the following fields
% Indices: row and column indices of the cell(s) edited
% PreviousData: previous data for the cell(s) edited
% EditData: string(s) entered by the user
% NewData: EditData or its converted form set on the Data property.
% Empty if Data was not changed
% Error: error string when failed to convert EditData
data = get(hObject,'Data');
data_sum = sum(sum(data))
When the end user finishes editing a table cell, this function gets all the values in thetable and calculates the sum of all the table values. The ColumnEditable property mustbe set to true in at least one column to allow the end user to edit cells in the table. Formore information about creating tables and modifying their properties in GUIDE, see“Add Components to the GUIDE Layout Area”.
Axes
The code in this section is an example of an axes ButtonDownFcn that triggers when theend user clicks on the axes.

8 Programming a GUIDE GUI
8-28
function axes1_ButtonDownFcn(hObject, eventdata, handles)
% hObject handle to axes1 (see GCBO)
% eventdata reserved - to be defined in a future version of MATLAB
% handles structure with handles and user data (see GUIDATA)
pt = get(hObject,'CurrentPoint')
The coordinates of the pointer display in the MATLAB Command Window when the enduser clicks on the axes (but not when that user clicks on another graphics object parentedto the axes).

Callbacks for Specific Components
8-29
Note: Most MATLAB plotting functions clear the axes and reset a number of axesproperties, including the ButtonDownFcn, before plotting data. To create an interfacethat lets the end user plot data interactively, consider providing a component such asa push button to control plotting. Such components’ properties are unaffected by theplotting functions. If you must use the axes ButtonDownFcn to plot data, then usefunctions such as line, patch, and surface.

8 Programming a GUIDE GUI
8-30
Examples of GUIDE GUIs
The following are examples that are packaged with MATLAB. The introductory text formost examples provides instructions on copying them to a writable folder on your system,so you can follow along.
• “Modal Dialog Box in a GUIDE GUI” on page 9-2• “GUI For Managing Persistent Data” on page 9-7• “GUI That Accepts Parameters and Generates Plots” on page 9-20• “Synchronized Data Presentations in a GUIDE GUI” on page 9-30• “Interactive List Box in a GUIDE GUI” on page 9-46• “Plot Workspace Variables in a GUIDE GUI” on page 9-52• “GUI for Setting Simulink Model Parameters” on page 9-57• “Animation with Slider Controls in a GUIDE GUI” on page 9-68• “Automatically Refresh Plot in a GUIDE GUI” on page 9-79

9
Examples of GUIDE GUIs
• “Modal Dialog Box in a GUIDE GUI” on page 9-2• “GUI For Managing Persistent Data” on page 9-7• “GUI That Accepts Parameters and Generates Plots” on page 9-20• “Synchronized Data Presentations in a GUIDE GUI” on page 9-30• “Interactive List Box in a GUIDE GUI” on page 9-46• “Plot Workspace Variables in a GUIDE GUI” on page 9-52• “GUI for Setting Simulink Model Parameters” on page 9-57• “Animation with Slider Controls in a GUIDE GUI” on page 9-68• “Automatically Refresh Plot in a GUIDE GUI” on page 9-79

9 Examples of GUIDE GUIs
9-2
Modal Dialog Box in a GUIDE GUI
In this section...
“About the Example” on page 9-2“Set Up the Close Confirmation Dialog Box” on page 9-2“Set Up a GUI with a Close Button” on page 9-3“Run the Close Confirmation GUI” on page 9-4“How the Close Confirmation GUIs Work” on page 9-5
About the Example
This example shows how to create a modal dialog box to work with a GUI that has aClose button. Clicking the Close button displays the modal dialog box, which asks Areyou sure you want to close?.
Set Up the Close Confirmation Dialog Box
1 On the Home tab, in the Environment section, click Preferences > GUIDE >Show names in component palette.
2 In the Command window, type guide.3 In the GUIDE Quick Start dialog box, select Modal Question Dialog. Then, click
OK.

Modal Dialog Box in a GUIDE GUI
9-3
4 In the Layout Editor, right-click the static text, Do you want to create aquestion dialog?, and select Property Inspector.
5 Change the String property value to Are you sure you want to close?6 In the Layout Editor select File > Save.7 In the Save As dialog box, in the File name field, type modaldlg.fig.
Set Up a GUI with a Close Button
To set up a separate GUI with a Close button:
1 In the GUIDE Layout Editor, select File > New.2 In the GUIDE Quick Start dialog box, select Blank GUI (Default). Then, click OK.3 From the component palette on the left, drag a push button into the layout area.4 Right-click the push button and select Property Inspector.5 Change the String property value to Close.6 Change the Tag property value to close_pushbutton.7 From the File menu, select Save.8 In Save As dialog box, in the File name field, type closedlg.fig. Then, click
Save.
The code file, closedlg.m, opens in the Editor.

9 Examples of GUIDE GUIs
9-4
On the Editor tab, in the Navigate section, click Go To, and then selectclose_pushbutton_Callback.
The following generated code for the Close button callback appears in the Editor: % --- Executes on button press in close_pushbutton.
function close_pushbutton_Callback(hObject, eventdata, handles)
% hObject handle to close_pushbutton (see GCBO)
% eventdata reserved - to be defined in a future version of MATLAB
% handles structure with handles and user data (see GUIDATA)
9 After the preceding comments, add the following:% Get the current position of the GUI from the handles structure
% to pass to the modal dialog.
pos_size = get(handles.figure1,'Position');
% Call modaldlg with the argument 'Position'.
user_response = modaldlg('Title','Confirm Close');
switch user_response
case {'No'}
% take no action
case 'Yes'
% Prepare to close GUI application window
% .
% .
% .
delete(handles.figure1)
end
10 Save closedlg.m.
Run the Close Confirmation GUI
1 On the Layout Editor toolbar, click the Run button .2 In the closedlg dialog box, click the Close push button.
The modal dialog box opens.
3 Click Yes or No.

Modal Dialog Box in a GUIDE GUI
9-5
• Yes closes both dialog boxes.• No closes just the Confirm Close dialog box.
How the Close Confirmation GUIs Work
This section describes how the GUIs work:
1 When you click the Close button, the close_pushbutton_Callback:
a Gets the current position of the GUI from the handles structure with thecommand:
pos_size = get(handles.figure1,'Position')
b Calls the modal dialog box with the command:
user_response = modaldlg('Title','Confirm Close');
Tip This is an example of calling a GUI with a property value pair. In this case,the figure property is 'Title', and its value is the string 'Confirm Close'.Opening modaldlg with this syntax displays the text “Confirm Close” at the topof the dialog box.
2 The modal dialog box opens with the 'Position' obtained from the GUI that callsit.
3 The opening function in the modal modaldlg code file:
• Makes the dialog box modal.• Executes the uiwait command, which causes the dialog box to wait for you to
click Yes or No, or click the close button (X) on the window border.4 When you click one of the two push buttons, the callback for the push button:
• Updates the output field in the handles structure.• Executes uiresume to return control to the opening function where uiwait is
called.5 The output function is called, which returns the string Yes or No as an output
argument, and deletes the dialog box with the command:
delete(handles.figure1)

9 Examples of GUIDE GUIs
9-6
6 When the GUI with the Close button regains control, it receives the string Yes orNo. If the string is 'No', it does nothing. If the string is 'Yes', the Close buttoncallback closes the GUI with the command:
delete(handles.figure1)

GUI For Managing Persistent Data
9-7
GUI For Managing Persistent Data
In this section...
“About the Example” on page 9-7“Calling Syntax” on page 9-8“MAT-file Validation” on page 9-9“GUI Behavior” on page 9-10“Overall GUI Characteristics” on page 9-17
About the Example
This example shows how to manage MAT-file data using local functions in a GUIDEGUI. It steps you through the code that reads and displays data from a MAT-file. Inaddition, the GUI provides a File menu for saving a MAT-file (or loading a new one), anda Contact menu for adding entries to the MAT-file.
To get and view the example code:
1 Copy the example FIG-file and code file to your current (writeable) folder and openthe FIG-file in GUIDE:

9 Examples of GUIDE GUIs
9-8
copyfile(fullfile(docroot, 'techdoc','creating_guis',...
'examples','addr*.*')),...
fileattrib('addr*.*', '+w');
guide address_book.fig;
2 In the GUIDE Layout Editor, click the Editor button .
The address_book.m code file opens in the MATLAB Editor.
Calling Syntax
The “address_book_OpeningFcn” on page 9-8 code in address_book.minterprets the input arguments:
• If you call the GUI, address_book, with no arguments, the GUI uses the defaultaddress book MAT-file.
• If you invoke the GUI with a pair of arguments (for example,address_book('book','my_list.mat')) , the first argument, 'book', is a keyword that the code looks for in the opening function. If the key word matches, the codeuses the second argument as the MAT-file for the address book.
address_book_OpeningFcn
function address_book_OpeningFcn(hObject, eventdata, ...
handles, varargin)
% Choose default command line output for address_book
handles.output = hObject;
% Make figure non-dockable
% set(hObject,'DockControls','off')
set(hObject,'WindowStyle','normal')
set(hObject,'HandleVisibility','callback')
% Update handles structure
guidata(hObject, handles);
if nargin < 4
% Load the default address book
Check_And_Load([],handles);
% If first element in varargin is 'book' and the second element is a
% MATLAB file, then load that file
elseif (length(varargin) == 2 && ...

GUI For Managing Persistent Data
9-9
strcmpi(varargin{1},'book') && ...
(2 == exist(varargin{2},'file')))
Check_And_Load(varargin{2},handles);
else
errordlg('File Not Found','File Load Error')
set(handles.Contact_Name,'String','')
set(handles.Contact_Phone,'String','')
end
MAT-file Validation
To be a valid address book, the MAT-file must contain a structure called Addresses thathas two fields called Name and Phone. The “Check_And_Load” on page 9-9 functionin address_book.m validates and loads the data as follows:
• Loads the specified file or the default if no file is specified.• Determines if the MAT-file is a valid address book.• Displays the data if it is valid. If the data is not valid, displays an error dialog box
(errordlg).• Returns 1 for valid MAT-files and 0 if invalid (used by the Open menu callback).• Saves the following items in the handles structure:
• The name of the MAT-file• The Addresses structure• An index pointer indicating which name and phone number are currently
displayed in the GUI
Check_And_Load
function pass = Check_And_Load(file,handles)
% Initialize the variable "pass" to determine if this is
% a valid file.
pass = 0;
% If called without any file then set file to the default
% file name. Otherwise if the file exists then load it.
if isempty(file)
file = 'addrbook.mat';
handles.LastFile = file;
guidata(handles.Address_Book,handles)

9 Examples of GUIDE GUIs
9-10
end
if exist(file,'file') == 2
data = load(file);
end
% Validate the MAT-file
% The file is valid if the variable is called "Addresses"
% and it has fields called "Name" and "Phone"
flds = fieldnames(data);
if (length(flds) == 1) && (strcmp(flds{1},'Addresses'))
fields = fieldnames(data.Addresses);
if (length(fields) == 2) && (strcmp(fields{1},'Name'))...
&& (strcmp(fields{2},'Phone'))
pass = 1;
end
end
% If the file is valid, display it
if pass
% Add Addresses to the handles structure
handles.Addresses = data.Addresses;
% Display the first entry
set(handles.Contact_Name,'String',data.Addresses(1).Name)
set(handles.Contact_Phone,'String',data.Addresses(1).Phone)
% Set the index pointer to 1
handles.Index = 1;
% Save the modified handles structure
guidata(handles.Address_Book,handles)
else
errordlg('Not a valid Address Book','Address Book Error')
end
GUI Behavior
• “Open and Load MAT-File” on page 9-11• “Retrieve and Store Data” on page 9-11• “Data Update Confirmation” on page 9-13• “Paging Through Entries — Prev/Next” on page 9-14• “Save File” on page 9-15• “Clear GUI Fields” on page 9-17
GUI For Managing Persistent Data
9-11
Open and Load MAT-File
The address book GUI contains a File > Open menu option for loading address bookMAT-files.
When you select this option, “Open_Callback” on page 9-11 in address_book.mopens a dialog box that enables you to browse for files.
The dialog box returns the file name and the path to the file, which are passedto fullfile to ensure the path is properly constructed for any platform. TheCheck_And_Load function validates and loads the new address book.
For information on creating the menu, see “Create Menus for GUIDE GUIs” on page6-91.
Open_Callback
function Open_Callback(hObject, eventdata, handles, varargin)
[filename, pathname] = uigetfile( ...
{'*.mat', 'All MAT-Files (*.mat)'; ...
'*.*','All Files (*.*)'}, ...
'Select Address Book');
% If "Cancel" is selected then return
if isequal([filename,pathname],[0,0])
return
% Otherwise construct the full file name and _and load the file.
else
File = fullfile(pathname,filename);
% if the MAT-file is not valid, do not save the name
if Check_And_Load(File,handles)
handles.LastFIle = File;
guidata(hObject,handles)
end
end
Retrieve and Store Data
The GUI’s Contact Name text box displays the name of the address book entry. If youtype in a new name and press enter, the “Contact_Name_Callback” on page 9-12 inaddress_book.m does the following:
• If the name exists in the current address book, the corresponding phone numberdisplays.

9 Examples of GUIDE GUIs
9-12
• If the name does not exist, a question dialog box asks you if you want to create a newentry, or cancel and return to the name previously displayed.
• If you create a new entry, you must save the MAT-file using the File > Save menu.
The Contact_Name_Callback callback uses the handles structure to access thecontents of the address book and to maintain an index pointer (handles.Index) thatenables the callback to determine what name is displayed before you enter a new one.The index pointer indicates what name is currently displayed. The Check_And_Loadfunction adds the address book and index pointer fields when you run the GUI.
If you add a new entry, the callback adds the new name to the address book and updatesthe index pointer to reflect the new value displayed. The updated address book and indexpointer are again saved (using guidata) in the handles structure.Contact_Name_Callback
function Contact_Name_Callback(hObject, eventdata, handles, varargin)
% Get the strings in the Contact Name and Phone text box
Current_Name = get(handles.Contact_Name,'string');
Current_Phone = get(handles.Contact_Phone,'string');
% If empty then return
if isempty(Current_Name)
return
end
% Get the current list of addresses from the handles structure
Addresses = handles.Addresses;
% Go through the list of contacts
% Determine if the current name matches an existing name
for i = 1:length(Addresses)
if strcmp(Addresses(i).Name,Current_Name)
set(handles.Contact_Name,'string',Addresses(i).Name)
set(handles.Contact_Phone,'string',Addresses(i).Phone)
handles.Index = i;
guidata(hObject,handles)
return
end
end
% If it's a new name, ask to create a new entry
Answer=questdlg('Do you want to create a new entry?', ...
'Create New Entry', ...

GUI For Managing Persistent Data
9-13
'Yes','Cancel','Yes');
switch Answer
case 'Yes'
Addresses(end+1).Name = Current_Name; % Grow array by 1
Addresses(end).Phone = Current_Phone;
index = length(Addresses);
handles.Addresses = Addresses;
handles.Index = index;
guidata(hObject,handles)
return
case 'Cancel'
% Revert back to the original number
set(handles.Contact_Name,'string',Addresses(handles.Index).Name)
set(handles.Contact_Phone,'String',Addresses(handles.Index).Phone)
return
end
Data Update Confirmation
The Contact Phone # text box displays the phone number of the entry listed in theContact Name text box. If you type in a new number and click one of the push buttons,“Contact_Phone_Callback” on page 9-13 in address_book.m opens a question dialogbox that asks you if you want to change the existing number or cancel your change.
This callback uses the index pointer (handles.Index) to update the new number in theaddress book and to revert to the previously displayed number if you click Cancel in thequestion dialog box. Both the current address book and the index pointer are saved in thehandles structure so that this data is available to other callbacks.
Contact_Phone_Callback
function Contact_Phone_Callback(hObject, eventdata, handles, varargin)
Current_Phone = get(handles.Contact_Phone,'string');
% If either one is empty then return
if isempty(Current_Phone)
return
end
% Get the current list of addresses from the handles structure
Addresses = handles.Addresses;
Answer=questdlg('Do you want to change the phone number?', ...
'Change Phone Number', ...
'Yes','Cancel','Yes');
9 Examples of GUIDE GUIs
9-14
switch Answer
case 'Yes'
% If no name match was found create a new contact
Addresses(handles.Index).Phone = Current_Phone;
handles.Addresses = Addresses;
guidata(hObject,handles)
return
case 'Cancel'
% Revert back to the original number
set(handles.Contact_Phone,'String',Addresses(handles.Index).Phone)
return
end
Paging Through Entries — Prev/Next
By clicking the Prev and Next buttons you can page back and forth through theentries in the address book. The Callback property of both push buttons are set to call“Prev_Next_Callback” on page 9-14 in address_book.m.
The Prev_Next_Callback defines an additional argument, str, that indicates whichbutton, Prev or Next, is clicked. The Prev button Callback property includes 'Prev'as the last argument. The Next button Callback string includes 'Next' as the lastargument. The value of str is used in case statements to implement each button'sfunction.
The Prev_Next_Callback gets the current index pointer and the addresses fromthe handles structure and, depending on which button you click, the index pointerdecrements or increments and the corresponding address and phone number display. Thefinal step stores the new value for the index pointer in the handles structure and savesthe updated structure using guidata.
Prev_Next_Callback
function Prev_Next_Callback(hObject, eventdata, handles, str)
% Get the index pointer and the addresses
index = handles.Index;
Addresses = handles.Addresses;
% Depending on whether Prev or Next was clicked,
% change the display
switch str
case 'Prev'
% Decrease the index by one
i = index - 1;
GUI For Managing Persistent Data
9-15
% If the index is less than one then set
% it equal to the index of the
% last element in the Addresses array
if i < 1
i = length(Addresses);
end
case 'Next'
% Increase the index by one
i = index + 1;
% If the index is greater than the size of the array then point
% to the first item in the Addresses array
if i > length(Addresses)
i = 1;
end
end
% Get the appropriate data for the index in selected
Current_Name = Addresses(i).Name;
Current_Phone = Addresses(i).Phone;
set(handles.Contact_Name,'string',Current_Name)
set(handles.Contact_Phone,'string',Current_Phone)
% Update the index pointer to reflect the new index
handles.Index = i;
guidata(hObject,handles)
Save File
When you make changes to an address book, the File submenus Save and Save Asenable you to save the current MAT-file, or save it as a new MAT-file. These menuswere created with the Menu Editor (Tools > Menu Editor, and use the same callback,Save_Callback.
“Save_Callback” on page 9-16 in address_book.m uses the menu Tag property(also specified in the Menu Editor) to identify whether Save or Save As is the callbackobject (that is, the object whose handle is passed in as the first argument to theSave_Callback).
The handles structure contains the Addresses structure, which the GUI mustsave (handles.Addresses) as well as the name of the currently loaded MAT-file (handles.LastFile). When you change a name or number in the GUI,

9 Examples of GUIDE GUIs
9-16
the Contact_Name_Callback or the Contact_Phone_Callback updateshandles.Addresses.
If you select Save, the save function is called to save the current MAT-file with the newnames and phone numbers.
If you select Save As, a dialog box displays which enables you to select the name of anexisting MAT-file or specify a new file. The dialog box returns the selected file name andpath. The final steps include:
• Using fullfile to create a platform-independent path name.• Calling save to save the new data in the MAT-file.• Updating the handles structure to contain the new MAT-file name.• Calling guidata to save the handles structure.
Save_Callback
function Save_Callback(hObject, eventdata, handles, varargin)
% Get the Tag of the menu selected
Tag = get(hObject,'Tag');
% Get the address array
Addresses = handles.Addresses;
% Based on the item selected, take the appropriate action
switch Tag
case 'Save'
% Save to the default addrbook file
File = handles.LastFile;
save(File,'Addresses')
case 'Save_As'
% Allow the user to select the file name to save to
[filename, pathname] = uiputfile( ...
{'*.mat';'*.*'}, ...
'Save as');
% If 'Cancel' was selected then return
if isequal([filename,pathname],[0,0])
return
else
% Construct the full path and save
File = fullfile(pathname,filename);
save(File,'Addresses')
handles.LastFile = File;
GUI For Managing Persistent Data
9-17
guidata(hObject,handles)
end
end
Clear GUI Fields
The Create New menu clears the Contact Name and Contact Phone # text fields tofacilitate adding a new name and number. The New_Callback callback sets the textString properties to empty strings:
function New_Callback(hObject, eventdata, handles, varargin)
set(handles.Contact_Name,'String','')
set(handles.Contact_Phone,'String','')
Overall GUI Characteristics
The GUI is nonblocking and nonmodal because it is designed to be displayed while youperform other MATLAB tasks. GUI options, which you can view by selecting Tools >GUI Options in GUIDE specify the following:
• Resize behavior: Other (Use SizeChangedFcn)
This sets the figure's SizeChangedFcn property to:
@(hObject,eventdata)address_book('Address_Book_SizeChangedFcn',...
hObject,eventdata,guidata(hObject))
• Command-line accessibility: Off• Generate FIG file and MATLAB file (selected)• Generate callback function prototypes (selected)• GUI allows only one instance to run (singleton) (selected)
GUI Resize Behavior
When you resize the GUI, MATLAB calls the SizeChangedFcn callback. In this case, thename of the SizeChangedFcn callback is Address_Book_SizeChangedFcn.
The SizeChangedFcn callback enables you to make the GUI wider, so it can accommodatelong names and numbers. However, you cannot make the GUI narrower than its originalwidth and you cannot change the height. These restrictions simplify the callback, whichmust maintain the proper proportions between the figure size and the components in theGUI.

9 Examples of GUIDE GUIs
9-18
When the you resize the figure and release the mouse, the SizeChangedFcn callbackexecutes. Unless you have maximized the figure, the SizeChangedFcn callback enforcesthe height of the GUI and resets the width of the Contact Name field. The followingsections describe how this calculation works.Width Changes
If the new width is greater than the original width, set the figure to the new width.
The size of the Contact Name text box changes in proportion to the new figure width.This is accomplished by:
• Obtaining the figure width as a ratio of its original width.• Expanding or contracting the width of the Contact Name field proportionally.
If the new width is less than the original width, use the original width. The code relies onthe fact that the original width of the Contact Name field is 72 character units.Height Changes
The height and width of the GUI is specified in pixel units. Using units of pixels enablesmaximizing and minimizing the figure to work properly. The code assumes that itsdimensions are 470-by-250 pixels. If you attempt to change the height, the code restoresthe original height. However, because the resize function is triggered when you releasethe mouse button after changing the size, the resize function cannot always determinethe original position of the GUI on screen. Therefore, the resize function applies acompensation to the vertical position (second element in the figure Position vector) byadding the vertical position to the height when you release the mouse and subtractingthe original height.
When you resize the GUI from the bottom, the GUI stays in the same position. When youresize from the top, the GUI moves to the location where you release the mouse button.SizeChangedFcn
% uicontrol units are in 'characters'
Figure_Size = get(hObject,'Position');
% This is the figure's original position in pixel units
Original_Size = [350 700 470 250];
% If the figure seems to be maximized, do not resize at all
pix_pos = get(hObject,'Position');
scr_size = get(groot,'ScreenSize');
if .99*scr_size(3) < pix_pos(3) % Apparently maximized
% When docked, get out

GUI For Managing Persistent Data
9-19
return
end
% If resized figure is smaller than original figure, then compensate.
% However, do not change figure size if it is docked; just adjust
% uicontrols
if ~strcmp(get(hObject,'WindowStyle'),'docked')
if Figure_Size(3) < Original_Size(3)
% If the width is too small then reset to origianl width
set(hObject,'Position',[Figure_Size(1) ...
Figure_Size(2) ...
Original_Size(3) ...
Original_Size(4)])
Figure_Size = get(hObject,'Position');
end
if abs(Figure_Size(4) - Original_Size(4)) > 10 % pixels
% Do not allow the height to change
set(hObject,'Position',[Figure_Size(1) ...
Figure_Size(2)+Figure_Size(4)-Original_Size(4) ...
Figure_Size(3) ...
Original_Size(4)])
end
movegui(hObject, 'onscreen')
end
% Get Contact_Name field Position for readjusting its width
C_N_pos = get(handles.Contact_Name,'Position');
ratio = Figure_Size(3) / Original_Size(3);
% Reset it so that its width remains proportional to figure width
% The original width of the Contact_Name box is 72 (characters)
set(handles.Contact_Name,'Position',[C_N_pos(1) ...
C_N_pos(2) ...
ratio * 72 ...
C_N_pos(4)])
Keeping Resized Figure On Screen
The SizeChangedFcn callback calls movegui to ensure that the resized GUI is on screenregardless of where you release the mouse.
The first time it runs, the GUI displays at the size and location specified by the figurePosition property. This property was set with the Property Inspector when the GUIwas created and it can be changed it in GUIDE at any time.

9 Examples of GUIDE GUIs
9-20
GUI That Accepts Parameters and Generates Plots
In this section...
“About the Example” on page 9-20“GUI Design” on page 9-22“Validate GUI Input as Numbers” on page 9-24“Plot Push Button Behavior” on page 9-27
About the Example
This example shows how to create a GUIDE GUI that accepts input parameters and plotsdata in two axes. The parameters define a time-varying and frequency-varying signal.One plot displays the data in the time domain, and the other plot displays the data in thefrequency domain.

GUI That Accepts Parameters and Generates Plots
9-21
To get and view the example code:
1 Copy the example FIG-file and code file to your current (writeable) folder and openthe FIG-file in GUIDE:
copyfile(fullfile(docroot, 'techdoc','creating_guis',...
'examples','two_axes*.*')), fileattrib('two_axes*.*', '+w')
guide two_axes.fig
2 From the GUIDE Layout Editor, click the Editor button .
The two_axes.m code displays in the MATLAB Editor.

9 Examples of GUIDE GUIs
9-22
If you run the GUI and click the Plot button, the GUI appears as shown in the precedingfigure. The GUI code evaluates the expression displayed at the top of the GUI usingparameters that you enter in the f1, f2, and t fields. The upper line graph displays aFourier transform of the computed signal displayed in the lower line graph.
GUI Design
This GUI plots two graphs depicting three input values:
• Frequency one (f1)• Frequency two (f2)• A time vector (t)
When you click the Plot button, the GUI puts these values into a MATLAB expressionthat is the sum of two sine functions:
x = sin(2*pi*f1*t) + sin(2*pi*f2*t)
Then, the GUI calculates the FFT (fast Fourier transform) of x and plots the data in thefrequency domain and the time domain in separate axes.
Default Values for Inputs
The GUI provides default values for the three inputs. This enables you to click the Plotbutton and see a result as soon as you run the GUI. The defaults indicate typical values.
The default values are created by setting the String property of the edit text. Thefollowing figure shows how the value was set for the time vector.
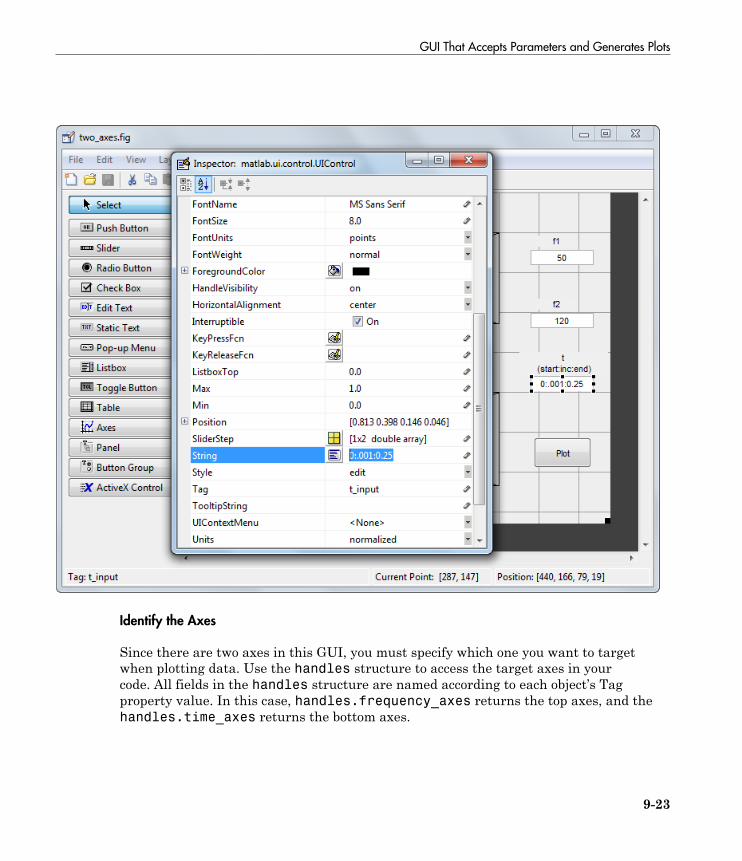
GUI That Accepts Parameters and Generates Plots
9-23
Identify the Axes
Since there are two axes in this GUI, you must specify which one you want to targetwhen plotting data. Use the handles structure to access the target axes in yourcode. All fields in the handles structure are named according to each object’s Tagproperty value. In this case, handles.frequency_axes returns the top axes, and thehandles.time_axes returns the bottom axes.
9 Examples of GUIDE GUIs
9-24
Validate GUI Input as Numbers
When you use the GUI, you type parameters into three edit text boxes as strings oftext. If you type an invalid value, the graphs can fail to inform or even to generate.Preventing bad inputs from being processed is an important function of almost any GUIthat performs computations. This GUI validates that:
• All three inputs are positive or negative real numbers• The t (time) input is a vector that increases monotonically and is not too long to
legibly display
Validate all three inputs are positive or negative real numbers
In this example, each edit text control callback validates its input. If the input failsvalidation, the callback disables the Plot button, changes its String to indicate thetype of problem encountered, and restores focus to the edit text control, highlightingthe erroneous input. When you enter a valid value, the Plot button reenables with itsString set back to 'Plot'. This approach prevents plotting errors and avoids the needfor an error dialog box.
The str2double function validates most cases, returning NaN (Not a Number) fornonnumeric or nonscalar string expressions. An additional test using the isrealfunction makes sure that a text edit field does not contain a complex number, such as'4+2i'. The f1_input_Callback contains the following code to validate input for f1 :function f1_input_Callback(hObject, eventdata, handles)
% Validate that the text in the f1 field converts to a real number
f1 = str2double(get(hObject,'String'));
if isnan(f1) || ~isreal(f1)
% isdouble returns NaN for non-numbers and f1 cannot be complex
% Disable the Plot button and change its string to say why
set(handles.plot_button,'String','Cannot plot f1')
set(handles.plot_button,'Enable','off')
% Give the edit text box focus so user can correct the error
uicontrol(hObject)
else
% Enable the Plot button with its original name
set(handles.plot_button,'String','Plot')
set(handles.plot_button,'Enable','on')
end
Similarly, f2_input_Callback code validates the f2 input.
Validate the Time Input Vector
The time vector input, t, is more complicated to validate. As the str2double functiondoes not operate on vectors, the eval function is called to convert the input string into

GUI That Accepts Parameters and Generates Plots
9-25
a MATLAB expression. Because you can type many things that eval cannot handle,the first task is to make sure that eval succeeded. The t_input_Callback uses try,catch blocks to do the following:
• Call eval with the t_input string inside the try block.• If eval succeeds, perform additional tests within the try block.• If eval generates an error, pass control to the catch block.• In that block, the callback disables the Plot button and changes its String to
'Cannot plot t'.
The remaining code in the try block makes sure that the variable t returned from evalis a monotonically increasing vector of numbers with no more than 1000 elements. If tpasses all these tests, the callback enables Plot button and sets its String to 'Plot'. Ifit fails any of the tests, the callback disables the Plot button and changes its String toan appropriate short message. Here are the try and catch blocks from the callback:
function t_input_Callback(hObject, eventdata, handles)
% Disable the Plot button ... until proven innocent
set(handles.plot_button,'Enable','off')
try
t = eval(get(handles.t_input,'String'));
if ~isnumeric(t)
% t is not a number
set(handles.plot_button,'String','t is not numeric')
elseif length(t) < 2
% t is not a vector
set(handles.plot_button,'String','t must be vector')
elseif length(t) > 1000
% t is too long a vector to plot clearly
set(handles.plot_button,'String','t is too long')
elseif min(diff(t)) < 0
% t is not monotonically increasing
set(handles.plot_button,'String','t must increase')
else
% All OK; Enable the Plot button with its original name
set(handles.plot_button,'String','Plot')
set(handles.plot_button,'Enable','on')
return
end
% Found an input error other than a bad expression
% Give the edit text box focus so user can correct the error
uicontrol(hObject)
catch EM
% Cannot evaluate expression user typed
set(handles.plot_button,'String','Cannot plot t')
% Give the edit text box focus so user can correct the error
uicontrol(hObject)
end

9 Examples of GUIDE GUIs
9-26
The edit text callbacks execute when you enter text in an edit box and press Return orclick elsewhere in the GUI. Even if you immediately click the Plot button, the edit textcallback executes before the plot button callback activates. When a callback receivesinvalid input, it disables the Plot button, preventing its callback from running. Finally,it restores focus to itself, selecting the text that did not validate so that you can re-entera value.
For example, here is the GUI's response to input of a time vector, [1 2 6 4 5 7 9],that does not monotonically increase.

GUI That Accepts Parameters and Generates Plots
9-27
In this figure, the two plots reflect the last successful set of inputs, f1 = 31.41, f2= 120, and t = [1 2 3 4 5 7 9]. The time vector [1 2 6 4 5 7 9] appearshighlighted so that you can enter a new, valid, value. The highlighting results fromexecuting the command uicontrol(hObject) in the preceding code listing.
Plot Push Button Behavior
When you click the Plot button, the plot_button_Callback performs three basictasks: it gets input from the edit text components, calculates data, and creates the twoplots.
Get Input
The first task for the plot_button_Callback is to read the input values. This involves:
• Reading the current values in the three edit text boxes using the handles structureto access the edit text handles.
• Converting the two frequency values (f1 and f2) from strings to doubles usingstr2double.
• Evaluating the time string using eval to produce a vector t, which the callback usedto evaluate the mathematical expression.
The following code shows how the plot_button_Callback obtains the input:
% Get user input from GUI
f1 = str2double(get(handles.f1_input,'String'));
f2 = str2double(get(handles.f2_input,'String'));
t = eval(get(handles.t_input,'String'));
Calculate Data
After constructing the string input parameters to numeric form and assigningthem to local variables, the next step is to calculate data for the two graphs. Theplot_button_Callback computes the time domain data using an expression of sines:
x = sin(2*pi*f1*t) + sin(2*pi*f2*t);
The callback computes the frequency domain data as the Fourier transform of the timedomain data:
y = fft(x,512);
For an explanation of this computation, see the fft function.

9 Examples of GUIDE GUIs
9-28
Plot Data
The final task for the plot_button_Callback is to generate two plots. This involves:
• Targeting plots to the appropriate axes. For example, this code directs a graph to thetime axes:
plot(handles.time_axes,t,x)
• Providing the appropriate data to the plot function• Turning on the axes grid, which the plot function automatically turns off
Note: Performing the last step is necessary because many plotting functions (includingplot) clear the axes and reset properties before creating the graph. This means thatyou cannot use the Property Inspector to set the XMinorTick, YMinorTick, and gridproperties in this example, because they are reset when the callback executes plot.
In the following code listing, notice how the handles structure provides access to thehandle of the axes, when needed.
Plot_Button Callback
function plot_button_Callback(hObject, eventdata, handles, varargin)
% hObject handle to plot_button (see GCBO)
% eventdata reserved - to be defined in a future version of MATLAB
% handles structure with handles and user data (see GUIDATA)
% Get user input from GUI
f1 = str2double(get(handles.f1_input,'String'));
f2 = str2double(get(handles.f2_input,'String'));
t = eval(get(handles.t_input,'String'));
% Calculate data
x = sin(2*pi*f1*t) + sin(2*pi*f2*t);
y = fft(x,512);
m = y.*conj(y)/512;
f = 1000*(0:256)/512;
% Create frequency plot in proper axes
plot(handles.frequency_axes,f,m(1:257))
set(handles.frequency_axes,'XMinorTick','on')
grid on
% Create time plot in proper axes
plot(handles.time_axes,t,x)
set(handles.time_axes,'XMinorTick','on')
grid on
GUI That Accepts Parameters and Generates Plots
9-29
GUI Option Settings
Two GUI Options settings (accessed using Tools > Menu Options) are particularlyimportant for this GUI:
• Resize behavior: Proportional
Selecting Proportional as the resize behavior enables you to resize the GUI tobetter view the plots. Using this option setting, when you resize the GUI, everythingexpands or shrinks proportionately, except text.
• Command-line accessibility: Callback
When GUIs include axes, their handles should be visible from other objects' callbacks.This enables you to use plotting commands like you would on the command line.Callback is the default setting for command-line accessibility.
For more information, see “GUIDE Options” on page 5-8.
9 Examples of GUIDE GUIs
9-30
Synchronized Data Presentations in a GUIDE GUI
In this section...
“About the Example” on page 9-30“Recreate the GUI” on page 9-32
About the Example
This example shows how to program a GUI that has the following features:
• Initializes a table and a plot.• Plots selected data in real time as you select data observations.• Generates line graphs that display different views of data.
This GUI plots different kinds of graphs into different axes for an entire data set orselections of it, and shows how Fourier transforms can identify periodicity in time seriesdata.
You can use this GUI to analyze and visualize time-series data containing periodicevents.

Synchronized Data Presentations in a GUIDE GUI
9-31
To get and view the example code:
1 Copy the example FIG-file and code file to your current (writeable) folder and openthe FIG-file in GUIDE with the following commands:
copyfile(fullfile(docroot, 'techdoc','creating_guis',...
'examples','tablestat*.*')), fileattrib('tablestat*.*', '+w');
guide tablestat.fig;

9 Examples of GUIDE GUIs
9-32
2 In the GUIDE Layout Editor, click the Editor button .
The tablestat.m code file opens in the MATLAB Editor.
Recreate the GUI
In the GUIDE Layout Editor, the tablestat GUI looks like this.

Synchronized Data Presentations in a GUIDE GUI
9-33
Perform the following steps in GUIDE and in the Property Inspector to generate thelayout:
1 In the Command Window, type guide, select the Blank GUI template, and thenclick OK.
2Use the Panel tool, , to drag out the three uipanels into the positions shownabove. Keep the defaults for their Tag properties (which are uipanel1, uipanel2,and uipanel3). Create, in order:
a A long panel on the left. In the Property Inspector, set its Title property valueto Data Set.
b A panel on the lower right, half the height of the first panel. In the PropertyInspector, set its Title property value to Data Statistics.
renaming its Title to in the Property Inspector.c A panel above the Data Statistics panel. In the Property Inspector, set its
Title property to Sunspots v. Year Plots. This panel changes its namewhen the type of plot changes.
3 Use the Table tool, , to drag a uitable inside the Data Set panel. Use theProperty Inspector to set the property values as follows:
• ColumnName: Year and Sunspot.• Data: As described in “Initialize the Data Table” on page 9-37.• Tag: data_table.• TooltipString: Drag to select a range of 11 or more
observations.• CellSelectionCallback: data_table_CellSelectionCallback.
Click the pencil-and-paper icon to have GUIDE set this property valueautomatically and declare it in the code file.
4 Drag a second uitable inside the Data Statistics panel. Use the Table PropertyEditor to set row values as follows:
a Double-click the Data Statistics table to open it in the Property Inspector.
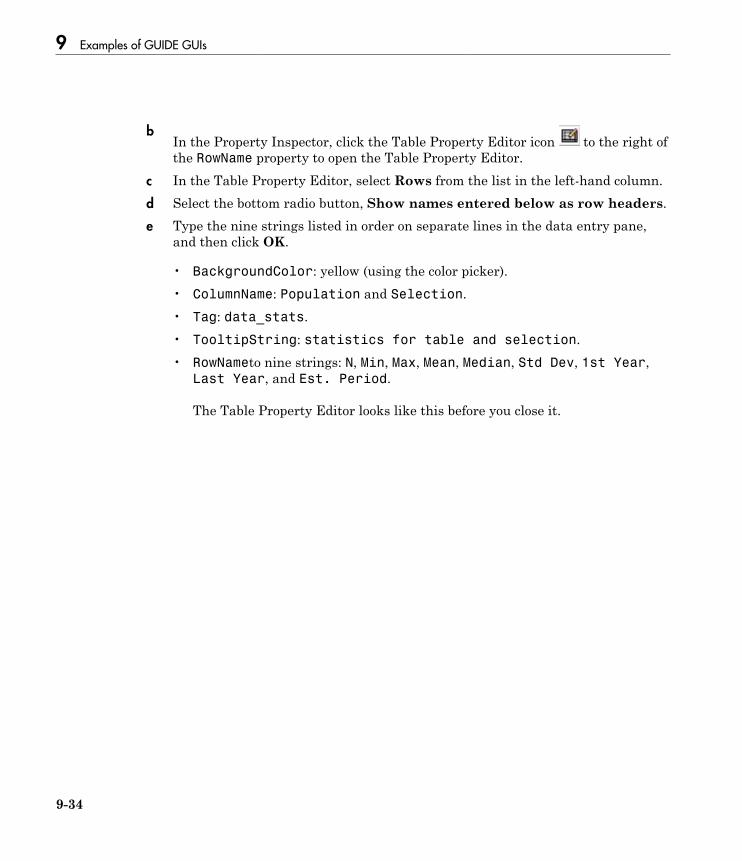
9 Examples of GUIDE GUIs
9-34
bIn the Property Inspector, click the Table Property Editor icon to the right ofthe RowName property to open the Table Property Editor.
c In the Table Property Editor, select Rows from the list in the left-hand column.d Select the bottom radio button, Show names entered below as row headers.e Type the nine strings listed in order on separate lines in the data entry pane,
and then click OK.
• BackgroundColor: yellow (using the color picker).• ColumnName: Population and Selection.• Tag: data_stats.• TooltipString: statistics for table and selection.• RowNameto nine strings: N, Min, Max, Mean, Median, Std Dev, 1st Year,
Last Year, and Est. Period.
The Table Property Editor looks like this before you close it.

Synchronized Data Presentations in a GUIDE GUI
9-35
The Data Statistics table does not use any callbacks.5
Use the Axes tool to drag out an axes within the top half of the Sunspots v.Year Plots panel, leaving its name as axes1.
6 Drag out a second axes, leaving its name as axes2 inside the Sunspots v. YearPlots panel, directly below the first axes.
Leave enough space below each axes to display the x-axis labels.7 Identify the axes with labels. Using the Text tool, drag out a small rectangle in the
upper right corner of the upper axes (axes1). Double-click it, and in the PropertyInspector, change its String property to Population and its Tag property topoplabel.

9 Examples of GUIDE GUIs
9-36
8 Place a second label in the lower axes (axes2), renaming this text object Selectionand setting its Tag property to sellabel.
9 Create a title for the GUI. Using the Text tool, drag out a static text object at the topleft of the GUI, above the data table. Double-click it, and in the Property Inspector,change its String property to “Zurich” Sunspot Statistics, 1700-1987 andits FontWeight property to bold.
10 Add a prompt above the axes; place a text label just above the Sunspots v. YearPlots panel, near its right edge. Change its Tag property to newfig, its Stringproperty to Right-click plots for larger view and its FontAngle propertyto Italic.
11 Make a pop-up menu to specify the type of graph to plot. Using the Pop-up Menu tool, drag out a pop-up menu just above the Sunspots v. Year panel, aligning it to
the panel's left edge. In the Property Inspector, set these properties:
• String:
Sunspots v. Year Plots
FFT Periodogram Plots
• Tag: plot_type• Tooltip: Choose type of data plot
Then, click the Callback property's icon. This creates a declaration calledplot_type_Callback, to which you add code later on.
12 Select the Push Button tool , and drag out a push button in the upper right ofthe figure. In the Property Inspector, rename it to Quit and set up its callback asfollows:
• Double-click it and in the Property Inspector, set its Tag property to quit and itsString property to Quit.
• Click the Callback property to create a callback for the button in the code filetablestat.m. GUIDE sets the Callback of the Quit item to quit_Callback.
• In the code file, for the quit_Callback function. enter:
close(ancestor(hObject,'figure'))
13 Save the GUI in GUIDE, naming it tablestat.fig. This action also saves the codefile as tablestat.m.

Synchronized Data Presentations in a GUIDE GUI
9-37
Initialize the Data Table
Although you can use the Opening Function to load data into a table, this example usesGUIDE to put data into the Data Set table. This way, the data becomes part of thefigure after you save it. Initializing the table data causes the table to have the samenumber of rows and columns as the variable that it contains:
1 Access the sunspot example data set. In the Command Window, type:
load sunspot.dat
The variable sunspot, a 288-by-2 double array, displays in the MATLAB workspace.2 Open the Property Inspector for the data table by double-clicking the Data Set table.3
In the Property Inspector, click the Table Editor icon to the right of the Dataproperty to open the Table Property Editor.
4 In the Table Property Editor, select Table from the list in the left-hand column.5 Select the bottom radio button, Change data value to the selected workspace
variable below.6 From the list of workspace variables in the box below the radio button, select
sunspot and click OK.
GUIDE inserts the sunspot data in the table.
Compute the Data Statistics
The Opening Function retrieves the preloaded data from the data table and calls thelocal function, setStats, to compute population statistics, and then returns them. Thedata_table_CellSelectionCallback performs the same action when you selectmore than 10 rows of the data table. The only difference between these two calls is whatinput data is provided and what column of the Data Statistics table is computed. Hereis the setStats function:
function stats = setStats(table, stats, col, peak)
% Computes basic statistics for data table.
% table The data to summarize (a population or selection)
% stats Array of statistics to update
% col Which column of the array to update
% peak Value for the peak period, computed externally
stats{1,col} = size(table,1); % Number of rows

9 Examples of GUIDE GUIs
9-38
stats{2,col} = min(table(:,2));
stats{3,col} = max(table(:,2));
stats{4,col} = mean(table(:,2));
stats{5,col} = median(table(:,2));
stats{6,col} = std(table(:,2));
stats{7,col} = table(1,1); % First row
stats{8,col} = table(end,1); % Last row
if ~isempty(peak)
stats{9,col} = peak; % Peak period from FFT
end
Note: When assigning data to a uitable, use a cell array, as shown in the code forsetStats. You can assign data that you retrieve from a uitable to a numeric array,however, only if it is entirely numeric. Storing uitable data in cell arrays enables tablesto hold numbers, strings of characters, or combinations of them.
The stats matrix is a 9-by-2 cell array in which each row is a separate statisticcomputed from the table argument. The last statistic is not computed by setStats; itcomes from the plotPeriod function when it computes and plots the FFT periodogramand is passed to setStats as the peak parameter.
Specify the Type of Data Plot
From the GUI, you can choose either of two types of plots to display from the plot_typepop-up menu:
• Sunspots v. Year Plots — Time-series line graphs displaying sunspot occurrences yearby year (default).
• Periodogram Plots — Graphs displaying the FFT-derived power spectrum of sunspotoccurrences by length of cycle in years.
When the plot type changes, one or both axes refresh. They always show the same kind ofplot, but the bottom axes is initially empty and does not display a graph until you selectat least 11 rows of the data table.
The plot_type control callback is plot_type_Callback. GUIDE generates it, andyou must add code to it that updates plots appropriately. In the example, the callbackconsists of this code:
function plot_type_Callback(hObject, eventdata, handles)

Synchronized Data Presentations in a GUIDE GUI
9-39
% hObject handle to plot_type (see GCBO)
% eventdata reserved - to be defined in a future version of MATLAB
% handles structure with handles and user data (see GUIDATA)
% ---- Customized as follows ----
% Determine state of the pop-up and assign the appropriate string
% to the plot panel label
index = get(hObject,'Value'); % What plot type is requested?
strlist = get(hObject,'String'); % Get the choice's name
set(handles.uipanel3,'Title',strlist(index)) % Rename uipanel3
% Plot one axes at a time, changing data; first the population
table = get(handles.data_table,'Data'); % Obtain the data table
refreshDisplays(table, handles, 1)
% Now compute stats for and plot the selection, if needed.
% Retrieve the stored event data for the last selection
selection = handles.currSelection;
if length(selection) > 10 % If more than 10 rows selected
refreshDisplays(table(selection,:), handles, 2)
else
% Do nothing; insufficient observations for statistics
end
The function updates the Data Statistics table and the plots. To perform the updates, itcalls the refreshDisplays function twice, which is a custom function added to the GUIcode file. In between the two calls, the refreshDisplays function retrieves row indicesfor the current selection from the currSelection member of the handles structure,where they were cached by the data_table_CellSelectionCallback.
You can see the effect of toggling the plot type in the two illustrations that follow. Theone on the left shows the Sunspots v. Year plots, and the one on the right shows the FFTPeriodograms Plots. The selection in both cases is the years 1901–1950.

9 Examples of GUIDE GUIs
9-40
Respond to Data Selections
The Data Set table has two columns: Year and Sunspots. The data tables's CellSelection Callback analyzes data from its second column, regardless of which columnsyou highlight. The setStats function (not generated by GUIDE) computes summarystatistics observations from the second column for insertion into the Data Statisticstable on the right. The plotPeriod function (not generated by GUIDE) plots either theraw data or a Fourier analysis of it.
The data_table_CellSelectionCallback function manages the application'sresponse to you selecting ranges of data. Ranges can be contiguous rows or separategroups of rows; holding down the Ctrl key lets you add discontiguous rows to a selection.Because the Cell Selection Callback is triggered as long as you hold the left mouse buttondown within the table, the selection statistics and lower plot are refreshed until selectionis completed.
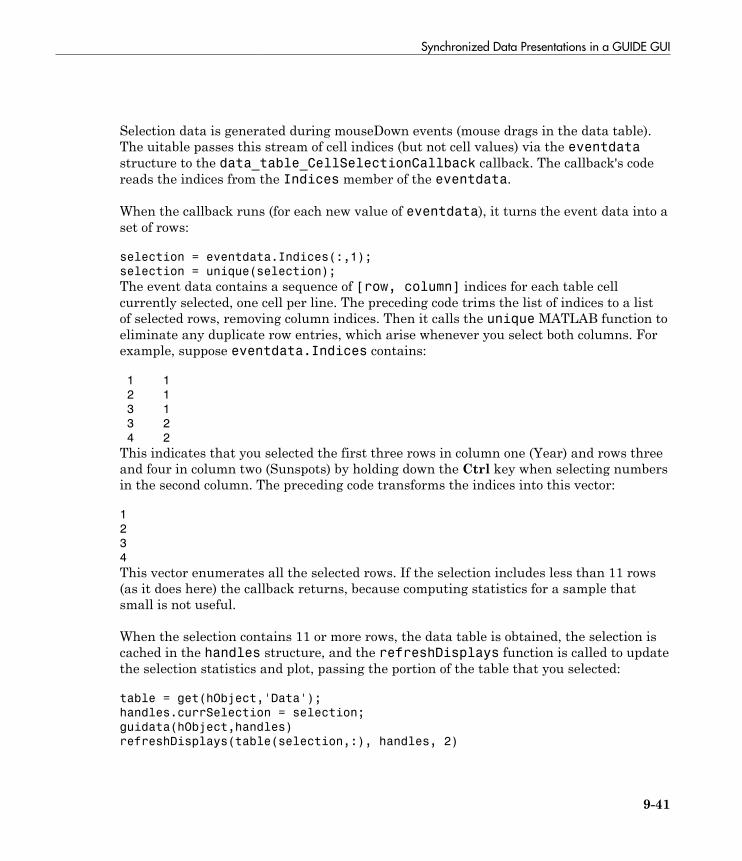
Synchronized Data Presentations in a GUIDE GUI
9-41
Selection data is generated during mouseDown events (mouse drags in the data table).The uitable passes this stream of cell indices (but not cell values) via the eventdatastructure to the data_table_CellSelectionCallback callback. The callback's codereads the indices from the Indices member of the eventdata.
When the callback runs (for each new value of eventdata), it turns the event data into aset of rows:
selection = eventdata.Indices(:,1);
selection = unique(selection);
The event data contains a sequence of [row, column] indices for each table cellcurrently selected, one cell per line. The preceding code trims the list of indices to a listof selected rows, removing column indices. Then it calls the unique MATLAB function toeliminate any duplicate row entries, which arise whenever you select both columns. Forexample, suppose eventdata.Indices contains:
1 1
2 1
3 1
3 2
4 2
This indicates that you selected the first three rows in column one (Year) and rows threeand four in column two (Sunspots) by holding down the Ctrl key when selecting numbersin the second column. The preceding code transforms the indices into this vector:
1
2
3
4
This vector enumerates all the selected rows. If the selection includes less than 11 rows(as it does here) the callback returns, because computing statistics for a sample thatsmall is not useful.
When the selection contains 11 or more rows, the data table is obtained, the selection iscached in the handles structure, and the refreshDisplays function is called to updatethe selection statistics and plot, passing the portion of the table that you selected:
table = get(hObject,'Data');
handles.currSelection = selection;
guidata(hObject,handles)
refreshDisplays(table(selection,:), handles, 2)

9 Examples of GUIDE GUIs
9-42
Caching the list of rows in the selection is necessary because changing plot types canforce selection data to be replotted. As the plot_type_Callback has no access to thedata table's event data, it requires a copy of the most recent selection.
Update the Statistics Table and the Graphs
The code must update the Data Statistics table and the graphs above it when:
• The GUI is initialized, in its tablestat_OpeningFcn.• You select cells in the data table, in its data_table_CellSelectionCallback.• You select a different plot type, in the plot_type_Callback.
In each case, the refreshDisplays function is called to handle the updates. It in turncalls two other custom functions:
• setStats — Computes summary statistics for the selection and returns them.• plotPeriod — Plots the type of graph currently requested in the appropriate axes.
The refreshDisplays function identifies the current plot type and specifies the axesto plot graphs into. After calling plotPeriod and setStats, it updates the DataStatistics table with the recomputed statistics. Here is the code for refreshDisplays:
function refreshDisplays(table, handles, item)
if isequal(item,1)
ax = handles.axes1;
elseif isequal(item,2)
ax = handles.axes2;
end
peak = plotPeriod(ax, table,...
get(handles.plot_type,'Value'));
stats = get(handles.data_stats, 'Data');
stats = setStats(table, stats, item, peak);
set(handles.data_stats, 'Data', stats);
set(ax,'FontSize',7.0);
If you are reading this document in the MATLAB Help Browser, click the names ofthe functions underlined above to see their complete code (including comments) in theMATLAB Editor.
Display Graphs in New Figure Windows
The tablestat GUI contains code to display either of its graphs in a larger size in anew figure window when you right-click either axes and selects the pop-up menu item,

Synchronized Data Presentations in a GUIDE GUI
9-43
Open plot in new window. The static text string (tagged newfig) above the plot panel,Right-click plots for larger view, informs you that this feature is available.
The axes respond by:
1 Creating a new figure window.2 Copying their contents to a new axes parented to the new figure.3 Resizing the new axes to use 90% of the figure's width.4 Constructing a title string and displaying it in the new figure.5 Saving the figure and axes handles in the handles structure for possible later use or
destruction.
Note: Handles are saved for both plots, but each time a new figure is created foreither of them, the new handles replace the old ones, if any, making previous figuresinaccessible from the GUI.
Create Two Context Menus
To create the two context menus, from the GUIDE Tools menu, select the Menu Editor.After you create the two context menus, attach one to the each axes, axes1 and axes2.In the Menu Editor, for each menu:
1 Click the Context Menus tab to select the type of menu you are creating.2
Click the New Context Menu icon .
This creates a context menu in the Menu Editor workspace called untitled. It hasno menu items and is not attached to any GUI object yet.
3 Select the new menu and in the Tag edit field in the Menu Properties panel, typeplot_axes1.
4 Click the New Menu Item icon .
A menu item is displayed underneath the plot_axes1 item in the Menu Editorworkspace.
5 In the Menu Properties panel, type Open plot in new window for Label andplot_ax1 for Tag. Do not set anything else for this item.
6 Repeat the last four steps to create a second context menu:

9 Examples of GUIDE GUIs
9-44
• Make the Tag for the menu plot_axes2.• Create a menu item under it and make its Label Open plot in new window
and assign it a Tag of plot_ax2.7 Click OK to save your menus and exit the Menu Editor.
For more information about using the Menu Editor, see “Create Menus for GUIDE GUIs”on page 6-91.
Attach Context Menus to Axes
Add the context menus you just created to the axes:
1 In the GUIDE Layout Editor, double-click axes1 (the top axes in the upper rightcorner) to open it in the Property Inspector.
2 Click the right-hand column next to UIContextMenu to see a drop-down list.3 From the list, select plot_axes1.
Perform the same steps for axes2, but select plot_axes2 as its UIContextMenu.
Code Context Menu Callbacks
The two context menu items perform the same actions, but create different objects. Eachhas its own callback. Here is the plot_ax1_Callback callback for axes1:
function plot_ax1_Callback(hObject, eventdata, handles)
% hObject handle to plot_ax1 (see GCBO)
% eventdata reserved - to be defined in a future version of MATLAB
% handles structure with handles and user data (see GUIDATA)
%
% Displays contents of axes1 at larger size in a new figure
% Create a figure to receive this axes' data
axes1fig = figure;
% Copy the axes and size it to the figure
axes1copy = copyobj(handles.axes1,axes1fig);
set(axes1copy,'Units','Normalized',...
'Position',[.05,.20,.90,.60])
% Assemble a title for this new figure
str = [get(handles.uipanel3,'Title') ' for ' ...
get(handles.poplabel,'String')];
title(str,'Fontweight','bold')
% Save handles to new fig and axes in case
Synchronized Data Presentations in a GUIDE GUI
9-45
% we want to do anything else to them
handles.axes1fig = axes1fig;
handles.axes1copy = axes1copy;
guidata(hObject,handles);
The other callback, plot_ax2_Callback, is identical to plot_ax1_Callback, exceptthat all instances of 1 in the code are replaced by 2, and poplabel is replaced withsellabel. The poplabel and sellabel objects are the Population and Selectionlabels on axes1 and axes2, respectively. These strings are appended to the currentTitle for uipanel3 to create a title for the plot in the new figure axes1fig oraxes2fig.
Use Plot in New Window Feature
Whenever you right-click one of the axes in the GUI and select Open plot in newwindow, a new figure is generated containing the graph in the axes. The callbacks donot check whether a graph exists in the axes (axes2 is empty until you select cells in theData Set) or whether a previously opened figure contains the same graph. A new figureis always created and the contents of axes1 or axes2 are copied into it. For example, youcould right-click a periodogram in axes1 and select Open plot in new window.
It is your responsibility to remove the new window when it is no longer needed. Thecontext menus can be programmed to do this. Because their callbacks call guidatato save the handle of the last figure created for each of the GUI's axes, anothercallback can delete or reuse either figure. For example, the plot_ax1_Callback andplot_ax2_Callback callbacks could check guidata for a valid axes handle stored inhandles.axes1copy or handles.axes2copy, and reuse the axes instead of creating anew figure.
Related Examples• “Fast Fourier Transform (FFT)”• “The FFT in One Dimension”
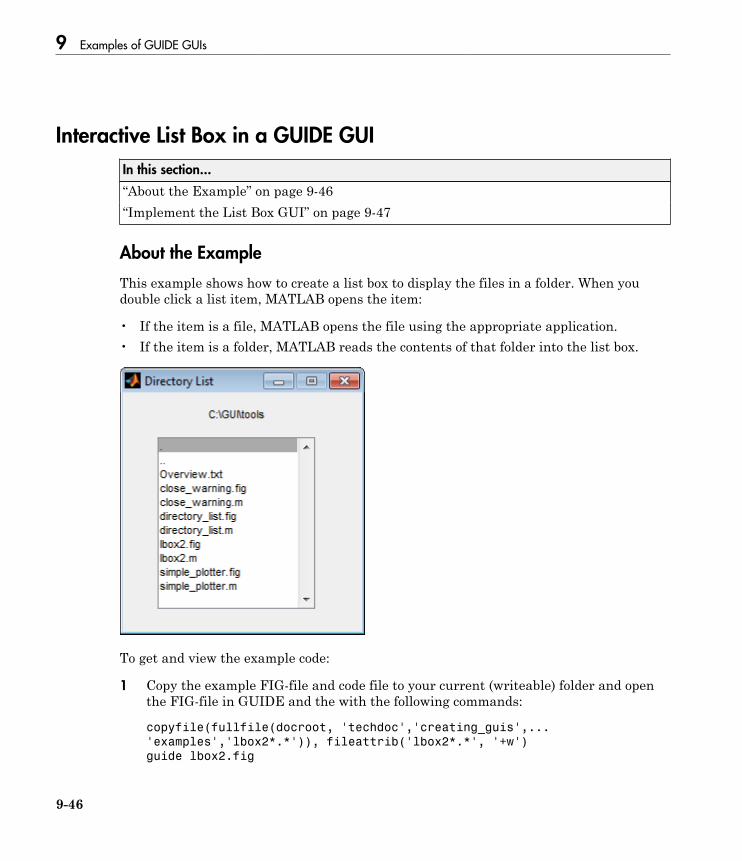
9 Examples of GUIDE GUIs
9-46
Interactive List Box in a GUIDE GUI
In this section...
“About the Example” on page 9-46“Implement the List Box GUI” on page 9-47
About the Example
This example shows how to create a list box to display the files in a folder. When youdouble click a list item, MATLAB opens the item:
• If the item is a file, MATLAB opens the file using the appropriate application.• If the item is a folder, MATLAB reads the contents of that folder into the list box.
To get and view the example code:
1 Copy the example FIG-file and code file to your current (writeable) folder and openthe FIG-file in GUIDE and the with the following commands:
copyfile(fullfile(docroot, 'techdoc','creating_guis',...
'examples','lbox2*.*')), fileattrib('lbox2*.*', '+w')
guide lbox2.fig
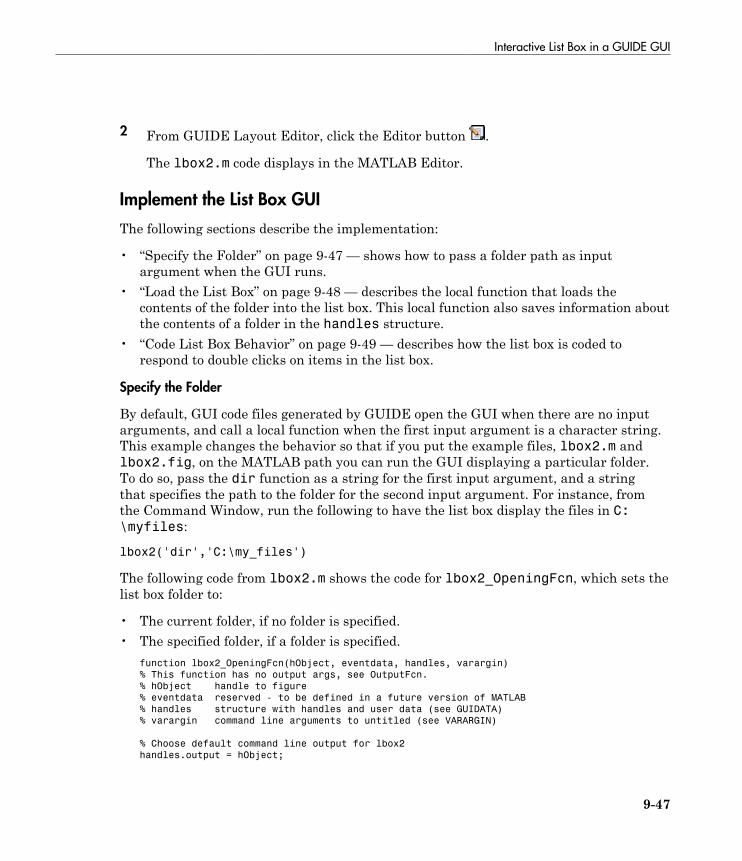
Interactive List Box in a GUIDE GUI
9-47
2 From GUIDE Layout Editor, click the Editor button .
The lbox2.m code displays in the MATLAB Editor.
Implement the List Box GUI
The following sections describe the implementation:
• “Specify the Folder” on page 9-47 — shows how to pass a folder path as inputargument when the GUI runs.
• “Load the List Box” on page 9-48 — describes the local function that loads thecontents of the folder into the list box. This local function also saves information aboutthe contents of a folder in the handles structure.
• “Code List Box Behavior” on page 9-49 — describes how the list box is coded torespond to double clicks on items in the list box.
Specify the Folder
By default, GUI code files generated by GUIDE open the GUI when there are no inputarguments, and call a local function when the first input argument is a character string.This example changes the behavior so that if you put the example files, lbox2.m andlbox2.fig, on the MATLAB path you can run the GUI displaying a particular folder.To do so, pass the dir function as a string for the first input argument, and a stringthat specifies the path to the folder for the second input argument. For instance, fromthe Command Window, run the following to have the list box display the files in C:\myfiles:
lbox2('dir','C:\my_files')
The following code from lbox2.m shows the code for lbox2_OpeningFcn, which sets thelist box folder to:
• The current folder, if no folder is specified.• The specified folder, if a folder is specified.
function lbox2_OpeningFcn(hObject, eventdata, handles, varargin)
% This function has no output args, see OutputFcn.
% hObject handle to figure
% eventdata reserved - to be defined in a future version of MATLAB
% handles structure with handles and user data (see GUIDATA)
% varargin command line arguments to untitled (see VARARGIN)
% Choose default command line output for lbox2
handles.output = hObject;

9 Examples of GUIDE GUIs
9-48
% Update handles structure
guidata(hObject, handles);
if nargin == 3,
initial_dir = pwd;
elseif nargin > 4
if strcmpi(varargin{1},'dir')
if exist(varargin{2},'dir')
initial_dir = varargin{2};
else
errordlg({'Input argument must be a valid',...
'folder'},'Input Argument Error!')
return
end
else
errordlg('Unrecognized input argument',...
'Input Argument Error!');
return;
end
end
% Populate the listbox
load_listbox(initial_dir,handles)
Load the List Box
A local function loads items into the list box. This local function accepts the path to afolder and the handles structure as input arguments and performs these steps:
• Changes to the specified folder so that the GUI can navigate up and down the tree, asrequired.
• Uses the dir command to get a list of files in the specified folder and to determinewhich name is a folder and which is a file. dir returns a structure (dir_struct)with two fields, name and isdir, containing this information.
• Sorts the file and folder names (sortrows) and saves the sorted names and otherinformation in the handles structure so that this information can be passed to otherfunctions.
The name structure field is passed to sortrows as a cell array, which is transposedto get one file name per row. The isdir field and the sorted index values,sorted_index, are saved as vectors in the handles structure.
• Calls guidata to save the handles structure.• Sets the list box String property to display the file and folder names and set the
Value property to 1, ensuring that Value never exceeds the number of items inString, because MATLAB software updates the Value property only when aselection occurs; not when the contents of String changes.
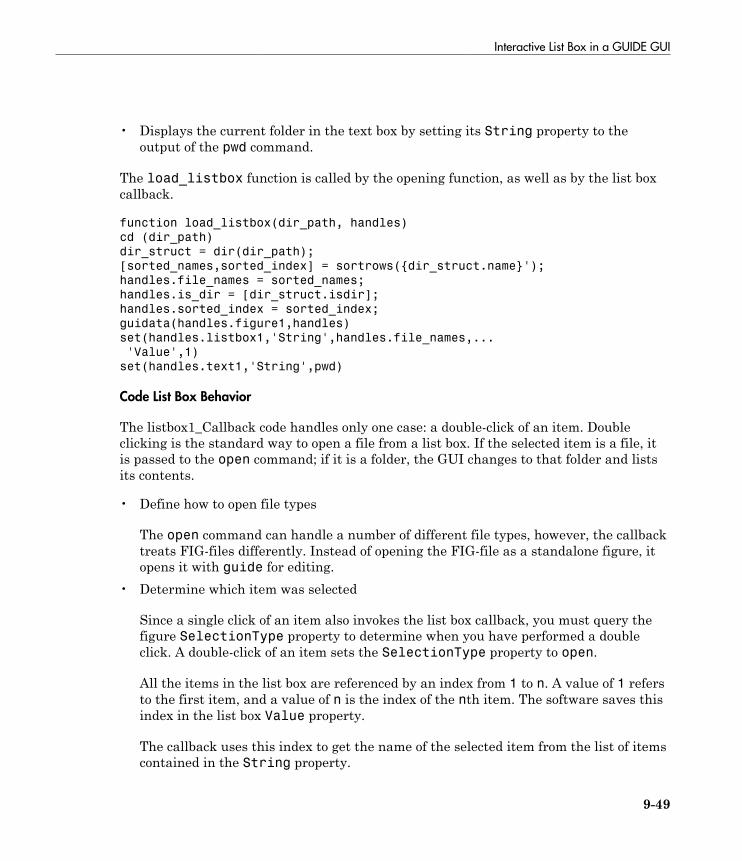
Interactive List Box in a GUIDE GUI
9-49
• Displays the current folder in the text box by setting its String property to theoutput of the pwd command.
The load_listbox function is called by the opening function, as well as by the list boxcallback.
function load_listbox(dir_path, handles)
cd (dir_path)
dir_struct = dir(dir_path);
[sorted_names,sorted_index] = sortrows({dir_struct.name}');
handles.file_names = sorted_names;
handles.is_dir = [dir_struct.isdir];
handles.sorted_index = sorted_index;
guidata(handles.figure1,handles)
set(handles.listbox1,'String',handles.file_names,...
'Value',1)
set(handles.text1,'String',pwd)
Code List Box Behavior
The listbox1_Callback code handles only one case: a double-click of an item. Doubleclicking is the standard way to open a file from a list box. If the selected item is a file, itis passed to the open command; if it is a folder, the GUI changes to that folder and listsits contents.
• Define how to open file types
The open command can handle a number of different file types, however, the callbacktreats FIG-files differently. Instead of opening the FIG-file as a standalone figure, itopens it with guide for editing.
• Determine which item was selected
Since a single click of an item also invokes the list box callback, you must query thefigure SelectionType property to determine when you have performed a doubleclick. A double-click of an item sets the SelectionType property to open.
All the items in the list box are referenced by an index from 1 to n. A value of 1 refersto the first item, and a value of n is the index of the nth item. The software saves thisindex in the list box Value property.
The callback uses this index to get the name of the selected item from the list of itemscontained in the String property.

9 Examples of GUIDE GUIs
9-50
• Determine whether the selected item is a file or directory
The load_listbox function uses the dir command to obtain a list of values thatindicate whether an item is a file or folder. These values (1 for folder, 0 for file)are saved in the handles structure. The list box callback queries these values todetermine if current selection is a file or folder and takes the following action:
• If the selection is a folder — change to the folder (cd) and call load_listboxagain to populate the list box with the contents of the new folder.
• If the selection is a file — get the file extension (fileparts) to determine if it is aFIG-file, which is opened with guide. All other file types are passed to open.
The open statement is called within a try, catch block to capture errors in an errordialog box (errordlg), instead of returning to the command line.
You can extend the file types that the open command recognizes to include any filehaving a three-character extension. Do this by creating a MATLAB code file with thename openxyz.m. xyz is the file extension for the type of files to be handled. Do not,however, take this approach for opening FIG-files, because openfig.m is a MATLABfunction which is needed to open GUIs. For more information, see open and openfig.
listbox1_Callback code
function listbox1_Callback(hObject, eventdata, handles)
get(handles.figure1,'SelectionType');
% If double click
if strcmp(get(handles.figure1,'SelectionType'),'open')
index_selected = get(handles.listbox1,'Value');
file_list = get(handles.listbox1,'String');
% Item selected in list box
filename = file_list{index_selected};
% If folder
if handles.is_dir(handles.sorted_index(index_selected))
cd (filename)
% Load list box with new folder.
load_listbox(pwd,handles)
else
[path,name,ext] = fileparts(filename);
switch ext
case '.fig'
% Open FIG-file with guide command.
guide (filename)
otherwise

Interactive List Box in a GUIDE GUI
9-51
try
% Use open for other file types.
open(filename)
catch ex
errordlg(...
ex.getReport('basic'),'File Type Error','modal')
end
end
end
end

9 Examples of GUIDE GUIs
9-52
Plot Workspace Variables in a GUIDE GUI
In this section...
“About the Example” on page 9-52“Read Workspace Variables” on page 9-53“Read Selections from List Box” on page 9-54
About the Example
This example shows how to create a GUI that uses a list box to display names ofvariables in the base workspace, and then plot them. Initially, no variable names areselected in the list box. The GUI provides controls to:
• Update the list.• Select multiple variables in the list box. Exactly two variables must be selected.• Create linear, semilogx and semilogy line graphs of selected variables.
The GUI evaluates the plotting commands in the base workspace. It does no validationbefore plotting. When you use the GUI, you are responsible for selecting pairs ofvariables that can be plotted against one another. The top-most selection is used as the x-variable, the lower one as the y-variable.
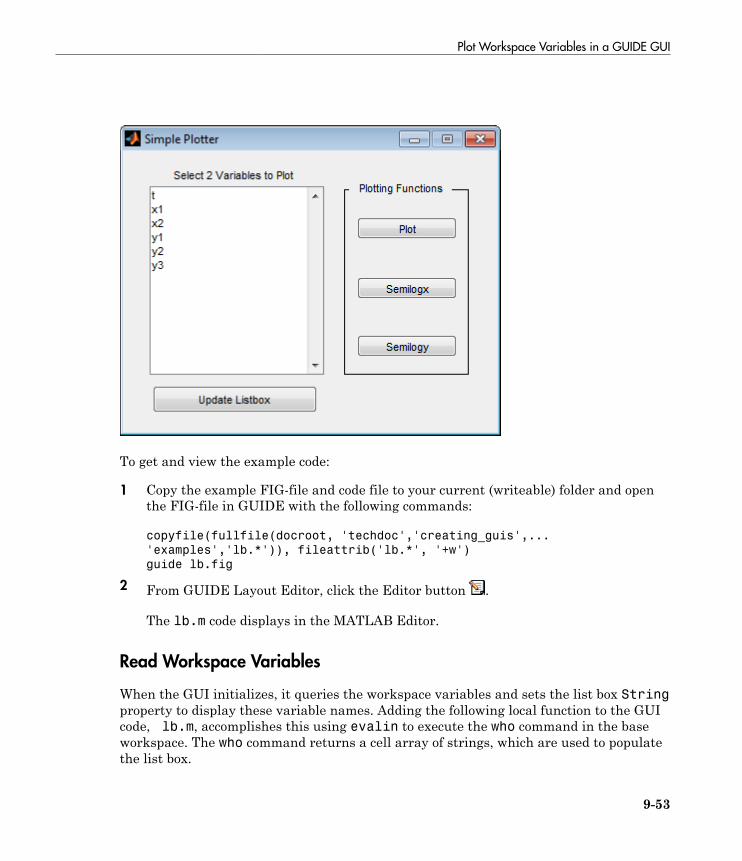
Plot Workspace Variables in a GUIDE GUI
9-53
To get and view the example code:
1 Copy the example FIG-file and code file to your current (writeable) folder and openthe FIG-file in GUIDE with the following commands:
copyfile(fullfile(docroot, 'techdoc','creating_guis',...
'examples','lb.*')), fileattrib('lb.*', '+w')
guide lb.fig
2 From GUIDE Layout Editor, click the Editor button .
The lb.m code displays in the MATLAB Editor.
Read Workspace Variables
When the GUI initializes, it queries the workspace variables and sets the list box Stringproperty to display these variable names. Adding the following local function to the GUIcode, lb.m, accomplishes this using evalin to execute the who command in the baseworkspace. The who command returns a cell array of strings, which are used to populatethe list box.

9 Examples of GUIDE GUIs
9-54
function update_listbox(handles)
vars = evalin('base','who');
set(handles.listbox1,'String',vars)
The function input argument is the handles structure set up by the GUIDE. Thisstructure contains the handle of the list box, as well as the handles of all othercomponents in the GUI.
The callback for the Update Listbox push button also calls update_listbox.
Read Selections from List Box
To use the GUI, you select two variables from the workspace and then choose one of threeplot commands to create a graph: plot, semilogx, or semilogy.
No callback for the list box exists in the GUI code file. One is not needed because theplotting actions are initiated by push buttons.
Enable Multiple Selection
Use the Property Inspector to set these properties on the list box. To enable multipleselection in a list box, change the default values of the Min and Max properties so thatMax - Min > 1.
Selecting Multiple Items
List box selection follows the standard for most systems:
• Ctrl+click left mouse button — noncontiguous multi-item selection• Shift+click left mouse button — contiguous multi-item selection
Use one of these techniques to select the two variables required to create the plot.
Return Variable Names for the Plotting Functions
The local function, get_var_names, returns the two variable names that are selectedwhen you click one of the three plotting buttons. The function does these tasks:
• Gets all the items in the list box from the String property.• Gets the indices of the selected items from the Value property.

Plot Workspace Variables in a GUIDE GUI
9-55
• Returns two string variables, if there are two items selected. Otherwiseget_var_names displays an error dialog box stating that you must select twovariables.
Here is the code for get_var_names:
function [var1,var2] = get_var_names(handles)
list_entries = get(handles.listbox1,'String');
index_selected = get(handles.listbox1,'Value');
if length(index_selected) ~= 2
errordlg('You must select two variables',...
'Incorrect Selection','modal')
else
var1 = list_entries{index_selected(1)};
var2 = list_entries{index_selected(2)};
end
Callbacks for the Plotting Buttons
The callbacks for the plotting buttons call get_var_names to get the names of thevariables to plot and then call evalin to execute the plot commands in the baseworkspace.
For example, here is the callback for the plot function:
function plot_button_Callback(hObject, eventdata, handles)
[x,y] = get_var_names(handles);
evalin('base',['plot(' x ',' y ')'])
The command to evaluate is created by concatenating the strings and variables, andlooks like this:
try
evalin('base',['semilogx(',x,',',y,')'])
catch ex
errordlg(...
ex.getReport('basic'),'Error generating semilogx plot','modal')
end
The try/catch block handles errors resulting from attempting to graph inappropriatedata. When evaluated, the result of the command is:
plot(x,y)

9 Examples of GUIDE GUIs
9-56
The other two plotting buttons work in the same way, resulting in semilogx(x,y) andsemilogy(x,y).

GUI for Setting Simulink Model Parameters
9-57
GUI for Setting Simulink Model Parameters
In this section...
“About the Example” on page 9-57“How to Use the Simulink Parameters GUI” on page 9-58“Run the GUI” on page 9-59“Program the Slider and Edit Text Components” on page 9-60“Run the Simulation from the GUI” on page 9-62“Remove Results from List Box” on page 9-64“Plot Results Data” on page 9-64“The GUI Help Button” on page 9-66“Close the GUI” on page 9-66“The List Box Callback and Create Function” on page 9-67
About the Example
This example shows how to create a GUIDE GUI that sets the parameters of a Simulinkmodel, runs the simulation, and plots the results in a figure window. The following figureshows the GUI after running three simulations with different values for controller gains.
9 Examples of GUIDE GUIs
9-58
To get and view the example code:
1 Copy the example FIG-file and code file to your current (writeable) folder and openthe FIG-file in GUIDE with the following commands:
copyfile(fullfile(docroot, 'techdoc','creating_guis','examples',...
'f14ex*.*')), fileattrib('f14ex*.*', '+w')
guide f14ex.fig
2 From GUIDE Layout Editor, click the Editor button .
The f14ex.m code displays in the MATLAB Editor.
How to Use the Simulink Parameters GUI
Note: You must have Simulink installed for this GUI to run. The first time you run theGUI, Simulink opens (if it is not already running) and loads the f14 example model. Thiscan take several seconds.
The GUI has a Help button. Clicking it opens an HTML file, f14ex_help.html, in theHelp Browser. This file, which resides in the examples folder along with the GUI files,contains the following five sections of help text:
F14 Controller Gain Editor
You can use the F14 Controller Gain Editor to analyze how changing the gains used inthe Proportional-Integral Controller affect the aircraft's angle of attack and the amountof G force the pilot feels.
Note that the Simulink diagram f14.mdl must be open to run this GUI. If you close theF14 Simulink model, the GUI reopens it whenever it requires the model to execute.
Change the Controller Gains
You can change gains in two blocks:
1 The Proportional gain (Kf) in the Gain block2 The Integral gain (Ki) in the Transfer Function block
You can change either of the gains in one of the two ways:

GUI for Setting Simulink Model Parameters
9-59
1 Move the slider associated with that gain.2 Type a new value into the Current value edit field associated with that gain.
The block's values are updated as soon as you enter the new value in the GUI.
Run the Simulation
Once you have set the gain values, you can run the simulation by clicking the Simulateand store results button. The simulation time and output vectors are stored in theResults list.
Plot the Results
You can generate a plot of one or more simulation results by selecting the row of results(Run1, Run2, etc.) in the Results list that you want to plot and clicking the Plot button.If you select multiple rows, the graph contains a plot of each result.
The graph is displayed in a figure, which is cleared each time you click the Plot button.The figure's handle is hidden so that only the GUI can display graphs in this window.
Remove Results
To remove a result from the Results list, select the row or rows you want to remove andclick the Remove button.
Run the GUI
The GUI is nonblocking and nonmodal because it is designed to be used as an analysistool.
GUI Options Settings
This GUI uses the following GUI option settings:
• Resize behavior: Non-resizable• Command-line accessibility: Off• GUI Options selected:
• Generate callback function prototypes

9 Examples of GUIDE GUIs
9-60
• GUI allows only one instance to run
Open the Simulink Block Diagrams
This example is designed to work with the f14 Simulink model. Because the GUIsets parameters and runs the simulation, the f14 model must be open when theGUI is displayed. When the GUI runs, the model_open local function executes. Themodel_open function performs these tasks:
• Determines if the model is open (find_system).• Opens the block diagram for the model and the subsystem where the parameters are
being set, if not open already (open_system).• Changes the size of the controller Gain block so it can display the gain value
(set_param).• Brings the GUI forward so it is displayed on top of the Simulink diagrams (figure).• Sets the block parameters to match the current settings in the GUI.
Here is the code for model_open:function model_open(handles)
if isempty(find_system('Name','f14')),
open_system('f14'); open_system('f14/Controller')
set_param('f14/Controller/Gain','Position',[275 14 340 56])
figure(handles.F14ControllerEditor)
set_param('f14/Controller Gain','Gain',...
get(handles.KfCurrentValue,'String'))
set_param(...
'f14/Controller/Proportional plus integral compensator',...
'Numerator',...
get(handles.KiCurrentValue,'String'))
end
Program the Slider and Edit Text Components
Each slider is coupled to an edit text component to accomplish these tasks:
• Display the current value of the slider in the edit text box.• Update the slider when you enter a value into the edit text box.• Update the appropriate model parameters when you interact with the slider and edit
text box.

GUI for Setting Simulink Model Parameters
9-61
Slider Callback
The GUI uses two sliders to specify block gains because these components enable theselection of continuous values within a specified range. When you change the slidervalue, the callback performs these tasks:
• Calls model_open to ensure that the Simulink model is open so that simulationparameters can be set.
• Gets the new slider value.• Sets the value of the Current value edit text component to match the slider.• Sets the appropriate block parameter to the new value (set_param).
Here is the callback for the Proportional (Kf) slider:
function KfValueSlider_Callback(hObject, eventdata, handles)
% Ensure model is open.
model_open(handles)
% Get the new value for the Kf Gain from the slider.
NewVal = get(hObject, 'Value');
% Set the value of the KfCurrentValue to the new value
% set by slider.
set(handles.KfCurrentValue,'String',NewVal)
% Set the Gain parameter of the Kf Gain Block to the new value.
set_param('f14/Controller/Gain','Gain',num2str(NewVal))
While a slider returns a number and the edit text requires a string, uicontrolsautomatically convert the values to the correct type.
The callback for the Integral (Ki) slider follows an approach similar to theProportional (Kf) slider's callback.
Current Value Edit Text Callback
The edit text box enables you to enter a value for the respective parameter. When youclick another component in the GUI after entering data into the text box, the edit textcallback performs these tasks:
• Calls model_open to ensure that the Simulink model is open so that it can setsimulation parameters.
• Converts the string returned by the edit box String property to a double(str2double).
• Checks whether the entered value is within the range of the slider:

9 Examples of GUIDE GUIs
9-62
If the value is out of range, the edit text String property is set to the value of theslider (rejecting the number you entered).
If the value is in range, the slider Value property is updated to the new value.• Sets the appropriate block parameter to the new value (set_param).
Here is the callback for the Kf Current value text box:
function KfCurrentValue_Callback(hObject, eventdata, handles)
% Ensure model is open.
model_open(handles)
% Get the new value for the Kf Gain.
NewStrVal = get(hObject, 'String');
NewVal = str2double(NewStrVal);
% Check that the entered value falls within the allowable range.
if isempty(NewVal) || (NewVal< -5) || (NewVal>0),
% Revert to last value, as indicated by KfValueSlider.
OldVal = get(handles.KfValueSlider,'Value');
set(hObject, 'String',OldVal)
else % Use new Kf value
% Set the value of the KfValueSlider to the new value.
set(handles.KfValueSlider,'Value',NewVal)
% Set the Gain parameter of the Kf Gain Block
% to the new value.
set_param('f14/Controller/Gain','Gain',NewStrVal)
end
The callback for the Ki Current value follows a similar approach.
Run the Simulation from the GUI
The GUI Simulate and store results button callback runs the model simulation andstores the results in the handles structure. Storing data in the handles structuresimplifies the process of passing data to other local function since this structure can bepassed as an argument.
When you click the Simulate and store results button, the callback performs thesetasks:
• Calls sim, which runs the simulation and returns the data that is used for plotting.• Creates a structure to save the results of the simulation, the current values of the
simulation parameters set by the GUI, and the run name and number.
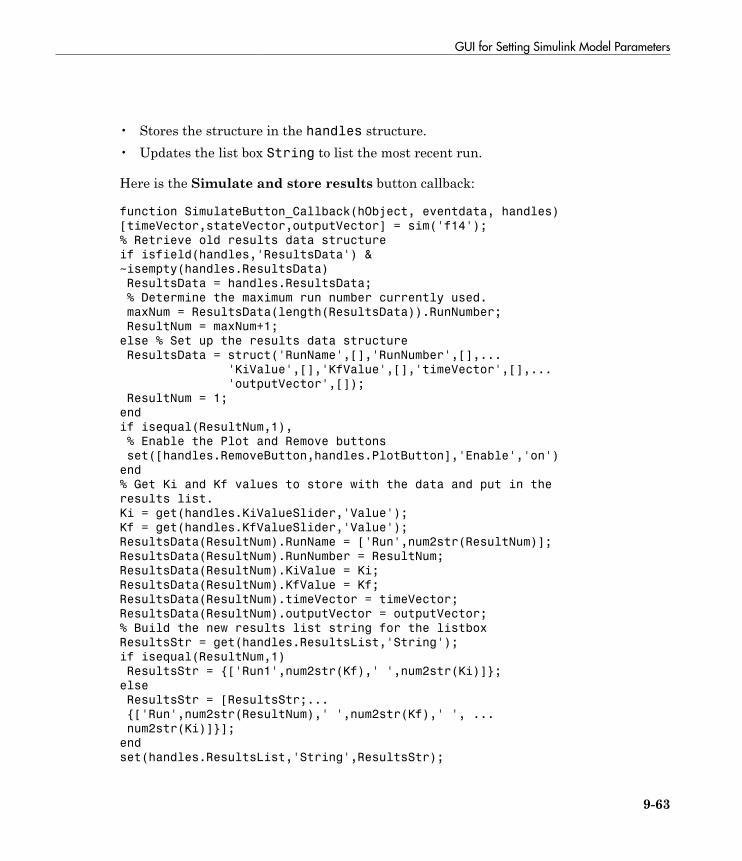
GUI for Setting Simulink Model Parameters
9-63
• Stores the structure in the handles structure.• Updates the list box String to list the most recent run.
Here is the Simulate and store results button callback:
function SimulateButton_Callback(hObject, eventdata, handles)
[timeVector,stateVector,outputVector] = sim('f14');
% Retrieve old results data structure
if isfield(handles,'ResultsData') &
~isempty(handles.ResultsData)
ResultsData = handles.ResultsData;
% Determine the maximum run number currently used.
maxNum = ResultsData(length(ResultsData)).RunNumber;
ResultNum = maxNum+1;
else % Set up the results data structure
ResultsData = struct('RunName',[],'RunNumber',[],...
'KiValue',[],'KfValue',[],'timeVector',[],...
'outputVector',[]);
ResultNum = 1;
end
if isequal(ResultNum,1),
% Enable the Plot and Remove buttons
set([handles.RemoveButton,handles.PlotButton],'Enable','on')
end
% Get Ki and Kf values to store with the data and put in the
results list.
Ki = get(handles.KiValueSlider,'Value');
Kf = get(handles.KfValueSlider,'Value');
ResultsData(ResultNum).RunName = ['Run',num2str(ResultNum)];
ResultsData(ResultNum).RunNumber = ResultNum;
ResultsData(ResultNum).KiValue = Ki;
ResultsData(ResultNum).KfValue = Kf;
ResultsData(ResultNum).timeVector = timeVector;
ResultsData(ResultNum).outputVector = outputVector;
% Build the new results list string for the listbox
ResultsStr = get(handles.ResultsList,'String');
if isequal(ResultNum,1)
ResultsStr = {['Run1',num2str(Kf),' ',num2str(Ki)]};
else
ResultsStr = [ResultsStr;...
{['Run',num2str(ResultNum),' ',num2str(Kf),' ', ...
num2str(Ki)]}];
end
set(handles.ResultsList,'String',ResultsStr);
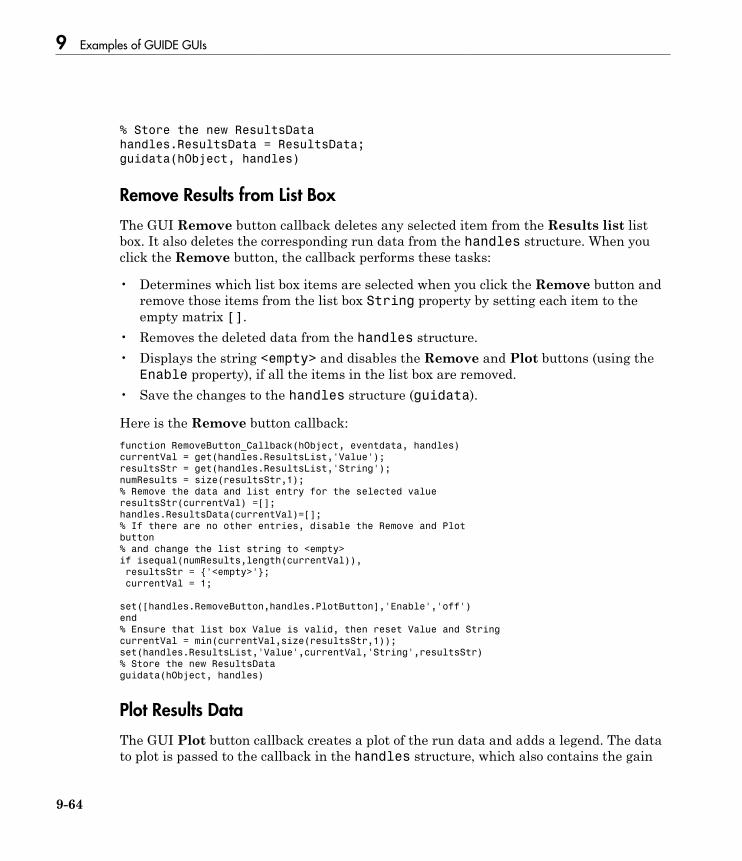
9 Examples of GUIDE GUIs
9-64
% Store the new ResultsData
handles.ResultsData = ResultsData;
guidata(hObject, handles)
Remove Results from List Box
The GUI Remove button callback deletes any selected item from the Results list listbox. It also deletes the corresponding run data from the handles structure. When youclick the Remove button, the callback performs these tasks:
• Determines which list box items are selected when you click the Remove button andremove those items from the list box String property by setting each item to theempty matrix [].
• Removes the deleted data from the handles structure.• Displays the string <empty> and disables the Remove and Plot buttons (using the
Enable property), if all the items in the list box are removed.• Save the changes to the handles structure (guidata).
Here is the Remove button callback:function RemoveButton_Callback(hObject, eventdata, handles)
currentVal = get(handles.ResultsList,'Value');
resultsStr = get(handles.ResultsList,'String');
numResults = size(resultsStr,1);
% Remove the data and list entry for the selected value
resultsStr(currentVal) =[];
handles.ResultsData(currentVal)=[];
% If there are no other entries, disable the Remove and Plot
button
% and change the list string to <empty>
if isequal(numResults,length(currentVal)),
resultsStr = {'<empty>'};
currentVal = 1;
set([handles.RemoveButton,handles.PlotButton],'Enable','off')
end
% Ensure that list box Value is valid, then reset Value and String
currentVal = min(currentVal,size(resultsStr,1));
set(handles.ResultsList,'Value',currentVal,'String',resultsStr)
% Store the new ResultsData
guidata(hObject, handles)
Plot Results Data
The GUI Plot button callback creates a plot of the run data and adds a legend. The datato plot is passed to the callback in the handles structure, which also contains the gain

GUI for Setting Simulink Model Parameters
9-65
settings used when the simulation ran. When you click the Plot button, the callbackperforms these tasks:
• Collects the data for each run selected in the Results list, including two variables(time vector and output vector) and a color for each result run to plot.
• Generates a string for the legend from the stored data.• Creates the figure and axes for plotting and saves the handles for use by the Close
button callback.• Plots the data, adds a legend, and makes the figure visible.
Plot Into the Hidden Figure
The figure that contains the plot is created as invisible and then made visible afteradding the plot and legend. To prevent this figure from becoming the target for plottingcommands issued at the command line or by other GUIs, its HandleVisibility andIntegerHandle properties are set to 'off'. This means the figure is also hidden fromthe plot and legend commands.
Follow these steps to plot into a hidden figure:
1 Save the figure object when you create it.2 Create an axes, set its Parent property to the figure object, and save the axes object.3 Create the plot (which is one or more line objects), save these line objects, and set
their Parent properties to the handle of the axes.4 Make the figure visible.
Plot Button Callback Listing
Here is the Plot button callback.function PlotButton_Callback(hObject, eventdata, handles)
currentVal = get(handles.ResultsList,'Value');
% Get data to plot and generate command string with color
% specified
legendStr = cell(length(currentVal),1);
plotColor = {'b','g','r','c','m','y','k'};
for ctVal = 1:length(currentVal);
PlotData{(ctVal*3)-2} =
handles.ResultsData(currentVal(ctVal)).timeVector;
PlotData{(ctVal*3)-1} =
handles.ResultsData(currentVal(ctVal)).outputVector;
numColor = ctVal - 7*( floor((ctVal-1)/7) );
PlotData{ctVal*3} = plotColor{numColor};

9 Examples of GUIDE GUIs
9-66
legendStr{ctVal} = ...
[handles.ResultsData(currentVal(ctVal)).RunName,'; Kf=',...
num2str(handles.ResultsData(currentVal(ctVal)).KfValue),...
'; Ki=', ...
num2str(handles.ResultsData(currentVal(ctVal)).KiValue)];
end
% If necessary, create the plot figure and store in handles
% structure
if ~isfield(handles,'PlotFigure') ||...
~ishandle(handles.PlotFigure),
handles.PlotFigure = ...
figure('Name','F14 Simulation Output',...
'Visible','off','NumberTitle','off',...
'HandleVisibility','off','IntegerHandle','off');
handles.PlotAxes = axes('Parent',handles.PlotFigure);
guidata(hObject, handles)
end
% Plot data
pHandles = plot(PlotData{:},'Parent',handles.PlotAxes);
% Add a legend, and bring figure to the front
legend(pHandles(1:2:end),legendStr{:})
% Make the figure visible and bring it forward
figure(handles.PlotFigure)
The GUI Help Button
The GUI Help button callback displays an HTML file in the MATLAB Help browser. Ituses two commands:
• The which command returns the full path to the file when it is on the MATLAB path• The web command displays the file in the Help browser.
This is the Help button callback.
function HelpButton_Callback(hObject, eventdata, handles)
HelpPath = which('f14ex_help.html');
web(HelpPath);
You can also display the help document in a Web browser or load an external URL. For adescription of these options, see the documentation for the web function.
Close the GUI
The GUI Close button callback closes the plot figure, if one exists and then closes theGUI. The handle of the plot figure and the GUI figure are available from the handlesstructure. The callback executes two steps:

GUI for Setting Simulink Model Parameters
9-67
• Checks to see if there is a PlotFigure field in the handles structure and if itcontains a valid figure handle (you could have closed the figure manually).
• Closes the GUI figure.
This is the Close button callback:
function CloseButton_Callback(hObject, eventdata, handles)
% Close the GUI and any plot window that is open
if isfield(handles,'PlotFigure') && ...
ishandle(handles.PlotFigure),
close(handles.PlotFigure);
end
close(handles.F14ControllerEditor);
The List Box Callback and Create Function
This GUI does not use the list box callback, but the push buttons reference the listbox in their callbacks (Simulate and store results, Remove, and Plot). GUIDEautomatically inserts an empty callback function when you add the list box to the layout.It also sets the Callback property to execute this local function whenever users interactwith the list box.
You can delete the listbox callback function from the GUI code and also delete the listbox’s Callback property value in the Property Inspector.
Set the Background to White
The list box create function enables you to determine the background color of the list box.The following code shows the create function for the list box that is tagged ResultsList:
function ResultsList_CreateFcn(hObject, eventdata, handles)
% Hint: listbox controls usually have a white background, change
% 'usewhitebg' to 0 to use default. See ISPC and COMPUTER.
usewhitebg = 1;
if usewhitebg
set(hObject,'BackgroundColor','white');
else
set(hObject,'BackgroundColor',...
get(groot,'defaultUicontrolBackgroundColor'));
end

9 Examples of GUIDE GUIs
9-68
Animation with Slider Controls in a GUIDE GUI
In this section...
“About the Example” on page 9-68“Design the 3-D Globe GUI” on page 9-69“Graphics Techniques Used in the 3-D Globe GUI” on page 9-74
About the Example
This example shows how to create a GUI with 3-D axes in which the Earth spins on itsaxis. It accepts no inputs, but it reads a matrix of topographic elevations for the wholeEarth. The GUI provides controls to:
• Start and stop the rotation.• Change lighting direction.• Display a latitude-longitude grid (or graticule).• Save the animation as a movie in a MAT-file.• Exit the application.

Animation with Slider Controls in a GUIDE GUI
9-69
To get and view the example code:
1 Copy the example FIG-file and code file to your current (writeable) folder and openthe FIG-file in GUIDE with the following commands:
copyfile(fullfile(docroot, 'techdoc','creating_guis','examples',...
'globegui*.*')), fileattrib('globegui*.*', '+w')
guide globegui.fig
2 From GUIDE Layout Editor, click the Editor button .
The globegui.m code displays in the MATLAB Editor.
Design the 3-D Globe GUI
• “Alternate the Label of a Push Button” on page 9-71• “Interrupt the Spin Callback” on page 9-72• “Make a Movie of the Animation” on page 9-73

9 Examples of GUIDE GUIs
9-70
In the GUIDE Layout Editor, the GUI looks like this.
The GUI includes three uipanels that you can barely see in this figure because they areentirely black. Using uipanels helps the graphic functions work more efficiently.
The axes CreateFcn (axes1_CreateFcn) initializes the graphic objects. It executes once,no matter how many times the GUI is opened.
The Spin button's callback (spinstopbutton_Callback), which contains a while loopfor rotating the spherical surface, conducts the animation.

Animation with Slider Controls in a GUIDE GUI
9-71
The two sliders allow you to change light direction during animation and functionindependently, but they query one another's value because both parameters are neededto specify a view.
The Show grid check box toggles the Visible property of the graticule surface object.The axes1_CreateFcn initializes the graticule and then hides it until you select thisoption.
The Spin button's callback reads the Make movie check box value to accumulate movieframes and saves the movie to a MAT-file when rotation is stopped or after one fullrevolution, whichever comes first. (You must select Make movie before spinning theglobe.)
The Property Inspector was used to customize the uicontrols and text by:
• Setting the figure Color to black, as well as the BackgroundColor,ForegroundColor, and ShadowColor of the three uipanels. (They are used ascontainers only, so they do not need to be visible.)
• Coloring all static text yellow and uicontrol backgrounds either black or yellow-gray.• Giving all uicontrols mnemonic names in their Tag string.• Setting the FontSize for uicontrols to 9 points.• Specifying nondefault Min and Max values for the sliders.• Adding tooltip strings for some controls.
The following sections describe the interactive techniques used in the GUI.
Alternate the Label of a Push Button
The top right button, initially labeled Spin, changes to Stop when clicked, and back toSpin clicked a second time. It does this by comparing its String property to a pair ofstrings stored in the handles structure as a cell array. Insert this data into the handlesstructure in spinstopbutton_CreateFcn, as follows:
function spinstopbutton_CreateFcn(hObject, eventdata, handles)
handles.Strings = {'Spin';'Stop'};
guidata(hObject, handles);
The call to guidata saves the updated handles structure for the figure containinghObject, which is the spinstopbutton push button object. GUIDE named this objectpushbutton1. It was renamed by changing its Tag property in the Property Inspector.As a result, GUIDE changed all references to the component in the GUI' code file when

9 Examples of GUIDE GUIs
9-72
the GUI was saved. For more information on setting tags, see “Identify the Axes” on page9-23 in the previous example.
The handles.Strings data is used in the spinstopbutton_Callback function,which includes the following code for changing the label of the button:
str = get(hObject,'String');
state = find(strcmp(str,handles.Strings));
set(hObject,'String',handles.Strings{3-state});
The find function returns the index of the string that matches the button's currentlabel. The call to set switches the label to the alternative string. If state is 1, 3-statesets it to 2. If state is 2, it sets it to 1.
Interrupt the Spin Callback
If you click the Spin/Stop button when its label is Stop, its callback is looping throughcode that updates the display by advancing the rotation of the surface objects. Thespinstopbutton_Callback contains code that listens to such events, but it does notuse the events structure to accomplish this. Instead, it uses this piece of code to exit thedisplay loop:
if find(strcmp(get(hObject,'String'),handles.Strings)) == 1
handles.azimuth = az;
guidata(hObject,handles);
break
end
Entering this block of code while spinning the view exits the while loop to stop theanimation. First, however, it saves the current azimuth of rotation for initializing thenext spin. (The handles structure can store any variable, not just handles.) If you clickthe (now) Spin button, the animation resumes at the place where it halted, using thecached azimuth value.
When you click Quit, the GUI destroys the figure, exiting immediately. To avoid errorsdue to quitting while the animation is running, the while loop must know whether theaxes object still exists:
while ishandle(handles.axes1)
% plotting code
...
end
You can write the spinstopbutton_Callback function without a while loop, whichavoids you having to test that the figure still exists. You can, for example, create a timer

Animation with Slider Controls in a GUIDE GUI
9-73
object that handles updating the graphics. This example does not explore the technique,but you can find information about programming timers in “Use a MATLAB TimerObject”.
Make a Movie of the Animation
Selecting the Make movie check box before clicking Spin causes the application torecord each frame displayed in the while loop of the spinstopbutton_Callbackroutine. When you select this check box, the animation runs more slowly because thefollowing block of code executes:
filming = handles.movie;
...
if ishandle(handles.axes1) && filming > 0 && filming < 361
globeframes(filming) = getframe; % Capture axes in movie
filming = filming + 1;
end
Because it is the value of a check box, handles.movie is either 0 or 1. When it is 1, acopy (filming) of it keeps a count of the number of frames saved in the globeframesmatrix (which contains the axes CData and colormap for each frame). You cannot togglesaving the movie on or off while the globe is spinning, because the while loop code doesnot monitor the state of the Make movie check box.
The ishandle test prevents the getframe from generating an error if the axes isdestroyed before the while loop finishes.
When the while loop terminates, the callback prints the results of capturing movieframes to the Command Window and writes the movie to a MAT-file:
if (filming)
filename = sprintf('globe%i.mat',filming-1);
disp(['Writing movie to file ' filename]);
save (filename, 'globeframes')
end
Note: Before creating a movie file with the GUI, make sure that you have writepermission for the current folder.
The file name of the movie ends with the number of frames it contains. Supposing themovie's file name is globe360.mat, you play it with:

9 Examples of GUIDE GUIs
9-74
load globe360
axis equal off
movie(globeframes)
The playback looks like this.
Graphics Techniques Used in the 3-D Globe GUI
To learn more about how this GUI uses Handle Graphics to create and view 3-D objects,read the following sections:
• “Create the Graphic Objects” on page 9-75• “Texture and Color the Globe” on page 9-75• “Plot the Graticule” on page 9-76• “Orient the Globe and Graticule” on page 9-76

Animation with Slider Controls in a GUIDE GUI
9-75
• “Light the Globe and Shift the Light Source” on page 9-77
Create the Graphic Objects
The axes1_CreateFcn function initializes the axes, the two objects displayed in it, andtwo hgtransform objects that affect the rotation of the globe:
• The globe is a surfaceplot generated by surface.• The geographic graticule (lines of latitude and longitude), also a surfaceplot object,
generated by a call to mesh.
Data for these two objects are rectangular x-y-z grids generated by the sphere function.The globe's grid is 50-by-50 and the graticule grid is 8-by-15. (Every other row of the 15-by-15 grid returned by sphere is removed to equalize its North-South and East-Westspans when viewed on the globe.)
The axes x-, y-, and z-limits are set to [-1.02 1.02]. Because the graphic objects areunit spheres, this leaves a little space around them while constraining all three axes toremain the same relative and absolute size. The graticule grid is also enlarged by 2%,which is barely enough to prevent the opaque texture-mapped surface of the globe fromobscuring the graticule. If you watch carefully, you can sometimes see missing pieces ofgraticule edges as the globe spins.
Texture and Color the Globe
Code in the axes1_CreateFcn sets the CData for the globe to the 180-by-360 (onedegree) topo terrain grid by setting its FaceColor property to 'texturemap'. Youcan use any image or grid to texture a surface. Specify surface properties as a structcontaining one element per property that you must set, as follows:
props.FaceColor= 'texture';
props.EdgeColor = 'none';
props.FaceLighting = 'gouraud';
props.Cdata = topo;
props.Parent = hgrotate;
hsurf = surface(x,y,z,props);
colormap(cmap)
Tip You can create MATLAB structs that contain values for sets of parameters andprovide them to functions instead of parameter-value pairs, and save the structs to MAT-files for later use.

9 Examples of GUIDE GUIs
9-76
The surface function plots the surface into the axes. Setting the Parent of the surfaceto hgrotate puts the surface object under the control of the hgtransform that spinsthe globe (see the illustration in “Orient the Globe and Graticule” on page 9-76). Bysetting EdgeColor to 'none', the globe displays face colors only, with no grid lines(which, by default, display in black). The colormap function sets the colormap for thesurface to the 64-by-3 colormap cmap defined in the code, which is appropriate for terraindisplay. While you can use more colors, 64 is sufficient, given the relative coarseness ofthe texture map (1-by-1 degree resolution).
Plot the Graticule
Unlike the globe grid, the graticule grid displays with no face colors and gray edge color.(You turn the graticule grid on and off by clicking the Show grid button.) Like theterrain map, it is a surfaceplot object; however, the mesh function creates it, rather thanthe surface function, as follows:
hmesh = mesh(gx,gy,gz,'parent',hgrotate,...
'FaceColor','none','EdgeColor',[.5 .5 .5]);
set(hmesh,'Visible','off')
The state of the Show grid button is initially off, causing the graticule not to display.Show grid toggles the mesh object's Visible property.
As mentioned earlier, enlarging the graticule by 2 percent before plotting prevents theterrain surface from obscuring it.
Orient the Globe and Graticule
The globe and graticule rotate as if they were one object, under the control of a pair ofhgtransform objects. Within the figure, the HG objects are set up in this hierarchy.

Animation with Slider Controls in a GUIDE GUI
9-77
Uipanel
Axes
ro ta tex fo rm
g lobesu r f ace
g ra t i cu l esu r f ace
Light
t i l tx f o rm
Insertedobjects
HG Hierarchy for the Example
The tilt transform applies a rotation about the x-axis of 0.5091 radians (equal to 23.44degrees, the inclination of the Earth's axis of rotation). The rotate transform initially hasa default identity matrix. The spinstopbutton_Callback subsequently updates thematrix to rotate about the z-axis by 0.01745329252 radians (1 degree) per iteration, usingthe following code:
az = az + 0.01745329252;
set(hgrotate,'Matrix',makehgtform('zrotate',az));
drawnow % Refresh the screen
Light the Globe and Shift the Light Source
A light object illuminates the globe, initially from the left. Two sliders control thelight's position, which you can manipulate whether the globe is standing still or rotating.The light is a child of the axes, so is not affected by either of the hgtransforms. The callto light uses no parameters other than its altitude and an azimuth:
hlight = camlight(0,0);
After creating the light, the axes1_CreateFcn adds some handles and data that othercallbacks need to the handles structure:

9 Examples of GUIDE GUIs
9-78
handles.light = hlight;
handles.tform = hgrotate;
handles.hmesh = hmesh;
handles.azimuth = 0.;
handles.cmap = cmap;
guidata(gcf,handles);
The call to guidata caches the data added to handles.
Moving either of the sliders sets both the elevation and the azimuth of the light source,although each slider changes only one. The code in the callback for varying the elevationof the light isfunction sunelslider_Callback(hObject, eventdata, handles)
hlight = handles.light; % Get handle to light object
sunaz = get(handles.sunazslider,'value'); % Get current light azimuth
sunel = get(hObject,'value'); % Varies from -72.8 -> 72.8 deg
lightangle(hlight,sunaz,sunel) % Set the new light angle
The callback for the light azimuth slider works similarly, querying the elevation slider'ssetting to keep that value from being changed in the call to lightangle.

Automatically Refresh Plot in a GUIDE GUI
9-79
Automatically Refresh Plot in a GUIDE GUI
In this section...
“About the Example” on page 9-79“How the GUI Implements the Timer” on page 9-81
About the Example
This example shows how to refresh a display by incorporating a timer in a GUI thatupdates data. Timers are MATLAB objects. Programs use their properties and methodsto schedule tasks, update information, and time out processes. For example, you can setup a timer to acquire real-time data at certain intervals, which your GUI then analyzesand displays.
The GUI displays a surface plot of the peaks function and contains three uicontrols:
• The Start Randomizing push button — Starts the timer running, which executesat a rate determined by the slider control. At each iteration, random noise is added tothe surface plot.
• The Stop Randomizing push button — Halts the timer, leaving the surface plot inits current state until you click the Start Randomizing button again.
• The Timer Period slider — Speeds up and slows down the timer, changing its periodwithin a range of 0.01 to 2 seconds.

9 Examples of GUIDE GUIs
9-80
To get and view the example code:
1 Copy the example FIG-file and code file to your current (writeable) folder and openthe FIG-file in GUIDE with the following commands:
copyfile(fullfile(docroot, 'techdoc','creating_guis','examples',...
'ex_guide_timergui*.*')), fileattrib('ex_guide_timergui*.*', '+w')
guide ex_guide_timergui.fig
2 From the GUIDE Layout Editor, click the Editor button .
The ex_guide_timergui.m code displays in the MATLAB Editor.
The following figures show the GUI when you run it. The left figure shows the initialstate of the GUI. The right figure shows the GUI after running the timer for 5 seconds atits default period of 1 count per second.

Automatically Refresh Plot in a GUIDE GUI
9-81
For details about timer properties, methods, and events, see “Use a MATLAB TimerObject” and the timer reference page.
How the GUI Implements the Timer
Each callback in the GUI either creates, modifies, starts, stops, or destroys the timerobject. The following sections describe what each callbacks does.
• “ex_guide_timergui_OpeningFcn” on page 9-82• “startbtn_Callback” on page 9-82• “stopbtn_Callback” on page 9-82• “periodsldr_Callback” on page 9-82• “update_display” on page 9-83• “figure1_CloseRequestFcn” on page 9-83
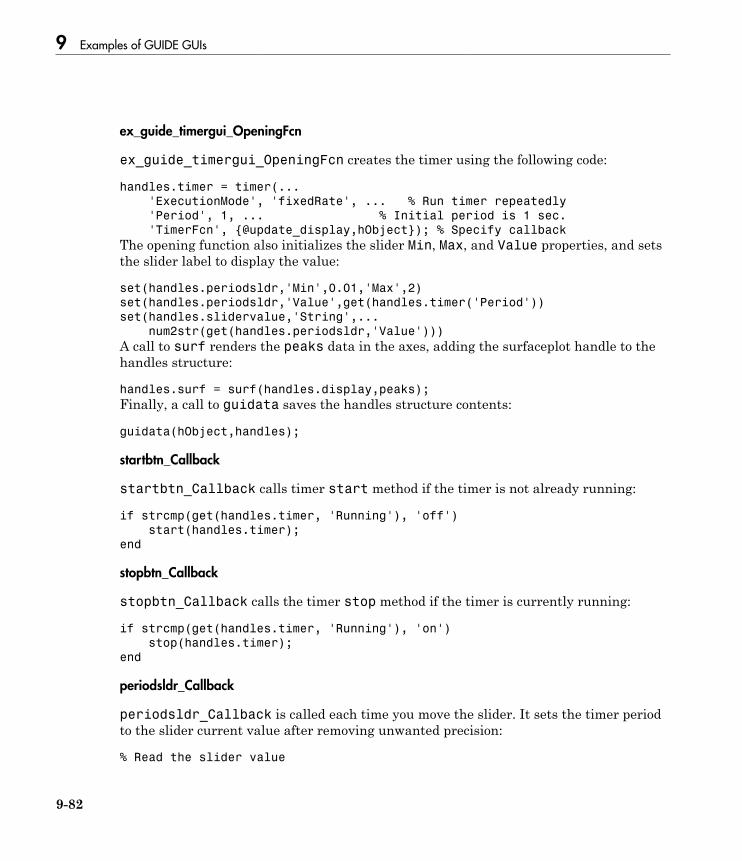
9 Examples of GUIDE GUIs
9-82
ex_guide_timergui_OpeningFcn
ex_guide_timergui_OpeningFcn creates the timer using the following code:
handles.timer = timer(...
'ExecutionMode', 'fixedRate', ... % Run timer repeatedly
'Period', 1, ... % Initial period is 1 sec.
'TimerFcn', {@update_display,hObject}); % Specify callback
The opening function also initializes the slider Min, Max, and Value properties, and setsthe slider label to display the value:
set(handles.periodsldr,'Min',0.01,'Max',2)
set(handles.periodsldr,'Value',get(handles.timer('Period'))
set(handles.slidervalue,'String',...
num2str(get(handles.periodsldr,'Value')))
A call to surf renders the peaks data in the axes, adding the surfaceplot handle to thehandles structure:
handles.surf = surf(handles.display,peaks);
Finally, a call to guidata saves the handles structure contents:
guidata(hObject,handles);
startbtn_Callback
startbtn_Callback calls timer start method if the timer is not already running:
if strcmp(get(handles.timer, 'Running'), 'off')
start(handles.timer);
end
stopbtn_Callback
stopbtn_Callback calls the timer stop method if the timer is currently running:
if strcmp(get(handles.timer, 'Running'), 'on')
stop(handles.timer);
end
periodsldr_Callback
periodsldr_Callback is called each time you move the slider. It sets the timer periodto the slider current value after removing unwanted precision:
% Read the slider value

Automatically Refresh Plot in a GUIDE GUI
9-83
period = get(handles.periodsldr,'Value');
% Timers need the precision of periods to be greater than about
% 1 millisecond, so truncate the value returned by the slider
period = period - mod(period,.01);
% Set slider readout to show its value
set(handles.slidervalue,'String',num2str(period))
% If timer is on, stop it, reset the period, and start it again.
if strcmp(get(handles.timer, 'Running'), 'on')
stop(handles.timer);
set(handles.timer,'Period',period)
start(handles.timer)
else % If timer is stopped, reset its period only.
set(handles.timer,'Period',period)
end
The slider callback must stop the timer to reset its period, because timer objects do notallow their periods to vary while they are running.
update_display
update_display is the callback for the timer object. It adds Gaussian noise to theZData of the surface plot:
handles = guidata(hfigure);
Z = get(handles.surf,'ZData');
Z = Z + 0.1*randn(size(Z));
set(handles.surf,'ZData',Z);
Because update_display is not a GUIDE-generated callback, it does not includehandles as one of its calling arguments. Instead, it accesses the handles structureby calling guidata. The callback gets the ZData of the surface plot from thehandles.surf member of the structure. It modifies the Z matrix by adding noise usingrandn, and then resets the ZData of the surface plot with the modified data. It does notmodify the handles structure.
figure1_CloseRequestFcn
MATLAB calls the figure1_CloseRequestFcn when you click the close box of the GUI.The callback cleans up the application before it exits, stopping and deleting the timerobject and then deleting the figure window.
% Necessary to provide this function to prevent timer callback
% from causing an error after GUI code stops executing.
% Before exiting, if the timer is running, stop it.
if strcmp(get(handles.timer, 'Running'), 'on')
stop(handles.timer);

9 Examples of GUIDE GUIs
9-84
end
% Destroy timer
delete(handles.timer)
% Destroy figure
delete(hObject);
Create GUIs Programmatically


10
Lay Out a Programmatic GUI
• “Structure of a Programmatic GUI File” on page 10-2• “Create Figures for Programmatic GUIs” on page 10-4• “Programmatic Components” on page 10-6• “Add Components to a Programmatic GUI” on page 10-9• “Layout a GUI Programmatically” on page 10-40• “Adjust Programmatic GUI Layouts Interactively” on page 10-49• “Customize Tabbing Behavior in a Programmatic GUI” on page 10-71• “Create Menus for Programmatic GUIs” on page 10-75• “Create Toolbars for Programmatic GUIs” on page 10-88• “Fonts and Colors for Cross-Platform Compatibility” on page 10-94

10 Lay Out a Programmatic GUI
10-2
Structure of a Programmatic GUI File
In this section...
“File Organization” on page 10-2“File Template” on page 10-2“Run the GUI” on page 10-3
File Organization
Typically, a GUI code file has the following ordered sections. You can help to maintainthe structure by adding comments that name the sections when you first create them.
1 Comments displayed in response to the MATLAB help command.2 Initialization tasks such as data creation and any processing that is needed to
construct the components. See “Initialize a Programmatic GUI” on page 11-2 formore information.
3 Construction of figure and components. For more information, see “Create Figuresfor Programmatic GUIs” on page 10-4 and “Add Components to a ProgrammaticGUI” on page 10-9.
4 Initialization tasks that require the components to exist, and output return. See“Initialize a Programmatic GUI” on page 11-2 for more information.
5 Callbacks for the components. Callbacks are the routines that execute in responseto user-generated events such as mouse clicks and key strokes. See “Write CallbacksUsing the Programmatic Workflow” on page 11-5 for more information.
6 Utility functions.
File Template
This is a template you can use to create a GUI code file:
function varargout = mygui(varargin)
% MYGUI Brief description of GUI.
% Comments displayed at the command line in response
% to the help command.
% (Leave a blank line following the help.)

Structure of a Programmatic GUI File
10-3
% Initialization tasks
% Construct the components
% Initialization tasks
% Callbacks for MYGUI
% Utility functions for MYGUI
end
The end statement that matches the function statement is necessary because thisdocument treats GUI creation using nested functions.
Save the file in your current folder or at a location that is on your MATLAB path.
Run the GUI
You can display your GUI at any time by executing its code file. For example, if your GUIcode file is mygui.m, type
mygui
at the command line. Provide run-time arguments as appropriate. The file must reside onyour path or in your current folder.
When you execute the code, a fully functional copy of the GUI displays on the screen. Ifthe file includes code to initialize the GUI and callbacks to service the components, youcan manipulate components that it contains.

10 Lay Out a Programmatic GUI
10-4
Create Figures for Programmatic GUIsIn MATLAB software, a GUI is a figure. Before you add components to it, create thefigure explicitly and obtain a handle for it. In the initialization section of your file, use astatement such as the following to create the figure:
fh = figure;
where fh is the figure handle.
Note If you create a component when there is no figure, MATLAB creates a figureautomatically but does not return the figure handle.
When you create the figure, you can also specify properties for the figure. The mostcommonly used figure properties are shown in the following table:
Property Values Description
MenuBar figure, none. Default is figure. Display or hide the MATLABstandard menu bar menus. If noneand there are no user-createdmenus, the menu bar itself isremoved.
Name String Title displayed in the figurewindow. If NumberTitle is on,this string is appended to thefigure number.
NumberTitle on, off. Default is on. Determines whether the string'Figure n' (where n is the figurenumber) is prefixed to the figurewindow title specified by Name.
Position 4-element vector: [distance fromleft, distance from bottom, width,height].
Size of the GUI figure and itslocation relative to the lower-leftcorner of the screen.
Resize on, off. Default is on. Determines if the user can resizethe figure window with the mouse.
Toolbar auto, none, figure. Default isauto.
Display or hide the default figuretoolbar.

Create Figures for Programmatic GUIs
10-5
Property Values Description
• none — do not display thefigure toolbar.
• auto — display the figuretoolbar, but remove it if a userinterface control (uicontrol) isadded to the figure.
• figure — display the figuretoolbar.
Units pixels, centimeters,characters, inches,normalized, points, Default ispixels.
Units of measurement used tointerpret position vector
Visible on, off. Default is on. Determines whether a figure isdisplayed on the screen.
For a complete list of properties and for more information about the properties listed inthe table, see Figure Properties.
The following statement names the figure My GUI, positions the figure on the screen,and makes the GUI invisible so that the user cannot see the components as they areadded or initialized. All other properties assume their defaults.
f = figure('Visible','off','Name','My GUI',...
'Position',[360,500,450,285]);
Related Examples• “Layout a GUI Programmatically”• “Add Components to a Programmatic GUI” on page 10-9• “Create Menus for Programmatic GUIs” on page 10-75• “Create Toolbars for Programmatic GUIs” on page 10-88

10 Lay Out a Programmatic GUI
10-6
Programmatic Components
The following table describes the available components and the function used to createeach programmatically.
Note MATLAB software provides a selection of standard dialog boxes that you can createwith a single function call. For an example, see the documentation for msgbox, whichalso provides links to functions that create specialized predefined dialog boxes.
Component Function Description
ActiveX actxcontrol ActiveX components enable you to displayActiveX controls in your GUI. They areavailable only on the Microsoft Windowsplatform.
“Axes” on page10-37
axes Axes enable your GUI to display graphicssuch as graphs and images.
“Button Group” onpage 10-33
uibuttongroup Button groups are like panels, but are usedto manage exclusive selection behavior forradio buttons and toggle buttons.
“Check Box” onpage 10-11
uicontrol Check boxes can generate an action whenchecked and indicate their state as checkedor not checked. Check boxes are usefulwhen providing the user with a number ofindependent choices, for example, displayinga toolbar.
“Edit Text” on page10-12
uicontrol Edit text components are fields that enableusers to enter or modify text strings. Use anedit text when you want text as input. Userscan enter numbers, but you must convertthem to their numeric equivalents.
“List Box” on page10-16
uicontrol List boxes display a list of items and enableusers to select one or more items.
“Panel” on page10-31
uipanel Panels arrange GUI components intogroups. By visually grouping relatedcontrols, panels can make the user interface
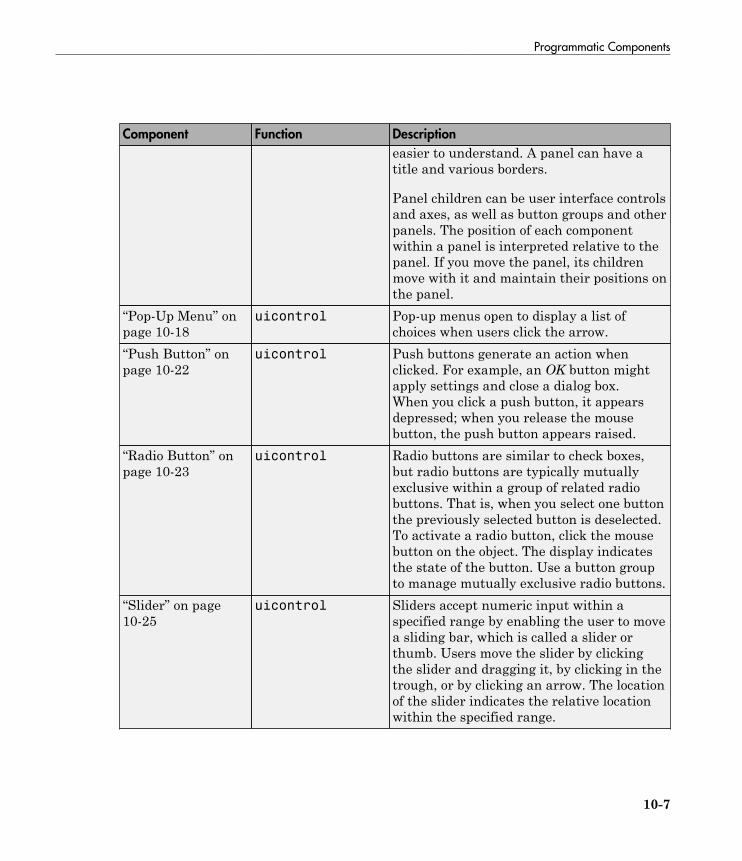
Programmatic Components
10-7
Component Function Description
easier to understand. A panel can have atitle and various borders.
Panel children can be user interface controlsand axes, as well as button groups and otherpanels. The position of each componentwithin a panel is interpreted relative to thepanel. If you move the panel, its childrenmove with it and maintain their positions onthe panel.
“Pop-Up Menu” onpage 10-18
uicontrol Pop-up menus open to display a list ofchoices when users click the arrow.
“Push Button” onpage 10-22
uicontrol Push buttons generate an action whenclicked. For example, an OK button mightapply settings and close a dialog box.When you click a push button, it appearsdepressed; when you release the mousebutton, the push button appears raised.
“Radio Button” onpage 10-23
uicontrol Radio buttons are similar to check boxes,but radio buttons are typically mutuallyexclusive within a group of related radiobuttons. That is, when you select one buttonthe previously selected button is deselected.To activate a radio button, click the mousebutton on the object. The display indicatesthe state of the button. Use a button groupto manage mutually exclusive radio buttons.
“Slider” on page10-25
uicontrol Sliders accept numeric input within aspecified range by enabling the user to movea sliding bar, which is called a slider orthumb. Users move the slider by clickingthe slider and dragging it, by clicking in thetrough, or by clicking an arrow. The locationof the slider indicates the relative locationwithin the specified range.
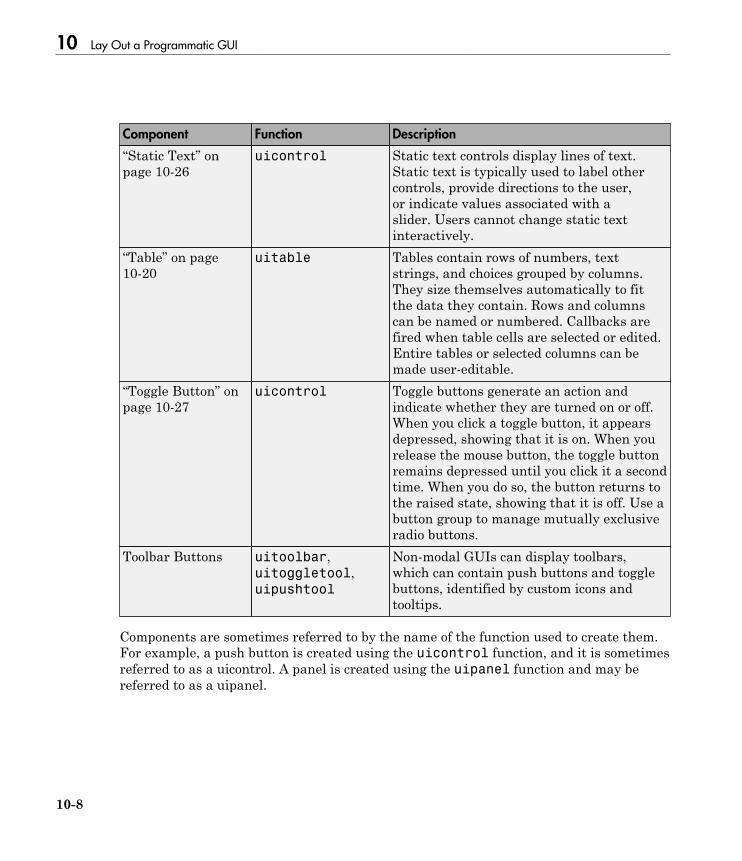
10 Lay Out a Programmatic GUI
10-8
Component Function Description
“Static Text” onpage 10-26
uicontrol Static text controls display lines of text.Static text is typically used to label othercontrols, provide directions to the user,or indicate values associated with aslider. Users cannot change static textinteractively.
“Table” on page10-20
uitable Tables contain rows of numbers, textstrings, and choices grouped by columns.They size themselves automatically to fitthe data they contain. Rows and columnscan be named or numbered. Callbacks arefired when table cells are selected or edited.Entire tables or selected columns can bemade user-editable.
“Toggle Button” onpage 10-27
uicontrol Toggle buttons generate an action andindicate whether they are turned on or off.When you click a toggle button, it appearsdepressed, showing that it is on. When yourelease the mouse button, the toggle buttonremains depressed until you click it a secondtime. When you do so, the button returns tothe raised state, showing that it is off. Use abutton group to manage mutually exclusiveradio buttons.
Toolbar Buttons uitoolbar,uitoggletool,uipushtool
Non-modal GUIs can display toolbars,which can contain push buttons and togglebuttons, identified by custom icons andtooltips.
Components are sometimes referred to by the name of the function used to create them.For example, a push button is created using the uicontrol function, and it is sometimesreferred to as a uicontrol. A panel is created using the uipanel function and may bereferred to as a uipanel.

Add Components to a Programmatic GUI
10-9
Add Components to a Programmatic GUI
In this section...
“Add User Interface Controls to a Programmatic GUI” on page 10-9“Add Panels and Button Groups” on page 10-29“Add Axes” on page 10-35“Add ActiveX Controls” on page 10-38
Add User Interface Controls to a Programmatic GUI
Use the uicontrol function to create user interface controls. These include pushbuttons, toggle buttons, sliders, radio buttons, edit text controls, static text controls, pop-up menus, check boxes, and list boxes.
Note See “Programmatic Components” on page 10-6 for descriptions of these components.See “Callbacks for Specific Components” for basic examples of programming thesecomponents.
A syntax for the uicontrol function is
uich = uicontrol(parent,'PropertyName',PropertyValue,...)
where uich is the handle of the resulting user interface control. If you do notspecify parent, the component parent is the current figure as specified by the rootCurrentFigure property. See the uicontrol reference page for other valid syntaxes.
Subsequent topics describe commonly used properties of user interface controls and offera simple example for each kind of control:
• “Commonly Used Properties” on page 10-10• “Check Box” on page 10-11• “Edit Text” on page 10-12• “List Box” on page 10-16• “Pop-Up Menu” on page 10-18• “Table” on page 10-20

10 Lay Out a Programmatic GUI
10-10
• “Push Button” on page 10-22• “Radio Button” on page 10-23• “Slider” on page 10-25• “Static Text” on page 10-26• “Toggle Button” on page 10-27
Commonly Used Properties
The most commonly used properties needed to describe a user interface control are shownin the following table:
Property Values Description
Max Scalar. Default is 1. Maximum value. Interpretationdepends on the Style property.
Min Scalar. Default is 0. Minimum value. Interpretationdepends on the Style property.
Position 4-element vector: [distancefrom left, distance from bottom,width, height]. Default is [20, 20,60, 20].
Size of the component and itslocation relative to its parent.
String String. Can be a cell array orcharacter array or strings.
Component label. For list boxesand pop-up menus it is a list of theitems. To display the & characterin a label, use two & charactersin the string. The words remove,default, and factory (casesensitive) are reserved. To useone of these as a label, prependa backslash (\) to the string. Forexample, \remove yields remove.
Style pushbutton, togglebutton,radiobutton, checkbox,edit, text, slider, listbox,popupmenu. Default ispushbutton.
Type of user interface controlobject.
TooltipString String Text of the tooltip associated withthe push tool or toggle tool.

Add Components to a Programmatic GUI
10-11
Property Values Description
Units pixels, centimeters,characters, inches,normalized, points, Default ispixels.
Units of measurement used tointerpret position vector
Value Scalar or vector Value of the component.Interpretation depends on theStyle property.
For a complete list of properties and for more information about the properties listed inthe table, see Uicontrol Properties.
Check Box
The following statement creates a check box with handle cbh.
cbh = uicontrol(fh,'Style','checkbox',...
'String','Display file extension',...
'Value',1,'Position',[30 20 130 20]);
The first argument, fh, specifies the handle of the parent figure. You can also specify theparent as a panel or button group. See “Panel” on page 10-31 and “Button Group” onpage 10-33 for more information.
The Style property, checkbox, specifies the user interface control as a check box.
The String property labels the check box as Display file extension. The check boxaccommodates only a single line of text. If you specify a component width that is too
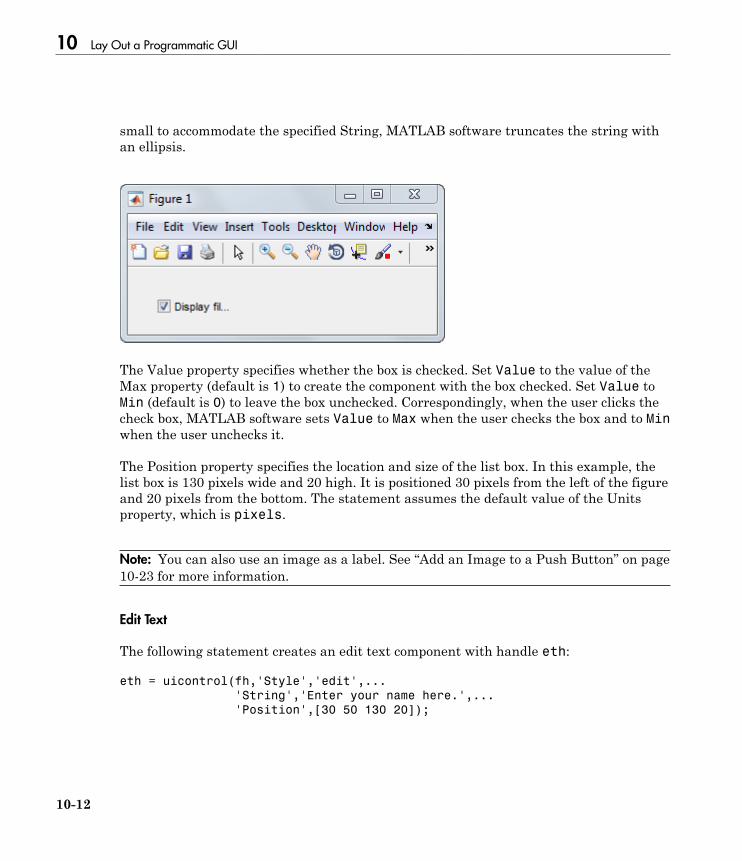
10 Lay Out a Programmatic GUI
10-12
small to accommodate the specified String, MATLAB software truncates the string withan ellipsis.
The Value property specifies whether the box is checked. Set Value to the value of theMax property (default is 1) to create the component with the box checked. Set Value toMin (default is 0) to leave the box unchecked. Correspondingly, when the user clicks thecheck box, MATLAB software sets Value to Max when the user checks the box and to Minwhen the user unchecks it.
The Position property specifies the location and size of the list box. In this example, thelist box is 130 pixels wide and 20 high. It is positioned 30 pixels from the left of the figureand 20 pixels from the bottom. The statement assumes the default value of the Unitsproperty, which is pixels.
Note: You can also use an image as a label. See “Add an Image to a Push Button” on page10-23 for more information.
Edit Text
The following statement creates an edit text component with handle eth:
eth = uicontrol(fh,'Style','edit',...
'String','Enter your name here.',...
'Position',[30 50 130 20]);

Add Components to a Programmatic GUI
10-13
The first argument, fh, specifies the handle of the parent figure. You can also specify theparent as a panel or button group. See “Panel” on page 10-31 and “Button Group” onpage 10-33 for more information.
The Style property, edit, specifies the user interface control as an edit text component.
The String property defines the text that appears in the component.
To enable multiple-line input, Max - Min must be greater than 1, as in the followingstatement. MATLAB software wraps the string if necessary.
eth = uicontrol(fh,'Style','edit',...
'String','Enter your name and address here.',...
'Max',2,'Min',0,...
'Position',[30 20 130 80]);

10 Lay Out a Programmatic GUI
10-14
If Max-Min is less than or equal to 1, the edit text component admits only a single lineof input. If you specify a component width that is too small to accommodate the specifiedstring, MATLAB displays only part of the string. The user can use the arrow keys tomove the cursor over the entire string.
The Position property specifies the location and size of the edit text component. In thisexample, the edit text is 130 pixels wide and 20 high. It is positioned 30 pixels from theleft of the figure and 50 pixels from the bottom. The statement assumes the default valueof the Units property, which is pixels.
Setting Font Characteristics
You specify the text font to display in the edit box with the FontName property. OnMicrosoft Windows platforms, the default is MS Sans Serif; on Macintosh and UNIXplatforms, the default is Helvetica. You can use any system font except Symbol andMarlett.
You can chose a text font for the edit box and set all font characteristics at once withoutput from the uisetfont GUI, which lists and previews available fonts. When youselect one of them and click OK, its name and other characteristics are returned in aMATLAB structure, which you can use to set the font characteristic for the edit box. Forexample, to use the Century Schoolbook font with a normal style and 9 point size, do thefollowing:
font = uisetfont
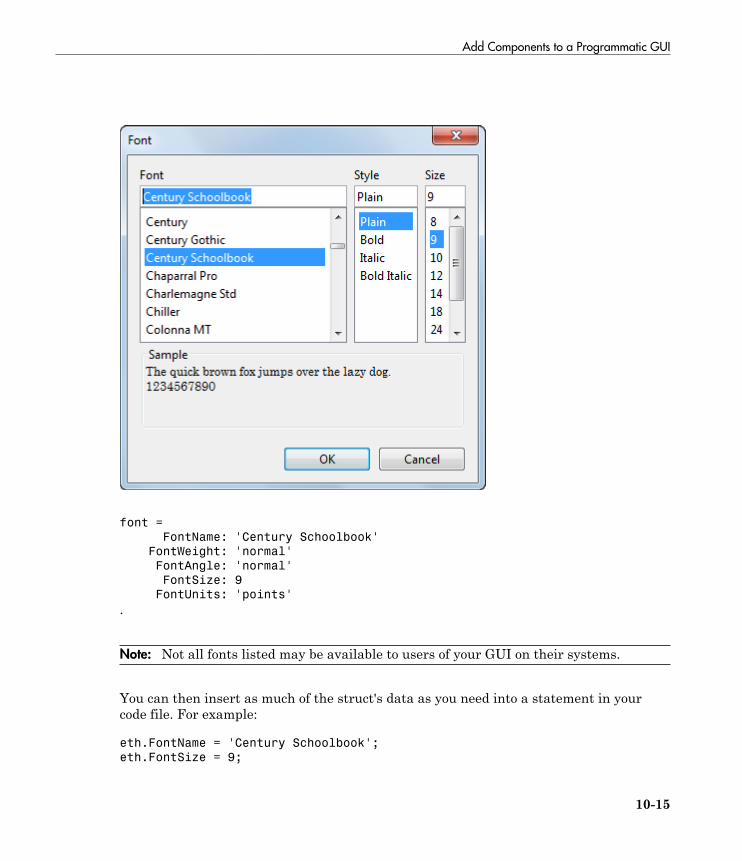
Add Components to a Programmatic GUI
10-15
font =
FontName: 'Century Schoolbook'
FontWeight: 'normal'
FontAngle: 'normal'
FontSize: 9
FontUnits: 'points'
.
Note: Not all fonts listed may be available to users of your GUI on their systems.
You can then insert as much of the struct's data as you need into a statement in yourcode file. For example:
eth.FontName = 'Century Schoolbook';
eth.FontSize = 9;

10 Lay Out a Programmatic GUI
10-16
Instead of designating a font yourself, you could provide a push button or context menuin your GUI that allows users to select fonts themselves via the uisetfont GUI. Thecallback for the feature could be
font = uisetfont;
set(eth, font)
where eth is the handle for the edit box whose font the user is setting. You can store thehandle in the figure's application data and retrieve it with getappdata.
List Box
The following statement creates a list box with handle lbh:
lbh = uicontrol(fh,'Style','listbox',...
'String',{'one','two','three','four'},...
'Value',1,'Position',[30 20 130 80]);
The first argument, fh, specifies the handle of the parent figure. You can also specify theparent as a panel or button group. See “Panel” on page 10-31 and “Button Group” onpage 10-33 for more information.
The Style property, listbox, specifies the user interface control as a list box.
The String property defines the list items. You can specify the items in any of the formatsshown in the following table.

Add Components to a Programmatic GUI
10-17
String Property Format Example
Cell array of strings {'one' 'two' 'three'}
Padded string matrix ['one ';'two ';'three']
String vector separated byvertical slash (|) characters
['one|two|three']
If you specify a component width that is too small to accommodate one or more of thespecified strings, MATLAB software truncates those strings with an ellipsis.
The Value property specifies the item or items that are selected when the componentis created. To select a single item, set Value to a scalar that indicates the index of theselected list item, where 1 corresponds to the first item in the list.
To select more than one item, set Value to a vector of indices of the selected items. Toenable selection of more than one item, Max - Min must be greater than 1, as in thefollowing statement:
lbh = uicontrol(fh,'Style','listbox',...
'String',{'one','two','three','four'},...
'Max',2,'Min',0,'Value',[1 3],...
'Position',[30 20 130 80]);
If you want no initial selection:
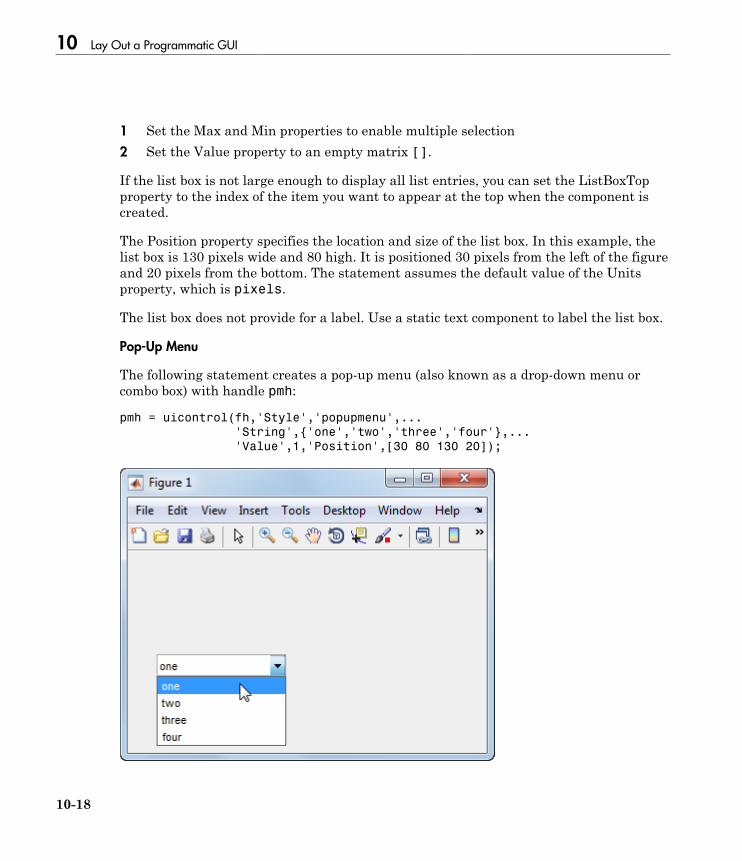
10 Lay Out a Programmatic GUI
10-18
1 Set the Max and Min properties to enable multiple selection2 Set the Value property to an empty matrix [].
If the list box is not large enough to display all list entries, you can set the ListBoxTopproperty to the index of the item you want to appear at the top when the component iscreated.
The Position property specifies the location and size of the list box. In this example, thelist box is 130 pixels wide and 80 high. It is positioned 30 pixels from the left of the figureand 20 pixels from the bottom. The statement assumes the default value of the Unitsproperty, which is pixels.
The list box does not provide for a label. Use a static text component to label the list box.
Pop-Up Menu
The following statement creates a pop-up menu (also known as a drop-down menu orcombo box) with handle pmh:
pmh = uicontrol(fh,'Style','popupmenu',...
'String',{'one','two','three','four'},...
'Value',1,'Position',[30 80 130 20]);

Add Components to a Programmatic GUI
10-19
The first argument, fh, specifies the handle of the parent figure. You can also specify theparent as a panel or button group. See “Panel” on page 10-31 and “Button Group” onpage 10-33 for more information.
The Style property, popupmenu, specifies the user interface control as a pop-up menu.
The String property defines the menu items. You can specify the items in any of theformats shown in the following table.
String Property Format Example
Cell array of strings {'one' 'two' 'three'}
Padded string matrix ['one ';'two ';'three']
String vector separated byvertical slash (|) characters
['one|two|three']
If you specify a component width that is too small to accommodate one or more of thespecified strings, MATLAB software truncates those strings with an ellipsis.
The Value property specifies the index of the item that is selected when the componentis created. Set Value to a scalar that indicates the index of the selected menu item,where 1 corresponds to the first item in the list. In the statement, if Value is 2, the menulooks like this when it is created:

10 Lay Out a Programmatic GUI
10-20
The Position property specifies the location and size of the pop-up menu. In this example,the pop-up menu is 130 pixels wide. It is positioned 30 pixels from the left of the figureand 80 pixels from the bottom. The height of a pop-up menu is determined by the fontsize; the height you set in the position vector is ignored. The statement assumes thedefault value of the Units property, which is pixels.
The pop up menu does not provide for a label. Use a static text component to label thepop-up menu.
Table
The following code creates a table with handle th. It populates it with the matrixmagic(5), and then adjusts its size by setting the width and height of its Positionproperty to that of its Extent property:
fh = figure;
th = uitable(fh,'Data',magic(5));
texn = th.Extent;
th.Position(3) = th.Extent(3);
th.Position(4) = th.Extent(4);

Add Components to a Programmatic GUI
10-21
By default, the size of a uitable is 300-by-300 pixels, and pixels is the default Unitsfor uitable Position and Extent. The table's Extent is calculated to include its scrollbars,which obscure the last row and column of data when setting the table's Position as above.
Table cells can be edited by users if the ColumnEditable property enables it. TheCellEditCallback fires whenever a table cell is edited. By default, cells are noteditable.
A uitable has no Style property, but you can change its appearance in several ways bysetting
• Foreground and background colors.• Row striping.• Row labels/numbers.• Column labels/numbers.• Column formats and widths.• Font characteristics.
Also, uitables have six callback functions that you can program.
You can set most uitable properties using the Table Property Editor that you openfrom the Property Inspector instead of using the set command. This GUI lets you setproperties for table rows, columns, colors, and data.
See uitable and Uitable Properties for complete documentation. For an example of aGUI containing a uitable, see “Synchronized Data Presentations in a Programmatic GUI”on page 14-12.
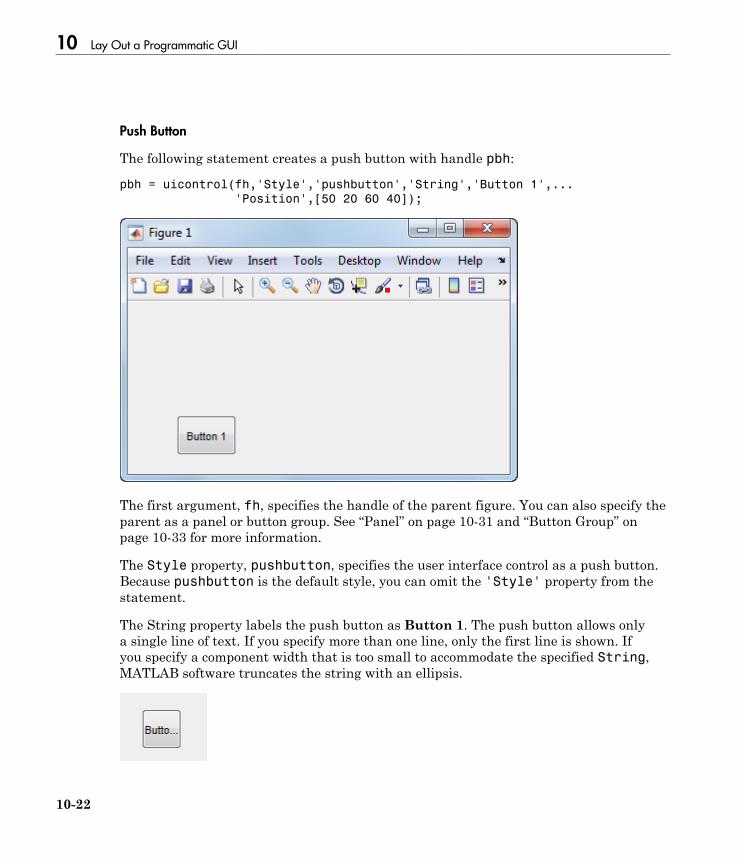
10 Lay Out a Programmatic GUI
10-22
Push Button
The following statement creates a push button with handle pbh:
pbh = uicontrol(fh,'Style','pushbutton','String','Button 1',...
'Position',[50 20 60 40]);
The first argument, fh, specifies the handle of the parent figure. You can also specify theparent as a panel or button group. See “Panel” on page 10-31 and “Button Group” onpage 10-33 for more information.
The Style property, pushbutton, specifies the user interface control as a push button.Because pushbutton is the default style, you can omit the 'Style' property from thestatement.
The String property labels the push button as Button 1. The push button allows onlya single line of text. If you specify more than one line, only the first line is shown. Ifyou specify a component width that is too small to accommodate the specified String,MATLAB software truncates the string with an ellipsis.

Add Components to a Programmatic GUI
10-23
The Position property specifies the location and size of the push button. In this example,the push button is 60 pixels wide and 40 high. It is positioned 50 pixels from the left ofthe figure and 20 pixels from the bottom. This statement assumes the default value ofthe Units property, which is pixels.
Add an Image to a Push Button
To add an image to a push button, assign the button's CData property an m-by-n-by-3array of RGB values that defines a “truecolor image”. For example, the array img defines16-by-64 truecolor image using random values between 0 and 1 (generated by rand).
img(:,:,1) = rand(16,64);
img(:,:,2) = rand(16,64);
img(:,:,3) = rand(16,64);
pbh = uicontrol(fh,'Style','pushbutton',...
'Position',[50 20 100 45],...
'CData',img);
Note See ind2rgb for information on converting a matrix X and corresponding colormap,i.e., an (X, MAP) image, to RGB (truecolor) format.
Radio Button
The following statement creates a radio button with handle rbh:
rbh = uicontrol(fh,'Style','radiobutton',...
'String','Indent nested functions.',...
'Value',1,'Position',[30 20 150 20]);

10 Lay Out a Programmatic GUI
10-24
The first argument, fh, specifies the handle of the parent figure. You can also specify theparent as a panel or button group. Use a button group to manage exclusive selection ofradio buttons and toggle buttons. See “Panel” on page 10-31 and “Button Group” onpage 10-33 for more information.
The Style property, radiobutton, specifies the user interface control as a radio button.
The String property labels the radio button as Indent nested functions. The radiobutton allows only a single line of text. If you specify more than one line, only the firstline is shown. If you specify a component width that is too small to accommodate thespecified String, MATLAB software truncates the string with an ellipsis.
The Value property specifies whether the radio button is selected when the componentis created. Set Value to the value of the Max property (default is 1) to create thecomponent with the radio button selected. Set Value to Min (default is 0) to leave theradio button unselected.
The Position property specifies the location and size of the radio button. In this example,the radio button is 150 pixels wide and 20 high. It is positioned 30 pixels from the left ofthe figure and 20 pixels from the bottom. The statement assumes the default value of theUnits property, which is pixels.
Note: You can also use an image as a label. See “Add an Image to a Push Button” on page10-23 for more information.

Add Components to a Programmatic GUI
10-25
Slider
The following statement creates a slider with handle sh:
sh = uicontrol(fh,'Style','slider',...
'Max',100,'Min',0,'Value',25,...
'SliderStep',[0.05 0.2],...
'Position',[30 20 150 30]);
• The first argument, fh, specifies the handle of the parent figure. You can also specifythe parent as a panel or button group. See “Panel” on page 10-31 and “ButtonGroup” on page 10-33 for more information.
• The Style property, slider, specifies the user interface control as a slider.• Specify the range of the slider by setting its Min property to the minimum value of
the slider and its Max property to the maximum value. The Min property must be lessthan Max.
• Specify the value indicated by the slider when it is created by setting the Valueproperty to the appropriate number. This number must be less than or equal to Maxand greater than or equal to Min. If you specify Value outside the specified range, theslider is not displayed.
• The slider Value changes by a small amount when a user clicks the arrow button,and changes by a larger amount when the user clicks the trough (also calledthe channel). Control how the slider responds to these actions by setting theSliderStep property. Specify SliderStep as a two-element vector, [minor_stepmajor_step], where minor_step is less than or equal to major_step. Because

10 Lay Out a Programmatic GUI
10-26
specifying very small values can cause unpredictable slider behavior, make bothminor_step and major_step greater than 1e-6. Set major_step to the proportionof the range that clicking the trough moves the slider thumb. Setting it to 1 or highercauses the thumb to move to Max or Min when the trough is clicked.
As major_step increases, the thumb grows longer. When major_step is 1, thethumb is half as long as the trough. When major_step is greater than 1, thethumb continues to grow, slowly approaching the full length of the trough. When aslider serves as a scroll bar, you can uses this behavior to indicate how much of thedocument is currently visible by changing the value of major_step.
• If you want to set the location or size of the component to an exact value, then modifyits Position property.
The example provides a 5 percent minor step and a 20 percent major step. The defaultmajor_step and minor_step, [0.01 0.10], provides a 1 percent minor step and a 10percent major step.
The Position property specifies the location and size of the slider. In this example, theslider is 150 pixels wide and 30 high. It is positioned 30 pixels from the left of the figureand 20 pixels from the bottom. The statement assumes the default value of the Unitsproperty, which is pixels.
Note: On Mac platforms, the height of a horizontal slider is constrained. If the height youset in the position vector exceeds this constraint, the displayed height of the slider is themaximum allowed. The height element of the position vector is not changed.
The slider component provides no text description or data entry capability. Use a “StaticText” on page 6-34 component to label the slider. Use an “Edit Text” on page 6-32component to enable a user to input a value to apply to the slider.
Static Text
The following statement creates a static text component with handle sth:

Add Components to a Programmatic GUI
10-27
sth = uicontrol(fh,'Style','text',...
'String','Select a data set.',...
'Position',[30 50 130 30]);
The first argument, fh, specifies the handle of the parent figure. You can also specify theparent as a panel or button group. See “Panel” on page 10-31 and “Button Group” onpage 10-33 for more information.
The Style property, text, specifies the user interface control as a static text component.
The String property defines the text that appears in the component. If you specifya component width that is too small to accommodate the specified String, MATLABsoftware wraps the string.
The Position property specifies the location and size of the static text component. In thisexample, the static text is 130 pixels wide and 20 high. It is positioned 30 pixels from theleft of the figure and 50 pixels from the bottom. The statement assumes the default valueof the Units property, which is pixels.
Toggle Button
The following statement creates a toggle button with handle tbh:

10 Lay Out a Programmatic GUI
10-28
tbh = uicontrol(fh,'Style','togglebutton',...
'String','Left/Right Tile',...
'Value',0,'Position',[30 20 100 30]);
The first argument, fh, specifies the handle of the parent figure. You can also specify theparent as a panel or button group. Use a button group to manage exclusive selection ofradio buttons and toggle buttons. See “Panel” on page 10-31 and “Button Group” onpage 10-33 for more information.
The Style property, togglebutton, specifies the user interface control as a togglebutton.
The String property labels the toggle button as Left/Right Tile. The toggle buttonallows only a single line of text. If you specify more than one line, only the first line isshown. If you specify a component width that is too small to accommodate the specifiedString, MATLAB software truncates the string with an ellipsis.
The Value property specifies whether the toggle button is selected when the component iscreated. Set Value to the value of the Max property (default is 1) to create the componentwith the toggle button selected (depressed). Set Value to Min (default is 0) to leave thetoggle button unselected (raised). The following figure shows the toggle button in thedepressed position.

Add Components to a Programmatic GUI
10-29
The Position property specifies the location and size of the toggle button. In this example,the toggle button is 100 pixels wide and 30 high. It is positioned 30 pixels from the left ofthe figure and 20 pixels from the bottom. The statement assumes the default value of theUnits property, which is pixels.
Note: You can also use an image as a label. See “Add an Image to a Push Button” on page10-23 for more information.
Add Panels and Button Groups
Panels and button groups are containers that arrange GUI components into groups.If you move the panel or button group, its children move with it and maintain theirpositions relative to the panel or button group.
Note See “Programmatic Components” on page 10-6 for descriptions of these components.
Use the uipanel and uibuttongroup functions to create these components.
A syntax for panels is
ph = uipanel(fh,'PropertyName',PropertyValue,...)
where ph is the handle of the resulting panel. The first argument, fh, specifies thehandle of the parent figure. You can also specify the parent as a panel or button group.See the uipanel reference page for other valid syntaxes.

10 Lay Out a Programmatic GUI
10-30
A syntax for button groups is
bgh = uibuttongroup('PropertyName',PropertyValue,...)
where bgh is the handle of the resulting button group. For button groups, you must usethe Parent property to specify the component parent. See the uibuttongroup referencepage for other valid syntaxes.
For both panels and button groups, if you do not specify a parent, the component parentis the current figure as specified by the root CurrentFigure property.
Subsequent topics describe commonly used properties of panels and button groups andoffer a simple example for each component.
• “Commonly Used Properties” on page 10-30• “Panel” on page 10-31• “Button Group” on page 10-33
Commonly Used Properties
The most commonly used properties needed to describe a panel or button group areshown in the following table:
Property Values Description
Parent Handle Handle of the component's parentfigure, panel, or button group.
Position 4-element vector: [distancefrom left, distance frombottom, width, height].Default is [0, 0, 1, 1].
Size of the component and its locationrelative to its parent.
Title String Component label. To display the& character in a label, use two &characters in the string. The wordsremove, default, and factory (casesensitive) are reserved. To use one ofthese as a label, prepend a backslash(\) to the string. For example, \removeyields remove.

Add Components to a Programmatic GUI
10-31
Property Values Description
TitlePosition lefttop, centertop,righttop, leftbottom,centerbottom,rightbottom. Default islefttop.
Location of title string in relation to thepanel or button group.
Units normalized,centimeters,characters, inches,pixels, points. Defaultis normalized.
Units of measurement used to interpretposition vector
For a complete list of properties and for more information about the properties listedin the table, see Uipanel Properties and Uibuttongroup Properties. Properties neededto control GUI behavior are discussed in “Write Callbacks Using the ProgrammaticWorkflow” on page 11-5.
Panel
The following statement creates a panel with handle ph. Use a panel to groupcomponents in the GUI.
ph = uipanel('Parent',fh,'Title','My Panel',...
'Position',[.25 .1 .5 .8]);
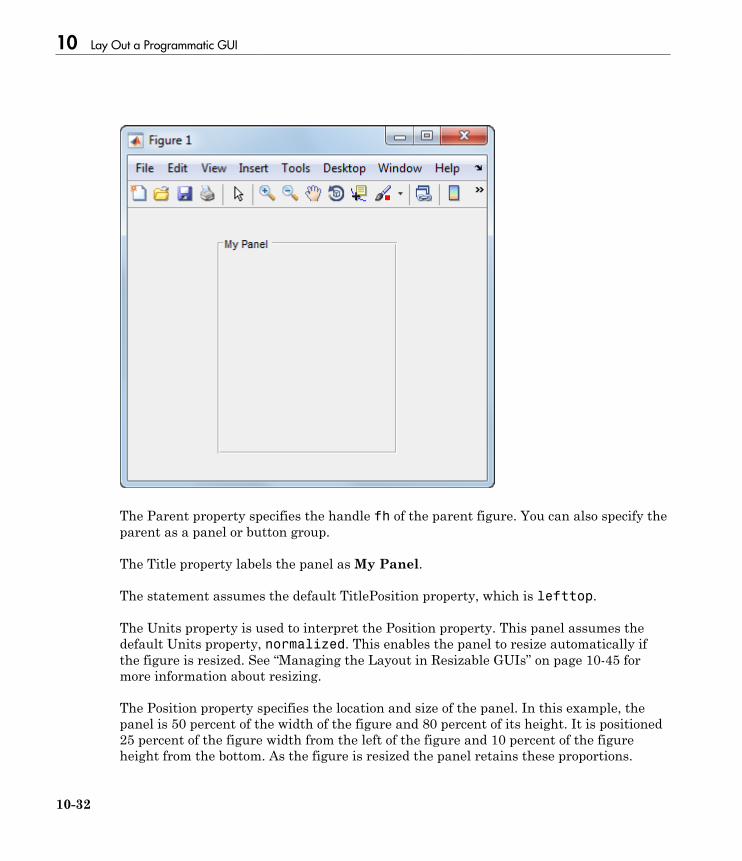
10 Lay Out a Programmatic GUI
10-32
The Parent property specifies the handle fh of the parent figure. You can also specify theparent as a panel or button group.
The Title property labels the panel as My Panel.
The statement assumes the default TitlePosition property, which is lefttop.
The Units property is used to interpret the Position property. This panel assumes thedefault Units property, normalized. This enables the panel to resize automatically ifthe figure is resized. See “Managing the Layout in Resizable GUIs” on page 10-45 formore information about resizing.
The Position property specifies the location and size of the panel. In this example, thepanel is 50 percent of the width of the figure and 80 percent of its height. It is positioned25 percent of the figure width from the left of the figure and 10 percent of the figureheight from the bottom. As the figure is resized the panel retains these proportions.

Add Components to a Programmatic GUI
10-33
The following statements add two push buttons to the panel with handle ph. The Positionproperty of each component within a panel is interpreted relative to the panel.
pbh1 = uicontrol(ph,'Style','pushbutton','String','Button 1',...
'Units','normalized',...
'Position',[.1 .55 .8 .3]);
pbh2 = uicontrol(ph,'Style','pushbutton','String','Button 2',...
'Units','normalized',...
'Position',[.1 .15 .8 .3]);
See “Push Button” on page 10-22 for more information about adding push buttons.
Button Group
The following statement creates a button group with handle bgh. Use a button group toexclusively manage radio buttons and toggle buttons.
bgh = uibuttongroup('Parent',fh,'Title','My Button Group',...

10 Lay Out a Programmatic GUI
10-34
'Position',[.1 .2 .8 .6]);
The Parent property specifies the handle fh of the parent figure. You can also specify theparent as a panel or button group.
The Title property labels the button group as My Button Group.
The statement assumes the default TitlePosition property, which is lefttop.
The Units property is used to interpret the Position property. This button group assumesthe default Units property, normalized. This enables the button group to resizeautomatically when the figure is resized.
The Position property specifies the location and size of the button group. In this example,the button group is 80 percent of the width of the figure and 60 percent of its height. Itis positioned 10 percent of the figure width from the left of the figure and 20 percent ofthe figure height from the bottom. As the figure is resized the button group retains theseproportions.
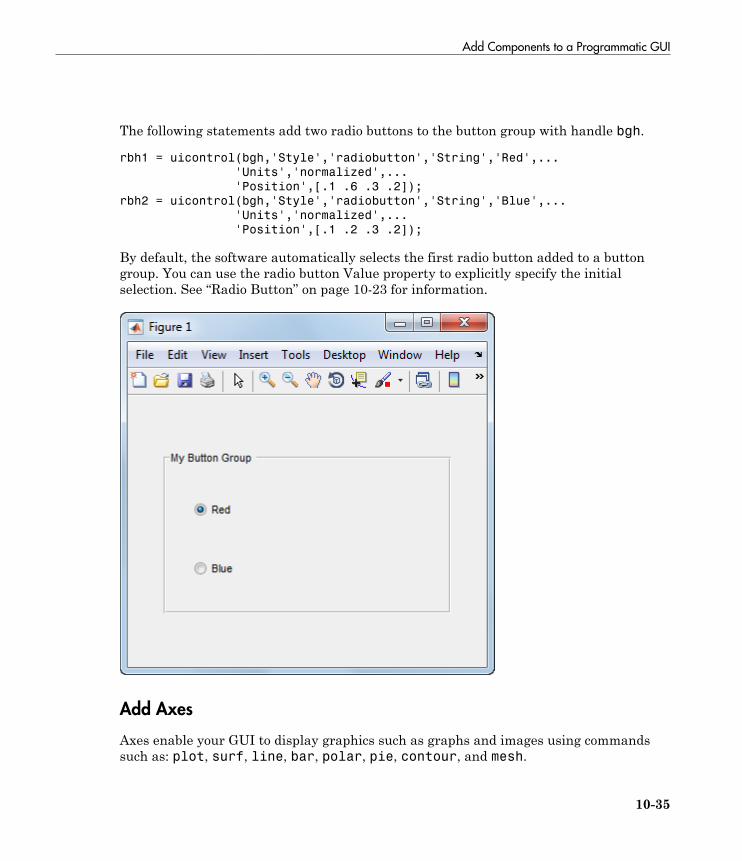
Add Components to a Programmatic GUI
10-35
The following statements add two radio buttons to the button group with handle bgh.
rbh1 = uicontrol(bgh,'Style','radiobutton','String','Red',...
'Units','normalized',...
'Position',[.1 .6 .3 .2]);
rbh2 = uicontrol(bgh,'Style','radiobutton','String','Blue',...
'Units','normalized',...
'Position',[.1 .2 .3 .2]);
By default, the software automatically selects the first radio button added to a buttongroup. You can use the radio button Value property to explicitly specify the initialselection. See “Radio Button” on page 10-23 for information.
Add Axes
Axes enable your GUI to display graphics such as graphs and images using commandssuch as: plot, surf, line, bar, polar, pie, contour, and mesh.

10 Lay Out a Programmatic GUI
10-36
Note See “Programmatic Components” on page 10-6 for a description of this component.
Use the axes function to create an axes. A syntax for this function is
ah = axes('PropertyName',PropertyValue,...)
where ah is the handle of the resulting axes. You must use the Parent property to specifythe axes parent. If you do not specify Parent, the parent is the current figure as specifiedby the root CurrentFigure property. See the axes reference page for other valid syntaxes.
Subsequent topics describe commonly used properties of axes and offer a simple example.
• “Commonly Used Properties” on page 10-36• “Axes” on page 10-37
Commonly Used Properties
The most commonly used properties needed to describe an axes are shown in thefollowing table:
Property Values Description
HandleVisibility on, callback, off. Default ison.
Determines if an object'shandle is visible in its parent'slist of children. For axes,set HandleVisibility tocallback to protect them fromcommand line operations.
NextPlot add, replace,replacechildren. Default isreplace
Specifies whether plotting addsgraphics, replaces graphics andresets axes properties to default,or replaces graphics only.
Parent Handle Handle of the component's parentfigure, panel, or button group.
Position 4-element vector: [distancefrom left, distance from bottom,width, height].
Size of the component and itslocation relative to its parent.
Units normalized, centimeters,characters, inches,
Units of measurement used tointerpret position vector

Add Components to a Programmatic GUI
10-37
Property Values Description
pixels, points. Default isnormalized.
For a complete list of properties and for more information about the properties listed inthe table, see Axes Properties.
See commands such as the following for more information on axes objects: plot, surf,line, bar, polar, pie, contour, imagesc, and mesh.
Axes
The following statement creates an axes with handle ah:
ah = axes('Parent',fh,'Position',[.15 .15 .7 .7]);
The Parent property specifies the handle fh of the parent figure. You can also specify theparent as a panel or button group.

10 Lay Out a Programmatic GUI
10-38
The Units property interprets the Position property. This axes assumes the defaultUnits property, normalized. This enables the axes to resize automatically if the figureis resized. For more information about resizing, see “Managing the Layout in ResizableGUIs” on page 10-45.
The Position property specifies the location and size of the axes. In this example, the axesis 70 percent of the width of the figure and 70 percent of its height. It is positioned 15percent of the figure width from the left of the figure and 15 percent of the figure heightfrom the bottom. As the figure is resized the axes retains these proportions.
The software automatically adds the tick marks. Most functions that draw in the axesupdate the tick marks appropriately.Prevent Customized Axes Properties from Being Reset
Data graphing functions, such as plot, image, scatter, and many others by defaultreset axes properties before they draw into an axes. This can be a problem in a GUIwhere you might need to maintain consistency of axes limits, ticks, axis colors, and fontcharacteristics from one plot to another.
The default value of the NextPlot axes property, 'replace' causes this behavior, andcan further interfere with a GUI that generates plots by removing all callbacks from theaxes whenever a graph is plotted or replotted. For a GUI, the appropriate value is often'replacechildren'. Consequently, in callbacks that generate graphics, you mightneed to include this command prior to changing the contents of an axes:
ah.NextPlot = 'replacechildren';
Executing this command prevents MATLAB from resetting the existing property valuesof an axes that the GUI might require, such as its colors, fonts, context menu or theButtonDownFcn callback.
To see this in the context of a full example, set the NextPlot property of axes1 andaxes2 to ReplaceChildrenin the “Synchronized Data Presentations in a GUIDE GUI”on page 9-30 example.
Add ActiveX Controls
ActiveX components enable you to display ActiveX controls in your GUI. They areavailable only on the Microsoft Windows platform.
An ActiveX control can be the child only of a figure; i.e., of the GUI itself. It cannot be thechild of a panel or button group.

Add Components to a Programmatic GUI
10-39
See “Creating an ActiveX Control” about adding an ActiveX control to a figure. See“Creating COM Objects” for general information about ActiveX controls.

10 Lay Out a Programmatic GUI
10-40
Layout a GUI Programmatically
You can adjust the size and location of components, and manage front-to-back orderof grouped components by setting certain property values. This topic explains howto use these properties to get the layout you want. It also explains how to use theSizeChangedFcn callback to control the GUI’s resizing behavior.
In this section...
“Component Placement and Sizing” on page 10-40“Managing the Layout in Resizable GUIs” on page 10-45“Manage the Stacking Order of Grouped Components” on page 10-48
Component Placement and Sizing
A GUI layout consists of a figure and one or more components that you place insidethe figure. Accurate placement and sizing of each component involves setting certainproperties and understanding how the inner and outer boundaries of the figure relate toeach other.
Location and Size of Outer Bounds and Drawable Area
The area inside the figure, which contains the UI components, is called the drawablearea. The drawable area is inside the outer bounds of the figure, but does not includethe menu bar or tool bar. You can control the location and size of the drawable area bysetting the figure’s Position property as a four-element row vector. The first two elementsof this vector specify the location. The last two elements specify the size. By default, thefigure’s Position values are in pixels.
This command creates a figure and sets the Position value. The left edge of the drawablearea is 258 pixels from the left side of the screen. Its bottom edge is 132 pixels up fromthe bottom of the screen. Its size is 560 pixels wide by 420 pixels high:
f = figure('Position',[258 132 560 420]);

Layout a GUI Programmatically
10-41
You can query or change the outer bounds of the figure by using the OuterPositionproperty. Like the Position property, the OuterPosition is a four element row vector:
f.OuterPosition
ans =
250 124 576 512
The left outer edge of this figure is 250 pixels from the left side of the screen. Its bottomouter edge is 124 pixels up from the bottom of the screen. The area enclosed by the outerbounds of the figure is 576 pixels wide by 512 pixels high.

10 Lay Out a Programmatic GUI
10-42
Explicitly changing the Position or OuterPosition causes the other property to change.For example, this is the current Position value of f:
f.Position
ans =
258 132 560 420
Changing the OuterPosition causes the Position to change:
f.OuterPosition = [250 250 490 340];
f.Position
ans =

Layout a GUI Programmatically
10-43
258 258 474 248
Other UI components, such as uicontrols, uitables, and uipanels have a Positionproperty, which you can use to set their location and size.
Units of Measure
The default units associated with the Position property depend on the component you areplacing. However, you can change the Units property to lay out your GUI in the units ofyour choice. There are six different units of measure to choose from: inches, centimeters,normalized, points, pixels, and characters.
Always specify Units before Position for the most predictable results.
f = figure('Units','inches','Position',[4 3 6 5]);
Your choice of units can affect the appearance and resizing behavior of the GUI:
• If you want the components inside the figure to scale proportionally with the figurewhen the user resizes the window, set the Units property of the components inside thefigure to 'normalized'.
• If you are developing a cross-platform GUI, then you can set the Units property to'points' or 'characters' to make the layout consistent across all platforms.
• There might be other situations in which you want to lay out your GUI usingnondefault units. For example, you might need to specify height and width values ininches in order to conform to a specification.
• When the value of the Units property is 'inches', 'centimeters', 'points','pixels', or 'characters', the component does not scale with the figure whenthe user resizes the GUI. To enable automatic scaling, set the Units property to'normalized' after the code that specifies the Position in the other units.
Example of a Simple Layout
Here is the code for a simple GUI containing an axes and a button. To see how it works,copy and paste this code into the editor and run it.
function mygui
% Add the GUI components
hs = addcomponents;

10 Lay Out a Programmatic GUI
10-44
% Make figure visible after adding components
hs.fig.Visible = 'on';
function hs = addcomponents
% add components, save handles in a struct
hs.fig = figure('Visible','off',...
'Resize','off',...
'Tag','fig');
hs.btn = uicontrol(hs.fig,'Position',[10 340 70 30],...
'String','Plot Sine',...
'Tag','button',...
'Callback',@plotsine);
hs.ax = axes('Parent',hs.fig,...
'Position',[0.20 0.13 0.71 0.75],...
'Tag','ax');
end
function plotsine(hObject,callbackdata)
theta = 0:pi/64:6*pi;
y = sin(theta);
plot(hs.ax,theta,y);
end
end
This code performs the following tasks:
• The main function, mygui, calls the addcomponents function. The addcomponentsfunction returns a structure, hs, containing the handles to all the GUI components.
• The addcomponents function creates a figure, an axes, and a button, each withspecific Position values.
• Notice that the Resize property of the figure is 'off'. This value disables theresizing capability of the figure.
• Notice that the Visible property of the figure is 'off' inside the addcomponentsfunction. The value changes to 'on' after addcomponents returns to the callingfunction. Doing this delays the figure display until after MATLAB adds all thecomponents. Thus, the resulting GUI has a clean appearance when it starts up.
• The plotsine function plots the sine function inside the axes when the user clicksthe button.

Layout a GUI Programmatically
10-45
Managing the Layout in Resizable GUIs
To create a resizable GUI and manage the layout when the user resizes the window, setthe figure’s SizeChangedFcn property to be a handle to a callback function. Code thecallback function to manage the layout when the window size changes.

10 Lay Out a Programmatic GUI
10-46
If your GUI has another container, such as a uipanel or uibuttongroup, you can managethe layout of the container’s child components in a separate callback function that youassign to the SizeChangedFcn property.
The SizeChangedFcn callback executes only under these circumstances:
• The container becomes visible for the first time.• The container is visible while its drawable area changes.• The container becomes visible for the first time after its drawable area changes. This
situation occurs when the drawable area changes while the container is invisible andbecomes visible later.
Note: Typically, the drawable area changes at the same time the outer bounds change.However, adding or removing menu bars or tool bars to a figure causes the outer boundsto change while the drawable area remains constant. Therefore, the SizeChangedFcncallback does not execute when you add or remove menu bars or tool bars.
This GUI is a resizable version of the simple GUI defined in “Example of a SimpleLayout” on page 10-43. This code includes a figure SizeChangedFcn callback calledresizegui. The resizegui function calculates new Position values for the button andaxes when the user resizes the window. The button appears to be stationary when theuser resizes the window. The axes scales with the figure.
function mygui
% Add the GUI components
hs = addcomponents;
% Make figure visible after adding components
hs.fig.Visible = 'on';
function hs = addcomponents
% Add components, save handles in a struct
hs.fig = figure('Visible','off',...
'Tag','fig',...
'SizeChangedFcn',@resizegui);
hs.btn = uicontrol(hs.fig,'String',...
'Plot Sine',...
'Callback',@plotsine,...
'Tag','button');
hs.ax = axes('Parent',hs.fig,...

Layout a GUI Programmatically
10-47
'Units','pixels',...
'Tag','ax');
end
function plotsine(hObject,callbackdata)
theta = 0:pi/64:6*pi;
y = sin(theta);
plot(hs.ax,theta,y);
end
function resizegui(hObject,callbackdata)
% Get figure width and height
figwidth = hs.fig.Position(3);
figheight = hs.fig.Position(4);
% Set button position
bheight = 30;
bwidth = 70;
bbottomedge = figheight - bheight - 50;
bleftedge = 10;
hs.btn.Position = [bleftedge bbottomedge bwidth bheight];
% Set axes position
axheight = .75*figheight;
axbottomedge = max(0,figheight - axheight - 30);
axleftedge = bleftedge + bwidth + 30;
axwidth = max(0,figwidth - axleftedge - 50);
hs.ax.Position = [axleftedge axbottomedge axwidth axheight];
end
end
The resizegui function sets the location and size of the button and axes whenever theuser resizes the window:
• The button height, width, and left edge stay the same when the window resizes.• The bottom edge of the button, bbottomedge, allows 50 pixels of space between the
top of the figure and the top of the button.• The value of the axes height, axheight, is 75% of the available height in the figure.• The value of the axes bottom edge, axbottomedge, allows 30 pixels of space between
the top of the figure and the top of the axes. In this calculation, the max functionlimits this value to nonnegative values.

10 Lay Out a Programmatic GUI
10-48
• The value of the axes width, axwidth, allows 50 pixels of space between the right sideof the axes and the right edge of the figure. In this calculation, the max function limitsthis value to nonnegative values.
Notice that all the layout code is inside the resizegui function. It is a good practice toput all the layout code inside the SizeChangedFcn callback to ensure the most accurateresults.
Also, it is important to delay the display of the entire GUI window until after all thevariables that a SizeChangedFcn callback uses are defined. Doing so can prevent theSizeChangedFcn callback from returning an error. To delay the display of the window,set the Visible property of the figure to 'off'. After you define all the variables thatyour SizeChangedFcn callback uses, set the Visible property to 'on'.
Manage the Stacking Order of Grouped Components
If your GUI has components grouped inside of uipanels, uibuttongroups or uitabs, thenyou might need to manage their front-to-back order, or stacking order, to make the GUIlook the way you want. The default stacking order of components is as follows:
• Axes and other Graphics objects appear at the bottom.• Other UI components appear in the order in which you create them. They can stack in
any order.
Use the Parent property to control the front-to-back order (stacking order) of groupedcomponents. To move a component on top of another component, set its Parent propertyto the object you want to appear beneath it.
The Children property of a uipanel, uibuttongroup, or uitab lists the child objects insidethe container according to their stacking order.

Adjust Programmatic GUI Layouts Interactively
10-49
Adjust Programmatic GUI Layouts Interactively
In this section...
“Set Positions of Components Interactively” on page 10-50“Align Components” on page 10-60“Set Colors Interactively” on page 10-67“Set Font Characteristics Interactively” on page 10-68
Laying out a programmatic GUI can take time and involves many small steps. Forexample, you must position components manually—often several times—to place themexactly where you want them to be. Establishing final settings for other propertiesand coding statements for them also takes time. You can reduce the effort involved bytaking advantage of built-in MATLAB tools and GUIs to establish values for componentproperties. The following sections describe some of the tools.
Mode or Tool Use it to Commands
Plot edit mode Interactively edit and annotateplots
plotedit
Property Editor Edit graphical properties ofobjects
propedit, propertyeditor
PropertyInspector
Interactively display and editmost object properties
inspect
Align DistributeTool
Align and distribute componentswith respect to one another
align
Color Selector Choose a color from a palette ofcolors and obtain its value
uisetcolor
Font Selector Preview character font, style, andsize and choose values for them
uisetfont
Some of these tools return property values, while others let you edit propertiesinteractively without returning their values. In particular, the Property Inspector letsyou interactively set almost any object property. You then can copy property values andpaste them into the Command Window or a code file. However, when you capture vector-valued properties, such as Color or Position, the Inspector only lets you copy values onenumber at a time.
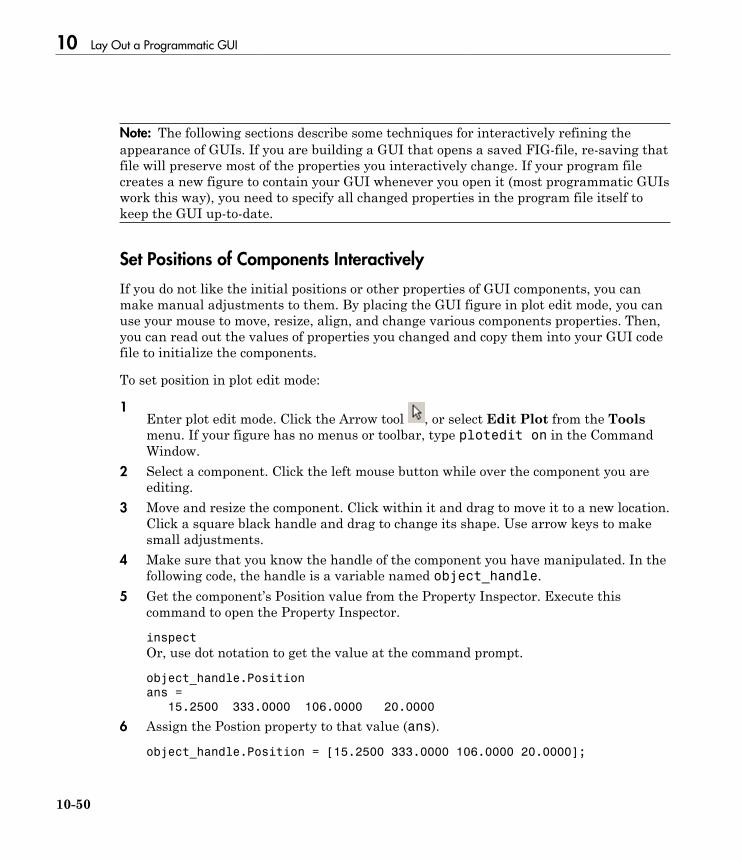
10 Lay Out a Programmatic GUI
10-50
Note: The following sections describe some techniques for interactively refining theappearance of GUIs. If you are building a GUI that opens a saved FIG-file, re-saving thatfile will preserve most of the properties you interactively change. If your program filecreates a new figure to contain your GUI whenever you open it (most programmatic GUIswork this way), you need to specify all changed properties in the program file itself tokeep the GUI up-to-date.
Set Positions of Components Interactively
If you do not like the initial positions or other properties of GUI components, you canmake manual adjustments to them. By placing the GUI figure in plot edit mode, you canuse your mouse to move, resize, align, and change various components properties. Then,you can read out the values of properties you changed and copy them into your GUI codefile to initialize the components.
To set position in plot edit mode:
1Enter plot edit mode. Click the Arrow tool , or select Edit Plot from the Toolsmenu. If your figure has no menus or toolbar, type plotedit on in the CommandWindow.
2 Select a component. Click the left mouse button while over the component you areediting.
3 Move and resize the component. Click within it and drag to move it to a new location.Click a square black handle and drag to change its shape. Use arrow keys to makesmall adjustments.
4 Make sure that you know the handle of the component you have manipulated. In thefollowing code, the handle is a variable named object_handle.
5 Get the component’s Position value from the Property Inspector. Execute thiscommand to open the Property Inspector.
inspect
Or, use dot notation to get the value at the command prompt.
object_handle.Position
ans =
15.2500 333.0000 106.0000 20.0000
6 Assign the Postion property to that value (ans).
object_handle.Position = [15.2500 333.0000 106.0000 20.0000];

Adjust Programmatic GUI Layouts Interactively
10-51
Tip Instead of using a separate set command, after you decide upon a position for theobject, you can modify the statement in your code file that creates the object to includethe Position parameter and value.
To position components systematically, you can create a function to manage the process.Here is a simple example function called editpos:
function rect = editpos(handle)
% Enters plot edit mode, pauses to let user manipulate objects,
% then turns the mode off. It does not track what user does.
% User later needs to output a Position property, if changed.
if ~ishghandle(handle)
disp(['=E= gbt_moveobj: Invalid handle: ' inputname(1)])
return
end
plotedit(handle,'on')
disp('=== Select, move and resize object. Use mouse and arrow keys.')
disp('=== When you are finished, press Return to continue.')
pause
rect = handle.Position;
inspect(handle)
To experiment with the function, enter the following code in the Command Window:
hfig = figure;
hsl = uicontrol('Style','slider')
editpos(hsl)
After you call editpos, the following prompt appears:
=== Select, move and resize the object. Use mouse and arrow keys.
=== When you are finished, press Return to continue.
When you first enter plot edit mode, the selection is figure itself. Click the slider to selectit and reposition it. For example, move it to the right side of the figure and orient itvertically, as shown in the following figure.

10 Lay Out a Programmatic GUI
10-52
Use Plot Edit Mode to Change Properties
After you select an object in plot edit mode, you can open the Property Inspector to viewand modify any of its properties. While the object is selected, in the Command Windowtype:
inspect
You also can use the functional form to pass in the handle of the object you want toinspect, for example:
inspect(hsl)
The Property Inspector opens, displaying the object properties. You can edit as well asread property values, and the component updates immediately. To see a definition of anyproperty, right-click the name or value in the Property Inspector and click the What'sThis? menu item that appears. A context-sensitive help window opens displaying thedefinition of the property.

Adjust Programmatic GUI Layouts Interactively
10-53
Scroll in the help window to view descriptions of other properties.

10 Lay Out a Programmatic GUI
10-54
The following Inspector image illustrates using the Inspector to change the Max propertyof a slider uicontrol from its default value (1.0) to 10.0.
Edit with the Property Editor
The Property Editor has a more graphical interface than the Property Inspector. Theinterface is convenient for setting properties that affect the appearance of components.To open it for a component, in the Command Window type:
propedit(object_handle)
Alternatively, omit the argument and type:
plotedit on
The figure enters plot edit mode. Select the object you want to edit and changeany property that the Property Editor displays. The following figure shows theBackgroundColor and String properties of a list box altered using the Property Editor.
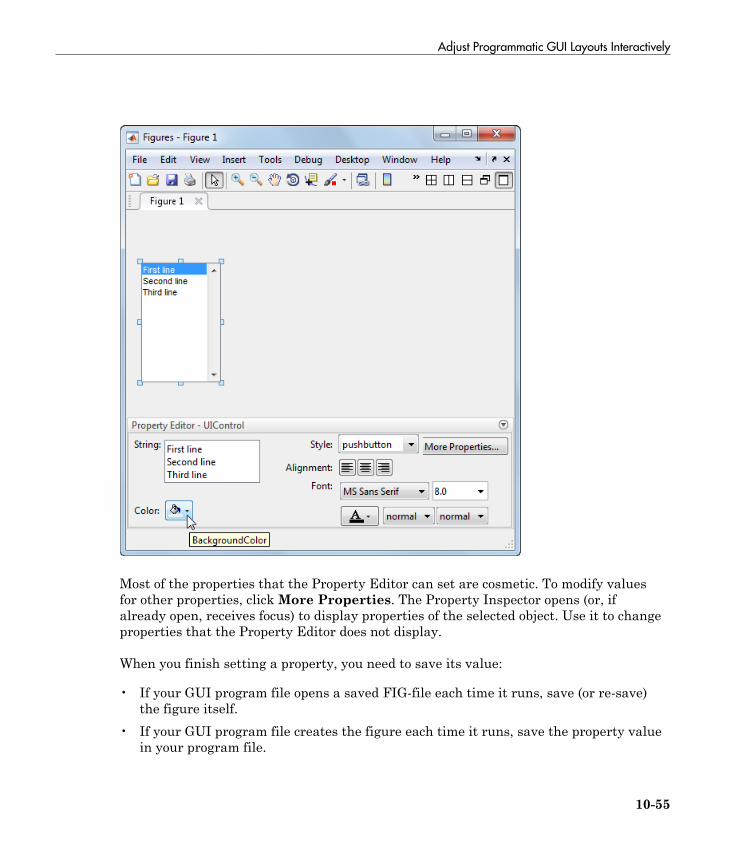
Adjust Programmatic GUI Layouts Interactively
10-55
Most of the properties that the Property Editor can set are cosmetic. To modify valuesfor other properties, click More Properties. The Property Inspector opens (or, ifalready open, receives focus) to display properties of the selected object. Use it to changeproperties that the Property Editor does not display.
When you finish setting a property, you need to save its value:
• If your GUI program file opens a saved FIG-file each time it runs, save (or re-save)the figure itself.
• If your GUI program file creates the figure each time it runs, save the property valuein your program file.
10 Lay Out a Programmatic GUI
10-56
You can obtain the new property value using dot notation and the property name. Forexample, this command gets the BackgroundColor property value of object_handleand stores it in the variable, bc.
bc = object_handle.BackgroundColor;
Sketch a Position Vector
rbbox is a useful function for setting positions. When you call it, you drag out a rubberband box anywhere in the figure. You receive a position vector for that box when yourelease the mouse button. Be aware that when rbbox executes,
• A figure window must have focus.• The mouse cursor must be within the figure window.• Your left mouse button must down.
Because of this behavior, you must call rbbox from a function or a script that waits foryou to press the mouse button. The returned position vector specifies the rectangle youdraw in figure units. The following function, called setpos, calls rbbox to specify aposition for a component. It returns the position vector you drag out and also places it onthe system clipboard:
function rect = setpos(object_handle)
% Use RBBOX to establish a position for a GUI component.
% object_handle is a handle to a uicomponent that uses
% any Units. Internally, figure Units are used.
disp(['=== Drag out a Position for object ' inputname(1)])
waitforbuttonpress % So that rbbox does not return immediately
rect = rbbox; % User drags out a rectangle, releases button
% Pressing a key aborts rbbox, so check for null width & height
if rect(3) ~= 0 && rect(4) ~= 0
% Save and restore original units for object
myunits = object_handle.Units;
object_handle.Units = get(gcf,'Units');
object_handle.Position = rect;
object_handle.Units = myunits;
else
rect = [];
end
clipboard('copy', rect) % Place set string on system
% clipboard as well as returning it
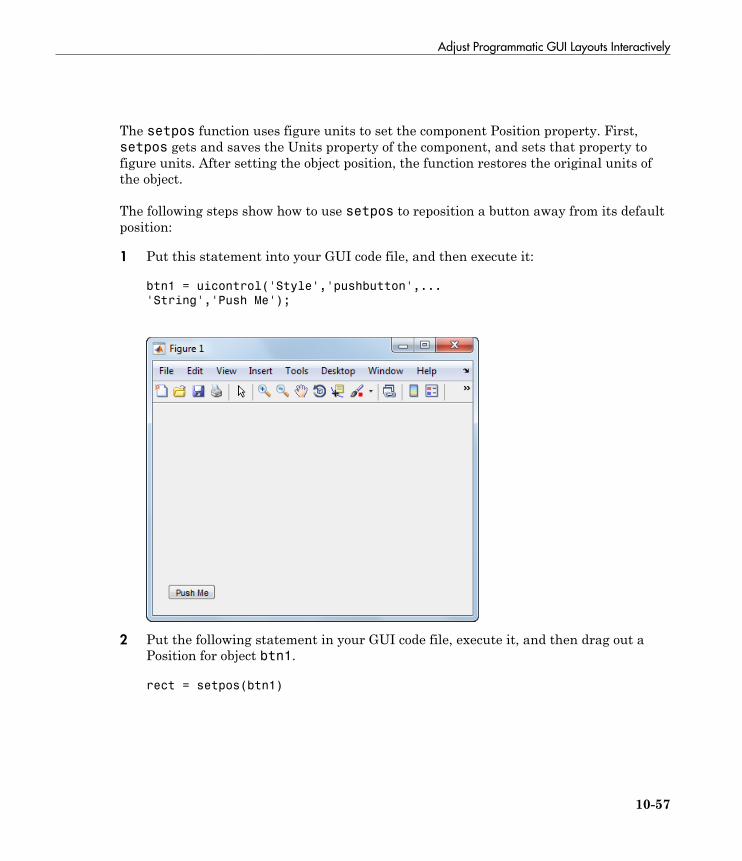
Adjust Programmatic GUI Layouts Interactively
10-57
The setpos function uses figure units to set the component Position property. First,setpos gets and saves the Units property of the component, and sets that property tofigure units. After setting the object position, the function restores the original units ofthe object.
The following steps show how to use setpos to reposition a button away from its defaultposition:
1 Put this statement into your GUI code file, and then execute it:
btn1 = uicontrol('Style','pushbutton',...
'String','Push Me');
2 Put the following statement in your GUI code file, execute it, and then drag out aPosition for object btn1.
rect = setpos(btn1)

10 Lay Out a Programmatic GUI
10-58
3 Release the mouse button. The control moves.

Adjust Programmatic GUI Layouts Interactively
10-59
4 The button Position is set, returned and placed on the system clipboard:
rect =
37 362 127 27
Add a Position parameter and empty value to the uicontrol command from step 1in your GUI code file, as follows:
btn1 = uicontrol('Style','pushbutton',...
'String','Push Me','Position',[])
With the cursor inside the brackets [], type Ctrl+V to paste the setpos output asthe Position parameter value:
btn1 = uicontrol('Style','pushbutton',...
'String','Push Me','Position',[37 362 127 27])
You cannot call setpos when you are creating a component because setpos requires thehandle of the component as an argument. However, you can create a small function thatlets you position a component interactively as you create it. The function waits for youto press the mouse button, then calls rbbox, and returns a position rectangle when yourelease the mouse button:
function rect = getrect
disp('=== Click and drag out a Position rectangle.')
waitforbuttonpress % So that rbbox does not return immediately
rect = rbbox; % User drags out a rectangle, releases button
clipboard('copy', rect) % Place set string on system
% clipboard as well as returning it
To use getrect:
1 In the editor, place the following statement in your GUI code file to generate a pushbutton. Specify getrect within it as the value for the Position property:
btn1 = uicontrol('Style','pushbutton','String','Push Me',...
'Position',getrect);
2 Select the entire statement in the editor and execute it with the F9 key or by right-clicking and selecting Evaluate Selection.
3 In the figure window, drag out a rectangle for the control to occupy. When youhave finished dragging, the new component displays in that rectangle. (If you typea character while you are dragging, rbbox aborts, you receive an error, and nouicontrol is created.)
4 In the editor, select getrect in the uicontrol statement, and type [] in place of it.The statement now looks like this:

10 Lay Out a Programmatic GUI
10-60
btn1 = uicontrol('Style','pushbutton','String','Push Me',...
'Position',[]);
5 Place your cursor between the empty brackets and type Ctrl+V, or right-click andselect Paste. Allowing for differences in coordinate values, the statement looks likethis one:
btn1 = uicontrol('Style','pushbutton','String','Push Me',...
'Position',[55 253 65 25]);
Remember that rbbox returns coordinates in figure units ('pixels', in this example).If the default Units value of a component is not the same as the figure, specify it to bethe same when you make the component. For example, the default Units of a uipanel is'normalized'. To sketch a uipanel position, use code that uses figure Units, as in thefollowing example:
pnl1 = uipanel('Title','Inputs',...
'Units',get(gcf,'Units'),...
'Position',getrect)
Two MATLAB utilities for composing GUIs can assist you in specifying positions. Usegetpixelposition to obtain a position vector for a component in units of pixelsregardless of its Units setting. The position origin is with respect to the parent of thecomponent or the enclosing figure. Use setpixelposition to specify a new componentposition in pixels. The Units property of the component remains unchanged after callingeither of these functions.
Align Components
• “Use the align Function” on page 10-60• “Use Align Distribute Tools” on page 10-64
After you position components, they still might not line up perfectly. To make finaladjustments, use the align function from the Command Window. As an interactivealternative, use the Align Distribute tool, a GUI available from the figure menu. Thefollowing sections describe both approaches.
Use the align Function
Use the align function to align user interface controls and axes. This function enablesyou to line up the components vertically and horizontally. You can also distribute thecomponents evenly across their span or specify a fixed distance between them.

Adjust Programmatic GUI Layouts Interactively
10-61
A syntax for the align function is
align(HandleList,'HorizontalAlignment','VerticalAlignment')
The following table lists the possible values for these parameters.
HorizontalAlignment VerticalAlignment
None, Left, Center, Right, Distribute,or Fixed
None, Top, Middle, Bottom, Distribute,or Fixed
All handles in HandleList must have the same parent. See the align reference pagefor information about other syntaxes.
The align function positions components with respect to their bounding box, shown as ablue dashed line in the following figures. For demonstration purposes, create three pushbuttons in arbitrary places using the following code.
fh = figure('Position',[400 300 300 150])
b1 = uicontrol(fh,'Position',[30 10 60 30],'String','B1');
b2 = uicontrol(fh,'Position',[50 50 60 30],'String','B2');
b3 = uicontrol(fh,'Position',[10 80 60 30],'String','B3');
Note: Each of the three following align examples starts with these unaligned pushbuttons and repositions them in different ways. In practice, when you create buttons with

10 Lay Out a Programmatic GUI
10-62
uicontrol and do not specify a Position, their location is always [20 20 60 20] (inpixels). That is, if you keep creating them with default positions, they lie on top of oneanother.
Align Components Horizontally
The following statement moves the push buttons horizontally to the right of theirbounding box. It does not alter their vertical positions. The figure shows the originalbounding box.
align([b1 b2 b3],'Right','None');
Align Components Horizontally While Distributing Them Vertically
The following statement moves the push buttons horizontally to the center of theirbounding box and adjusts their vertical placement. The 'Fixed' option makes thedistance between the boxes uniform. Specify the distance in points (1 point = 1/72 inch).In this example, the distance is seven points. The push buttons appear in the center ofthe original bounding box. The bottom push button remains at the bottom of the originalbounding box.
align([b1 b2 b3],'Center','Fixed',7);

Adjust Programmatic GUI Layouts Interactively
10-63
Align Components Vertically While Distributing Them Horizontally
The following statement moves the push buttons to the bottom of their bounding box. Italso adjusts their horizontal placement to create a fixed distance of five points betweenthe boxes. The push buttons appear at the bottom of the original bounding box.
align([b1 b2 b3],'Fixed',5,'Bottom');
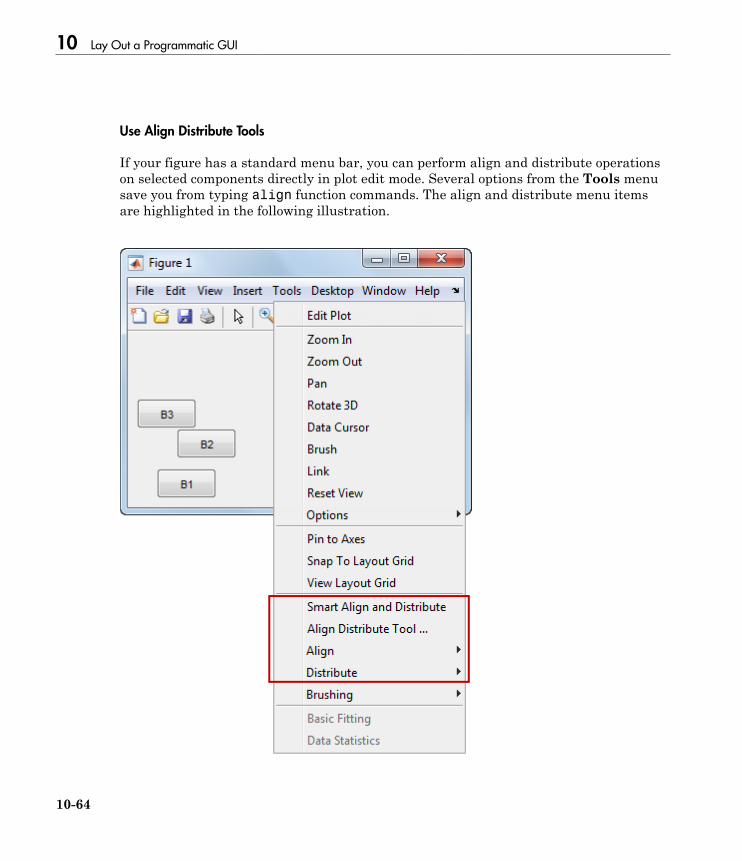
10 Lay Out a Programmatic GUI
10-64
Use Align Distribute Tools
If your figure has a standard menu bar, you can perform align and distribute operationson selected components directly in plot edit mode. Several options from the Tools menusave you from typing align function commands. The align and distribute menu itemsare highlighted in the following illustration.

Adjust Programmatic GUI Layouts Interactively
10-65
The following steps illustrate how to use the “Align Distribute tool” to arrangecomponents in a GUI. The tool provides the same options as the align function.discussed in “Use the align Function” on page 10-60.
1 Select Tools > Edit Plot.2 Select the components that you want to align.3 Select Tools > Align Distribute Tool.4 In the Vertical panel, choose the third Distribute option (the same as the align
function Middle VerticalAlignment option). In the Horizontal panel, choose thefirst Align option (the same as the align function Left HorizontalAlignmentoption)
5 Click Apply.
The buttons align as shown.

10 Lay Out a Programmatic GUI
10-66
Note: One thing to remember when aligning components is that the align functionuses units of points while the Align Distribute GUI uses units of pixels. Neither methodchanges the Units property of the components you align, however.
You can also select the Align or Distribute option from the figure Tools menu toperform either operation immediately. For example, here are the six options availablefrom the Align menu item.
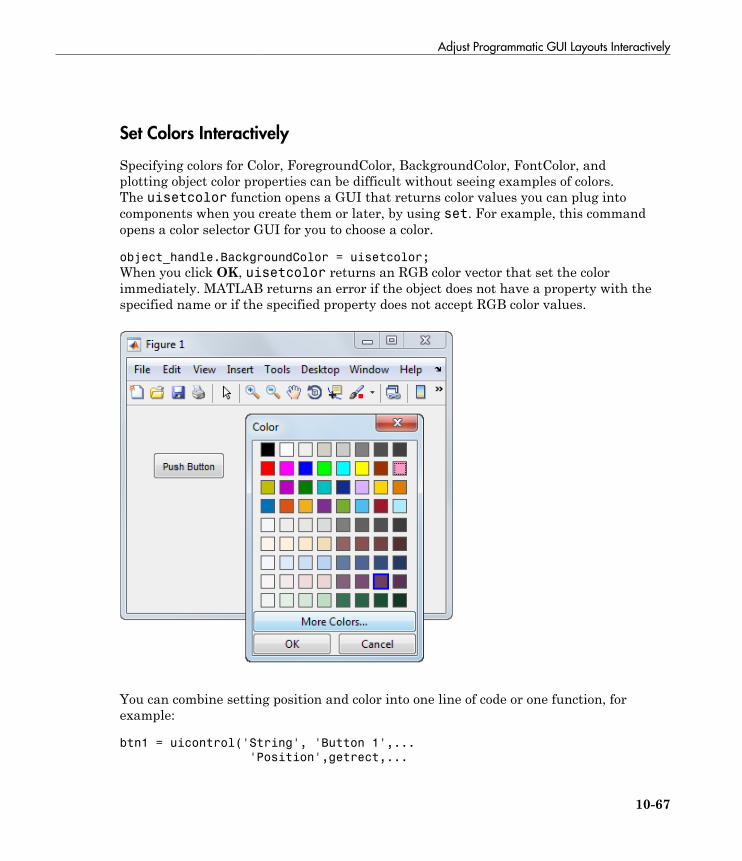
Adjust Programmatic GUI Layouts Interactively
10-67
Set Colors Interactively
Specifying colors for Color, ForegroundColor, BackgroundColor, FontColor, andplotting object color properties can be difficult without seeing examples of colors.The uisetcolor function opens a GUI that returns color values you can plug intocomponents when you create them or later, by using set. For example, this commandopens a color selector GUI for you to choose a color.
object_handle.BackgroundColor = uisetcolor;
When you click OK, uisetcolor returns an RGB color vector that set the colorimmediately. MATLAB returns an error if the object does not have a property with thespecified name or if the specified property does not accept RGB color values.
You can combine setting position and color into one line of code or one function, forexample:
btn1 = uicontrol('String', 'Button 1',...
'Position',getrect,...
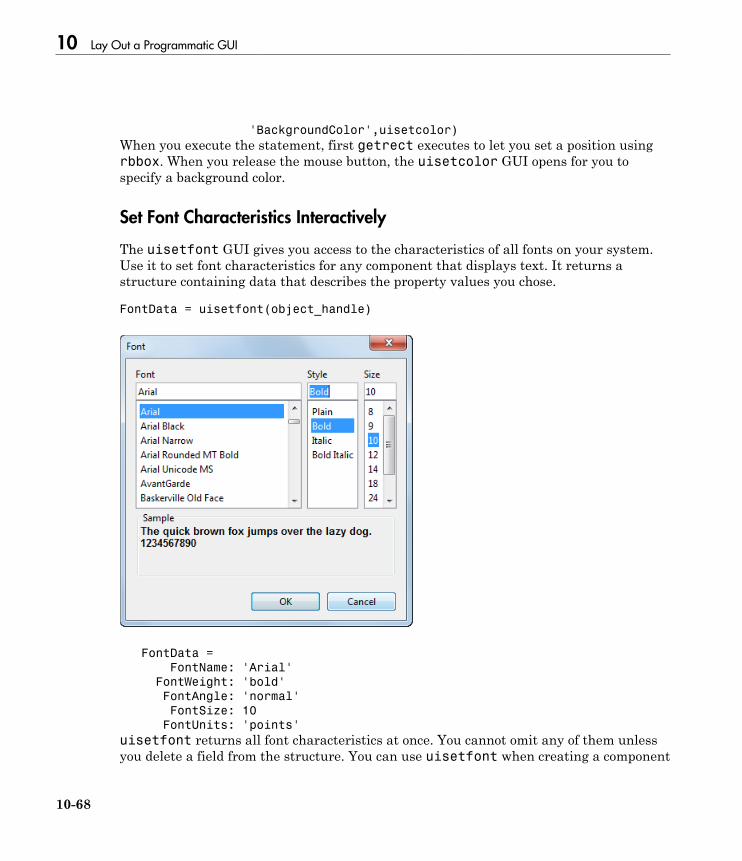
10 Lay Out a Programmatic GUI
10-68
'BackgroundColor',uisetcolor)
When you execute the statement, first getrect executes to let you set a position usingrbbox. When you release the mouse button, the uisetcolor GUI opens for you tospecify a background color.
Set Font Characteristics Interactively
The uisetfont GUI gives you access to the characteristics of all fonts on your system.Use it to set font characteristics for any component that displays text. It returns astructure containing data that describes the property values you chose.
FontData = uisetfont(object_handle)
FontData =
FontName: 'Arial'
FontWeight: 'bold'
FontAngle: 'normal'
FontSize: 10
FontUnits: 'points'
uisetfont returns all font characteristics at once. You cannot omit any of them unlessyou delete a field from the structure. You can use uisetfont when creating a component

Adjust Programmatic GUI Layouts Interactively
10-69
that has a String property. You can also specify the string itself at the same time bycalling inputdlg, which is a predefined GUI for entering text strings. Here is anexample that creates static text and sets the font properties.
f = figure('Position',[300 300 385 285]);
txt1 = uicontrol(f,...
'Style','text',...
'String',inputdlg('String','Static Text'),...
uisetfont,'Position',[50 200 150 40]);
The inputdlg dialog box appears first.
After you enter a string and click OK, the uisetfont dialog box opens for you to set fontcharacteristics for displaying the string.

10 Lay Out a Programmatic GUI
10-70
When you specify a font, style, and size and click OK, the text appears in the figurewindow.
Customize Tabbing Behavior in a Programmatic GUI
10-71
Customize Tabbing Behavior in a Programmatic GUI
In this section...
“How Tabbing Works” on page 10-71“Default Tab Order” on page 10-71“Change the Tab Order in the uipanel” on page 10-73
How Tabbing Works
A GUI's tab order is the order in which components of the GUI acquire focus when a userpresses the keyboard Tab key. Focus is generally denoted by a border or a dotted border.
Tab order is determined separately for the children of each parent. For example, childcomponents of the GUI figure have their own tab order. Child components of each panelor button group also have their own tab order.
If, in tabbing through the components at one level, a user tabs to a panel or button group,then the tabbing sequences through the components of the panel or button group beforereturning to the level from which the panel or button group was reached. For example, ifa GUI figure contains a panel that contains three push buttons and the user tabs to thepanel, then the tabbing sequences through the three push buttons before returning to thefigure.
Note You cannot tab to axes and static text components. You cannot determineprogrammatically which component has focus.
Default Tab Order
The default tab order for each level is the order in which you create the components atthat level.
The following code creates a GUI that contains a pop-up menu with a static text label, apanel with three push buttons, and an axes.
fh = figure('Position',[200 200 450 270]);
pmh = uicontrol(fh,'Style','popupmenu',...
'String',{'peaks','membrane','sinc'},...

10 Lay Out a Programmatic GUI
10-72
'Position',[290 200 130 20]);
sth = uicontrol(fh,'Style','text','String','Select Data',...
'Position',[290 230 60 20]);
ph = uipanel('Parent',fh,'Units','pixels',...
'Position',[290 30 130 150]);
ah = axes('Parent',fh,'Units','pixels',...
'Position',[40 30 220 220]);
bh1 = uicontrol(ph,'Style','pushbutton',...
'String','Contour','Position',[20 20 80 30]);
bh2 = uicontrol(ph,'Style','pushbutton',...
'String','Mesh','Position',[20 60 80 30]);
bh3 = uicontrol(ph,'Style','pushbutton',...
'String','Surf','Position',[20 100 80 30]);
You can obtain the default tab order for a figure, panel, or button group by looking at itsChildren property. For the example, this command gets the children of the uipanel, ph.
ch = ph.Children
ch =

Customize Tabbing Behavior in a Programmatic GUI
10-73
3x1 UIControl array:
UIControl (Surf)
UIControl (Mesh)
UIControl (Contour)
The default tab order is the reverse of the child order: Contour, then Mesh, then Surf.
Note Displaying the children in this way shows only those children that have theirHandleVisibility property set to 'on'. Use allchild to retrieve children regardless oftheir handle visibility.
In this example, the default order is pop-up menu followed by the panel's Contour,Mesh, and Surf push buttons (in that order), and then back to the pop-up menu. Youcannot tab to the axes component or the static text component.
Try modifying the code to create the pop-up menu following the creation of the Contourpush button and before the Mesh push button. Now execute the code to create the GUIand tab through the components. This code change does not alter the default tab order.This is because the pop-up menu does not have the same parent as the push buttons. Thefigure is the parent of the panel and the pop-up menu.
Change the Tab Order in the uipanel
Get the Children property of the uipanel, and then modify the order of the arrayelements. This code gets the children of the uipanel and stores it in the variable, ch.
ch = ph.Children
ch =
3x1 UIControl array:
UIControl (Surf)
UIControl (Mesh)
UIControl (Contour)
Next, call the uistack function to change the tab order of buttons. This code moves theMesh button up one level, making it the last item in the tab order.
uistack(ch(2),'up',1);

10 Lay Out a Programmatic GUI
10-74
The tab order of the three buttons is now Contour, then Surf, then Mesh.
This command shows the new child order.
ph.Children
ans =
3x1 UIControl array:
UIControl (Mesh)
UIControl (Surf)
UIControl (Contour)
Note Tab order also affects the stacking order of components. If components overlap,those that appear higher in the child order, display on top of those that appear lower inthe order.

Create Menus for Programmatic GUIs
10-75
Create Menus for Programmatic GUIs
In this section...
“Add Menu Bar Menus” on page 10-75“Add Context Menus to a Programmatic GUI” on page 10-82
Add Menu Bar Menus
Use the uimenu function to add a menu bar menu to your GUI. A syntax for uimenu is
mh = uimenu(parent,'PropertyName',PropertyValue,...)
Where mh is the handle of the resulting menu or menu item. See the uimenu referencepage for other valid syntaxes.
These topics discuss use of the MATLAB standard menu bar menus and describecommonly used menu properties and offer some simple examples.
• “Display Standard Menu Bar Menus” on page 10-75• “Commonly Used Properties” on page 10-76• “How Menus Affect Figure Docking” on page 10-77• “Menu Bar Menu” on page 10-79
Display Standard Menu Bar Menus
Displaying the standard menu bar menus is optional. This figure’s menu bar contains thestandard menus.
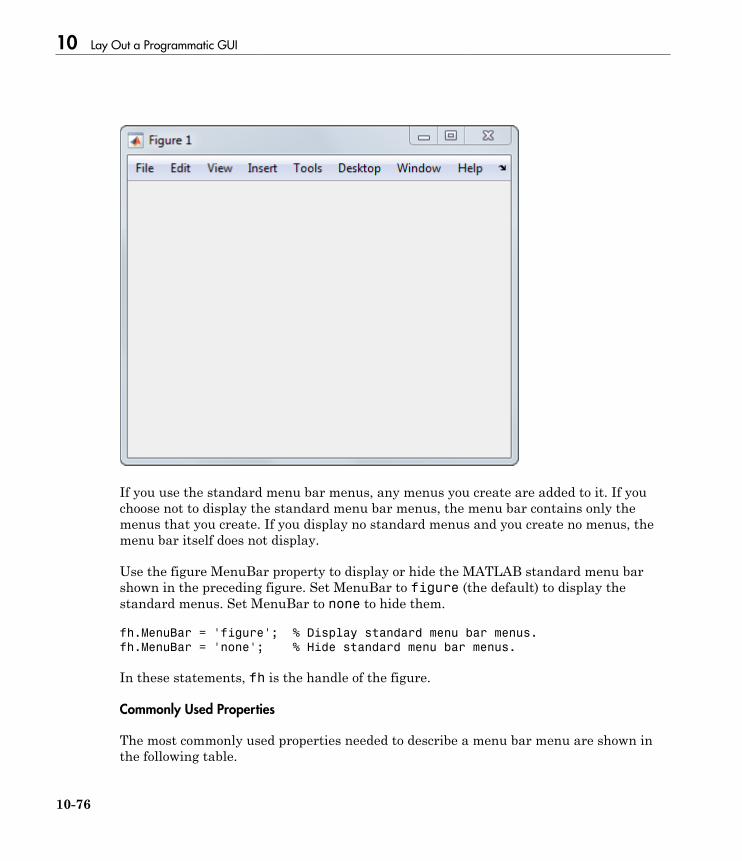
10 Lay Out a Programmatic GUI
10-76
If you use the standard menu bar menus, any menus you create are added to it. If youchoose not to display the standard menu bar menus, the menu bar contains only themenus that you create. If you display no standard menus and you create no menus, themenu bar itself does not display.
Use the figure MenuBar property to display or hide the MATLAB standard menu barshown in the preceding figure. Set MenuBar to figure (the default) to display thestandard menus. Set MenuBar to none to hide them.
fh.MenuBar = 'figure'; % Display standard menu bar menus.
fh.MenuBar = 'none'; % Hide standard menu bar menus.
In these statements, fh is the handle of the figure.
Commonly Used Properties
The most commonly used properties needed to describe a menu bar menu are shown inthe following table.

Create Menus for Programmatic GUIs
10-77
Property Values Description
Accelerator Alphabetic character Keyboard equivalent. Availablefor menu items that do not havesubmenus.
Checked off, on. Default is off. Menu check indicatorEnable on, off. Default is on. Controls whether a menu item can be
selected. When set to off, the menulabel appears dimmed.
HandleVisibility on, off. Default is on. Determines if an object's handle isvisible in its parent's list of children.For menus, set HandleVisibility tooff to protect menus from operationsnot intended for them.
Label String Menu label.
To display the & character in a label,use two & characters in the string.
The words remove, default, andfactory (case sensitive) are reserved.To use one of these as a label, prependa backslash (\) to the string. Forexample, \remove yields remove.
Position Scalar. Default is 1. Position of a menu item in the menu.Separator off, on. Default is off. Separator line mode
For a complete list of properties and for more information about the properties listed inthe table, see Uimenu Properties.
How Menus Affect Figure Docking
When you customize the menu bar or toolbar, you can display the GUI's docking controlsor not by setting DockControls appropriately, as long as the figure's WindowStyle doesnot conflict with that setting. You might not need menus for your GUI, but if you wantthe user to be able to dock or undock the GUI, it must contain a menu bar or a toolbar.This is because docking is controlled by the docking icon, a small curved arrow near theupper-right corner of the menu bar or the toolbar, as the following illustration shows.

10 Lay Out a Programmatic GUI
10-78
Figure windows with a standard menu bar also have a Desktop menu from which theuser can dock and undock them.
To display the docking arrow and the Desktop > Dock Figure menu item, the figureproperty DockControls must be set to 'on'. You can set it in the Property Inspector. Inaddition, the MenuBar and/or ToolBar figure properties must be set to 'on' to displaydocking controls.
The WindowStyle figure property also affects docking behavior. The default is 'normal',but if you change it to 'docked', then the following applies:
• The GUI opens docked in the desktop when you run it.• The DockControls property is set to 'on' and cannot be turned off until WindowStyle
is no longer set to 'docked'.• If you undock a GUI created with WindowStyle 'docked', it will have not have a
docking arrow unless the figure displays a menu bar or a toolbar (either standard orcustomized). When it has no docking arrow, users can undock it from the desktop, butwill be unable to redock it there.
To summarize, you can display docking controls with the DockControls property as longas it is not in conflict with the figure's WindowStyle property.
Note: GUIs that are modal dialogs (figures with WindowStyle 'modal') cannot havemenu bars, toolbars, or docking controls.
For more information, see the DockControls, MenuBar, ToolBar, and WindowStyleproperty descriptions on the Figure Properties page.

Create Menus for Programmatic GUIs
10-79
Menu Bar Menu
The following statements create a menu bar menu with two menu items.
mh = uimenu(fh,'Label','My menu');
eh1 = uimenu(mh,'Label','Item 1');
eh2 = uimenu(mh,'Label','Item 2','Checked','on');
fh is the handle of the parent figure.
mh is the handle of the parent menu.
The Label property specifies the text that appears in the menu.
The Checked property specifies that this item is displayed with a check next to it whenthe menu is created.
If your GUI displays the standard menu bar, the new menu is added to it.
If your GUI does not display the standard menu bar, MATLAB creates a menu bar ifnone exists and then adds the menu to it.
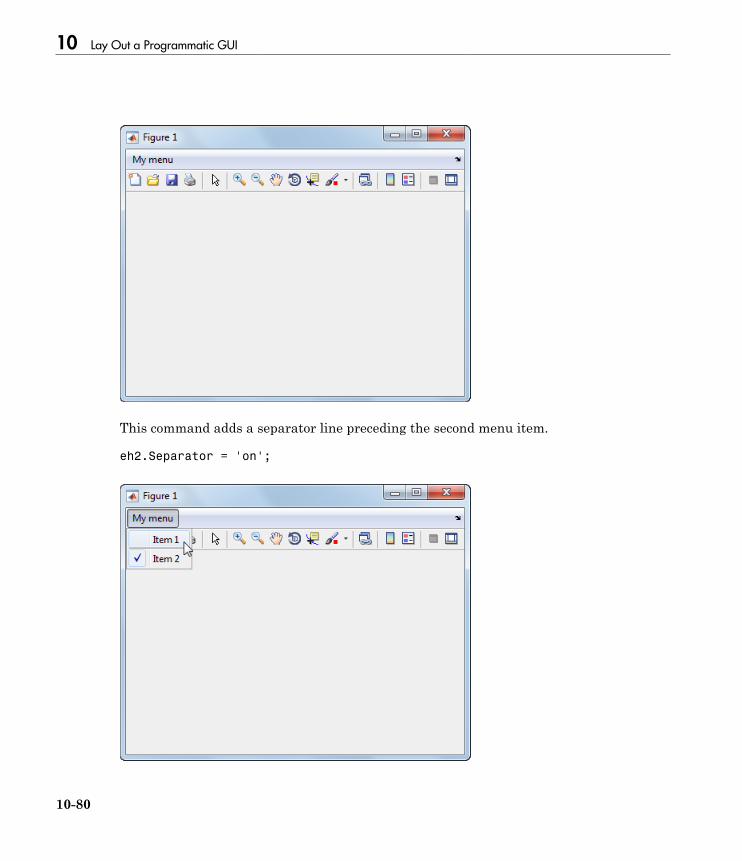
10 Lay Out a Programmatic GUI
10-80
This command adds a separator line preceding the second menu item.
eh2.Separator = 'on';
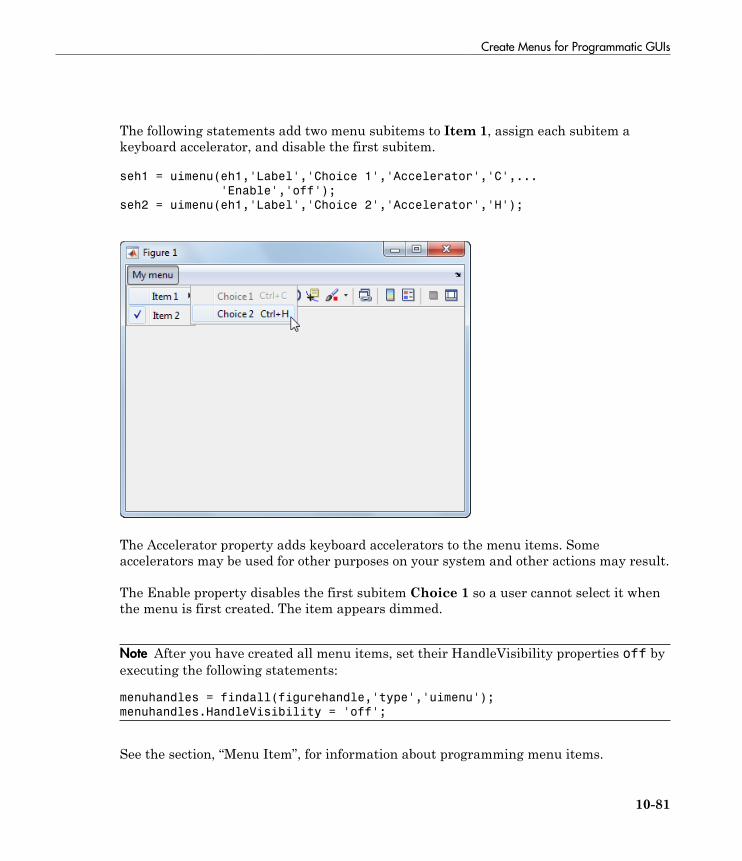
Create Menus for Programmatic GUIs
10-81
The following statements add two menu subitems to Item 1, assign each subitem akeyboard accelerator, and disable the first subitem.
seh1 = uimenu(eh1,'Label','Choice 1','Accelerator','C',...
'Enable','off');
seh2 = uimenu(eh1,'Label','Choice 2','Accelerator','H');
The Accelerator property adds keyboard accelerators to the menu items. Someaccelerators may be used for other purposes on your system and other actions may result.
The Enable property disables the first subitem Choice 1 so a user cannot select it whenthe menu is first created. The item appears dimmed.
Note After you have created all menu items, set their HandleVisibility properties off byexecuting the following statements:
menuhandles = findall(figurehandle,'type','uimenu');
menuhandles.HandleVisibility = 'off';
See the section, “Menu Item”, for information about programming menu items.

10 Lay Out a Programmatic GUI
10-82
Add Context Menus to a Programmatic GUI
Context menus appear when the user right-clicks on a figure or GUI component. Followthese steps to add a context menu to your GUI:
1 Create the context menu object using the uicontextmenu function.2 Add menu items to the context menu using the uimenu function.3 Associate the context menu with a graphics object using the object's UIContextMenu
property.
Subsequent topics describe commonly used context menu properties and explain each ofthese steps:
• “Commonly Used Properties” on page 10-82• “Create the Context Menu Object” on page 10-83• “Add Menu Items to the Context Menu” on page 10-83• “Associate the Context Menu with Graphics Objects” on page 10-84• “Force Display of the Context Menu” on page 10-86
Commonly Used Properties
The most commonly used properties needed to describe a context menu object are shownin the following table. These properties apply only to the menu object and not to theindividual menu items.
Property Values Description
HandleVisibility on, off. Default is on. Determines if an object's handle is visible inits parent's list of children. For menus, setHandleVisibility to off to protect menusfrom operations not intended for them.
Parent Figure handle Handle of the context menu's parent figure.Position 2-element vector:
[distance from left,distance from bottom].Default is [0 0].
Distances from the bottom left corner of theparent figure to the top left corner of thecontext menu. This property is used only whenyou programmatically set the context menuVisible property to on.

Create Menus for Programmatic GUIs
10-83
Property Values Description
Visible off, on. Default isoff
• Indicates whether the context menu iscurrently displayed. While the context menuis displayed, the property value is on; whenthe context menu is not displayed, its value isoff.
• Setting the value to on forces the posting ofthe context menu. Setting to off forces thecontext menu to be removed. The Positionproperty determines the location where thecontext menu is displayed.
For a complete list of properties and for more information about the properties listed inthe table, see Uicontextmenu Properties.
Create the Context Menu Object
Use the uicontextmenu function to create a context menu object. The syntax is
handle = uicontextmenu('PropertyName',PropertyValue,...)
The parent of a context menu must always be a figure. Use the context menu Parentproperty to specify its parent. If you do not specify Parent, the parent is the currentfigure as specified by the root CurrentFigure property.
The following code creates a figure and a context menu whose parent is the figure. At thispoint, the figure is visible, but not the menu.
fh = figure('Position',[300 300 400 225]);
cmenu = uicontextmenu('Parent',fh,'Position',[10 215]);
Note “Force Display of the Context Menu” on page 10-86 explains the use of thePosition property.
Add Menu Items to the Context Menu
Use the uimenu function to add items to the context menu. The items appear on themenu in the order in which you add them. The following code adds three items to thecontext menu created above.

10 Lay Out a Programmatic GUI
10-84
mh1 = uimenu(cmenu,'Label','Item 1');
mh2 = uimenu(cmenu,'Label','Item 2');
mh3 = uimenu(cmenu,'Label','Item 3');
You can specify any applicable Uimenu Properties when you define the context menuitems. See the uimenu reference page and “Add Menu Bar Menus” on page 10-75 forinformation about using uimenu to create menu items. Note that context menus do nothave an Accelerator property.
Note After you have created the context menu and all its items, set theirHandleVisibility properties to 'off' by executing the following statements:
cmenuhandles = findall(figurehandle,'type','uicontextmenu');
cmenuhandles.HandleVisibility = 'off';
menuitemhandles = findall(cmenuhandles,'type','uimenu');
menuitemhandles.HandleVisibility = 'off';
Associate the Context Menu with Graphics Objects
You can associate a context menu with the figure itself and with all components thathave a UIContextMenu property. This includes axes, panel, button group, all userinterface controls (uicontrols).
This code adds a panel and an axes to the figure. The panel contains a single pushbutton.
ph = uipanel('Parent',fh,'Units','pixels',...
'Position',[20 40 150 150]);
bh1 = uicontrol(ph,'String','Button 1',...
'Position',[20 20 60 40]);
ah = axes('Parent',fh,'Units','pixels',...
'Position',[220 40 150 150]);

Create Menus for Programmatic GUIs
10-85
This code associates the context menu with the figure and with the axes by setting theUIContextMenu property of the figure and the axes to the handle cmenu of the contextmenu.
fh.UIContextMenu = cmenu; % Figure
ah.UIContextMenu = cmenu; % Axes
Right-click on the figure or on the axes. The context menu appears with its upper-leftcorner at the location you clicked. Right-click on the panel or its push button. The contextmenu does not appear.
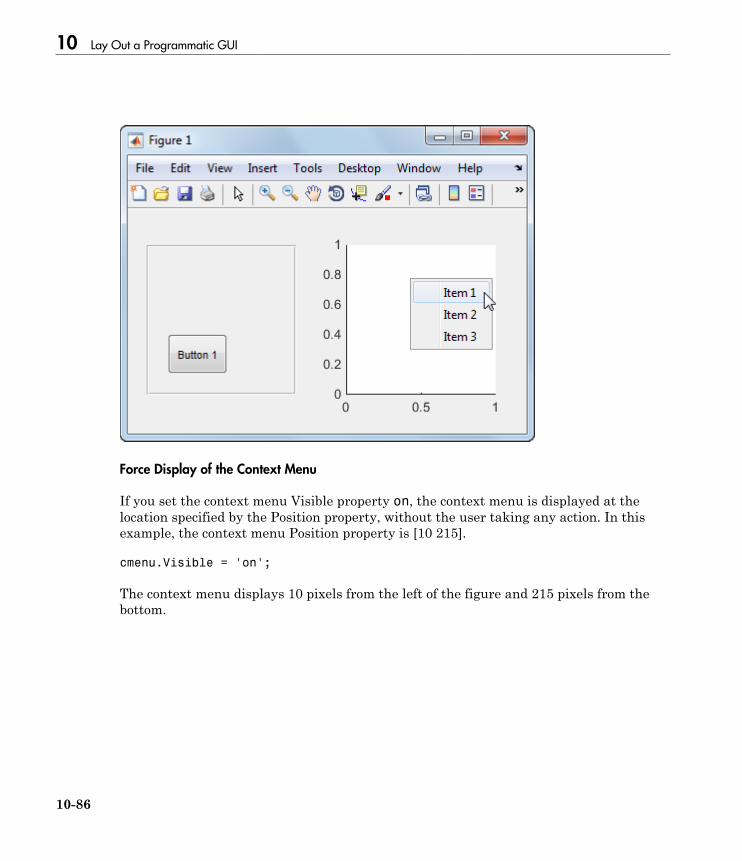
10 Lay Out a Programmatic GUI
10-86
Force Display of the Context Menu
If you set the context menu Visible property on, the context menu is displayed at thelocation specified by the Position property, without the user taking any action. In thisexample, the context menu Position property is [10 215].
cmenu.Visible = 'on';
The context menu displays 10 pixels from the left of the figure and 215 pixels from thebottom.

Create Menus for Programmatic GUIs
10-87
If you set the context menu Visible property to off, or if the user clicks the GUI outsidethe context menu, the context menu disappears.

10 Lay Out a Programmatic GUI
10-88
Create Toolbars for Programmatic GUIs
In this section...
“Use the uitoolbar Function” on page 10-88“Commonly Used Properties” on page 10-88“Toolbars” on page 10-89“Display and Modify the Standard Toolbar” on page 10-92
Use the uitoolbar Function
Use the uitoolbar function to add a custom toolbar to your GUI. Use the uipushtooland uitoggletool functions to add push tools and toggle tools to a toolbar. A push toolfunctions as a push button. A toggle tool functions as a toggle button. You can add pushtools and toggle tools to the standard toolbar or to a custom toolbar.
Syntaxes for the uitoolbar, uipushtool, and uitoggletool functions include thefollowing:
tbh = uitoolbar(fh,'PropertyName',PropertyValue,...)
pth = uipushtool(tnh,'PropertyName',PropertyValue,...)
tth = uitoggletool(tbh,'PropertyName',PropertyValue,...)
The output arguments, tbh, pth, and tth are the handles, respectively, of the resultingtoolbar, push tool, and toggle tool. See the uitoolbar, uipushtool, and uitoggletoolreference pages for other valid syntaxes.
Subsequent topics describe commonly used properties of toolbars and toolbar tools, offera simple example, and discuss use of the MATLAB standard toolbar:
Commonly Used Properties
The most commonly used properties needed to describe a toolbar and its tools are shownin the following table.
Property Values Description
CData 3-D array of valuesbetween 0.0 and 1.0
n-by-m-by-3 array of RGB valuesthat defines a truecolor image

Create Toolbars for Programmatic GUIs
10-89
Property Values Description
displayed on either a push button ortoggle button.
HandleVisibility on, off. Default is on. Determines if an object's handle isvisible in its parent's list of children.For toolbars and their tools, setHandleVisibility to off to protectthem from operations not intendedfor them.
Separator off, on. Default is off. Draws a dividing line to left of thepush tool or toggle tool
State off, on. Default is off. Toggle tool state. on is the down, ordepressed, position. off is the up, orraised, position.
TooltipString String Text of the tooltip associated withthe push tool or toggle tool.
For a complete list of properties and for more information about the properties listedin the table, see the Uitoolbar Properties, Uipushtool Properties, and UitoggletoolProperties.
Toolbars
The following statements add a toolbar to a figure, and then add a push tool and a toggletool to the toolbar. By default, the tools are added to the toolbar, from left to right, in theorder they are created.
% Create the toolbar
fh = figure;
tbh = uitoolbar(fh);
% Add a push tool to the toolbar
a = [.20:.05:0.95];
img1(:,:,1) = repmat(a,16,1)';
img1(:,:,2) = repmat(a,16,1);
img1(:,:,3) = repmat(flipdim(a,2),16,1);
pth = uipushtool(tbh,'CData',img1,...
'TooltipString','My push tool',...
'HandleVisibility','off');
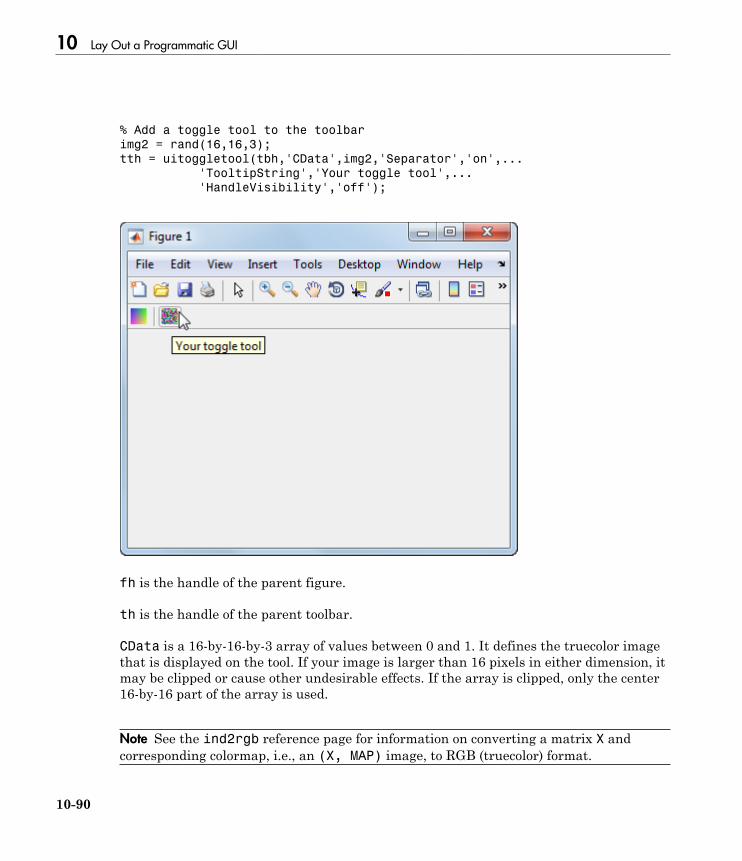
10 Lay Out a Programmatic GUI
10-90
% Add a toggle tool to the toolbar
img2 = rand(16,16,3);
tth = uitoggletool(tbh,'CData',img2,'Separator','on',...
'TooltipString','Your toggle tool',...
'HandleVisibility','off');
fh is the handle of the parent figure.
th is the handle of the parent toolbar.
CData is a 16-by-16-by-3 array of values between 0 and 1. It defines the truecolor imagethat is displayed on the tool. If your image is larger than 16 pixels in either dimension, itmay be clipped or cause other undesirable effects. If the array is clipped, only the center16-by-16 part of the array is used.
Note See the ind2rgb reference page for information on converting a matrix X andcorresponding colormap, i.e., an (X, MAP) image, to RGB (truecolor) format.

Create Toolbars for Programmatic GUIs
10-91
TooltipString specifies the tooltips for the push tool and the toggle tool as My pushtool and Your toggle tool, respectively.
In this example, setting the toggle tool Separator property to on creates a dividing line tothe left of the toggle tool.
You can change the order of the tools by modifying the child vector of the parent toolbar.For this example, execute the following code to reverse the order of the tools.
oldOrder = allchild(tbh);
newOrder = flipud(oldOrder);
tbh.Children = newOrder;
This code uses flipud because the Children property is a column vector.
Use the delete function to remove a tool from the toolbar. The following statementremoves the toggle tool from the toolbar. The toggle tool handle is tth.
delete(tth)

10 Lay Out a Programmatic GUI
10-92
If necessary, you can use the findall function to determine the handles of the tools on aparticular toolbar.
Note After you have created a toolbar and its tools, set their HandleVisibility propertiesoff by executing statements similar to the following:
toolbarhandle.HandleVisibility = 'off';
toolhandles = toolbarhandle.Children;
toolhandles.HandleVisibility = 'off';
Display and Modify the Standard Toolbar
You can choose whether or not to display the MATLAB standard toolbar (highlighted inred below). You can also add or delete tools from the standard toolbar.

Create Toolbars for Programmatic GUIs
10-93
Display the Standard Toolbar
Use the figure Toolbar property to display or hide the standard toolbar. Set Toolbar to'figure' to display the standard toolbar. Set Toolbar to 'none' to hide it.
fh.Toolbar = 'figure'; % Display the standard toolbar
fh.Toolbar = 'none'; % Hide the standard toolbar
In these statements, fh is the handle of the figure.
The default ToolBar value is 'auto', which uses the MenuBar property value.
Modify the Standard Toolbar
Once you have the handle of the standard toolbar, you can add tools, delete tools, andchange the order of the tools.
Add a tool the same way you would add it to a custom toolbar. This code gets the handleof the standard toolbar and adds a toggle tool to it.
tbh = findall(fh,'Type','uitoolbar');
tth = uitoggletool(tbh,'CData',rand(20,20,3),...
'Separator','on',...
'HandleVisibility','off');
To remove a tool from the standard toolbar, determine the handle of the tool to beremoved, and then use the delete function to remove it. The following code deletes thetoggle tool that was added to the standard toolbar above.
delete(tth)
If necessary, you can use the findall function to determine the handles of the tools onthe standard toolbar.
10 Lay Out a Programmatic GUI
10-94
Fonts and Colors for Cross-Platform Compatibility
In this section...
“Default System Font” on page 10-94“Standard Background Color” on page 10-95
Default System Font
By default, user interface controls (uicontrols) use the default font for the platform onwhich they are running. For example, when displaying your GUI on PCs, user interfacecontrols use MS San Serif. When your GUI runs on a different platform, they use thatcomputer's default font. This provides a consistent look with respect to your GUI andother application GUIs on the same platform.
If you have set the FontName property to a named font and want to return to the defaultvalue, you can set the property to the string, 'default'. This ensures that MATLABsoftware uses the system default at run-time.
pbh1.FontName = 'default';
Specify a Fixed-Width Font
If you want to use a fixed-width font for a user interface control, set its FontNameproperty to the string, 'fixedwidth'. This special identifier ensures that your GUI usesthe standard fixed-width font for the target platform.
You can find the name of the fixed-width font that is used on a given platform byquerying the root FixedWidthFontName property.
get(groot,'FixedWidthFontName')
Use a Specific Font Name
You can specify an actual font name (such as Times or Courier) for the FontNameproperty. However, doing so may cause your GUI to appear differently than you intendedwhen run on a different computer. If the target computer does not have the specifiedfont, it substitutes another font that may not look good in your GUI or may not be thestandard font used for GUIs on that system. Also, different versions of the same namedfont may have different size requirements for a given set of characters.

Fonts and Colors for Cross-Platform Compatibility
10-95
Standard Background Color
MATLAB software uses the standard system background color of the system on whichthe GUI is running as the default component background color. This color varies ondifferent computer systems, e.g., the standard shade of gray on the PC differs from thaton UNIX system, and may not match the default GUI background color.
You can make the GUI background color match the default component background color.This code gets the default component background color and assign it to the figure.
defaultBackground = get(groot,'defaultUicontrolBackgroundColor');
fh.Color = defaultBackground;

10-96

11
Code a Programmatic GUI
• “Initialize a Programmatic GUI” on page 11-2• “Write Callbacks Using the Programmatic Workflow” on page 11-5

11 Code a Programmatic GUI
11-2
Initialize a Programmatic GUI
When you open a GUI, it usually initializes certain data structures and variable values.These actions can include:
• Defining default values• Setting UI component property values• Processing input arguments• Hiding the figure window until all the components are created
Group these tasks together rather than scattering them throughout the code. If aninitialization task is long or complex, consider creating a utility function to do the work.
Examples
Declare Variables for Input and Output Arguments
These are typical declarations for input and output arguments.
mInputArgs = varargin; % Command line arguments when invoking
% the GUI
mOutputArgs = {}; % Variable for storing output when GUI
% returns
See the varargin reference page for more information.
Define Custom Property/Value Pairs
This example defines the properties in a cell array, mPropertyDefs, and then initializesthe properties.mPropertyDefs = {...
'iconwidth', @localValidateInput, 'mIconWidth';
'iconheight', @localValidateInput, 'mIconHeight';
'iconfile', @localValidateInput, 'mIconFile'};
mIconWidth = 16; % Use input property 'iconwidth' to initialize
mIconHeight = 16; % Use input property 'iconheight' to initialize
mIconFile = fullfile(matlabroot,'toolbox/matlab/icons/');
% Use input property 'iconfile' to initialize
Each row of the cell array defines one property. It specifies, in order, the name of theproperty, the routine that is called to validate the input, and the name of the variablethat holds the property value.

Initialize a Programmatic GUI
11-3
The fullfile function builds a full filename from parts.
The following statements start the Icon Editor application. The first statement creates anew icon. The second statement opens existing icon file for editing.
cdata = iconEditor('iconwidth',16,'iconheight',25)
cdata = iconEditor('iconfile','eraser.gif');
iconEditor calls a routine, processUserIputs, during the initialization to accomplishthese tasks:
• Identify each property by matching it to the first column of the cell array• Call the routine named in the second column to validate the input• Assign the value to the variable named in the third column
Make the Figure Invisible
When you create the GUI figure, make it invisible when you create it. Display it onlyafter you have added all the UI components.
To make the GUI invisible, set the figure Visible property to 'off' when you createthe figure:
hMainFigure = figure(...
'Units','characters',...
'MenuBar','none',...
'Toolbar','none',...
'Position',[71.8 34.7 106 36.15],...
'Visible','off');
After you have added all the components to the figure window, make the figure visible:
hMainFigure.Visible = 'on';
Most components have a Visible property. Thus, you can also use this property to makeindividual components invisible.
Return Output to the User
If your GUI function provides for an argument to the left of the equal sign, and the userspecifies such an argument, then you want to return the expected output. The code thatprovides this output usually appears just before the GUI main function returns.
In the example shown here,

11 Code a Programmatic GUI
11-4
1 A call to uiwait blocks execution until uiresume is called or the current figure isdeleted.
2 While execution is blocked, the user creates the icon.3 When the user clicks OK, that push button’s callback calls the uiresume function.4 The GUI then returns the completed icon to the user as output of the GUI.
% Make the GUI blocking.
uiwait(hMainFigure);
% Return the edited icon CData if it is requested.
mOutputArgs{1} = mIconCData;
if nargout>0
[varargout{1:nargout}] = mOutputArgs{:};
end
mIconData contains the icon that the user created or edited. mOutputArgs is a cellarray defined to hold the output arguments. nargout indicates how many outputarguments the user has supplied. varargout contains the optional output argumentsreturned by the GUI. See the complete Icon Editor code file for more information.

Write Callbacks Using the Programmatic Workflow
11-5
Write Callbacks Using the Programmatic Workflow
In this section...
“Callbacks for Different User Actions” on page 11-5“How to Specify Callback Property Values” on page 11-7“Callback Syntax” on page 11-9
Callbacks for Different User Actions
UI and graphics components have certain properties that you can associate with specificcallback functions. Each of these properties corresponds to a specific user action. Forexample, a uicontrol has a property called Callback. You can set the value of thisproperty to be a handle to a callback function, an anonymous function, or a stringcontaining MATLAB commands. Setting this property makes your GUI respond whenthe user interacts with the uicontrol. If the Callback property has no specified value, thennothing happens when the end user interacts with the uicontrol.
This table lists the callback properties that are available, the user actions that triggerthe callback function, and the most common UI and graphics components that use them.
Callback Property User Action Components That Use This Property
ButtonDownFcn End user presses a mouse buttonwhile the pointer is on thecomponent or figure.
axes, figure, uibuttongroup,uicontrol, uipanel, uitable,
Callback End user triggers the component.For example: selecting a menuitem, moving a slider, or pressinga push button.
uicontextmenu, uicontrol,uimenu
CellEditCallback End user edits a value in a tablewhose cells are editable.
uitable
CellSelectionCallbackEnd user selects cells in a table. uitable
ClickedCallback End user clicks the push tool ortoggle tool with the left mousebutton.
uitoggletool, uipushtool
CloseRequestFcn The figure closes. figure

11 Code a Programmatic GUI
11-6
Callback Property User Action Components That Use This Property
CreateFcn Callback executes when MATLABcreates the object, but before it isdisplayed.
axes, figure, uibuttongroup,uicontextmenu, uicontrol,uimenu, uipushtool, uipanel,uitable, uitoggletool,uitoolbar
DeleteFcn Callback executes just beforeMATLAB deletes the figure.
axes, figure, uibuttongroup,uicontextmenu, uicontrol,uimenu, uipushtool, uipanel,uitable, uitoggletool,uitoolbar
KeyPressFcn End user presses a keyboard keywhile the pointer is on the object.
figure, uicontrol, uipanel,uipushtool, uitable,uitoolbar
KeyReleaseFcn End user releases a keyboard keywhile the pointer is on the object.
figure, uicontrol, uitable
OffCallback Executes when the State of atoggle tool changes to 'off'.
uitoggletool
OnCallback Executes when the State of atoggle tool changes to 'on'.
uitoggletool
SizeChangedFcn End user resizes a button group,figure, or panel whose Resizeproperty is 'on'.
figure, uipanel,uibuttongroup
SelectionChangedFcnEnd user selects a different radiobutton or toggle button within abutton group.
uibuttongroup
WindowButtonDownFcnEnd user presses a mouse buttonwhile the pointer is in the figurewindow.
figure
WindowButtonMotionFcnEnd user moves the pointer withinthe figure window.
figure
WindowButtonUpFcnEnd user releases a mouse button. figure
WindowKeyPressFcnEnd user presses a key while thepointer is on the figure or any ofits child objects.
figure
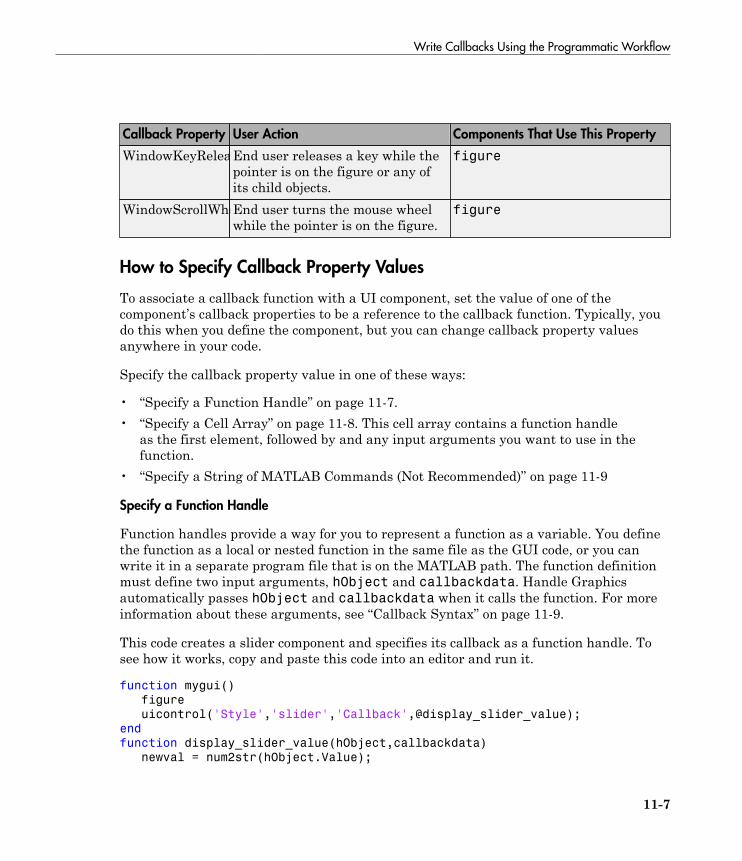
Write Callbacks Using the Programmatic Workflow
11-7
Callback Property User Action Components That Use This Property
WindowKeyReleaseFcnEnd user releases a key while thepointer is on the figure or any ofits child objects.
figure
WindowScrollWheelFcnEnd user turns the mouse wheelwhile the pointer is on the figure.
figure
How to Specify Callback Property Values
To associate a callback function with a UI component, set the value of one of thecomponent’s callback properties to be a reference to the callback function. Typically, youdo this when you define the component, but you can change callback property valuesanywhere in your code.
Specify the callback property value in one of these ways:
• “Specify a Function Handle” on page 11-7.• “Specify a Cell Array” on page 11-8. This cell array contains a function handle
as the first element, followed by and any input arguments you want to use in thefunction.
• “Specify a String of MATLAB Commands (Not Recommended)” on page 11-9
Specify a Function Handle
Function handles provide a way for you to represent a function as a variable. You definethe function as a local or nested function in the same file as the GUI code, or you canwrite it in a separate program file that is on the MATLAB path. The function definitionmust define two input arguments, hObject and callbackdata. Handle Graphicsautomatically passes hObject and callbackdata when it calls the function. For moreinformation about these arguments, see “Callback Syntax” on page 11-9.
This code creates a slider component and specifies its callback as a function handle. Tosee how it works, copy and paste this code into an editor and run it.
function mygui()
figure
uicontrol('Style','slider','Callback',@display_slider_value);
end
function display_slider_value(hObject,callbackdata)
newval = num2str(hObject.Value);

11 Code a Programmatic GUI
11-8
disp(['Slider moved to ' newval]);
end
This callback function displays the value of the slider when the end user adjusts it.A benefit of specifying callbacks as function handles is that MATLAB checks thefunction for syntax errors and missing dependencies when you assign the callback to thecomponent. If there is a problem in the callback function, then MATLAB returns an errorimmediately instead of waiting for the end user to trigger the callback. This behaviorhelps you to find problems in your code before the end user encounters them.
Note: If you want to use an existing function that does not support the hObject andcallbackdata arguments, then you can specify it as an anonymous function. Forexample,uicontrol('Style','slider','Callback',@(hObject,callbackdata)myfunction(x));
In this case, x is an input argument to the function, myfunction. See “AnonymousFunctions” for more information.
Specify a Cell Array
Use a cell array to specify a callback function that accepts input arguments that youwant to use in the function. The first element in the cell array is a function handle.The other elements in the cell array are the input arguments to the function, separatedby commas. For example, this code creates a push button component and specifies itscallback to be a cell array containing the function handle, @pushbutton_callback, andone input argument, myvar. To see how it works, copy and paste this code into an editorand run it.
function somegui()
myvar = 5;
figure
uicontrol('Style','pushbutton',...
'Callback',{@pushbutton_callback,myvar});
end
function pushbutton_callback(hObject,callbackdata,x)
display(x);
end
The function definition must define two input arguments, hObject and callbackdata,followed by any additional arguments the function uses. Handle Graphics automaticallypasses the hObject and callbackdata arguments when it calls the function. If youdefine additional input arguments, then the values you pass to the callback must exist inthe workspace when the end user triggers the callback.

Write Callbacks Using the Programmatic Workflow
11-9
Like callbacks specified as function handles, MATLAB checks callbacks specified as cellarrays for syntax errors and missing dependencies when you assign the callback to thecomponent. If there is a problem in the callback function, then MATLAB returns an errorimmediately instead of waiting for the end user to trigger the callback. This behaviorhelps you to find problems in your code before the end user encounters them.
Specify a String of MATLAB Commands (Not Recommended)
You can use string callbacks for a few simple commands, but the callback can becomedifficult to manage if it contains more than a few commands. The string you specify mustconsist of valid MATLAB expressions, which can include arguments to functions. Forexample:
hb = uicontrol('Style','pushbutton',...
'String','Plot line',...
'Callback','plot(rand(20,3))');
The callback string, 'plot(rand(20,3))', is a valid command, and MATLABevaluates it when the end user clicks the button. If the callback string includes avariable, for example,
'plot(myvar)'
The variable, myvar, must exist in the base workspace when the end user triggers thecallback, or it returns an error. The variable does not need to exist at the time you assigncallback property value, but it must exist when the end user triggers the callback.
Unlike callbacks that are specified as function handles or cell arrays, MATLAB does notcheck string callbacks for syntax errors or missing dependencies. If there is a problemwith the code in your string, it remains undetected until the end user triggers thecallback.
Callback Syntax
All callback functions that you reference as function handles or cell arrays mustaccept the at least two input arguments, hObject and callbackdata. All other inputarguments must appear after hObject and callbackdata in the function definition.
The hObject argument is a handle to the UI component that triggered the callback.The callbackdata argument provides additional information to certain callbackfunctions. For example, if the end user triggers the KeyPressFcn, then MATLABprovides information regarding the specific key (or combination of keys) that the end userpressed. If callbackdata is not available to the callback function, then MATLAB passes

11 Code a Programmatic GUI
11-10
it as an empty array. The following table lists the callbacks and components that usecallbackdata.
Callback Property Name Component
WindowKeyPressFcn
WindowKeyReleaseFcn
WindowScrollWheel
figure
KeyPressFcn figure, uicontrol, uitableKeyReleaseFcn figure, uicontrol, uitableSelectionChangedFcn uibuttongroup
CellEditCallback
CellSelectionCallback
uitable
12
Manage Application-Defined Data

12 Manage Application-Defined Data
12-2
Share Data Among Callbacks
In this section...
“Overview of Data Sharing Techniques” on page 12-2“Store Data in UserData or Other Object Properties” on page 12-3“Store Data as Application Data” on page 12-4“Create Nested Callback Functions (Programmatic GUIs)” on page 12-5“Store Data Using the guidata Function” on page 12-6“Sharing Data Among Multiple GUIDE GUIs” on page 12-9
Overview of Data Sharing Techniques
Many GUIs contain interdependent controls, menus, and graphics objects. Since eachcallback function has its own scope, you must explicitly share data with those parts ofyour GUI that need to access it. The table below describes several different methods forsharing data within your GUI.
Method Description Requirements and Trade-Offs
“Store Data inUserData orOther ObjectProperties” onpage 12-3
Use dot syntax,object.property, to store orretrieve the value of an objectproperty.
All UI components have aUserData property that can storeany MATLAB data.
• Requires access to the objectto set or retrieve the objectproperties.
• UserData holds only onevariable at a time, but youcan store multiple values as astruct array or cell array.
“Store Dataas ApplicationData” on page12-4
Associate data with a specificcomponent using the setappdatafunction. You can access it laterusing the getappdata function.
• Requires access to an objecthandle to set or retrieve theapplication data.
• Can share multiple variables.“Create NestedCallbackFunctions(Programmatic
Nest your callback functionsinside your main GUI function.This gives your callback functionsaccess to all the variables in themain GUI function.
• Requires that functions becoded in the same file as themain GUI code.
• Not recommended for GUIDEGUIs.

Share Data Among Callbacks
12-3
Method Description Requirements and Trade-Offs
GUIs)” on page12-5
• Can share multiple variables.
“Store DataUsing theguidataFunction” onpage 12-6
Share data with the GUI figureusing the guidata function.
• Stores or retrieves the datathrough any UI component.
• Stores only one variable ata time, but you can storemultiple values as a structarray or cell array.
Store Data in UserData or Other Object Properties
UI components contain useful information in their properties, which you can accessdirectly as long as you have the component handle. If you do not have a handle to thecomponent, then use the findobj function to search for a handle that has a knownproperty value. You can store any data in the UserData property of a UI component orfigure. For example, the following programmatic GUI code uses the UserData propertyto share information about the slider. To see how it works, copy and paste this code intoan editor and run it.
function my_slider()
hfig = figure();
slider = uicontrol('Parent', hfig,'Style','slider',...
'Units','normalized',...
'Position',[0.3 0.5 0.4 0.1],...
'Tag','slider1',...
'UserData',struct('val',0,'diffMax',1),...
'Callback',@slider_callback);
button = uicontrol('Parent', hfig,'Style','pushbutton',...
'Units','normalized',...
'Position',[0.4 0.3 0.2 0.1],...
'String','Display Difference',...
'Callback',@button_callback);
end
function slider_callback(hObject,eventdata)
sval = hObject.Value;
diffMax = hObject.Max - sval;
data = struct('val',sval,'diffMax',diffMax);
hObject.UserData = data;
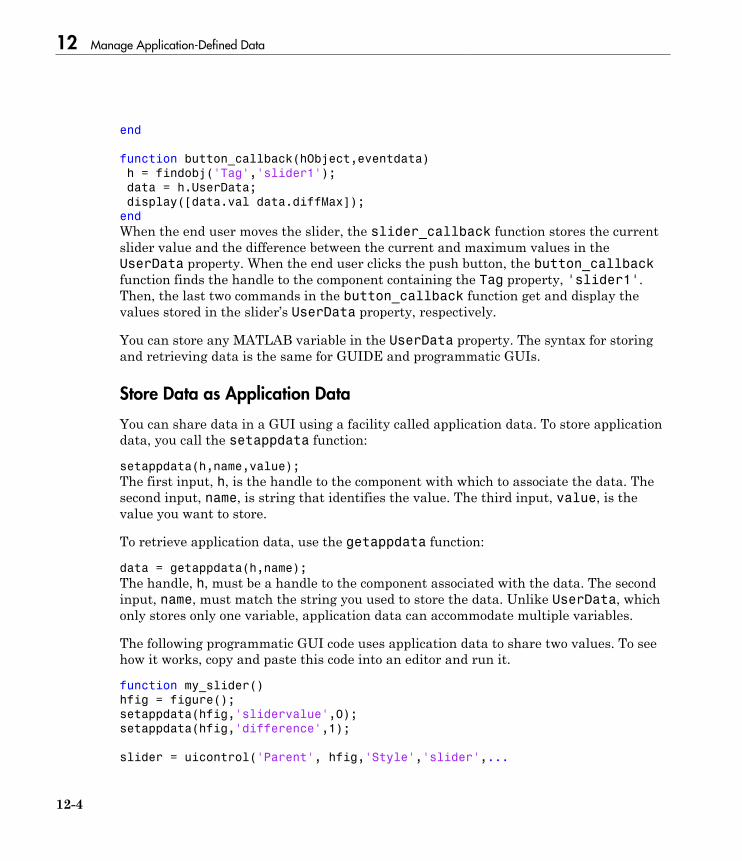
12 Manage Application-Defined Data
12-4
end
function button_callback(hObject,eventdata)
h = findobj('Tag','slider1');
data = h.UserData;
display([data.val data.diffMax]);
end
When the end user moves the slider, the slider_callback function stores the currentslider value and the difference between the current and maximum values in theUserData property. When the end user clicks the push button, the button_callbackfunction finds the handle to the component containing the Tag property, 'slider1'.Then, the last two commands in the button_callback function get and display thevalues stored in the slider’s UserData property, respectively.
You can store any MATLAB variable in the UserData property. The syntax for storingand retrieving data is the same for GUIDE and programmatic GUIs.
Store Data as Application Data
You can share data in a GUI using a facility called application data. To store applicationdata, you call the setappdata function:
setappdata(h,name,value);
The first input, h, is the handle to the component with which to associate the data. Thesecond input, name, is string that identifies the value. The third input, value, is thevalue you want to store.
To retrieve application data, use the getappdata function:
data = getappdata(h,name);
The handle, h, must be a handle to the component associated with the data. The secondinput, name, must match the string you used to store the data. Unlike UserData, whichonly stores only one variable, application data can accommodate multiple variables.
The following programmatic GUI code uses application data to share two values. To seehow it works, copy and paste this code into an editor and run it.
function my_slider()
hfig = figure();
setappdata(hfig,'slidervalue',0);
setappdata(hfig,'difference',1);
slider = uicontrol('Parent', hfig,'Style','slider',...
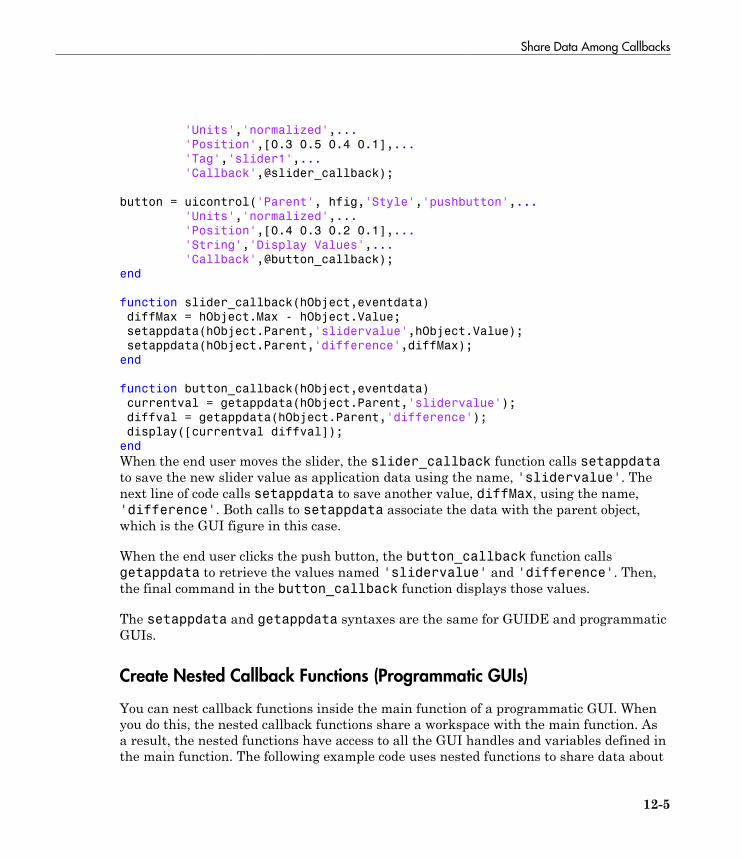
Share Data Among Callbacks
12-5
'Units','normalized',...
'Position',[0.3 0.5 0.4 0.1],...
'Tag','slider1',...
'Callback',@slider_callback);
button = uicontrol('Parent', hfig,'Style','pushbutton',...
'Units','normalized',...
'Position',[0.4 0.3 0.2 0.1],...
'String','Display Values',...
'Callback',@button_callback);
end
function slider_callback(hObject,eventdata)
diffMax = hObject.Max - hObject.Value;
setappdata(hObject.Parent,'slidervalue',hObject.Value);
setappdata(hObject.Parent,'difference',diffMax);
end
function button_callback(hObject,eventdata)
currentval = getappdata(hObject.Parent,'slidervalue');
diffval = getappdata(hObject.Parent,'difference');
display([currentval diffval]);
end
When the end user moves the slider, the slider_callback function calls setappdatato save the new slider value as application data using the name, 'slidervalue'. Thenext line of code calls setappdata to save another value, diffMax, using the name,'difference'. Both calls to setappdata associate the data with the parent object,which is the GUI figure in this case.
When the end user clicks the push button, the button_callback function callsgetappdata to retrieve the values named 'slidervalue' and 'difference'. Then,the final command in the button_callback function displays those values.
The setappdata and getappdata syntaxes are the same for GUIDE and programmaticGUIs.
Create Nested Callback Functions (Programmatic GUIs)
You can nest callback functions inside the main function of a programmatic GUI. Whenyou do this, the nested callback functions share a workspace with the main function. Asa result, the nested functions have access to all the GUI handles and variables defined inthe main function. The following example code uses nested functions to share data about

12 Manage Application-Defined Data
12-6
the slider position. To see how it works, copy and paste this code into an editor and runit.
function my_slider()
hfig = figure();
data = struct('val',0,'diffMax',1);
slider = uicontrol('Parent', hfig,'Style','slider',...
'Units','normalized',...
'Position',[0.3 0.5 0.4 0.1],...
'Tag','slider1',...
'Callback',@slider_callback);
button = uicontrol('Parent', hfig,'Style','pushbutton',...
'Units','normalized',...
'Position',[0.4 0.3 0.2 0.1],...
'String','Display Difference',...
'Callback',@button_callback);
function slider_callback(hObject,eventdata)
sval = hObject.Value;
diffMax = hObject.Max - sval;
data.val = sval;
data.diffMax = diffMax;
end
function button_callback(hObject,eventdata)
display([data.val data.diffMax]);
end
end
The main function defines a struct array called data. When the end user moves theslider, the slider_callback function updates the val and diffMax fields of the datastructure. When the end user clicks the push button, the button_callback functiondisplays the values stored in data.
Note: Nested functions are not recommended for GUIDE GUIs.
Store Data Using the guidata Function
The guidata function provides a way to share data with the GUI figure. You can storeor retrieve the your data in any callback through the hObject handle. This meansthat, unlike working with UserData or application data, you do not have to search
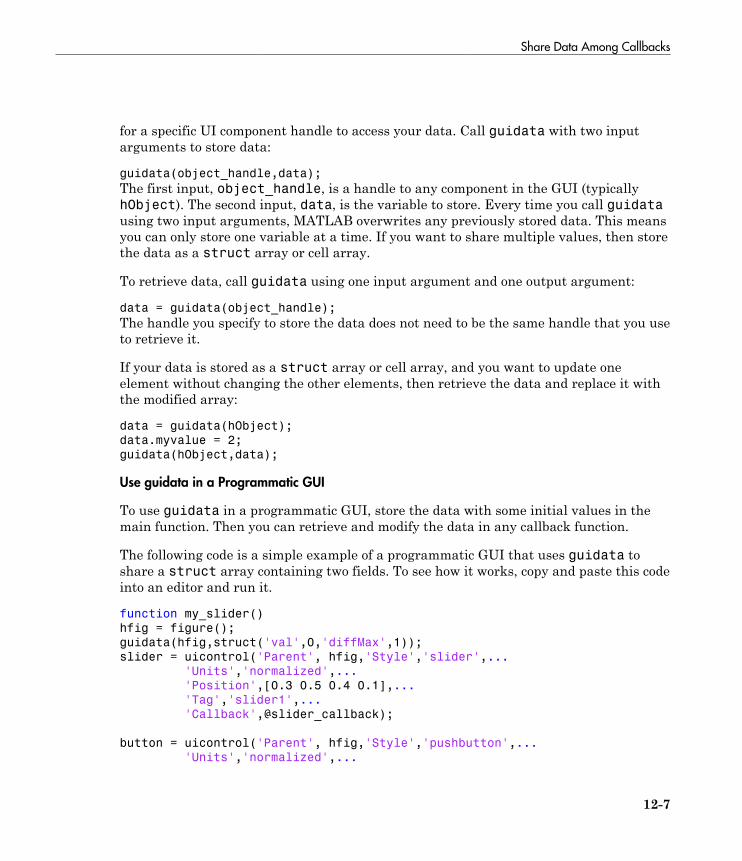
Share Data Among Callbacks
12-7
for a specific UI component handle to access your data. Call guidata with two inputarguments to store data:
guidata(object_handle,data);
The first input, object_handle, is a handle to any component in the GUI (typicallyhObject). The second input, data, is the variable to store. Every time you call guidatausing two input arguments, MATLAB overwrites any previously stored data. This meansyou can only store one variable at a time. If you want to share multiple values, then storethe data as a struct array or cell array.
To retrieve data, call guidata using one input argument and one output argument:
data = guidata(object_handle);
The handle you specify to store the data does not need to be the same handle that you useto retrieve it.
If your data is stored as a struct array or cell array, and you want to update oneelement without changing the other elements, then retrieve the data and replace it withthe modified array:
data = guidata(hObject);
data.myvalue = 2;
guidata(hObject,data);
Use guidata in a Programmatic GUI
To use guidata in a programmatic GUI, store the data with some initial values in themain function. Then you can retrieve and modify the data in any callback function.
The following code is a simple example of a programmatic GUI that uses guidata toshare a struct array containing two fields. To see how it works, copy and paste this codeinto an editor and run it.
function my_slider()
hfig = figure();
guidata(hfig,struct('val',0,'diffMax',1));
slider = uicontrol('Parent', hfig,'Style','slider',...
'Units','normalized',...
'Position',[0.3 0.5 0.4 0.1],...
'Tag','slider1',...
'Callback',@slider_callback);
button = uicontrol('Parent', hfig,'Style','pushbutton',...
'Units','normalized',...

12 Manage Application-Defined Data
12-8
'Position',[0.4 0.3 0.2 0.1],...
'String','Display Values',...
'Callback',@button_callback);
end
function slider_callback(hObject,eventdata)
data = guidata(hObject);
data.val = hObject.Value;
data.diffMax = hObject.Max - data.val;
guidata(hObject,data);
end
function button_callback(hObject,eventdata)
data = guidata(hObject);
display([data.val data.diffMax]);
end
When the end user moves the slider, the slider_callback function calls guidata toretrieve a copy of the stored struct array. The next two lines of code modify the structarray. The last line in the function replaces the stored struct array with the modifiedcopy.
When the end users clicks the push button, the button_callback function callsguidata to retrieve a copy of the stored struct array. Then it displays the two valuesstored in the array.
Use guidata in a GUIDE GUI
GUIDE uses guidata to store a struct array called handles, which contains all thehandles in the GUI. MATLAB passes the handles array to every callback function.If you want to use guidata to share additional data, then add fields to the handlesstructure in the OpeningFcn callback. To modify your data in a callback function, modifythe handles array, and then store it using guidata. This slider callback function showshow to modify and store the handles array in a callback function.
function slider1_Callback(hObject,eventdata,handles)
handles.myvalue = 2;
guidata(hObject,handles);
end
To see a full example of a GUIDE GUI that uses the guidata function, follow these stepsto copy and examine the code.
1 Set your current folder to one to which you have write access.

Share Data Among Callbacks
12-9
2 Copy the example code.
copyfile(fullfile(docroot, 'techdoc','creating_guis',...
'examples','sliderbox_guidata.*')),...
fileattrib('sliderbox_guidata.*', '+w');
3 Display this example in the GUIDE Layout Editor:
guide sliderbox_guidata.fig
4 View the code in the Editor by clicking the Editor button, .5 Run the GUI by clicking the Run Figure button, .
Sharing Data Among Multiple GUIDE GUIs
Example of Sharing Data Between Two GUIs
To see a full-featured example that uses application data and the guidata function toshare data between two separate GUIs, use these steps to copy, run, and examine thecode.
1 Set your current folder to one to which you have write access.2 Copy the example code with this command:
copyfile(fullfile(docroot, 'techdoc','creating_guis','examples'...
,'changeme*.*')),fileattrib('changeme*.*', '+w');
3 Display the GUIs in two GUIDE Layout Editors with these commands:
guide changeme_main
guide changeme_dialog
4 View the code in the editor by clicking the Editor button, , in both Layout Editors.5 Run the changeme_main GUI by clicking Run Figure button, , in that GUI
Layout Editor.
Example of Sharing Data Among Three GUIs
To see a full-featured example that uses guidata and UserData data to share dataamong three GUIs, use these steps to copy, run, and examine the code.
1 Set your current folder to one to which you have write access.2 Copy the example code with this command

12 Manage Application-Defined Data
12-10
copyfile(fullfile(docroot, 'techdoc','creating_guis',...
'examples','guide*.*')),...
fileattrib('guide*.*', '+w');
3 Display the GUIs in three GUIDE Layout Editors with these commands:
guide guide_iconeditor;
guide guide_toolpalette;
guide guide_colorpalette;
4 View the code in the editor by clicking the Editor button, , in each Layout Editor.5 Run the guide_iconeditor GUI by clicking Run Figure button, , in that GUI
Layout Editor.
More About• “Nested Functions”

13
Manage Callback Execution

13 Manage Callback Execution
13-2
Interrupt Callback Execution
In this section...
“Control Callback Execution and Interruption” on page 13-2“Control Program Execution Using Timer Objects” on page 13-10
Control Callback Execution and Interruption
• “Order of Callback Execution” on page 13-3• “How the Interruptible Property Works” on page 13-3• “How the Busy Action Property Works” on page 13-5• “Example” on page 13-5
Callback execution is event driven and callbacks from different GUIs share the sameevent queue. In general, callbacks are triggered by user events such as a mouse click orkey press. When a callback initiates, under this event model you cannot know whetheranother callback is executing. If a callback is executing, your code cannot tell whichcallback that is.
If a callback is executing and the user triggers an event for which a callback is defined,that callback attempts to interrupt the callback that is already executing. When thisoccurs, MATLAB software processes the callbacks according to the values of twoproperties:
• The Interruptible property of the object whose callback is already executing.The Interruptible property specifies whether the executing callback can beinterrupted. The default value for uicontrol objects is 'on', allowing interruption.
• The BusyAction property of the object whose callback has just been triggered and isabout to execute. The BusyAction property specifies whether to queue the callback toawait execution or cancel the callback. The default property value is 'queue'.
Note: For information about what callbacks are and do, see “Write Callbacks Using theProgrammatic Workflow” on page 11-5.

Interrupt Callback Execution
13-3
Order of Callback Execution
Interacting with figures and graphic objects can trigger a variety of callbacks. Morethan one callback can execute in response to a given user action, such as a button or keypress. In particular, figure window callbacks can respond to some of the same eventsas uicontrol, uipanel, and uitable callbacks. In most cases, the callbacks execute in awell-defined order. Some applications need to attend to the order of execution in orderto respond to user gestures appropriately and consistently, especially when severalcallbacks are triggered by the same gesture. The following list indicates the normal orderof execution of callbacks in response to mouse button presses and movements in figuresand graphic objects:
1 Figure WindowButtonMotionFcn (mouse button can be up or down; no similarcallback exists for objects)
2 Figure WindowButtonDownFcn3 Figure ButtonDownFcn4 Object Callback (if Enable is on for object)5 Object ButtonDownFcn (if Enable is off for object)6 Figure WindowButtonUpFcn (no similar callbacks exist)
A different set of callbacks exist to respond to keyboard events. Almost all keyboardcallbacks belong to figure windows. The following list indicates the normal order ofexecution of callbacks in response to keyboard events in figure windows and graphicobjects:
1 WindowKeyPressFcn (in figure window or any of its child objects)2 KeyPressFcn (figure window callback)3 KeyPressFcn (uicontrol and uitable callback)4 KeyReleaseFcn (in figure window only)5 WindowKeyReleaseFcn (in figure window or any of its child objects)
How the Interruptible Property Works
You can set an object's Interruptible property to either on (the default) or off.
If the Interruptible property of the object whose callback is executing is on, thecallback can be interrupted. However, it is interrupted only when it, or a function ittriggers, calls drawnow, figure, getframe, pause, or waitfor. Before performingtheir defined tasks, these functions process any events in the event queue, including any

13 Manage Callback Execution
13-4
waiting callbacks. If the executing callback, or a function it triggers, calls none of thesefunctions, it cannot be interrupted regardless of the value of its object's Interruptibleproperty.
If the Interruptible property of an object is set to 'off', then that object’s callbackcannot be interrupted, unless both of the following items are true:
• The callback calls drawnow, figure, getframe, pause, or waitfor.• The interrupting callback is a DeleteFcn, CloseRequestFcn, or SizeChangedFcn
callback.
MATLAB resumes the executing the running callback when the interrupting callbackcompletes.
The callback properties to which Interruptible can apply depend on the objects forwhich the callback properties are defined:
• For figures, the Interruptible property only affects callback routines defined forthese properties:
• ButtonDownFcn
• KeyPressFcn
• KeyReleaseFcn
• WindowButtonDownFcn
• WindowButtonMotionFcn
• WindowButtonUpFcn
• WindowScrollWheelFcn
For callbacks that execute continuously, setting the figure's Interruptible propertyto 'off' might be necessary if callbacks from other objects or GUIs could fire whilesuch interactions are occurring. The rationale is, do not interrupt callbacks thatcontinuously execute unless there is a specific reason to do so.
• For GUI components, Interruptible applies to these properties (for componentsthat have these properties):
• ButtonDownFcn
• Callback
• CellSelectionCallback
Interrupt Callback Execution
13-5
• KeyPressFcn
• SelectionChangedFcn
• ClickedCallback
• OffCallback
• OnCallback
To prevent an object’s callback from being interrupted repeatedly, set the value of thatobject’s Interruptible property to 'off':
h.Interruptible = 'off';
How the Busy Action Property Works
You can set an object's BusyAction property to either queue (the default) or cancel.The BusyAction property of the interrupting callback's object is taken into accountonly if the Interruptible property of the executing callback's object is off, i.e., theexecuting callback is not interruptible.
If a noninterruptible callback is executing and an event (such as a mouse click) triggers anew callback, MATLAB software examines the value of the BusyAction property of theobject that generated the new callback:
• If the BusyAction value is 'queue', the requested callback is added to the eventqueue and executes in its turn when the executing callback finishes execution.
• If the value is 'cancel', the event is discarded and the requested callback does notexecute.
If an interruptible callback is executing, the requested callback runs when the executingcallback terminates or calls drawnow, figure, getframe, pause, or waitfor. TheBusyAction property of the requested callback's object has no effect.
Example
This example demonstrates control of callback interruption using the Interruptibleand BusyAction properties. It creates two GUIs:
• The first GUI contains two push buttons:
• Wait (interruptible) whose Interruptible property is on• Wait (noninterruptible) whose Interruptible property is off

13 Manage Callback Execution
13-6
Clicking either button triggers the button's Callback callback, which creates andupdates a waitbar.
This code creates the two Wait buttons and specifies the callbacks that service them.
h_interrupt = uicontrol(h_panel1,'Style','pushbutton',...
'Position',[30,110,120,30],...
'String','Wait (interruptible)',...
'Interruptible','on',...
'Callback',@wait_interruptible);
h_noninterrupt = uicontrol(h_panel1,'Style','pushbutton',...
'Position',[30,40,120,30],...
'String','Wait (noninterruptible)',...
'Interruptible','off',...
'Callback',@wait_noninterruptible);
• The second GUI contains two push buttons:
• Surf Plot (queue) whose BusyAction property is queue• Mesh Plot (cancel) whose BusyAction property is cancel
Clicking either button triggers the button's Callback callback to generate a plot inthe axes.

Interrupt Callback Execution
13-7
This code creates the two plot buttons and specifies the callbacks that service them.
hsurf_queue = uicontrol(h_panel2,'Style','pushbutton',...
'Position',[30,200,110,30],...
'String','Surf Plot (queue)',...
'TooltipString','BusyAction = queue',...
'BusyAction','queue',...
'Callback',@surf_queue);
hmesh_cancel = uicontrol(h_panel2,'Style','pushbutton',...
'Position',[30,130,110,30],...
'String','Mesh Plot (cancel)',...
'BusyAction','cancel',...
'TooltipString','BusyAction = cancel',...
'Callback',@mesh_cancel);
Using the Example GUIs
Click here to run the example GUIs.

13 Manage Callback Execution
13-8
Note This link executes MATLAB commands and is designed to work withinthe MATLAB Help browser. If you are reading this online or in a PDF, go to thecorresponding section in the MATLAB Help Browser to use the link.
To see the interplay of the Interruptible and BusyAction properties:
1 Click one of the Wait buttons in the first GUI. Both buttons create and update awaitbar.
2 While the waitbar is active, click either the Surf Plot or the Mesh Plot button inthe second GUI. The Surf Plot button creates a surf plot using peaks data. TheMesh Plot button creates a mesh plot using the same data.
The following topics describe what happens when you click specific combinations ofbuttons:
Click a Wait Button
The Wait buttons are the same except for their Interruptible properties. TheirCallback callbacks, which are essentially the same, call the utility functioncreate_update_waitbar which calls waitbar to create and update a waitbar. TheWait (Interruptible) button Callback callback, wait_interruptible, can beinterrupted each time waitbar calls drawnow. The Wait (Noninterruptible) buttonCallback callback, wait_noninterruptible, cannot be interrupted (except by specificcallbacks listed in “How the Interruptible Property Works” on page 13-3).
This is the Wait (Interruptible) button Callback callback, wait_interruptible:
function wait_interruptible(hObject,eventdata)
% Disable the other push button.
h_noninterrupt.Enable = 'off';
% Clear the axes in the other GUI.
cla(h_axes2,'reset')
% Create and update the waitbar.
create_update_waitbar
% Enable the other push button
h_noninterrupt.Enable = 'on';
end
The callback first disables the other push button and clears the axes in the second GUI.It then calls the utility function create_update_waitbar to create and update awaitbar. When create_update_waitbar returns, it enables the other button.

Interrupt Callback Execution
13-9
Click a Plot Button
What happens when you click a Plot button depends on which Wait button you clickedfirst and the BusyAction property of the Plot button.
• If you click Surf Plot, whose BusyAction property is queue, MATLAB softwarequeues the Surf Plot callback surf_queue.
If you clicked the Wait (interruptible) button first, surf_queue runs and displaysthe surf plot when the waitbar issues a call to drawnow, terminates, or is destroyed.
If you clicked the Wait (noninterruptible) button first, surf_queue runs onlywhen the waitbar terminates or is destroyed.
This is the surf_queue callback:
function surf_queue(hObject,eventdata)
h_plot = surf(h_axes2,peaks_data);
end
• If you click Mesh Plot , whose BusyAction property is cancel, after having clickedWait (noninterruptible), MATLAB software discards the button click event anddoes not queue the mesh_cancel callback.
If you click Mesh Plot after having clicked Wait (interruptible), the Mesh PlotBusyAction property has no effect. MATLAB software queues the Mesh Plotcallback, mesh_cancel. It runs and displays the mesh plot when the waitbar issues acall to drawnow, terminates, or is destroyed.
This is the mesh_plot callback:
function mesh_cancel(hObject,eventdata)
h_plot = surf(h_axes2,peaks_data);
end
View the Complete GUI Code File
If you are reading this in the MATLAB Help browser, click here to display a completelisting of the code used in this example in the MATLAB Editor.
Note This link executes MATLAB commands and is designed to work withinthe MATLAB Help browser. If you are reading this online or in a PDF, go to thecorresponding section in the MATLAB Help Browser to use the links.

13 Manage Callback Execution
13-10
Control Program Execution Using Timer Objects
If you create a GUI that performs regularly scheduled tasks, such as acquiring data,updating a display, polling devices or services, or autosaving results, you can managethe activity with timers. Timers are MATLAB objects that time execution of functionsand programs. Timers have properties that you can customize for your application. Forexample, you can make them execute once or repeatedly, wait before running, and handledelays in execution. The following callbacks are among these properties.
CallbackProperty
Description Examples of Use
StartFcn Function the timer calls when itstarts
Open an input file or output file, orinitialize variables.
TimerFcn Timer callback function thattriggers actions that the timercontrols
Acquire new data or flush old data,or update a display.
StopFcn Function the timer calls when itstops
Close input or output files, orcompute statistics for session.
ErrorFcn Function that the timer executeswhen an error occurs (this functionexecutes before the StopFcn.).
Called when a timeout occurs. Youcan specify conditions under whichthis can happen.
You can include any of these callbacks in your GUI code file. Your code also needsto create and configure the timer object when your GUI opens, and delete the timerbefore your GUI closes. To start a timer, call its start method. The timer executes itsStartFcn, begins counting, and executes its first TimerFcn callback when the periodspecified by the StartDelay property expires. To halt a timer, call its stop method.
Caution Timers are independent objects that operate asynchronously, as do GUIs.A timer callback can change or even delete data used by your GUI code or code itcalls. It can also fail to execute due to timing out. If such possibilities exist for yourapplication, your code must guard against them. For example, it can test whether avariable continues to exist, or place code that can fail within try/catch blocks
For an example of a GUI that uses a timer, see “Automatically Refresh Plot in a GUIDEGUI”. For more information about setting up timers and controlling their run-timecharacteristics, see “Use a MATLAB Timer Object” and the timer reference page.

14
Examples of GUIs CreatedProgrammatically
• “Axes, Menus, and Toolbars in Programmatic GUIs” on page 14-2• “Synchronized Data Presentations in a Programmatic GUI” on page 14-12• “Lists of Items in a Programmatic GUI” on page 14-20• “GUI That Accepts and Returns Arguments” on page 14-32

14 Examples of GUIs Created Programmatically
14-2
Axes, Menus, and Toolbars in Programmatic GUIs
In this section...
“About the Example” on page 14-2“View the Example Code” on page 14-3“Generate the Graphing Commands and Data” on page 14-3“Create the GUI and Its Components” on page 14-4“Initialize the GUI” on page 14-7“Define the Callbacks” on page 14-8“Updating the Plot” on page 14-11
About the Example
When you run this GUI, it initially displays a plot of five random numbers generated bythe MATLAB rand(5) command.
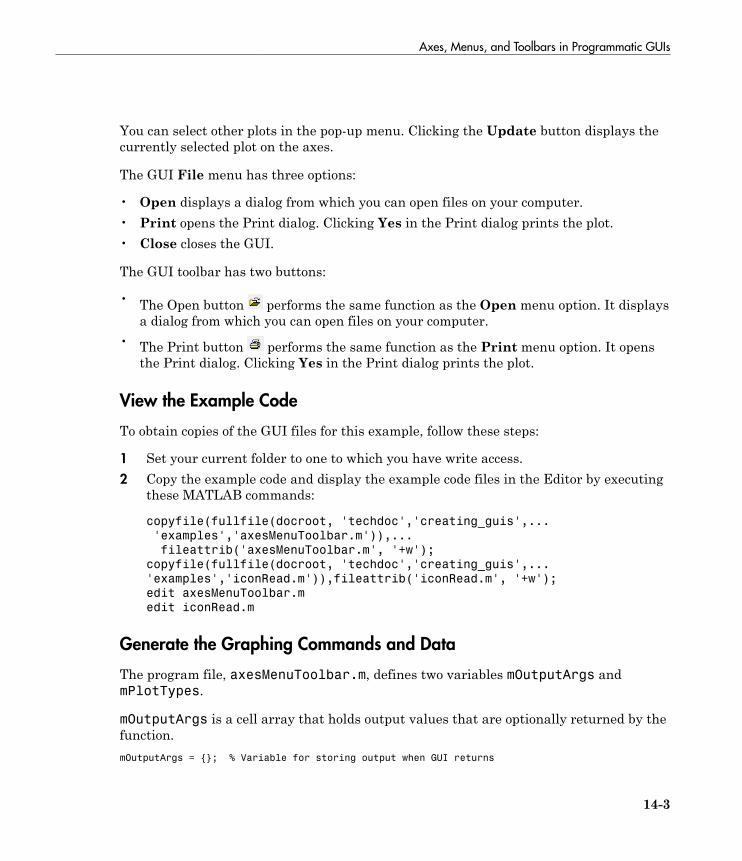
Axes, Menus, and Toolbars in Programmatic GUIs
14-3
You can select other plots in the pop-up menu. Clicking the Update button displays thecurrently selected plot on the axes.
The GUI File menu has three options:
• Open displays a dialog from which you can open files on your computer.• Print opens the Print dialog. Clicking Yes in the Print dialog prints the plot.• Close closes the GUI.
The GUI toolbar has two buttons:
• The Open button performs the same function as the Open menu option. It displaysa dialog from which you can open files on your computer.
• The Print button performs the same function as the Print menu option. It opensthe Print dialog. Clicking Yes in the Print dialog prints the plot.
View the Example Code
To obtain copies of the GUI files for this example, follow these steps:
1 Set your current folder to one to which you have write access.2 Copy the example code and display the example code files in the Editor by executing
these MATLAB commands:
copyfile(fullfile(docroot, 'techdoc','creating_guis',...
'examples','axesMenuToolbar.m')),...
fileattrib('axesMenuToolbar.m', '+w');
copyfile(fullfile(docroot, 'techdoc','creating_guis',...
'examples','iconRead.m')),fileattrib('iconRead.m', '+w');
edit axesMenuToolbar.m
edit iconRead.m
Generate the Graphing Commands and Data
The program file, axesMenuToolbar.m, defines two variables mOutputArgs andmPlotTypes.
mOutputArgs is a cell array that holds output values that are optionally returned by thefunction.mOutputArgs = {}; % Variable for storing output when GUI returns
14 Examples of GUIs Created Programmatically
14-4
mPlotTypes is a 5-by-2 cell array that specifies graphing functions and data. The firstcolumn contains the strings that are used to populate the pop-up menu. The secondcolumn contains functions (anonymous functions) for creating the plots.mPlotTypes = {... % Example plot types shown by this GUI
'plot(rand(5))', @(a)plot(a,rand(5));
'plot(sin(1:0.01:25))', @(a)plot(a,sin(1:0.01:25));
'bar(1:.5:10)', @(a)bar(a,1:.5:10);
'plot(membrane)', @(a)plot(a,membrane);
'surf(peaks)', @(a)surf(a,peaks)};
Because these variables are created in the main function, they are accessible from withinthe nested callback functions in the same file.
Create the GUI and Its Components
Like the mOutputArgs and mPlotTypes variables, the UI components are created insidethe main function, so they are accessible from within the nested callback functions in thesame file.
The Main Figure
This command creates the figure window:hMainFigure = figure(... % The main GUI figure
'MenuBar','none', ...
'Toolbar','none', ...
'HandleVisibility','callback', ...
'Color', get(groot,...
'defaultuicontrolbackgroundcolor'));
• Setting the MenuBar and Toolbar properties to 'none' prevents the default menusfrom displaying and hides the default toolbar.
• Setting the HandleVisibility property to 'callback' ensures that the figureobject can be accessed only from within a GUI callback.
• The Color property defines the background color of the figure. In this case, it is setto be the same as the default background color of uicontrol objects, such as theUpdate push button. The factory default background color of uicontrol objects isthe system default and can vary from system to system. This statement ensures thatthe figure's background color matches the background color of the components.
The Axes
This command creates the axes:

Axes, Menus, and Toolbars in Programmatic GUIs
14-5
hPlotAxes = axes(... % Axes for plotting the selected plot
'Parent', hMainFigure, ...
'Units', 'normalized', ...
'HandleVisibility','callback', ...
'Position',[0.11 0.13 0.80 0.67]);
• The axes function creates the axes. Setting the axes Parent property tohMainFigure makes it a child of the main figure.
• Setting the Units property to 'normalized' ensures that the axes resizesproportionately when the user resizes the figure window.
• The Position property is a 4-element vector that specifies the location of the axeswithin the figure and its size: [distance from left, distance from bottom, width,height].
The Pop-Up Menu
This command creates the pop-up menu:hPlotsPopupmenu = uicontrol(... % List of available types of plot
'Parent', hMainFigure, ...
'Units','normalized',...
'Position',[0.11 0.85 0.45 0.1],...
'HandleVisibility','callback', ...
'String',mPlotTypes(:,1),...
'Style','popupmenu');
• The uicontrol function creates various user interface controls based on the value ofthe Style property. Here, the Style property is set to 'popupmenu'.
• For a pop-up menu, the String property defines the list of items in the menu. Here itis defined as a 5-by-1 cell array of strings derived from the cell array mPlotTypes.
The Update Push Button
This command creates the Update push button:hUpdateButton = uicontrol(... % Button for updating selected plot
'Parent', hMainFigure, ...
'Units','normalized',...
'HandleVisibility','callback', ...
'Position',[0.6 0.85 0.3 0.1],...
'String','Update',...
'Callback', @hUpdateButtonCallback);
• The uicontrol function creates various user interface controls based on the valueof the Style property. This statement does not set the Style property because itsdefault is 'pushbutton'.
14 Examples of GUIs Created Programmatically
14-6
• For a push button, the String property defines the label on the button. Here it isdefined as the string, 'Update'.
• Setting the Callback property to @hUpdateButtonCallback specifies the function,hUpdateButtonCallback to be the function that executes when the user presses thepush button. This callback function is a nested function in the same file.
The File Menu and Its Menu Items
These statements define the File menu and the three items it contains.
hFileMenu = uimenu(... % File menu
'Parent',hMainFigure,...
'HandleVisibility','callback', ...
'Label','File');
hOpenMenuitem = uimenu(... % Open menu item
'Parent',hFileMenu,...
'Label','Open',...
'HandleVisibility','callback', ...
'Callback', @hOpenMenuitemCallback);
hPrintMenuitem = uimenu(... % Print menu item
'Parent',hFileMenu,...
'Label','Print',...
'HandleVisibility','callback', ...
'Callback', @hPrintMenuitemCallback);
hCloseMenuitem = uimenu(... % Close menu item
'Parent',hFileMenu,...
'Label','Close',...
'Separator','on',...
'HandleVisibility','callback', ...
'Callback', @hCloseMenuitemCallback);
• The uimenu function creates both the main menu, File, and the menu items underit. For the main menu and each of its items, set the Parent property to the handle ofthe desired parent to create the menu hierarchy you want. Here, setting the Parentproperty of the File menu to hMainFigure makes it the child of the main figure. Thisstatement creates a menu bar in the figure and puts the File menu on it.
For each of the menu items, setting its Parent property to the handle of the parentmenu, hFileMenu, causes it to appear on the File menu.
• The Label property defines the text label for each menu item.• Setting the Separator property to 'on' for creates a separator line above a menu
item.
Axes, Menus, and Toolbars in Programmatic GUIs
14-7
• For each of the menu items, the Callback property specifies the callback thatservices that item. These callbacks are defined as nested functions in the same file.
The Toolbar
These statements define the toolbar and the two buttons it contains:hToolbar = uitoolbar(... % Toolbar for Open and Print buttons
'Parent',hMainFigure, ...
'HandleVisibility','callback');
hOpenPushtool = uipushtool(... % Open toolbar button
'Parent',hToolbar,...
'TooltipString','Open File',...
'CData',iconRead(fullfile(matlabroot,...
'toolbox\matlab\icons\opendoc.mat')),...
'HandleVisibility','callback', ...
'ClickedCallback', @hOpenMenuitemCallback);
hPrintPushtool = uipushtool(... % Print toolbar button
'Parent',hToolbar,...
'TooltipString','Print Figure',...
'CData',iconRead(fullfile(matlabroot,...
'toolbox\matlab\icons\printdoc.mat')),...
'HandleVisibility','callback', ...
'ClickedCallback', @hPrintMenuitemCallback);
• The uitoolbar function creates the toolbar.• The uipushtool function creates the two push buttons in the toolbar.• The uipushtool TooltipString property assigns a tool tip that displays when the
user moves the mouse pointer over the button and leaves it there.• The CData property specifies a truecolor image that displays on the button. For these
two buttons, the utility iconRead function supplies the image.• For each of the uipushtools, the ClickedCallback property specifies the callback
that executes when the user clicks the buttons.
Initialize the GUI
This code creates the plot that appears when the GUI initially displays. This code alsochecks to see if the user provided an output argument.% Update the plot with the initial plot type
localUpdatePlot();
% Define default output and return it if it is requested by users
mOutputArgs{1} = hMainFigure;
if nargout>0
[varargout{1:nargout}] = mOutputArgs{:};
14 Examples of GUIs Created Programmatically
14-8
end
• The localUpdatePlot function creates a plot in the axes. The localUpdatePlotfunction gets the pop-up menu’s Value property to determine which plot the userselected.
• The default output argument is the handle of the main figure.
Define the Callbacks
This topic defines the callbacks that service the components of the GUI. Because thecallback definitions are nested, they have access to all data and components defined inthe main function.
Although the GUI has six components that are serviced by callbacks, there are only fourcallback functions. This is because the Open menu item and the Open toolbar button share the same callbacks. Similarly, the Print menu item and the Print toolbar button
share the same callbacks.
Update Button Callback
The hUpdateButtonCallback function services the Update push button. Clicking theUpdate button triggers the execution of this callback function.
function hUpdateButtonCallback(hObject, eventdata)
% Callback function run when the Update button is pressed
localUpdatePlot();
end
Open Menu Item Callback
The hOpenMenuitemCallback function services the Open menu item and the Opentoolbar button . Selecting the menu item or clicking the toolbar button triggers theexecution of this callback function.
function hOpenMenuitemCallback(hObject,eventdata)
% Callback function run when the Open menu item is selected
file = uigetfile('*.m');
if ~isequal(file, 0)
open(file);
end

Axes, Menus, and Toolbars in Programmatic GUIs
14-9
end
The hOpenMenuitemCallback function first calls the uigetfile function to open thestandard dialog box for retrieving files. This dialog box lists all files having the extension.fig. If uigetfile returns a file name, the function then calls the open function toopen it.
Print Menu Item Callback
The hPrintMenuitemCallback function services the Print menu item and the Printtoolbar button . Selecting the menu item or clicking the toolbar button triggers theexecution of this callback function.
function hPrintMenuitemCallback(hObject, eventdata)
% Callback function run when the Print menu item is selected
printdlg(hMainFigure);
end
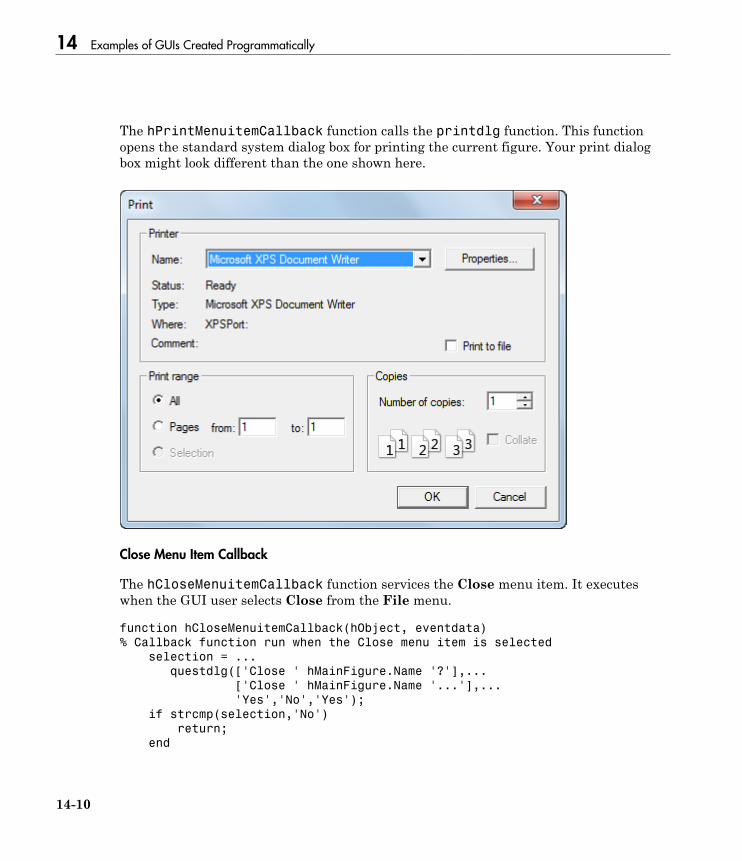
14 Examples of GUIs Created Programmatically
14-10
The hPrintMenuitemCallback function calls the printdlg function. This functionopens the standard system dialog box for printing the current figure. Your print dialogbox might look different than the one shown here.
Close Menu Item Callback
The hCloseMenuitemCallback function services the Close menu item. It executeswhen the GUI user selects Close from the File menu.
function hCloseMenuitemCallback(hObject, eventdata)
% Callback function run when the Close menu item is selected
selection = ...
questdlg(['Close ' hMainFigure.Name '?'],...
['Close ' hMainFigure.Name '...'],...
'Yes','No','Yes');
if strcmp(selection,'No')
return;
end

Axes, Menus, and Toolbars in Programmatic GUIs
14-11
delete(hMainFigure);
end
The hCloseMenuitemCallback function calls the questdlg function to create andopen the question dialog box shown in the following figure.
If the user clicks the No button, the callback returns. If the GUI user clicks the Yesbutton, the callback deletes the GUI.
Updating the Plot
Here is the code for the localUpdatePlot function. Because it is a nested function,localUpdatePlot has access to the same data and UI components as the other callbackfunctions.
function localUpdatePlot
% Helper function for plotting the selected plot type
mPlotTypes{hPlotsPopupmenu.Value, 2}(hPlotAxes);
end
The localUpdatePlot function gets the pop-up menu Value property to identify theselected menu item from the first column of the mPlotTypes 5-by-2 cell array. Then,localUpdatePlot calls the corresponding anonymous function from the second columnin the cell array.
See AlsoAxes Properties | Figure Properties | Uicontrol Properties
More About• “Anonymous Functions”
14 Examples of GUIs Created Programmatically
14-12
Synchronized Data Presentations in a Programmatic GUI
In this section...
“Techniques Illustrated in the Example” on page 14-12“About the Example” on page 14-12“View the Example Code” on page 14-14“Set Up and Interact with the uitable” on page 14-14
Techniques Illustrated in the Example
The example shows how to interact with a uitable and the data it holds by:
• Graphing specific columns of data• Brushing the graph when the user selects cells in the table
A 2-D axes displays line graphs of the data in response to selecting check boxes and inreal time, the results of selecting observations in the table.
About the Example
The example GUI presents data in a three-column table (a uitable object) and enablesthe user to plot any column of data as a line graph. When the user selects data values inthe table, the plot displays markers for the selected observations.
This figure shows the results of plotting two columns and selecting a subset of values ineach column.
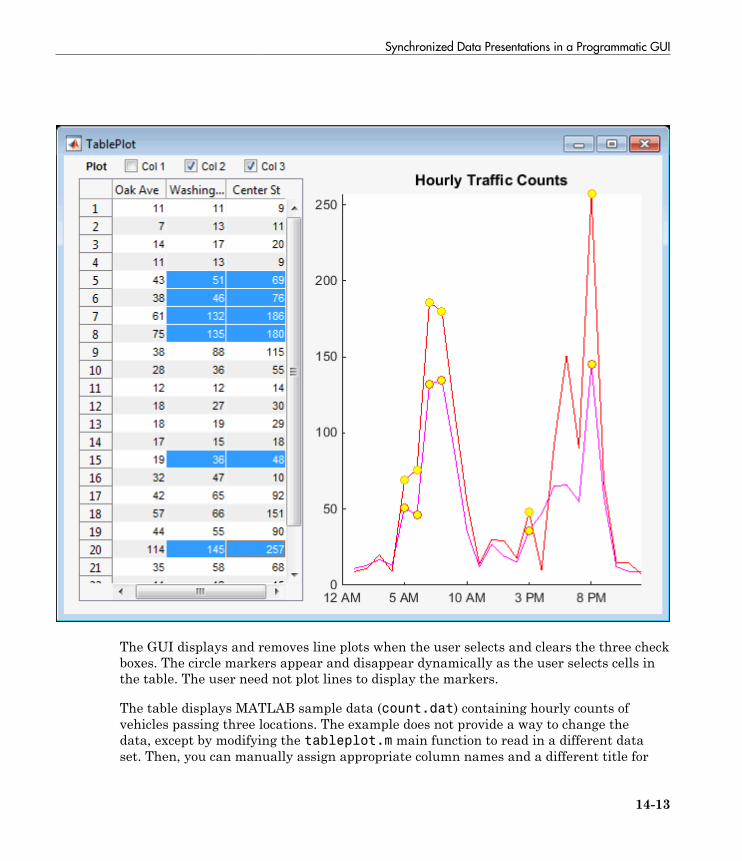
Synchronized Data Presentations in a Programmatic GUI
14-13
The GUI displays and removes line plots when the user selects and clears the three checkboxes. The circle markers appear and disappear dynamically as the user selects cells inthe table. The user need not plot lines to display the markers.
The table displays MATLAB sample data (count.dat) containing hourly counts ofvehicles passing three locations. The example does not provide a way to change thedata, except by modifying the tableplot.m main function to read in a different dataset. Then, you can manually assign appropriate column names and a different title for

14 Examples of GUIs Created Programmatically
14-14
the plot. A more natural way to add this capability is to allow the user to supply inputarguments to the GUI to identify a data file or workspace variable, and to supply textstrings to use for column headers.
View the Example Code
To obtain copies of the GUI files for this example, follow these steps:
1 Set your current folder to one to which you have write access.2 Copy the example code and display it in the Editor by issuing the following MATLAB
commands:
copyfile(fullfile(docroot, 'techdoc','creating_guis',...
'examples','tableplot.m')),...
fileattrib('tableplot.m', '+w');
edit tableplot.m
Set Up and Interact with the uitable
This example has one file, tableplot.m, that contains its main function plus two localfunctions (uicontrol callbacks). The main tableplot function creates a figure andpopulates it with uicontrols and one axes.
The function hides the figure's menu bar because it is not needed.
% Create a figure that will have a uitable, axes and checkboxes
figure('Position', [100, 300, 600, 460],...
'Name', 'TablePlot',... % Title figure
'NumberTitle', 'off',... % Do not show figure number
'MenuBar', 'none'); % Hide standard menu bar menus
The main tableplot function sets up the uitable immediately after loading a datamatrix into the workspace. The table's size adapts to the matrix size (matrices foruitables must be 1-D or 2-D).
% Load some tabular data (traffic counts from somewhere)
count = load('count.dat');
tablesize = size(count); % This demo data is 24-by-3
% Define parameters for a uitable (col headers are fictional)
colnames = {'Oak Ave', 'Washington St', 'Center St'};
% All column contain numeric data (integers, actually)
colfmt = {'numeric', 'numeric', 'numeric'};

Synchronized Data Presentations in a Programmatic GUI
14-15
% Disallow editing values (but this can be changed)
coledit = [false false false];
% Set columns all the same width (must be in pixels)
colwdt = {60 60 60};
% Create a uitable on the left side of the figure
htable = uitable('Units', 'normalized',...
'Position', [0.025 0.03 0.375 0.92],...
'Data', count,...
'ColumnName', colnames,...
'ColumnFormat', colfmt,...
'ColumnWidth', colwdt,...
'ColumnEditable', coledit,...
'ToolTipString',...
'Select cells to highlight them on the plot',...
'CellSelectionCallback',{@select_callback});
The tableplot function performs these tasks:
• Passes the count matrix to the table as the Data parameter.• Specifies the column names using the ColumnName property• Specifies that all columns hold numeric data using the ColumnFormat property• Specifies that all columns have a width of 60 pixels
MATLAB always interprets the ColumnWidth property in pixels• Provides a tooltip string for the table• Accepts default values for most of the remaining Uitable Properties.
In the next block of code, the tableplot function sets up an axes on the right side of thefigure. It plots lines and markers in response to the user's actions.
% Create an axes on the right side; set x and y limits to the
% table value extremes, and format labels for the demo data.
haxes = axes('Units', 'normalized',...
'Position', [.465 .065 .50 .85],...
'XLim', [0 tablesize(1)],...
'YLim', [0 max(max(count))],...
'XLimMode', 'manual',...
'YLimMode', 'manual',...
'XTickLabel',...
{'12 AM','5 AM','10 AM','3 PM','8 PM'});
title(haxes, 'Hourly Traffic Counts') % Describe data set
% Prevent axes from clearing when new lines or markers are plotted
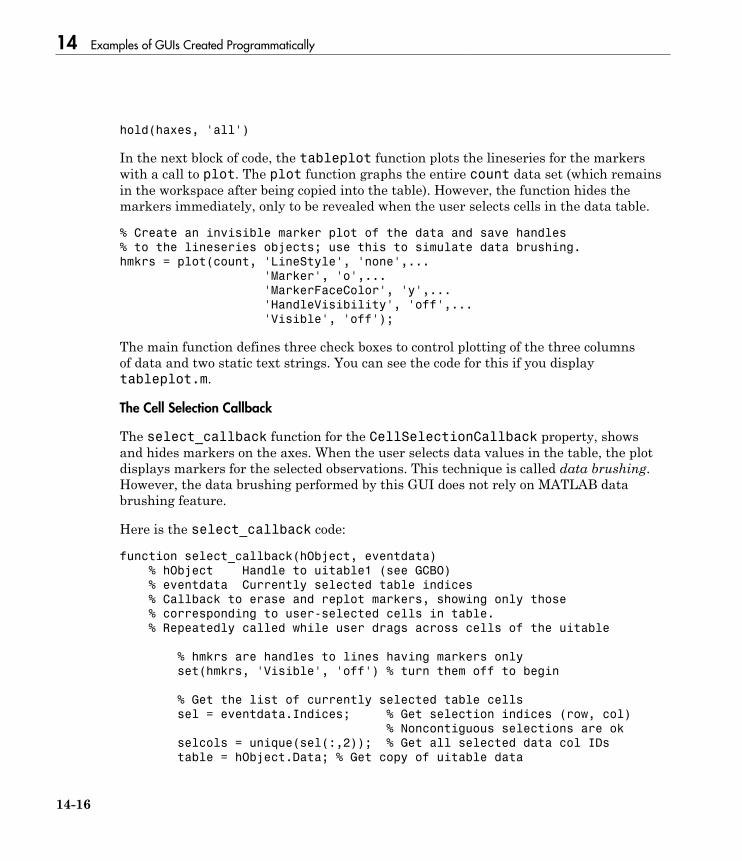
14 Examples of GUIs Created Programmatically
14-16
hold(haxes, 'all')
In the next block of code, the tableplot function plots the lineseries for the markerswith a call to plot. The plot function graphs the entire count data set (which remainsin the workspace after being copied into the table). However, the function hides themarkers immediately, only to be revealed when the user selects cells in the data table.
% Create an invisible marker plot of the data and save handles
% to the lineseries objects; use this to simulate data brushing.
hmkrs = plot(count, 'LineStyle', 'none',...
'Marker', 'o',...
'MarkerFaceColor', 'y',...
'HandleVisibility', 'off',...
'Visible', 'off');
The main function defines three check boxes to control plotting of the three columnsof data and two static text strings. You can see the code for this if you displaytableplot.m.
The Cell Selection Callback
The select_callback function for the CellSelectionCallback property, showsand hides markers on the axes. When the user selects data values in the table, the plotdisplays markers for the selected observations. This technique is called data brushing.However, the data brushing performed by this GUI does not rely on MATLAB databrushing feature.
Here is the select_callback code:
function select_callback(hObject, eventdata)
% hObject Handle to uitable1 (see GCBO)
% eventdata Currently selected table indices
% Callback to erase and replot markers, showing only those
% corresponding to user-selected cells in table.
% Repeatedly called while user drags across cells of the uitable
% hmkrs are handles to lines having markers only
set(hmkrs, 'Visible', 'off') % turn them off to begin
% Get the list of currently selected table cells
sel = eventdata.Indices; % Get selection indices (row, col)
% Noncontiguous selections are ok
selcols = unique(sel(:,2)); % Get all selected data col IDs
table = hObject.Data; % Get copy of uitable data

Synchronized Data Presentations in a Programmatic GUI
14-17
% Get vectors of x,y values for each column in the selection;
for idx = 1:numel(selcols)
col = selcols(idx);
xvals = sel(:,1);
xvals(sel(:,2) ~= col) = [];
yvals = table(xvals, col)';
% Create Z-vals = 1 in order to plot markers above lines
zvals = col*ones(size(xvals));
% Plot markers for xvals and yvals using a line object
hmkrs(col).Visible = 'on';.
hmkrs(col).XData = xvals;
hmkrs(col).YData = yvals;
hmkrs(col).ZData = zvals;
end
end
The function passes the rows and columns of the user-selected cells ineventdata.Indices and copies them into sel. For example, if the user selects all threecolumns in row 3 of the table, then
eventdata =
Indices: [3x2 double]
sel =
3 1
3 2
3 3
If the user selects rows 5, 6, and 7 of columns 2 and 3, then
eventdata =
Indices: [6x2 double]
sel =
5 2
5 3
6 2
6 3
7 2
7 3
After hiding all the markers, the callback performs these tasks:
1 Identifies the unique columns that the user selected.2 Iterates over the unique columns to find the row indices for the selection.

14 Examples of GUIs Created Programmatically
14-18
3 Sets the x-values for all row indices that do not appear in the selection to empty.4 Uses the vector of x-values to copy y-values from the table and specify dummy z-
values.
Setting the z-values ensures that the markers plot on top of the lines.5 Assigns x-, y-, and z-values to the XData, YData, and ZData of each vector of
markers, and makes the markers visible again.
Only markers with nonempty data display.
The Plot Check Box callback
The three Plot check boxes all share the same callback, plot_callback. It has acolumn argument in addition to the standard hObject and eventdata parameters. Thecolumn argument identifies which box (and column of data) the callback is for.
The plot_callback also uses handles found in the function workspace for the followingpurposes:
• htable — To fetch table data and column names for plotting the data and deletinglines; the column argument identifies which column to draw or erase.
• haxes — To draw lines and delete lines from the axes.• hprompt — To remove the prompt (which only displays until the first line is plotted)
from the axes.
Keying on the column argument, the callback takes the following actions:
• Extracts data from the table and calls plot, specifying data from the given column asYData, and setting its DisplayName property to the column's name.
• Deletes the appropriate line from the plot when a check box is deselected, based onthe line's DisplayName property.
Here is the plot_callback code:
function plot_callback(hObject, eventdata, column)
% hObject Handle to Plot menu
% eventdata Not used
% column Number of column to plot or clear
colors = {'b','m','r'}; % Use consistent color for lines
colnames = htable.ColumnName;

Synchronized Data Presentations in a Programmatic GUI
14-19
colname = colnames{column};
if (hObject.Value)
% Turn off the advisory text; it never comes back
hprompt.Visible = 'off';
% Obtain the data for that column
ydata = htable.Data;
haxes.NextPlot = 'Add';
% Draw the line plot for column
plot(haxes, ydata(:,column),...
'DisplayName', colname,...
'Color', colors{column});
else % Adding a line to the plot
% Find the lineseries object and delete it
delete(findobj(haxes, 'DisplayName', colname))
end
end

14 Examples of GUIs Created Programmatically
14-20
Lists of Items in a Programmatic GUI
In this section...
“About the Example” on page 14-20“View the Example Code” on page 14-21“Use the GUI” on page 14-22“Program List Master” on page 14-25“Add an “Import from File” Option to List Master” on page 14-31“Add a “Rename List” Option to List Master” on page 14-31
About the Example
This GUI creates and manages lists, such as to-do lists, phone numbers, or any set ofitems. It has these features:
• Ability to create new GUIs from an existing List Master GUI• A scrolling list box containing a numbered or unnumbered sequence of items• A text box and push buttons enabling GUI users to edit, add, delete, and reorder list
items• Capability to import and export list data and to save a list by saving the GUI itself• A File menu for creating, opening, and saving GUIs.
The left image below shows the items available under the File menu. The right imageshows a sample list.
The File Menu Items GUI Containing a Sample List

Lists of Items in a Programmatic GUI
14-21
View the Example Code
The example includes one code file, two MAT-files and a text file:
• listmaster.m — The GUI code file, containing all required local functions• listmaster_icons.mat — Three icons, used as CData for push buttons• senators110cong.mat — A cell array containing phone book entries for United
States senators• senators110th.txt — A text file containing the same data as
senators110cong.mat
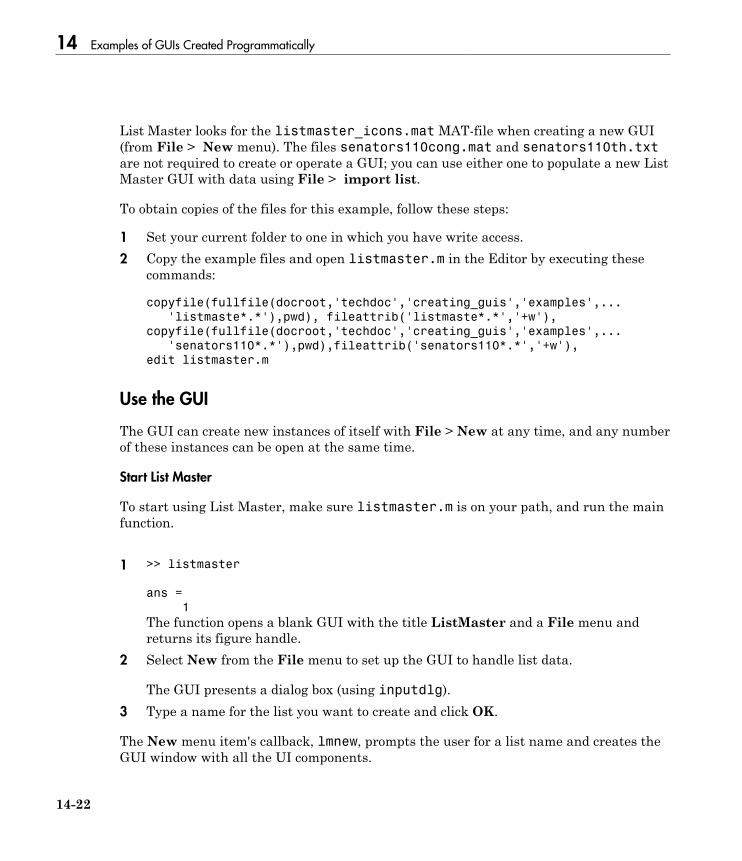
14 Examples of GUIs Created Programmatically
14-22
List Master looks for the listmaster_icons.mat MAT-file when creating a new GUI(from File > New menu). The files senators110cong.mat and senators110th.txtare not required to create or operate a GUI; you can use either one to populate a new ListMaster GUI with data using File > import list.
To obtain copies of the files for this example, follow these steps:
1 Set your current folder to one in which you have write access.2 Copy the example files and open listmaster.m in the Editor by executing these
commands:
copyfile(fullfile(docroot,'techdoc','creating_guis','examples',...
'listmaste*.*'),pwd), fileattrib('listmaste*.*','+w'),
copyfile(fullfile(docroot,'techdoc','creating_guis','examples',...
'senators110*.*'),pwd),fileattrib('senators110*.*','+w'),
edit listmaster.m
Use the GUI
The GUI can create new instances of itself with File > New at any time, and any numberof these instances can be open at the same time.
Start List Master
To start using List Master, make sure listmaster.m is on your path, and run the mainfunction.
1 >> listmaster
ans =
1
The function opens a blank GUI with the title ListMaster and a File menu andreturns its figure handle.
2 Select New from the File menu to set up the GUI to handle list data.
The GUI presents a dialog box (using inputdlg).3 Type a name for the list you want to create and click OK.
The New menu item's callback, lmnew, prompts the user for a list name and creates theGUI window with all the UI components.

Lists of Items in a Programmatic GUI
14-23
Because the positions of all controls are specified in normalized Units, the GUI isresizable. Only the button icons and the text fonts have a fixed size.
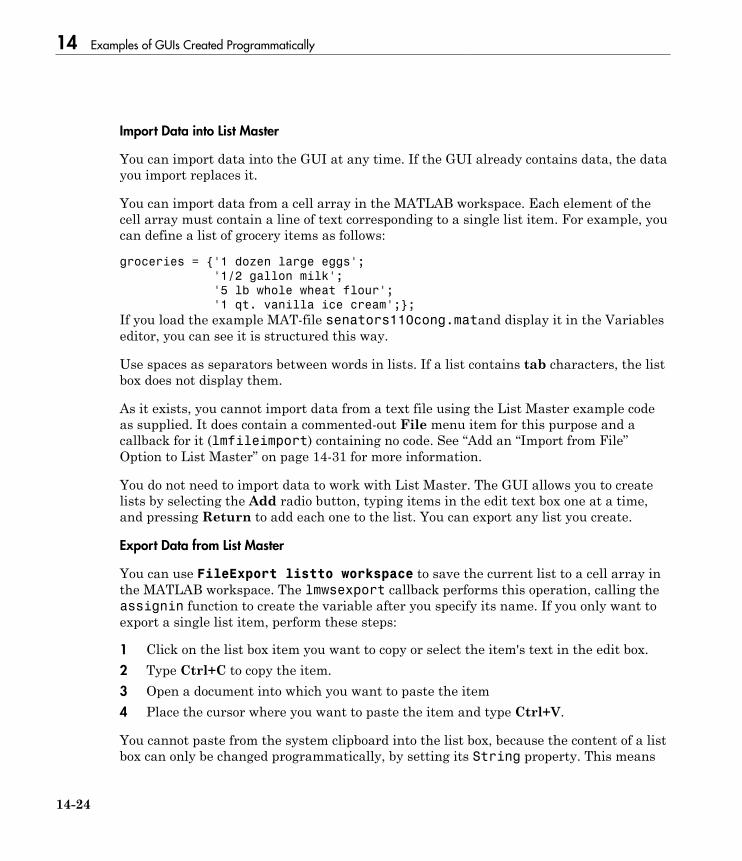
14 Examples of GUIs Created Programmatically
14-24
Import Data into List Master
You can import data into the GUI at any time. If the GUI already contains data, the datayou import replaces it.
You can import data from a cell array in the MATLAB workspace. Each element of thecell array must contain a line of text corresponding to a single list item. For example, youcan define a list of grocery items as follows:
groceries = {'1 dozen large eggs';
'1/2 gallon milk';
'5 lb whole wheat flour';
'1 qt. vanilla ice cream';};
If you load the example MAT-file senators110cong.matand display it in the Variableseditor, you can see it is structured this way.
Use spaces as separators between words in lists. If a list contains tab characters, the listbox does not display them.
As it exists, you cannot import data from a text file using the List Master example codeas supplied. It does contain a commented-out File menu item for this purpose and acallback for it (lmfileimport) containing no code. See “Add an “Import from File”Option to List Master” on page 14-31 for more information.
You do not need to import data to work with List Master. The GUI allows you to createlists by selecting the Add radio button, typing items in the edit text box one at a time,and pressing Return to add each one to the list. You can export any list you create.
Export Data from List Master
You can use FileExport listto workspace to save the current list to a cell array inthe MATLAB workspace. The lmwsexport callback performs this operation, calling theassignin function to create the variable after you specify its name. If you only want toexport a single list item, perform these steps:
1 Click on the list box item you want to copy or select the item's text in the edit box.2 Type Ctrl+C to copy the item.3 Open a document into which you want to paste the item4 Place the cursor where you want to paste the item and type Ctrl+V.
You cannot paste from the system clipboard into the list box, because the content of a listbox can only be changed programmatically, by setting its String property. This means

Lists of Items in a Programmatic GUI
14-25
that to paste new items into a list, you must add them one at a time via the edit text box.It also means you cannot copy the entire list and then paste it into another document.
You can save the entire contents of a list to a text file using File > Export list > to file.That menu item's callback (lmfileexport) opens a standard file dialog to navigate to afolder and specify a file name. Then, lmfileexport calls fopen, fprintf, and fcloseto create, write, and close the file.
Save the GUI
You do not need to export a list to save it. The Save and Save as menu options savelists by saving the entire GUI. They call the saveas function to write the figure and allits contents as a FIG-file to disk. You can reopen the saved GUI by double-clicking itin the Current Folder browser, or by calling hgload('figfilename.fig') from theCommand Line.
Program List Master
The List Master GUI code file contains 22 functions, organized into five groups, whichare described below.
List Master Main Program
The main function, listmaster, opens a figure window. Then, listmaster calls thelocal function, lm_make_file_menu, to create the File menu. The following tabledescribes the menu items and lists their callbacks.
Menu Item How Used Callback
Open... Opens an existing List Master figure lmopen
New... Creates a List Master by adding controlsto the initial GUI or to a new figure if theexisting one already contains a list
lmnew
Importlist...
Loads list data from a workspace cell array lmwsimport
Exportlist...
Creates a cell array or text file containing thecurrent list
lmwsexport,lmfileexport
Save Saves current List Master and its contents asa FIG-file
lmsave
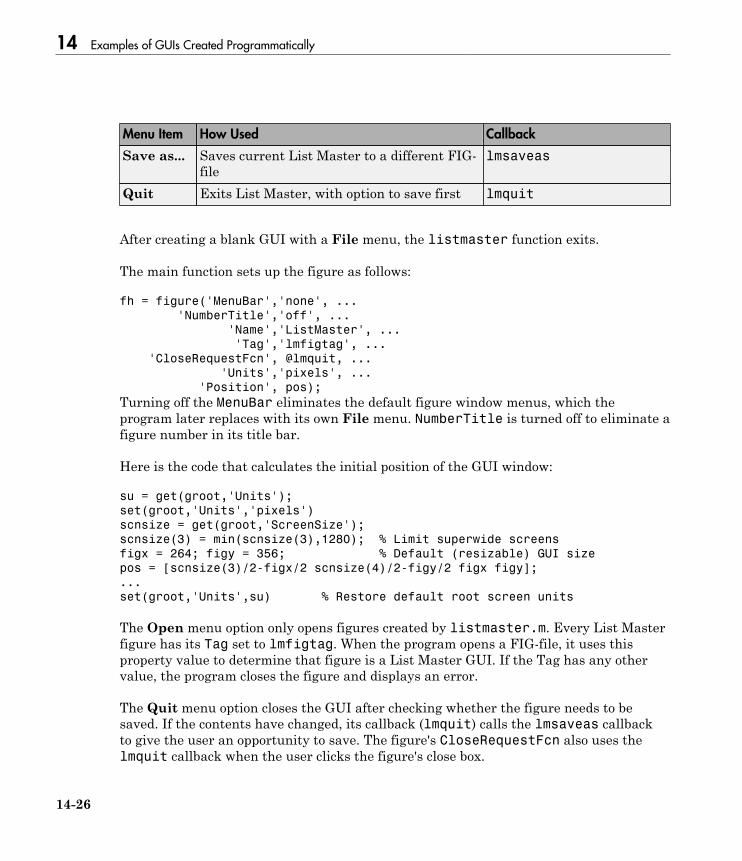
14 Examples of GUIs Created Programmatically
14-26
Menu Item How Used Callback
Save as... Saves current List Master to a different FIG-file
lmsaveas
Quit Exits List Master, with option to save first lmquit
After creating a blank GUI with a File menu, the listmaster function exits.
The main function sets up the figure as follows:
fh = figure('MenuBar','none', ...
'NumberTitle','off', ...
'Name','ListMaster', ...
'Tag','lmfigtag', ...
'CloseRequestFcn', @lmquit, ...
'Units','pixels', ...
'Position', pos);
Turning off the MenuBar eliminates the default figure window menus, which theprogram later replaces with its own File menu. NumberTitle is turned off to eliminate afigure number in its title bar.
Here is the code that calculates the initial position of the GUI window:
su = get(groot,'Units');
set(groot,'Units','pixels')
scnsize = get(groot,'ScreenSize');
scnsize(3) = min(scnsize(3),1280); % Limit superwide screens
figx = 264; figy = 356; % Default (resizable) GUI size
pos = [scnsize(3)/2-figx/2 scnsize(4)/2-figy/2 figx figy];
...
set(groot,'Units',su) % Restore default root screen units
The Open menu option only opens figures created by listmaster.m. Every List Masterfigure has its Tag set to lmfigtag. When the program opens a FIG-file, it uses thisproperty value to determine that figure is a List Master GUI. If the Tag has any othervalue, the program closes the figure and displays an error.
The Quit menu option closes the GUI after checking whether the figure needs to besaved. If the contents have changed, its callback (lmquit) calls the lmsaveas callbackto give the user an opportunity to save. The figure's CloseRequestFcn also uses thelmquit callback when the user clicks the figure's close box.
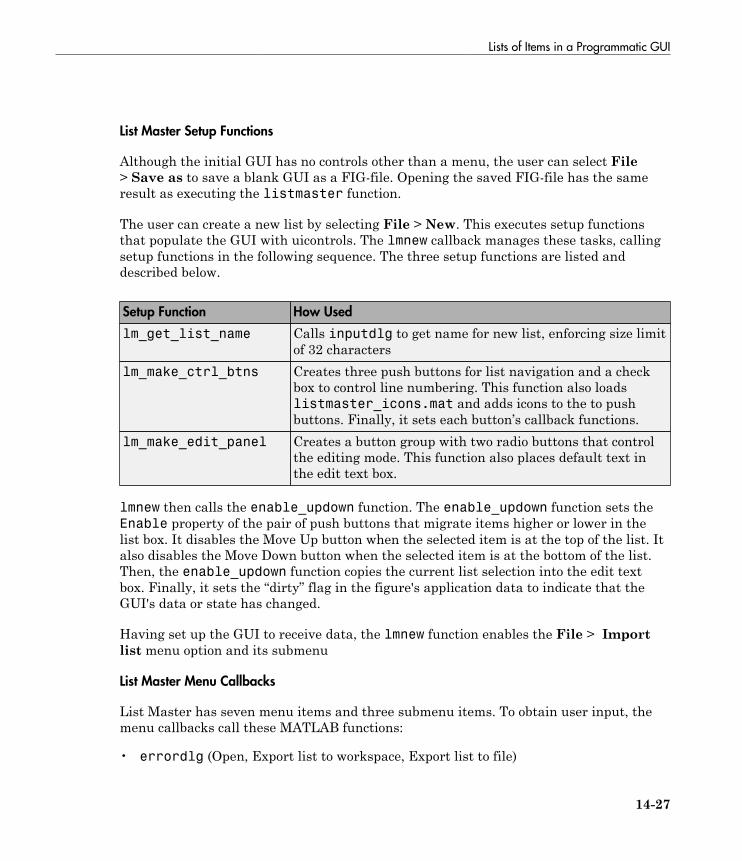
Lists of Items in a Programmatic GUI
14-27
List Master Setup Functions
Although the initial GUI has no controls other than a menu, the user can select File> Save as to save a blank GUI as a FIG-file. Opening the saved FIG-file has the sameresult as executing the listmaster function.
The user can create a new list by selecting File > New. This executes setup functionsthat populate the GUI with uicontrols. The lmnew callback manages these tasks, callingsetup functions in the following sequence. The three setup functions are listed anddescribed below.
Setup Function How Used
lm_get_list_name Calls inputdlg to get name for new list, enforcing size limitof 32 characters
lm_make_ctrl_btns Creates three push buttons for list navigation and a checkbox to control line numbering. This function also loadslistmaster_icons.mat and adds icons to the to pushbuttons. Finally, it sets each button’s callback functions.
lm_make_edit_panel Creates a button group with two radio buttons that controlthe editing mode. This function also places default text inthe edit text box.
lmnew then calls the enable_updown function. The enable_updown function sets theEnable property of the pair of push buttons that migrate items higher or lower in thelist box. It disables the Move Up button when the selected item is at the top of the list. Italso disables the Move Down button when the selected item is at the bottom of the list.Then, the enable_updown function copies the current list selection into the edit textbox. Finally, it sets the “dirty” flag in the figure's application data to indicate that theGUI's data or state has changed.
Having set up the GUI to receive data, the lmnew function enables the File > Importlist menu option and its submenu
List Master Menu Callbacks
List Master has seven menu items and three submenu items. To obtain user input, themenu callbacks call these MATLAB functions:
• errordlg (Open, Export list to workspace, Export list to file)
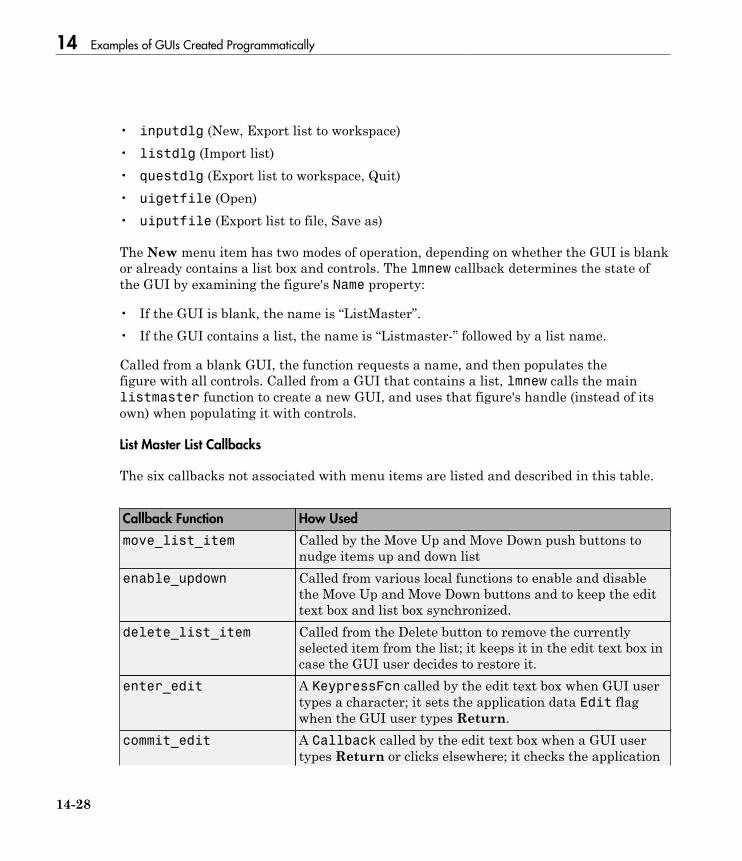
14 Examples of GUIs Created Programmatically
14-28
• inputdlg (New, Export list to workspace)• listdlg (Import list)• questdlg (Export list to workspace, Quit)• uigetfile (Open)• uiputfile (Export list to file, Save as)
The New menu item has two modes of operation, depending on whether the GUI is blankor already contains a list box and controls. The lmnew callback determines the state ofthe GUI by examining the figure's Name property:
• If the GUI is blank, the name is “ListMaster”.• If the GUI contains a list, the name is “Listmaster-” followed by a list name.
Called from a blank GUI, the function requests a name, and then populates thefigure with all controls. Called from a GUI that contains a list, lmnew calls the mainlistmaster function to create a new GUI, and uses that figure's handle (instead of itsown) when populating it with controls.
List Master List Callbacks
The six callbacks not associated with menu items are listed and described in this table.
Callback Function How Used
move_list_item Called by the Move Up and Move Down push buttons tonudge items up and down list
enable_updown Called from various local functions to enable and disablethe Move Up and Move Down buttons and to keep the edittext box and list box synchronized.
delete_list_item Called from the Delete button to remove the currentlyselected item from the list; it keeps it in the edit text box incase the GUI user decides to restore it.
enter_edit A KeypressFcn called by the edit text box when GUI usertypes a character; it sets the application data Edit flagwhen the GUI user types Return.
commit_edit A Callback called by the edit text box when a GUI usertypes Return or clicks elsewhere; it checks the application
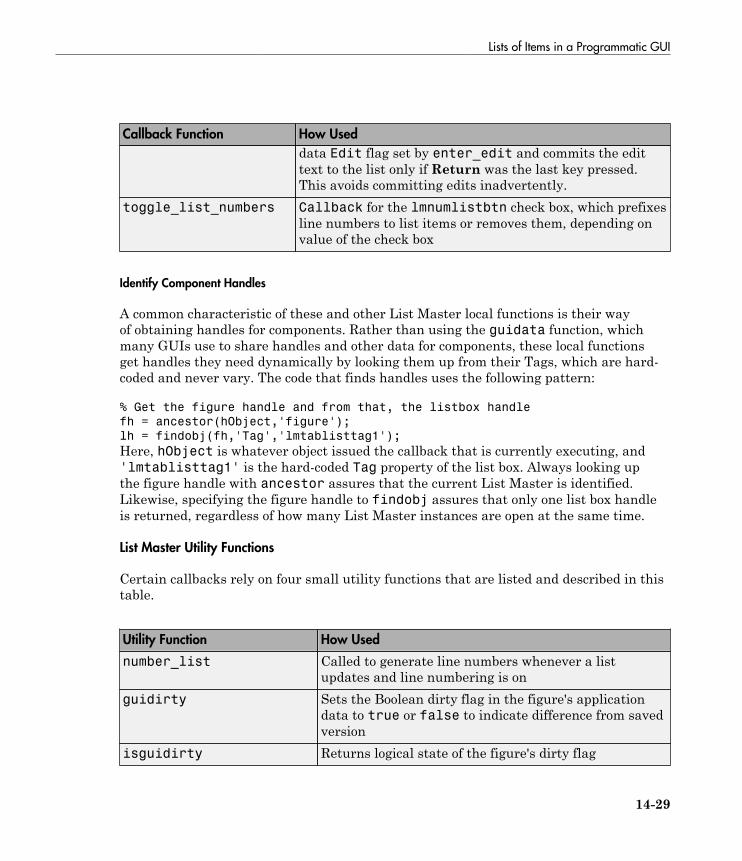
Lists of Items in a Programmatic GUI
14-29
Callback Function How Used
data Edit flag set by enter_edit and commits the edittext to the list only if Return was the last key pressed.This avoids committing edits inadvertently.
toggle_list_numbers Callback for the lmnumlistbtn check box, which prefixesline numbers to list items or removes them, depending onvalue of the check box
Identify Component Handles
A common characteristic of these and other List Master local functions is their wayof obtaining handles for components. Rather than using the guidata function, whichmany GUIs use to share handles and other data for components, these local functionsget handles they need dynamically by looking them up from their Tags, which are hard-coded and never vary. The code that finds handles uses the following pattern:
% Get the figure handle and from that, the listbox handle
fh = ancestor(hObject,'figure');
lh = findobj(fh,'Tag','lmtablisttag1');
Here, hObject is whatever object issued the callback that is currently executing, and'lmtablisttag1' is the hard-coded Tag property of the list box. Always looking upthe figure handle with ancestor assures that the current List Master is identified.Likewise, specifying the figure handle to findobj assures that only one list box handleis returned, regardless of how many List Master instances are open at the same time.
List Master Utility Functions
Certain callbacks rely on four small utility functions that are listed and described in thistable.
Utility Function How Used
number_list Called to generate line numbers whenever a listupdates and line numbering is on
guidirty Sets the Boolean dirty flag in the figure's applicationdata to true or false to indicate difference from savedversion
isguidirty Returns logical state of the figure's dirty flag

14 Examples of GUIs Created Programmatically
14-30
Utility Function How Used
make_list_output_name Converts the name of a list (obtained from the figureName property) into a valid MATLAB identifier, whichserves as a default when saving the GUI or exporting itsdata
List numbering works by adding five spaces before each list entry, then substitutingnumerals for characters 3, 2, and 1 of these blanks (as needed to display the digits) andplacing a period in character 4. The numbers are stripped off the copy of the currentitem that displays in the text edit box, and then prepended again when the edit iscommitted (if the Number list check box is selected). This limits the size of lists thatcan be numbered to 999 items. You can modify number_list to add characters to thenumber field if you want the GUI to number lists longer than that.
Note: You should turn off the numbering feature before importing list data if the itemson that list are already numbered. In such cases, the item numbers display in the list,but moving list items up or down in the list does not renumber them.
The guidirty function sets the figure's application data using setappdata to indicatethat it has been modified, as follows:
function guidirty(fh,yes_no)
% Sets the "Dirty" flag of the figure to true or false
setappdata(fh,'Dirty',yes_no);
% Also disable or enable the File->Save item according to yes_no
saveitem = findobj(fh,'Label','Save');
if yes_no
if isgraphics(saveitem)
saveitem.Enable = 'on';
end
else
if isgraphics(saveitem)
saveitem.Enable = 'off';
end
end
The isguidirty function queries the application data with getappdata to determinewhether the figure needs to be saved in response to closing the GUI.

Lists of Items in a Programmatic GUI
14-31
Add an “Import from File” Option to List Master
If you want to round out List Master's capabilities, try activating the File > Import list> from file menu item. You can add this feature yourself by removing comments fromlines 106-108 (enabling a File > Import list > from file menu item) and adding yourown code to the callback. For related code that you can use as a starting point, see thelmfileexport callback for File > Export list > to file.
Add a “Rename List” Option to List Master
When you import data to a list, you replace the entire contents of the list with theimported text. If the content of the new list is very different, you might want to givea new name to the list. (The list name appears above the list box). Consider adding amenu item or context menu item, such as Rename list. The callback for this item mightperform these tasks:
• Call lm_get_list_name to get a name from the GUI user (perhaps after modifying itto let the caller specify the prompt string.)
• Do nothing if the GUI user cancels the dialog.• Obtain the handle of the uipanel with tag 'lmtitlepaneltag'.• Set the Title property of the uipanel to the string that the user specifies.
After renaming the list, the user can save the GUI to a new FIG-file by selecting Saveas. If the GUI had been saved previously, saving it to a new file preserves that version ofthe GUI with its original name and contents.

14 Examples of GUIs Created Programmatically
14-32
GUI That Accepts and Returns ArgumentsIn this section...
“About the Example” on page 14-32“Copy and View the Color Palette Code” on page 14-34“Local Function Summary for Color Palette” on page 14-34“Code File Organization” on page 14-35“GUI Programming Techniques” on page 14-36
About the Example
This example shows how to create a GUI that supports optional input and outputarguments. The example also shows how to present a standard color selection dialog boxto the user.
Use the Color Palette
These are the basic steps for using the color palette.

GUI That Accepts and Returns Arguments
14-33
1 Clicking a color cell toggle button makes the program perform these actions:
• Display the selected color in the preview area.• Display the red, green, and blue values for the newly selected color are displayed
in the R, G, and B fields in the GUI.2 Clicking the Eraser toggle button is equivalent to selecting no color.3 Clicking the More Colors button displays a second dialog box containing more
colors.
4 Clicking the close box on the main dialog returns a function handle. You can call thereturned function to get the RGB values of the selected color. For example, this codecalls the ColorPalette program, which returns a function handle in the variable,getmycolor. The second line calls getmycolor to get the RGB values.
getmycolor = colorPalette;
rgb = getmycolor();
The getmycolor function returns a 1-by-3 vector of values. It returns a NaN value ifthe user selects the Eraser button.
Call the colorPalette Function With Input Arguments
You can call the colorPalette function with input arguments:
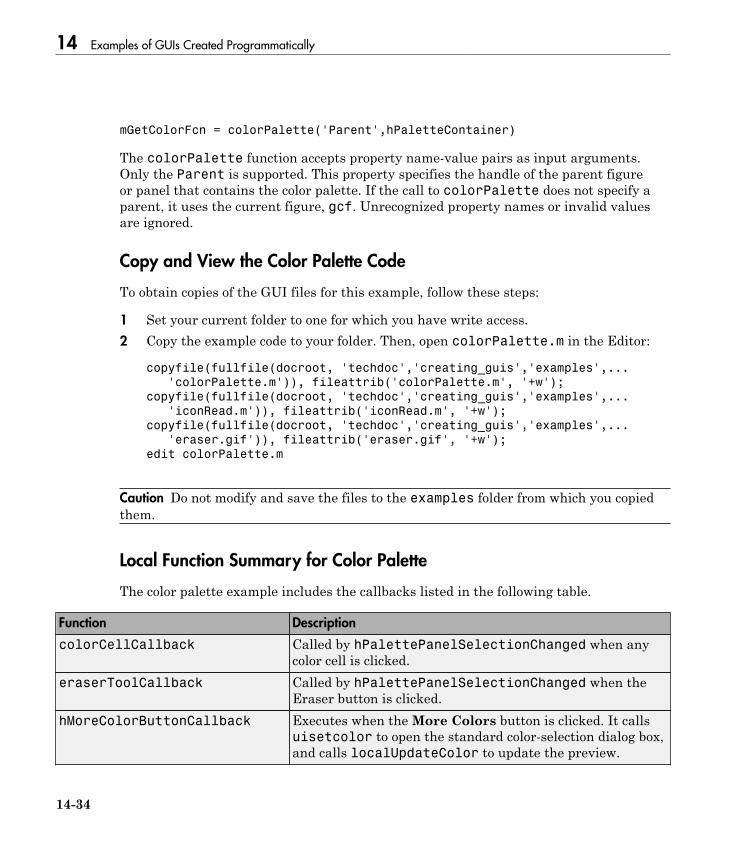
14 Examples of GUIs Created Programmatically
14-34
mGetColorFcn = colorPalette('Parent',hPaletteContainer)
The colorPalette function accepts property name-value pairs as input arguments.Only the Parent is supported. This property specifies the handle of the parent figureor panel that contains the color palette. If the call to colorPalette does not specify aparent, it uses the current figure, gcf. Unrecognized property names or invalid valuesare ignored.
Copy and View the Color Palette Code
To obtain copies of the GUI files for this example, follow these steps:
1 Set your current folder to one for which you have write access.2 Copy the example code to your folder. Then, open colorPalette.m in the Editor:
copyfile(fullfile(docroot, 'techdoc','creating_guis','examples',...
'colorPalette.m')), fileattrib('colorPalette.m', '+w');
copyfile(fullfile(docroot, 'techdoc','creating_guis','examples',...
'iconRead.m')), fileattrib('iconRead.m', '+w');
copyfile(fullfile(docroot, 'techdoc','creating_guis','examples',...
'eraser.gif')), fileattrib('eraser.gif', '+w');
edit colorPalette.m
Caution Do not modify and save the files to the examples folder from which you copiedthem.
Local Function Summary for Color Palette
The color palette example includes the callbacks listed in the following table.
Function Description
colorCellCallback Called by hPalettePanelSelectionChanged when anycolor cell is clicked.
eraserToolCallback Called by hPalettePanelSelectionChanged when theEraser button is clicked.
hMoreColorButtonCallback Executes when the More Colors button is clicked. It callsuisetcolor to open the standard color-selection dialog box,and calls localUpdateColor to update the preview.

GUI That Accepts and Returns Arguments
14-35
Function Description
hPalettePanelSelectionChangedExecutes when the GUI user clicks on a new color. This isthe SectionChangeFcn callback of the uibuttongroupthat exclusively manages the tools and color cells that itcontains. It calls the appropriate callback to service each ofthe tools and color cells.
The example also includes the helper functions listed in this table.
Function Description
layoutComponent Dynamically creates the Eraser tool and the color cells inthe palette. It calls localDefineLayout.
localUpdateColor Updates the preview of the selected color.getSelectedColor Returns the currently selected color which is then
returned to the colorPalette caller.localDefineLayout Calculates the preferred color cell and tool sizes
for the GUI. It calls localDefineColors andlocalDefineTools
localDefineTools Defines the tools shown in the palette. In this example,the only tool is the Eraser button.
localDefineColors Defines the colors that are shown in the array of colorcells.
processUserInputs Determines if the property in a property-value pair issupported. It calls localValidateInput.
localValidateInput Validates the value in a property-value pair.
Code File Organization
The color palette code uses nested functions. Its code file is organized in the followingsequence:
1 Comments displayed in response to the help command.2 Data creation. Because the example uses nested functions, defining this data at the
top level makes the data accessible to all functions without having to pass them asarguments.
3 Command line input processing.

14 Examples of GUIs Created Programmatically
14-36
4 GUI figure and component creation.5 GUI initialization.6 Callback definitions. These callbacks, which service the GUI components, are local
functions of the colorPalette main function and so have access to the data andcomponent handles created at the top level, without their having to be passed asarguments.
7 Helper function definitions. These helper functions are local functions of thecolorPalette main function and so have access to the data and component handlescreated at the top level, without their having to be passed as arguments.
GUI Programming Techniques
This topic explains the following GUI programming techniques as they are used in thecreation of the colorPalette.
• “Pass Input Arguments to a GUI” on page 14-36• “Pass Output to a Caller on Returning” on page 14-37
Pass Input Arguments to a GUI
Inputs to the GUI are custom property-value pairs. colorPalette allows one suchproperty: Parent. The names are case-insensitive. The colorPalette syntax is
mGetColorFcn = colorPalette('Parent',hPaletteContainer)
Definition and Initialization of the Properties
The colorPalette function first defines a variable mInputArgs as varargin to acceptthe GUI user input arguments.
mInputArgs = varargin; % Command line arguments when invoking
% the GUI
The colorPalette function then defines the valid custom properties in a 3-by-3 cellarray.mPropertyDefs = {... % The supported custom property/value
% pairs of this GUI
'parent', @localValidateInput, 'mPaletteParent';
• The first column contains the property name.

GUI That Accepts and Returns Arguments
14-37
• The second column contains a function handle for the function,localValidateInput, that validates the input property values.
• The third column is the local variable that holds the value of the property.
colorPalette then initializes the properties with default values.mPaletteParent = []; % Use input property 'parent' to initialize
Process the Input Arguments
The processUserInputs helper function processes the input property-value pairs.colorPalette calls processUserInputs before it creates the components, todetermine the parent of the components.
% Process the command line input arguments supplied when
% the GUI is invoked
processUserInputs();
1 processUserInputs sequences through the inputs, if any, and tries to match eachproperty name to a string in the first column of the mPropertyDefs cell array.
2 If it finds a match, processUserInputs assigns the value that was input for theproperty to its variable in the third column of the mPropertyDefs cell array.
3 processUserInputs then calls the helper function specified in the second columnof the mPropertyDefs cell array to validate the value that was passed in for theproperty.
Pass Output to a Caller on Returning
If a host GUI calls the colorPalette function with an output argument, it returns afunction handle that the host GUI can call to get the currently selected color.
The host GUI calls colorPalette only once. The call creates the color palette in thespecified parent and then returns the function handle.
The data definition section of the colorPalette code file creates a cell array to hold theoutput:mOutputArgs = {}; % Variable for storing output when GUI returns
Just before returning, colorPalette assigns the function handle,mgetSelectedColor, to the cell array mOutputArgs and then assigns mOutputArgs tovarargout to return the arguments.

14 Examples of GUIs Created Programmatically
14-38
mOutputArgs{} = @getSelectedColor;
if nargout>0
[varargout{1:nargout}] = mOutputArgs{:};
end
15
Apps
• “Find Apps” on page 15-2• “View App File List” on page 15-3• “Run, Uninstall, Reinstall, and Install Apps” on page 15-5• “Install Apps in a Shared Network Location” on page 15-7• “Change Apps Installation Folder” on page 15-8
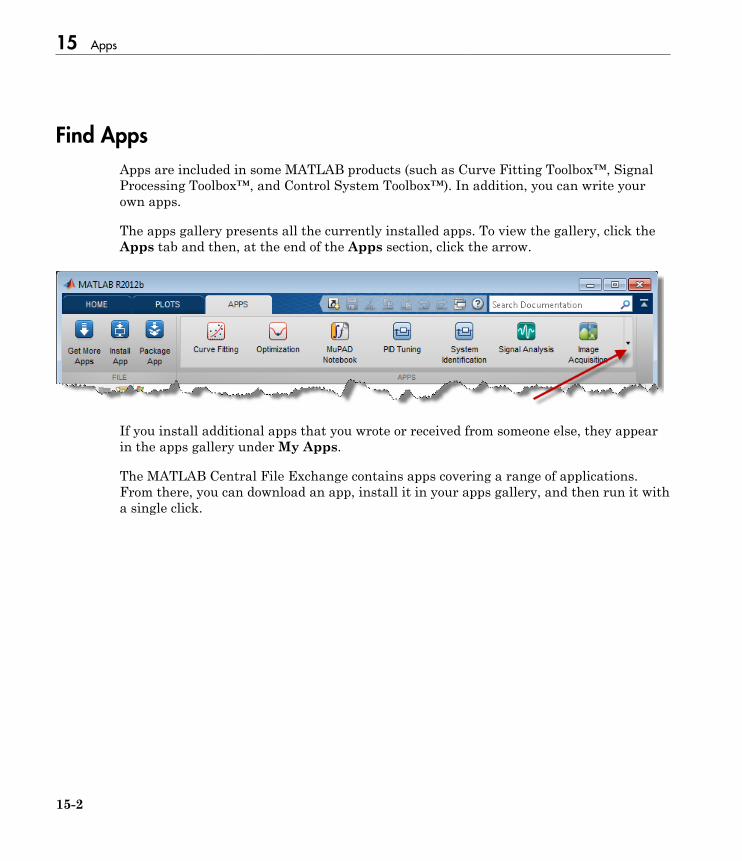
15 Apps
15-2
Find Apps
Apps are included in some MATLAB products (such as Curve Fitting Toolbox™, SignalProcessing Toolbox™, and Control System Toolbox™). In addition, you can write yourown apps.
The apps gallery presents all the currently installed apps. To view the gallery, click theApps tab and then, at the end of the Apps section, click the arrow.
If you install additional apps that you wrote or received from someone else, they appearin the apps gallery under My Apps.
The MATLAB Central File Exchange contains apps covering a range of applications.From there, you can download an app, install it in your apps gallery, and then run it witha single click.

View App File List
15-3
View App File List
In this section...
“Before Installing” on page 15-3“After Installing” on page 15-3
Before Installing
Before installing an app you or someone else wrote, you can view the list of app files:
1 In the Current Folder browser, navigate to the folder to which you downloaded theapp.
2 Right-click the .mlappinstall file and select Show Details.3 At the bottom of the Current Folder browser, in the Details panel, click the View
File List expander .
MATLAB displays the list of files in the app.
After Installing
After installing an app you or someone else wrote, you can see the list of app files and thecontents of each file:
1 Click the desktop Apps tab.2 Click the down arrow at the end of the Apps section .3 Under My Apps, hover over the installed app.4 Within the tooltip, click the View File List expander .
MATLAB displays a list of links to the source files.5 Click a file link.
The file opens in the MATLAB Editor.
Note: Be aware that if you modify the files in an app, the app behavior can change.If you modify files, and then want to revert back to the original app, reinstall the
15 Apps
15-4
original .mlappinstall file. For information on locating the.mlappinstall file,see “Change Apps Installation Folder” on page 15-8.

Run, Uninstall, Reinstall, and Install Apps
15-5
Run, Uninstall, Reinstall, and Install Apps
In this section...
“Run App” on page 15-5“Install or Reinstall App” on page 15-5“Uninstall App” on page 15-6
Run App
To run an installed app (those that install with MathWorks products and apps that youinstalled separately):
1 On the desktop toolstrip, click the Apps tab.2 At the end of the Apps section, click the down arrow .3 In the apps gallery, browse the apps to find the one you want to run.
Hover over an app button to see a tooltip describing the app.4 Click the app button.
You can run multiple custom apps concurrently, including multiple instances of the sameapp.
Install or Reinstall App
To install or reinstall an app that you or someone else wrote:
1 On the desktop toolstrip, click the Apps tab.2 In the File section, click Install App.3 In the Install App dialog box, specify a MATLAB app installer (.mlappinstall)
file, and then click Open.4 In the App Installer dialog box, click Install or Reinstall.
MATLAB installs or reinstalls the app and displays it in the apps gallery.
When you install an app using the .mlappinstall file, MATLAB manages theMATLAB path for you, so you can run the app from the apps gallery without makingadjustments to your desktop environment.

15 Apps
15-6
Uninstall App
To uninstall an app that appears in the apps gallery under My Apps:
1 On the desktop toolstrip, click the Apps tab.2 On the far right of the Apps section, click the down arrow .3 In the apps gallery, under My Apps, right-click the app, and select Uninstall.
Hover over an app button to see a tooltip describing the app.
MATLAB deletes the app code from disk and removes the app from the apps gallery.

Install Apps in a Shared Network Location
15-7
Install Apps in a Shared Network Location
If you are responsible for administering MATLAB software for your business group,you might consider installing apps in a shared network location. This can be useful, forinstance, if a member of your technical staff creates GUIs and packages them as appsthat several staff members use. You control installation, upgrades, and deinstallation toensure every staff member uses the same version of each app.
1 Install each app within the same write-protected, shared network folder.2 Direct staff members to change their apps preferences to specify the network folder
as the apps installation folder.
For details, see “Change Apps Installation Folder”.
As needed, reinstall an app to upgrade it to a new version or revert it to an earlierversion. When an app is no longer used, you can uninstall it. For details see, “Install orReinstall App” on page 15-5 and “Uninstall App” on page 15-6.
15 Apps
15-8
Change Apps Installation Folder
By default, MATLAB installs apps from .mlappinstall files in the userpath \Apps\appname folder. The userpath is the path returned by userpath, and appname is thename of the installed app (sometimes with an additional character added to the name).
To change the apps installation folder:
1 On the Home tab, in the Environment section, click Preferences > MATLAB > Apps.
2 In the Apps Install Folder field, specify a folder name to which you have writeaccess.
3 Click OK.
Note: If you change the app installation folder, then apps installed prior to the change(other than those installed with MATLAB products) are no longer accessible from theapps gallery. To make those apps accessible again, move their appname folders andcontents to the new installation folder, and then restart MATLAB.

16
Packaging GUIs as Apps
• “Apps Overview” on page 16-2• “Package Apps” on page 16-5• “Modify Apps” on page 16-7• “Share Apps” on page 16-8• “MATLAB App Installer File — mlappinstall” on page 16-9• “Dependency Analysis” on page 16-10
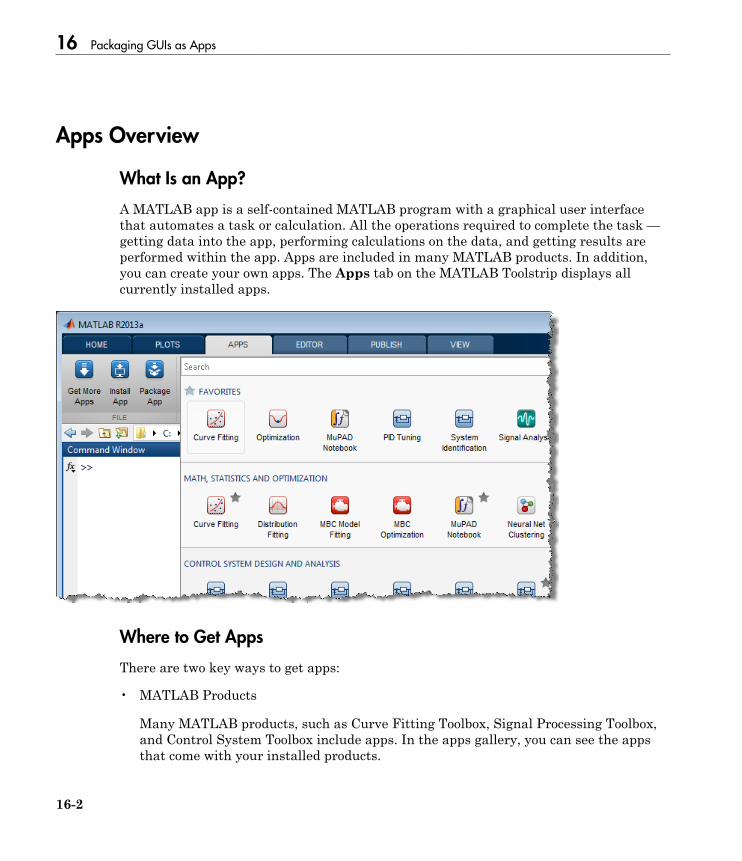
16 Packaging GUIs as Apps
16-2
Apps Overview
What Is an App?
A MATLAB app is a self-contained MATLAB program with a graphical user interfacethat automates a task or calculation. All the operations required to complete the task —getting data into the app, performing calculations on the data, and getting results areperformed within the app. Apps are included in many MATLAB products. In addition,you can create your own apps. The Apps tab on the MATLAB Toolstrip displays allcurrently installed apps.
Where to Get Apps
There are two key ways to get apps:
• MATLAB Products
Many MATLAB products, such as Curve Fitting Toolbox, Signal Processing Toolbox,and Control System Toolbox include apps. In the apps gallery, you can see the appsthat come with your installed products.

Apps Overview
16-3
• Create Your Own
You can create your own MATLAB app and package it into a single file that you candistribute to others. The apps packaging tool automatically finds and includes all thefiles needed for your app. It also identifies any MATLAB products required to runyour app.
You can share your app directly with other users, or share it with the MATLABuser community by uploading it to the MATLAB File Exchange. When others installyour app, they do not need to be concerned with the MATLAB search path or otherinstallation details.
Watch this video for an introduction to creating apps:
Packaging and Installing MATLAB Apps (2 min, 58 sec)
Tip User-contributed code (including some apps) is available from the MATLAB FileExchange. You may also find functions and example code there that is useful as afoundation for an app you want to build.
Why Create an App?
When you create an app package, MATLAB creates a single app installation file(.mlappinstall) that enables you and others to easily install your app.
In particular, when you package an app, the app packaging tool:
• Performs a dependency analysis to help you find and add the files your app requires• Reminds you to add shared resources and helper files• Stores information you provide about your app with the app package, including a
description, a list of additional MATLAB products required by your app, and a list ofsupported platforms
• Automates app updates (versioning)
In addition when others install your app:
• It is a one-click installation.• Users do not need to manage the MATLAB search path or other installation details.• Your app appears alongside MATLAB toolbox apps in the apps gallery.

16 Packaging GUIs as Apps
16-4
Best Practices and Requirements for Creating an App
Best practices:
• An app should be an interactive application written in the MATLAB language thathas a graphical user interface.
• All interaction with the app should be through the graphical user interface.• The app should be reusable. A user should not have to restart the app to use different
data or inputs with it.• The main function should return the handle of the main figure. (The main function
created by GUIDE returns the figure handle by default.)
Although not a requirement, doing so enables MATLAB to remove the app files fromthe search path when users exit the app.
• If you want to share your app on MATLAB File Exchange you must release it undera BSD license — in addition, there are restrictions on the use of binary files such asMEX-files, p-coded files or DLLs.
Requirements:
• The main file must be a function (not a script).• Because you invoke apps by clicking an icon in the apps gallery, the main function
cannot have input arguments. (It can, however, take optional arguments.)

Package Apps
16-5
Package Apps
Package GUIs you create into an app package for sharing with others. When you createan app package MATLAB creates a single app installation file (.mlappinstall) thatenables you and others to install your app and access it from the apps gallery withoutconcern for installation details or the MATLAB path.
Note: As you enter information in the Package Apps dialog box, MATLAB creates andsaves a .prj file continuously. A .prj file contains information about your app, suchas included files and a description. Therefore, if you exit the dialog box before clickingthe Package button, the .prj file remains, even though a .mlappinstall file is notcreated. This enables you to quit and resume the app creation process where you left off.
To create an app installation file:
1 On the desktop Toolstrip, click the Apps tab.2 In the File section, click Package App.3 Click Add main file and specify the file that you use to run your GUI.
The main file must be callable with no input, and must be a function or method, nota script. MATLAB analyzes the main file to determine other MATLAB files on whichthe main file depends. For more information, see “Dependency Analysis” on page16-10.
Tip The main file must return your main GUI’s figure handle if you want MATLABto remove your app files from the search path when end users exit the GUI. For moreinformation, see “What Is the MATLAB Search Path?”
(Functions created by GUIDE return the figure handle.)4 Add additional files needed to run your GUI, by clicking Add files/folders.
Such files might be data, image, and other files that were not included viadependency analysis.
You can include external interfaces, such as MEX-files, ActiveX, or Java® in the.mlappinstall file, although doing so might restrict the systems on which yourapp can run.

16 Packaging GUIs as Apps
16-6
5 Describe your app.
Minimally, you must specify an app name. MATLAB uses the name for the.mlappinstall file and to label your app in the apps gallery if you install the app.
Click the icon to the left of the App Name field to select an icon for your app or tospecify a custom icon. MATLAB automatically scales the icon for use in the Installdialog, App gallery, and quick access toolbar.
After you create the package, when you select a .mlappinstall file in the CurrentFolder browser, MATLAB displays the app description in the Details panel. Thedescription also displays in MATLAB Central File Exchange, if you decide to shareyour app there. The screen shot you select represents your app in File Exchange.
6 Click Package.
As part of the app packaging process, MATLAB creates a .prj file that containsinformation about your app, such as included files and a description. The .prjfile enables you to update the files in your app without requiring you to respecifydescriptive information about the app.
7 In the Build dialog box, note the location of the installation file (.mlappinstall),and then click Close.
For information on installing the app, see “Install or Reinstall App” on page 15-5.

Modify Apps
16-7
Modify Apps
When you update the files included in a .mlappinstall file, you recreate and overwritethe original app. You cannot maintain two versions of the same app.
To update files in an app you created:
1 In the Current Folder browser, navigate to the folder containing the project file(.prj) that MATLAB created when you packaged the app.
By default, MATLAB writes the .prj file to the folder that was the current folderwhen you packaged the app.
2 From the Current Folder browser, double-click the project file for your app package,appname.prj
The Package App dialog box opens.3 Adjust the information in the dialog box to reflect your changes by doing any or all of
the following:
• If you made code changes, add the main file again, and refresh the files includedthrough analysis.
• If your code calls additional files that are not included through analysis, addthem.
• If you want anyone who installs your app over a previous installation to beinformed that the content is different, change the version.
Version numbers must be a combination of integers and periods, and can includeup to three periods — 2.3.5.2, for example.
Anyone who attempts to install a revision of your app over another version isnotified that the version number is changed and has the opportunity to continueor cancel the installation.
4 Click Package.

16 Packaging GUIs as Apps
16-8
Share Apps
To share your app with others you only need to give them the .mlappinstall file. Allfiles you added when you packaged the app are included in the .mlappinstall file.When the recipients install your app, they do not need to be concerned with the MATLABpath or other installation details. The .mlappinstall file manages that for them.
You can share your app with others by attaching the .mlappinstall file to an emailmessage, or using any other method you typically use to share files—such as uploading toMATLAB Central File Exchange. Provide instructions on installing your app by referringthem to “Install or Reinstall App” on page 15-5.
Note: While .mlappinstall files can contain any files you specify, MATLAB CentralFile Exchange places additional limitations on submissions. Your app cannot besubmitted to File Exchange if it contains any of the following:
• MEX-files
• Other binary executable files, such as DLLs or ActiveX controls. (Data and image filesare typically acceptable.)

MATLAB App Installer File — mlappinstall
16-9
MATLAB App Installer File — mlappinstall
A MATLAB app installer file, .mlappinstall, is an archive file for sharing a MATLABGUI as an app. A single app installer file contains everything necessary to installand run an app, including source code, supporting data, information (such as productdependencies), and the app icon.
An .mlappinstall file is a compressed package that conforms to the Open PackagingConventions (OPC) interoperability standard. You can search for and install.mlappinstall files using your operating system file browser. When you select an.mlappinstall file in Windows Explorer or Quick Look (Mac OS), the browser displaysproperties for the file, such as Authors and Release. Use these properties to search for.mlappinstall files. Use the Tags property to add custom searchable text to the file.
For information on creating an app installer file for a GUI you created, see “PackageApps”.
16 Packaging GUIs as Apps
16-10
Dependency Analysis
When you create an app package, MATLAB analyzes your main file and attempts toinclude all the MATLAB files that it uses in the app package. However, MATLAB doesnot guarantee to find every dependent file. MATLAB will not find files for functions thatyour code references as strings (for instance, as arguments to eval, feval, and callbackfunctions). In addition, MATLAB might include some files that the main file never callswhen it runs.
Dependency analysis searches for executable files, such as:
• MATLAB files• P-files• .fig files• MEX-files
Dependency analysis does not search for data, image, or other binary files, such as Javaclasses and .jar files. You must manually add such files when you package your app.The Package Apps dialog box provides an option for doing this.
Related Documents