Maternal and Child Health * 139 9 MATERNAL AND CHILD HEALTH The Safe Motherhood Program in Nepal has adopted two major strategies to improve mater- nal healthprovide around-the-clock essential obstetric services and ensure the presence of skilled attendants at deliveries, especially at-home deliveries (Ministry of Health, 2001). In recognizing that the majority of women do not have access to maternal health care services due to social, economic, and political reasons, the Ministry of Health is emphasizing a multisectoral approach that encom- passes medical interventions and nonhealth programs that promote access to and utilization of ser- vices. Based on the National Health Policy, the Safe Motherhood National Plan of Action (1994- 1997) was developed. Ten districts were initially selected for the program, and in the first phase, the program was launched in three districts. After the evaluation of the first phase, six more districts were incorporated in the second phase by 2001. In conjunction with the Ministry of Health’s efforts, several other programs to support safe motherhood have been initiated by international organizations like the World Health Organization (WHO), the United Nations Children’s Fund (UNICEF), the United Nations Population Fund (UNFPA), the Department for International Development (DFID), U.S. Agency for International Development (USAID), and German Agency for Technical Coopera- tion (GTZ) in several targeted districts. These include the promotion of maternal health programs through the construction of maternity facilities, human resource development, and the provision of essential obstetric care kits and maternal and child health equipment to primary health centers and hospitals. USAID supports the Safe Motherhood Program with the maternal and child health work- ers (MCHWs) refresher training curriculum, the National Safe Motherhood Subcommittee and regu- lar newsletter, the National Safe Motherhood IEC strategy, postabortion care training as part of emergency obstetric care, and the Birth Preparedness Package for families to plan for normal births and emergencies. This chapter presents the survey findings in four areas of importance to maternal and child health: antenatal, delivery, and postnatal services; characteristics of the newborn; vaccination cover- age; and common childhood illnesses and their treatment. Combined with information on maternal and childhood mortality, this information can be used to identify subgroups of women and children who are “at risk” because of low levels of use or nonuse of maternal and child health services and to provide information to assist in the planning of appropriate improvements in services. 9.1 ANTENATAL CARE ANTENATAL CARE COVERAGE The maternal health care services that a mother receives during her pregnancy and at the time of delivery is important for the well being of the mother and her child. Antenatal care (ANC) can be assessed according to the type of service provider, number of visits made, the stage of pregnancy at the time of first visit, services and information provided during ANC checkups (including whether tetanus toxoid vaccinations were received). Information on ANC coverage was collected from women who had a live birth in the five years preceding the survey. For women with two or more live births during the five-year period, the data refer to the most recent birth only. Table 9.1 and Figure 9.1 show the percent distribution of mothers who had a live birth in the five years preceding the survey by source of antenatal care received during pregnancy according to

Welcome message from author
This document is posted to help you gain knowledge. Please leave a comment to let me know what you think about it! Share it to your friends and learn new things together.
Transcript

Maternal and Child Health * 139
9 MATERNAL AND CHILD HEALTH
The Safe Motherhood Program in Nepal has adopted two major strategies to improve mater-nal healthprovide around-the-clock essential obstetric services and ensure the presence of skilled attendants at deliveries, especially at-home deliveries (Ministry of Health, 2001). In recognizing that the majority of women do not have access to maternal health care services due to social, economic, and political reasons, the Ministry of Health is emphasizing a multisectoral approach that encom-passes medical interventions and nonhealth programs that promote access to and utilization of ser-vices. Based on the National Health Policy, the Safe Motherhood National Plan of Action (1994-1997) was developed. Ten districts were initially selected for the program, and in the first phase, the program was launched in three districts. After the evaluation of the first phase, six more districts were incorporated in the second phase by 2001. In conjunction with the Ministry of Health’s efforts, several other programs to support safe motherhood have been initiated by international organizations like the World Health Organization (WHO), the United Nations Children’s Fund (UNICEF), the United Nations Population Fund (UNFPA), the Department for International Development (DFID), U.S. Agency for International Development (USAID), and German Agency for Technical Coopera-tion (GTZ) in several targeted districts. These include the promotion of maternal health programs through the construction of maternity facilities, human resource development, and the provision of essential obstetric care kits and maternal and child health equipment to primary health centers and hospitals. USAID supports the Safe Motherhood Program with the maternal and child health work-ers (MCHWs) refresher training curriculum, the National Safe Motherhood Subcommittee and regu-lar newsletter, the National Safe Motherhood IEC strategy, postabortion care training as part of emergency obstetric care, and the Birth Preparedness Package for families to plan for normal births and emergencies.
This chapter presents the survey findings in four areas of importance to maternal and child
health: antenatal, delivery, and postnatal services; characteristics of the newborn; vaccination cover-age; and common childhood illnesses and their treatment. Combined with information on maternal and childhood mortality, this information can be used to identify subgroups of women and children who are “at risk” because of low levels of use or nonuse of maternal and child health services and to provide information to assist in the planning of appropriate improvements in services.
9.1 ANTENATAL CARE
ANTENATAL CARE COVERAGE
The maternal health care services that a mother receives during her pregnancy and at the time
of delivery is important for the well being of the mother and her child. Antenatal care (ANC) can be assessed according to the type of service provider, number of visits made, the stage of pregnancy at the time of first visit, services and information provided during ANC checkups (including whether tetanus toxoid vaccinations were received). Information on ANC coverage was collected from women who had a live birth in the five years preceding the survey. For women with two or more live births during the five-year period, the data refer to the most recent birth only.
Table 9.1 and Figure 9.1 show the percent distribution of mothers who had a live birth in the
five years preceding the survey by source of antenatal care received during pregnancy according to

140 * Maternal and Child Health
Table 9.1 Antenatal care
Percent distribution of women who had a live birth in the five years preceding the survey by antenatal care (ANC) provider during pregnancy for the most recent birth, according to background characteristics, Nepal 2001
Background characteristic Doctor
Nurse/ auxiliary
nurse midwife
Health assistant/ auxiliary health worker
Maternal child
health worker
Village health worker
Traditional birth
attendant/other No one Total
Number of
women
Age <20 21.5 13.4 13.8 4.4 5.8 0.4 40.7 100.0 773 20-34 17.2 11.7 10.8 3.2 6.7 0.6 49.8 100.0 3,419 35-49 6.5 5.7 8.6 2.5 4.7 0.4 71.6 100.0 553 Birth order 1 27.4 14.8 13.6 4.0 4.8 0.4 35.0 100.0 993 2-3 18.5 13.6 11.7 3.9 6.9 0.5 44.9 100.0 1,900 4-5 11.3 8.3 9.4 2.0 6.0 0.9 62.1 100.0 1,107 6+ 5.4 5.3 8.2 3.0 7.5 0.2 70.4 100.0 746 Residence Urban 54.5 20.2 4.3 0.8 1.1 1.3 17.6 100.0 332 Rural 13.8 10.6 11.5 3.5 6.7 0.5 53.4 100.0 4,414 Ecological zone Mountain 5.5 7.0 13.8 3.0 1.2 0.1 69.3 100.0 361 Hill 15.8 10.3 10.4 4.6 2.8 0.1 56.0 100.0 1,979 Terai 19.0 12.8 11.1 2.2 10.1 1.0 43.9 100.0 2,405
Development region Eastern 17.1 17.0 15.4 1.7 2.0 1.2 45.7 100.0 1,102 Central 18.6 7.8 10.1 2.3 13.2 0.6 47.4 100.0 1,535 Western 22.9 12.7 12.1 6.1 2.8 0.0 43.5 100.0 914 Mid-western 7.1 8.4 8.4 5.2 5.5 0.3 64.9 100.0 693 Far-western 11.1 11.0 5.8 2.2 2.6 0.2 67.0 100.0 502 Subregion Eastern Mountain 8.3 7.3 21.8 3.1 1.6 0.0 58.0 100.0 74 Central Mountain 5.7 12.2 18.7 5.2 2.2 0.4 55.7 100.0 122 Western Mountain 4.2 3.1 6.6 1.4 0.3 0.0 84.3 100.0 166 Eastern Hill 12.7 17.1 13.0 3.2 3.8 0.0 50.2 100.0 347 Central Hill 22.7 12.7 11.3 2.0 3.1 0.2 48.0 100.0 484 Western Hill 24.2 11.8 13.1 8.1 1.8 0.0 41.0 100.0 521 Mid-western Hill 3.8 3.6 6.2 5.8 3.3 0.4 77.0 100.0 405 Far-western Hill 7.9 2.8 5.4 2.5 1.7 0.0 79.6 100.0 223 Eastern Terai 20.3 18.0 15.9 0.7 1.1 1.9 42.1 100.0 681 Central Terai 18.1 4.7 8.3 2.1 19.9 0.9 46.0 100.0 930 Western Terai 21.2 13.9 10.7 3.3 4.1 0.0 46.8 100.0 393 Mid-western Terai 14.8 18.7 15.0 5.2 11.2 0.2 34.8 100.0 222 Far-western Terai 18.2 25.8 3.5 2.3 4.7 0.6 44.5 100.0 179 Education No education 9.5 8.7 10.7 2.9 6.9 0.5 60.8 100.0 3,437 Primary 22.3 17.7 12.1 4.6 7.0 0.5 35.5 100.0 684 Some secondary 42.8 20.4 11.9 4.5 3.1 1.2 16.0 100.0 439 SLC and above 65.8 14.9 10.1 3.1 0.9 0.0 5.2 100.0 186 Total 16.6 11.3 11.0 3.3 6.3 0.5 50.9 100.0 4,745
Note: If more than one source of ANC was mentioned, only the provider with the highest qualifications is considered in this tabulation. Total includes women with missing information on antenatal care provider who are not shown separately. SLC = School Leaving Certificate
Maternal and Child Health * 141
selected background characteristics. Interviewers were instructed to record all persons a woman had seen for antenatal care for the most recent birth. But in the table, only the provider with the highest qualifications is listed if the woman had seen more than one provider.
Overall, one in two pregnant women received antenatal care. Twenty-eight percent of moth-
ers received antenatal care either from a doctor (17 percent) or a nurse or auxiliary nurse midwife (11 percent). Another 11 percent of mothers received antenatal care from a health assistant (HA) or aux-iliary health worker (AHW). Village health workers (VHWs) provided antenatal care to 6 percent of women and maternal and child health workers (MCHWs) provided care to 3 percent of mothers. Traditional birth attendants (TBAs) provided antenatal care to less than 1 percent of mothers.
4951
459
45
989
1323
559
ANTENATAL CAREHealth professional
No one
TT VACCINATIONNoneOne2+
PLACE OF DELIVERYHealth facility
Home
DELIVERY ASSISTANCEHealth professional
TBARelative/friend/other
No one
0 20 40 60 80 100
Percent
Nepal 2001
Figure 9.1 Antenatal Care, Tetanus Toxoid (TT) Vaccinations,Place of Delivery, and Delivery Assistance
Note: Health professional refers to doctor, nurse/auxiliary nurse midwife, health assistant/auxiliary health worker, maternal child health worker, village health worker.TBA = Traditional birth attendant
Comparison with the 1996 Nepal Family Health Survey results shows that there were some
improvements in the utilization of antenatal services during the last five years. The percentage of women receiving antenatal services from a doctor, nurse, or auxiliary nurse midwife (ANM) has in-creased from 24 percent in 1996 to 28 percent in 2001. At the same time, the percentage of mothers receiving antenatal care from a HA or AHW increased from 2 percent to 11 percent. The percentage of mothers who did not receive any antenatal care dropped from 56 percent to 51 percent over the same period.
Younger women are more likely to use antenatal services than older women. This is espe-
cially true for care from doctors, nurses or ANMs and HAs or AHWs. Similarly, lower birth order is associated with greater use of antenatal services provided by medically trained personnel. Perhaps this pattern occurs because young women tend to be more educated than older women and are thus more likely to know that antenatal care from medically trained personnel is superior in quality. Also older women who have given birth previously may feel less need for ANC services. There are large differences in the use of antenatal care services between urban and rural women. Overall, 82 percent of women from urban areas utilize antenatal care services, compared with 47 percent of their rural
142 * Maternal and Child Health
counterparts. Urban women use doctors and nurses or ANMs much more often than rural women, whereas rural women are more likely to use HAs or AHWs and MCHWs for antenatal care.
Utilization of antenatal care services is higher in the terai and in the Western, Eastern, and
Central development regions than in the other regions. Similarly, women from the terai subregions and Western and Central hills use ANC services more often and from doctors and nurses or ANMs than in other areas. Women from the Western mountains are least likely to obtain ANC services, while women from the Mid-western terai are most likely to use ANC services. Reported use of doc-tors for antenatal care should be viewed with caution because in most rural areas, nurses and para-medical personnel are regarded as doctors and health posts and subhealth posts are regarded as hos-pitals.
The utilization of antenatal care services is positively associated with mother’s level of education. Ninety-five percent of women with an SLC and above received antenatal care ser-vices, compared with 39 percent of women with no education. Use of a doctor for antenatal care increases from 10 percent among uneducated women to 66 percent among women who have completed their SLC.
Antenatal care can be more effective in
avoiding adverse pregnancy outcomes when it is sought early in the pregnancy and continues through to delivery. The National Safe Mother-hood Program guidelines in Nepal recommend at least four visits during pregnancy. The first visit should be made soon after the woman real-izes she is pregnant. The second visit should be made between the fifth and the seventh month of pregnancy. The third visit should be made at the beginning of the ninth month, and the last visit should be made the same week that the baby is due. Additional visits should be made if any problems or danger signs arise.
Table 9.2 indicates that most Nepalese
women who receive antenatal care get it at a relatively late stage in their pregnancy and do not make the minimum recommended number of antenatal visits. Only one in seven (14 per-cent) women make four or more visits during their entire pregnancy. Urban women are four times more likely than rural women to have made four or more ANC visits. Sixteen percent of women reported that their first visit occurred at less than four months of pregnancy. Forty-one percent of urban women, compared with 15 percent of rural women, made their first antenatal visit when they were less than four months pregnant. Among women who received antenatal care, the median duration of pregnancy at first visit was five months.
Table 9.2 Number of antenatal care visits and timing of first visit
Percent distribution of women who had a live birth in the five years preceding the survey by number of antena-tal care (ANC) visits for the most recent birth, and by the timing of the first visit according to residence, Nepal 2001
Residence
Number and timing of ANC visits Urban Rural
Total
Number of ANC visits
None 17.6 53.4 50.9 1 6.5 7.9 7.8 2-3 27.3 26.8 26.8 4+ 48.4 11.8 14.3 Don't know/missing 0.3 0.2 0.2 Total 100.0 100.0 100.0 Number of months pregnant
at time of first ANC visit
No antenatal care 17.6 53.4 50.9 <4 41.0 14.6 16.4 4-5 24.3 18.2 18.7 6-7 14.4 10.7 11.0 8+ 2.2 2.9 2.8 Don't know/missing 0.5 0.2 0.2 Total 100.0 100.0 100.0
Median months pregnant at first visit (for those with ANC) 4.0 5.1 5.0
Number of women 332 4,414 4,745
Maternal and Child Health * 143
CARE COMPONENTS
Pregnancy complications are an important cause of maternal and child morbidity and mortal-
ity. Thus, providing adequate and proper information to expectant mothers about the danger signs associated with pregnancy and the appropriate action to be taken is an essential component of antenatal care.
Table 9.3 shows the components of antenatal care among women who received antenatal care
for the most recent birth in the five years preceding the survey. About one in two mothers who re-ceived antenatal care reported that they were informed about the danger signs of pregnancy compli-cations or had their weight measured, while one in seven had their height measured as a part of their ANC checkup. Among various services that a woman receives during her antenatal checkup, meas-urement of blood pressure is important. It is encouraging to note that three in five women reported that their blood pressure was measured. Urine tests and blood tests were each done for about three in ten women who received antenatal care. The relatively low coverage for these two tests may indi-cate a lack of testing facilities in most of the health institutions.
About one in four women with a live birth in the five years preceding the survey reported that
they received iron/folic acid tablets. Younger women and low parity women are more likely to receive information about preg-
nancy complications and other components of antenatal care services than older and high parity women. A similar pattern is observed by urban-rural residence, with urban women more likely than rural women to receive the various components of antenatal care. In terms of ecological region, a higher percentage of mothers from the mountain region received information on signs of complica-tions than mothers from the other ecological regions. In general, a higher percentage of women resid-ing in the hill ecological zone received the various components of antenatal care.
The different components of antenatal care received varies with women’s level of education,
with educated women much more likely to have received all components of antenatal care than un-educated women. For example, twice as many women with an SLC and above received information about pregnancy complications than women with no education.
144 * Maternal and Child Health
Table 9.3 Components of antenatal care
Percentage of women with a live birth in the five years preceding the survey who received antenatal care for the most recent birth, by content of antenatal care, and percentage of women with a live birth in the five years preceding the survey who re-ceived iron/folic acid tablets for the most recent birth, by background characteristics, Nepal 2001
Among women who received antenatal care
Background characteristic
Informed of signs of
pregnancy complica-
tions Weight
measured Height
measured
Blood pressure
measured
Urine sample taken
Blood sample taken
Number of
women
Received iron/
folic acid tablets
Number of
women
Age at birth <20 49.9 50.1 15.1 65.4 30.9 31.6 458 29.5 773 20-34 47.9 47.7 14.3 59.1 29.5 27.6 1,715 23.0 3,419 35-49 37.9 30.1 7.4 51.9 20.9 16.1 157 11.4 553 Birth order 1 55.9 55.0 16.4 71.7 38.5 38.2 645 36.8 993 2-3 46.8 49.4 15.0 59.3 30.3 28.6 1,045 25.1 1,900 4-5 44.1 39.0 11.6 51.8 19.9 16.5 420 15.0 1,107 6+ 34.2 27.4 6.6 43.3 13.9 12.9 221 9.3 746 Residence Urban 58.6 79.1 27.3 84.9 59.3 58.1 273 50.7 332 Rural 46.2 42.8 12.2 56.5 25.2 23.6 2,058 20.6 4,414 Ecological zone Mountain 55.7 38.9 4.5 47.0 18.1 13.9 111 14.1 361 Hill 51.4 52.7 14.3 67.1 33.4 30.3 870 22.1 1,979 Terai 44.6 44.0 14.5 56.2 27.3 27.0 1,350 24.5 2,405 Development region Eastern 39.3 51.5 13.8 57.2 23.3 23.1 599 24.0 1,102 Central 46.9 42.7 14.8 54.8 33.2 31.7 807 24.8 1,535 Western 54.0 56.1 15.5 71.7 38.4 35.8 517 28.5 914 Mid-western 47.4 26.9 9.1 56.7 17.7 15.5 243 11.3 693 Far-western 61.9 52.5 13.0 61.9 18.7 16.0 165 18.4 502 Subregion Eastern Mountain 40.7 38.3 8.6 48.1 17.3 14.8 31 16.6 74 Central Mountain 68.6 44.1 0.0 52.9 18.6 14.7 54 22.2 122 Western Mountain 46.7 28.9 8.9 33.3 17.8 11.1 26 7.0 166 Eastern Hill 31.8 36.9 8.3 43.9 15.3 14.0 173 19.7 347 Central Hill 59.3 67.8 25.2 72.6 47.8 47.0 251 28.1 484 Western Hill 50.2 57.9 12.8 75.3 40.7 34.3 307 30.9 521 Mid-western Hill 61.1 17.5 6.1 63.6 12.5 10.7 93 9.1 405 Far-western Hill 69.4 67.1 4.6 77.3 16.2 12.5 45 15.6 223 Eastern Terai 42.5 59.0 16.6 63.8 27.2 27.7 395 27.1 681 Central Terai 38.3 30.1 11.1 46.0 27.5 25.9 502 23.5 930 Western Terai 59.5 53.6 19.5 66.4 35.0 38.1 209 25.3 393 Mid-western Terai 37.7 32.7 10.9 52.0 21.2 19.1 145 17.6 222 Far-western Terai 63.0 51.2 17.9 62.3 19.8 18.1 99 27.1 179 Education No education 39.4 35.3 10.0 50.5 19.7 18.4 1,346 15.1 3,437 Primary 50.7 51.9 16.4 66.1 28.5 27.7 440 29.4 684 Some secondary 59.5 66.6 21.3 74.0 47.9 45.2 368 50.7 439 SLC and above 77.9 83.2 22.4 86.3 64.1 61.4 176 72.5 186 Total 47.6 47.0 14.0 59.9 29.2 27.6 2,330 22.7 4,745
SLC = School Leaving Certificate
Maternal and Child Health * 145
TETANUS TOXOID COVERAGE
Tetanus toxoid injection, an important component of antenatal care, is given during preg-
nancy primarily for the prevention of neonatal tetanus. Neonatal tetanus is one of the major causes of infant deaths in Nepal. For full protection, it is recommended that a pregnant woman should re-ceive at least two doses of tetanus toxoid during her first pregnancy, administered one month apart, and a booster shot during each subsequent pregnancy. Five doses of tetanus toxoid injections are considered to provide lifetime protection. However, if a pregnant woman does not have a card show-ing that she has received previous doses (as is often the case), she is likely to be given two doses, one month apart, for each pregnancy to ensure adequate protection.
Table 9.4 presents data on tetanus toxoid coverage during pregnancy for women who had a
live birth in the five years preceding the survey by selected background characteristics. Forty-five percent of women received two or more doses of tetanus toxoid injections during their pregnancy, and 9 percent received only one dose. Nearly one in two women did not receive any tetanus toxoid injection during her pregnancy.
Mothers giving birth at a younger age and having lower birth order children are more likely
to receive tetanus toxoid injections than older mothers and those with higher birth order children. For example, two-thirds of mothers below age 20 received one or more doses of tetanus toxoid injec-tions, compared with one-third of mothers age 35-49. These patterns make sense since older, higher parity mothers most likely received tetanus toxoid injections during previous pregnancies. A larger difference is observed in coverage of tetanus toxoid shots among urban women than among rural women (81 percent versus 53 percent). A large difference in tetanus toxoid coverage is also ob-served by ecological zone. Mothers from the terai have the highest tetanus toxoid coverage (67 per-cent) compared with the hill and mountain zones (44 percent and 29 percent, respectively). In terms of development region, the Eastern, Central, and Western regions have higher tetanus toxoid cover-age than the Mid-western and Far-western regions (about 60 percent versus 40 percent, respectively). Tetanus toxoid coverage is highest in the Eastern terai subregion and lowest in the Western moun-tain subregion.
Education of mothers is strongly associated with tetanus toxoid coverage. Pregnant mothers
with an SLC and above are twice as likely as mothers with no education to receive at least one dose of tetanus toxoid injections (95 percent and 47 percent, respectively).

146 * Maternal and Child Health
Table 9.4 Tetanus toxoid injections
Percent distribution of women who had a live birth in the five years preceding the survey by number of tetanus toxoid injections received during pregnancy for the most recent birth, accord-ing to background characteristics, Nepal 2001
Background characteristic None
One injection
Two or more
injections
Don't know/ missing Total
Number of
women
Age at birth <20 34.2 10.0 55.7 0.1 100.0 773 20-34 44.1 9.4 46.3 0.2 100.0 3,419 35-49 67.9 7.6 24.5 0.0 100.0 553 Birth order 1 31.5 10.0 58.5 0.0 100.0 993 2-3 39.1 9.8 50.9 0.2 100.0 1,900 4-5 53.7 8.8 37.3 0.2 100.0 1,107 6+ 66.4 7.9 25.5 0.1 100.0 746 Residence Urban 18.3 13.9 67.3 0.5 100.0 332 Rural 47.3 9.0 43.7 0.1 100.0 4,414 Ecological zone Mountain 71.1 7.6 21.3 0.0 100.0 361 Hill 55.8 9.1 34.9 0.1 100.0 1,979 Terai 32.7 9.7 57.4 0.2 100.0 2,405 Development region Eastern 37.4 9.0 53.6 0.0 100.0 1,102 Central 38.7 10.9 50.1 0.4 100.0 1,535 Western 44.1 11.7 44.1 0.1 100.0 914 Mid-western 60.4 5.3 34.3 0.0 100.0 693 Far-western 63.7 6.4 29.9 0.1 100.0 502 Subregion Eastern Mountain 62.2 8.3 29.5 0.0 100.0 74 Central Mountain 61.7 10.0 28.3 0.0 100.0 122 Western Mountain 81.9 5.6 12.5 0.0 100.0 166 Eastern Hill 50.8 9.8 39.4 0.0 100.0 347 Central Hill 46.8 9.5 43.2 0.6 100.0 484 Western Hill 45.9 13.6 40.4 0.0 100.0 521 Mid-western Hill 70.4 4.6 25.0 0.0 100.0 405 Far-western Hill 79.4 5.1 15.5 0.0 100.0 223 Eastern Terai 27.9 8.7 63.5 0.0 100.0 681 Central Terai 31.5 11.7 56.5 0.3 100.0 930 Western Terai 41.7 9.0 49.1 0.3 100.0 393 Mid-western Terai 35.0 6.7 58.2 0.0 100.0 222 Far-western Terai 34.8 8.0 56.8 0.3 100.0 179 Education No education 53.0 7.8 39.0 0.2 100.0 3,437 Primary 34.6 12.4 52.8 0.2 100.0 684 Some secondary 18.2 14.1 67.7 0.0 100.0 439 SLC and above 4.6 14.2 81.1 0.0 100.0 186 Total 45.2 9.3 45.3 0.2 100.0 4,745
SLC = School Leaving Certificate

Maternal and Child Health * 147
9.2 DELIVERY CARE The objective of providing safe delivery services is to protect the life and health of the mother
and her child by ensuring the delivery of a baby safely. An important component of efforts to reduce the health risk to mothers and children is to increase the proportion of babies delivered under the su-pervision of health professionals. Proper medical attention under hygienic conditions during delivery can reduce the risk of complications and infections that may cause death or serious illness either to the mother or the baby or both. The National Safe Motherhood Program encourages women to de-liver at facilities under the care of skilled attendants when it is feasible and ensures that facilities are upgraded and providers are trained to manage complications. Respondents in the 2001 NDHS were asked to provide information on the place of birth of all children born in the five years preceding the survey.
PLACE OF DELIVERY
Traditionally, Nepalese children are delivered at home either without assistance or with the
assistance of TBAs or relatives and friends. At the national level, only 9 percent of births are deliv-ered in health facilities, compared with 89 percent at home (Table 9.5). This is a slight improvement since 1996, when 8 percent of births were delivered in health facilities. This suggests that despite an increase in the number of health facilities offering delivery services, use of health facilities during deliveries is still minimal among most Nepalese women.
Table 9.5 also shows that births to young women and low parity births are more likely to be
delivered at health facilities than births to older women and high parity births. A child born in an ur-ban area is six times more likely (45 percent) to be delivered at a health facility than a child from a rural area (7 percent). Children living in the mountain ecological zone are less likely to be delivered in a health facility than children living in the hill and terai zones.
Use of a health facility for delivery increases sharply with maternal education from 4 percent
of births among women with no education to 55 percent among children of women with an SLC or higher level of education.
Institutional deliveries are about five times more common among births to mothers who had
four or more antenatal checkups (40 percent) than among births to mothers who had one to three an-tenatal checkups (8 percent). Institutional deliveries are least prevalent (2 percent) among births to mothers who did not receive any antenatal checkups. Several factors are likely to contribute to this positive relationship between antenatal checkups and institutional deliveries. Women who have had contact with health facilities during pregnancy are more likely to subsequently deliver in an institu-tion because of the advice and encouragement from health personnel. Women with pregnancy com-plications are more likely than other women to go for antenatal checkups and deliver in a health fa-cility because they are more aware of the health risks associated with a complicated pregnancy. Women, especially the young, urban, and educated, with knowledge of the benefits of modern medi-cal care will choose to use both antenatal and delivery services.

148 * Maternal and Child Health
Table 9.5 Place of delivery
Percent distribution of live births in the five years preceding the survey by place of delivery, according to background characteristics, Nepal 2001
Health facility
Background characteristic
Govern- ment sector
Non-gov.
(NGO) sector
Private medical sector Home Other Missing Total
Number of
births
Mother’s age at birth <20 9.2 1.5 1.4 85.9 1.8 0.2 100.0 1,290 20-34 6.9 0.9 1.1 89.1 1.9 0.1 100.0 5,043 35-49 3.1 0.2 0.3 93.0 3.5 0.0 100.0 645 Birth order 1 14.5 2.2 2.4 78.6 2.1 0.2 100.0 1,665 2-3 6.1 0.8 1.1 90.2 1.6 0.1 100.0 2,790 4-5 3.3 0.3 0.2 93.8 2.4 0.0 100.0 1,534 6+ 2.3 0.2 0.3 94.8 2.4 0.0 100.0 990 Residence Urban 34.9 5.7 3.9 53.8 1.4 0.2 100.0 449 Rural 5.1 0.6 0.9 91.3 2.0 0.1 100.0 6,529 Ecological zone Mountain 3.2 0.0 0.1 93.8 2.9 0.1 100.0 535 Hill 7.2 1.4 1.0 87.8 2.5 0.1 100.0 2,873 Terai 7.4 0.8 1.3 89.0 1.4 0.1 100.0 3,570 Development region Eastern 7.5 1.4 0.8 89.7 0.5 0.1 100.0 1,610 Central 9.0 1.3 1.4 86.2 2.0 0.1 100.0 2,310 Western 7.2 0.9 1.3 86.9 3.5 0.1 100.0 1,261 Mid-western 2.8 0.0 1.0 93.3 2.9 0.0 100.0 1,048 Far-western 5.2 0.5 0.5 92.3 1.2 0.3 100.0 749 Subregion Eastern Mountain 5.7 0.0 0.4 94.0 0.0 0.0 100.0 107 Central Mountain 3.9 0.0 0.0 88.1 7.8 0.3 100.0 177 Western Mountain 1.6 0.0 0.0 97.7 0.7 0.0 100.0 251 Eastern Hill 4.5 0.2 0.0 94.4 0.8 0.0 100.0 533 Central Hill 14.1 3.4 1.7 79.5 1.2 0.1 100.0 692 Western Hill 9.5 1.7 1.9 82.5 4.1 0.2 100.0 683 Mid-western Hill 1.7 0.0 0.8 93.1 4.5 0.0 100.0 634 Far-western Hill 2.6 1.1 0.0 95.3 1.0 0.0 100.0 330 Eastern Terai 9.3 2.2 1.4 86.7 0.4 0.1 100.0 969 Central Terai 7.2 0.4 1.5 89.2 1.7 0.0 100.0 1,441 Western Terai 4.5 0.0 0.5 92.1 2.8 0.0 100.0 578 Mid-western Terai 5.8 0.0 1.7 92.0 0.5 0.0 100.0 318 Far-western Terai 10.1 0.0 1.3 85.9 1.9 0.8 100.0 264 Mother’s education No education 3.5 0.2 0.5 93.8 1.9 0.1 100.0 5,176 Primary 9.9 1.0 1.1 85.9 2.1 0.1 100.0 970 Some secondary 20.4 4.8 2.5 69.7 2.3 0.2 100.0 587 SLC and above 37.1 7.5 10.6 42.8 2.0 0.0 100.0 244 Antenatal care visits1 None 1.5 0.0 0.2 95.8 2.4 0.0 100.0 2,414 1-3 6.5 0.6 1.3 90.2 1.3 0.0 100.0 1,643 4+ 29.3 6.3 4.4 57.7 2.3 0.0 100.0 680 Total 7.0 1.0 1.1 88.9 2.0 0.1 100.0 6,978
Note: Total includes 9 births with missing information on antenatal care visits which are not shown separately. SLC = School Leaving Certificate 1Includes only the most recent birth in the five years preceding the survey

Maternal and Child Health * 149
ASSISTANCE DURING DELIVERY
Assistance by skilled health personnel during delivery is considered to be effective in the re-
duction of maternal and neonatal mortality. Births delivered at home are usually more likely to be delivered without assistance from a health professional, whereas births delivered at health facilities are more likely to be delivered by health personnel with at least minimal training in the provision of normal delivery services.
Table 9.6 and Figure 9.1 show the percent distribution of live births in the five years preced-
ing the survey by the type of person providing assistance during delivery according to background characteristics. Only 13 percent of deliveries are assisted by health professionals, that is, doctors, nurses or ANMs, HAs or AHWs, MCHWs, and VHWs. Of these, 8 percent are doctors and 3 per-cent are nurses or ANMs. Contrary to expectations, the proportion of deliveries assisted by MCHWs is very low (less than 1 percent) in spite of the fact that in Nepal, MCHWs have been assigned to subhealth posts for the promotion of maternal and child health services. This finding suggests that MCHWs are either not properly deployed or they are not very effective in providing delivery ser-vices.
Although traditional birth attendants are considered to be less effective in reducing maternal
deaths, TBAs continue to play a prominent role in assisting deliveries, especially in rural areas. The contribution of TBAs to providing delivery care remained almost the same over the last ten years at about 23 percent. More than half of births are assisted by relatives, friends, and other nonhealth per-sonnel, while about one in ten births are delivered without any assistance at all.
Differences in delivery assistance by background characteristics are marked. This is espe-
cially obvious for assistance provided by doctors. Births to young mothers below age 20 and first order births are more likely to receive assistance from doctors during delivery. Urban births are seven times more likely than rural births to be delivered by doctors. Delivery assistance from doc-tors is about three times as high in the hills and terai (more than 8 percent) than in the mountains (3 percent). Similarly, a higher proportion of deliveries in the Central development region (10 percent) are assisted by doctors than in the other development regions.
Women’s education is positively associated with deliveries by medical professionals. For
example, only 4 percent of births to women with no education were assisted by a doctor, compared with 48 percent of births to women with at least an SLC. This could probably be attributed to the fact that women with higher levels of education mostly come from urban areas where the services of a doctor are more readily available.

150 * Maternal and Child Health
Table 9.6 Assistance during delivery
Percent distribution of live births in the five years preceding the survey by person providing assistance during delivery, according to background characteristics, Nepal 2001
Background characteristic Doctor
Nurse/ auxiliary
nurse midwife
Health assistant/ auxiliary health worker
Maternal child
health worker
Village health worker
Tradi- Tional
birth at-tendant
Relative/ friend/ other No one Total
Number of
births
Mother’s age at birth <20 10.7 4.5 2.1 0.5 0.1 24.7 53.2 4.1 100.0 1,290 20-34 7.6 3.0 1.2 0.4 0.2 23.4 55.2 8.8 100.0 5,043 35-49 3.1 0.7 1.2 0.4 0.3 20.4 57.2 16.7 100.0 645 Birth order 1 16.1 6.2 2.6 0.6 0.2 23.0 48.5 2.7 100.0 1,665 2-3 7.2 2.8 1.2 0.5 0.2 25.0 55.7 7.2 100.0 2,790 4-5 3.2 1.6 1.0 0.1 0.3 23.2 58.0 12.7 100.0 1,534 6+ 2.6 0.8 0.5 0.4 0.1 19.8 59.5 16.4 100.0 990 Residence Urban 39.4 10.9 0.8 0.0 0.0 9.4 35.9 3.5 100.0 449 Rural 5.6 2.5 1.4 0.4 0.2 24.4 56.4 9.0 100.0 6,529 Ecological zone Mountain 3.0 1.0 0.8 0.7 0.2 10.1 71.4 12.8 100.0 535 Hill 8.3 2.6 1.2 0.7 0.2 7.0 67.1 12.9 100.0 2,873 Terai 8.1 3.7 1.6 0.2 0.2 38.6 42.9 4.6 100.0 3,570 Development region Eastern 7.9 5.4 1.9 0.1 0.3 25.6 49.5 9.2 100.0 1,610 Central 10.4 2.5 1.3 0.2 0.2 29.2 47.6 8.6 100.0 2,310 Western 7.7 3.9 1.0 1.4 0.1 17.8 58.5 9.6 100.0 1,261 Mid-western 3.7 0.4 1.7 0.3 0.2 19.4 68.0 6.1 100.0 1,048 Far-western 5.6 2.1 0.4 0.2 0.1 15.8 65.9 9.6 100.0 749 Subregion Eastern Mountain 6.0 1.4 2.5 0.4 0.4 6.0 58.5 24.8 100.0 107 Central Mountain 2.7 1.8 0.6 1.2 0.0 2.1 77.6 13.7 100.0 177 Western Mountain 1.8 0.2 0.2 0.5 0.2 17.5 72.6 6.9 100.0 251 Eastern Hill 4.8 1.9 1.2 0.0 0.6 9.9 64.9 16.7 100.0 533 Central Hill 16.7 4.0 1.3 0.2 0.0 6.6 54.4 16.7 100.0 692 Western Hill 10.3 5.0 1.8 2.5 0.2 8.9 59.0 12.3 100.0 683 Mid-western Hill 2.2 0.3 0.5 0.0 0.0 4.7 83.4 8.9 100.0 634 Far-western Hill 4.1 0.6 1.0 0.2 0.0 3.4 82.5 8.1 100.0 330 Eastern Terai 9.9 7.7 2.3 0.1 0.1 36.4 40.1 3.2 100.0 969 Central Terai 8.3 1.9 1.5 0.1 0.3 43.3 40.6 4.1 100.0 1,441 Western Terai 4.6 2.6 0.0 0.2 0.0 28.3 57.9 6.4 100.0 578 Mid-western Terai 7.5 1.0 4.4 0.8 0.8 47.1 37.4 1.0 100.0 318 Far-western Terai 9.1 5.0 0.0 0.2 0.2 33.1 39.4 12.3 100.0 264 Mother’s education No education 3.7 1.5 1.0 0.2 0.2 25.6 58.2 9.5 100.0 5,176 Primary 9.7 4.4 2.5 0.8 0.2 19.4 53.9 8.9 100.0 970 Some secondary 23.9 9.2 2.3 1.3 0.2 16.3 42.9 4.0 100.0 587 SLC and above 47.8 16.3 2.6 1.1 0.0 9.9 20.8 1.6 100.0 244 Total 7.8 3.1 1.4 0.4 0.2 23.4 55.0 8.6 100.0 6,978
Note: If the respondent mentioned more than one person attending during delivery, only the most qualified person is consid-ered in this tabulation. Total includes births for whom information on assistance at delivery is missing and not shown separately. SLC = School Leaving Certificate

Maternal and Child Health * 151
USE OF HOME DELIVERY KIT
The clean home delivery kit was developed in the early 1990s by Maternal Child Health
Products with funding from USAID. It is a social marketing product now supported by other donors as well as by revenue from sales. It is not widely marketed, however, and in some donor or NGO-supported areas it is available at no cost. Where it is sold, the average cost is about Rps. 25 or about US$0.33 per unit. The kit contains a new razor blade, clean threads, hand soap, a plastic sheet to place under the woman, a plastic disc (used to replace the traditional coin placed under the cord when it is cut), and pictorial instructions. Since most babies are delivered at home with the assis-tance of elders or relatives and TBAs, use of the clean home delivery kit could play an important role in reducing neonatal tetanus and other infections.
Table 9.7 provides information on the use of the
clean home delivery kits by type of residence and ecologi-cal zone. A clean delivery kit was used in only 9 percent of home deliveries. Although use of clean delivery kits in home deliveries has improved over the last five years (from 2 percent in 1996 to 9 percent in 2001), it has still not reached the bulk of Nepalese mothers. Home deliveries in urban areas are more likely to involve these delivery kits (14 percent) than home deliveries in rural areas (9 per-cent). Likewise, clean delivery kits are more likely to be used in the terai (12 percent) than in the hills or mountains (6 percent each). In terms of development regions, births in the Eastern and Western regions are more likely to involve clean delivery kits than births in the other regions.
DELIVERY CHARACTERISTICS
Less than 1 percent of births in Nepal are delivered
by caesarean section (Table 9.8). This could in part be due to the high percentage of home deliveries coupled with a weak health care referral system. Births to older women, first order births, births in urban areas, births in the hill ecological zone, births in the Central development region, and births to women with at least an SLC are more likely to be delivered by caesarean section. There has been little change in the percentage of deliveries by caesarean section over the last five years.
Babies in Nepal are usually not weighed at birth since most deliveries take place outside an
institutional setting. Thus, it is difficult to know whether the baby was underweight at birth. To overcome this, respondents were asked to provide an assessment of their child’s size at birth. This type of assessment is subject to considerable error for individual births. However, at the aggregate level, it has been observed that there is a strong association between the actual weight at birth and a mother’s perception of the size of her child at birth.
In the absence of birth weight, a mother’s assessment of the size of the baby at birth can be a
useful measure of the survival chances of a child. The 2001 NDHS data indicate that about one in five births (21 percent) was reported as being very small or smaller than average. Births in the moun-tain ecological zone and Far-western development region and births to mothers with low levels of education are more likely to be reported as being very small or smaller than average. Nearly 80 per-cent of the mothers report that their baby was of average size or larger at birth.
Table 9.7 Use of clean home delivery kits
Percentage of births delivered at home in the five years preceding the survey in which a clean home delivery kit was used, by resi-dence and region, Nepal 2001
Residence and region
Clean home
delivery kit used
Number of
births
Residence Urban 13.8 242 Rural 9.2 5,960 Ecological zone Mountain 6.3 502 Hill 6.4 2,523 Terai 12.3 3,177 Development region Eastern 12.0 1,445 Central 8.5 1,992 Western 11.7 1,096 Mid-western 5.9 977 Far-western 8.0 692 Total 9.4 6,202

152 * Maternal and Child Health
Table 9.8 Delivery characteristics
Percentage of live births in the five years preceding the survey delivered by caesarean section, and percent distribution by mother's estimate of baby's size at birth, according to background characteristics, Nepal 2001
Size of child at birth
Background characteristic
Delivery by C-
section Very small
Smaller than
average Average or larger Total
Number of
births
Mother’s age at birth <20 0.7 7.1 16.9 75.8 100.0 1,290 20-34 0.8 5.6 14.2 80.1 100.0 5,043 35-49 1.0 7.3 16.8 75.9 100.0 645 Birth order 1 1.6 6.8 17.5 75.5 100.0 1,665 2-3 0.8 5.1 12.7 82.1 100.0 2,790 4-5 0.4 6.5 13.9 79.6 100.0 1,534 6+ 0.5 6.8 18.9 74.4 100.0 990 Residence Urban 4.8 7.4 13.4 79.0 100.0 449 Rural 0.6 5.9 15.1 78.9 100.0 6,529 Ecological zone Mountain 0.3 16.9 14.1 68.9 100.0 535 Hill 1.1 7.4 15.8 76.7 100.0 2,873 Terai 0.7 3.4 14.4 82.1 100.0 3,570 Development region Eastern 1.0 5.4 13.5 81.0 100.0 1,610 Central 1.2 4.7 12.1 83.1 100.0 2,310 Western 0.8 5.5 14.5 79.9 100.0 1,261 Mid-western 0.1 5.1 18.8 76.2 100.0 1,048 Far-western 0.3 13.8 22.3 63.5 100.0 749 Subregion Eastern Mountain 0.7 6.4 16.0 77.7 100.0 107 Central Mountain 0.6 20.0 6.6 73.1 100.0 177 Western Mountain 0.0 19.1 18.7 62.2 100.0 251 Eastern Hill 0.4 7.6 13.2 79.1 100.0 533 Central Hill 2.7 8.0 12.3 79.5 100.0 692 Western Hill 1.3 7.8 11.7 80.3 100.0 683 Mid-western Hill 0.0 5.5 19.8 74.7 100.0 634 Far-western Hill 0.3 8.4 27.9 63.7 100.0 330 Eastern Terai 1.4 4.1 13.4 82.4 100.0 969 Central Terai 0.6 1.3 12.7 86.1 100.0 1,441 Western Terai 0.3 2.7 17.8 79.4 100.0 578 Mid-western Terai 0.3 4.2 19.2 76.6 100.0 318 Far-western Terai 0.5 12.3 14.4 72.3 100.0 264 Mother’s education No education 0.4 6.0 16.3 77.5 100.0 5,176 Primary 1.1 7.3 11.4 81.2 100.0 970 Some secondary 1.9 4.7 11.6 83.4 100.0 587 SLC and above 6.1 4.3 7.7 88.0 100.0 244 Total 0.8 6.0 15.0 78.9 100.0 6,978
Note: Total includes births for whom information on size at birth is not known or miss-ing and not shown separately. SLC = School Leaving Certificate
Maternal and Child Health * 153
9.3 POSTNATAL CARE
The National Safe Motherhood program recommends that mothers should have a postnatal
checkup within two days of delivery. This recommendation is based on the fact that a large number of maternal and neonatal deaths occur during the 48 hours after delivery. To assess the extent of postnatal care utilization, respondents who had a birth in the five years preceding the survey were asked whether they received a postnatal checkup after the delivery of their last birth. Table 9.9 shows the timing of postnatal checkups for the most recent birth that occurred outside a health facil-ity. The timing of the first postnatal checkup was not asked of mothers who had an institutional birth because it is assumed that these mothers would normally receive postnatal care within the first two crucial days after delivery as part of their routine care.
Postnatal care is uncommon in Nepal. Seventy-nine percent of mothers who delivered outside
a health facility do not receive any postnatal checkup. Less than one in five mothers receive postnatal care within the first two days after delivery.
Postnatal care utilization varies by place of residence. Rural women are slightly more likely
to receive postnatal care within two days of delivery, compared with urban women (17 percent and 13 percent, respectively). Women from the terai ecological zone, Central development region, and Central terai are more likely to receive postnatal care within the first two days of delivery than women from other regions. A somewhat higher percentage of women having no education receive postnatal care within two days of delivery than women having at least an SLC level of education. This anomaly may be because a smaller percentage of deliveries in urban areas and to educated women occur at home, and it could be specific to women or families who have reservations about utilizing health facilities for deliveries.
9.4 REPRODUCTIVE HEALTH CARE AND WOMEN’S STATUS
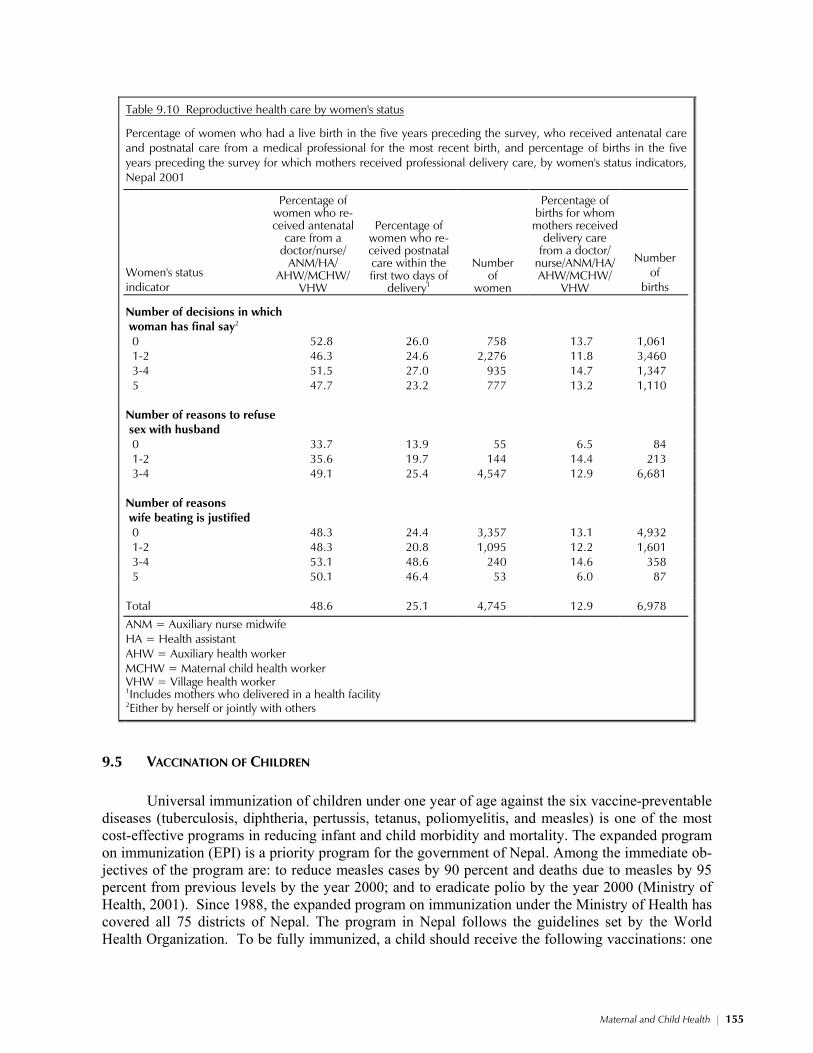
Table 9.10 shows whether a woman’s use of reproductive health services varies by her level
of empowerment as measured by three indicators: her participation in decisionmaking, her attitudes toward a woman’s right to refuse sex with her husband, and her attitudes toward wife beating. The more say a woman has in decisionmaking, the greater control she has over her reproductive needs. Similarly, empowerment over her reproductive needs is likely to vary positively with the number of reasons she believes a woman is justified in refusing sex with her husband. On the other hand, em-powerment over her reproductive needs is likely to vary negatively relative to the number of reasons she believes wife beating is justified.
In the case of Nepal, there is little variation in the utilization of reproductive health services
by women’s decisionmaking autonomy. However, there is a positive relationship between utilization of reproductive health services and women’s empowerment as measured by her attitude toward women’s ability to refuse sex with their husband. For example, one in two women who believe that a woman can refuse sex with her husband for three or four reasons receives antenatal care services, compared with only one in three women who believe a wife should refuse sex with her husband for any reason at all. There appears to be a mixed association between women’s empowerment as measured by the number of reasons women believe that wife beating is justified and their care-seeking behavior. For example, half as many women who believe that wife beating is not justified for any reason at all receive postnatal care within the first two days of delivery as women who be-lieve that wife beating is justified for five reasonsa positive association. On the other hand, twice as many women in the former group receive delivery assistance from a health professional as women in the latter groupa negative association.

154 * Maternal and Child Health
Table 9.9 Postnatal care by background characteristics
Percent distribution of women who had a noninstitutional live birth in the five years preceding the survey by tim-ing of postnatal care for the most recent noninstitutional birth, according to background characteristics, Nepal 2001
Timing of first postnatal checkup
Background characteristic
Within 2 days of delivery
3-6 days after
delivery
7-41 days after
delivery
Did not receive
postnatal checkup1 Total
Number of
women
Age at birth <20 18.0 1.1 3.7 77.2 100.0 675 20-34 17.7 0.8 2.7 78.7 100.0 3,082 35-49 12.8 0.4 1.5 85.4 100.0 534 Birth order 1 17.5 1.9 3.7 77.0 100.0 791 2-3 17.1 0.8 3.1 78.9 100.0 1,715 4-5 17.5 0.1 2.4 80.0 100.0 1,061 6+ 16.3 0.8 1.0 81.9 100.0 724 Residence Urban 12.6 0.5 5.1 81.8 100.0 180 Rural 17.3 0.8 2.6 79.2 100.0 4,111 Ecological zone Mountain 1.8 0.4 0.8 97.1 100.0 350 Hill 2.0 0.4 2.1 95.5 100.0 1,781 Terai 32.1 1.2 3.5 63.1 100.0 2,160 Development region Eastern 13.2 1.5 4.0 81.2 100.0 986 Central 39.4 0.6 2.3 57.7 100.0 1,335 Western 8.5 0.8 2.1 88.6 100.0 838 Mid-western 0.5 0.6 2.7 96.1 100.0 663 Far-western 1.1 0.2 2.0 96.6 100.0 470 Subregion Eastern Mountain 4.9 0.5 0.5 94.0 100.0 69 Central Mountain 1.4 0.5 0.5 97.7 100.0 117 Western Mountain 0.7 0.4 1.1 97.9 100.0 163 Eastern Hill 2.3 0.3 2.7 94.7 100.0 331 Central Hill 2.6 0.7 3.6 93.1 100.0 378 Western Hill 3.8 0.8 1.9 93.4 100.0 465 Mid-western Hill 0.0 0.0 1.4 98.6 100.0 393 Far-western Hill 0.0 0.0 0.3 99.7 100.0 214 Eastern Terai 20.3 2.3 5.2 72.1 100.0 586 Central Terai 61.2 0.5 2.0 36.3 100.0 840 Western Terai 14.3 0.8 2.4 82.4 100.0 372 Mid-western Terai 1.6 2.0 6.1 90.3 100.0 205 Far-western Terai 2.5 0.3 4.6 92.5 100.0 156 Education No education 18.8 0.6 2.2 78.3 100.0 3,289 Primary 11.4 0.6 3.4 84.6 100.0 601 Some secondary 11.7 1.9 4.8 81.6 100.0 315 SLC and above 14.5 5.4 8.0 72.1 100.0 86 Total 17.1 0.8 2.7 79.3 100.0 4,291
Note: Total includes women for whom information on timing or postnatal care is not known or missing and not shown separately. SLC = School Leaving Certificate 1Includes women who received the first postnatal checkup after 41 days
Maternal and Child Health * 155
Table 9.10 Reproductive health care by women's status
Percentage of women who had a live birth in the five years preceding the survey, who received antenatal care and postnatal care from a medical professional for the most recent birth, and percentage of births in the five years preceding the survey for which mothers received professional delivery care, by women's status indicators, Nepal 2001
Women's status indicator
Percentage of women who re-ceived antenatal
care from a doctor/nurse/
ANM/HA/ AHW/MCHW/
VHW
Percentage of
women who re-ceived postnatal care within the first two days of
delivery1
Number of
women
Percentage of births for whom
mothers received delivery care
from a doctor/ nurse/ANM/HA/ AHW/MCHW/
VHW
Number of
births
Number of decisions in which woman has final say2
0 52.8 26.0 758 13.7 1,061 1-2 46.3 24.6 2,276 11.8 3,460 3-4 51.5 27.0 935 14.7 1,347 5 47.7 23.2 777 13.2 1,110 Number of reasons to refuse sex with husband
0 33.7 13.9 55 6.5 84 1-2 35.6 19.7 144 14.4 213 3-4 49.1 25.4 4,547 12.9 6,681 Number of reasons wife beating is justified
0 48.3 24.4 3,357 13.1 4,932 1-2 48.3 20.8 1,095 12.2 1,601 3-4 53.1 48.6 240 14.6 358 5 50.1 46.4 53 6.0 87 Total 48.6 25.1 4,745 12.9 6,978
ANM = Auxiliary nurse midwife HA = Health assistant AHW = Auxiliary health worker MCHW = Maternal child health worker VHW = Village health worker
1Includes mothers who delivered in a health facility 2Either by herself or jointly with others
9.5 VACCINATION OF CHILDREN Universal immunization of children under one year of age against the six vaccine-preventable
diseases (tuberculosis, diphtheria, pertussis, tetanus, poliomyelitis, and measles) is one of the most cost-effective programs in reducing infant and child morbidity and mortality. The expanded program on immunization (EPI) is a priority program for the government of Nepal. Among the immediate ob-jectives of the program are: to reduce measles cases by 90 percent and deaths due to measles by 95 percent from previous levels by the year 2000; and to eradicate polio by the year 2000 (Ministry of Health, 2001). Since 1988, the expanded program on immunization under the Ministry of Health has covered all 75 districts of Nepal. The program in Nepal follows the guidelines set by the World Health Organization. To be fully immunized, a child should receive the following vaccinations: one
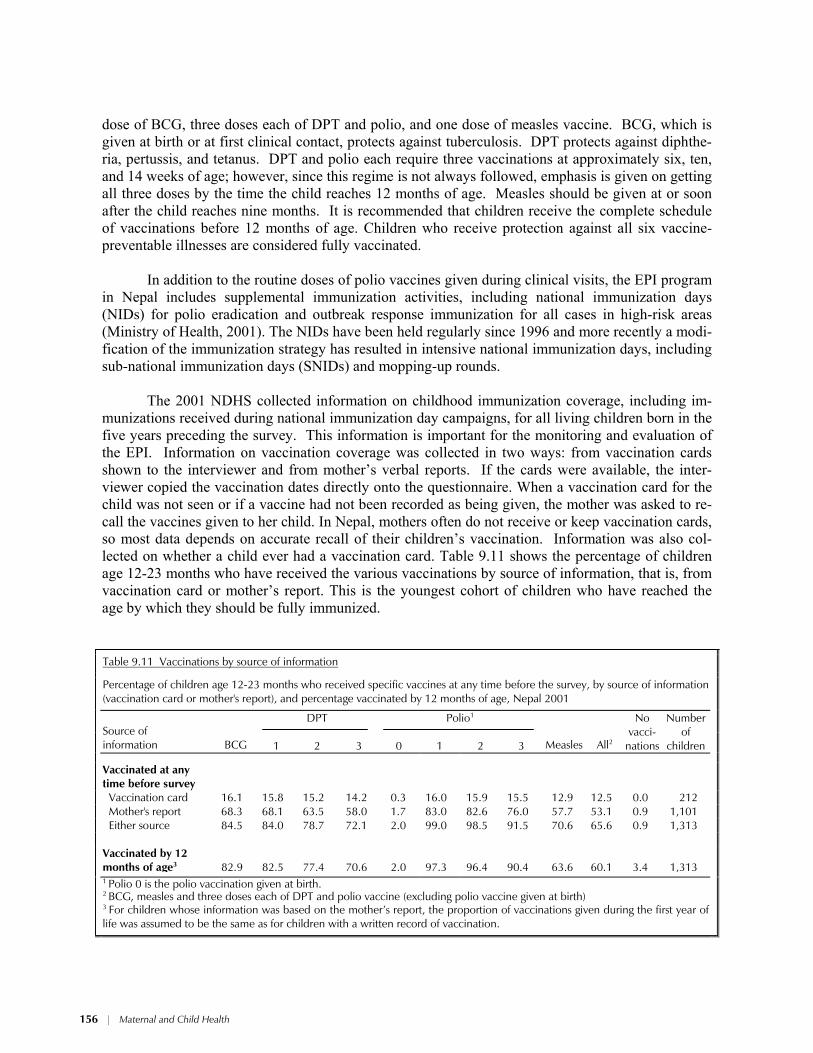
156 * Maternal and Child Health
dose of BCG, three doses each of DPT and polio, and one dose of measles vaccine. BCG, which is given at birth or at first clinical contact, protects against tuberculosis. DPT protects against diphthe-ria, pertussis, and tetanus. DPT and polio each require three vaccinations at approximately six, ten, and 14 weeks of age; however, since this regime is not always followed, emphasis is given on getting all three doses by the time the child reaches 12 months of age. Measles should be given at or soon after the child reaches nine months. It is recommended that children receive the complete schedule of vaccinations before 12 months of age. Children who receive protection against all six vaccine-preventable illnesses are considered fully vaccinated.
In addition to the routine doses of polio vaccines given during clinical visits, the EPI program
in Nepal includes supplemental immunization activities, including national immunization days (NIDs) for polio eradication and outbreak response immunization for all cases in high-risk areas (Ministry of Health, 2001). The NIDs have been held regularly since 1996 and more recently a modi-fication of the immunization strategy has resulted in intensive national immunization days, including sub-national immunization days (SNIDs) and mopping-up rounds.
The 2001 NDHS collected information on childhood immunization coverage, including im-
munizations received during national immunization day campaigns, for all living children born in the five years preceding the survey. This information is important for the monitoring and evaluation of the EPI. Information on vaccination coverage was collected in two ways: from vaccination cards shown to the interviewer and from mother’s verbal reports. If the cards were available, the inter-viewer copied the vaccination dates directly onto the questionnaire. When a vaccination card for the child was not seen or if a vaccine had not been recorded as being given, the mother was asked to re-call the vaccines given to her child. In Nepal, mothers often do not receive or keep vaccination cards, so most data depends on accurate recall of their children’s vaccination. Information was also col-lected on whether a child ever had a vaccination card. Table 9.11 shows the percentage of children age 12-23 months who have received the various vaccinations by source of information, that is, from vaccination card or mother’s report. This is the youngest cohort of children who have reached the age by which they should be fully immunized.
Table 9.11 Vaccinations by source of information
Percentage of children age 12-23 months who received specific vaccines at any time before the survey, by source of information (vaccination card or mother's report), and percentage vaccinated by 12 months of age, Nepal 2001
DPT Polio1 Source of information BCG 1 2 3 0 1 2 3 Measles All2
No vacci-
nations
Number of
children
Vaccinated at any time before survey
Vaccination card 16.1 15.8 15.2 14.2 0.3 16.0 15.9 15.5 12.9 12.5 0.0 212 Mother's report 68.3 68.1 63.5 58.0 1.7 83.0 82.6 76.0 57.7 53.1 0.9 1,101 Either source 84.5 84.0 78.7 72.1 2.0 99.0 98.5 91.5 70.6 65.6 0.9 1,313 Vaccinated by 12 months of age3
82.9
82.5
77.4
70.6
2.0
97.3
96.4
90.4
63.6
60.1
3.4
1,313
1 Polio 0 is the polio vaccination given at birth. 2 BCG, measles and three doses each of DPT and polio vaccine (excluding polio vaccine given at birth) 3 For children whose information was based on the mother’s report, the proportion of vaccinations given during the first year of life was assumed to be the same as for children with a written record of vaccination.
Maternal and Child Health * 157
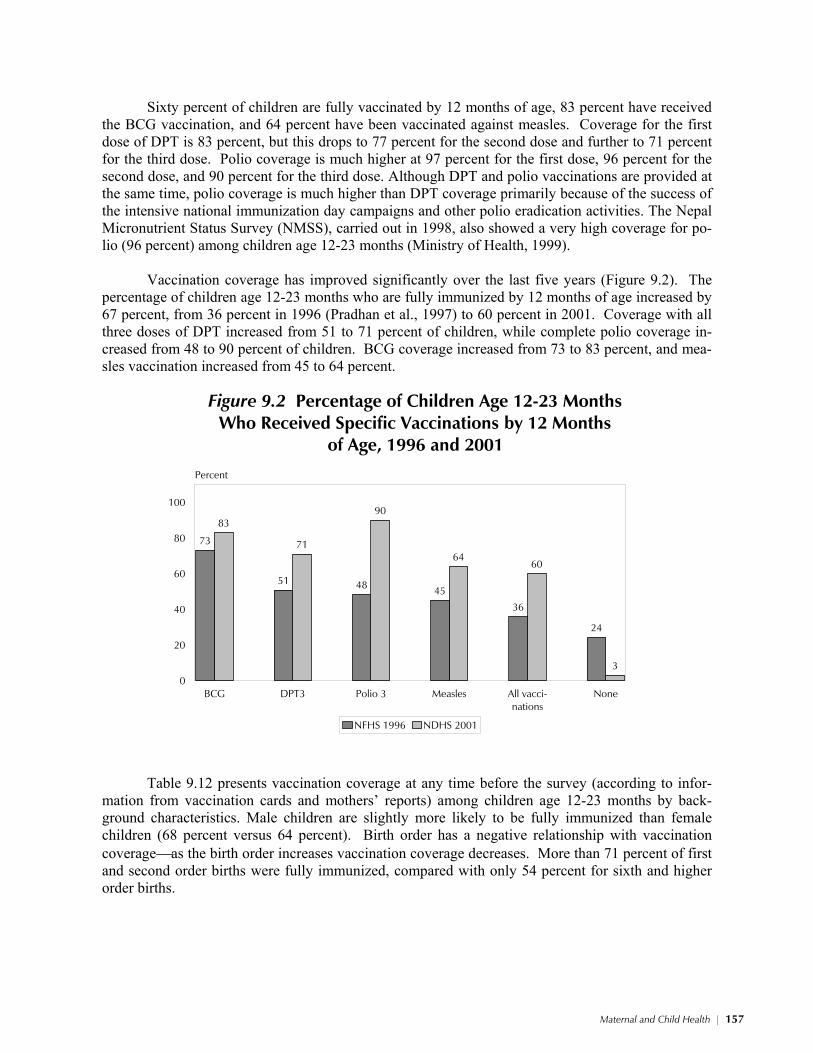
Sixty percent of children are fully vaccinated by 12 months of age, 83 percent have received
the BCG vaccination, and 64 percent have been vaccinated against measles. Coverage for the first dose of DPT is 83 percent, but this drops to 77 percent for the second dose and further to 71 percent for the third dose. Polio coverage is much higher at 97 percent for the first dose, 96 percent for the second dose, and 90 percent for the third dose. Although DPT and polio vaccinations are provided at the same time, polio coverage is much higher than DPT coverage primarily because of the success of the intensive national immunization day campaigns and other polio eradication activities. The Nepal Micronutrient Status Survey (NMSS), carried out in 1998, also showed a very high coverage for po-lio (96 percent) among children age 12-23 months (Ministry of Health, 1999).
Vaccination coverage has improved significantly over the last five years (Figure 9.2). The
percentage of children age 12-23 months who are fully immunized by 12 months of age increased by 67 percent, from 36 percent in 1996 (Pradhan et al., 1997) to 60 percent in 2001. Coverage with all three doses of DPT increased from 51 to 71 percent of children, while complete polio coverage in-creased from 48 to 90 percent of children. BCG coverage increased from 73 to 83 percent, and mea-sles vaccination increased from 45 to 64 percent.
73
51 48 45
36
24
83
71
90
6460
3
BCG DPT3 Polio 3 Measles All vacci-nations
None0
20
40
60
80
100
Percent
NFHS 1996 NDHS 2001
Figure 9.2 Percentage of Children Age 12-23 MonthsWho Received Specific Vaccinations by 12 Months
of Age, 1996 and 2001
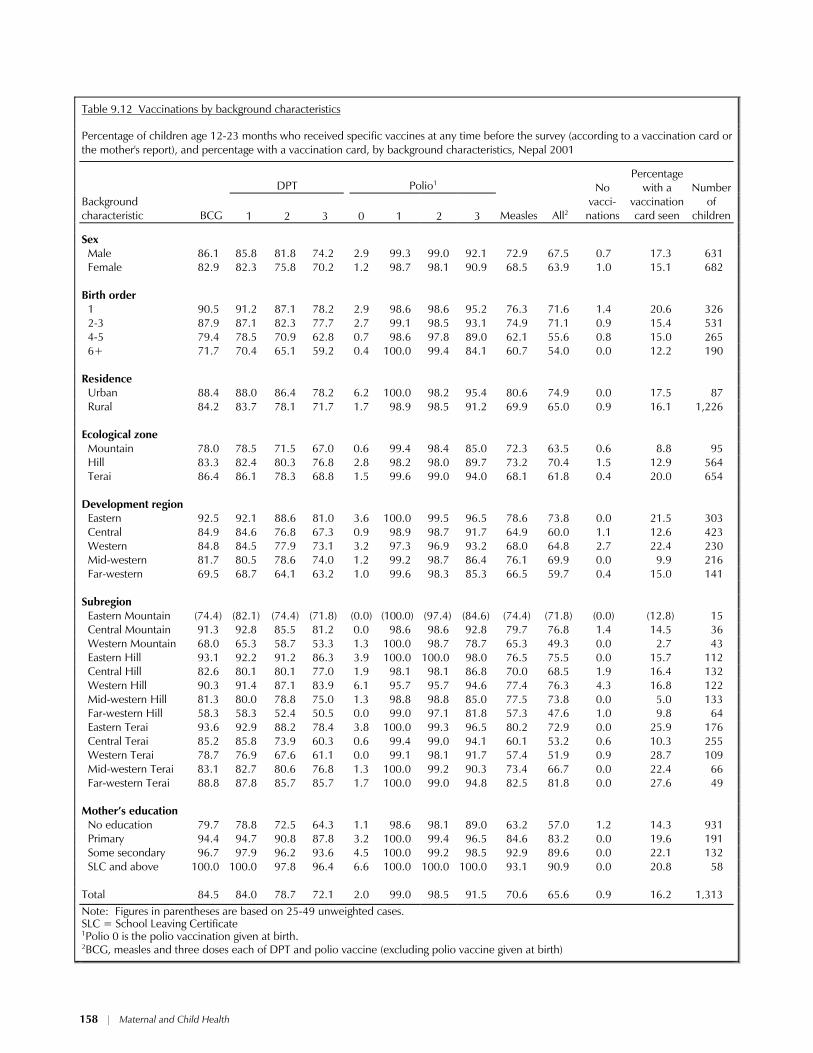
Table 9.12 presents vaccination coverage at any time before the survey (according to infor-
mation from vaccination cards and mothers’ reports) among children age 12-23 months by back-ground characteristics. Male children are slightly more likely to be fully immunized than female children (68 percent versus 64 percent). Birth order has a negative relationship with vaccination coverageas the birth order increases vaccination coverage decreases. More than 71 percent of first and second order births were fully immunized, compared with only 54 percent for sixth and higher order births.
158 * Maternal and Child Health
Table 9.12 Vaccinations by background characteristics
Percentage of children age 12-23 months who received specific vaccines at any time before the survey (according to a vaccination card or the mother's report), and percentage with a vaccination card, by background characteristics, Nepal 2001
DPT Polio1
Background characteristic
BCG
1
2
3
0
1
2
3
Measles
All2
No
vacci-nations
Percentage with a
vaccination card seen
Number
of children
Sex Male 86.1 85.8 81.8 74.2 2.9 99.3 99.0 92.1 72.9 67.5 0.7 17.3 631 Female 82.9 82.3 75.8 70.2 1.2 98.7 98.1 90.9 68.5 63.9 1.0 15.1 682 Birth order 1 90.5 91.2 87.1 78.2 2.9 98.6 98.6 95.2 76.3 71.6 1.4 20.6 326 2-3 87.9 87.1 82.3 77.7 2.7 99.1 98.5 93.1 74.9 71.1 0.9 15.4 531 4-5 79.4 78.5 70.9 62.8 0.7 98.6 97.8 89.0 62.1 55.6 0.8 15.0 265 6+ 71.7 70.4 65.1 59.2 0.4 100.0 99.4 84.1 60.7 54.0 0.0 12.2 190 Residence Urban 88.4 88.0 86.4 78.2 6.2 100.0 98.2 95.4 80.6 74.9 0.0 17.5 87 Rural 84.2 83.7 78.1 71.7 1.7 98.9 98.5 91.2 69.9 65.0 0.9 16.1 1,226 Ecological zone Mountain 78.0 78.5 71.5 67.0 0.6 99.4 98.4 85.0 72.3 63.5 0.6 8.8 95 Hill 83.3 82.4 80.3 76.8 2.8 98.2 98.0 89.7 73.2 70.4 1.5 12.9 564 Terai 86.4 86.1 78.3 68.8 1.5 99.6 99.0 94.0 68.1 61.8 0.4 20.0 654 Development region Eastern 92.5 92.1 88.6 81.0 3.6 100.0 99.5 96.5 78.6 73.8 0.0 21.5 303 Central 84.9 84.6 76.8 67.3 0.9 98.9 98.7 91.7 64.9 60.0 1.1 12.6 423 Western 84.8 84.5 77.9 73.1 3.2 97.3 96.9 93.2 68.0 64.8 2.7 22.4 230 Mid-western 81.7 80.5 78.6 74.0 1.2 99.2 98.7 86.4 76.1 69.9 0.0 9.9 216 Far-western 69.5 68.7 64.1 63.2 1.0 99.6 98.3 85.3 66.5 59.7 0.4 15.0 141 Subregion Eastern Mountain (74.4) (82.1) (74.4) (71.8) (0.0) (100.0) (97.4) (84.6) (74.4) (71.8) (0.0) (12.8) 15 Central Mountain 91.3 92.8 85.5 81.2 0.0 98.6 98.6 92.8 79.7 76.8 1.4 14.5 36 Western Mountain 68.0 65.3 58.7 53.3 1.3 100.0 98.7 78.7 65.3 49.3 0.0 2.7 43 Eastern Hill 93.1 92.2 91.2 86.3 3.9 100.0 100.0 98.0 76.5 75.5 0.0 15.7 112 Central Hill 82.6 80.1 80.1 77.0 1.9 98.1 98.1 86.8 70.0 68.5 1.9 16.4 132 Western Hill 90.3 91.4 87.1 83.9 6.1 95.7 95.7 94.6 77.4 76.3 4.3 16.8 122 Mid-western Hill 81.3 80.0 78.8 75.0 1.3 98.8 98.8 85.0 77.5 73.8 0.0 5.0 133 Far-western Hill 58.3 58.3 52.4 50.5 0.0 99.0 97.1 81.8 57.3 47.6 1.0 9.8 64 Eastern Terai 93.6 92.9 88.2 78.4 3.8 100.0 99.3 96.5 80.2 72.9 0.0 25.9 176 Central Terai 85.2 85.8 73.9 60.3 0.6 99.4 99.0 94.1 60.1 53.2 0.6 10.3 255 Western Terai 78.7 76.9 67.6 61.1 0.0 99.1 98.1 91.7 57.4 51.9 0.9 28.7 109 Mid-western Terai 83.1 82.7 80.6 76.8 1.3 100.0 99.2 90.3 73.4 66.7 0.0 22.4 66 Far-western Terai 88.8 87.8 85.7 85.7 1.7 100.0 99.0 94.8 82.5 81.8 0.0 27.6 49 Mother’s education No education 79.7 78.8 72.5 64.3 1.1 98.6 98.1 89.0 63.2 57.0 1.2 14.3 931 Primary 94.4 94.7 90.8 87.8 3.2 100.0 99.4 96.5 84.6 83.2 0.0 19.6 191 Some secondary 96.7 97.9 96.2 93.6 4.5 100.0 99.2 98.5 92.9 89.6 0.0 22.1 132 SLC and above 100.0 100.0 97.8 96.4 6.6 100.0 100.0 100.0 93.1 90.9 0.0 20.8 58 Total 84.5 84.0 78.7 72.1 2.0 99.0 98.5 91.5 70.6 65.6 0.9 16.2 1,313
Note: Figures in parentheses are based on 25-49 unweighted cases. SLC = School Leaving Certificate
1Polio 0 is the polio vaccination given at birth. 2BCG, measles and three doses each of DPT and polio vaccine (excluding polio vaccine given at birth)
Maternal and Child Health * 159
As expected, urban coverage (75 percent) is higher than rural coverage (65 percent); how-
ever, the gap has narrowed over the last five years. This indicates that there has been considerable improvement in immunization coverage in rural areas, while a relatively smaller change occurred in urban areas. The percentage of children age 12-23 months fully immunized is higher among children residing in the hill ecological zone than among children residing in the mountain and terai zones. In spite of the fact that transportation is better in the terai and it is easier to maintain a cold-chain, the coverage in that zone is lower. This could be attributed to a higher dropout in the third dose of DPT and a lower coverage for the measles vaccination. The Eastern development region has the highest immunization coverage (74 percent) compared with the other development regions. Immunization coverage is highest in the Far-western terai subregion (82 percent).
The percentage of children fully immunized increases with mother’s educational level. For
example, only 57 percent of children of mothers with no education are fully immunized, compared with 91 percent of children whose mothers have completed an SLC or above.
Vaccination cards were seen for 16 percent of children, with first order births and children
from the terai region the most likely to have cards. Educated mothers are also more likely to show a vaccination card than mothers with little or no education.
9.6 PREVALENCE AND TREATMENT OF ARI AND FEVER
ACUTE RESPIRATORY INFECTION
Acute respiratory infection (ARI) is one of the leading causes of childhood morbidity and
mortality in Nepal. The ARI program focuses on its early diagnosis and treatment with antibiotics, which can prevent a large proportion of deaths due to pneumonia. Therefore, emphasis is placed in the early recognition of the signs of ARI and its impending severity by primary health care workers and health volunteers. In the 2001 NDHS, the prevalence of ARI was estimated by asking mothers whether their children below five years of age had been sick with a cough accompanied by short, rapid breathing in the two weeks preceding the survey. These symptoms are compatible with ARI. It should be noted that morbidity data are subjective since the information is based on a mother’s per-ception of her child’s illness without any medical diagnosis. The prevalence of ARI is also subject to seasonality.
Table 9.13 shows that 23 percent of children below five years of age had symptoms of ARI at
some time in the two weeks preceding the survey. The prevalence of ARI varies with the age of the child. Prevalence was highest among children 6-11 months of age. The prevalence of ARI decreases with increasing age. There are no significant differences in the prevalence of ARI by sex of the child and urban-rural residence. However, there are marked differences by region of residence. The prevalence of ARI is lowest in the hill zone (20 percent) compared with the terai and mountain zones. Prevalence is also lowest in the Mid-western region (15 percent) and highest in the Eastern region (30 percent) compared with the other development regions.
ARI prevalence varied little by mothers’ education, with the exception of children of mothers
with at least an SLC level of education, who are least likely to show symptoms of ARI. Prevalence is also slightly higher among children whose mothers smoke cigarettes or other tobacco (25 percent) than among children of mothers who do not smoke (22 percent).

160 * Maternal and Child Health
Table 9.13 Prevalence and treatment of symptoms of ARI and fever
Percentage of children under five years who had a cough accompanied by short, rapid breathing (symptoms of ARI) in the two weeks preceding the survey, and percentage who had fever in the two weeks preceding the survey, and among children with symptoms of ARI and/or fever, percentage for whom treatment was sought from a health facility or provider, by background characteristics, Nepal 2001
Background characteristic
Children with
symptoms of ARI
Children with fever
Number of
children
Children with symptoms of
ARI and/or fever, for whom treatment was sought from
a health facility/provider1
Number of
children
Age in months <6 28.1 27.9 651 21.6 259 6-11 36.3 47.8 631 27.9 357 12-23 27.7 40.9 1,313 25.8 626 24-35 21.5 32.4 1,245 19.4 481 36-47 17.7 26.1 1,329 21.8 419 48-59 15.0 22.8 1,301 25.5 354 Sex Male 23.7 32.1 3,194 25.9 1,238 Female 21.8 31.8 3,277 21.6 1,259 Residence Urban 23.8 26.7 431 33.3 158 Rural 22.7 32.3 6,040 23.1 2,338 Ecological zone Mountain 31.7 32.9 480 21.7 198 Hill 20.3 30.3 2,698 23.7 947 Terai 23.5 33.2 3,292 24.0 1,351 Development region Eastern 30.0 35.1 1,499 28.5 662 Central 25.4 35.7 2,126 20.0 918 Western 18.4 27.0 1,196 29.7 397 Mid-western 15.1 27.1 975 17.7 297 Far-western 17.4 29.0 674 22.7 223 Subregion Eastern Mountain 29.9 33.7 99 26.9 40 Central Mountain 47.6 40.5 163 19.7 94 Western Mountain 20.7 26.8 218 21.4 65 Eastern Hill 23.7 29.4 498 25.2 166 Central Hill 25.1 30.7 656 29.7 244 Western Hill 22.6 32.8 653 27.1 259 Mid-western Hill 12.4 27.9 593 12.3 177 Far-western Hill 15.0 30.4 298 18.4 101 Eastern Terai 33.5 38.4 901 29.8 456 Central Terai 22.8 37.6 1,306 15.9 579 Western Terai 13.3 20.1 543 34.5 138 Mid-western Terai 22.2 28.9 298 28.4 104 Far-western Terai 14.7 24.6 244 26.5 73 Mother’s education No education 22.6 32.8 4,758 20.9 1,840 Primary 24.6 29.9 915 31.3 353 Some secondary 23.1 30.0 553 33.7 218 SLC and above 18.6 27.6 244 28.9 86 Mother's smoking status Smokes cigarettes/tobacco 25.4 na 1,671 na 670 Does not smoke cigarettes/tobacco
21.9
na
4,799
na
1,826
Total 22.8 32.0 6,471 23.7 2,496
na = Not applicable ARI = Acute respiratory infection SLC = School Leaving Certificate 1Excludes pharmacy, shop, and traditional practitioner

Maternal and Child Health * 161
FEVER
Fever is a manifestation of malaria, although it also accompanies various other illnesses. Ma-
laria and fever contribute to high levels of malnutrition and high mortality. Although fever can occur throughout the year, malaria is more prevalent during the rainy season. For this reason, temporal factors must be taken into account when interpreting fever as an indicator of malaria prevalence. Pre-sumptive treatment of fever with antimalarial tablets is advocated where malaria is endemic. Table 9.13 shows the percentage of children under five years of age who had fever during the two weeks preceding the survey.
Thirty-two percent of children under five years of age had fever in the two weeks preceding
the survey. The prevalence of fever varies with the age of the child. One in two children age 6-11 months had fever; this decreases to about one in five children among those age 48-59 months. There is little variation in the prevalence of fever by sex, but children residing in rural areas have a higher prevalence of fever (32 percent) than urban children (27 percent). Differences in the prevalence of fever by ecological region are minor. Prevalence of fever is lowest among children of mothers with at least an SLC level of education.
TREATMENT OF ARI AND FEVER
Table 9.13 shows the percentage of children with symptoms of ARI and or fever for whom
treatment was sought. As shown by the table, use of a health facility or provider for the treatment of ARI and/or fever is low in Nepal. Less than one in four children (24 percent) with symptoms of ARI and/or fever were taken to a health facility or provider for the treatment of ARI. Children age 24-35 months are least likely (19 percent) to be taken for treatment, while those age 6-11 months are most likely to be taken for treatment (28 percent). A higher proportion of male than female children are taken for treatment (26 percent versus 22 percent). Likewise a higher proportion of urban than rural children are taken to a health facility or provider (33 percent versus 23 percent). Children residing in the Eastern and Western development regions and especially the Western terai subregion are more likely than other children to be taken for treatment. Children of mothers with no education are least likely to be taken for treatment (21 percent), compared with mothers with some education.
9.7 DIARRHEA
STOOL DISPOSAL
Diarrhea is frequently caused by the use of contaminated water and unhygienic practices re-
lated to food preparation and excreta disposal. If human feces are left uncontained, diarrheal disease may spread by direct or indirect contact. So stool disposal practices also play a vital role in the prevalence of diarrhea.
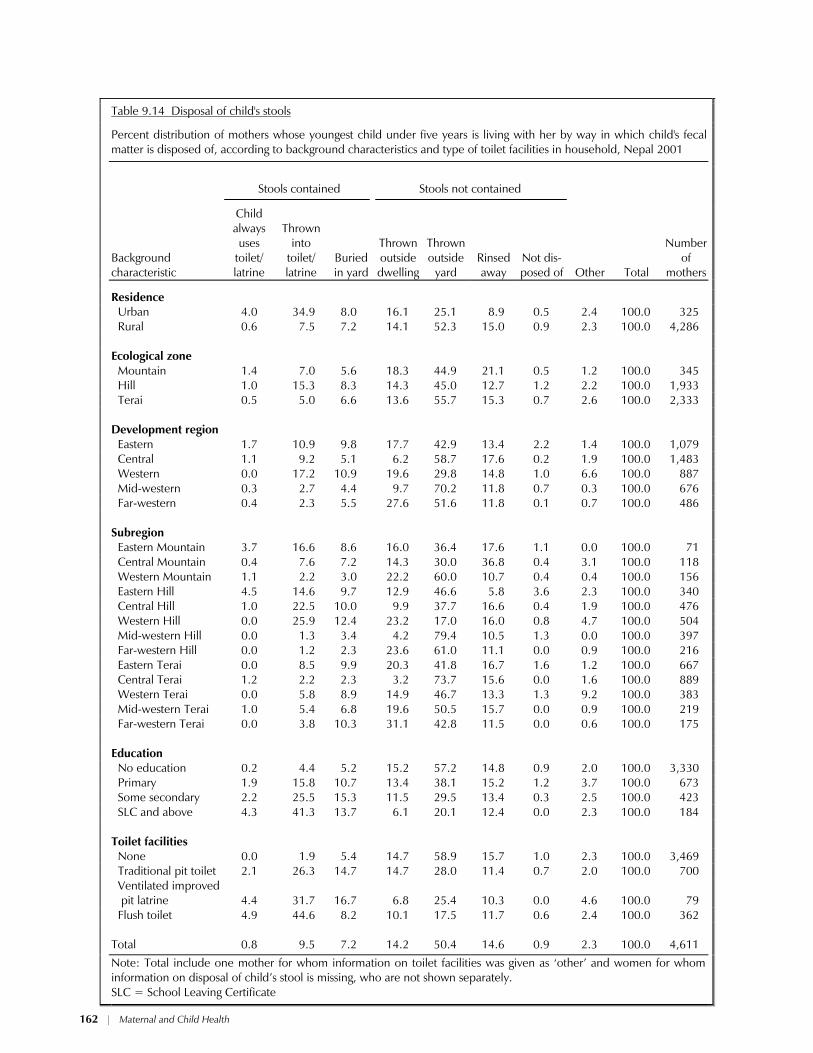
Table 9.14 presents information on the disposal of the stools of children under five years of
age by background characteristics and type of toilet facilities available in the household. Only 18 percent of children’s stools are “contained,” that is, the child always uses the toilet facilities or the child’s stool is thrown into the toilet or buried in the yard. On the other hand, 65 percent of chil-dren’s stools are either thrown outside the dwelling or yard, while 15 percent of children’s stools are rinsed away, indicating a high potential in Nepal for the spread of diarrheal diseases from uncon-tained stools.
162 * Maternal and Child Health
Table 9.14 Disposal of child's stools
Percent distribution of mothers whose youngest child under five years is living with her by way in which child's fecal matter is disposed of, according to background characteristics and type of toilet facilities in household, Nepal 2001
Stools contained
Stools not contained
Background characteristic
Child always uses
toilet/ latrine
Thrown into
toilet/ latrine
Buried in yard
Thrown outside dwelling
Thrown outside
yard Rinsed away
Not dis-posed of Other Total
Number of
mothers
Residence Urban 4.0 34.9 8.0 16.1 25.1 8.9 0.5 2.4 100.0 325 Rural 0.6 7.5 7.2 14.1 52.3 15.0 0.9 2.3 100.0 4,286 Ecological zone Mountain 1.4 7.0 5.6 18.3 44.9 21.1 0.5 1.2 100.0 345 Hill 1.0 15.3 8.3 14.3 45.0 12.7 1.2 2.2 100.0 1,933 Terai 0.5 5.0 6.6 13.6 55.7 15.3 0.7 2.6 100.0 2,333 Development region Eastern 1.7 10.9 9.8 17.7 42.9 13.4 2.2 1.4 100.0 1,079 Central 1.1 9.2 5.1 6.2 58.7 17.6 0.2 1.9 100.0 1,483 Western 0.0 17.2 10.9 19.6 29.8 14.8 1.0 6.6 100.0 887 Mid-western 0.3 2.7 4.4 9.7 70.2 11.8 0.7 0.3 100.0 676 Far-western 0.4 2.3 5.5 27.6 51.6 11.8 0.1 0.7 100.0 486 Subregion Eastern Mountain 3.7 16.6 8.6 16.0 36.4 17.6 1.1 0.0 100.0 71 Central Mountain 0.4 7.6 7.2 14.3 30.0 36.8 0.4 3.1 100.0 118 Western Mountain 1.1 2.2 3.0 22.2 60.0 10.7 0.4 0.4 100.0 156 Eastern Hill 4.5 14.6 9.7 12.9 46.6 5.8 3.6 2.3 100.0 340 Central Hill 1.0 22.5 10.0 9.9 37.7 16.6 0.4 1.9 100.0 476 Western Hill 0.0 25.9 12.4 23.2 17.0 16.0 0.8 4.7 100.0 504 Mid-western Hill 0.0 1.3 3.4 4.2 79.4 10.5 1.3 0.0 100.0 397 Far-western Hill 0.0 1.2 2.3 23.6 61.0 11.1 0.0 0.9 100.0 216 Eastern Terai 0.0 8.5 9.9 20.3 41.8 16.7 1.6 1.2 100.0 667 Central Terai 1.2 2.2 2.3 3.2 73.7 15.6 0.0 1.6 100.0 889 Western Terai 0.0 5.8 8.9 14.9 46.7 13.3 1.3 9.2 100.0 383 Mid-western Terai 1.0 5.4 6.8 19.6 50.5 15.7 0.0 0.9 100.0 219 Far-western Terai 0.0 3.8 10.3 31.1 42.8 11.5 0.0 0.6 100.0 175 Education No education 0.2 4.4 5.2 15.2 57.2 14.8 0.9 2.0 100.0 3,330 Primary 1.9 15.8 10.7 13.4 38.1 15.2 1.2 3.7 100.0 673 Some secondary 2.2 25.5 15.3 11.5 29.5 13.4 0.3 2.5 100.0 423 SLC and above 4.3 41.3 13.7 6.1 20.1 12.4 0.0 2.3 100.0 184 Toilet facilities None 0.0 1.9 5.4 14.7 58.9 15.7 1.0 2.3 100.0 3,469 Traditional pit toilet 2.1 26.3 14.7 14.7 28.0 11.4 0.7 2.0 100.0 700 Ventilated improved
pit latrine
4.4
31.7
16.7
6.8
25.4
10.3
0.0
4.6 100.0
79
Flush toilet 4.9 44.6 8.2 10.1 17.5 11.7 0.6 2.4 100.0 362 Total 0.8 9.5 7.2 14.2 50.4 14.6 0.9 2.3 100.0 4,611
Note: Total include one mother for whom information on toilet facilities was given as ‘other’ and women for whom information on disposal of child’s stool is missing, who are not shown separately. SLC = School Leaving Certificate
Maternal and Child Health * 163
The way in which children’s stools are dis-
posed of varies markedly by urban-rural residence. Forty-seven percent of urban children’s stools are contained, compared with only 15 percent in rural areas. Regional variations exist in the practice of stool disposal. Hygienic disposal of stools is more common in the hill ecological zone and in the Western development region than in the other re-gions. Not surprisingly, education exerts a posi-tive influence on the hygienic disposal of chil-dren’s stools, as does the availability of toilet fa-cilities.
PREVALENCE OF DIARRHEA
Diarrhea has been singled out for investiga-
tion for two reasons. Dehydration caused by diar-rhea is a major cause of morbidity and mortality among young children, and the condition can be easily treated by oral rehydration therapy (ORT). Exposure to agents that cause diarrheal disease is frequently related to the use of contaminated water and unhygienic practices of food preparation and excreta disposal. The most effective way to control dehydration is to administer oral rehydration ther-apy promptly.
The Ministry of Health in Nepal has given
high priority to the control of diarrhea through preventive as well as curative strategies. To re-duce the severity of symptoms from dehydration, health education programs promote the use of ORT. The availability of oral rehydration salt (ORS) packages all over the country has been in-creased along with an expanded social marketing system providing supplies to female community health volunteers. In the 2001 NDHS, information was collected on the prevalence of diarrhea among children under five years of age in the two weeks before the interview. The information on preva-lence should be interpreted with caution since the incidence of diarrhea varies with the season.
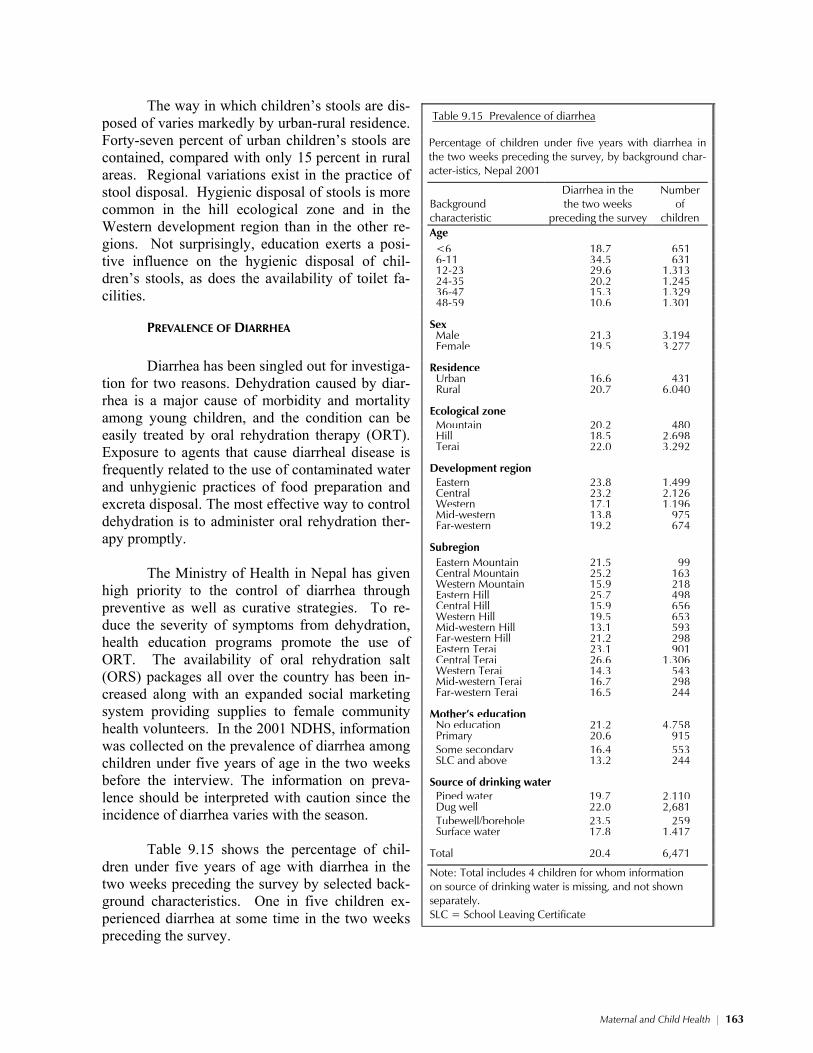
Table 9.15 shows the percentage of chil-
dren under five years of age with diarrhea in the two weeks preceding the survey by selected back-ground characteristics. One in five children ex-perienced diarrhea at some time in the two weeks preceding the survey.
Table 9.15 Prevalence of diarrhea
Percentage of children under five years with diarrhea in the two weeks preceding the survey, by background char-acter-istics, Nepal 2001
Background characteristic
Diarrhea in the the two weeks
preceding the survey
Number of
children
Age <6 18.7 651 6-11 34.5 631 12-23 29.6 1,313 24-35 20.2 1,245 36-47 15.3 1,329 48-59 10.6 1,301 Sex Male 21.3 3,194 Female 19.5 3,277 Residence Urban 16.6 431 Rural 20.7 6,040 Ecological zone Mountain 20.2 480 Hill 18.5 2,698 Terai 22.0 3,292 Development region Eastern 23.8 1,499 Central 23.2 2,126 Western 17.1 1,196 Mid-western 13.8 975 Far-western 19.2 674 Subregion Eastern Mountain 21.5 99 Central Mountain 25.2 163 Western Mountain 15.9 218 Eastern Hill 25.7 498 Central Hill 15.9 656 Western Hill 19.5 653 Mid-western Hill 13.1 593 Far-western Hill 21.2 298 Eastern Terai 23.1 901 Central Terai 26.6 1,306 Western Terai 14.3 543 Mid-western Terai 16.7 298 Far-western Terai 16.5 244 Mother’s education No education 21.2 4,758 Primary 20.6 915 Some secondary 16.4 553 SLC and above 13.2 244 Source of drinking water Piped water 19.7 2,110 Dug well 22.0 2,681 Tubewell/borehole 23.5 259 Surface water 17.8 1,417 Total 20.4 6,471
Note: Total includes 4 children for whom information on source of drinking water is missing, and not shown separately. SLC = School Leaving Certificate
164 * Maternal and Child Health
The incidence of diarrhea varies with age. Prevalence is highest among children age 6-11
months (35 percent). There is little discernible difference in the prevalence of diarrhea by sex of the child, urban-rural residence, and ecological zone. Prevalence is higher in the Eastern and Central development regions.
Children of mothers with little or no educa-tion are also more likely to have diarrhea than chil-dren of mothers with at least some secondary edu-cation. Children living in households where the main source of drinking water is from a well (dug well, tube well, or borehole) are also more prone to diarrhea than children living in households with access to piped drinking water.
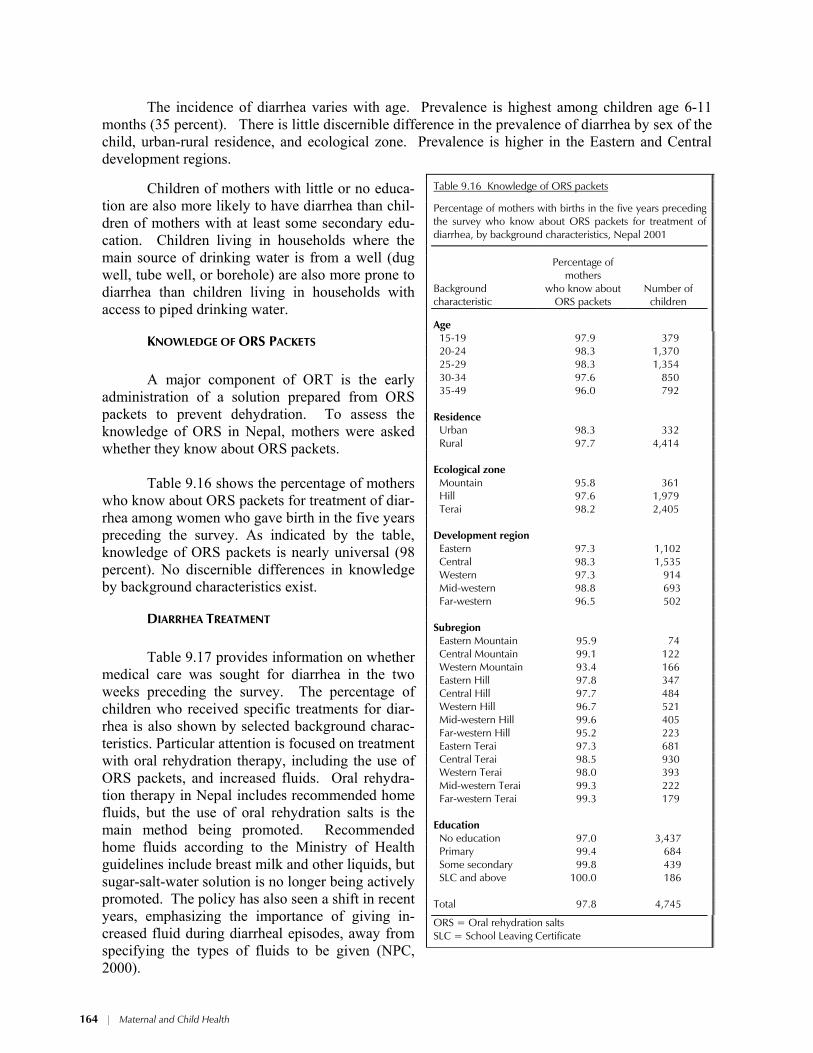
KNOWLEDGE OF ORS PACKETS
A major component of ORT is the early
administration of a solution prepared from ORS packets to prevent dehydration. To assess the knowledge of ORS in Nepal, mothers were asked whether they know about ORS packets.
Table 9.16 shows the percentage of mothers
who know about ORS packets for treatment of diar-rhea among women who gave birth in the five years preceding the survey. As indicated by the table, knowledge of ORS packets is nearly universal (98 percent). No discernible differences in knowledge by background characteristics exist.
DIARRHEA TREATMENT
Table 9.17 provides information on whether
medical care was sought for diarrhea in the two weeks preceding the survey. The percentage of children who received specific treatments for diar-rhea is also shown by selected background charac-teristics. Particular attention is focused on treatment with oral rehydration therapy, including the use of ORS packets, and increased fluids. Oral rehydra-tion therapy in Nepal includes recommended home fluids, but the use of oral rehydration salts is the main method being promoted. Recommended home fluids according to the Ministry of Health guidelines include breast milk and other liquids, but sugar-salt-water solution is no longer being actively promoted. The policy has also seen a shift in recent years, emphasizing the importance of giving in-creased fluid during diarrheal episodes, away from specifying the types of fluids to be given (NPC, 2000).
Table 9.16 Knowledge of ORS packets
Percentage of mothers with births in the five years preceding the survey who know about ORS packets for treatment of diarrhea, by background characteristics, Nepal 2001
Background characteristic
Percentage of mothers
who know about ORS packets
Number of children
Age 15-19 97.9 379 20-24 98.3 1,370 25-29 98.3 1,354 30-34 97.6 850 35-49 96.0 792 Residence Urban 98.3 332 Rural 97.7 4,414 Ecological zone Mountain 95.8 361 Hill 97.6 1,979 Terai 98.2 2,405 Development region Eastern 97.3 1,102 Central 98.3 1,535 Western 97.3 914 Mid-western 98.8 693 Far-western 96.5 502 Subregion Eastern Mountain 95.9 74 Central Mountain 99.1 122 Western Mountain 93.4 166 Eastern Hill 97.8 347 Central Hill 97.7 484 Western Hill 96.7 521 Mid-western Hill 99.6 405 Far-western Hill 95.2 223 Eastern Terai 97.3 681 Central Terai 98.5 930 Western Terai 98.0 393 Mid-western Terai 99.3 222 Far-western Terai 99.3 179 Education No education 97.0 3,437 Primary 99.4 684 Some secondary 99.8 439 SLC and above 100.0 186 Total 97.8 4,745
ORS = Oral rehydration salts SLC = School Leaving Certificate

Maternal and Child Health * 165
Table 9.17 Diarrhea treatment
Percentage of children under five years who had diarrhea in the two weeks preceding the survey taken for treatment to a health provider, percentage who received oral rehydration therapy (ORT), and percentage given other treatments, by background characteristics, Nepal 2001
Oral rehydration therapy (ORT) Other treatments
Background characteristic
Percentage taken to a
health provider1
ORS packets
Increased fluids
ORS or increased
fluids Pill/
syrup Injection
Intra- venous solution
Home remedy/
other
No treat- ment
Number of
children
Age in months <6 9.9 11.2 13.3 19.5 24.0 2.4 0.0 2.2 64.2 121 6-11 23.1 23.8 20.7 35.6 42.2 1.5 0.6 7.0 39.1 218 12-23 26.3 39.2 31.3 54.9 44.9 0.8 1.2 5.9 28.8 388 24-35 20.1 32.9 35.4 54.8 35.5 1.2 0.5 8.1 28.1 251 36-47 18.3 41.3 22.8 50.4 34.6 0.9 0.4 6.2 32.5 203 48-59 19.9 29.2 24.4 43.4 28.9 0.0 0.0 14.8 37.4 138 Sex Male 20.2 32.5 28.2 48.5 37.7 0.9 0.4 6.7 33.4 681 Female 22.2 31.8 24.9 44.4 37.3 1.3 0.8 7.5 36.9 639 Residence Urban 23.1 45.6 39.2 63.2 43.6 0.0 1.2 4.0 25.7 71 Rural 21.1 31.4 25.9 45.6 37.1 1.1 0.6 7.3 35.6 1,249 Ecological zone Mountain 28.2 29.1 28.4 48.1 19.2 0.6 0.0 6.9 43.9 97 Hill 23.7 31.2 37.7 52.1 28.1 1.0 0.3 7.8 36.3 500 Terai 18.5 33.2 18.7 42.5 46.4 1.2 0.9 6.7 33.1 723 Development region Eastern 19.1 38.7 32.3 51.5 33.2 1.7 0.6 8.2 33.6 357 Central 17.6 27.2 16.5 37.7 45.5 0.8 1.2 5.9 36.3 493 Western 30.0 33.8 33.5 52.1 35.6 0.0 0.0 7.6 34.8 205 Mid-western 16.7 27.5 37.3 53.2 26.1 1.2 0.0 10.3 34.1 135 Far-western 31.3 35.5 27.2 50.8 33.9 1.7 0.0 5.1 35.8 130 Subregion Eastern Mountain 32.1 33.9 50.0 58.9 25.0 0.0 0.0 12.5 30.4 21 Central Mountain 20.5 23.1 24.4 43.6 14.1 0.0 0.0 1.3 51.3 41 Western Mountain 35.0 33.3 20.0 46.7 21.7 1.7 0.0 10.0 43.3 35 Eastern Hill 22.4 42.2 44.8 60.3 16.4 0.0 0.0 12.1 33.6 128 Central Hill 26.4 29.6 34.4 50.0 34.8 2.4 1.2 4.0 35.2 104 Western Hill 29.8 33.2 39.4 55.1 35.6 0.0 0.0 6.2 34.6 127 Mid-western Hill (8.6) (17.2) (37.5) (46.1) (21.6) (2.2) (0.0) (10.8) (40.9) 77 Far-western Hill 27.7 24.7 25.7 40.3 33.7 1.0 0.0 5.0 41.0 63 Eastern Terai 15.7 37.0 22.9 45.3 44.3 3.0 1.0 5.4 34.0 208 Central Terai 14.6 26.9 10.3 33.3 52.4 0.4 1.3 6.9 34.9 348 Western Terai 30.3 34.6 23.8 47.2 35.5 0.0 0.0 10.0 35.1 77 Mid-western Terai 27.4 46.9 38.5 67.0 34.1 0.0 0.0 11.2 19.6 50 Far-western Terai 33.2 48.7 36.2 67.7 42.2 2.6 0.0 0.0 25.4 40 Mother’s education No education 18.7 29.1 21.6 42.5 35.9 1.2 0.5 7.3 37.3 1,009 Primary 27.4 39.0 37.7 55.0 40.6 0.0 1.5 4.8 31.5 188 Some secondary 26.7 43.0 47.0 62.7 40.7 0.0 0.0 8.6 26.8 91 SLC and above (45.9) (57.9) (60.4) (76.5) (60.3) (7.7) (0.0) (10.5) (9.4) 32 Total 21.2 32.2 26.6 46.5 37.5 1.1 0.6 7.1 35.1 1,320 Note: Total includes children with missing information on diarrhea treatment who are not shown separately. Figures in parentheses are based on 25-49 unweighted cases. ORS = Oral rehydration salts SLC = School Leaving Certificate 1 Excludes pharmacy, shop, and traditional practitioner

166 * Maternal and Child Health
One in five children with diarrhea in the two weeks prior to the survey was taken to a health
facility for treatment. Children age 12-23 months are most likely to be taken for treatment, and chil-dren less than six months of age are least likely. There is little difference in the percentage of chil-dren taken for treatment for diarrhea by child’s sex and urban-rural residence. Children residing in the mountain ecological zone (28 percent) and children from the Western and Far-western develop-ment regions (about 30 percent) are more likely to be taken to a health facility for treatment than children residing in the other regions.
Children of mothers with an SLC are more than twice as likely to take their sick children to a health facility as mothers with no education.
Almost half of children with diarrhea received some sort of
oral rehydration therapy, that is, either ORS or increased fluids, with 32 percent of children being treated with ORS and 27 percent receiving increased fluids. Thirty-eight percent of children were given a pill or syrup, while 7 percent receive home remedies or other treatments. However, a large proportion of children with diarrhea (35 percent) were not given any treatment.
Generally, therapeutic intervention increases with the in-
creasing age of the child up to 24-35 months and then declines thereafter. Similarly the proportion of children not treated de-creases sharply with increasing age of the child. For example, 64 percent of children under six months of age were not treated for diarrhea, compared with 28 percent of children age 24-35 months.
ORT varies markedly by place of residence, by rural-urban
residence (from 46 percent in rural areas to 63 percent in urban areas), by ecological zone (from 43 percent in the terai to 52 percent in the hill), and by development region (from 38 per-cent in the Central region to 53 percent in the Mid-western region).
Children of educated mothers are also more likely to re-
ceive ORT than children of noneducated mothers.
FEEDING PRACTICE DURING DIARRHEA
It is recommended that children be given more liquids to drink during diarrhea and that food intake not be reduced.
Table 9.18 presents the percent distribution of children under five years who had diarrhea in
the two weeks preceding the survey by feeding practices. One in three children who had diarrhea were given the same amount of liquids, and 27 percent were given more than the usual amount. However, one in four children were given less than their usual amount to drink and 16 percent were not given anything to drink at all. This finding is surprising given the high intensity of educational activities in this area during the last five years.
One in three children with diarrhea was given the same amount of food and 7 percent were given more than the usual amount to eat. However, 44 percent of children with diarrhea were given less than usual. Despite the substantial increase in educational activities about the importance of maintaining food intake during diarrhea, 6 percent of children with diarrhea were not given any food.
Table 9.18 Feeding practices during diarrhea
Percent distribution of children un-der five years who had diarrhea in the two weeks preceding the survey by amount of liquids and food of-fered compared with normal prac-tice, Nepal 2001
Liquids/foods Percent
Amount of liquids offered About the same 32.9 More than usual 26.6 Less than usual 23.9 Nothing to drink 16.4 Don't know 0.1 Total 100.0 Amount of food offered About the same 32.3 More than usual 6.6 Less than usual 43.8 Stopped food 6.0 Never gave food 11.2 Don't know 0.0 Total 100.0 Number of children 1,320
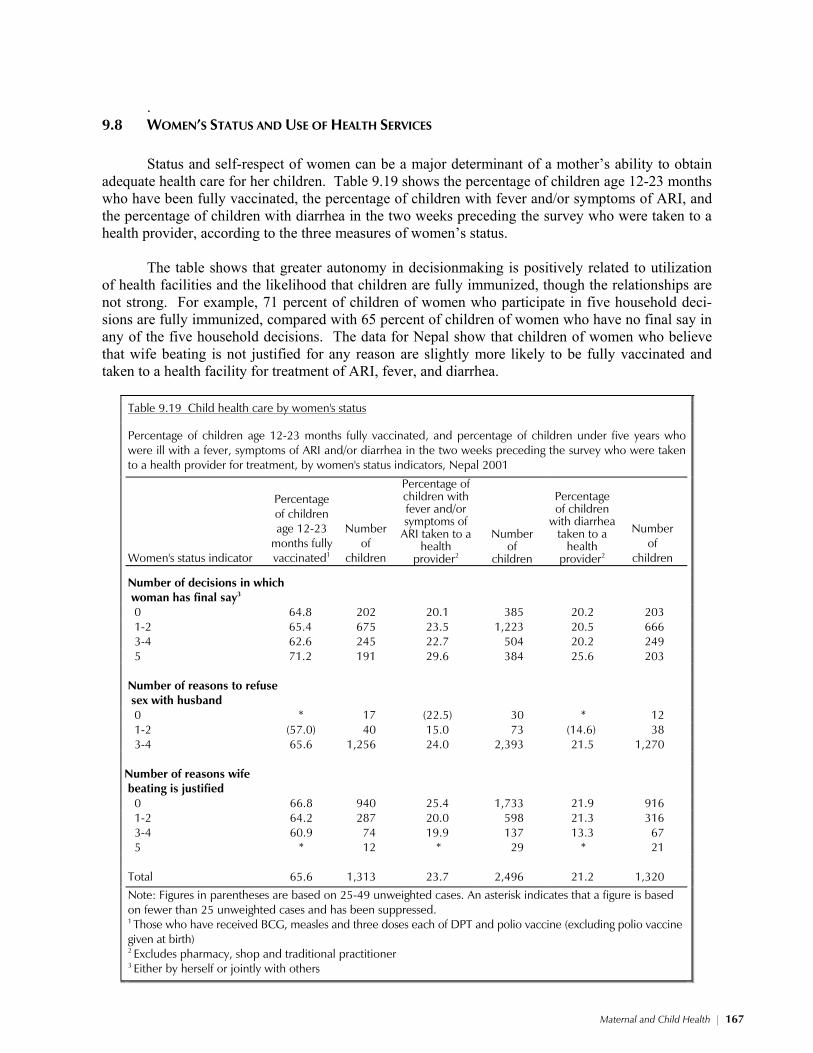
Maternal and Child Health * 167
.
9.8 WOMEN’S STATUS AND USE OF HEALTH SERVICES Status and self-respect of women can be a major determinant of a mother’s ability to obtain
adequate health care for her children. Table 9.19 shows the percentage of children age 12-23 months who have been fully vaccinated, the percentage of children with fever and/or symptoms of ARI, and the percentage of children with diarrhea in the two weeks preceding the survey who were taken to a health provider, according to the three measures of women’s status.
The table shows that greater autonomy in decisionmaking is positively related to utilization
of health facilities and the likelihood that children are fully immunized, though the relationships are not strong. For example, 71 percent of children of women who participate in five household deci-sions are fully immunized, compared with 65 percent of children of women who have no final say in any of the five household decisions. The data for Nepal show that children of women who believe that wife beating is not justified for any reason are slightly more likely to be fully vaccinated and taken to a health facility for treatment of ARI, fever, and diarrhea.
Table 9.19 Child health care by women's status
Percentage of children age 12-23 months fully vaccinated, and percentage of children under five years who were ill with a fever, symptoms of ARI and/or diarrhea in the two weeks preceding the survey who were taken to a health provider for treatment, by women's status indicators, Nepal 2001
Women's status indicator
Percentage of children age 12-23
months fully vaccinated1
Number of
children
Percentage of children with fever and/or symptoms of
ARI taken to a health
provider2
Number
of children
Percentage of children
with diarrhea taken to a
health provider2
Number of
children
Number of decisions in which woman has final say3
0 64.8 202 20.1 385 20.2 203 1-2 65.4 675 23.5 1,223 20.5 666 3-4 62.6 245 22.7 504 20.2 249 5 71.2 191 29.6 384 25.6 203 Number of reasons to refuse sex with husband
0 * 17 (22.5) 30 * 12 1-2 (57.0) 40 15.0 73 (14.6) 38 3-4 65.6 1,256 24.0 2,393 21.5 1,270 Number of reasons wife beating is justified
0 66.8 940 25.4 1,733 21.9 916 1-2 64.2 287 20.0 598 21.3 316 3-4 60.9 74 19.9 137 13.3 67 5 * 12 * 29 * 21 Total 65.6 1,313 23.7 2,496 21.2 1,320
Note: Figures in parentheses are based on 25-49 unweighted cases. An asterisk indicates that a figure is based on fewer than 25 unweighted cases and has been suppressed. 1 Those who have received BCG, measles and three doses each of DPT and polio vaccine (excluding polio vaccine given at birth) 2 Excludes pharmacy, shop and traditional practitioner 3 Either by herself or jointly with others
168 * Maternal and Child Health
9.9 WOMEN’S PERCEPTIONS OF PROBLEMS IN ACCESSING HEALTH CARE Many factors can prevent a woman from getting medical advice or treatment for herself. In
the 2001 NDHS, women age 15-49 were asked whether various issues pose “a big problem,” “a small problem,” or are “not a problem” in accessing health care for themselves when they are sick.
Table 9.20 shows that two in three women consider getting money for treatment to be a big
problem, and 57 percent mention not wanting to go to a health facility alone to be a big problem. One in two women also considers the distance to a health facility, having to take transport, and lack of a female provider to be big problems. Knowing where to go was a big problem for 28 percent of women. In general, 87 percent of women mentioned that they considered accessing health care to be a big problem for any of the specified reasons. Education and urban-rural residence are the two background variables most likely to impact a woman’s perception of being able to access health care for herself. Urban women are much less likely than rural women to cite any of the specified reasons as being a big problem in accessing health care for themselves. Similarly, nearly twice as many women with no education mention at least one of the specified problems as women with an SLC level of education or above.
9.10 USE OF SMOKING TOBACCO
Tobacco smoking during pregnancy increases the risk of having a small or low birth weight
baby. Its use at other times also adversely affects women’s health and may increase respiratory ill-nesses among children. Table 9.21 shows the percentage of women who smoke cigarettes or pipes or use tobacco and the distribution of women who smoke by the number of cigarettes smoked in the last 24 hours by background characteristics. Since more than one mode of tobacco consumption is possi-ble, the percentage using tobacco may sum to more than 100 percent.
Nearly one in four women smoke cigarettes, while 4 percent smoke a pipe, and 6 per-
cent use some other form of tobacco. Smoking is more prevalent among older women than among younger women, in rural areas than in urban areas, and in the mountain ecological zone and Mid-western development region than in the other regions. Education is negatively associated with smok-ing. Women who are neither pregnant nor breastfeeding are also more likely to smoke than other women.
One in five women who smoke reported that they consumed 10 or more cigarettes in the 24
hours preceding the survey, 16 percent smoked 6-9 cigarettes, 39 percent smoked 3-5 cigarettes, and 18 percent smoked 1-2 cigarettes. Five percent of women who usually smoke did not smoke in the 24 hours preceding the survey.
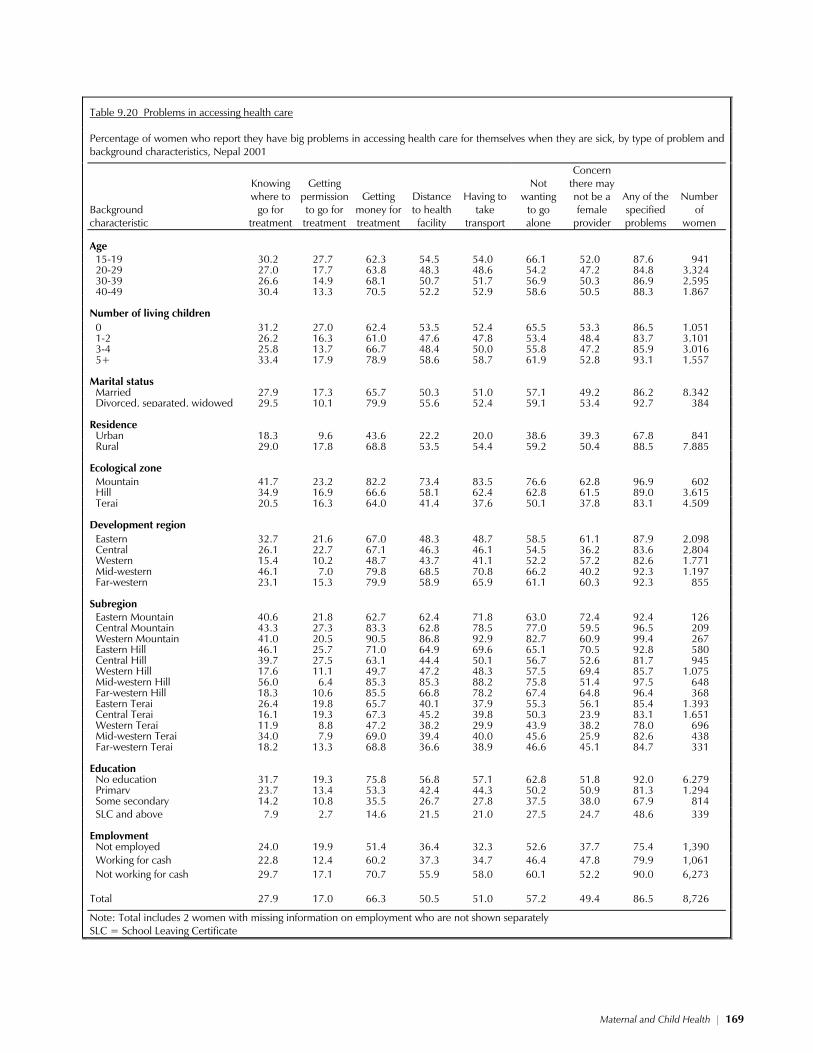
Maternal and Child Health * 169
Table 9.20 Problems in accessing health care
Percentage of women who report they have big problems in accessing health care for themselves when they are sick, by type of problem and background characteristics, Nepal 2001
Background characteristic
Knowing where to
go for treatment
Getting permission to go for treatment
Getting money for treatment
Distance to health facility
Having to take
transport
Not wanting
to go alone
Concern there may not be a female
provider
Any of the specified problems
Number of
women
Age 15-19 30.2 27.7 62.3 54.5 54.0 66.1 52.0 87.6 941 20-29 27.0 17.7 63.8 48.3 48.6 54.2 47.2 84.8 3,324 30-39 26.6 14.9 68.1 50.7 51.7 56.9 50.3 86.9 2,595 40-49 30.4 13.3 70.5 52.2 52.9 58.6 50.5 88.3 1,867 Number of living children 0 31.2 27.0 62.4 53.5 52.4 65.5 53.3 86.5 1,051 1-2 26.2 16.3 61.0 47.6 47.8 53.4 48.4 83.7 3,101 3-4 25.8 13.7 66.7 48.4 50.0 55.8 47.2 85.9 3,016 5+ 33.4 17.9 78.9 58.6 58.7 61.9 52.8 93.1 1,557 Marital status Married 27.9 17.3 65.7 50.3 51.0 57.1 49.2 86.2 8,342 Divorced, separated, widowed 29.5 10.1 79.9 55.6 52.4 59.1 53.4 92.7 384 Residence Urban 18.3 9.6 43.6 22.2 20.0 38.6 39.3 67.8 841 Rural 29.0 17.8 68.8 53.5 54.4 59.2 50.4 88.5 7,885 Ecological zone Mountain 41.7 23.2 82.2 73.4 83.5 76.6 62.8 96.9 602 Hill 34.9 16.9 66.6 58.1 62.4 62.8 61.5 89.0 3,615 Terai 20.5 16.3 64.0 41.4 37.6 50.1 37.8 83.1 4,509 Development region Eastern 32.7 21.6 67.0 48.3 48.7 58.5 61.1 87.9 2,098 Central 26.1 22.7 67.1 46.3 46.1 54.5 36.2 83.6 2,804 Western 15.4 10.2 48.7 43.7 41.1 52.2 57.2 82.6 1,771 Mid-western 46.1 7.0 79.8 68.5 70.8 66.2 40.2 92.3 1,197 Far-western 23.1 15.3 79.9 58.9 65.9 61.1 60.3 92.3 855 Subregion Eastern Mountain 40.6 21.8 62.7 62.4 71.8 63.0 72.4 92.4 126 Central Mountain 43.3 27.3 83.3 62.8 78.5 77.0 59.5 96.5 209 Western Mountain 41.0 20.5 90.5 86.8 92.9 82.7 60.9 99.4 267 Eastern Hill 46.1 25.7 71.0 64.9 69.6 65.1 70.5 92.8 580 Central Hill 39.7 27.5 63.1 44.4 50.1 56.7 52.6 81.7 945 Western Hill 17.6 11.1 49.7 47.2 48.3 57.5 69.4 85.7 1,075 Mid-western Hill 56.0 6.4 85.3 85.3 88.2 75.8 51.4 97.5 648 Far-western Hill 18.3 10.6 85.5 66.8 78.2 67.4 64.8 96.4 368 Eastern Terai 26.4 19.8 65.7 40.1 37.9 55.3 56.1 85.4 1,393 Central Terai 16.1 19.3 67.3 45.2 39.8 50.3 23.9 83.1 1,651 Western Terai 11.9 8.8 47.2 38.2 29.9 43.9 38.2 78.0 696 Mid-western Terai 34.0 7.9 69.0 39.4 40.0 45.6 25.9 82.6 438 Far-western Terai 18.2 13.3 68.8 36.6 38.9 46.6 45.1 84.7 331 Education No education 31.7 19.3 75.8 56.8 57.1 62.8 51.8 92.0 6,279 Primary 23.7 13.4 53.3 42.4 44.3 50.2 50.9 81.3 1,294 Some secondary 14.2 10.8 35.5 26.7 27.8 37.5 38.0 67.9 814 SLC and above 7.9 2.7 14.6 21.5 21.0 27.5 24.7 48.6 339 Employment Not employed 24.0 19.9 51.4 36.4 32.3 52.6 37.7 75.4 1,390 Working for cash 22.8 12.4 60.2 37.3 34.7 46.4 47.8 79.9 1,061 Not working for cash 29.7 17.1 70.7 55.9 58.0 60.1 52.2 90.0 6,273 Total 27.9 17.0 66.3 50.5 51.0 57.2 49.4 86.5 8,726
Note: Total includes 2 women with missing information on employment who are not shown separately SLC = School Leaving Certificate
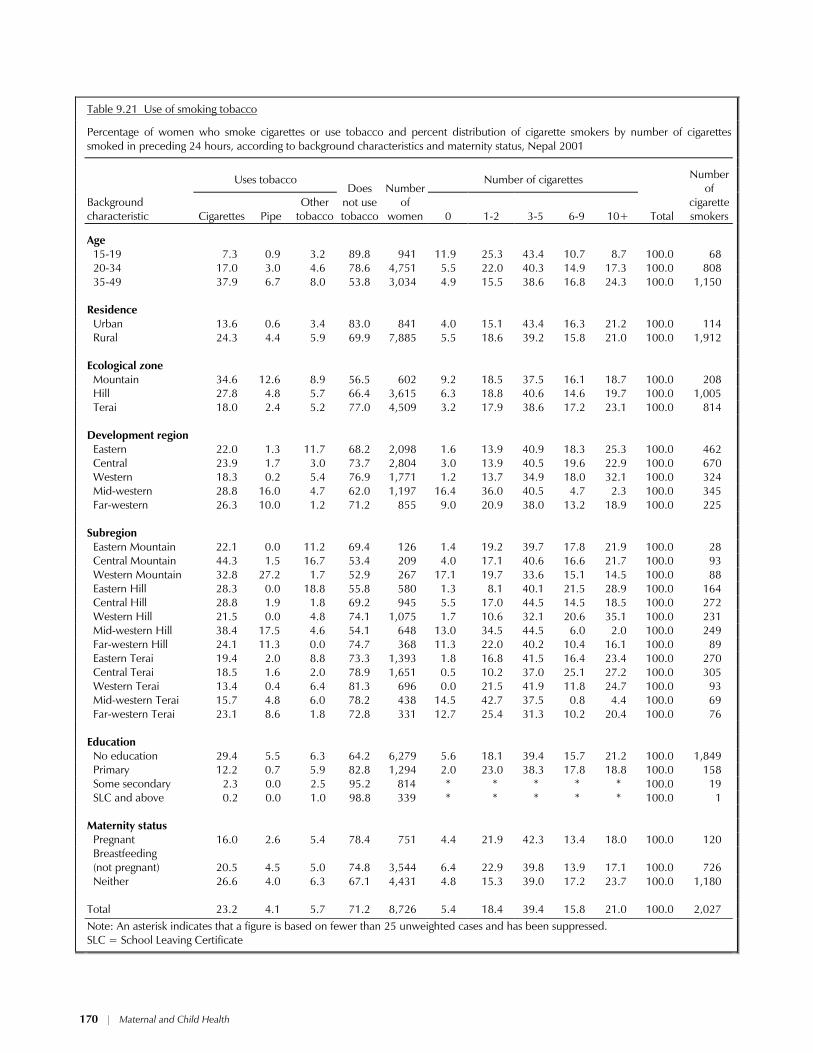
170 * Maternal and Child Health
Table 9.21 Use of smoking tobacco
Percentage of women who smoke cigarettes or use tobacco and percent distribution of cigarette smokers by number of cigarettes smoked in preceding 24 hours, according to background characteristics and maternity status, Nepal 2001
Uses tobacco Number of cigarettes
Background characteristic Cigarettes Pipe
Other tobacco
Does
not use tobacco
Number
of women 0 1-2 3-5 6-9 10+ Total
Number of
cigarette smokers
Age 15-19 7.3 0.9 3.2 89.8 941 11.9 25.3 43.4 10.7 8.7 100.0 68 20-34 17.0 3.0 4.6 78.6 4,751 5.5 22.0 40.3 14.9 17.3 100.0 808 35-49 37.9 6.7 8.0 53.8 3,034 4.9 15.5 38.6 16.8 24.3 100.0 1,150 Residence Urban 13.6 0.6 3.4 83.0 841 4.0 15.1 43.4 16.3 21.2 100.0 114 Rural 24.3 4.4 5.9 69.9 7,885 5.5 18.6 39.2 15.8 21.0 100.0 1,912 Ecological zone Mountain 34.6 12.6 8.9 56.5 602 9.2 18.5 37.5 16.1 18.7 100.0 208 Hill 27.8 4.8 5.7 66.4 3,615 6.3 18.8 40.6 14.6 19.7 100.0 1,005 Terai 18.0 2.4 5.2 77.0 4,509 3.2 17.9 38.6 17.2 23.1 100.0 814 Development region Eastern 22.0 1.3 11.7 68.2 2,098 1.6 13.9 40.9 18.3 25.3 100.0 462 Central 23.9 1.7 3.0 73.7 2,804 3.0 13.9 40.5 19.6 22.9 100.0 670 Western 18.3 0.2 5.4 76.9 1,771 1.2 13.7 34.9 18.0 32.1 100.0 324 Mid-western 28.8 16.0 4.7 62.0 1,197 16.4 36.0 40.5 4.7 2.3 100.0 345 Far-western 26.3 10.0 1.2 71.2 855 9.0 20.9 38.0 13.2 18.9 100.0 225 Subregion Eastern Mountain 22.1 0.0 11.2 69.4 126 1.4 19.2 39.7 17.8 21.9 100.0 28 Central Mountain 44.3 1.5 16.7 53.4 209 4.0 17.1 40.6 16.6 21.7 100.0 93 Western Mountain 32.8 27.2 1.7 52.9 267 17.1 19.7 33.6 15.1 14.5 100.0 88 Eastern Hill 28.3 0.0 18.8 55.8 580 1.3 8.1 40.1 21.5 28.9 100.0 164 Central Hill 28.8 1.9 1.8 69.2 945 5.5 17.0 44.5 14.5 18.5 100.0 272 Western Hill 21.5 0.0 4.8 74.1 1,075 1.7 10.6 32.1 20.6 35.1 100.0 231 Mid-western Hill 38.4 17.5 4.6 54.1 648 13.0 34.5 44.5 6.0 2.0 100.0 249 Far-western Hill 24.1 11.3 0.0 74.7 368 11.3 22.0 40.2 10.4 16.1 100.0 89 Eastern Terai 19.4 2.0 8.8 73.3 1,393 1.8 16.8 41.5 16.4 23.4 100.0 270 Central Terai 18.5 1.6 2.0 78.9 1,651 0.5 10.2 37.0 25.1 27.2 100.0 305 Western Terai 13.4 0.4 6.4 81.3 696 0.0 21.5 41.9 11.8 24.7 100.0 93 Mid-western Terai 15.7 4.8 6.0 78.2 438 14.5 42.7 37.5 0.8 4.4 100.0 69 Far-western Terai 23.1 8.6 1.8 72.8 331 12.7 25.4 31.3 10.2 20.4 100.0 76 Education No education 29.4 5.5 6.3 64.2 6,279 5.6 18.1 39.4 15.7 21.2 100.0 1,849 Primary 12.2 0.7 5.9 82.8 1,294 2.0 23.0 38.3 17.8 18.8 100.0 158 Some secondary 2.3 0.0 2.5 95.2 814 * * * * * 100.0 19 SLC and above 0.2 0.0 1.0 98.8 339 * * * * * 100.0 1 Maternity status Pregnant 16.0 2.6 5.4 78.4 751 4.4 21.9 42.3 13.4 18.0 100.0 120 Breastfeeding
(not pregnant) 20.5 4.5 5.0 74.8 3,544 6.4 22.9 39.8 13.9 17.1 100.0 726
Neither 26.6 4.0 6.3 67.1 4,431 4.8 15.3 39.0 17.2 23.7 100.0 1,180 Total 23.2 4.1 5.7 71.2 8,726 5.4 18.4 39.4 15.8 21.0 100.0 2,027 Note: An asterisk indicates that a figure is based on fewer than 25 unweighted cases and has been suppressed.
SLC = School Leaving Certificate
Related Documents