BIS WORKING PAPERS No. 74 – August 1999 THE DOLLAR – MARK AXIS by Gabriele Galati BANK FOR INTERNATIONAL SETTLEMENTS Monetary and Economic Department Basel, Switzerland

Welcome message from author
This document is posted to help you gain knowledge. Please leave a comment to let me know what you think about it! Share it to your friends and learn new things together.
Transcript
BIS WORKING PAPERS
No. 74 – August 1999
THE DOLLAR – MARK AXIS
by
Gabriele Galati
BANK FOR INTERNATIONAL SETTLEMENTSMonetary and Economic Department
Basel, Switzerland
BIS Working Papers are written by members of the Monetary and Economic Department of the Bank forInternational Settlements, and from time to time by other economists, and are published by the Bank. The papersare on subjects of topical interest and are technical in character. The views expressed in them are those of theirauthors and not necessarily the views of the BIS.
Copies of publications are available from:
Bank for International SettlementsInformation, Press & Library ServicesCH-4002 Basel, Switzerland
Fax: +41 61 / 280 91 00 and +41 61 / 280 81 00
This publication is available on the BIS website (www.bis.org).
© Bank for International Settlements 1999.All rights reserved. Brief excerpts may be reproduced or translated provided the source is stated.
ISSN 1020-0959
BIS WORKING PAPERS
No. 74 – August 1999
THE DOLLAR – MARK AXIS
by
Gabriele Galati *
Abstract
Over the last two decades, most European currencies have tended to weakenagainst the mark as the latter strengthened against the dollar. Moreover, thestrength of the response of European cross-rates has tended to remain in the sameorder over time. I first set out the stylised facts of this phenomenon, referred to asthe dollar-mark axis, and then try to identify its determinants. In addition toexchange rate policy, I examine the correlation of cyclical fluctuations and tradelinks (two factors suggested by the theory of optimum currency areas) and the biasof international investors in the currency composition of their portfolios.
* I thank Frank Smets for helpful comments on an earlier draft and Florence Béranger for excellent research assistance.

Contents
1. Introduction ............................................................................................................. 1
2. Stylised facts about the dollar-mark polarity .......................................................... 2
3. Explaining the dollar-mark polarity ........................................................................ 8
4. Empirical evidence ................................................................................................. 10
5. Conclusions ............................................................................................................. 16
References .................................................................................................................................. 17

1
1. Introduction
This paper looks at some stylised facts that have characterised foreign exchange markets over the past
25 years. When the mark strengthened against the dollar during this period, most European currencies
tended to weaken against the mark, while the Australian and Canadian dollars tended to weaken
against the US dollar. The extent to which different European cross-rates against the mark responded
to the dollar remained in roughly the same order over time; for instance, the mark/French franc rate
consistently responded less to the dollar’s movements against the mark than did the mark/lira rate.1
The magnitude of the response of European dollar exchange rates to movements in the mark/dollar
rate has instead changed over time. After rising between the early 1970s and 1992, it declined into the
mid-1990s and has since risen again. Observers have referred to these tendencies in different ways,
including the dollar-mark axis or the dollar-mark polarity (Brown, (1979)).2 In this paper I investigate
the determinants of this phenomenon and provide empirical evidence of their importance.
A number of studies have looked at the relationship between currencies and the dollar and the mark
and how it has evolved over time, but only a few have attempted to identify the determinants of these
regularities and to test their importance empirically. The first discussion of the role of different factors
that shape the dollar-mark axis can be found in Brown (1979). According to Brown, while financial
factors affect the mark/dollar exchange rate, other factors such as monetary policy or the trade
structure determine how currencies react to a given change in the mark/dollar rate. In an influential
paper, Giavazzi and Giovannini (1989) ascribe the reaction of currencies to mark/dollar rate changes
to a bias in international investors’ preferences that results in the size of shifts in asset demand relative
to the underlying asset stock being higher for certain currencies than for others. There is now an
extensive literature that looks at the determinants of currency links defined in terms of the variability
of exchange rates rather than in terms of the response to shocks to the dollar or the mark. This
literature finds that two types of factors matter: monetary and exchange rate policy, and factors
derived from the theory of optimum currency areas, such as trade links and the co-movement of
business cycles. Von Hagen and Neumann (1992) provide evidence of the impact of exchange rate
arrangements and monetary policy coordination on currency links. Bayoumi and Eichengreen (1996a,
1996b, 1996c), Bénassy-Quéré (1997), and Frankel and Wei (1993) find that OCA factors explain
some but not all of the exchange rate volatility observed over the last three decades.
This paper provides a comprehensive analysis of the determinants of the dollar-mark axis. I look at a
set of 15 currencies and try to explain their alignment on the dollar-mark axis over the past two
decades. I test the importance of exchange rate policies, the symmetry of cyclical movements, trade
1Throughout this paper, the exchange rate of currency X against the dollar (mark) is expressed in units of currency X perdollar (mark).
2 Brown refers to the mark and the dollar as “polar currencies”.

2
links and international portfolio bias. The empirical analysis combines time-series and cross-sectional
evidence by estimating regression equations with panel data. This analysis is relevant not only for
explaining some stylised facts that have characterised foreign exchange markets over the last few
decades, but also because it provides a framework for analysing the role that the euro will play in
foreign exchange markets. The main findings of the empirical work suggest that exchange rate policy,
trade links and international portfolio bias are the principal determinants of the dollar-mark axis.
The rest of the paper is organised as follows. The next section describes in detail the pattern of
currency links known as the dollar-mark axis and how it has evolved over the last two decades.
Section 3 provides different explanations for these stylised facts. Their importance is tested
empirically in Section 4. Section 5 concludes.
2. Stylised facts about the dollar-mark polarity
In this paper I refer to a currency’s link with the dollar and the mark in terms of the location of that
currency on the dollar-mark axis or dollar-mark polarity. There are different ways of measuring this
link. This paper uses the elasticity of a currency’s dollar exchange rate with respect to movements in
the mark/dollar rate. A currency is located close to the mark (the dollar) on the dollar-mark axis and
closely follows the movements of the mark (dollar) if that elasticity is close to one (zero). The focus in
this paper is therefore on the response of bilateral exchange rates (with respect to the dollar) to shocks
to the bilateral mark/dollar rate. In the literature, shocks to the dollar have often been expressed in
terms of changes in the effective dollar exchange rate (see e.g. Del Giovane and Pozzolo (1998)) or the
dollar/SDR rate (see e.g. Frankel and Wei (1993)), rather than in terms of shocks to the bilateral
mark/dollar rate. Ohno (1999) and McKinnon (1999) look at bilateral exchange rates but use the Swiss
franc as numeraire. I look at the bilateral dollar/mark rate rather than expressing all currencies in terms
of a common numeraire such as the SDR or looking at effective exchange rates, because I am
interested in measuring the response to a shock to a key exchange rate. A similar approach can be
followed to measure the response of dollar exchange rates to shocks to the yen/dollar rate. In practice,
the elasticity of the dollar exchange rate of currency X�FDQ�EH�PHDVXUHG�E\�WKH�VORSH�FRHIILFLHQW� �LQ
the regression of (differences of logarithms of) dollar exchange rates on a constant and (the difference
of the logarithm of) the mark/dollar rate:3
(1) ttt DMX ε+×β+α= $/$/
where t�LV�D�]HUR�PHDQ�HUURU�WHUP�ZLWK�YDULDQFH� 2. Exchange rates are expressed here as differences
of logarithms.
3 See BIS (1996). The equation can be augmented by adding changes in the yen/dollar rate on the right-hand side. In thiscase the right-hand side coefficients will pick up the response to shocks to the mark/dollar and yen/dollar rates.
3
An alternative way to measure currency links, which has been frequently used in the literature, is the
correlation coefficient of dollar exchange rate changes with mark/dollar rate changes or the R2 value of
the above regressions. The advantage of looking at the elasticity rather than a correlation coefficient is
that the former can also provide information on currencies that appreciate against a polar currency
when it strengthens against other currencies.
Exchange rate volatility is another common measure of currency links employed in the literature.
From (1), the variance of the X/$ rate is given by
(2) ( ) ( ) 22 $/var/$var σ+×β= tDMX t
Hence the volatility of the dollar exchange rate of currency X can be viewed as driven by three factors:
mark/dollar volatility, the elasticity of the X/$ rate with respect to movements in the mark/dollar rate,
DQG�LGLRV\QFUDWLF�YRODWLOLW\��FDSWXUHG�E\�WKH�HUURU�WHUP� ���,I�LGLRV\QFUDWLF�PRYHPHQWV�H[SODLQ�OLWWOH�RI
the variance of the X/$ rate, estimating equation (1) will give an R2 value close to one. In this case,
JLYHQ�WKH�YDULDQFH�RI�WKH�PDUN�GROODU�UDWH��WKH�HODVWLFLW\� �ZLOO�GHWHUPLQH�WKH�YDULDQFH�RI�WKH�X/dollar
rate.
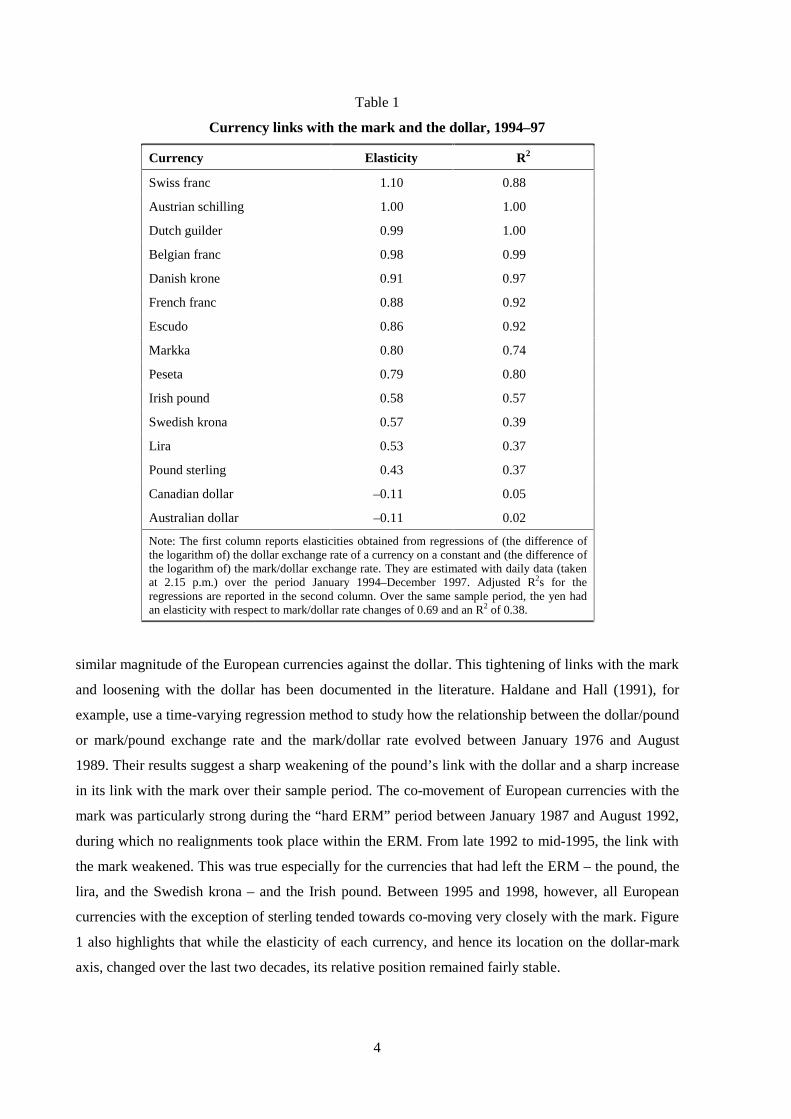
Table 1 shows average dollar elasticities for 13 European currencies and the Canadian and Australian
dollars estimated with daily data over the sample period January 1994 to December 1997. For every
1% appreciation of the mark against the dollar, the Swiss franc appreciated on average by 1.10%
against the dollar. Seen from another perspective, the Swiss franc appreciated by around 0.10% against
the mark when the latter appreciated by 1% against the dollar. The dollar elasticities of the Dutch
guilder, the Belgian franc and the Austrian schilling are around 1%. Hence these currencies moved
about one to one with the mark against the dollar. The elasticities of the Danish krone, the French
franc, the escudo, the markka and the peseta fall somewhat short of 1%. The Irish pound, the pound
sterling, the lira and the Swedish krona have the lowest sensitivities among European currencies, and
tended to share about half of the dollar’s movements against the mark. These currencies also exhibit
high idiosyncratic movements, as indicated by their lower R2 values. At the other end of the spectrum,
the Australian and Canadian dollars depreciated on average by more than 1% against the DM for each
1% depreciation of the US dollar against the mark. Very similar results obtain when the exchange rate
elasticities are estimated using data at monthly or quarterly frequency.
Although the dollar-mark axis characterised foreign exchange markets consistently over time, the
alignment of currencies along the axis has changed. This is shown in Figure 1, which plots elasticities
estimated over rolling windows of 125 days over the last 20 years. Between the late 1970s and the
mid-1990s the exchange rate elasticities of European currencies followed a hump-shaped pattern.
After a sharp rise around the start of the ERM, the elasticities remained close to one until 1992. During
this period, movements of the mark against the dollar were generally accompanied by movements of
4
Table 1
Currency links with the mark and the dollar, 1994–97
Currency Elasticity R2
Swiss franc 1.10 0.88
Austrian schilling 1.00 1.00
Dutch guilder 0.99 1.00
Belgian franc 0.98 0.99
Danish krone 0.91 0.97
French franc 0.88 0.92
Escudo 0.86 0.92
Markka 0.80 0.74
Peseta 0.79 0.80
Irish pound 0.58 0.57
Swedish krona 0.57 0.39
Lira 0.53 0.37
Pound sterling 0.43 0.37
Canadian dollar –0.11 0.05
Australian dollar –0.11 0.02
Note: The first column reports elasticities obtained from regressions of (the difference ofthe logarithm of) the dollar exchange rate of a currency on a constant and (the difference ofthe logarithm of) the mark/dollar exchange rate. They are estimated with daily data (takenat 2.15 p.m.) over the period January 1994–December 1997. Adjusted R2s for theregressions are reported in the second column. Over the same sample period, the yen hadan elasticity with respect to mark/dollar rate changes of 0.69 and an R2 of 0.38.
similar magnitude of the European currencies against the dollar. This tightening of links with the mark
and loosening with the dollar has been documented in the literature. Haldane and Hall (1991), for
example, use a time-varying regression method to study how the relationship between the dollar/pound
or mark/pound exchange rate and the mark/dollar rate evolved between January 1976 and August
1989. Their results suggest a sharp weakening of the pound’s link with the dollar and a sharp increase
in its link with the mark over their sample period. The co-movement of European currencies with the
mark was particularly strong during the “hard ERM” period between January 1987 and August 1992,
during which no realignments took place within the ERM. From late 1992 to mid-1995, the link with
the mark weakened. This was true especially for the currencies that had left the ERM – the pound, the
lira, and the Swedish krona – and the Irish pound. Between 1995 and 1998, however, all European
currencies with the exception of sterling tended towards co-moving very closely with the mark. Figure
1 also highlights that while the elasticity of each currency, and hence its location on the dollar-mark
axis, changed over the last two decades, its relative position remained fairly stable.
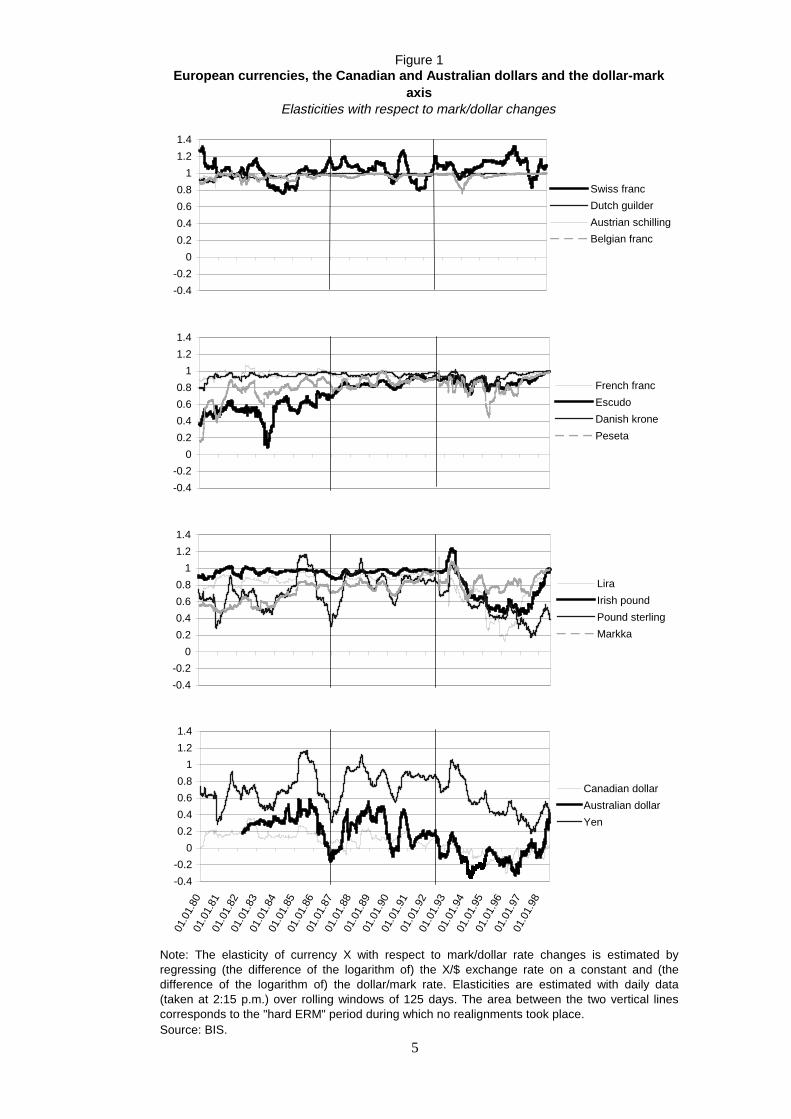
5Source: BIS.
Note: The elasticity of currency X with respect to mark/dollar rate changes is estimated byregressing (the difference of the logarithm of) the X/$ exchange rate on a constant and (thedifference of the logarithm of) the dollar/mark rate. Elasticities are estimated with daily data(taken at 2:15 p.m.) over rolling windows of 125 days. The area between the two vertical linescorresponds to the "hard ERM" period during which no realignments took place.
European currencies, the Canadian and Australian dollars and the dollar-mark axis
Elasticities with respect to mark/dollar changes
Figure 1
-0.4
-0.2
0
0.2
0.4
0.6
0.8
1
1.2
1.4
Swiss franc
Dutch guilder
Austrian schilling
Belgian franc
-0.4
-0.2
0
0.2
0.4
0.6
0.8
1
1.2
1.4
French franc
Escudo
Danish krone
Peseta
-0.4
-0.2
0
0.2
0.4
0.6
0.8
1
1.2
1.4
Lira
Irish pound
Pound sterling
Markka
-0.4
-0.2
0
0.2
0.4
0.6
0.8
1
1.2
1.4
01.0
1.80
01.0
1.81
01.0
1.82
01.0
1.83
01.0
1.84
01.0
1.85
01.0
1.86
01.0
1.87
01.0
1.88
01.0
1.89
01.0
1.90
01.0
1.91
01.0
1.92
01.0
1.93
01.0
1.94
01.0
1.95
01.0
1.96
01.0
1.97
01.0
1.98
Canadian dollar
Australian dollar
Yen
6
Consistent with Brown’s (1998) assertion that the interactions among the G3 currencies are complex,
the yen is not just another currency trading along the dollar-mark axis. Figure 1 shows that the
elasticity of the yen/dollar rate with respect to movements in the mark/dollar rate varied widely during
the last two decades, with none of the consistency seen among the European currencies. To a large
extent, the movements of the yen seem to have been idiosyncratic, as the low R2 in the regression of
yen/dollar rate changes on mark/dollar rate changes suggests. We conclude from these results that the
movement of the yen cannot be well explained in terms of the dollar-mark polarity.
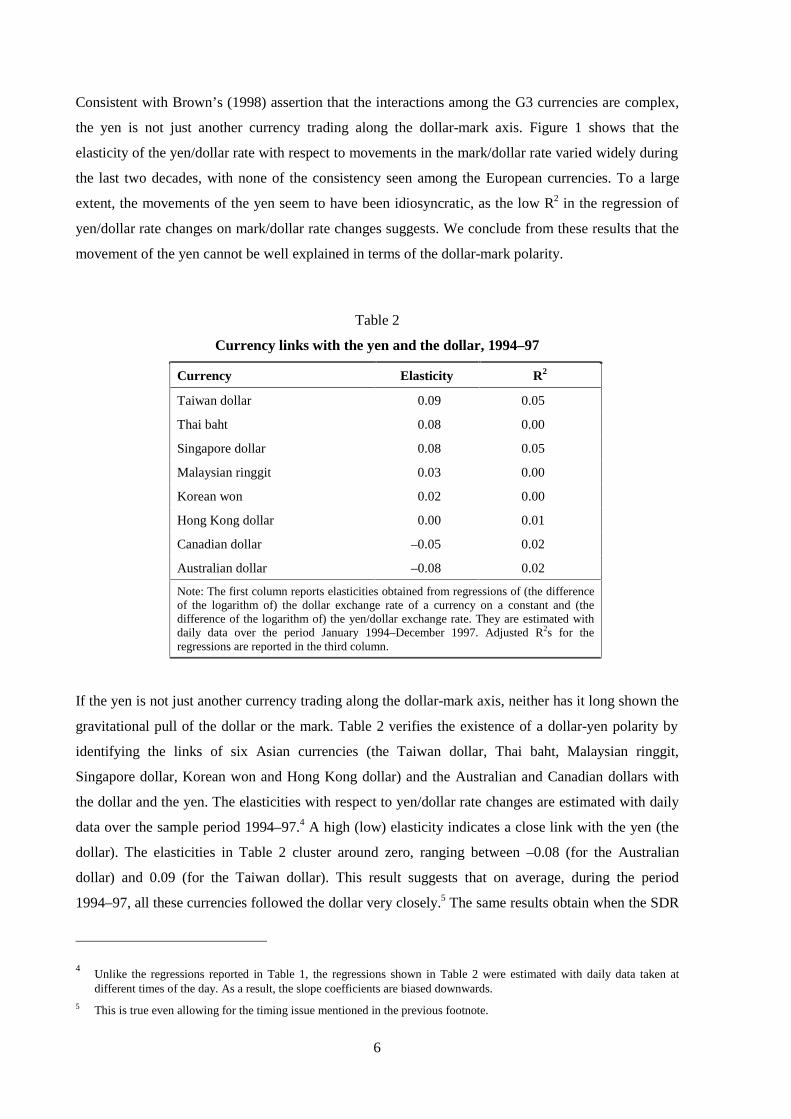
Table 2
Currency links with the yen and the dollar, 1994–97
Currency Elasticity R2
Taiwan dollar 0.09 0.05
Thai baht 0.08 0.00
Singapore dollar 0.08 0.05
Malaysian ringgit 0.03 0.00
Korean won 0.02 0.00
Hong Kong dollar 0.00 0.01
Canadian dollar –0.05 0.02
Australian dollar –0.08 0.02
Note: The first column reports elasticities obtained from regressions of (the differenceof the logarithm of) the dollar exchange rate of a currency on a constant and (thedifference of the logarithm of) the yen/dollar exchange rate. They are estimated withdaily data over the period January 1994–December 1997. Adjusted R2s for theregressions are reported in the third column.
If the yen is not just another currency trading along the dollar-mark axis, neither has it long shown the
gravitational pull of the dollar or the mark. Table 2 verifies the existence of a dollar-yen polarity by
identifying the links of six Asian currencies (the Taiwan dollar, Thai baht, Malaysian ringgit,
Singapore dollar, Korean won and Hong Kong dollar) and the Australian and Canadian dollars with
the dollar and the yen. The elasticities with respect to yen/dollar rate changes are estimated with daily
data over the sample period 1994–97.4 A high (low) elasticity indicates a close link with the yen (the
dollar). The elasticities in Table 2 cluster around zero, ranging between –0.08 (for the Australian
dollar) and 0.09 (for the Taiwan dollar). This result suggests that on average, during the period
1994–97, all these currencies followed the dollar very closely.5 The same results obtain when the SDR
4Unlike the regressions reported in Table 1, the regressions shown in Table 2 were estimated with daily data taken atdifferent times of the day. As a result, the slope coefficients are biased downwards.
5 This is true even allowing for the timing issue mentioned in the previous footnote.
7
is used as numeraire and the exchange rate of each currency in Table 2 is regressed on the dollar and
the yen expressed in terms of SDRs. An important conclusion from this evidence is that the yen did
not play a significant role in Asia.
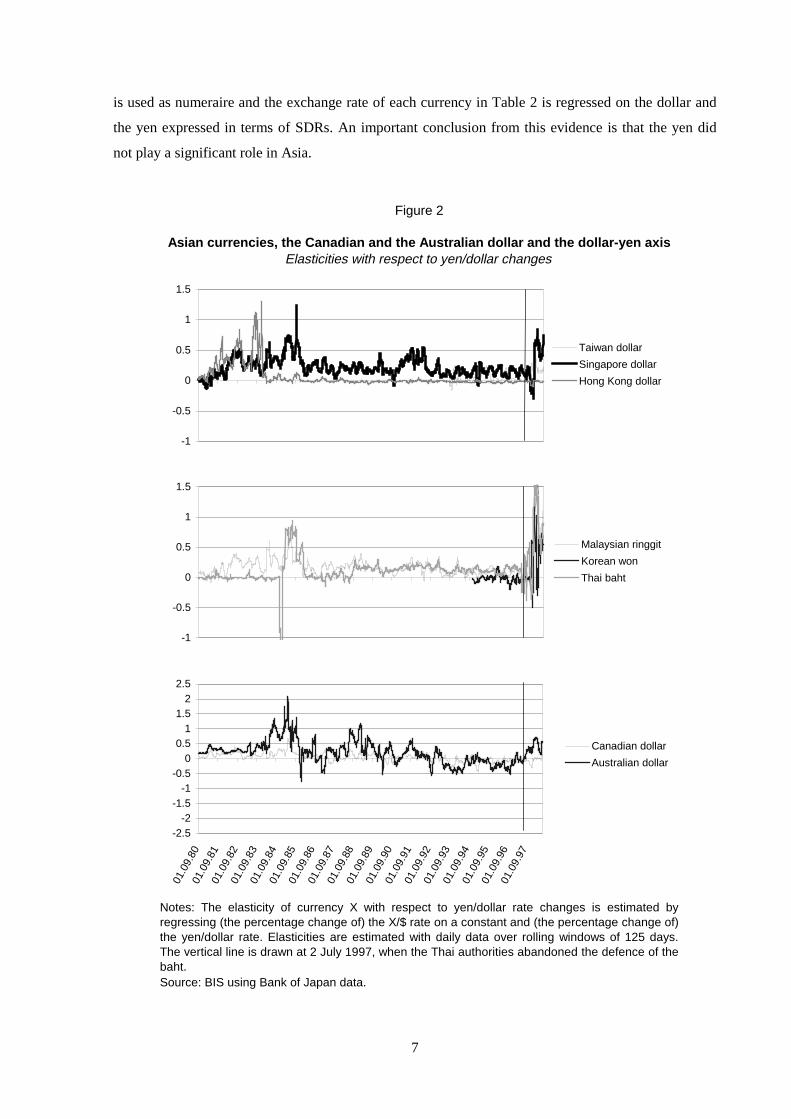
Source: BIS using Bank of Japan data.
Figure 2
Notes: The elasticity of currency X with respect to yen/dollar rate changes is estimated byregressing (the percentage change of) the X/$ rate on a constant and (the percentage change of)the yen/dollar rate. Elasticities are estimated with daily data over rolling windows of 125 days.The vertical line is drawn at 2 July 1997, when the Thai authorities abandoned the defence of thebaht.
Asian currencies, the Canadian and the Australian dollar and the dollar-yen axisElasticities with respect to yen/dollar changes
-1
-0.5
0
0.5
1
1.5
Taiwan dollar
Singapore dollar
Hong Kong dollar
-1
-0.5
0
0.5
1
1.5
Malaysian ringgit
Korean won
Thai baht
-2.5-2
-1.5-1
-0.50
0.51
1.52
2.5
01.0
9.80
01.0
9.81
01.0
9.82
01.0
9.83
01.0
9.84
01.0
9.85
01.0
9.86
01.0
9.87
01.0
9.88
01.0
9.89
01.0
9.90
01.0
9.91
01.0
9.92
01.0
9.93
01.0
9.94
01.0
9.95
01.0
9.96
01.0
9.97
Canadian dollar
Australian dollar
8
In the wake of the devaluation of the Thai baht in July 1997, a number of currencies in Asia and the
Pacific tended to co-move more with the yen following shocks to the yen/dollar rate (Figure 2).
However, the dollar elasticities of these currencies have moved back towards zero since autumn 1998.
Based on this evidence, it seems difficult to support the market commentary frequently heard in 1998
about a “break-up of the dollar bloc in East and South-East Asia”.
3. Explaining the dollar-mark polarity
Exchange rate and monetary policies are obvious factors that may explain dollar-mark polarity. The
well documented fact that European currencies drew closer to the mark in the late 1970s and the 1980s
has been explained by participation in the ERM and associated monetary policies. An early study by
Padoa-Schioppa (1985) reports that the correlation between exchange rates of European currencies
against the mark and the mark/dollar rate is significantly higher during the EMS period (March 1979 –
March 1984) than before (March 1973 – March 1979). This finding is confirmed in an influential
paper by Giavazzi and Giovannini (1989), who use data with different frequencies between 1973 and
1987 to estimate the elasticity of bilateral mark exchange rates with respect to the effective dollar rate
before and during the EMS period. They find lower sensitivities of mark rates in Europe during the
EMS period, which is equivalent to finding values close to one of the elasticities reported in Table 1.
More recently, Del Giovane and Pozzolo (1998) use a simple model to show how the sensitivity of
currencies to movements of the dollar or the mark depends on the relative weight assigned to these
two currencies in a country’s exchange rate policy. Using data for the period 1987–92, they found that
exchange rate and monetary policies explain the bulk of currency links with the mark.
While the role of exchange rate arrangements has been emphasised in the literature, they cannot
account for all the time-series and cross-sectional variation of the observed currency links. The pound
sterling’s abandoning the ERM in 1992, for example, has been explained by the asynchrony of the
business cycle in Germany and the United Kingdom in the early 1990s. Moreover, the synchrony of
the UK and US business cycles in the mid-1990s can be used to explain sterling’s closer link with the
dollar during that period. And even if exchange rate policies play a key role, this begs the question of
why countries join an exchange rate mechanism in the first place (Bayoumi and Eichengreen (1996b)).
I therefore investigate whether underlying forces other than exchange and monetary policy have been
driving currency links.
The theory of optimum currency areas (OCA) first proposed by Mundell (1961) provides a framework
for analysing these forces.6 According to this theory, strong trade links and highly correlated business
6 For a survey of the empirical literature on the OCA, see Bayoumi and Eichengreen (1996a).
9
cycle fluctuations are two key criteria for participating in a currency area, along with high labour
mobility (or strong responsiveness of wages to exchange rate movements) and a well developed
system of fiscal transfers. While the OCA theory asks which criteria should be satisfied for a set of
countries to benefit from fixing their exchange rates, I turn this argument on its head. Using the
approach followed by Bayoumi and Eichengreen (1996b) and, with a focus on Asian currencies, by
Bayoumi and Eichengreen (1996c) and Bénassy-Quéré (1997), I ask whether stronger trade links and
more correlated cyclical fluctuations lead to closer currency links. More specifically, I ask whether the
currency of a country that, ceteris paribus, has a more synchronous business cycle and stronger trade
links with Germany than with the United States co-moves more with the mark than with the dollar.
While Switzerland’s synchrony of cyclical fluctuations and trade links with Germany may explain
why the Swiss franc tracks the mark’s movements against the dollar very closely, the OCA argument
cannot explain why the Swiss franc tends to appreciate against the mark as the mark strengthens
against the dollar. Financial factors, and more specifically safe haven arguments, have typically been
used to account for this phenomenon. I therefore investigate to what extent the observed exchange rate
sensitivities can be explained by how portfolio shifts between the dollar area and Europe are
distributed across currencies. I postulate the international portfolio bias hypothesis according to which
the sensitivities depend on the shifts in asset demand relative to the underlying asset stock in response
to shocks to the mark/dollar exchange rate. The higher the shift in demand for a currency relative to
the underlying stock of that currency, the stronger the reaction of that currency will be. This
hypothesis appears to be particularly apt in explaining the behaviour of Swiss money markets and the
Swiss franc in reaction to portfolio shifts away from the dollar and into Europe. In response to these
shifts, the Swiss franc appreciates against the mark when the mark appreciates against the dollar. The
intuition underlying this effect is that shifts of funds from North America to Europe would have no
effect on European exchange rates if they were distributed neutrally across European assets and every
economy got its share. Switzerland gets more than its share of funds switched into Europe; conversely,
other economies get less than their share. The Swiss franc will therefore appreciate more against the
dollar than the mark.
The literature provides little evidence of this type of argument. Giavazzi and Giovannini (1989)
address it and argue that, owing to capital controls, exchange rate variability is influenced by the
different depth and segmentation of financial markets. They argue that France’s and Italy’s foreign
exchange controls limited the size of financial markets in their own currency, and hence their financial
assets were less substitutable for assets denominated in other currencies. As a result, an exogenous
change of expected rates of return or of the risk premium would have a smaller impact on the French
franc and the lira than on other currencies, such as the Swiss franc, whose international market is
bigger. The exchange rate of these two currencies against the mark (the dollar) is therefore more (less)
exposed to movements in the value of the dollar. However, the behaviour of exchange rates after the
10
abolition of capital controls at the beginning of the 1990s refutes their conclusions. More recently, Del
Giovane and Pozzolo (1998) provide some evidence that differences in information costs across
markets may have led to market segmentation and hence driven differences in currency links.
However, their evidence is based on a very indirect measure of information costs – amounts of dollar
transactions against other currencies as a fraction of the stock of international assets denominated in
that currency.
While no empirical analysis of the dollar-mark axis can be found in the literature, several papers have
looked at the determinants of currency links measured by exchange rate volatility (see e.g. Bayoumi
and Eichengreen (1996b, 1996c) and Bénassy-Quéré (1997)). The primary goal of these studies is to
establish how well OCA factors explain currency links. The empirical method that is typically
followed consists in estimating cross-sectional regressions for different sets of exchange rates over
different sample periods. Measures of exchange rate volatility are regressed on variables capturing the
OCA and different control variables. The results suggest that OCA variables perform quite well in
explaining the variability of bilateral exchange rates in the G-10 and in non -G -10 European countries,
particularly in the 1970s and 1980s. By contrast, OCA variables do not explain why Asian currencies
track the dollar (Bénassy-Quéré (1997)). Bénassy-Quéré and Lahrèche-Révil (1998) show that policies
that target the external balance by stabilising both external competitiveness and the real price of
external debt also play a role.
4. Empirical evidence
In this section I look at three types of determinants of the mark/dollar axis: variables suggested by the
OCA that measure the intensity of trade links and the correlation of business cycles; a variable that
captures exchange rate policies; and a variable that describes financial factors (the portfolio bias of
international investors). Both a graphical analysis and a regression analysis are used to gauge the
importance of these different factors.
In order to investigate how well the co-movement of cyclical fluctuations of country X with Germany
and the United States explains the alignment of its currency along the dollar-mark axis, I look at the
correlation coefficient of output gaps in country X with those in Germany and the United States.
Output gaps are estimated with quarterly data of real GDP using the Hodrick-Prescott filter method. A
high correlation coefficient indicates highly symmetric cyclical fluctuations. Bayoumi and
Eichengreen (1996a) argue that observed movements in output reflect the combined effect of shocks
and the response of labour and capital to these shocks. In a strict sense, the OCA argument focuses on
the symmetry of aggregate shocks that hit different countries rather than the co-movement of measures
of output across countries. Direct tests of currency areas would therefore involve identifying the
11
shocks that hit the different countries.7 For the present analysis, however, this distinction is not
relevant, since I am interested more generally in the response of exchange rates to the relative cyclical
position of the countries involved, regardless of whether it is the direct result of shocks or the
reflection of the adjustment process.8
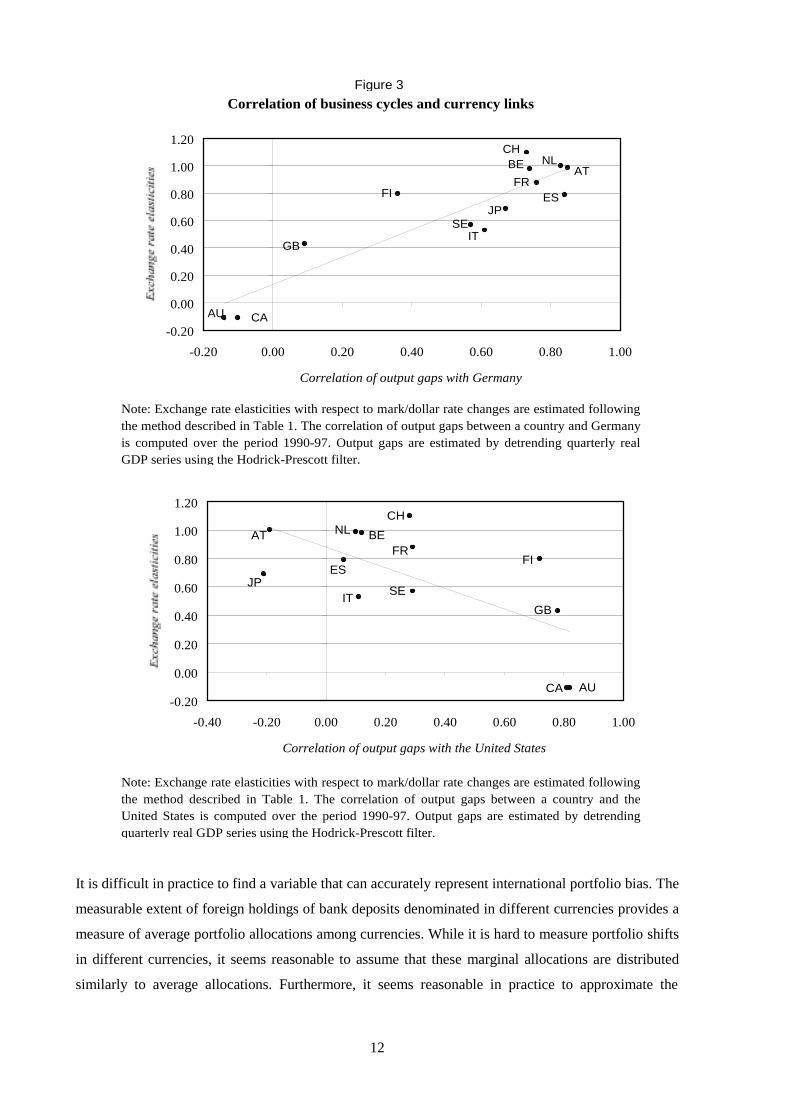
Figure 3 provides cross-sectional graphical evidence that the correlation coefficients of output gaps
with Germany (the United States), computed over the period 1990-1997, are positively (negatively)
related to the exchange rate elasticity with respect to mark/dollar rate changes. In other words, a closer
correlation of business cycle fluctuations with Germany (the United States) is associated with a
location closer to the mark (the dollar) on the dollar-mark axis. It is interesting that, in the 1990s, the
UK business cycle co-moved closely with the US cycle and little with the German cycle. This relative
cyclical position is one of the forces that drove sterling out of the ERM and closer to the dollar.
Another factor suggested by the OCA, the relative trade links of a country with the United States and
Germany, is measured here by the ratio of that country’s bilateral trade with Germany to bilateral trade
with both the United States and Germany. As a variation of this indicator, I also look at the ratio of
bilateral trade with the “mark area” to the sum of bilateral trade with the “mark area” and the “dollar
area”. The “mark area” is assumed here to comprise of Germany and countries with exchange rate
elasticities close to one (Switzerland and the “core” European countries: the Netherlands, Belgium,
Denmark and France), while the “dollar area” comprises the United States and countries with
elasticities close to zero (Canada, Australia, New Zealand, Hong Kong, Singapore, Taiwan, Korea,
Thailand, Indonesia, Malaysia and India). As an alternative indicator of trade links of country X with
Germany and the United States, I also use the ratio of weights on Germany to the sum of weights on
Germany and the United States in the BIS effective exchange rate of country X’s currency. This
indicator has the advantage that it takes account of the importance of trade in third markets. However,
since these weights are not updated on a regular basis, the use of this indicator is limited to cross-
sectional analysis only.
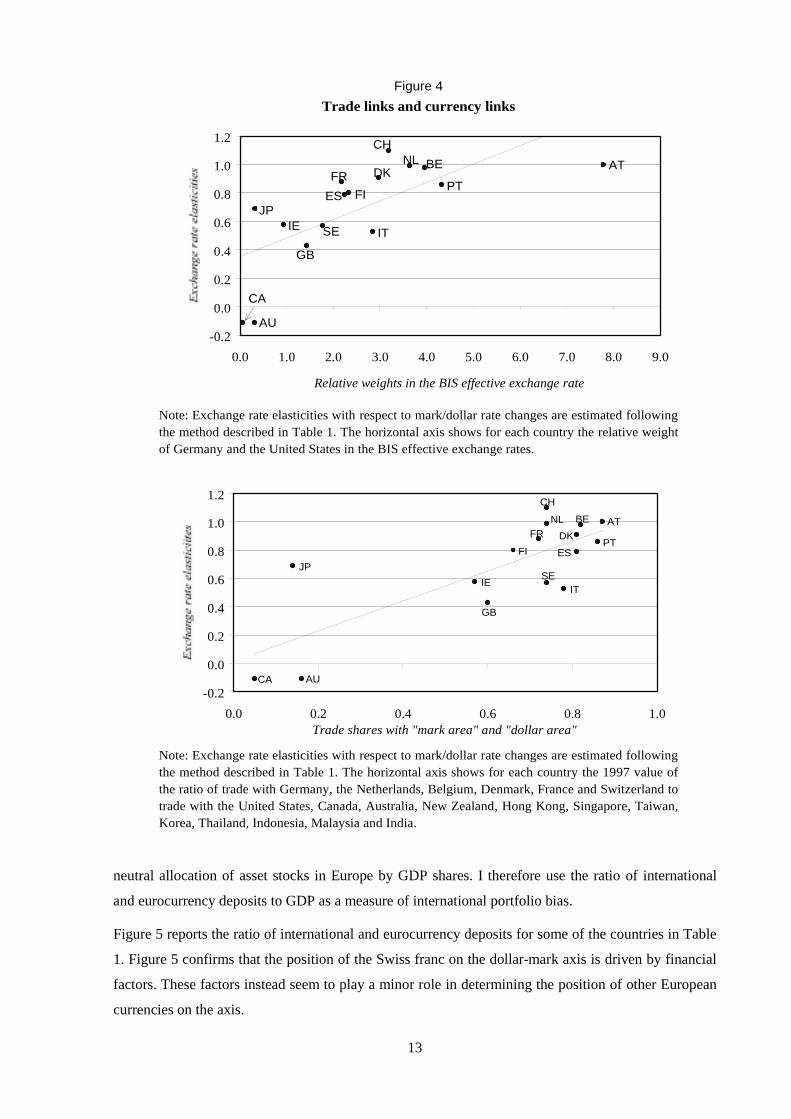
Figure 4 shows that both the indicator based on the BIS effective exchange rate weights and the one
based on the relative share of the “mark area” and the “dollar area”, measured in 1997, convey the
same information. As a country’s trade intensity with Germany (the United States) increases, its
currency co-moves more closely with the mark (the dollar) following a shock to the mark/dollar rate.
In the United Kingdom both the cyclical behaviour and trade are more closely linked with the United
States than Germany. Time-series evidence (not reported here) shows that trade integration between
the United Kingdom and Germany rose in the 1980s and into 1991, but has fallen since 1991.
7In the literature, these shocks have been typically measured by estimating VAR models with long-run restrictions.
8In related work (BIS (1997)), I also look at the cross-country correlation of supply shocks identified by estimatingbivariate VAR models with output growth and inflation and imposing the standard long-run restrictions.
12
It is difficult in practice to find a variable that can accurately represent international portfolio bias. The
measurable extent of foreign holdings of bank deposits denominated in different currencies provides a
measure of average portfolio allocations among currencies. While it is hard to measure portfolio shifts
in different currencies, it seems reasonable to assume that these marginal allocations are distributed
similarly to average allocations. Furthermore, it seems reasonable in practice to approximate the
Note: Exchange rate elasticities with respect to mark/dollar rate changes are estimated followingthe method described in Table 1. The correlation of output gaps between a country and theUnited States is computed over the period 1990-97. Output gaps are estimated by detrendingquarterly real GDP series using the Hodrick-Prescott filter.
Correlation of business cycles and currency links
Note: Exchange rate elasticities with respect to mark/dollar rate changes are estimated followingthe method described in Table 1. The correlation of output gaps between a country and Germanyis computed over the period 1990-97. Output gaps are estimated by detrending quarterly realGDP series using the Hodrick-Prescott filter.
Figure 3
AT
CHNLBE
IT
FRESFI
GB
SEJP
CAAU
-0.20
0.00
0.20
0.40
0.60
0.80
1.00
1.20
-0.20 0.00 0.20 0.40 0.60 0.80 1.00
Correlation of output gaps with Germany
AT
CHNL BE
IT
FR
ESFI
GB
SEJP
CA AU-0.20
0.00
0.20
0.40
0.60
0.80
1.00
1.20
-0.40 -0.20 0.00 0.20 0.40 0.60 0.80 1.00
Correlation of output gaps with the United States
13
neutral allocation of asset stocks in Europe by GDP shares. I therefore use the ratio of international
and eurocurrency deposits to GDP as a measure of international portfolio bias.
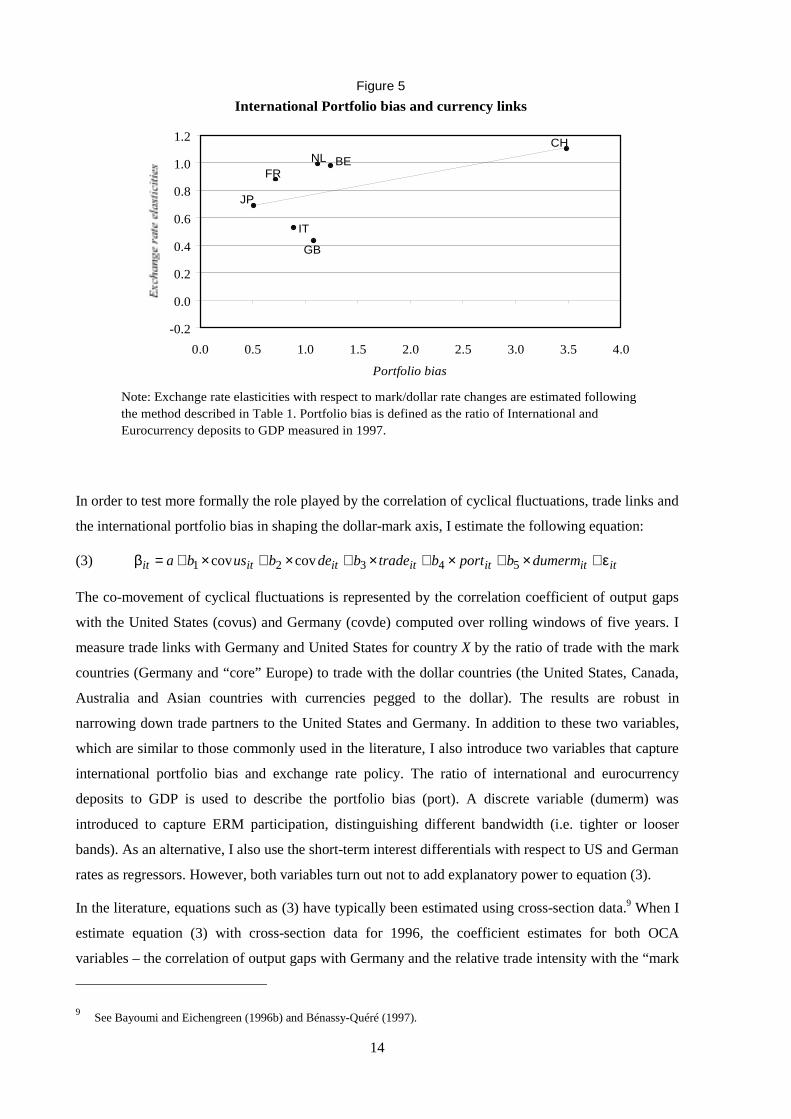
Figure 5 reports the ratio of international and eurocurrency deposits for some of the countries in Table
1. Figure 5 confirms that the position of the Swiss franc on the dollar-mark axis is driven by financial
factors. These factors instead seem to play a minor role in determining the position of other European
currencies on the axis.
Figure 4
Note: Exchange rate elasticities with respect to mark/dollar rate changes are estimated followingthe method described in Table 1. The horizontal axis shows for each country the relative weightof Germany and the United States in the BIS effective exchange rates.
Note: Exchange rate elasticities with respect to mark/dollar rate changes are estimated followingthe method described in Table 1. The horizontal axis shows for each country the 1997 value ofthe ratio of trade with Germany, the Netherlands, Belgium, Denmark, France and Switzerland totrade with the United States, Canada, Australia, New Zealand, Hong Kong, Singapore, Taiwan,Korea, Thailand, Indonesia, Malaysia and India.
Trade links and currency links
AT
PT
CHNL BE
DK
IT
FR
ES FI
GB
SEIEJP
CA
AU-0.2
0.0
0.2
0.4
0.6
0.8
1.0
1.2
0.0 1.0 2.0 3.0 4.0 5.0 6.0 7.0 8.0 9.0
Relative weights in the BIS effective exchange rate
AUCA
JP
IESE
GB
FI ES
FR
IT
DK
BENL
CH
PT
AT
-0.2
0.0
0.2
0.4
0.6
0.8
1.0
1.2
0.0 0.2 0.4 0.6 0.8 1.0Trade shares with "mark area" and "dollar area"
14
In order to test more formally the role played by the correlation of cyclical fluctuations, trade links and
the international portfolio bias in shaping the dollar-mark axis, I estimate the following equation:
(3) ititititititit dumermbportbtradebdebusba ε+×+×+×+×+×+=β 54321 covcov
The co-movement of cyclical fluctuations is represented by the correlation coefficient of output gaps
with the United States (covus) and Germany (covde) computed over rolling windows of five years. I
measure trade links with Germany and United States for country X by the ratio of trade with the mark
countries (Germany and “core” Europe) to trade with the dollar countries (the United States, Canada,
Australia and Asian countries with currencies pegged to the dollar). The results are robust in
narrowing down trade partners to the United States and Germany. In addition to these two variables,
which are similar to those commonly used in the literature, I also introduce two variables that capture
international portfolio bias and exchange rate policy. The ratio of international and eurocurrency
deposits to GDP is used to describe the portfolio bias (port). A discrete variable (dumerm) was
introduced to capture ERM participation, distinguishing different bandwidth (i.e. tighter or looser
bands). As an alternative, I also use the short-term interest differentials with respect to US and German
rates as regressors. However, both variables turn out not to add explanatory power to equation (3).
In the literature, equations such as (3) have typically been estimated using cross-section data.9 When I
estimate equation (3) with cross-section data for 1996, the coefficient estimates for both OCA
variables – the correlation of output gaps with Germany and the relative trade intensity with the “mark
9See Bayoumi and Eichengreen (1996b) and Bénassy-Quéré (1997).
International Portfolio bias and currency links
Note: Exchange rate elasticities with respect to mark/dollar rate changes are estimated following the method described in Table 1. Portfolio bias is defined as the ratio of International and Eurocurrency deposits to GDP measured in 1997.
Figure 5
JP
GB
FR
IT
BENLCH
-0.2
0.0
0.2
0.4
0.6
0.8
1.0
1.2
0.0 0.5 1.0 1.5 2.0 2.5 3.0 3.5 4.0
Portfolio bias
15
area” and the “dollar area” – turn out positive and statistically significant, while the coefficient on the
variable measuring ERM participation does not.10 These results are consistent with the findings of
Bayoumi and Eichengreen (1996a, 1996b). However, a shortcoming of this estimation approach is that
it neglects important information provided by the time-series variation of the data. I therefore prefer to
use panel data (and a random effects model) to estimate equation 3, since they exploit both the time
dimension and the cross-sectional dimension.
The estimation of equation (3) with panel data for seven countries for the sample period 1980–97
gives the following results (t-statistics are given in parentheses): 11
ititititititit portdumermtradedeus ε+×+×+×+×−×−=β 11.013.013.0cov02.0cov02.058.0
(12.50***)12 (–0.58) (–0.53) (1.67*) (5.38***) (5.70***)
The model fits the data reasonably well, as suggested by an adjusted R2 of 0.48. Unlike the cross-
sectional regression, the results from the panel regressions reveal that the coefficients on the variables
that capture the correlation of cyclical fluctuations with Germany and the United States are not
significant. The coefficient on the trade intensity variable is positive and statistically significant, but
only at the 10% confidence level. This result seems to be consistent with several studies that have
found evidence of a positive and statistically significant effect of trade links on the correlation of
cyclical movements across countries (De Cecco and Perri (1996); Frankel and Rose (1996a, 1996b)).
An interpretation of the results for equation (3) is that the co-movement of cyclical fluctuations affects
currency links mainly through trade links. Overall, I find that OCA factors are not as important in
explaining the cross-sectional and time-series patterns of the dollar-mark axis as shown by Bayoumi
and Eichengreen (1996a, 1996b) and others, who explain only cross-sectional differences in exchange
rate variability.
The variable that captures exchange rate policy is now positive and statistically significant. This
finding is consistent with those studies (e.g. von Hagen and Neumann (1992) and Del Giovane and
Pozzolo (1998)) that have found evidence of the significant role of monetary and exchange rate policy.
I also find that the variable measuring portfolio bias is positive and significant. Figure 5 suggests that
this result is driven by the observations for the Swiss franc.
In summary, the regression results suggest that three main factors play a significant role in shaping the
dollar-mark axis. Not surprisingly, exchange rate policy is one of them. OCA variables also matter,
although only trade links remain important once exchange rate policy is taken into account and the
time-series dimension is considered. An important variable which has received little attention in the
10 Results are not reported here. Since the portfolio variable is only available for a few countries, I exclude it from the cross-section regressions.
11 The reduced number of currencies in this regression is dictated by data availability for the portfolio bias variable.12 * = significant at the 10% level, ** = significant at the 5% level, *** = significant at the 1% level.
16
literature is international investors’ portfolio bias. Taken together, these factors explain about half of
the movements of currencies against the dollar or the mark.
5. Conclusions
In this paper I analyse some stylised facts that have characterised foreign exchange markets over the
last few decades, and which are referred to as the dollar-mark axis. I first document how currencies
have followed a pattern in responding to shocks to the mark/dollar rate and how this pattern has
evolved over time. I show that the yen does not fit well into this pattern and, furthermore, that its role
in Asia does not match the role of the dollar in North America and the mark in Europe. I then identify
three factors that have shaped the dollar-mark axis. I provide evidence that, in addition to exchange
rate policies, trade links and the preferences of international investors in their portfolio allocation have
played a significant role.
It is too early to ascertain the extent to which the euro’s role will evolve from that which the mark
played up to end-1998. However, six months after the introduction of the euro there is already
evidence that a dollar-euro axis has formed. In early 1999 a number of currencies including sterling,
the Swiss franc, the Swedish krona and most eastern European currencies reacted to movements in the
euro/dollar rate in a similar way to how they reacted to movements in the mark/dollar rates in recent
years. On average, the Swiss franc depreciated by about 1.07% for every 1% depreciation of the euro
against the dollar. The krona tracked the euro somewhat less closely, and tended to depreciate by
about 0.7% for every 1% decline of the euro. The Czech and Slovak korunas are behaving similarly to
the krona, while the forint and the zloty on average shared less than half of the euro’s rate changes
against the dollar. The pound took the same position on the dollar-euro axis as it had on the dollar-
mark axis. In the first months of 1999 it tended to share about half of the euro’s movements against the
dollar.
17
References
Bank for International Settlements (1996): Central Bank Survey of Foreign Exchange and DerivativesMarkets.
Bank for International Settlements (1997): 67th Annual Report. Basel, June.
Bayoumi, Tamim and Barry Eichengreen (1996a): “Operationalizing the Theory of OptimumCurrency Areas”. CEPR Discussion Paper No. 1484, October.
Bayoumi, Tamim and Barry Eichengreen (1996b): “Optimum currency areas and exchange ratevolatility”, in International Trade and Finance: New Frontiers for Research. Cambridge UniversityPress, Cambridge.
Bayoumi Tamim and Barry Eichengreen (1996c): “Is Asia an optimum currency area?” University ofCalifornia at Berkeley Center for International and Development Economics Research WorkingPaper, No. 96-081, December.
Bénassy-Quéré, Agnès (1997): “Optimal pegs for Asian currencies”. Centre d’Etudes Prospectives etd’Informations Internationales Document de Travail, No. 97-14, October.
Bénassy-Quéré, Agnès and Amina Lahrèche-Révil (1998): “The euro as a monetary anchor in theCEECS”. CEPII Working Paper.
Brown, Brendan (1979): The Dollar-Mark Axis. MacMillan, London.
Brown, Brendan (1998): “The new five-currency world”, in Tokyo-Mitsubishi International plc,Market Perspectives, Spring, pp. 15–7.
Clarida, Richard, Jordi Galí and Mark Gertler (1998): “Monetary policy rules in practice: Someinternational evidence”. European Economic Review, 42, pp. 1033–67.
De Cecco, Marcello and Fabrizio Perri (1996): “L’integrazione europea: un’analisi empirica”. Monetae Credito, No.193, March.
Del Giovane, Paolo and Alberto F Pozzolo (1998): “The behaviour of the dollar and exchange rates inEurope: Empirical evidence and possible explanations”. Banca d’Italia Temi di Discussione delServizio Studi, No. 328, February.
Frankel, Jeffrey and Andrew K Rose (1996): “The endogeneity of the optimum currency area criteria”.NBER Working Paper, No. 5700, August.
Frankel, Jeffrey and Shang-Jin Wei (1993): “Trade blocs and currency blocs”. NBER Working Paper,No. 4335, April.
Giavazzi, Francesco and Alberto Aiovannini (1989): Limiting Exchange Rate Flexibility.Massachusetts Institute of Technology Press, Cambridge, MA.
Von Hagen, Jürgen and Manfred Neumann (1992): “Real exchange rates within and between currencyareas: How far away is EMU?” CEPR Working Paper, No. 660.
Haldane, A G and S G Hall (1991): “Sterling’s relationship with the dollar and the deutschmark:1976–89”. The Economic Journal, 101, May, pp. 436–43.
Mundell, R (1961): “A theory of optimum currency areas”. American Economic Review, pp. 379-96.
McKinnon, Ronald I (1999): “The east Asian dollar standard, life after death?” Paper presented at theWorkshop on ‘Rethinking the east Asian Miracle’, The Asia Foundation.
Ohno, Keinichi (1999): “Exchange rate management in the developing Asia: A reassessment of thepre-crisis soft dollar zone”. ADBI Working Paper, January.
18
Padoa-Schioppa, Tommaso (1985): “Policy cooperation and the EMS experience”, in W Buiter and RMarston (eds.), International Economic Policy Coordination, Cambridge University Press, Cambridge,pp. 331–55.
Peersman, Geert and Frank Smets (1998): “The Taylor rule: a useful monetary policy guide for theECB?” Unpublished working paper, BIS.
Rudebusch, Glenn and Lars E O Svensson (1998): “Policy rules for inflation targeting”. SverigesRiksbank Working Paper, No. 49.
Taylor, John (1993): “Discretion versus policy rules in practice”. Carnegie–Rochester ConferenceSeries on Public Policy, 39, pp. 195–214.
Taylor, John (1998a): “Rate setting by the European Central Bank”. Sveriges Riksbank WorkingPaper, No. 58.
Taylor, John (1998b): “Guidelines for the European Central Bank”. International Economy,September/October, pp. 24–5.


Recent BIS Working Papers
No. Title Author
58November 1998
The importance of bank seniority for relationshiplending
Stanley D Longhoferand João A C Santos
59November 1998
Portfolio selection using fuzzy decision theory SrichanderRamaswamy
60November 1998
Output gap uncertainty: does it matter for the Taylorrule?
Frank Smets
61November 1998
Foreign direct investment and employment in theindustrial countries
P S Andersenand P Hainaut
62March 1999
The pricing of bank lending and borrowing: evidencefrom the federal funds market
Craig H Furfine
63March 1999
Microeconomic inventory adjustment and aggregatedynamics
Jonathan McCarthyand Egon Zakrajšek
64March 1999
Precarious credit equilibria: reflections on the Asianfinancial crisis
Joseph Bisignano
65April 1999
Higher profits and lower capital prices: is factorallocation optimal?
P S Andersen, M Klauand E Yndgaard
66April 1999
Evolving international financial markets: someimplications for central banks
William R White
67May 1999
The cyclical sensitivity of seasonality in US employment Spencer Krane andWilliam Wascher
68May 1999
The evolution and determinants of emerging marketcredit spreads in the 1990s
Steven B Kamin andKarsten von Kleist
69June 1999
Credit channels and consumption in Europe: empiricalevidence
Gabe de Bondt
70June 1999
Interbank exposures: quantifying the risk of contagion Craig H Furfine
71June 1999
The term structure of announcement effects Michael J Flemingand Eli M Remolona
72August 1999
Reserve currency allocation: an alternative methodology SrichanderRamaswamy
73August 1999
The Taylor rule and interest rates in the EMU area: anote
Stefan Gerlach andGert Schnabel
Related Documents