ARTICLES NATURE METHODS | VOL.8 NO.4 | APRIL 2011 | 341 The analysis of synthetic genetic interaction networks can reveal how biological systems achieve a high level of complexity with a limited repertoire of components. Studies in yeast and bacteria have taken advantage of collections of deletion strains to construct matrices of quantitative interaction profiles and infer gene function. Yet comparable approaches in higher organisms have been difficult to implement in a robust manner. Here we report a method to identify genetic interactions in tissue culture cells through RNAi. By performing more than 70,000 pairwise perturbations of signaling factors, we identified >600 interactions affecting different quantitative phenotypes of Drosophila melanogaster cells. Computational analysis of this interaction matrix allowed us to reconstruct signaling pathways and identify a conserved regulator of Ras-MAPK signaling. Large-scale genetic interaction mapping by RNAi is a versatile, scalable approach for revealing gene function and the connectivity of cellular networks. Genetics underlying many phenotypes, including most common diseases, are complex with contributions from multiple loci. Studies in model organisms provide evidence for pervasive genetic inter- actions with large effects on many phenotypes. Such genetic factors are difficult to identify in classical loss-of-function screens. For example, RNAi screens in cultured cells have revealed components of signaling pathways through pathway-specific reporter assays but revealed little about the interactions between the different com- ponents. To explore the underlying network connectivity, simul- taneous perturbations of multiple components are required, for example, through combinatorial drug treatments 1 or the genera- tion of double mutant strains 2,3 . Here we describe an RNAi-based experimental approach to functionally annotate metazoan genes based on their genetic interaction profiles, independent of path- way-specific reporters, mutant collections or chemical inhibitors. RESULTS Double-RNAi analyses RNAi offers the opportunity to simultaneously reduce the expres- sion of any chosen pair of genes, allowing us to systematically Mapping of signaling networks through synthetic genetic interaction analysis by RNAi Thomas Horn 1,2,5 , Thomas Sandmann 1,3,5 , Bernd Fischer 4,5 , Elin Axelsson 4 , Wolfgang Huber 4 & Michael Boutros 1 sample large numbers of distinct, biologically relevant conditions. To overcome limitations of RNAi experiments, such as off-target effects, we designed two independent dsRNAs to each target and used robust statistical modeling to identify single-RNAi or double-RNAi phenotypes and synthetic effects. As genetic inter- actions can manifest themselves by affecting any phenotypic trait, we used automated microscopy to collect multiparametric data, for example, information about cell number, nuclear size and fluorescence intensity after Hoechst staining, instead of restricting the analysis to any individual, preselected pathway 4 . To validate our approach, we assessed genetic interactions between known components of the Ras-MAPK pathway affecting cell number at varying concentrations of dsRNA (Fig. 1a–c and Supplementary Fig. 1). Depletion of the Drosophila Ras85D gene, which encodes a member of the conserved Ras superfamily of small GTPases, led to a concentration-dependent reduction in cell growth 5,6 (Fig. 1a). RNAi-mediated knockdown of CG13197, a gene not connected to Ras signaling, also attenuated cell growth. When we simulta- neously targeted both Ras85D and CG13197 with different con- centrations of dsRNAs, we could predict the resulting number of cells based on the single-knockdown phenotypes of the individual genes by a multiplicative model (Fig. 1a,d), as has been observed for double deletion strains in yeast 2,7 . Deviations between the expected and the experimentally observed double-RNAi effects revealed positive (alleviating) or negative (aggravating for genes with negative single-RNAi effect) genetic interactions (Fig. 1d). The outcome of simultaneously targeting two genes with known functions in the Ras-MAPK signaling pathway deviated strongly from predictions based on single-knockdown phenotypes. Double RNAi of Ras85D and Gap1, a negative regulator of Ras, alleviated the growth inhibition caused by targeting Ras85D alone, revealing a strong positive interaction (Fig. 1b). Double RNAi of Gap1 and Ptp69D, a receptor-linked protein tyrosine phosphatase, in con- trast, led to a negative genetic interaction (Fig. 1c). Thus, double RNAi can reveal both positive and negative interactions, whose strengths, analogous to interactions between chemical com- pounds 8 , are concentration-dependent and reflect the quantitative nature of functional interactions (Supplementary Fig. 1). 1 German Cancer Research Center (Deutsches Krebsforschungszentrum), Division Signaling and Functional Genomics and Heidelberg University, Department of Cell and Molecular Biology, Faculty of Medicine Mannheim, Heidelberg, Germany. 2 Heidelberg University, Hartmut Hoffmann-Berling International Graduate School for Molecular and Cellular Biology, Heidelberg, Germany. 3 Heidelberg University, CellNetworks Cluster of Excellence, Heidelberg, Germany. 4 European Molecular Biology Laboratory, Genome Biology Unit, Heidelberg, Germany. 5 These authors contributed equally to this work. Correspondence should be addressed to M.B. ([email protected]) or W.H. ([email protected]). RECEIVED 23 SEPTEMBER 2010; ACCEPTED 4 FEBRUARY 2011; PUBLISHED ONLINE 6 MARCH 2011; DOI:10.1038/NMETH.1581 © 2011 Nature America, Inc. All rights reserved.

Welcome message from author
This document is posted to help you gain knowledge. Please leave a comment to let me know what you think about it! Share it to your friends and learn new things together.
Transcript
Articles
nAture methods | VOL.8 NO.4 | APRIL 2011 | 341
the analysis of synthetic genetic interaction networks can reveal how biological systems achieve a high level of complexity with a limited repertoire of components. studies in yeast and bacteria have taken advantage of collections of deletion strains to construct matrices of quantitative interaction profiles and infer gene function. Yet comparable approaches in higher organisms have been difficult to implement in a robust manner. here we report a method to identify genetic interactions in tissue culture cells through rnAi. By performing more than 70,000 pairwise perturbations of signaling factors, we identified >600 interactions affecting different quantitative phenotypes of Drosophila melanogaster cells. computational analysis of this interaction matrix allowed us to reconstruct signaling pathways and identify a conserved regulator of ras-mAPK signaling. large-scale genetic interaction mapping by rnAi is a versatile, scalable approach for revealing gene function and the connectivity of cellular networks.
Genetics underlying many phenotypes, including most common diseases, are complex with contributions from multiple loci. Studies in model organisms provide evidence for pervasive genetic interactions with large effects on many phenotypes. Such genetic factors are difficult to identify in classical lossoffunction screens. For example, RNAi screens in cultured cells have revealed components of signaling pathways through pathwayspecific reporter assays but revealed little about the interactions between the different components. To explore the underlying network connectivity, simultaneous perturbations of multiple components are required, for example, through combinatorial drug treatments1 or the generation of double mutant strains2,3. Here we describe an RNAibased experimental approach to functionally annotate metazoan genes based on their genetic interaction profiles, independent of pathwayspecific reporters, mutant collections or chemical inhibitors.
resultsdouble-rnAi analysesRNAi offers the opportunity to simultaneously reduce the expression of any chosen pair of genes, allowing us to systematically
mapping of signaling networks through synthetic genetic interaction analysis by rnAiThomas Horn1,2,5, Thomas Sandmann1,3,5, Bernd Fischer4,5, Elin Axelsson4, Wolfgang Huber4 & Michael Boutros1
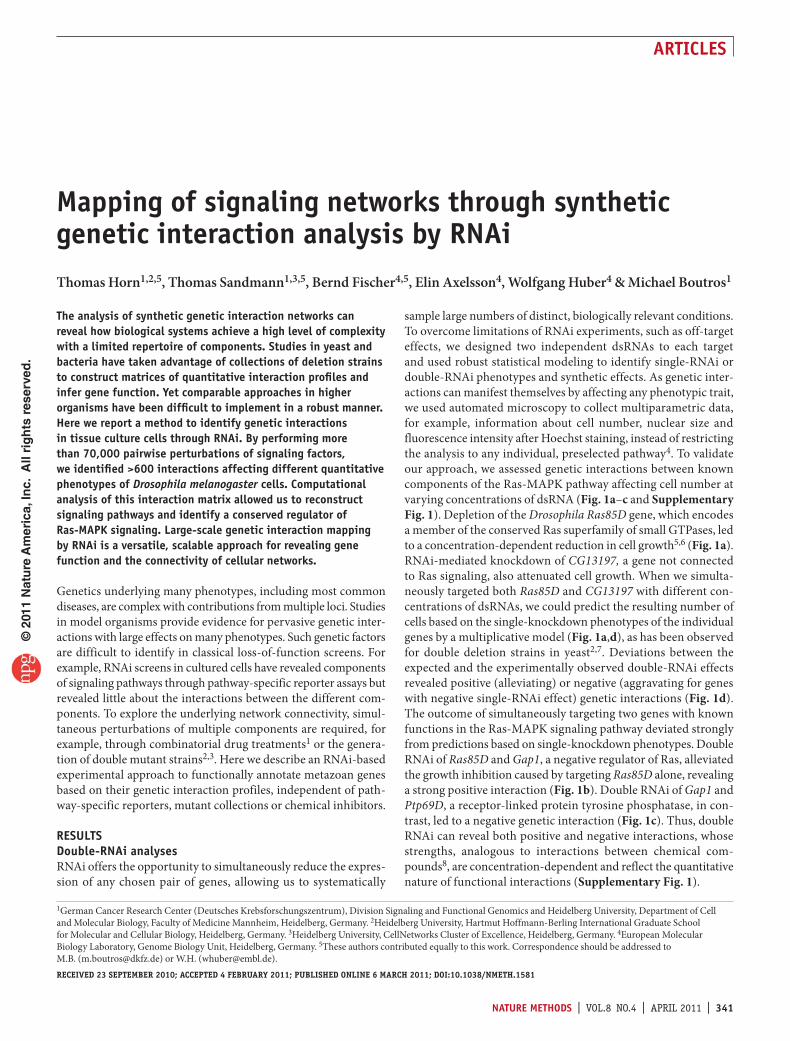
sample large numbers of distinct, biologically relevant conditions. To overcome limitations of RNAi experiments, such as offtarget effects, we designed two independent dsRNAs to each target and used robust statistical modeling to identify singleRNAi or doubleRNAi phenotypes and synthetic effects. As genetic interactions can manifest themselves by affecting any phenotypic trait, we used automated microscopy to collect multiparametric data, for example, information about cell number, nuclear size and fluorescence intensity after Hoechst staining, instead of restricting the analysis to any individual, preselected pathway4. To validate our approach, we assessed genetic interactions between known components of the RasMAPK pathway affecting cell number at varying concentrations of dsRNA (Fig. 1a–c and Supplementary Fig. 1). Depletion of the Drosophila Ras85D gene, which encodes a member of the conserved Ras superfamily of small GTPases, led to a concentrationdependent reduction in cell growth5,6 (Fig. 1a). RNAimediated knockdown of CG13197, a gene not connected to Ras signaling, also attenuated cell growth. When we simultaneously targeted both Ras85D and CG13197 with different concentrations of dsRNAs, we could predict the resulting number of cells based on the singleknockdown phenotypes of the individual genes by a multiplicative model (Fig. 1a,d), as has been observed for double deletion strains in yeast2,7. Deviations between the expected and the experimentally observed doubleRNAi effects revealed positive (alleviating) or negative (aggravating for genes with negative singleRNAi effect) genetic interactions (Fig. 1d). The outcome of simultaneously targeting two genes with known functions in the RasMAPK signaling pathway deviated strongly from predictions based on singleknockdown phenotypes. Double RNAi of Ras85D and Gap1, a negative regulator of Ras, alleviated the growth inhibition caused by targeting Ras85D alone, revealing a strong positive interaction (Fig. 1b). Double RNAi of Gap1 and Ptp69D, a receptorlinked protein tyrosine phosphatase, in contrast, led to a negative genetic interaction (Fig. 1c). Thus, double RNAi can reveal both positive and negative interactions, whose strengths, analogous to interactions between chemical compounds8, are concentrationdependent and reflect the quantitative nature of functional interactions (Supplementary Fig. 1).
1German Cancer Research Center (Deutsches Krebsforschungszentrum), Division Signaling and Functional Genomics and Heidelberg University, Department of Cell and Molecular Biology, Faculty of Medicine Mannheim, Heidelberg, Germany. 2Heidelberg University, Hartmut HoffmannBerling International Graduate School for Molecular and Cellular Biology, Heidelberg, Germany. 3Heidelberg University, CellNetworks Cluster of Excellence, Heidelberg, Germany. 4European Molecular Biology Laboratory, Genome Biology Unit, Heidelberg, Germany. 5These authors contributed equally to this work. Correspondence should be addressed to M.B. ([email protected]) or W.H. ([email protected]).Received 23 SeptembeR 2010; accepted 4 FebRuaRy 2011; publiShed online 6 maRch 2011; doi:10.1038/nmeth.1581
© 2
011
Nat
ure
Am
eric
a, In
c. A
ll ri
gh
ts r
eser
ved
.
342 | VOL.8 NO.4 | APRIL 2011 | nAture methods
Articles
high-throughput analysis of pairwise interactionsWe tested all pairwise interactions between 93 genes involved in signal transduction in Drosophila cells, evaluating two nonoverlapping RNAi reagents for each target (192 dsRNA reagents including controls; Fig. 1e, Supplementary Figs. 2 and 3, and Supplementary Table 1)9. Targeted genes included annotated
components of the three MAPK pathways (RasMAPK, JNK and p38 pathway) and all annotated protein and lipid phosphatases expressed in Drosophila Schneider cells (Supplementary Table 2). We performed experiments in Schneider S2 cells, which we fixed, stained with Hoechst dye and analyzed using highthroughput fluorescence imaging and automated image analysis (Fig. 1e). We selected three nonredundant quantitative features from the images: number of cells per well, mean nuclear area and nuclear fluorescence intensity (Fig. 1e and Supplementary Fig. 4). For example, treatment with dsRNA to the firefly luciferase gene (negative control) led to an average of 48,200 cells per well with a mean nuclear area of 59.1 µm2 per cell. Depletion of Rho1, a small GTPase involved in cytokinesis and cytoskeleton remodeling10, led to significantly larger nuclear area (77.9 µm2 per cell, P < 1 × 10⁻¹⁵, Student’s ttest, n = 16), likely reflecting multinucleate morphology caused by incomplete cytokinesis, with a concomitant decrease in the number of cells (25,400 cells per well, P < 1 × 10⁻¹⁵, Student’s ttest, n = 16). In contrast, pnt depletion also resulted in a decreased number of cells (19,000 cells per well, P < 1 × 10⁻¹⁵, Student’s ttest, n = 16) but a smaller mean nuclear area (44.7 µm2 per cell, P < 1 × 10⁻¹⁵, Student’s ttest, n = 16).
We performed two biologically independent experiments yielding 73,728 measurements in total, from which we estimated interaction scores (Fig. 2a, Supplementary Figs. 5–8 and Supplementary Table 3). Phenotypic measurements were highly
a b c
2–2π score
e
d FlucA B
100%80% 62.5%
75% 100%50%12.5%
–2 +10Aggravating(negative)
Alleviating(positive)
Phe
noty
peIn
tera
ctio
ns
25%
Interactionscore (πA,B)
CG13197 dsRNA (ng)
Ras
85D
dsR
NA
(ng
)
0 50 100
0
50
100
0.0
Gap1 dsRNA (ng)R
as85
D d
sRN
A (
ng)
0 50 100
0
50
100
0.51.0
1.52.0
Gap1 dsRNA (ng)
Ptp
69D
dsR
NA
(ng
)
0 50 100
0
50
100 −1.5
−1.0
−0.50.0
...
Num
ber
Are
aIn
tens
ity
Interactionscore (πA,B)
+ RNAi 1
+ RNAi 2
+ RNAi 192
Combinatorial RNAiImaging and
image analysisModeling of
genetic interactions
Gene A Gene B
A1
A2
B1
B2
×
Figure 1 | A multiparametric approach to identify genetic interactions through double-RNAi. (a–c) Genetic interaction surfaces of double-RNAi treatments over a range of dsRNA concentrations. Axes indicate the amounts of the respective dsRNAs combined per well. Interaction scores (π scores based on cell number phenotypes) are shown on a color scale ranging from −2 (negative interaction) to 2 (positive interaction). (d) Schematic overview of π score calculation. Single RNAi effects (A and B) are compared to that of a negative control dsRNA targeting firefly luciferase (Fluc). The expected double-RNAi effect is obtained by multiplying the single RNAi effects (arrowhead points to the relative cell number of 50% expected in this example) and compared to the observed double-RNAi phenotype. The π score is the log2 ratio between the observed and the expected value. (e) Schematic overview of the combinatorial RNAi experiment. Each color corresponds to a single dsRNA in the assay plates. To each plate, a different second dsRNA (RNAi 1–192) is added to all wells. This design creates all possible dsRNA combinations (arrows) targeting each pair of genes, A and B, with two dsRNAs (A1 and A2, and B1 and B2).
c
a
b
rlphlcswmskSosRas85DDsor1CkastgmRNA−capmopPpVCG3573Gap1Rho1pntpucdrkPvrmts
π−sc
ore
nucl
ear
area
π−sc
ore
cell
num
ber
Jrakaysharkslprbsk
π−sc
ore
mea
n in
tens
ty
−0.5
0.5
−0.2
0.2
−0.2
0.2
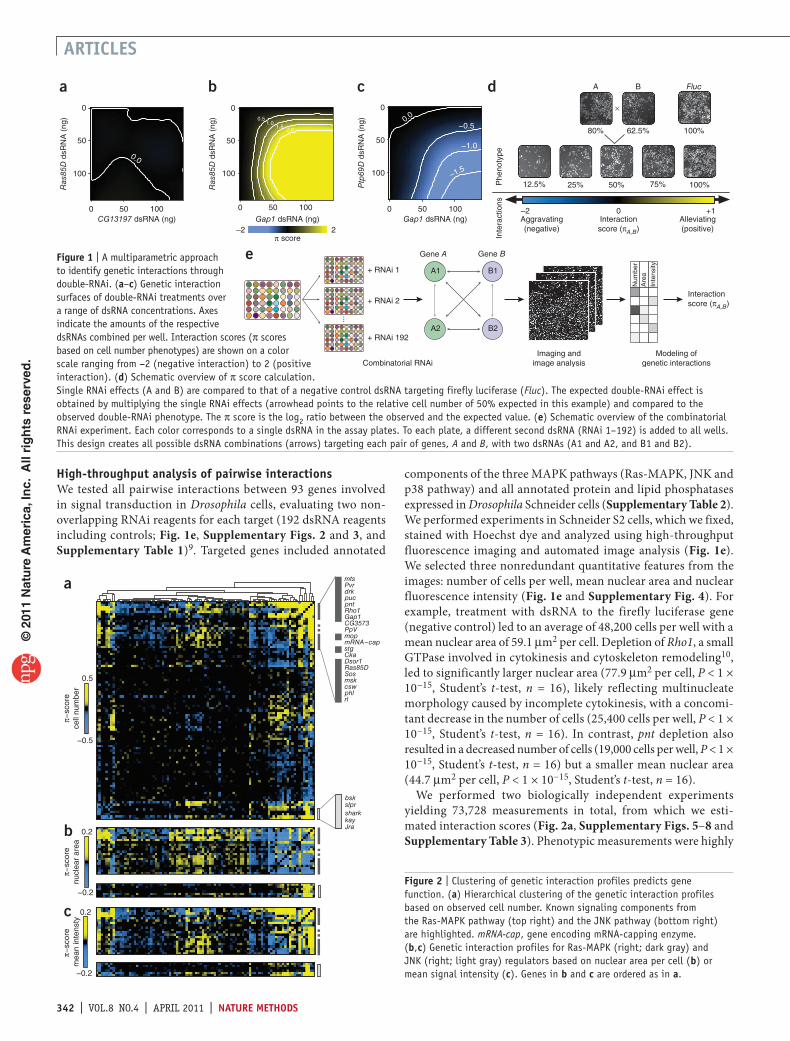
Figure 2 | Clustering of genetic interaction profiles predicts gene function. (a) Hierarchical clustering of the genetic interaction profiles based on observed cell number. Known signaling components from the Ras-MAPK pathway (top right) and the JNK pathway (bottom right) are highlighted. mRNA-cap, gene encoding mRNA-capping enzyme. (b,c) Genetic interaction profiles for Ras-MAPK (right; dark gray) and JNK (right; light gray) regulators based on nuclear area per cell (b) or mean signal intensity (c). Genes in b and c are ordered as in a.
© 2
011
Nat
ure
Am
eric
a, In
c. A
ll ri
gh
ts r
eser
ved
.
nAture methods | VOL.8 NO.4 | APRIL 2011 | 343
Articles
reproducible across technical and biological replicates, with a Pearson correlation coefficient of 0.95 for observed numbers of cells between biological replicates (Supplementary Fig. 9). In each replicate, we measured the doubleRNAi phenotype for each pair of genes eight times (Fig. 1e), allowing for stringent statistical analysis.
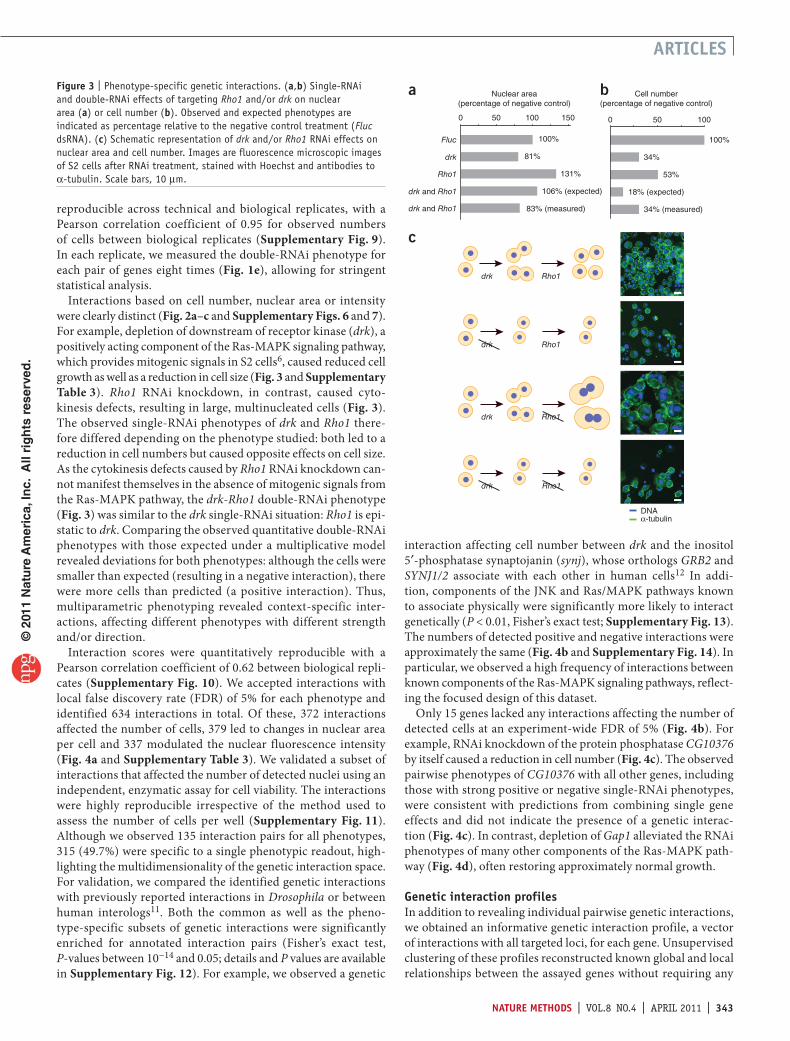
Interactions based on cell number, nuclear area or intensity were clearly distinct (Fig. 2a–c and Supplementary Figs. 6 and 7). For example, depletion of downstream of receptor kinase (drk), a positively acting component of the RasMAPK signaling pathway, which provides mitogenic signals in S2 cells6, caused reduced cell growth as well as a reduction in cell size (Fig. 3 and Supplementary Table 3). Rho1 RNAi knockdown, in contrast, caused cytokinesis defects, resulting in large, multinucleated cells (Fig. 3). The observed singleRNAi phenotypes of drk and Rho1 therefore differed depending on the phenotype studied: both led to a reduction in cell numbers but caused opposite effects on cell size. As the cytokinesis defects caused by Rho1 RNAi knockdown cannot manifest themselves in the absence of mitogenic signals from the RasMAPK pathway, the drk-Rho1 doubleRNAi phenotype (Fig. 3) was similar to the drk singleRNAi situation: Rho1 is epistatic to drk. Comparing the observed quantitative doubleRNAi phenotypes with those expected under a multiplicative model revealed deviations for both phenotypes: although the cells were smaller than expected (resulting in a negative interaction), there were more cells than predicted (a positive interaction). Thus, multiparametric phenotyping revealed contextspecific interactions, affecting different phenotypes with different strength and/or direction.
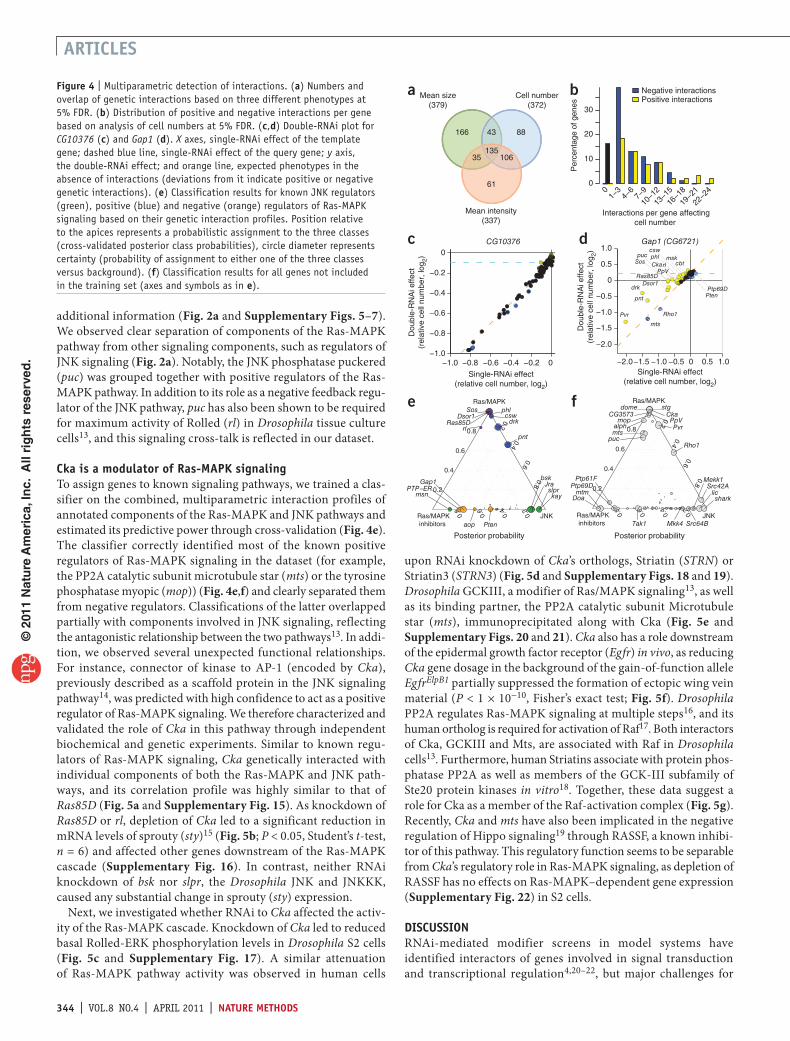
Interaction scores were quantitatively reproducible with a Pearson correlation coefficient of 0.62 between biological replicates (Supplementary Fig. 10). We accepted interactions with local false discovery rate (FDR) of 5% for each phenotype and identified 634 interactions in total. Of these, 372 interactions affected the number of cells, 379 led to changes in nuclear area per cell and 337 modulated the nuclear fluorescence intensity (Fig. 4a and Supplementary Table 3). We validated a subset of interactions that affected the number of detected nuclei using an independent, enzymatic assay for cell viability. The interactions were highly reproducible irrespective of the method used to assess the number of cells per well (Supplementary Fig. 11). Although we observed 135 interaction pairs for all phenotypes, 315 (49.7%) were specific to a single phenotypic readout, highlighting the multidimensionality of the genetic interaction space. For validation, we compared the identified genetic interactions with previously reported interactions in Drosophila or between human interologs11. Both the common as well as the phenotypespecific subsets of genetic interactions were significantly enriched for annotated interaction pairs (Fisher’s exact test, Pvalues between 10−14 and 0.05; details and P values are available in Supplementary Fig. 12). For example, we observed a genetic
interaction affecting cell number between drk and the inositol 5′phosphatase synaptojanin (synj), whose orthologs GRB2 and SYNJ1/2 associate with each other in human cells12 In addition, components of the JNK and Ras/MAPK pathways known to associate physically were significantly more likely to interact genetically (P < 0.01, Fisher’s exact test; Supplementary Fig. 13). The numbers of detected positive and negative interactions were approximately the same (Fig. 4b and Supplementary Fig. 14). In particular, we observed a high frequency of interactions between known components of the RasMAPK signaling pathways, reflecting the focused design of this dataset.
Only 15 genes lacked any interactions affecting the number of detected cells at an experimentwide FDR of 5% (Fig. 4b). For example, RNAi knockdown of the protein phosphatase CG10376 by itself caused a reduction in cell number (Fig. 4c). The observed pairwise phenotypes of CG10376 with all other genes, including those with strong positive or negative singleRNAi phenotypes, were consistent with predictions from combining single gene effects and did not indicate the presence of a genetic interaction (Fig. 4c). In contrast, depletion of Gap1 alleviated the RNAi phenotypes of many other components of the RasMAPK pathway (Fig. 4d), often restoring approximately normal growth.
Genetic interaction profilesIn addition to revealing individual pairwise genetic interactions, we obtained an informative genetic interaction profile, a vector of interactions with all targeted loci, for each gene. Unsupervised clustering of these profiles reconstructed known global and local relationships between the assayed genes without requiring any
Figure 3 | Phenotype-specific genetic interactions. (a,b) Single-RNAi and double-RNAi effects of targeting Rho1 and/or drk on nuclear area (a) or cell number (b). Observed and expected phenotypes are indicated as percentage relative to the negative control treatment (Fluc dsRNA). (c) Schematic representation of drk and/or Rho1 RNAi effects on nuclear area and cell number. Images are fluorescence microscopic images of S2 cells after RNAi treatment, stained with Hoechst and antibodies to α-tubulin. Scale bars, 10 µm.
c
drk Rho1
drk Rho1
drk Rho1
drk Rho1
DNAα-tubulin
a b
100
Nuclear area (percentage of negative control)
500
Cell number (percentage of negative control)
150
100%
81%
131%
106% (expected)
83% (measured)
100%
34%
53%
18% (expected)
34% (measured)
50 1000
Fluc
drk
Rho1
drk and Rho1
drk and Rho1
© 2
011
Nat
ure
Am
eric
a, In
c. A
ll ri
gh
ts r
eser
ved
.
344 | VOL.8 NO.4 | APRIL 2011 | nAture methods
Articles
additional information (Fig. 2a and Supplementary Figs. 5–7). We observed clear separation of components of the RasMAPK pathway from other signaling components, such as regulators of JNK signaling (Fig. 2a). Notably, the JNK phosphatase puckered (puc) was grouped together with positive regulators of the RasMAPK pathway. In addition to its role as a negative feedback regulator of the JNK pathway, puc has also been shown to be required for maximum activity of Rolled (rl) in Drosophila tissue culture cells13, and this signaling crosstalk is reflected in our dataset.
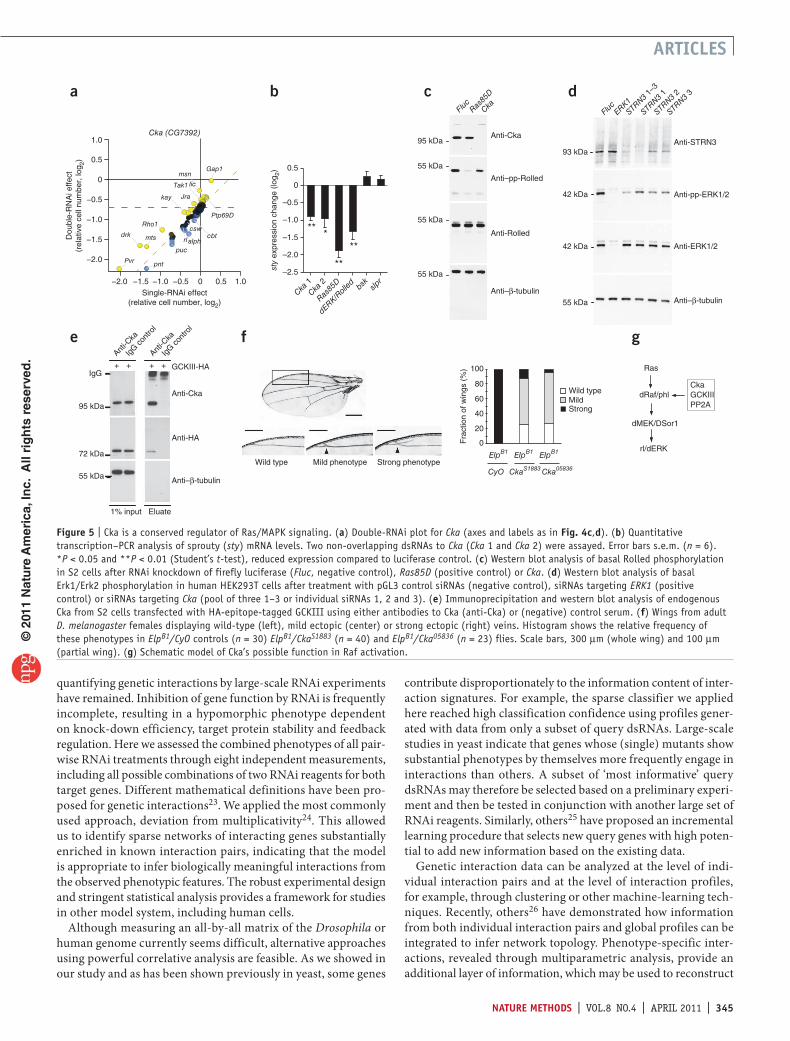
cka is a modulator of ras-mAPK signalingTo assign genes to known signaling pathways, we trained a classifier on the combined, multiparametric interaction profiles of annotated components of the RasMAPK and JNK pathways and estimated its predictive power through crossvalidation (Fig. 4e). The classifier correctly identified most of the known positive regulators of RasMAPK signaling in the dataset (for example, the PP2A catalytic subunit microtubule star (mts) or the tyrosine phosphatase myopic (mop)) (Fig. 4e,f) and clearly separated them from negative regulators. Classifications of the latter overlapped partially with components involved in JNK signaling, reflecting the antagonistic relationship between the two pathways13. In addition, we observed several unexpected functional relationships. For instance, connector of kinase to AP1 (encoded by Cka), previously described as a scaffold protein in the JNK signaling pathway14, was predicted with high confidence to act as a positive regulator of RasMAPK signaling. We therefore characterized and validated the role of Cka in this pathway through independent biochemical and genetic experiments. Similar to known regulators of RasMAPK signaling, Cka genetically interacted with individual components of both the RasMAPK and JNK pathways, and its correlation profile was highly similar to that of Ras85D (Fig. 5a and Supplementary Fig. 15). As knockdown of Ras85D or rl, depletion of Cka led to a significant reduction in mRNA levels of sprouty (sty)15 (Fig. 5b; P < 0.05, Student’s ttest, n = 6) and affected other genes downstream of the RasMAPK cascade (Supplementary Fig. 16). In contrast, neither RNAi knockdown of bsk nor slpr, the Drosophila JNK and JNKKK, caused any substantial change in sprouty (sty) expression.
Next, we investigated whether RNAi to Cka affected the activity of the RasMAPK cascade. Knockdown of Cka led to reduced basal RolledERK phosphorylation levels in Drosophila S2 cells (Fig. 5c and Supplementary Fig. 17). A similar attenuation of RasMAPK pathway activity was observed in human cells
upon RNAi knockdown of Cka’s orthologs, Striatin (STRN) or Striatin3 (STRN3) (Fig. 5d and Supplementary Figs. 18 and 19). Drosophila GCKIII, a modifier of Ras/MAPK signaling13, as well as its binding partner, the PP2A catalytic subunit Microtubule star (mts), immunoprecipitated along with Cka (Fig. 5e and Supplementary Figs. 20 and 21). Cka also has a role downstream of the epidermal growth factor receptor (Egfr) in vivo, as reducing Cka gene dosage in the background of the gainoffunction allele EgfrElpB1 partially suppressed the formation of ectopic wing vein material (P < 1 × 10⁻¹⁰, Fisher’s exact test; Fig. 5f). Drosophila PP2A regulates RasMAPK signaling at multiple steps16, and its human ortholog is required for activation of Raf17. Both interactors of Cka, GCKIII and Mts, are associated with Raf in Drosophila cells13. Furthermore, human Striatins associate with protein phosphatase PP2A as well as members of the GCKIII subfamily of Ste20 protein kinases in vitro18. Together, these data suggest a role for Cka as a member of the Rafactivation complex (Fig. 5g). Recently, Cka and mts have also been implicated in the negative regulation of Hippo signaling19 through RASSF, a known inhibitor of this pathway. This regulatory function seems to be separable from Cka’s regulatory role in RasMAPK signaling, as depletion of RASSF has no effects on RasMAPK–dependent gene expression (Supplementary Fig. 22) in S2 cells.
discussionRNAimediated modifier screens in model systems have identified interactors of genes involved in signal transduction and transcriptional regulation4,20–22, but major challenges for
a b
61
88
106
166
35
43
135
Interactions per gene affectingcell number
Per
cent
age
of g
enes
01−
34−
67−
9
10−1
2
13−1
5
16−1
8
19−2
1
22−2
4
Mean size(379)
Cell number(372)
Mean intensity(337)
0
10
20
30Positive interactionsNegative interactions
−2.0−1.5 −1.0 −0.5 0 0.5 1.0
−2.0
−1.5
−1.0
−0.5
0
0.5
1.0Gap1 (CG6721)
cbtPpV
mskrl
Dsor1Ras85D
phlCkaSos
puc
pnt
Pvr
drk
mts
Rho1
Pten
Dou
ble-
RN
Ai e
ffect
(rel
ativ
e ce
ll nu
mbe
r, lo
g 2)
dc
e f
−1.0 −0.8 −0.6 −0.4 −0.2 0−1.0
−0.8
−0.6
−0.4
−0.2
0
Single-RNAi effect(relative cell number, log2)
Dou
ble-
RN
Ai e
ffect
(rel
ativ
e ce
ll nu
mbe
r, lo
g 2)
CG10376
Single-RNAi effect(relative cell number, log2)
Ras/MAPK inhibitors
JNK
Ras/MAPK
0.8
0.2
0.8
0.6
0.4
0.6
0.4
0.6
0.4
0.2
0.8
0.2
Gap1
Sos
Ras85DDsor1
PTP−ERmsn
aop
rldrk
pnt
Jrabsk
slprkay
Pten
cswphl
Posterior probability
Ras/MAPK inhibitors
JNK
Ras/MAPK
0.8
0.2
0.8
0.6
0.4
0.6
0.4
0.6
0.4
0.2
0.8
0.2
mts
dome
puc
mtmPtp69D
Tak1
alph
Ptp61F
Doa
mopCG3573
Pvr
stgCka
licshark
Rho1
Src42AMekk1
Mkk4 Src64B
PpV
Posterior probability
Ptp69D
csw
Figure 4 | Multiparametric detection of interactions. (a) Numbers and overlap of genetic interactions based on three different phenotypes at 5% FDR. (b) Distribution of positive and negative interactions per gene based on analysis of cell numbers at 5% FDR. (c,d) Double-RNAi plot for CG10376 (c) and Gap1 (d). X axes, single-RNAi effect of the template gene; dashed blue line, single-RNAi effect of the query gene; y axis, the double-RNAi effect; and orange line, expected phenotypes in the absence of interactions (deviations from it indicate positive or negative genetic interactions). (e) Classification results for known JNK regulators (green), positive (blue) and negative (orange) regulators of Ras-MAPK signaling based on their genetic interaction profiles. Position relative to the apices represents a probabilistic assignment to the three classes (cross-validated posterior class probabilities), circle diameter represents certainty (probability of assignment to either one of the three classes versus background). (f) Classification results for all genes not included in the training set (axes and symbols as in e).
© 2
011
Nat
ure
Am
eric
a, In
c. A
ll ri
gh
ts r
eser
ved
.
nAture methods | VOL.8 NO.4 | APRIL 2011 | 345
Articles
quantifying genetic interactions by largescale RNAi experiments have remained. Inhibition of gene function by RNAi is frequently incomplete, resulting in a hypomorphic phenotype dependent on knockdown efficiency, target protein stability and feedback regulation. Here we assessed the combined phenotypes of all pairwise RNAi treatments through eight independent measurements, including all possible combinations of two RNAi reagents for both target genes. Different mathematical definitions have been proposed for genetic interactions23. We applied the most commonly used approach, deviation from multiplicativity24. This allowed us to identify sparse networks of interacting genes substantially enriched in known interaction pairs, indicating that the model is appropriate to infer biologically meaningful interactions from the observed phenotypic features. The robust experimental design and stringent statistical analysis provides a framework for studies in other model system, including human cells.
Although measuring an allbyall matrix of the Drosophila or human genome currently seems difficult, alternative approaches using powerful correlative analysis are feasible. As we showed in our study and as has been shown previously in yeast, some genes
contribute disproportionately to the information content of interaction signatures. For example, the sparse classifier we applied here reached high classification confidence using profiles generated with data from only a subset of query dsRNAs. Largescale studies in yeast indicate that genes whose (single) mutants show substantial phenotypes by themselves more frequently engage in interactions than others. A subset of ‘most informative’ query dsRNAs may therefore be selected based on a preliminary experiment and then be tested in conjunction with another large set of RNAi reagents. Similarly, others25 have proposed an incremental learning procedure that selects new query genes with high potential to add new information based on the existing data.
Genetic interaction data can be analyzed at the level of individual interaction pairs and at the level of interaction profiles, for example, through clustering or other machinelearning techniques. Recently, others26 have demonstrated how information from both individual interaction pairs and global profiles can be integrated to infer network topology. Phenotypespecific interactions, revealed through multiparametric analysis, provide an additional layer of information, which may be used to reconstruct
Cka 1
Cka 2
Ras85
D
dERK/Roll
ed bsk slpr
–2.5
–2.0
–1.5
–1.0
–0.5
0
0.5
sty
expr
essi
on c
hang
e (lo
g 2)
***
**
**
b
0
20
40
60
80
100
CkaS1883
ElpB1
Cka05836
ElpB1ElpB1
CyO
Wild typeMild Strong
Fra
ctio
n of
win
gs (
%)
Wild type Mild phenotype Strong phenotype
dRaf/phl
dMEK/DSor1
rl/dERK
Ras
GCKIIIPP2A
Cka
f g
−2.0 −1.5 −1.0 −0.5 0 0.5 1.0
−2.0
−1.5
−1.0
−0.5
0
0.5
1.0Cka (CG7392)
Ptp69D
licTak1
Jrakay
mts
Rho1
Gap1msn
Pvr
drkcsw
rlcbt
pnt
pucalph
a
Dou
ble-
RN
Ai e
ffect
(rel
ativ
e ce
ll nu
mbe
r, lo
g 2)
Single-RNAi effect(relative cell number, log2)
c
Anti–β-tubulin
Anti-Rolled
Anti–pp-Rolled
Fluc Ras85
D
Cka
55 kDa
55 kDa
55 kDa
Anti-Cka95 kDa
d
Anti-pp-ERK1/2
Fluc ERK1STR
N3 1–
3
STRN3
1
STRN3
2
STRN3
3
42 kDa
42 kDa
55 kDa
Anti-ERK1/2
93 kDaAnti-STRN3
GCKIII-HA
55 kDa
eIg
G cont
rol
Anti-C
ka
IgG co
ntro
l
Anti-C
ka
+ + + +
Anti-HA
72 kDa
Anti-Cka
95 kDa
1% input Eluate
IgG
Anti–β-tubulin
Anti–β-tubulin
Figure 5 | Cka is a conserved regulator of Ras/MAPK signaling. (a) Double-RNAi plot for Cka (axes and labels as in Fig. 4c,d). (b) Quantitative transcription–PCR analysis of sprouty (sty) mRNA levels. Two non-overlapping dsRNAs to Cka (Cka 1 and Cka 2) were assayed. Error bars s.e.m. (n = 6). *P < 0.05 and **P < 0.01 (Student’s t-test), reduced expression compared to luciferase control. (c) Western blot analysis of basal Rolled phosphorylation in S2 cells after RNAi knockdown of firefly luciferase (Fluc, negative control), Ras85D (positive control) or Cka. (d) Western blot analysis of basal Erk1/Erk2 phosphorylation in human HEK293T cells after treatment with pGL3 control siRNAs (negative control), siRNAs targeting ERK1 (positive control) or siRNAs targeting Cka (pool of three 1–3 or individual siRNAs 1, 2 and 3). (e) Immunoprecipitation and western blot analysis of endogenous Cka from S2 cells transfected with HA-epitope-tagged GCKIII using either antibodies to Cka (anti-Cka) or (negative) control serum. (f) Wings from adult D. melanogaster females displaying wild-type (left), mild ectopic (center) or strong ectopic (right) veins. Histogram shows the relative frequency of these phenotypes in ElpB1/CyO controls (n = 30) ElpB1/CkaS1883 (n = 40) and ElpB1/Cka05836 (n = 23) flies. Scale bars, 300 µm (whole wing) and 100 µm (partial wing). (g) Schematic model of Cka’s possible function in Raf activation.
© 2
011
Nat
ure
Am
eric
a, In
c. A
ll ri
gh
ts r
eser
ved
.
346 | VOL.8 NO.4 | APRIL 2011 | nAture methods
Articles
network architecture. As has been demonstrated with similar data from yeast3, combining this information with results from chemicalgenomic experiments may allow researchers to link previously uncharacterized compounds to processes and pathways in metazoan cells.
Interactions between genetic variants have been proposed as one possible explanation for the ‘missing heritability’ in genomewide association studies27. Studies in model organisms support the existence of extensive interactions between different genetic alleles with large effects on many phenotypes28,29. Of the large number of gene variants detected in the human genome, only few correspond to complete lossoffunction alleles. The tunable reduction of gene expression through RNAi may be used to mimic the effect of different levels of residual gene activity. The systematic, quantitative approach toward characterization of synthetic genetic interactions we presented here offers the opportunity to improve our ability to explain phenotypes through genotypes in the broad range of model systems responsive to RNAi.
methodsMethods and any associated references are available in the online version of the paper at http://www.nature.com/naturemethods/.
Note: Supplementary information is available on the Nature Methods website.
AcKnowledGmentsWe thank A.-C. Gavin, A. Teleman and F. Markowetz for helpful comments on the manuscript, N. Perrimon (Harvard Medical School), W. Du (University of Chicago) and S. Hou (National Cancer Institute–Frederick) for sharing reagents and fly stocks, members of the Drosophila Genomics Resource Center for providing plasmids, members of the Bloomington Drosophila stock center for fly stocks and the information technology Service Units of the European Molecular Biology Laboratory and the German Cancer Research Center, for technical support; and A. Kiger and R. Gentleman for helpful discussions. The work was supported in part by a fellowship of the Studienstiftung (T.H.), the CellNetworks Cluster of Excellence (T.S.), a program grant of the Human Frontiers Sciences Program (W.H. and M.B.) and the EU FP7 project CancerPathways (W.H. and M.B.).
Author contriButionsT.H., T.S., B.F., W.H. and M.B. designed the study; T.H. and T.S. performed the experiments; B.F. analyzed the data; E.A. performed initial analyses; T.S., T.H., B.F., W.H. and M.B. wrote the manuscript.
comPetinG FinAnciAl interestsThe authors declare no competing financial interests.
Published online at http://www.nature.com/naturemethods/. reprints and permissions information is available online at http://npg.nature.com/reprintsandpermissions/.
1. Farha, M.A. & Brown, E.D. Chemical probes of Escherichia coli uncovered through chemical-chemical interaction profiling with compounds of known biological activity. Chem. Biol. 17, 852–862 (2010).
2. Collins, S.R. et al. Functional dissection of protein complexes involved in yeast chromosome biology using a genetic interaction map. Nature 446, 806–810 (2007).
3. Costanzo, M. et al. The genetic landscape of a cell. Science 327, 425–431 (2010).
4. Bakal, C. et al. Phosphorylation networks regulating JNK activity in diverse genetic backgrounds. Science 322, 453–456 (2008).
5. Bruckner, K. et al. The PDGF/VEGF receptor controls blood cell survival in Drosophila. Dev. Cell 7, 73–84 (2004).
6. Sims, D., Duchek, P. & Baum, B. PDGF/VEGF signaling controls cell size in Drosophila. Genome Biol. 10, R20 (2009).
7. Tong, A.H. et al. Global mapping of the yeast genetic interaction network. Science 303, 808–813 (2004).
8. Lehar, J. et al. Synergistic drug combinations tend to improve therapeutically relevant selectivity. Nat. Biotechnol. 27, 659–666 (2009).
9. Horn, T., Sandmann, T. & Boutros, M. Design and evaluation of genome-wide libraries for RNA interference screens. Genome Biol. 11, R61 (2010).
10. Ridley, A.J. Rho GTPases and actin dynamics in membrane protrusions and vesicle trafficking. Trends Cell Biol. 16, 522–529 (2006).
11. Yu, J., Pacifico, S., Liu, G. & Finley, R.L. Jr. DroID: the Drosophila Interactions Database, a comprehensive resource for annotated gene and protein interactions. BMC Genomics 9, 461 (2008).
12. McPherson, P.S., Takei, K., Schmid, S.L. & De Camilli, P. p145, a major Grb2-binding protein in brain, is co-localized with dynamin in nerve terminals where it undergoes activity-dependent dephosphorylation. J. Biol. Chem. 269, 30132–30139 (1994).
13. Friedman, A. & Perrimon, N. A functional RNAi screen for regulators of receptor tyrosine kinase and ERK signalling. Nature 444, 230–234 (2006).
14. Chen, H.W. et al. CKA, a novel multidomain protein, regulates the JUN N-terminal kinase signal transduction pathway in Drosophila. Mol. Cell. Biol. 22, 1792–1803 (2002).
15. Reich, A., Sapir, A. & Shilo, B. Sprouty is a general inhibitor of receptor tyrosine kinase signaling. Development 126, 4139–4147 (1999).
16. Wassarman, D.A. et al. Protein phosphatase 2A positively and negatively regulates Ras1-mediated photoreceptor development in Drosophila. Genes Dev. 10, 272–278 (1996).
17. Ory, S., Zhou, M., Conrads, T.P., Veenstra, T.D. & Morrison, D.K. Protein phosphatase 2A positively regulates Ras signaling by dephosphorylating KSR1 and Raf-1 on critical 14–3-3 binding sites. Curr. Biol. 13, 1356–1364 (2003).
18. Goudreault, M. et al. A PP2A phosphatase high density interaction network identifies a novel striatin-interacting phosphatase and kinase complex linked to the cerebral cavernous malformation 3 (CCM3) protein. Mol. Cell. Proteomics 8, 157–171 (2009).
19. Ribeiro, P.S. et al. Combined functional genomic and proteomic approaches identify a PP2A complex as a negative regulator of Hippo signaling. Mol. Cell 39, 521–534 (2010).
20. Byrne, A.B. et al. A global analysis of genetic interactions in Caenorhabditis elegans. J. Biol. 6, 8 (2007).
21. Lehner, B., Crombie, C., Tischler, J., Fortunato, A. & Fraser, A.G. Systematic mapping of genetic interactions in Caenorhabditis elegans identifies common modifiers of diverse signaling pathways. Nat. Genet. 38, 896–903 (2006).
22. Luo, J. et al. A genome-wide RNAi screen identifies multiple synthetic lethal interactions with the Ras oncogene. Cell 137, 835–848 (2009).
23. Mani, R., St Onge, R.P., Hartman, J.L.t., Giaever, G. & Roth, F.P. Defining genetic interaction. Proc. Natl. Acad. Sci. USA 105, 3461–3466 (2008).
24. Baryshnikova, A. et al. Quantitative analysis of fitness and genetic interactions in yeast on a genome scale. Nat. Methods 7, 1017–1024 (2010).
25. Casey, F.P., Cagney, G., Krogan, N.J. & Shields, D.C. Optimal stepwise experimental design for pairwise functional interaction studies. Bioinformatics 24, 2733–2739 (2008).
26. Battle, A., Jonikas, M.C., Walter, P., Weissman, J.S. & Koller, D. Automated identification of pathways from quantitative genetic interaction data. Mol. Syst. Biol. 6, 379 (2010).
27. Manolio, T.A. et al. Finding the missing heritability of complex diseases. Nature 461, 747–753 (2009).
28. Dowell, R.D. et al. Genotype to phenotype: a complex problem. Science 328, 469 (2010).
29. Shao, H. et al. Genetic architecture of complex traits: large phenotypic effects and pervasive epistasis. Proc. Natl. Acad. Sci. USA 105, 19910–19914 (2008).
© 2
011
Nat
ure
Am
eric
a, In
c. A
ll ri
gh
ts r
eser
ved
.
doi:10.1038/nmeth.1581 nAture methods
online methodsDesign of RNAi reagents. We designed 192 dsRNAs (two independent designs each for 42 MAPK pathway components and 51 phosphatases, and controls targeting the firefly luciferase mRNA, CSN3, CSN4, thread, Pvr and pbl) using the NEXTRNAi software9. The dsRNAs were 150–175 base pairs long and avoided (i) perfect matches > 19 nt to unintended transcripts, (ii) significant sequence similarity to unintended transcripts (BLAST E value ≤ 10−10), (iii) more than 6 contiguous CAN repeats or other regions of low complexity or (iv) annotated untranslated regions in the target. Primer and amplicon information was based on FlyBase release 5.16 (ref. 30) and is listed in Supplementary Table 1.
We synthesized the reagents in 96well plates using a twostep PCR approach followed by in vitro transcription as described earlier31,32. All steps yielded a synthesis success rate of 100%. dsRNAs were purified by gel filtration through BioGel P30 (Biorad) and concentrations were adjusted to 50 ng µl−1.
Validation of RNAi knockdown in Drosophila S2 cells. We aliquoted 125 ng of each dsRNA reagent (either single or in combination with a second dsRNA) into 384well plates, combined them with 13,500 cells in 40 µl of culture medium, 0.2 µl 0.4 mg ml−1 dimethyldioctadecylammonium bromide (DDAB)33 per well and incubated the plates for 5 d at 25 °C. For quantitative (q)PCR analysis, we lysed the cells in 30 µl QuickExtract RNA Extraction Solution (Epicentre) and performed DNAse treatment according to the manufacturer’s instructions. We used 2 µl of this cell lysate for cDNA synthesis by random priming with the Revertaid cDNA synthesis kit (Fermentas) and performed qPCR analysis using the 2× Maxima SYBR green reagent (Fermentas) according to the manufacturer’s instructions. We designed all qPCR primers using QuantPrime34 (Supplementary Table 1). Of all dsRNA reagents, 83% caused >60% reduction of transcript levels (Supplementary Figs. 2 and 3). Knockdown efficiency between independent, nonoverlapping dsRNAs for the same target gene was highly concordant with a correlation coefficient of > 0.8.
Drosophila tissue culture. We cultured Schneider S2 cells adjusted to serumfree growth medium (D.Mel2; Invitrogen) in Express Five SFM (Invitrogen) supplemented with 20 mM GlutaMAX (Invitrogen) and 1% penicillinstreptomycin (Invitrogen).
Human tissue culture. We cultured HEK293T cells in DMEM (Invitrogen) supplemented with 10% FBS (Biochrom) and 1% penicillinstreptomycin.
Matrix dilution series. We combined eight different dsRNA amounts targeting Drk, Ras85D and Gap1 in all pairwise combinations (0, 10, 20, 40, 80, 100, 120 and 140 ng) and adjusted the total amount of dsRNA to 280 ng per well (6 µl final volume) with a controldsRNA targeting firefly luciferase mRNA. We seeded 15,000 cells per well in 40 µl culture medium containing 0.2 µl DDAB transfection reagent using the Thermo Scientific Multidrop dispenser and incubated the plates for 4 d at 25 °C.
Combinatorial RNAi. For the doubleRNAi screen, we used a templatequery design. We aliquoted 125 ng (2.5 µl) of each of the 192 template dsRNAs into both halves of a 384well clearbottom microscopy plate (BD Biosciences). Then, we combined
each halfplate with 125 ng (2.5 µl) of one the 192 query dsRNAs, creating 36,864 combinations (192 dsRNAs versus 192 dsRNAs). Each pairwise combination of genes was assayed through eight pairs of independent dsRNA designs: denote by A and A′ the two independent designs targeting one gene and by B and B′ the two independent dsRNA reagents targeting the other, then each biological replicate of the experiment contained the templatequery combinations AB, AB′, BA, B′A, A′B, A′B′, BA′, B′A′.
In each biological replicate, we seeded 13,500 cells in 40 µl culture medium with 0.2 µl of 0.4 mg ml−1 DDAB per well and incubated the plates for 5 d at 25 °C before fixation, nuclear staining and imaging of cells.
Cell staining and imaging. We added 20 µl of 10% paraformaldehyde (Polysciences) with 0.02 mg ml−1 Hoechst 33342 (Invitrogen) to each well and incubated the plates for > 5 h at room temperature (25 °C), followed by storage at 8 °C. We acquired the fluorescence images with an Acumen Explorer eX3 (TTP Labtech) and processed them using custom software. To visualize the cell body (Fig. 3c), we detected microtubules with a fluorescently labeled antibody to αtubulin (SigmaAldrich).
Image processing. Images were obtained from the Acumen laser scanner as 16bit .tiff images of size 4,000 by 4,000 pixels. We normalized the intensities to the range between 0 (lowest intensity) and 1 (highest intensity), and improved the alignment of the scanned rows in each image by a rowwise registration algorithm.
We detected artifacts (for example, dust particles) by a hysteresis thresholding procedure: we identified connected areas with intensity larger than 0.12, and we extended these regions until the intensity fell below 0.08. Regions larger than 636 µm2 were masked and eliminated from subsequent processing. To eliminate highfrequency noise in the images, we blurred the images by twodimensional convolution with a Gaußian filter (bandwidth 1.35 µm).
We segmented the nuclei as follows. First, the image was convoluted with the ‘ringfilter’ kernel f(x,y) ~ exp(−(r − r0)2 / 2s2), in which r = (x2 + y2)0.5, r0 = 2.26 µm and s = 0.56 µm. Pixels in the resulting ringfiltered image whose intensity exceeded that of the image before ringfiltering were labeled ‘nuclear region’ whereas the remaining pixels were labeled as ‘background’. Within the nuclear regions, we identified nucleus centers as the local maxima of the smoothed image intensities, requiring a minimum distance of 3.95 µm between them. Each pixel in a nuclear region was assigned to its closest nucleus center to define individual objects (candidate nuclei). Objects with an area smaller than 10.2 µm2 were removed. We extracted summaries for 43 initial features from the recorded images and then carefully selected the most relevant ones as follows: We performed principal component analysis and observed that 99% of the variability was explained by the first five principal components. We therefore concluded that the number of features could be reduced. MAPK signaling directly affects cell number, nuclear size and fluorescent Hoechst intensity phenotypes in Drosophila cells, making these features particularly relevant from a biological point of view. These three features (number of cells, area and intensity) explained 95% of the variance in the data, whereas the cell number feature alone explained 66%. We therefore focused the analysis on these three phenotypic features.
© 2
011
Nat
ure
Am
eric
a, In
c. A
ll ri
gh
ts r
eser
ved
.
doi:10.1038/nmeth.1581nAture methods
Computational analysis. The computational tools we developed, a script to reproduce the full analysis and all datasets are available as Bioconductor packages RNAinteract and RNAinteractMAPK at http://www.bioconductor.org/.
Mathematical modeling of synthetic genetic interactions. Following a previously introduced definition35, we modeled the double RNAi phenotypic effect of noninteracting gene pairs as the product of the singleRNAi phenotypic effects (main effects). The model is represented by the equation
d w m mijk i j ij ijk= + + + +′ p e
in which dijk is the logarithm of the kth measurement of the doubleRNAi phenotype of genes i (as query) and j (as template), w is the logarithm of the quantitative phenotype in unperturbed cells, mi is the logarithm of the single knockdown effect of gene i (as query), m′j is the logarithm of the single knockdown effect of gene j (as template), πij is the pairwise interaction term (π score) and εijk is a noise term which models biological and experimental variation.
The main effects were estimated from the measurements dijk, including all double RNAi measurements as well as the negative controls, by setting πij = 0 in equation (1) and applying robust regression. In particular, we minimized the sum of absolute values (L1norm) of εijk. The estimate for w was determined by requiring that for the negative controls (firefly luciferase), mneg = m′neg = 0. Altogether, the estimates were
ˆ , ˆ , ˆ arg min ,, ,
w m m d w m m mw m m
ijk i jijk
′ ′′
= − − − =∑ 1
10such that anneg dd negm′ = 0
This procedure was motivated by the fact that πij is sparse, that is, of negligible size for most pairs i,j. The standard error (s.e.) of the main effects was estimated by
s e median. . .i
jkjk
ijk i jd m m= × − − −( )( )∑1 48
1
1w ′
The pairwise interaction term πij was computed as the difference of the measured phenotype and the value from the noninteraction model (NIMij)
pij ijk ijkKd= −∑1 NIM with NIMij i jw m m= + +ˆ ˆ ˆ ′
To quantify statistical significance we computed for each i,j the moderated onesample t statistic of the 8 values per gene pair
d m mijk i j− + +( )w ′
and the P values associated with the twosided test against the null hypothesis t = 0.
We provide two P values for each phenotype (Supplementary Table 3) (i) with moderation as described previously36 and implemented in the Bioconductor package limma37 and (ii) using a more conservative method of moderation, choosing the maximum of the empirical s.d. of the eight measurements and the median of the empirical s.d. of all gene pairs, respectively, as the s.d. for the test statistic. P values were obtained from Student’s tdistribution with 7 degrees of freedom. If not
(1)(1)
(2)(2)
(3)(3)
(4)(4)
otherwise stated, the results obtained using the conservative method are shown. In addition, we provide a P value from a Hotelling T2 test testing all three phenotypic features jointly. We also converted the P values into q values using a previously published method38 to estimate the false discovery rate within a set of significant interactions.
Estimation of the interaction surface in the matrix dilution series. For each gene pair we made 8 × 8 measurements for each combination of dsRNA concentrations. A twodimensional surface of thin plate splines was fit to these data to remove noise. The smoothing parameter (degree of freedom) was estimated by eightfold crossvalidation. The expected values for noninteracting genes were computed as the sum of the respective main effects for each pair of concentrations. The π scores were computed as distance of the expected values from the fitted surface.
Comparison to other networks. To compare the resulting interactions with other networks, we considered threshold graphs for each phenotype. The nodes of the graph corresponded to the genes and the edges to those πij with q value less than 5%. Each resulting genetic interaction network was compared to three other interaction networks11: literaturecurated genetic interactions from Drosophila, a network of genes correlated from expression data and human interologs (interactions reported in human that were orthologymapped to the fly genome). The other networks reported in the Drosophila Interactions Database (DroID) were too sparse for comparison with our data. To evaluate the relationship between known proteinprotein interaction pairs in Drosophila and the detected genetic interactions, we manually curated a set of proteinprotein interaction pairs from Flybase and the literature. Significant overlap between the two networks was detected using Fisher’s exact test. Furthermore, to test for phenotypespecific interactions, we conducted tests restricted to gene pairs that had interactions affecting only a single phenotype (FDR, 5%).
Clustering. For each gene, its interaction profile (the vector of π scores with all other genes) was used as a 93dimensional feature vector. The data were projected into the space spanned by the first four principal components. Euclidean distances in that space were computed between genes, and genes were clustered by hierarchical agglomeration with complete linkage.
Classification. To train a classifier, we defined four classes of genes: positive regulators of the RasMAPK pathway, negative regulators of the RasMAPK pathway, positive regulators of the JNK pathway and a group of genes not annotated to have a specific role in the MAPK pathways. The interaction profile (π scores with all other genes) was used as a 93dimensional feature vector. The number of examples of each class (5–10 genes) was small; hence, to avoid overfitting, sparse (regularized) linear discriminant analysis was used as implemented in the CRAN package sparseLDA (L. Clemmensen, T. Hastie & B. Ersboll, Sparse Discriminant Analysis. IMM Technical Report; 2008). Classifiers were learned separately for each biological replicate and phenotype and merged by computing the mean of the predicted class probabilities. We assessed the accuracy of the classifier for independent genes outside the training set by leaveoneout crossvalidation.
NIMij i jw m m= + +ˆ ˆ ˆ ′NIMij i jw m m= + +ˆ ˆ ˆ ′NIMij i jw m m= + +ˆ ˆ ˆ ′
NIMij i jw m m= + +ˆ ˆ ˆ ′NIMij i jw m m= + +ˆ ˆ ˆ ′NIMij i jw m m= + +ˆ ˆ ˆ ′
© 2
011
Nat
ure
Am
eric
a, In
c. A
ll ri
gh
ts r
eser
ved
.
doi:10.1038/nmeth.1581 nAture methods
The probabilities shown in Figure 4e are the predicted probabilities for each gene, obtained by removing it from the training set.
MAPK target gene analysis through reverse transcription–qPCR and western blot analysis. We seeded 0.3 × 10⁶ Drosophila S2 cells with 4 µl 0.4 mg ml−1 DDAB transfection reagent and 10 µg dsRNA in 1 ml Express Five SFM medium (Invitrogen) in 12well dishes. After incubation at 25 °C for 5 d, we extracted RNA using Trizol (Invitrogen) and repurified it using RNeasy spin columns (Qiagen) following the manufacturer’s instructions. Reverse transcription and qPCR analysis was performed as described above. Primer sequences are available in Supplementary Table 4.
For western blot experiments with Drosophila cells, we seeded 0.3 × 10⁶ S2 cells with 4 µl 0.4 mg ml−1 DDAB transfection reagent and 10 µg dsRNA in 1 ml Express Five SFM medium (Invitrogen) in 12well dishes. We incubated the cells at 25 °C for 4 d, followed by an overnight incubation in serumfree Schneider’s medium (Invitrogen). We lysed the cells by scraping in 200 µl 2% SDS, 20% glycerol, 100 mM TrisHCl (pH 6.8), followed by immediate incubation at 95 °C for 10 min and separated the proteins by SDSPAGE.
We performed knockdown experiments in human cells by reverse transfection of single siRNAs or siRNA pools (supplied by Dharmacon, Thermo Scientific) using Dharmafect I transfection reagent (Dharmacon, Thermo Scientific). The sequences of the siRNAs used are available in Supplementary Table 5.
For western blot experiments with human cells, we prepared a transfection mix containing 149 µl RPMI and 1 µl Dharmafect I and added to 50 µl siRNAs (500 nM). After 30 min incubation, we added 60,000 HEK293T cells (in 800 µl DMEM supplemented with 10% FBS). Cells were grown for 3 d at 37 °C (5% CO2), followed by an overnight incubation in DMEM supplemented with 0.5% FBS. We washed the cells once with PBS and then lysed them in 450 µl 2% SDS, 20% glycerol, 100 mM TrisHCl (pH 6.8). We immediately incubated the lysates at 95 °C for 15 min and separated the proteins by SDSPAGE. Western blotting was performed according to standard protocols with the following rabbit polyclonal antibodies: antiERK (Sigma), antidpERK (Cell Signaling technology), antiSTRN (Chemicon/Millipore), antiSTRN3 (Millipore), antiCka (provided by S.X. Hou) as well as rat antihemagglutinin (HA) (Roche Applied Science) and mouse antiβ tubulin (Sigma). Western blotting detection was performed using HRPconjugated secondary antibodies (GE Healthcare) and ECL+ reagents (GE Healthcare).
Immunoprecipitation experiments from Drosophila S2 cells. The GCKIII fulllength coding sequence fused to a Cterminal HAepitope tag sequence in the pUAST expression vector (provided
by N. Perrimon). We transfected the expression vector along with a pRMGal4 driver for inducible expression using Effectene into 4 × 10⁶ S2 cells in sixwell dishes. We induced protein expression with 0.7 mM CuSO4 after 24 h and incubated the cells for an additional 2 d at 25 °C. Then we lysed the cells in 1 ml 1% Triton X100, 50 mM TrisCl (pH 7.4), 300 mM NaCl, 5 mM EDTA, 1× protease inhibitors (Roche), 5 mM sodium fluoride and 2 mM sodium orthovanadate, and cleared the lysate by centrifugation at 10,000g at 4 °C for 10 min. We incubated the supernatant with rabbit Cka antibodies (provided by W. Du) prebound to 30 µl protein A–agarose beads (Sigma) at 4 °C overnight. We washed the beads four times with 1 ml 0.1% (w/v) Triton X100, 50 mM TrisCl (pH 7.4), 300 mM NaCl and 5 mM EDTA at 4 °C and eluted bound proteins by incubating the beads in 2× Lämmli sample buffer at 95 °C for 5 min. Western blot detection was performed as described above.
We PCRamplified the fulllength coding sequence of mts from BDGP gold collection clone LD26077 and fused to three Cterminal HAepitope tags in the pUAST expression vector. Immunoprecipitations were essentially performed as described above, but with 150 mM NaCl, 0.2% NP40, 10% glycerol and 20 mM TrisHCl (pH 7.4) as lysis and wash buffer.
Genetic interaction of Cka loss-of-function alleles with EgfrElpB1 allele in vivo. We obtained two previously described Pelement insertions into the Cka locus14,39 from the Bloomington stock center: P3Cka05836cn1/CyO; ry506 and w1118; P{lacW}Ckas1883/CyO and crossed them to EgfrElpB1/CyO flies (provided by N. Perrimon). We scored wings from female offspring for ectopic vein material phenotypes.
30. Tweedie, S. et al. FlyBase: enhancing Drosophila Gene Ontology annotations. Nucleic Acids Res. 37, D555–D559 (2009).
31. Boutros, M. et al. Genome-wide RNAi analysis of growth and viability in Drosophila cells. Science 303, 832–835 (2004).
32. Steinbrink, S. & Boutros, M. RNAi screening in cultured Drosophila cells. Methods Mol. Biol. 420, 139–153 (2008).
33. Han, K. An efficient DDAB-mediated transfection of Drosophila S2 cells. Nucleic Acids Res. 24, 4362–4363 (1996).
34. Arvidsson, S., Kwasniewski, M., Riano-Pachon, D.M. & Mueller-Roeber, B. QuantPrime–a flexible tool for reliable high-throughput primer design for quantitative PCR. BMC Bioinformatics 9, 465 (2008).
35. Norton, B. & Pearson, E.S. A note on the background to and refereeing of R.A. Fisher’s 1918 paper. Notes Rec. R. Soc. Lond. 31, 151–162 (1976).
36. Lönnstedt, I. & Speed, T.P. Replicated microarray data. Statist. Sinica 12, 31–46 (2002).
37. Smyth, G.K. Linear models and empirical bayes methods for assessing differential expression in microarray experiments. Stat. Appl. Genet. Mol. Biol. 3, 3 (2004).
38. Storey, J.D. & Tibshirani, R. Statistical significance for genomewide studies. Proc. Natl. Acad. Sci. USA 100, 9440–9445 (2003).
39. Weng, L. & Du, W. Role of Cka in imaginal disc growth and differentiation. Drosoph. Inf. Serv. 85, 8–12 (2002).
© 2
011
Nat
ure
Am
eric
a, In
c. A
ll ri
gh
ts r
eser
ved
.
Related Documents