Manpower Employment Outlook Survey India Q 2 2015

Welcome message from author
This document is posted to help you gain knowledge. Please leave a comment to let me know what you think about it! Share it to your friends and learn new things together.
Transcript

Manpower Employment Outlook SurveyIndia
Q2 2015
The Manpower Employment
Outlook Survey for the
second quarter 2015 was
conducted by interviewing a
representative sample of
5,003 employers in India.
All survey participants were
asked, “How do you
anticipate total employment
at your location to change in
the three months to the end
of June 2015 as compared
to the current quarter?”
Contents Country Employment Outlook 1Organisation-Size ComparisonsRegional Comparisons Sector Comparisons
Global Employment Outlook 11International Comparisons – Asia Pacifi cInternational Comparisons – AmericasInternational Comparisons – EMEA
About the Survey 27
About ManpowerGroupTM 28Ind
iaE
mp
loym
en
tO
utl
oo
k
Manpower Employment Outlook Survey 1
Increase Decrease No Change Don’t KnowNet Employment
Outlook
Seasonally
Adjusted
% % % % % %
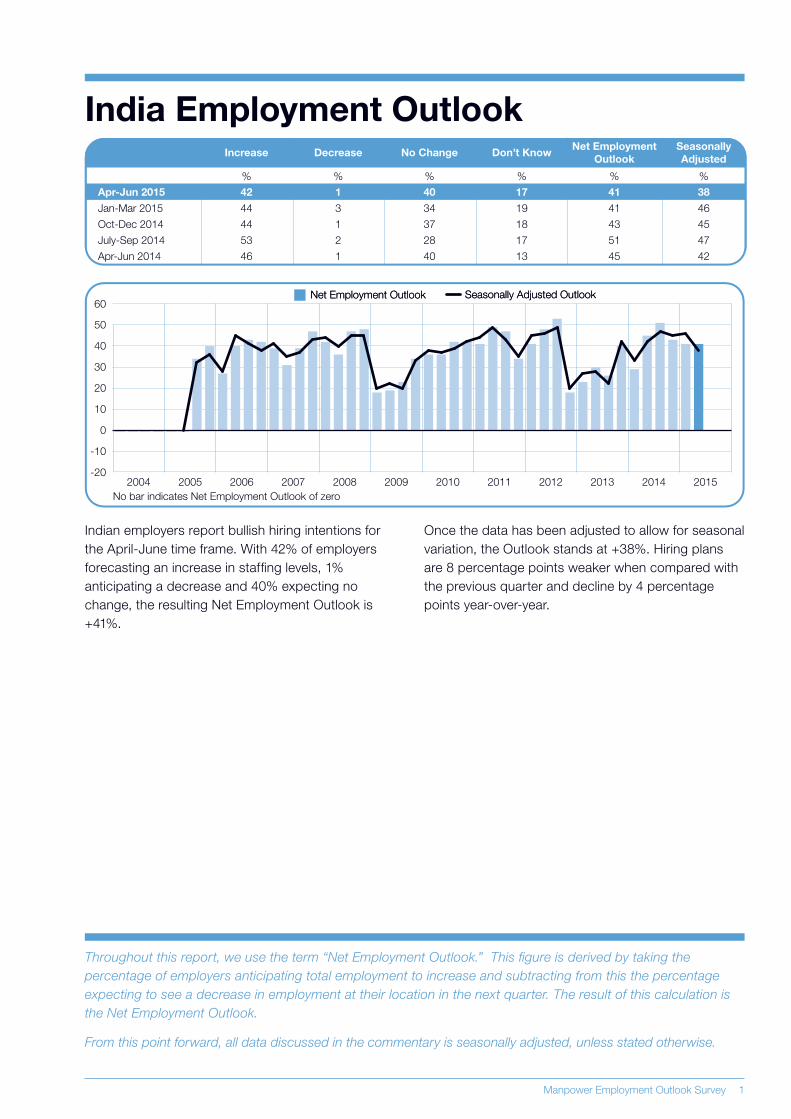
Apr-Jun 2014 46 1 40 13 45 42
July-Sep 2014 53 2 28 17 51 47
Oct-Dec 2014 44 1 37 18 43 45
Jan-Mar 2015 44 3 34 19 41 46
Apr-Jun 2015 42 1 40 17 41 38
Seasonally Adjusted OutlookSeasonally Adjusted OutlookNet Employment OutlookNet Employment Outlook
No bar indicates Net Employment Outlook of zero
2004 2005 2006 2007 2008 2009 2010 2011 2012 2013 2014 2015
50
60
40
30
20
10
0
-10
-20
India Employment Outlook
Indian employers report bullish hiring intentions for
the April-June time frame. With 42% of employers
forecasting an increase in staffi ng levels, 1%
anticipating a decrease and 40% expecting no
change, the resulting Net Employment Outlook is
+41%.
Once the data has been adjusted to allow for seasonal
variation, the Outlook stands at +38%. Hiring plans
are 8 percentage points weaker when compared with
the previous quarter and decline by 4 percentage
points year-over-year.
Throughout this report, we use the term “Net Employment Outlook.” This fi gure is derived by taking the
percentage of employers anticipating total employment to increase and subtracting from this the percentage
expecting to see a decrease in employment at their location in the next quarter. The result of this calculation is
the Net Employment Outlook.
From this point forward, all data discussed in the commentary is seasonally adjusted, unless stated otherwise.
2 Manpower Employment Outlook Survey
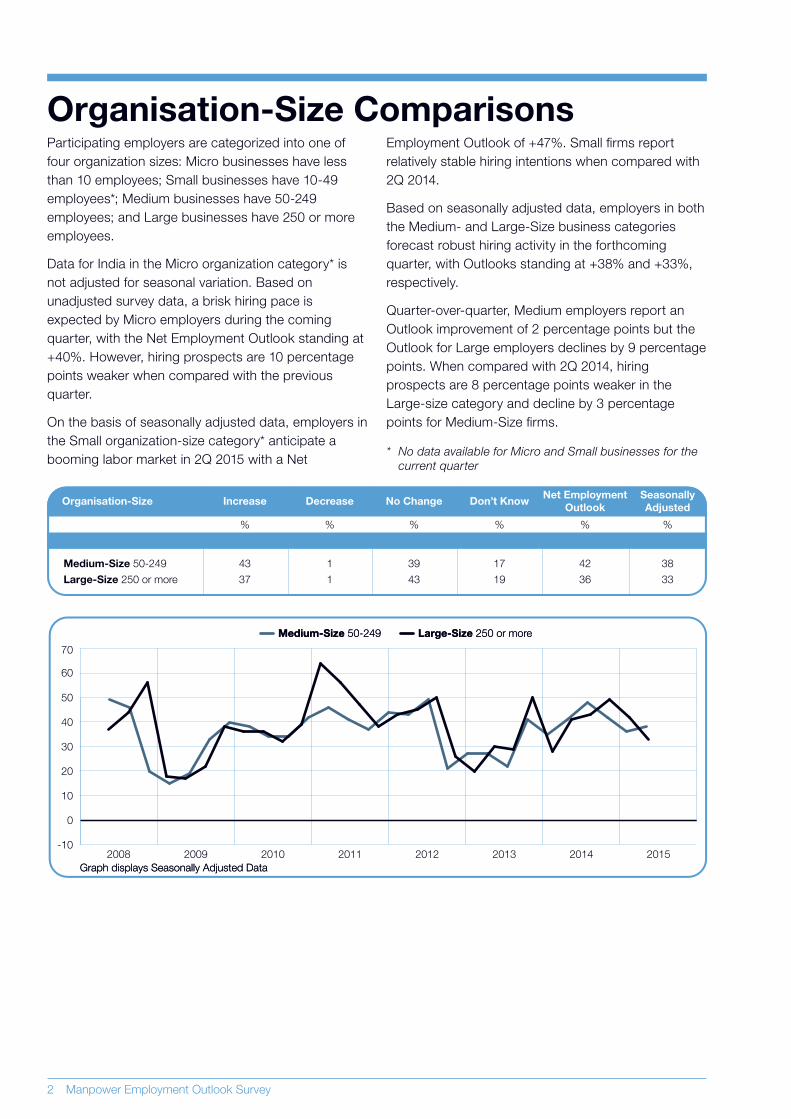
Participating employers are categorized into one of
four organization sizes: Micro businesses have less
than 10 employees; Small businesses have 10-49
employees*; Medium businesses have 50-249
employees; and Large businesses have 250 or more
employees.
Data for India in the Micro organization category* is
not adjusted for seasonal variation. Based on
unadjusted survey data, a brisk hiring pace is
expected by Micro employers during the coming
quarter, with the Net Employment Outlook standing at
+40%. However, hiring prospects are 10 percentage
points weaker when compared with the previous
quarter.
On the basis of seasonally adjusted data, employers in
the Small organization-size category* anticipate a
booming labor market in 2Q 2015 with a Net
Organisation-Size ComparisonsEmployment Outlook of +47%. Small fi rms report
relatively stable hiring intentions when compared with
2Q 2014.
Based on seasonally adjusted data, employers in both
the Medium- and Large-Size business categories
forecast robust hiring activity in the forthcoming
quarter, with Outlooks standing at +38% and +33%,
respectively.
Quarter-over-quarter, Medium employers report an
Outlook improvement of 2 percentage points but the
Outlook for Large employers declines by 9 percentage
points. When compared with 2Q 2014, hiring
prospects are 8 percentage points weaker in the
Large-size category and decline by 3 percentage
points for Medium-Size fi rms.
IncreaseOrganisation-Size Decrease No Change Don’t KnowNet Employment
Outlook
Seasonally
Adjusted
% % % % % %
Large-Size 250 or more 37 1 43 19 36 33
Medium-Size 50-249 43 1 39 17 42 38
Graph displays Seasonally Adjusted DataGraph displays Seasonally Adjusted Data
Medium-Size 50-249Medium-Size 50-249 Large-Size 250 or moreLarge-Size 250 or more
2008 2009 2010 2011 2012 2013 2014 2015-10
0
10
20
30
40
50
60
70
* No data available for Micro and Small businesses for the
current quarter
Manpower Employment Outlook Survey 3
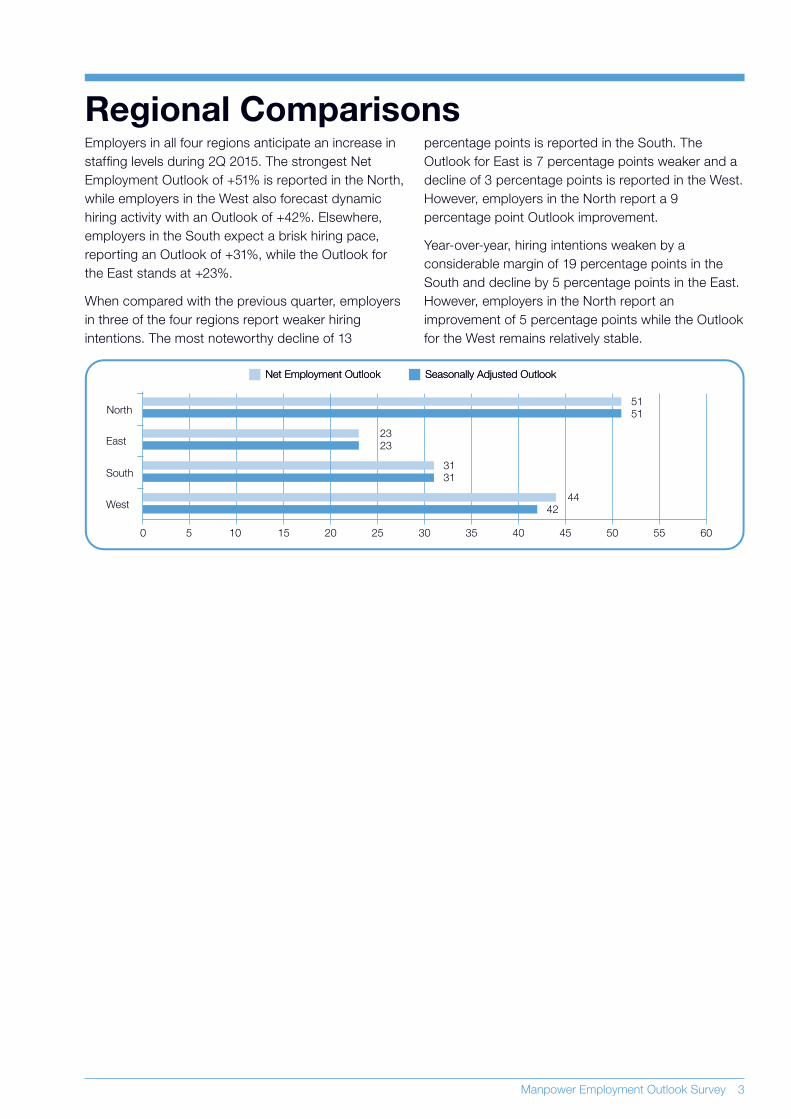
Employers in all four regions anticipate an increase in
staffi ng levels during 2Q 2015. The strongest Net
Employment Outlook of +51% is reported in the North,
while employers in the West also forecast dynamic
hiring activity with an Outlook of +42%. Elsewhere,
employers in the South expect a brisk hiring pace,
reporting an Outlook of +31%, while the Outlook for
the East stands at +23%.
When compared with the previous quarter, employers
in three of the four regions report weaker hiring
intentions. The most noteworthy decline of 13
0 60
31
44
42
23
31
23
105 20 2515 30 35 55504540
North
East
South
West
51
51
Net Employment OutlookNet Employment Outlook Seasonally Adjusted OutlookSeasonally Adjusted Outlook
Regional Comparisonspercentage points is reported in the South. The
Outlook for East is 7 percentage points weaker and a
decline of 3 percentage points is reported in the West.
However, employers in the North report a 9
percentage point Outlook improvement.
Year-over-year, hiring intentions weaken by a
considerable margin of 19 percentage points in the
South and decline by 5 percentage points in the East.
However, employers in the North report an
improvement of 5 percentage points while the Outlook
for the West remains relatively stable.
4 Manpower Employment Outlook Survey
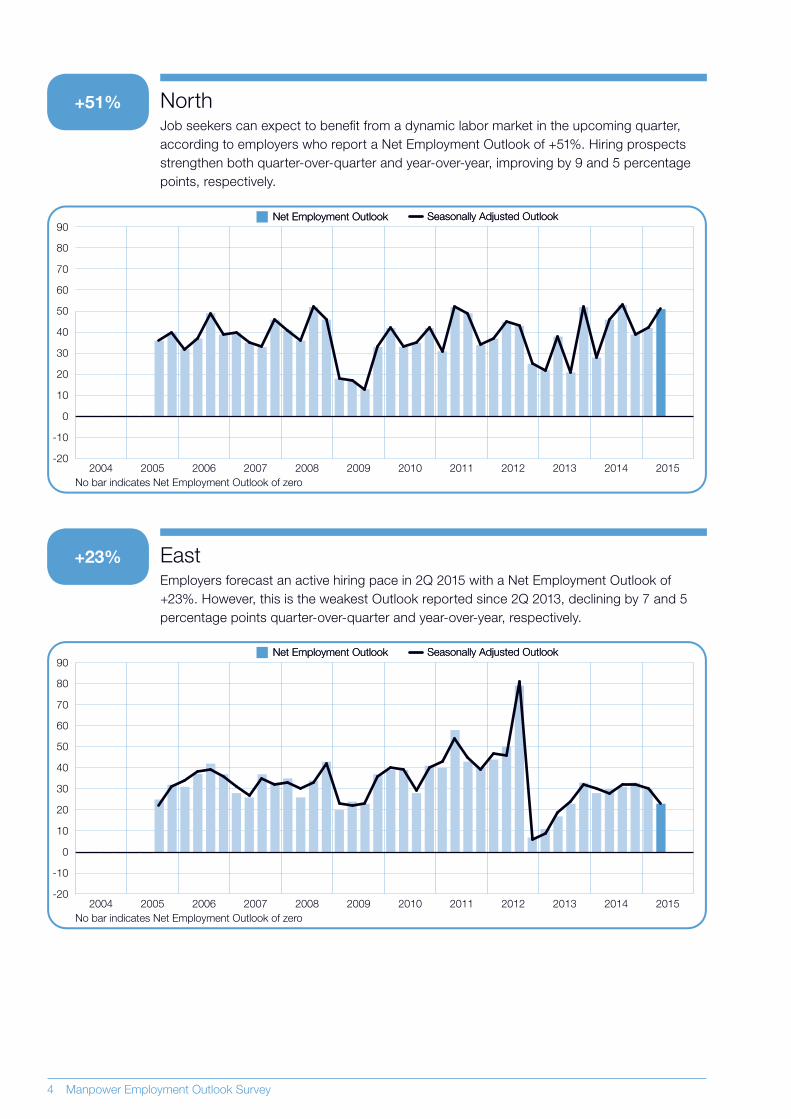
NorthJob seekers can expect to benefi t from a dynamic labor market in the upcoming quarter,
according to employers who report a Net Employment Outlook of +51%. Hiring prospects
strengthen both quarter-over-quarter and year-over-year, improving by 9 and 5 percentage
points, respectively.
EastEmployers forecast an active hiring pace in 2Q 2015 with a Net Employment Outlook of
+23%. However, this is the weakest Outlook reported since 2Q 2013, declining by 7 and 5
percentage points quarter-over-quarter and year-over-year, respectively.
Seasonally Adjusted OutlookSeasonally Adjusted OutlookNet Employment OutlookNet Employment Outlook
No bar indicates Net Employment Outlook of zero
2004 2005 2006 2007 2008 2009 2010 2011 2012 2013 2014 2015
50
60
70
80
90
40
30
20
10
0
-10
-20
Seasonally Adjusted OutlookSeasonally Adjusted OutlookNet Employment OutlookNet Employment Outlook
No bar indicates Net Employment Outlook of zero
2004 2005 2006 2007 2008 2009 2010 2011 2012 2013 2014 2015
50
60
70
80
90
40
30
20
10
0
-10
-20
+51%
+23%
Manpower Employment Outlook Survey 5
+31%
+42%
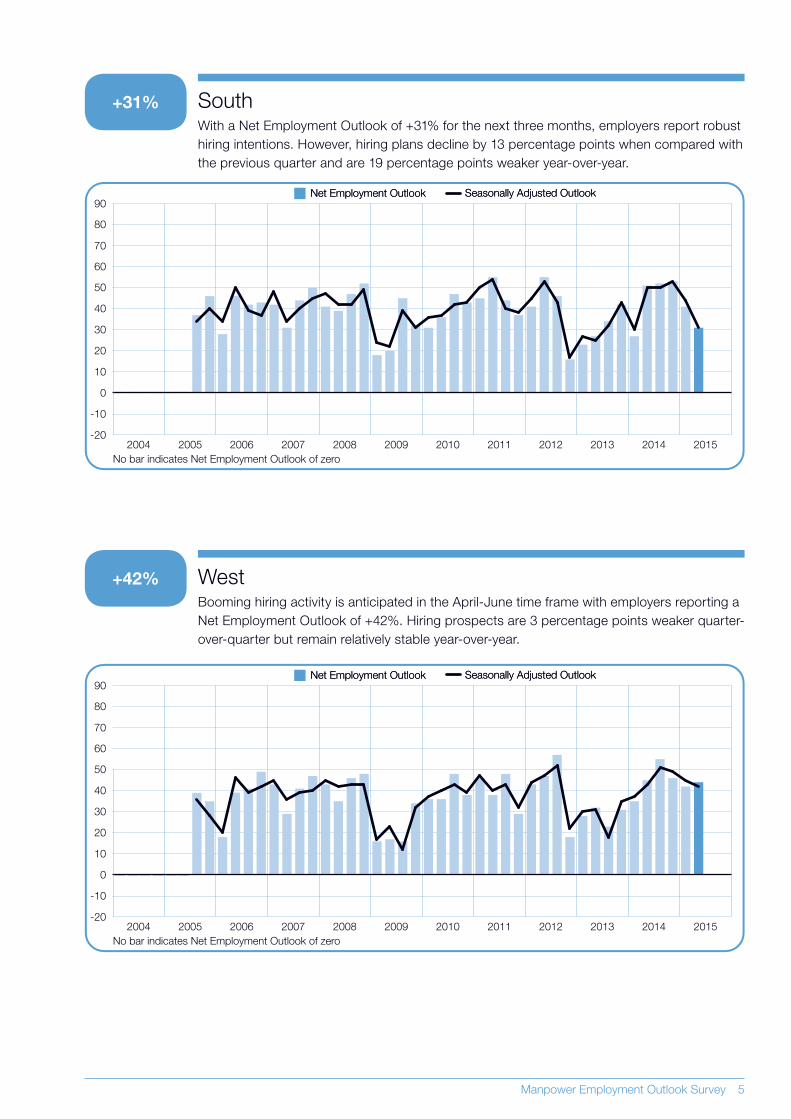
SouthWith a Net Employment Outlook of +31% for the next three months, employers report robust
hiring intentions. However, hiring plans decline by 13 percentage points when compared with
the previous quarter and are 19 percentage points weaker year-over-year.
WestBooming hiring activity is anticipated in the April-June time frame with employers reporting a
Net Employment Outlook of +42%. Hiring prospects are 3 percentage points weaker quarter-
over-quarter but remain relatively stable year-over-year.
Seasonally Adjusted OutlookSeasonally Adjusted OutlookNet Employment OutlookNet Employment Outlook
No bar indicates Net Employment Outlook of zero
2004 2005 2006 2007 2008 2009 2010 2011 2012 2013 2014 2015
50
60
70
80
90
40
30
20
10
0
-10
-20
Seasonally Adjusted OutlookSeasonally Adjusted OutlookNet Employment OutlookNet Employment Outlook
No bar indicates Net Employment Outlook of zero
2004 2005 2006 2007 2008 2009 2010 2011 2012 2013 2014 2015
50
60
70
80
90
40
30
20
10
0
-10
-20
6 Manpower Employment Outlook Survey
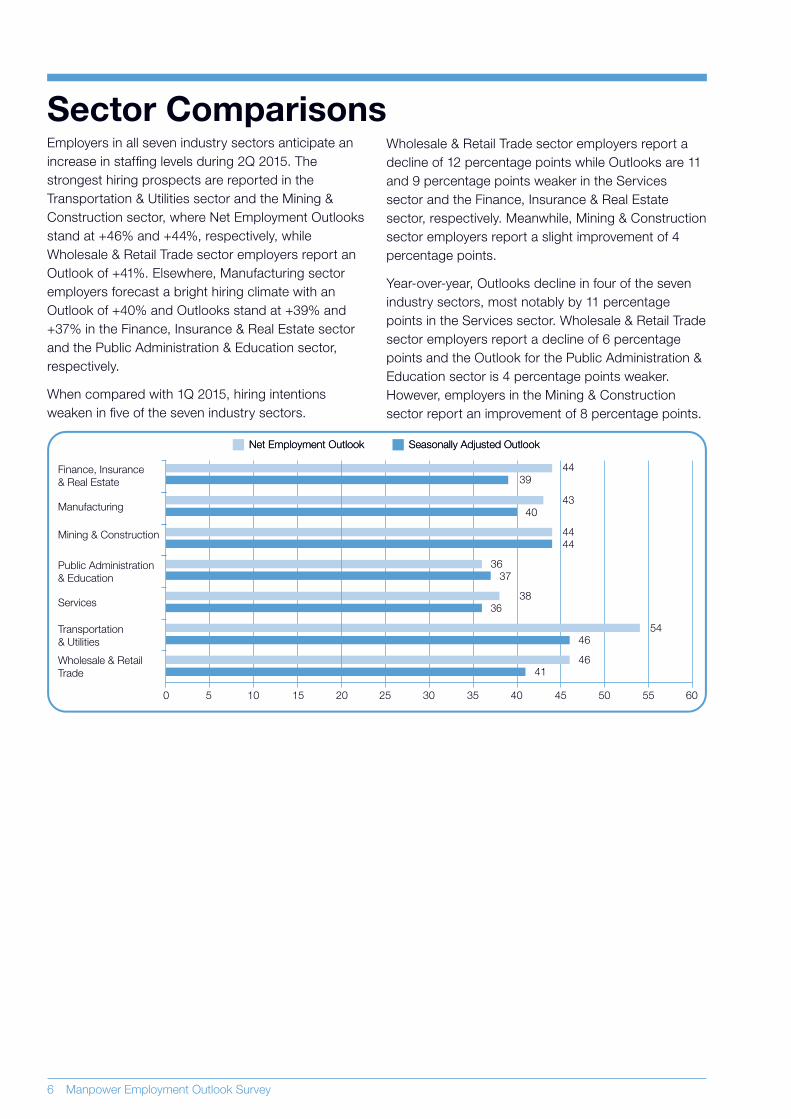
Employers in all seven industry sectors anticipate an
increase in staffi ng levels during 2Q 2015. The
strongest hiring prospects are reported in the
Transportation & Utilities sector and the Mining &
Construction sector, where Net Employment Outlooks
stand at +46% and +44%, respectively, while
Wholesale & Retail Trade sector employers report an
Outlook of +41%. Elsewhere, Manufacturing sector
employers forecast a bright hiring climate with an
Outlook of +40% and Outlooks stand at +39% and
+37% in the Finance, Insurance & Real Estate sector
and the Public Administration & Education sector,
respectively.
When compared with 1Q 2015, hiring intentions
weaken in fi ve of the seven industry sectors.
0 60
54
46
41
46
38
105 20 2515 30 35 55504540
37
36
44
44
40
43
39
44
Net Employment OutlookNet Employment Outlook Seasonally Adjusted OutlookSeasonally Adjusted Outlook
36
Finance, Insurance & Real Estate
Manufacturing
Mining & Construction
Public Administration & Education
Services
Transportation & Utilities
Wholesale & Retail Trade
Sector ComparisonsWholesale & Retail Trade sector employers report a
decline of 12 percentage points while Outlooks are 11
and 9 percentage points weaker in the Services
sector and the Finance, Insurance & Real Estate
sector, respectively. Meanwhile, Mining & Construction
sector employers report a slight improvement of 4
percentage points.
Year-over-year, Outlooks decline in four of the seven
industry sectors, most notably by 11 percentage
points in the Services sector. Wholesale & Retail Trade
sector employers report a decline of 6 percentage
points and the Outlook for the Public Administration &
Education sector is 4 percentage points weaker.
However, employers in the Mining & Construction
sector report an improvement of 8 percentage points.
Manpower Employment Outlook Survey 7
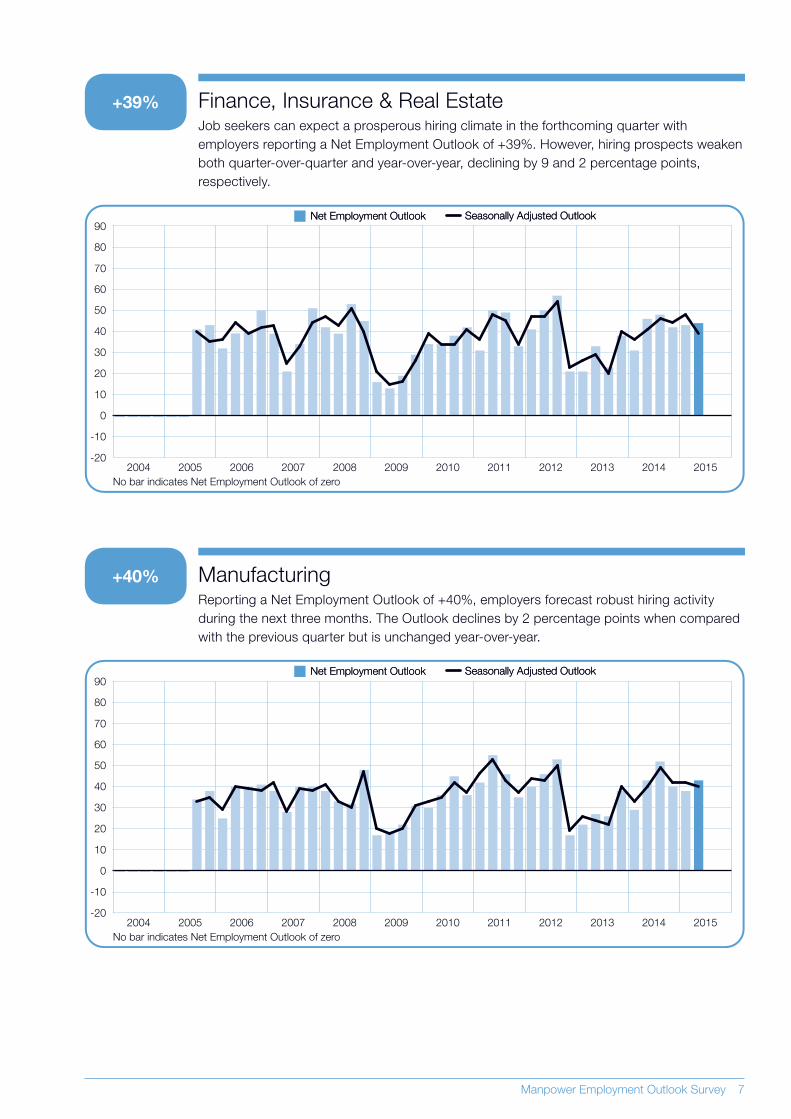
Finance, Insurance & Real EstateJob seekers can expect a prosperous hiring climate in the forthcoming quarter with
employers reporting a Net Employment Outlook of +39%. However, hiring prospects weaken
both quarter-over-quarter and year-over-year, declining by 9 and 2 percentage points,
respectively.
ManufacturingReporting a Net Employment Outlook of +40%, employers forecast robust hiring activity
during the next three months. The Outlook declines by 2 percentage points when compared
with the previous quarter but is unchanged year-over-year.
Seasonally Adjusted OutlookSeasonally Adjusted OutlookNet Employment OutlookNet Employment Outlook
No bar indicates Net Employment Outlook of zero
2004 2005 2006 2007 2008 2009 2010 2011 2012 2013 2014 2015
50
60
70
80
90
40
30
20
10
0
-10
-20
Seasonally Adjusted OutlookSeasonally Adjusted OutlookNet Employment OutlookNet Employment Outlook
No bar indicates Net Employment Outlook of zero
2004 2005 2006 2007 2008 2009 2010 2011 2012 2013 2014 2015
50
60
70
80
90
40
30
20
10
0
-10
-20
+40%
+39%
8 Manpower Employment Outlook Survey
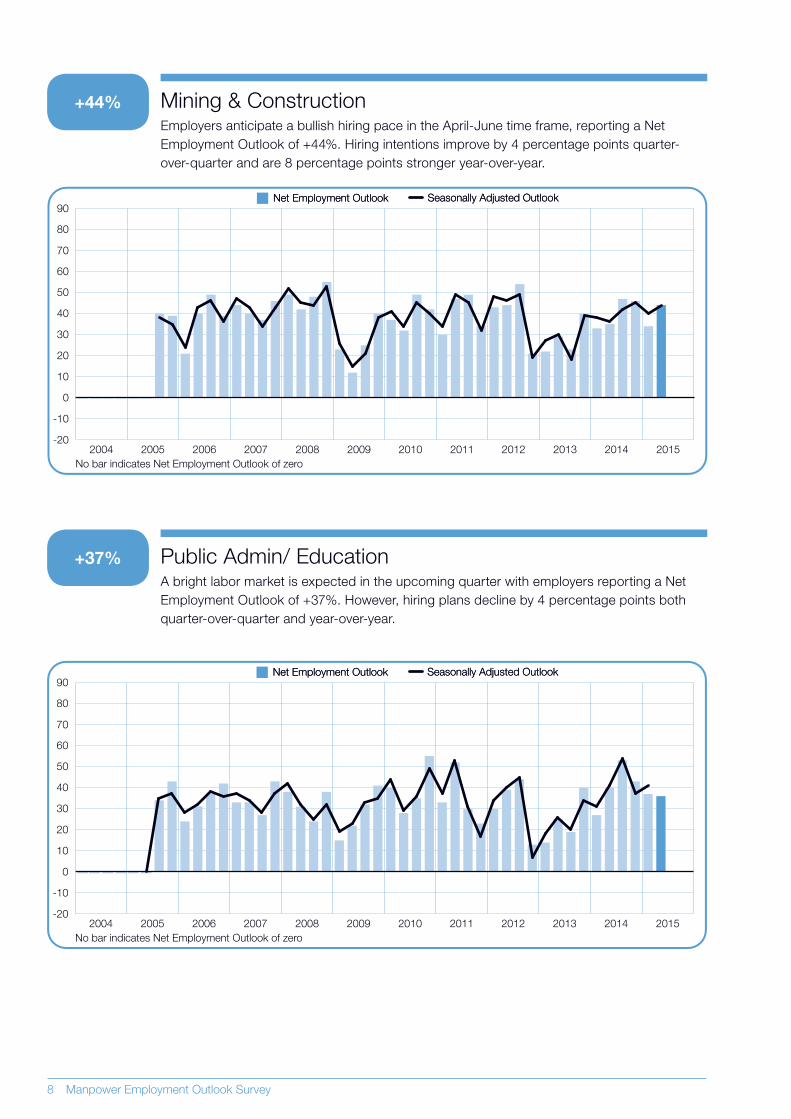
Mining & ConstructionEmployers anticipate a bullish hiring pace in the April-June time frame, reporting a Net
Employment Outlook of +44%. Hiring intentions improve by 4 percentage points quarter-
over-quarter and are 8 percentage points stronger year-over-year.
Public Admin/ EducationA bright labor market is expected in the upcoming quarter with employers reporting a Net
Employment Outlook of +37%. However, hiring plans decline by 4 percentage points both
quarter-over-quarter and year-over-year.
Seasonally Adjusted OutlookSeasonally Adjusted OutlookNet Employment OutlookNet Employment Outlook
No bar indicates Net Employment Outlook of zero
2004 2005 2006 2007 2008 2009 2010 2011 2012 2013 2014 2015
50
60
70
80
90
40
30
20
10
0
-10
-20
Seasonally Adjusted OutlookSeasonally Adjusted OutlookNet Employment OutlookNet Employment Outlook
No bar indicates Net Employment Outlook of zero
2004 2005 2006 2007 2008 2009 2010 2011 2012 2013 2014 2015
50
60
70
80
90
40
30
20
10
0
-10
-20
+44%
+37%
Manpower Employment Outlook Survey 9
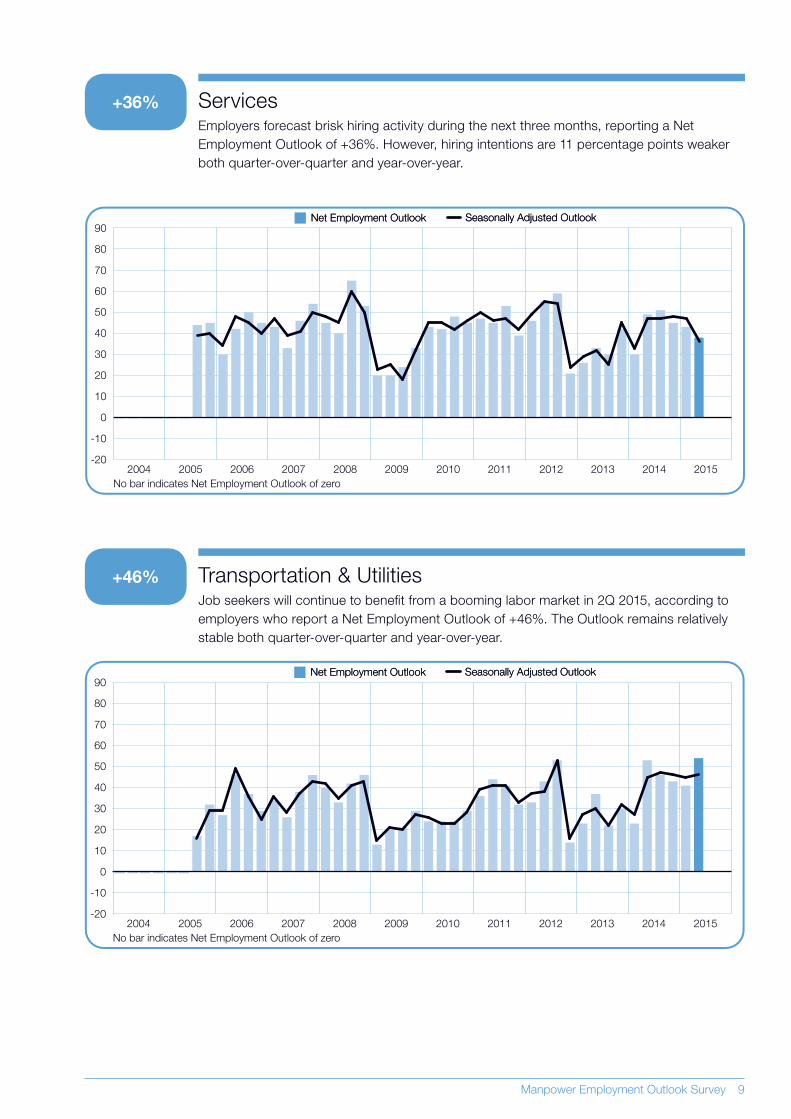
ServicesEmployers forecast brisk hiring activity during the next three months, reporting a Net
Employment Outlook of +36%. However, hiring intentions are 11 percentage points weaker
both quarter-over-quarter and year-over-year.
Transportation & UtilitiesJob seekers will continue to benefi t from a booming labor market in 2Q 2015, according to
employers who report a Net Employment Outlook of +46%. The Outlook remains relatively
stable both quarter-over-quarter and year-over-year.
Seasonally Adjusted OutlookSeasonally Adjusted OutlookNet Employment OutlookNet Employment Outlook
No bar indicates Net Employment Outlook of zero
2004 2005 2006 2007 2008 2009 2010 2011 2012 2013 2014 2015
50
60
70
80
90
40
30
20
10
0
-10
-20
Seasonally Adjusted OutlookSeasonally Adjusted OutlookNet Employment OutlookNet Employment Outlook
No bar indicates Net Employment Outlook of zero
2004 2005 2006 2007 2008 2009 2010 2011 2012 2013 2014 2015
50
60
70
80
90
40
30
20
10
0
-10
-20
+36%
+46%
10 Manpower Employment Outlook Survey
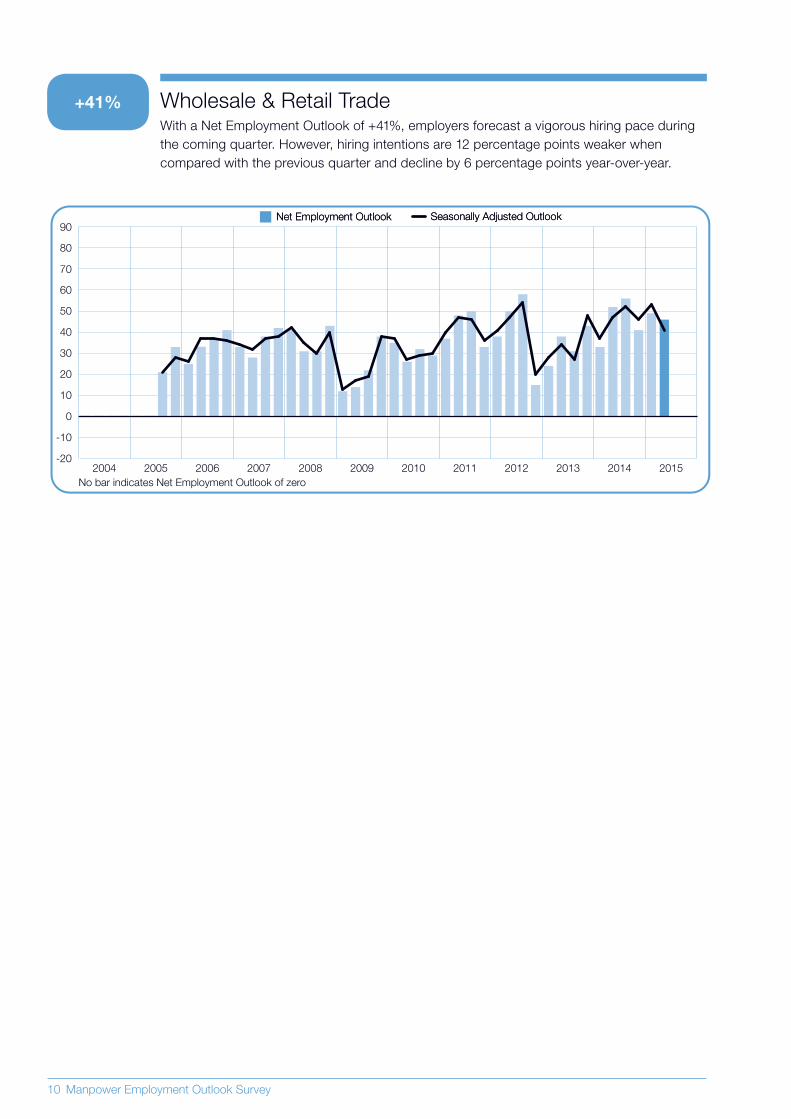
Wholesale & Retail TradeWith a Net Employment Outlook of +41%, employers forecast a vigorous hiring pace during
the coming quarter. However, hiring intentions are 12 percentage points weaker when
compared with the previous quarter and decline by 6 percentage points year-over-year.
Seasonally Adjusted OutlookSeasonally Adjusted OutlookNet Employment OutlookNet Employment Outlook
No bar indicates Net Employment Outlook of zero
2004 2005 2006 2007 2008 2009 2010 2011 2012 2013 2014 2015
50
60
70
80
90
40
30
20
10
0
-10
-20
+41%
Manpower Employment Outlook Survey 11
9 (8)1
3 (1)1
3 (2)1
%
10 (8)1
29 (19)1
19 (17)1
15 (16)1
41 (38)1
14 (14)1
46 (45)1
13 (10)1
12 (11)1
8 (8)1
1 (2)1
6 (5)1
4 (4)1
6 (4)1
8 (6)1
3 (3)1
5 (4)1
6 (4)1
21 (16)1
-4 (-6)1
-1 (-3)1
2 (-4)1
1 (0)1
3 (0)1
11 (-1)1
-6 (-10)1
0 (1)1
0 (-8)1
-2 (-4)1
9 (2)1
-7 (-7)1
-3 (-3)1
-1 (-1)1
-1 (-1)1
2 (2)1
-10 (-10)1
1 (0)1
-4 (-4)1
-4 (-4)1
7 (7)1
14 (9)1 9 (-1)1 0 (0)1
11 (10)1 1 (2)1 -8 (-10)115 (15)1 0 (-1)1 -4 (-2)1
18 (16)1 5 (0)1 3 (3)1
4 (4)1 3 (0)1 5 (4)1
14 (11)1 10 (3)1 6 (6)1
13 (10)1 8 (3)1 5 (5)1
11 (13)1 -2 (3)1 11 (10)112 (6)1 7 (-1)1 -1 (-1)1
8 5 6
9 (8)1 8 (2)1 1 (1)1
20 (11)1 19 (1)1 5 (3)1
9 (0)1
2 (-1)1
-7 (-8)1
1 (1)13 (-1)1 -3 (-9)1 -15 (-15)16 (3)1 3 (0)1 -4 (-3)1
-6 (-6)110 (11)1 1 (3)1 -1 (-1)1
-11 (-11)117 (18)1 -1 (-1)1 4 (2)1
†EMEA – Europe, Middle East and Africa.
1. Number in parentheses is the Net Employment Outlook when adjusted to remove theimpact of seasonal variations in hiring activity. Please note that this data is not available for all countries as a minimum of 17 quarters worth of data is required.
-2 (-2)1
4 (0)1
2 (3)111 19 2
-2 (-2)1
8 (6)1
9 (6)1
1 (-4)1
2 (0)1
5 (1)1
2 (-2)1
7 (-4)1
3 (-1)1
3 (4)1
0 (0)1
4 (4)1
10 3 -3
-3 (-4)1
1 (1)1
2 (1)1
-5 (-7)1
6 (6)1 2 (0)1 -1 (-1)1
0 (0)1
* Indicates unadjusted data.
Quarter 2 2015 Net Employment Outlook
-15 -10 -5 0 5 10 15 20 25 30 35 40 45
-15 -10 -5 0 5 10 15 20 25 30 35 40 45
Taiwan
India
Japan
Panama
New Zealand
Hong Kong
Turkey
United States
Colombia
Singapore
South Africa
Finland
Greece
Guatemala
Mexico
Romania
Canada
Costa Rica
Hungary
Israel
Bulgaria
Australia
China
Peru
Poland
Slovakia
Ireland
Slovenia
United Kingdom
Germany
Czech Republic
Netherlands
Spain
Sweden
Switzerland
Argentina
Norway
Belgium
France
Austria
Brazil
Italy
+45%
+38%
+19%
+18%
+17%
+16%
+16%
+16%
+15%
+14%
+13%
+11%*
+11%
+11%
+11%
+11%
+10%
+10%
+10%
+10%*
+9%
+8%
+8%
+8%
+8%
+8%*
+6%
+6%
+6%
+5%
+4%
+4%
+4%
+4%
+4%
+3%
+3%
+2%
+2%
+1%
-1%
-6%
Quarter 2 2015Qtr on Qtr Change
Q1 2015 to Q2 2015 Yr on Yr Change
Q2 2014 to Q2 2015
Americas
Asia Pacific
Australia
China
Hong Kong
Japan
India
New Zealand
Singapore
Taiwan
EMEA†
Austria
Belgium
Bulgaria
Costa Rica
Colombia
United States
Czech Republic
Greece
Hungary
South Africa
Slovenia
Slovakia
Poland
Romania
Canada
Mexico
Peru
Brazil
Argentina
Guatemala
Panama
France
Germany
Finland
Ireland
Netherlands
Norway
Spain
Turkey
Italy
Switzerland
Sweden
Israel
UK
Global Employment Outlook
12 Manpower Employment Outlook Survey
ManpowerGroup interviewed over 65,000 employers
across 42 countries and territories to forecast labor
market activity* in Quarter 2 2015. All participants
were asked, “How do you anticipate total employment
at your location to change in the three months to the
end of June 2015 as compared to the current
quarter?”
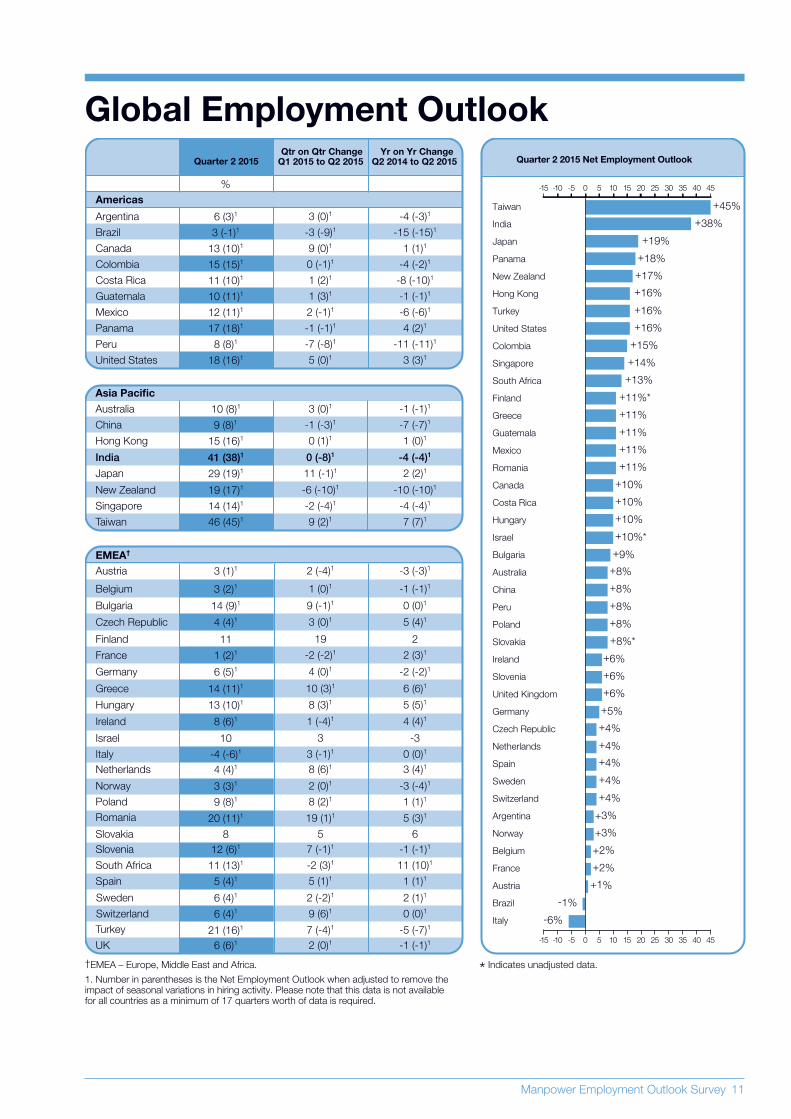
The survey reveals that employers in 40 of 42
countries and territories intend to add to their payrolls
by varying margins during the April-June time frame.
Yet there are few signs that labor markets are gaining
real momentum, and some additional signs that
employer uncertainty is spreading well beyond the
eurozone’s borders. For instance, employer
confi dence continues to decline in China where the
forecast remains positive but dips to a level not
reported since 2009. And for the fi rst time since Brazil
launched the survey in Quarter 4 2009, the country’s
forecast turns negative following considerable
declines in comparison to both the prior quarter and
last year at this time.
Outlooks are mixed in comparison to the Quarter 1
2015 and Quarter 2 2014 surveys; forecasts improve
in 15 countries and decline in 18 quarter-over-quarter,
and improve in a year-over-year comparison in 18
countries while declining in 20. Second-quarter hiring
confi dence is strongest in Taiwan, India, Japan and
Panama. The weakest—and only negative—forecasts
are reported in Italy and Brazil.
Workforce gains are forecast in 23 of 24 countries in
the Europe, Middle East & Africa (EMEA) region, with
only employers in Italy anticipating payroll declines
over the next three months. Hiring plans improve in 11
countries quarter-over-quarter and weaken in only
eight. In a year-over-year comparison, Outlooks
improve in 13 countries and decline in eight. Once
again, Turkish job seekers can expect to benefi t from
the strongest employer hiring plans in the EMEA
region; this is despite the country’s employers
reporting their least optimistic forecast since the
survey started in Quarter 1 2011. In addition to Turkey,
the strongest EMEA forecasts are reported by
employers in South Africa, Finland, Greece and
Romania. The weakest second-quarter forecasts are
reported in Italy and Austria.
Payrolls are expected to increase in all eight Asia
Pacifi c countries and territories. However, Outlooks
are trending weaker than they have in the past and the
hiring pace is expected to slow by varying margins in
fi ve countries and territories in both quarter-over-
quarter and year-over-year comparisons. Employers in
Taiwan report the most optimistic forecast across the
globe for the sixth time in the last three years.
Meanwhile, the region’s weakest forecasts are
reported by employers in Australia and China.
Positive Outlooks are reported in nine of the 10
countries surveyed in the Americas. Hiring confi dence
strengthens in two countries, dips in fi ve and is
unchanged in three when compared to the fi rst three
months of 2015. Similarly, hiring activity is expected to
slow compared to last year at this time in seven
countries, and improve in only three. Employers in
Panama and the United States report the strongest
second-quarter hiring plans while those in Brazil,
Argentina and Peru expect the weakest hiring pace.
Full survey results for each of the 42 countries and
territories included in this quarter’s survey, plus
regional and global comparisons, can be found at
manpowergroup.com/press/meos_landing.cfm.
The next Manpower Employment Outlook Survey will
be released on 9 June 2015 and will detail expected
labor market activity for the third quarter of 2015.
* Commentary is based on seasonally adjusted data where available.
Data is not seasonally adjusted for Finland, Israel and Slovakia.
The Manpower Employment Outlook Survey is ManpowerGroup’s quarterly index of employer hiring confi dence.
Manpower Employment Outlook Survey 13
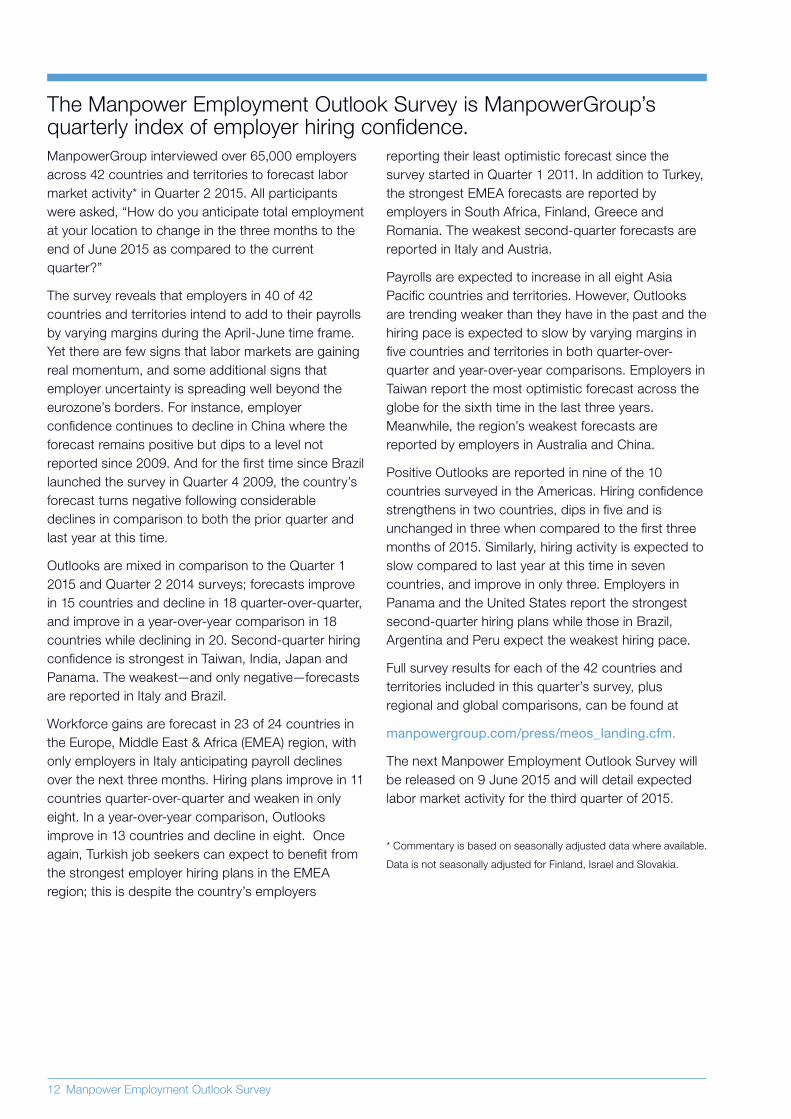
Over 15,000 employers were interviewed in the Asia
Pacifi c region. Employers in each of the eight
countries and territories intend to add to their
workforces in the next three months, but the hiring
pace is expected to slow by varying degrees in fi ve
countries and territories in comparison to both Quarter
1 2015 and Quarter 2 2014. The region’s strongest
hiring plans are reported by employers in Taiwan, India
and Japan, while those in Australia and China report
the weakest.
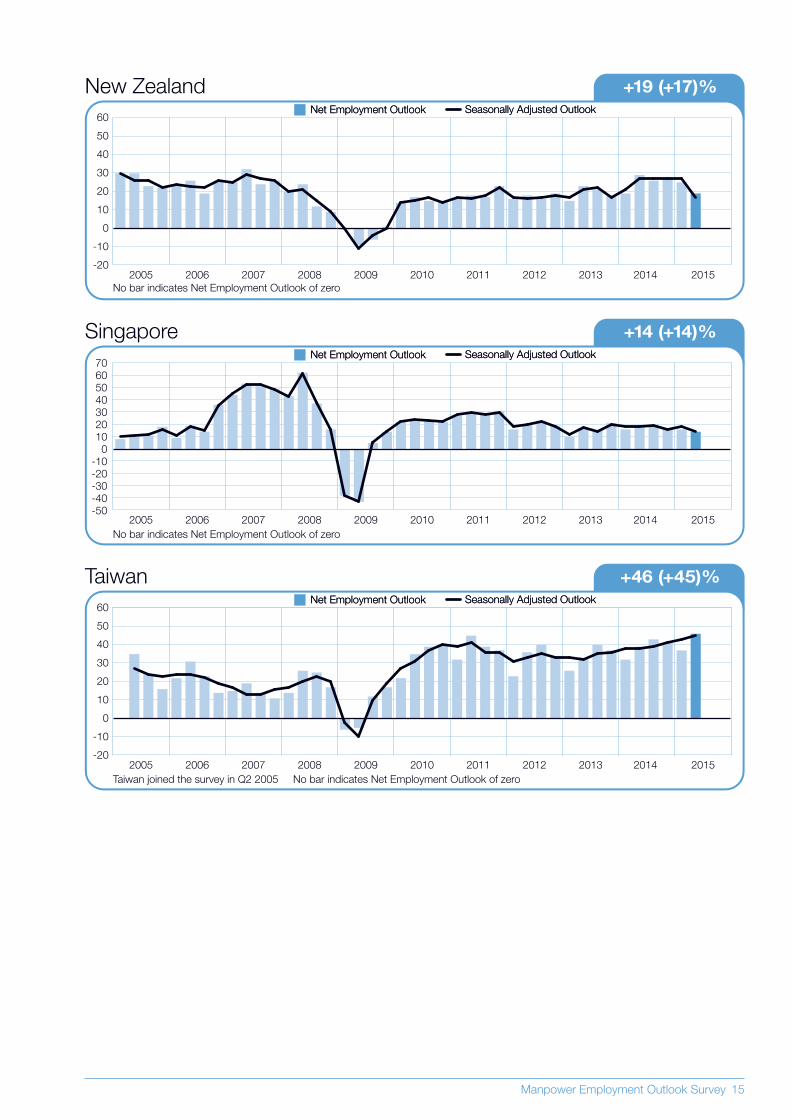
Employers in Taiwan report the most optimistic
forecast among the 42 countries and territories that
participate in the survey. Nearly one of every two
employers indicate they will add to their payrolls in the
April-June time frame, resulting in the strongest
quarterly forecast reported since Taiwan joined the
survey in Quarter 2 2005. Employers in the Finance,
Insurance & Real Estate sector expect the most
dynamic second-quarter hiring pace. Similarly, the
Outlook in the Manufacturing sector strengthens for
the fourth consecutive quarter and is now the
strongest forecast reported by employers since the
survey started.
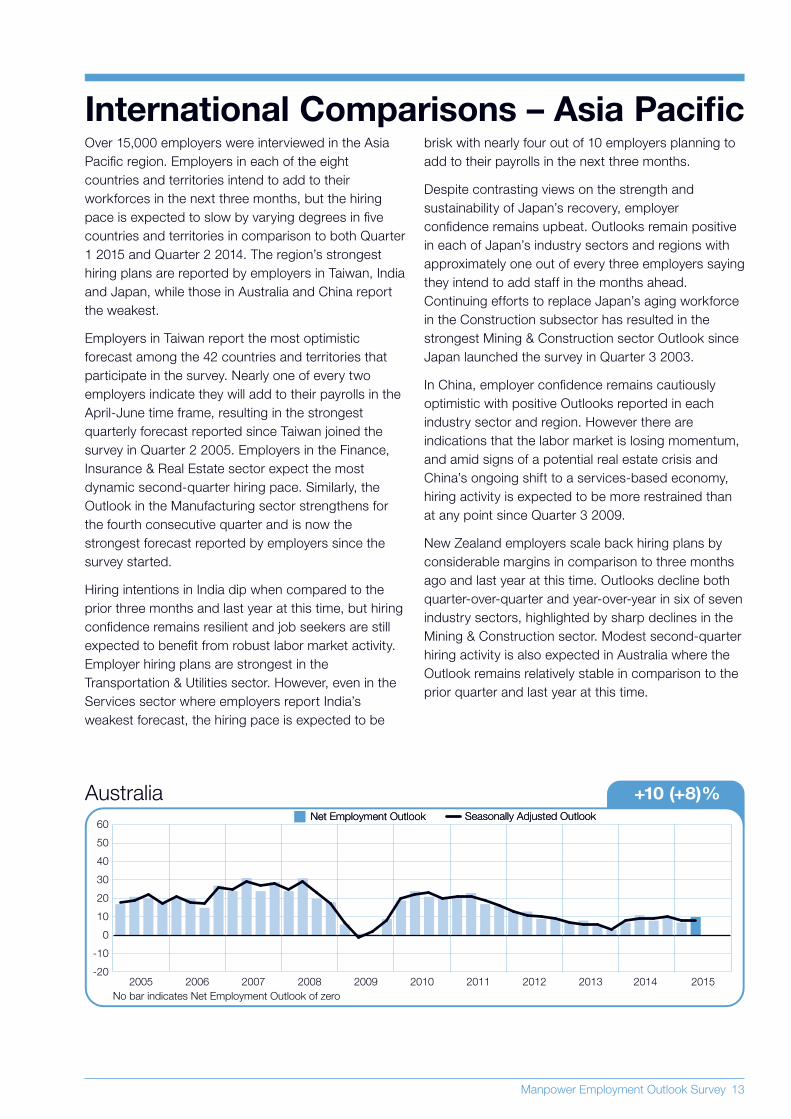
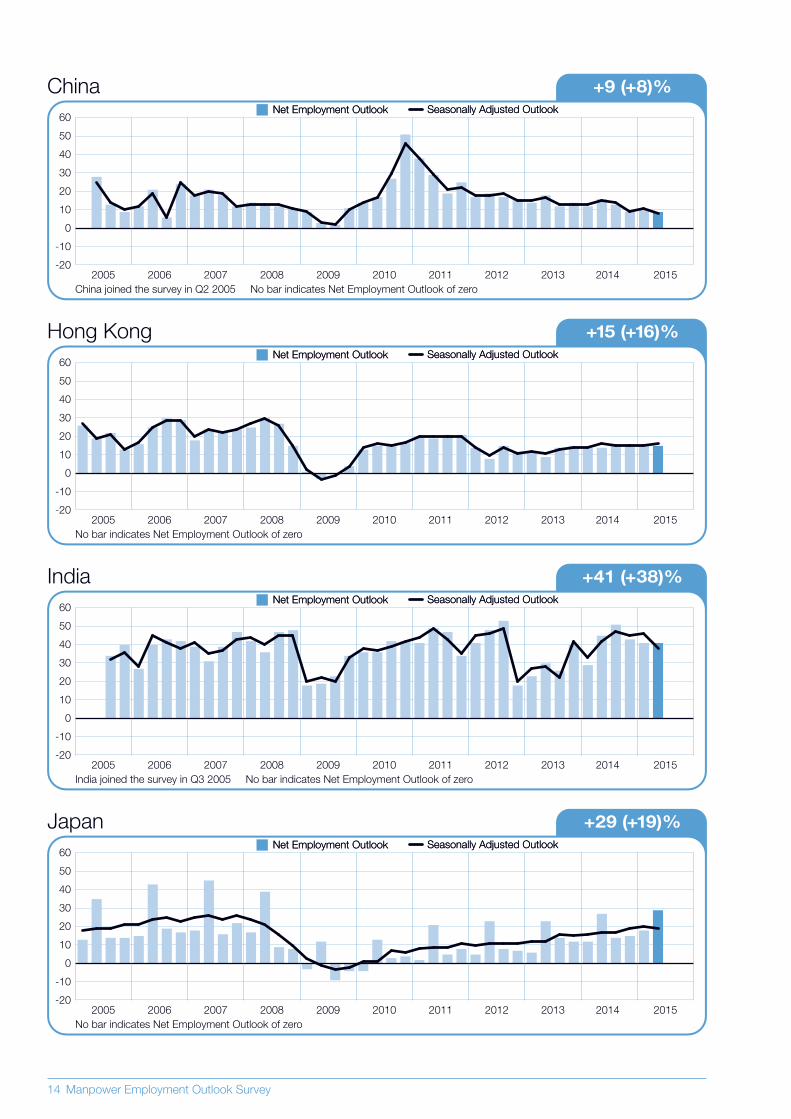
Hiring intentions in India dip when compared to the
prior three months and last year at this time, but hiring
confi dence remains resilient and job seekers are still
expected to benefi t from robust labor market activity.
Employer hiring plans are strongest in the
Transportation & Utilities sector. However, even in the
Services sector where employers report India’s
weakest forecast, the hiring pace is expected to be
International Comparisons – Asia Pacifi cbrisk with nearly four out of 10 employers planning to
add to their payrolls in the next three months.
Despite contrasting views on the strength and
sustainability of Japan’s recovery, employer
confi dence remains upbeat. Outlooks remain positive
in each of Japan’s industry sectors and regions with
approximately one out of every three employers saying
they intend to add staff in the months ahead.
Continuing efforts to replace Japan’s aging workforce
in the Construction subsector has resulted in the
strongest Mining & Construction sector Outlook since
Japan launched the survey in Quarter 3 2003.
In China, employer confi dence remains cautiously
optimistic with positive Outlooks reported in each
industry sector and region. However there are
indications that the labor market is losing momentum,
and amid signs of a potential real estate crisis and
China’s ongoing shift to a services-based economy,
hiring activity is expected to be more restrained than
at any point since Quarter 3 2009.
New Zealand employers scale back hiring plans by
considerable margins in comparison to three months
ago and last year at this time. Outlooks decline both
quarter-over-quarter and year-over-year in six of seven
industry sectors, highlighted by sharp declines in the
Mining & Construction sector. Modest second-quarter
hiring activity is also expected in Australia where the
Outlook remains relatively stable in comparison to the
prior quarter and last year at this time.
Australia +10 (+8)%
Seasonally Adjusted OutlookSeasonally Adjusted OutlookNet Employment OutlookNet Employment Outlook
No bar indicates Net Employment Outlook of zero
20062005 2007 2008 2009 2010 2011 2012 2013 2014 2015-20
-10
0
10
20
30
40
50
60
14 Manpower Employment Outlook Survey
+9 (+8)%China Seasonally Adjusted OutlookSeasonally Adjusted OutlookNet Employment OutlookNet Employment Outlook
China joined the survey in Q2 2005 No bar indicates Net Employment Outlook of zero
20062005 2007 2008 2009 2010 2011 2012 2013 2014 2015-20
-10
0
10
20
30
40
50
60
Hong Kong +15 (+16)%
Seasonally Adjusted OutlookSeasonally Adjusted OutlookNet Employment OutlookNet Employment Outlook
No bar indicates Net Employment Outlook of zero
20062005 2007 2008 2009 2010 2011 2012 2013 2014 2015-20
-10
0
10
20
30
40
50
60
+41 (+38)%India Seasonally Adjusted OutlookSeasonally Adjusted OutlookNet Employment OutlookNet Employment Outlook
India joined the survey in Q3 2005 No bar indicates Net Employment Outlook of zero
20062005 2007 2008 2009 2010 2011 2012 2013 2014 2015-20
-10
0
10
20
30
40
50
60
Japan +29 (+19)%
Seasonally Adjusted OutlookSeasonally Adjusted OutlookNet Employment OutlookNet Employment Outlook
No bar indicates Net Employment Outlook of zero
20062005 2007 2008 2009 2010 2011 2012 2013 2014 2015-20
-10
0
10
20
30
40
50
60
Manpower Employment Outlook Survey 15
New Zealand +19 (+17)%
Seasonally Adjusted OutlookSeasonally Adjusted OutlookNet Employment OutlookNet Employment Outlook
No bar indicates Net Employment Outlook of zero
20062005 2007 2008 2009 2010 2011 2012 2013 2014 2015-20
-10
0
10
20
30
40
50
60
Singapore +14 (+14)%
Seasonally Adjusted OutlookSeasonally Adjusted OutlookNet Employment OutlookNet Employment Outlook
No bar indicates Net Employment Outlook of zero
20062005 2007 2008 2009 2010 2011 2012 2013 2014 2015-50
-40
-30
-20
-10
0
10
20
30
40
50
60
70
Taiwan +46 (+45)%
Seasonally Adjusted OutlookSeasonally Adjusted OutlookNet Employment OutlookNet Employment Outlook
Taiwan joined the survey in Q2 2005 No bar indicates Net Employment Outlook of zero
20062005 2007 2008 2009 2010 2011 2012 2013 2014 2015-20
-10
0
10
20
30
40
50
60
16 Manpower Employment Outlook Survey
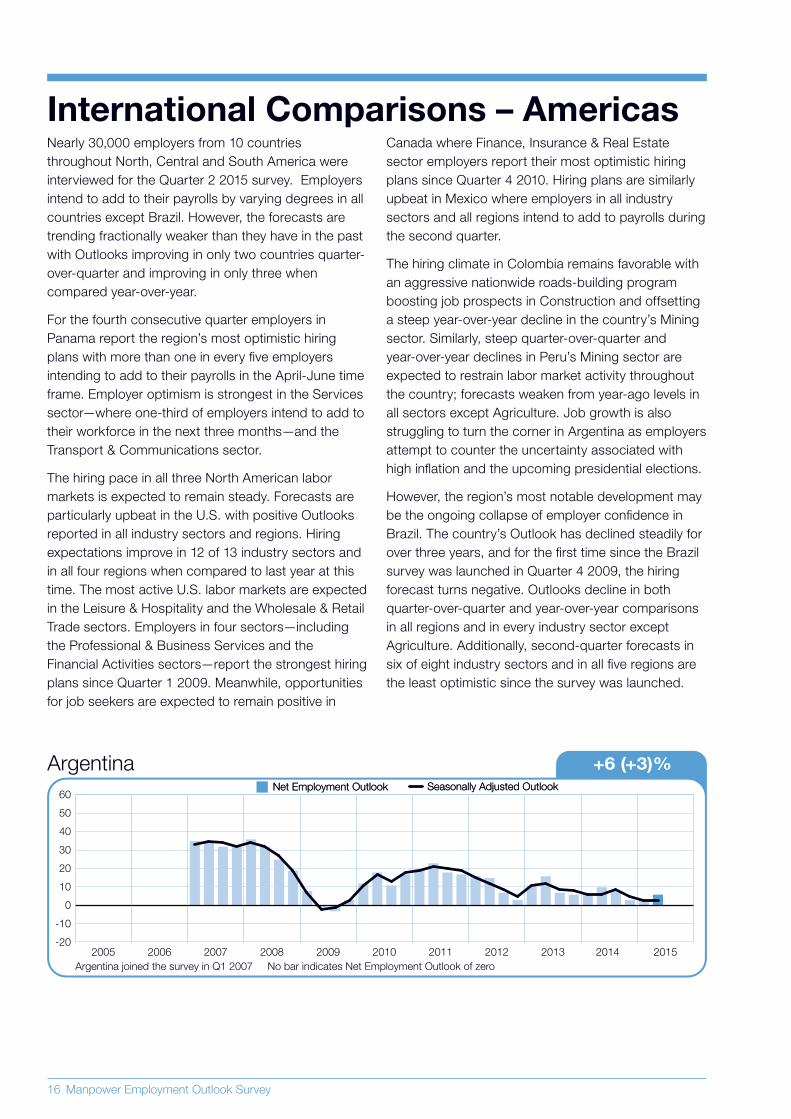
Nearly 30,000 employers from 10 countries
throughout North, Central and South America were
interviewed for the Quarter 2 2015 survey. Employers
intend to add to their payrolls by varying degrees in all
countries except Brazil. However, the forecasts are
trending fractionally weaker than they have in the past
with Outlooks improving in only two countries quarter-
over-quarter and improving in only three when
compared year-over-year.
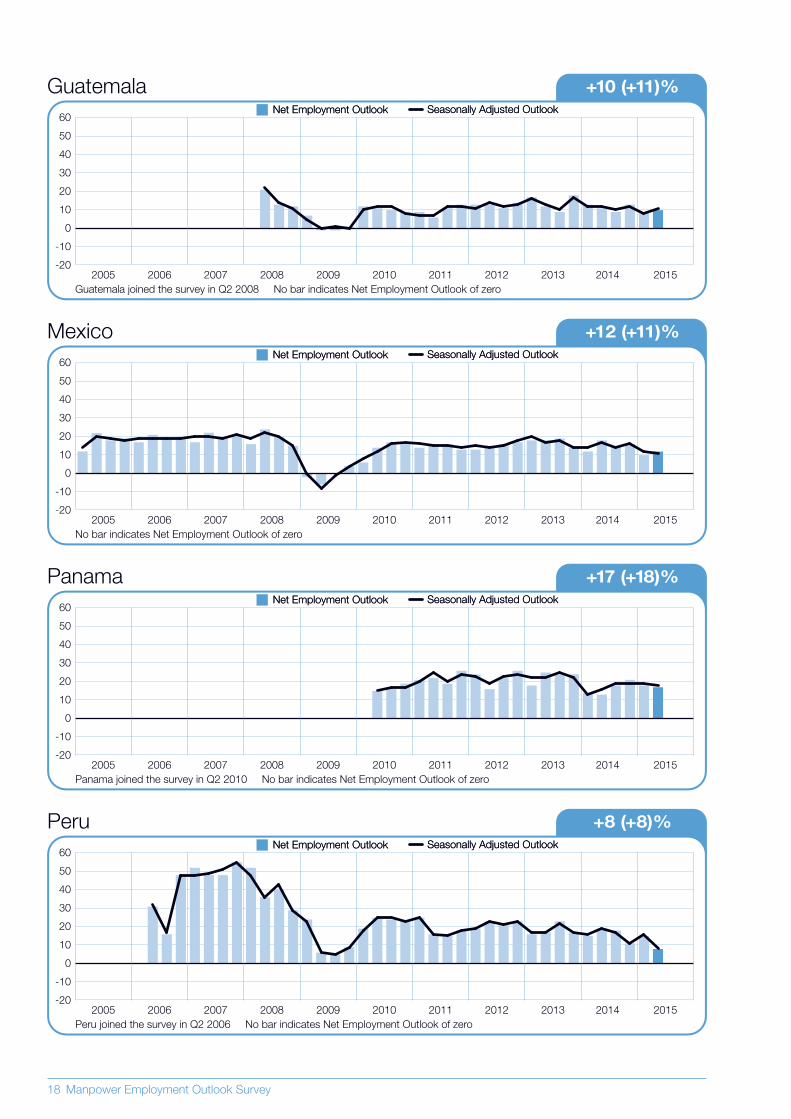
For the fourth consecutive quarter employers in
Panama report the region’s most optimistic hiring
plans with more than one in every fi ve employers
intending to add to their payrolls in the April-June time
frame. Employer optimism is strongest in the Services
sector—where one-third of employers intend to add to
their workforce in the next three months—and the
Transport & Communications sector.
The hiring pace in all three North American labor
markets is expected to remain steady. Forecasts are
particularly upbeat in the U.S. with positive Outlooks
reported in all industry sectors and regions. Hiring
expectations improve in 12 of 13 industry sectors and
in all four regions when compared to last year at this
time. The most active U.S. labor markets are expected
in the Leisure & Hospitality and the Wholesale & Retail
Trade sectors. Employers in four sectors—including
the Professional & Business Services and the
Financial Activities sectors—report the strongest hiring
plans since Quarter 1 2009. Meanwhile, opportunities
for job seekers are expected to remain positive in
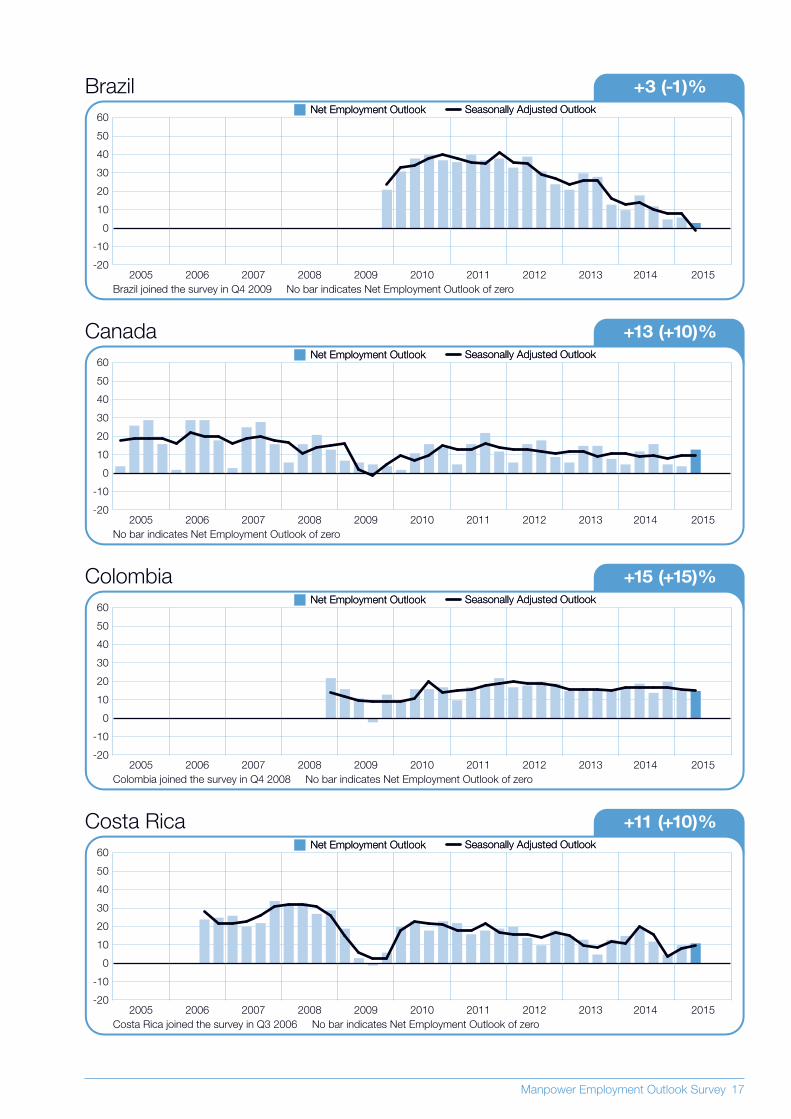
International Comparisons – AmericasCanada where Finance, Insurance & Real Estate
sector employers report their most optimistic hiring
plans since Quarter 4 2010. Hiring plans are similarly
upbeat in Mexico where employers in all industry
sectors and all regions intend to add to payrolls during
the second quarter.
The hiring climate in Colombia remains favorable with
an aggressive nationwide roads-building program
boosting job prospects in Construction and offsetting
a steep year-over-year decline in the country’s Mining
sector. Similarly, steep quarter-over-quarter and
year-over-year declines in Peru’s Mining sector are
expected to restrain labor market activity throughout
the country; forecasts weaken from year-ago levels in
all sectors except Agriculture. Job growth is also
struggling to turn the corner in Argentina as employers
attempt to counter the uncertainty associated with
high infl ation and the upcoming presidential elections.
However, the region’s most notable development may
be the ongoing collapse of employer confi dence in
Brazil. The country’s Outlook has declined steadily for
over three years, and for the fi rst time since the Brazil
survey was launched in Quarter 4 2009, the hiring
forecast turns negative. Outlooks decline in both
quarter-over-quarter and year-over-year comparisons
in all regions and in every industry sector except
Agriculture. Additionally, second-quarter forecasts in
six of eight industry sectors and in all fi ve regions are
the least optimistic since the survey was launched.
Argentina +6 (+3)%
Seasonally Adjusted OutlookSeasonally Adjusted OutlookNet Employment OutlookNet Employment Outlook
Argentina joined the survey in Q1 2007 No bar indicates Net Employment Outlook of zero
20062005 2007 2008 2009 2010 2011 2012 2013 2014 2015-20
-10
0
10
20
30
40
50
60
Manpower Employment Outlook Survey 17
Brazil +3 (-1)%
Seasonally Adjusted OutlookSeasonally Adjusted OutlookNet Employment OutlookNet Employment Outlook
Brazil joined the survey in Q4 2009 No bar indicates Net Employment Outlook of zero
20062005 2007 2008 2009 2010 2011 2012 2013 2014 2015-20
-10
0
10
20
30
40
50
60
Canada +13 (+10)%
Seasonally Adjusted OutlookSeasonally Adjusted OutlookNet Employment OutlookNet Employment Outlook
No bar indicates Net Employment Outlook of zero
20062005 2007 2008 2009 2010 2011 2012 2013 2014 2015-20
-10
0
10
20
30
40
50
60
Colombia +15 (+15)%
Seasonally Adjusted OutlookSeasonally Adjusted OutlookNet Employment OutlookNet Employment Outlook
Colombia joined the survey in Q4 2008 No bar indicates Net Employment Outlook of zero
20062005 2007 2008 2009 2010 2011 2012 2013 2014 2015-20
-10
0
10
20
30
40
50
60
Costa Rica +11 (+10)%
Seasonally Adjusted OutlookSeasonally Adjusted OutlookNet Employment OutlookNet Employment Outlook
Costa Rica joined the survey in Q3 2006 No bar indicates Net Employment Outlook of zero
20062005 2007 2008 2009 2010 2011 2012 2013 2014 2015-20
-10
0
10
20
30
40
50
60
18 Manpower Employment Outlook Survey
Guatemala +10 (+11)%
Seasonally Adjusted OutlookSeasonally Adjusted OutlookNet Employment OutlookNet Employment Outlook
Guatemala joined the survey in Q2 2008 No bar indicates Net Employment Outlook of zero
20062005 2007 2008 2009 2010 2011 2012 2013 2014 2015-20
-10
0
10
20
30
40
50
60
Mexico +12 (+11)%
Seasonally Adjusted OutlookSeasonally Adjusted OutlookNet Employment OutlookNet Employment Outlook
No bar indicates Net Employment Outlook of zero
20062005 2007 2008 2009 2010 2011 2012 2013 2014 2015-20
-10
0
10
20
30
40
50
60
Panama +17 (+18)%
Seasonally Adjusted OutlookSeasonally Adjusted OutlookNet Employment OutlookNet Employment Outlook
Panama joined the survey in Q2 2010 No bar indicates Net Employment Outlook of zero
20062005 2007 2008 2009 2010 2011 2012 2013 2014 2015-20
-10
0
10
20
30
40
50
60
Peru +8 (+8)%
Seasonally Adjusted OutlookSeasonally Adjusted OutlookNet Employment OutlookNet Employment Outlook
Peru joined the survey in Q2 2006 No bar indicates Net Employment Outlook of zero
20062005 2007 2008 2009 2010 2011 2012 2013 2014 2015-20
-10
0
10
20
30
40
50
60
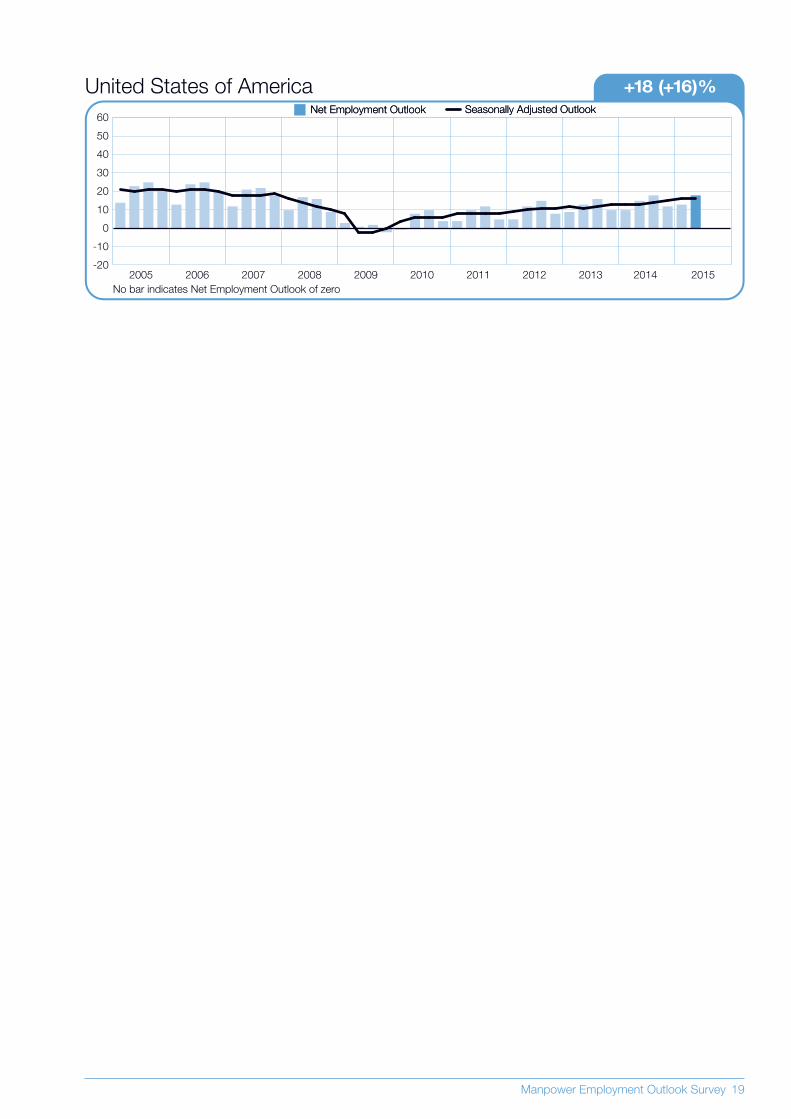
Manpower Employment Outlook Survey 19
+18 (+16)%United States of AmericaSeasonally Adjusted OutlookSeasonally Adjusted OutlookNet Employment OutlookNet Employment Outlook
No bar indicates Net Employment Outlook of zero
20062005 2007 2008 2009 2010 2011 2012 2013 2014 2015-20
-10
0
10
20
30
40
50
60
20 Manpower Employment Outlook Survey
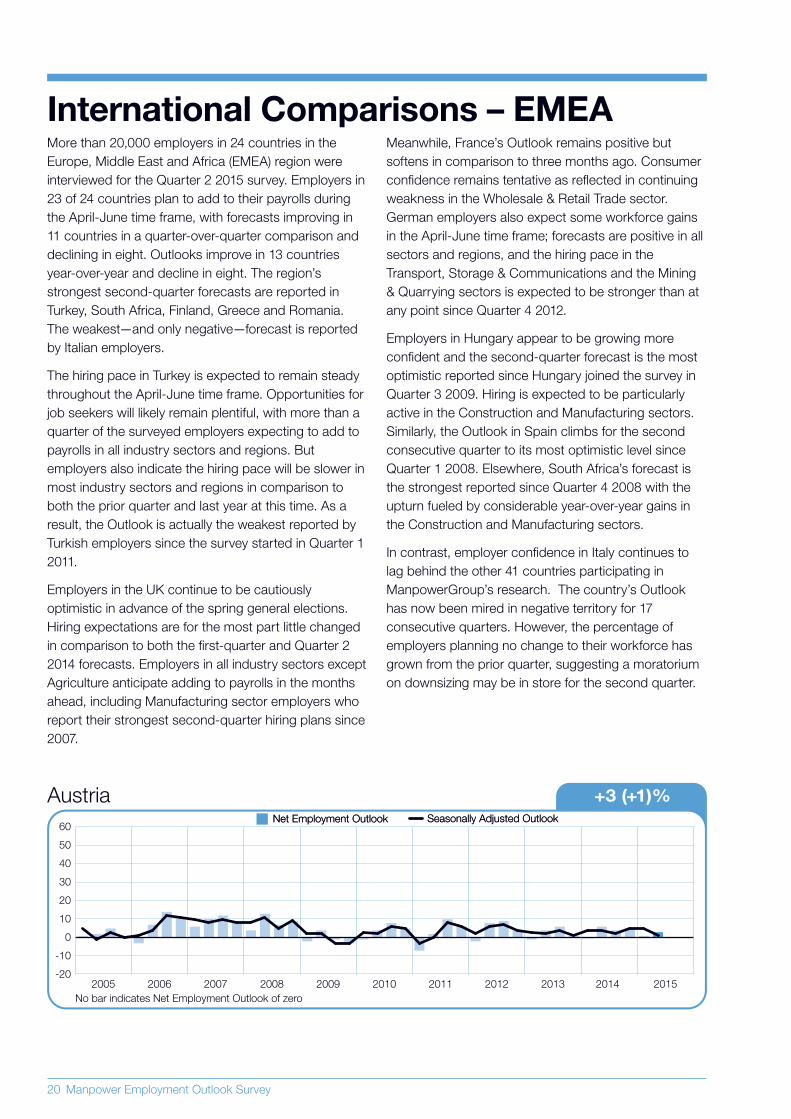
More than 20,000 employers in 24 countries in the
Europe, Middle East and Africa (EMEA) region were
interviewed for the Quarter 2 2015 survey. Employers in
23 of 24 countries plan to add to their payrolls during
the April-June time frame, with forecasts improving in
11 countries in a quarter-over-quarter comparison and
declining in eight. Outlooks improve in 13 countries
year-over-year and decline in eight. The region’s
strongest second-quarter forecasts are reported in
Turkey, South Africa, Finland, Greece and Romania.
The weakest—and only negative—forecast is reported
by Italian employers.
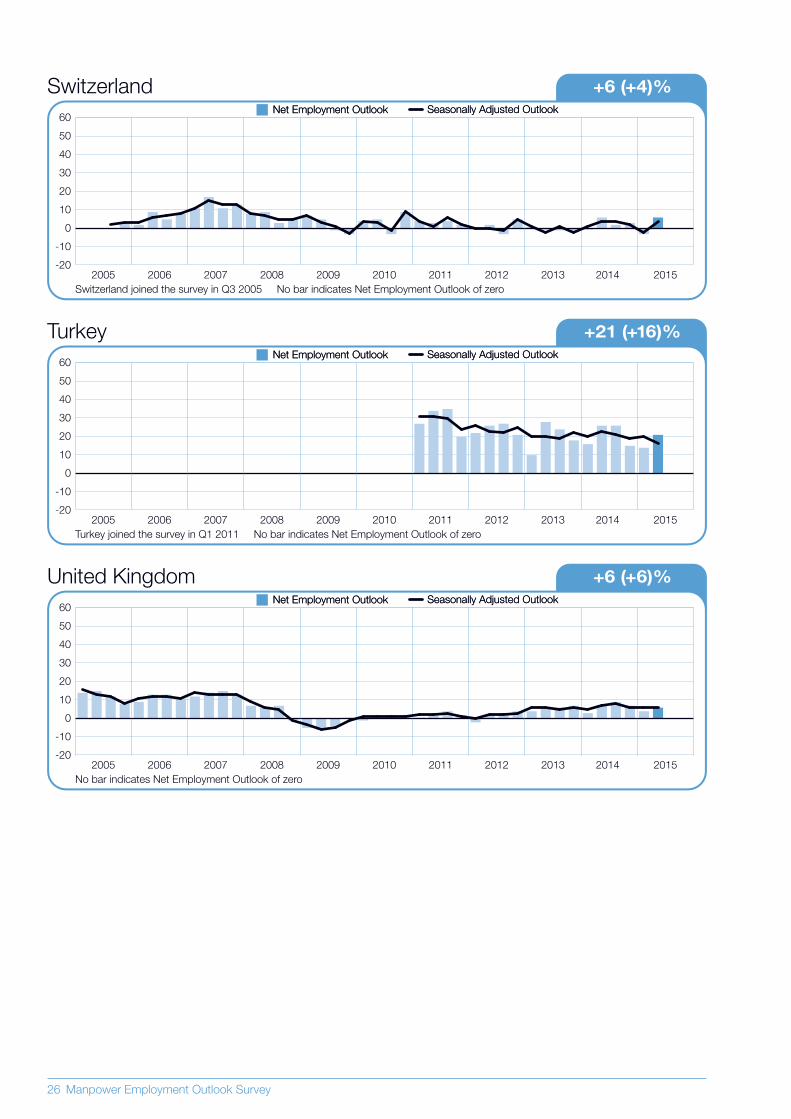
The hiring pace in Turkey is expected to remain steady
throughout the April-June time frame. Opportunities for
job seekers will likely remain plentiful, with more than a
quarter of the surveyed employers expecting to add to
payrolls in all industry sectors and regions. But
employers also indicate the hiring pace will be slower in
most industry sectors and regions in comparison to
both the prior quarter and last year at this time. As a
result, the Outlook is actually the weakest reported by
Turkish employers since the survey started in Quarter 1
2011.
Employers in the UK continue to be cautiously
optimistic in advance of the spring general elections.
Hiring expectations are for the most part little changed
in comparison to both the fi rst-quarter and Quarter 2
2014 forecasts. Employers in all industry sectors except
Agriculture anticipate adding to payrolls in the months
ahead, including Manufacturing sector employers who
report their strongest second-quarter hiring plans since
2007.
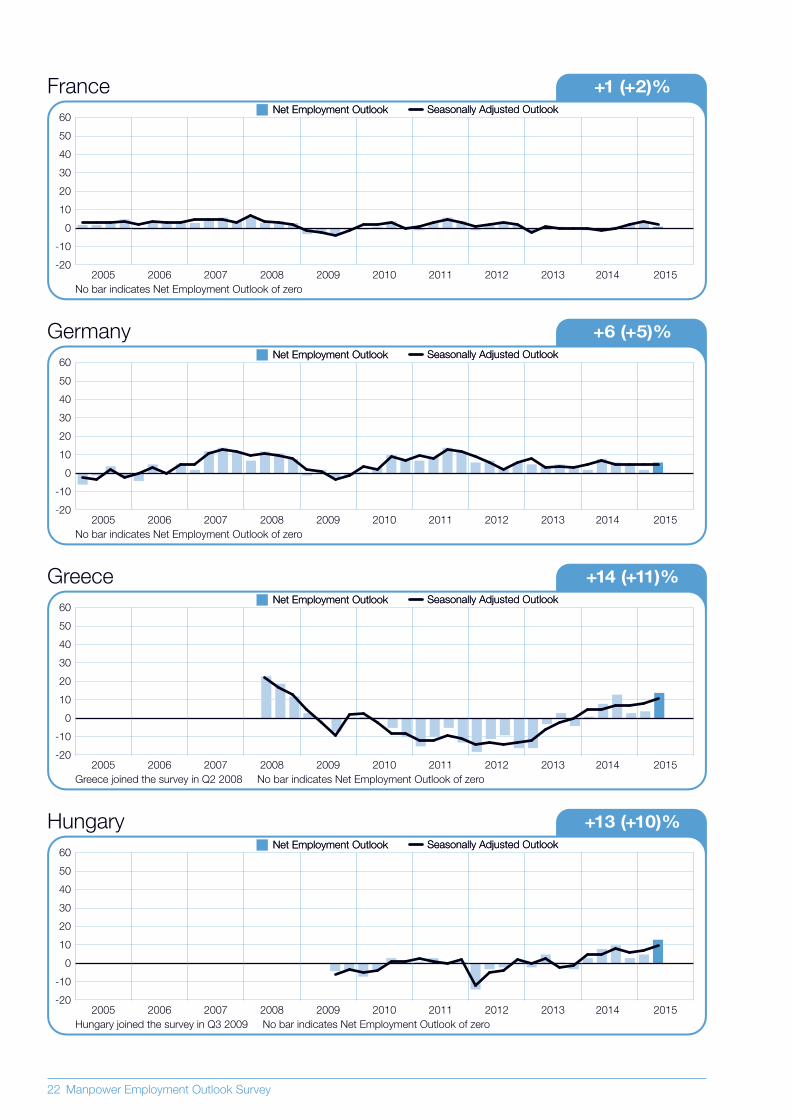
International Comparisons – EMEAMeanwhile, France’s Outlook remains positive but
softens in comparison to three months ago. Consumer
confi dence remains tentative as refl ected in continuing
weakness in the Wholesale & Retail Trade sector.
German employers also expect some workforce gains
in the April-June time frame; forecasts are positive in all
sectors and regions, and the hiring pace in the
Transport, Storage & Communications and the Mining
& Quarrying sectors is expected to be stronger than at
any point since Quarter 4 2012.
Employers in Hungary appear to be growing more
confi dent and the second-quarter forecast is the most
optimistic reported since Hungary joined the survey in
Quarter 3 2009. Hiring is expected to be particularly
active in the Construction and Manufacturing sectors.
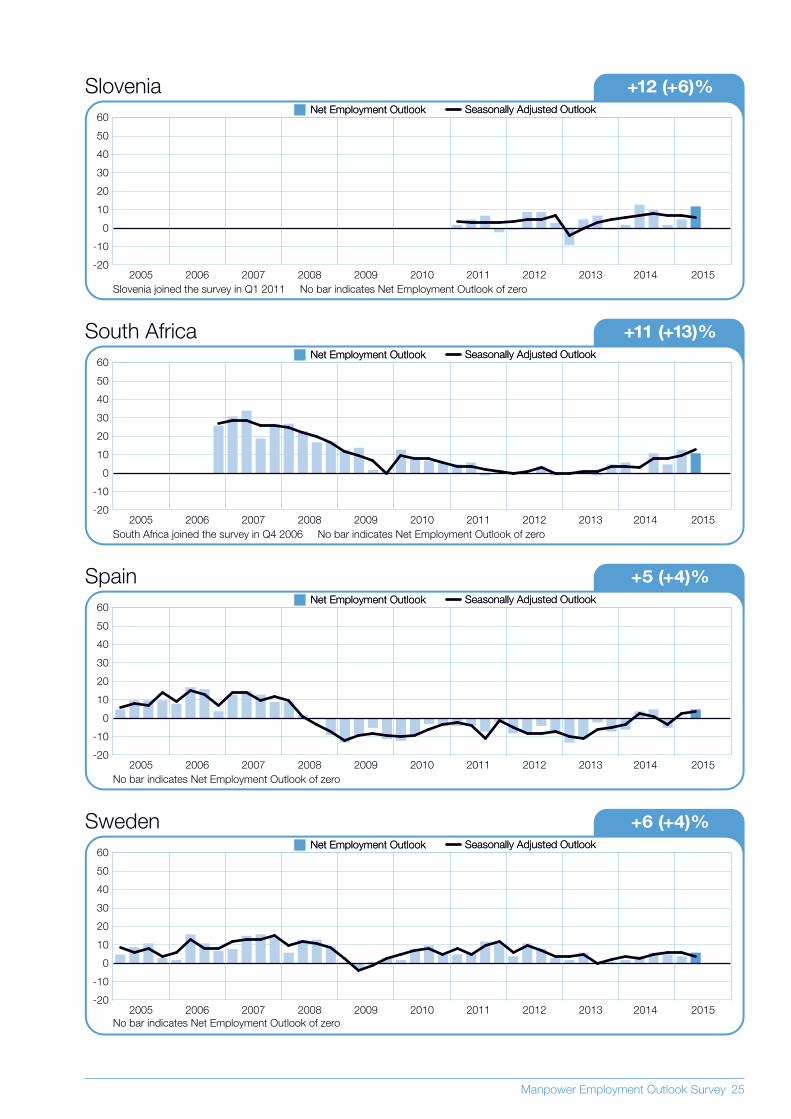
Similarly, the Outlook in Spain climbs for the second
consecutive quarter to its most optimistic level since
Quarter 1 2008. Elsewhere, South Africa’s forecast is
the strongest reported since Quarter 4 2008 with the
upturn fueled by considerable year-over-year gains in
the Construction and Manufacturing sectors.
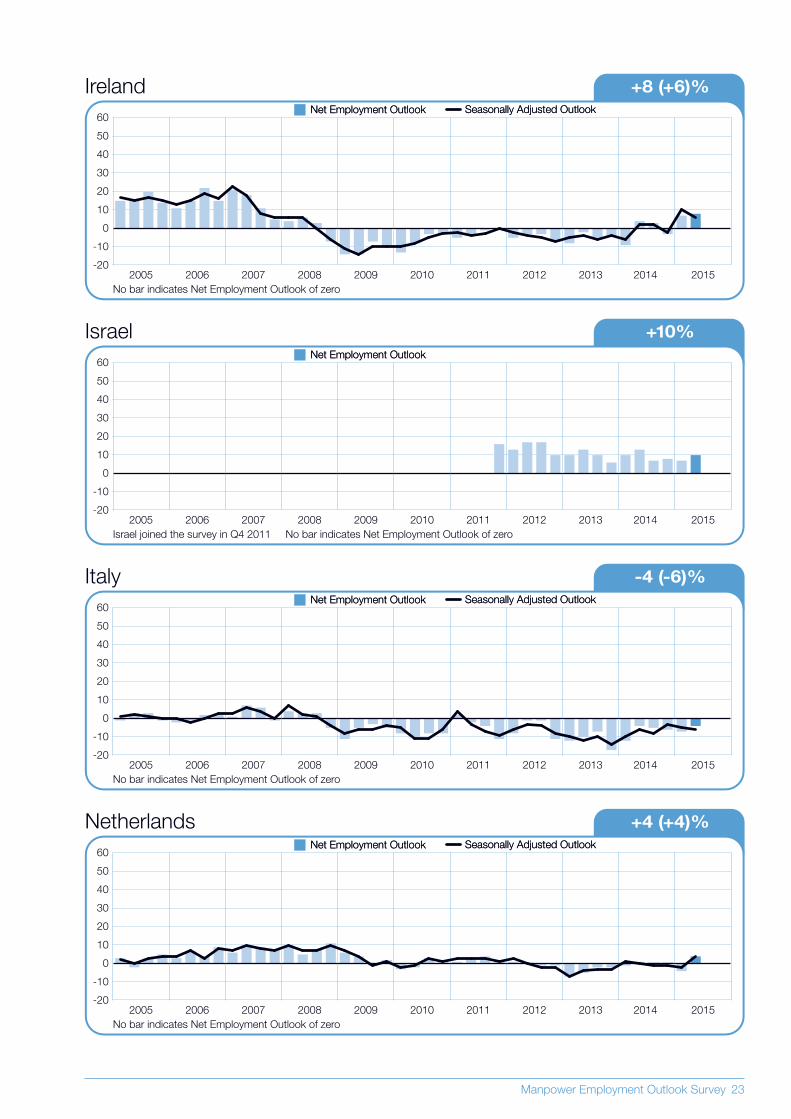
In contrast, employer confi dence in Italy continues to
lag behind the other 41 countries participating in
ManpowerGroup’s research. The country’s Outlook
has now been mired in negative territory for 17
consecutive quarters. However, the percentage of
employers planning no change to their workforce has
grown from the prior quarter, suggesting a moratorium
on downsizing may be in store for the second quarter.
Austria +3 (+1)%
Seasonally Adjusted OutlookSeasonally Adjusted OutlookNet Employment OutlookNet Employment Outlook
No bar indicates Net Employment Outlook of zero
20062005 2007 2008 2009 2010 2011 2012 2013 2014 2015-20
-10
0
10
20
30
40
50
60
Manpower Employment Outlook Survey 21
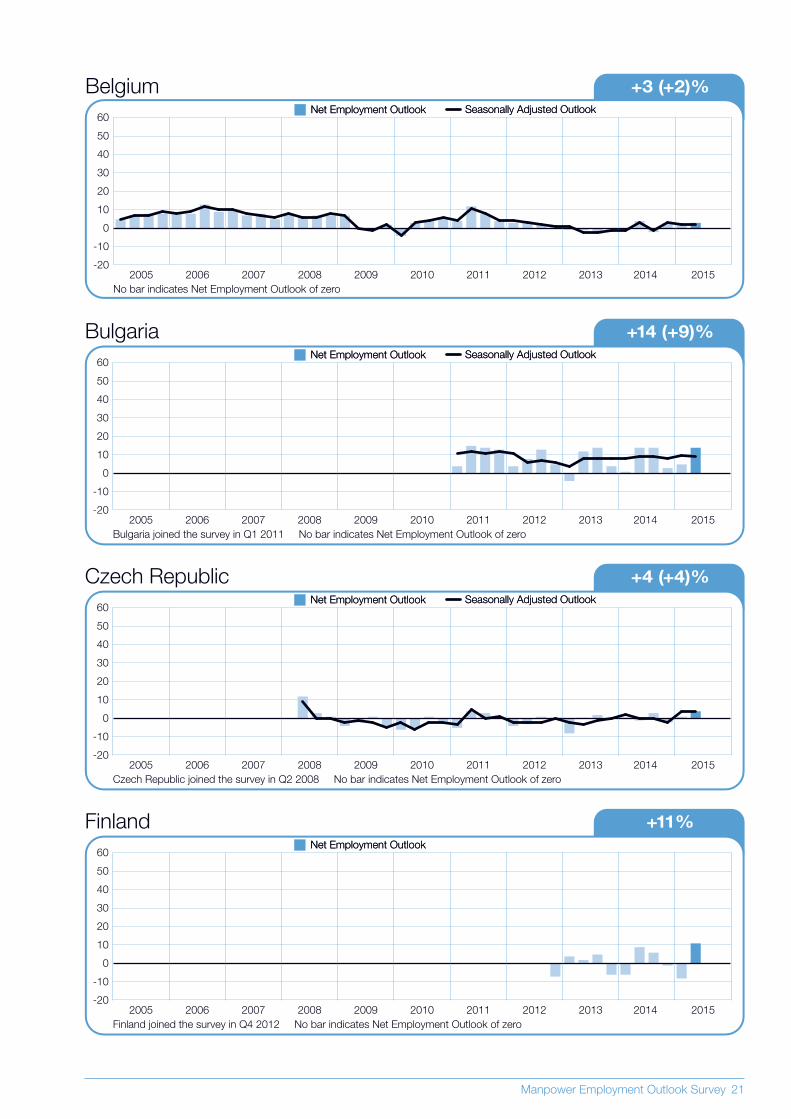
Belgium +3 (+2)%
Seasonally Adjusted OutlookSeasonally Adjusted OutlookNet Employment OutlookNet Employment Outlook
No bar indicates Net Employment Outlook of zero
20062005 2007 2008 2009 2010 2011 2012 2013 2014 2015-20
-10
0
10
20
30
40
50
60
Bulgaria +14 (+9)%
Bulgaria joined the survey in Q1 2011 No bar indicates Net Employment Outlook of zero
20062005 2007 2008 2009 2010 2011 2012 2013 2014 2015
Seasonally Adjusted OutlookSeasonally Adjusted OutlookNet Employment OutlookNet Employment Outlook
-20
-10
0
10
20
30
40
50
60
Czech Republic +4 (+4)%
Seasonally Adjusted OutlookSeasonally Adjusted OutlookNet Employment OutlookNet Employment Outlook
Czech Republic joined the survey in Q2 2008 No bar indicates Net Employment Outlook of zero
20062005 2007 2008 2009 2010 2011 2012 2013 2014 2015-20
-10
0
10
20
30
40
50
60
Finland +11%
Net Employment OutlookNet Employment Outlook
Finland joined the survey in Q4 2012 No bar indicates Net Employment Outlook of zero
20062005 2007 2008 2009 2010 2011 2012 2013 2014 2015-20
-10
0
10
20
30
40
50
60
22 Manpower Employment Outlook Survey
France +1 (+2)%
Seasonally Adjusted OutlookSeasonally Adjusted OutlookNet Employment OutlookNet Employment Outlook
No bar indicates Net Employment Outlook of zero
20062005 2007 2008 2009 2010 2011 2012 2013 2014 2015-20
-10
0
10
20
30
40
50
60
Germany +6 (+5)%
Seasonally Adjusted OutlookSeasonally Adjusted OutlookNet Employment OutlookNet Employment Outlook
No bar indicates Net Employment Outlook of zero
20062005 2007 2008 2009 2010 2011 2012 2013 2014 2015-20
-10
0
10
20
30
40
50
60
Greece +14 (+11)%
Seasonally Adjusted OutlookSeasonally Adjusted OutlookNet Employment OutlookNet Employment Outlook
Greece joined the survey in Q2 2008 No bar indicates Net Employment Outlook of zero
20062005 2007 2008 2009 2010 2011 2012 2013 2014 2015-20
-10
0
10
20
30
40
50
60
Hungary +13 (+10)%
Seasonally Adjusted OutlookSeasonally Adjusted OutlookNet Employment OutlookNet Employment Outlook
Hungary joined the survey in Q3 2009 No bar indicates Net Employment Outlook of zero
20062005 2007 2008 2009 2010 2011 2012 2013 2014 2015-20
-10
0
10
20
30
40
50
60
Manpower Employment Outlook Survey 23
Ireland +8 (+6)%
Seasonally Adjusted OutlookSeasonally Adjusted OutlookNet Employment OutlookNet Employment Outlook
No bar indicates Net Employment Outlook of zero
20062005 2007 2008 2009 2010 2011 2012 2013 2014 2015-20
-10
0
10
20
30
40
50
60
Israel +10%
Net Employment OutlookNet Employment Outlook
Israel joined the survey in Q4 2011 No bar indicates Net Employment Outlook of zero
20062005 2007 2008 2009 2010 2011 2012 2013 2014 2015-20
-10
0
10
20
30
40
50
60
Italy -4 (-6)%
Seasonally Adjusted OutlookSeasonally Adjusted OutlookNet Employment OutlookNet Employment Outlook
No bar indicates Net Employment Outlook of zero
20062005 2007 2008 2009 2010 2011 2012 2013 2014 2015-20
-10
0
10
20
30
40
50
60
Netherlands +4 (+4)%
Seasonally Adjusted OutlookSeasonally Adjusted OutlookNet Employment OutlookNet Employment Outlook
No bar indicates Net Employment Outlook of zero
20062005 2007 2008 2009 2010 2011 2012 2013 2014 2015-20
-10
0
10
20
30
40
50
60
24 Manpower Employment Outlook Survey
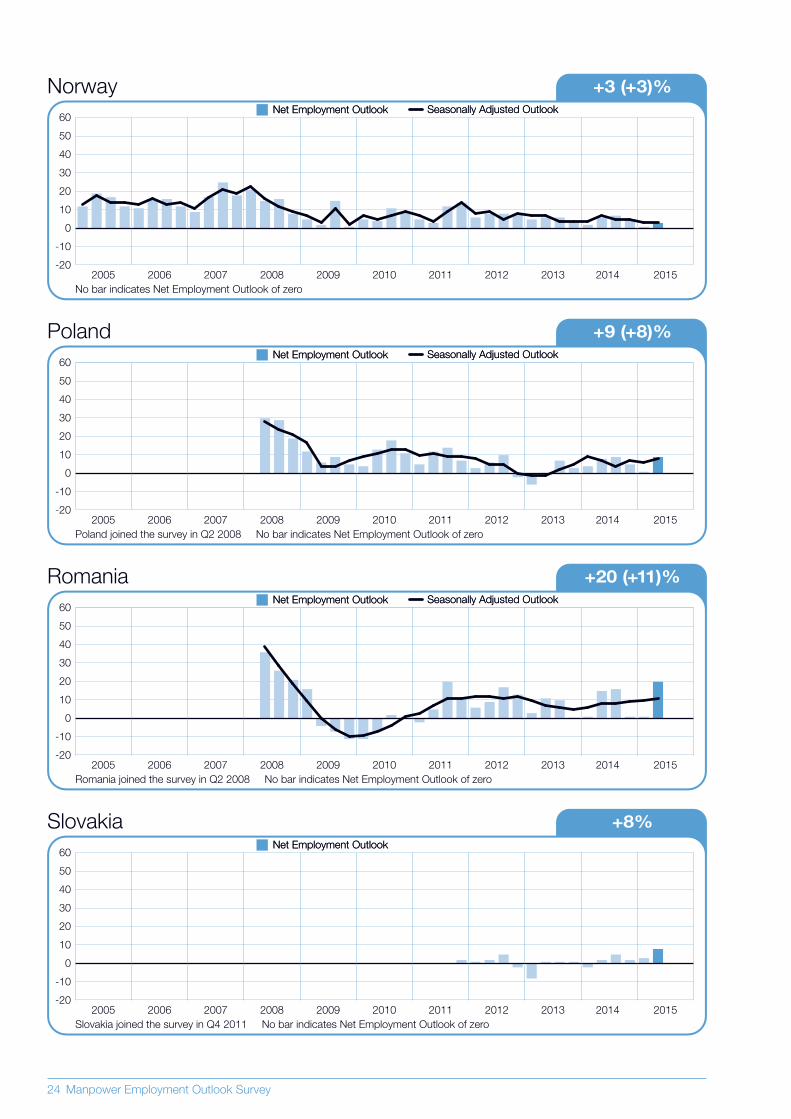
Norway +3 (+3)%
Seasonally Adjusted OutlookSeasonally Adjusted OutlookNet Employment OutlookNet Employment Outlook
No bar indicates Net Employment Outlook of zero
20062005 2007 2008 2009 2010 2011 2012 2013 2014 2015-20
-10
0
10
20
30
40
50
60
Poland +9 (+8)%
Seasonally Adjusted OutlookSeasonally Adjusted OutlookNet Employment OutlookNet Employment Outlook
Poland joined the survey in Q2 2008 No bar indicates Net Employment Outlook of zero
20062005 2007 2008 2009 2010 2011 2012 2013 2014 2015-20
-10
0
10
20
30
40
50
60
Romania +20 (+11)%
Seasonally Adjusted OutlookSeasonally Adjusted OutlookNet Employment OutlookNet Employment Outlook
Romania joined the survey in Q2 2008 No bar indicates Net Employment Outlook of zero
20062005 2007 2008 2009 2010 2011 2012 2013 2014 2015-20
-10
0
10
20
30
40
50
60
Slovakia +8%
Net Employment OutlookNet Employment Outlook
Slovakia joined the survey in Q4 2011 No bar indicates Net Employment Outlook of zero
20062005 2007 2008 2009 2010 2011 2012 2013 2014 2015-20
-10
0
10
20
30
40
50
60
Manpower Employment Outlook Survey 25
Slovenia +12 (+6)%
Slovenia joined the survey in Q1 2011 No bar indicates Net Employment Outlook of zero
20062005 2007 2008 2009 2010 2011 2012 2013 2014 2015
Seasonally Adjusted OutlookSeasonally Adjusted OutlookNet Employment OutlookNet Employment Outlook
-20
-10
0
10
20
30
40
50
60
South Africa +11 (+13)%
Seasonally Adjusted OutlookSeasonally Adjusted OutlookNet Employment OutlookNet Employment Outlook
South Africa joined the survey in Q4 2006 No bar indicates Net Employment Outlook of zero
20062005 2007 2008 2009 2010 2011 2012 2013 2014 2015-20
-10
0
10
20
30
40
50
60
Spain +5 (+4)%
Seasonally Adjusted OutlookSeasonally Adjusted OutlookNet Employment OutlookNet Employment Outlook
No bar indicates Net Employment Outlook of zero
20062005 2007 2008 2009 2010 2011 2012 2013 2014 2015-20
-10
0
10
20
30
40
50
60
Sweden +6 (+4)%
Seasonally Adjusted OutlookSeasonally Adjusted OutlookNet Employment OutlookNet Employment Outlook
No bar indicates Net Employment Outlook of zero
20062005 2007 2008 2009 2010 2011 2012 2013 2014 2015-20
-10
0
10
20
30
40
50
60
26 Manpower Employment Outlook Survey
Switzerland +6 (+4)%
Seasonally Adjusted OutlookSeasonally Adjusted OutlookNet Employment OutlookNet Employment Outlook
Switzerland joined the survey in Q3 2005 No bar indicates Net Employment Outlook of zero
20062005 2007 2008 2009 2010 2011 2012 2013 2014 2015-20
-10
0
10
20
30
40
50
60
Turkey +21 (+16)%
Turkey joined the survey in Q1 2011 No bar indicates Net Employment Outlook of zero
20062005 2007 2008 2009 2010 2011 2012 2013 2014 2015
Seasonally Adjusted OutlookSeasonally Adjusted OutlookNet Employment OutlookNet Employment Outlook
-20
-10
0
10
20
30
40
50
60
United Kingdom +6 (+6)%
Seasonally Adjusted OutlookSeasonally Adjusted OutlookNet Employment OutlookNet Employment Outlook
No bar indicates Net Employment Outlook of zero
20062005 2007 2008 2009 2010 2011 2012 2013 2014 2015-20
-10
0
10
20
30
40
50
60
Manpower Employment Outlook Survey 27
The Manpower Employment Outlook Survey is conducted
quarterly to measure employers’ intentions to increase or
decrease the number of employees in their workforces
during the next quarter. ManpowerGroup’s
comprehensive forecast of employer hiring plans has
been running for more than 50 years and is one of the
most trusted surveys of employment activity in the world.
Various factors underpin the success of the Manpower
Employment Outlook Survey:
Unique: It is unparalleled in its size, scope, longevity
and area of focus.
Projective: The Manpower Employment Outlook Survey
is the most extensive, forward-looking employment
survey in the world, asking employers to forecast
employment over the next quarter. In contrast, other
surveys and studies focus on retrospective data to
report on what occurred in the past.
Independent: The survey is conducted with a
representative sample of employers from throughout
the countries and territories in which it is conducted.
The survey participants are not derived from
ManpowerGroup’s customer base.
Robust: The survey is based on interviews with over
65,000 public and private employers across 42
countries and territories to measure anticipated
employment trends each quarter. This sample allows
for analysis to be performed across specifi c sectors
and regions to provide more detailed information.
Focused: For more than fi ve decades the survey has
derived all of its information from a single question:
For the 2Q 2015 research, all employers participating
in the survey worldwide are asked the same question,
“How do you anticipate total employment at your
location to change in the three months to the end of
June 2015 as compared to the current quarter?”
Methodology
The Manpower Employment Outlook Survey is
conducted using a validated methodology, in
accordance with the highest standards in market
research. The survey has been structured to be
representative of each national economy. The margin
of error for all national, regional and global data is not
greater than +/- 3.9%.
About the SurveyNet Employment OutlookThroughout this report, we use the term “Net
Employment Outlook.” This fi gure is derived by taking
the percentage of employers anticipating an increase
in hiring activity and subtracting from this the
percentage of employers expecting to see a decrease
in employment at their location in the next quarter. The
result of this calculation is the Net Employment
Outlook. Net Employment Outlooks for countries and
territories that have accumulated at least 17 quarters
of data are reported in a seasonally adjusted format
unless otherwise stated.
Seasonal adjustments have been applied to the data
for all participating countries except Finland, Slovakia
and Israel. ManpowerGroup intends to add seasonal
adjustments to the data for other countries in the
future, as more historical data is compiled. Note that
in Quarter 2 2008, ManpowerGroup adopted the
TRAMO-SEATS method of seasonal adjustment for
data.
28 Manpower Employment Outlook Survey
ManpowerGroup™ (NYSE: MAN) has been the world’s
workforce expert for more than 65 years. We source,
assess, develop and manage talent across a wide
range of skills and industries. Our ManpowerGroup
family of brands — Experis™, Manpower®,
ManpowerGroup™ Solutions, and Right
Management® — helps 400,000 clients in 80
countries and territories improve workforce
performance, while connecting more than 600,000
individuals to meaningful work. ManpowerGroup was
named one of the World’s Most Ethical Companies for
the fourth consecutive year in 2014, confi rming our
position as the most trusted brand in the industry.
www.manpowergroup.com.
About ManpowerGroupTM
About ManpowerGroup IndiaManpowerGroup, the world leader in innovative
workforce solutions, has been helping clients and
candidates win in India since 1997. ManpowerGroup
India provides unique value to clients and candidates
through a comprehensive suite of innovative solutions
which cover an entire range of talent-driven needs from
recruitment and assessment, training and development,
and career management, to outsourcing and workforce
consulting. This is the Human Age, where access to
talent has replaced access to capital as the key
competitive differentiator. ManpowerGroup India
creates powerful connections between organizations
and the talent they need to enhance their
competitiveness and unleash their workforce potential.
For more information, visit www.manpowergroup.co.in.

ManpowerGroup Services India Pvt. Ltd.First Floor, Building 10-BDLF Cyber CityGurgaon- 122002Haryana, India Tel: 1800 4194 [email protected]
© 2015, ManpowerGroup. All rights reserved.
Related Documents