Management Plan Part 3 Ajinomoto Group 44 Integrated Report 2021 Dear Stakeholders Our Vision & Strategy Management Plan Our Governance

Welcome message from author
This document is posted to help you gain knowledge. Please leave a comment to let me know what you think about it! Share it to your friends and learn new things together.
Transcript
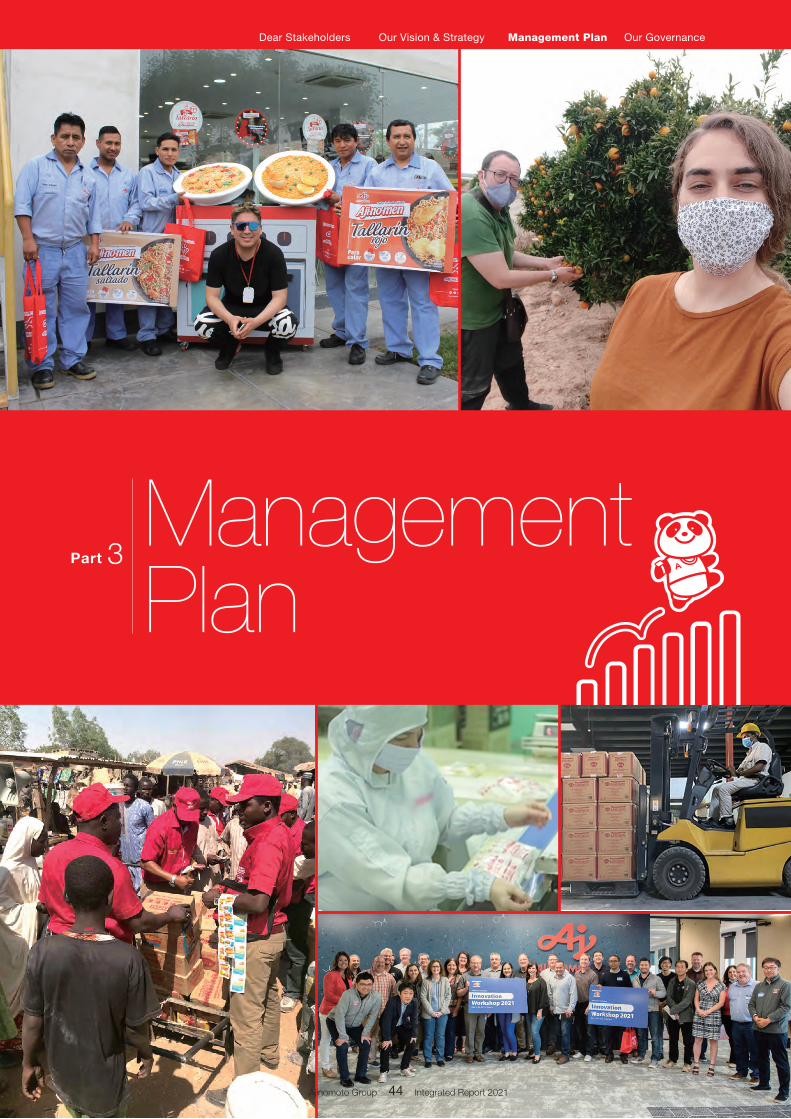
ManagementPlan
Part 3
Ajinomoto Group 44 Integrated Report 2021
Dear Stakeholders Our Vision & Strategy Management Plan Our Governance
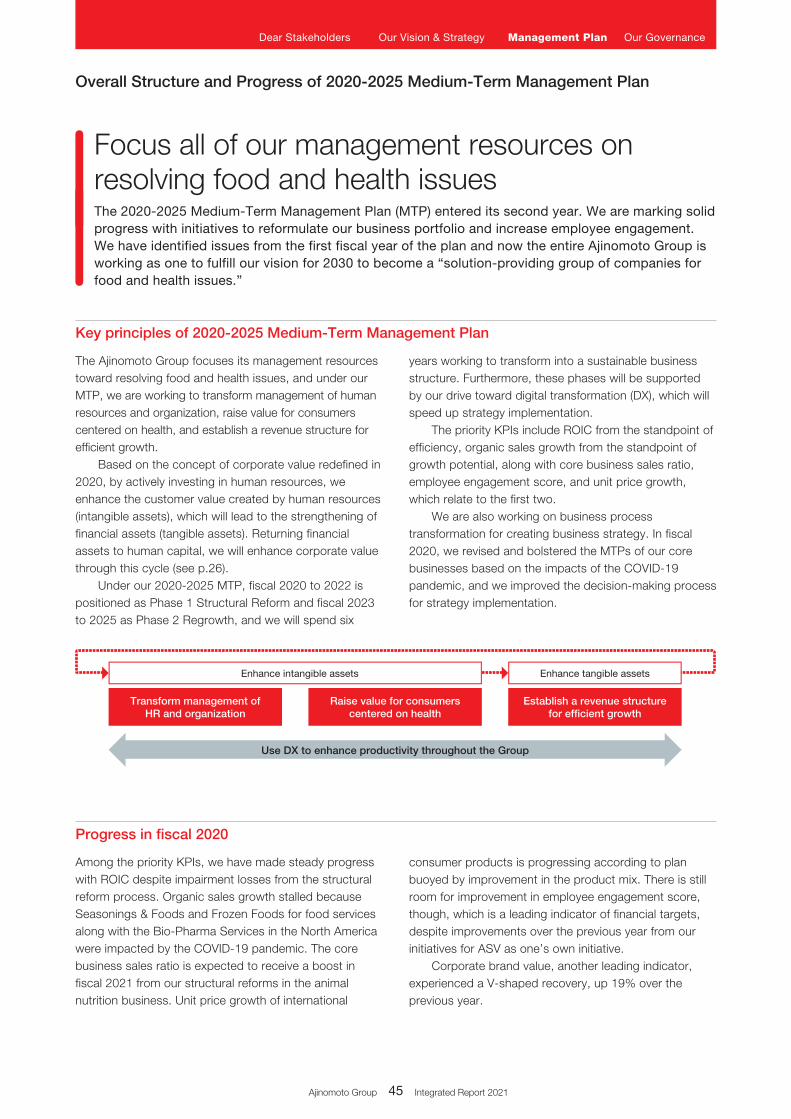
Use DX to enhance productivity throughout the Group
Raise value for consumerscentered on health
Establish a revenue structurefor efficient growth
Transform management ofHR and organization
Enhance intangible assets Enhance tangible assets
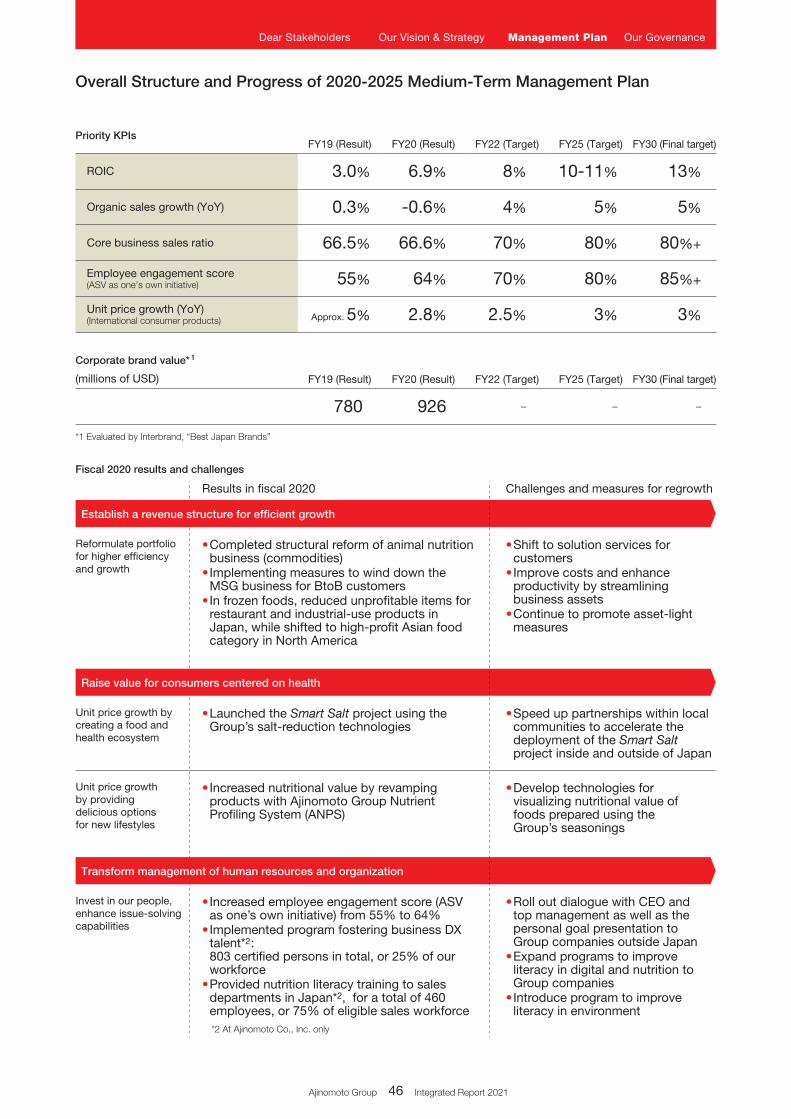
*2 At Ajinomoto Co., Inc. only
Results in fiscal 2020 Challenges and measures for regrowth
• Completed structural reform of animal nutrition business (commodities)
• Implementing measures to wind down the MSG business for BtoB customers
• In frozen foods, reduced unprofitable items for restaurant and industrial-use products in Japan, while shifted to high-profit Asian food category in North America
• Shift to solution services for customers
• Improve costs and enhance productivity by streamlining business assets
• Continue to promote asset-light measures
Reformulate portfolio for higher efficiency and growth
• Increased employee engagement score (ASV as one’s own initiative) from 55% to 64%
• Implemented program fostering business DX talent*2: 803 certified persons in total, or 25% of our workforce
• Provided nutrition literacy training to sales departments in Japan*2, for a total of 460 employees, or 75% of eligible sales workforce
• Roll out dialogue with CEO and top management as well as the personal goal presentation to Group companies outside Japan
• Expand programs to improve literacy in digital and nutrition to Group companies
• Introduce program to improve literacy in environment
Invest in our people, enhance issue-solving capabilities
Transform management of human resources and organization
• Launched the Smart Salt project using the Group’s salt-reduction technologies
• Speed up partnerships within local communities to accelerate the deployment of the Smart Salt project inside and outside of Japan
Unit price growth by creating a food and health ecosystem
• Increased nutritional value by revamping products with Ajinomoto Group Nutrient Profiling System (ANPS)
• Develop technologies for visualizing nutritional value of foods prepared using the Group’s seasonings
Unit price growth by providing delicious options for new lifestyles
Raise value for consumers centered on health
Establish a revenue structure for efficient growth
Overall Structure and Progress of 2020-2025 Medium-Term Management Plan
Focus all of our management resources on resolving food and health issuesThe 2020-2025 Medium-Term Management Plan (MTP) entered its second year. We are marking solid progress with initiatives to reformulate our business portfolio and increase employee engagement. We have identified issues from the first fiscal year of the plan and now the entire Ajinomoto Group is working as one to fulfill our vision for 2030 to become a “solution-providing group of companies for food and health issues.”
years working to transform into a sustainable business structure. Furthermore, these phases will be supported by our drive toward digital transformation (DX), which will speed up strategy implementation.
The priority KPIs include ROIC from the standpoint of efficiency, organic sales growth from the standpoint of growth potential, along with core business sales ratio, employee engagement score, and unit price growth, which relate to the first two.
We are also working on business process transformation for creating business strategy. In fiscal 2020, we revised and bolstered the MTPs of our core businesses based on the impacts of the COVID-19 pandemic, and we improved the decision-making process for strategy implementation.
consumer products is progressing according to plan buoyed by improvement in the product mix. There is still room for improvement in employee engagement score, though, which is a leading indicator of financial targets, despite improvements over the previous year from our initiatives for ASV as one’s own initiative.
Corporate brand value, another leading indicator, experienced a V-shaped recovery, up 19% over the previous year.
The Ajinomoto Group focuses its management resources toward resolving food and health issues, and under our MTP, we are working to transform management of human resources and organization, raise value for consumers centered on health, and establish a revenue structure for efficient growth.
Based on the concept of corporate value redefined in 2020, by actively investing in human resources, we enhance the customer value created by human resources (intangible assets), which will lead to the strengthening of financial assets (tangible assets). Returning financial assets to human capital, we will enhance corporate value through this cycle (see p.26).
Under our 2020-2025 MTP, fiscal 2020 to 2022 is positioned as Phase 1 Structural Reform and fiscal 2023 to 2025 as Phase 2 Regrowth, and we will spend six
Among the priority KPIs, we have made steady progress with ROIC despite impairment losses from the structural reform process. Organic sales growth stalled because Seasonings & Foods and Frozen Foods for food services along with the Bio-Pharma Services in the North America were impacted by the COVID-19 pandemic. The core business sales ratio is expected to receive a boost in fiscal 2021 from our structural reforms in the animal nutrition business. Unit price growth of international
Key principles of 2020-2025 Medium-Term Management Plan
Progress in fiscal 2020
Ajinomoto Group 45 Integrated Report 2021
Dear Stakeholders Our Vision & Strategy Management Plan Our Governance
Use DX to enhance productivity throughout the Group
Raise value for consumerscentered on health
Establish a revenue structurefor efficient growth
Transform management ofHR and organization
Enhance intangible assets Enhance tangible assets
*2 At Ajinomoto Co., Inc. only
Results in fiscal 2020 Challenges and measures for regrowth
• Completed structural reform of animal nutrition business (commodities)
• Implementing measures to wind down the MSG business for BtoB customers
• In frozen foods, reduced unprofitable items for restaurant and industrial-use products in Japan, while shifted to high-profit Asian food category in North America
• Shift to solution services for customers
• Improve costs and enhance productivity by streamlining business assets
• Continue to promote asset-light measures
Reformulate portfolio for higher efficiency and growth
• Increased employee engagement score (ASV as one’s own initiative) from 55% to 64%
• Implemented program fostering business DX talent*2: 803 certified persons in total, or 25% of our workforce
• Provided nutrition literacy training to sales departments in Japan*2, for a total of 460 employees, or 75% of eligible sales workforce
• Roll out dialogue with CEO and top management as well as the personal goal presentation to Group companies outside Japan
• Expand programs to improve literacy in digital and nutrition to Group companies
• Introduce program to improve literacy in environment
Invest in our people, enhance issue-solving capabilities
Transform management of human resources and organization
• Launched the Smart Salt project using the Group’s salt-reduction technologies
• Speed up partnerships within local communities to accelerate the deployment of the Smart Salt project inside and outside of Japan
Unit price growth by creating a food and health ecosystem
• Increased nutritional value by revamping products with Ajinomoto Group Nutrient Profiling System (ANPS)
• Develop technologies for visualizing nutritional value of foods prepared using the Group’s seasonings
Unit price growth by providing delicious options for new lifestyles
Raise value for consumers centered on health
Establish a revenue structure for efficient growth
Overall Structure and Progress of 2020-2025 Medium-Term Management Plan
FY19 (Result) FY20 (Result) FY22 (Target) FY25 (Target) FY30 (Final target)
ROIC 3.0% 6.9% 8% 10-11% 13%
Organic sales growth (YoY) 0.3% -0.6% 4% 5% 5%
Core business sales ratio 66.5% 66.6% 70% 80% 80%+
Employee engagement score(ASV as one’s own initiative) 55% 64% 70% 80% 85%+
Unit price growth (YoY)(International consumer products) Approx. 5% 2.8% 2.5% 3% 3%
Priority KPIs
FY19 (Result) FY20 (Result) FY22 (Target) FY25 (Target) FY30 (Final target)
780 926 – – –
Corporate brand value* 1
(millions of USD)
*1 Evaluated by Interbrand, “Best Japan Brands”
Fiscal 2020 results and challenges
Ajinomoto Group 45 Integrated Report 2021 Ajinomoto Group 46 Integrated Report 2021
Dear Stakeholders Our Vision & Strategy Management Plan Our Governance
803 (25%*)Fiscal 2020 certified business DX employees of Ajinomoto Co., Inc.
CEO
Executive Committee
Food P
roducts D
ivision
Am
inoScience D
ivision
Corp
orate Division
Business Model Transformation
Task Force
Companywide Operational
Transformation Task Force
DX Committee
Promoters
Executo
rs
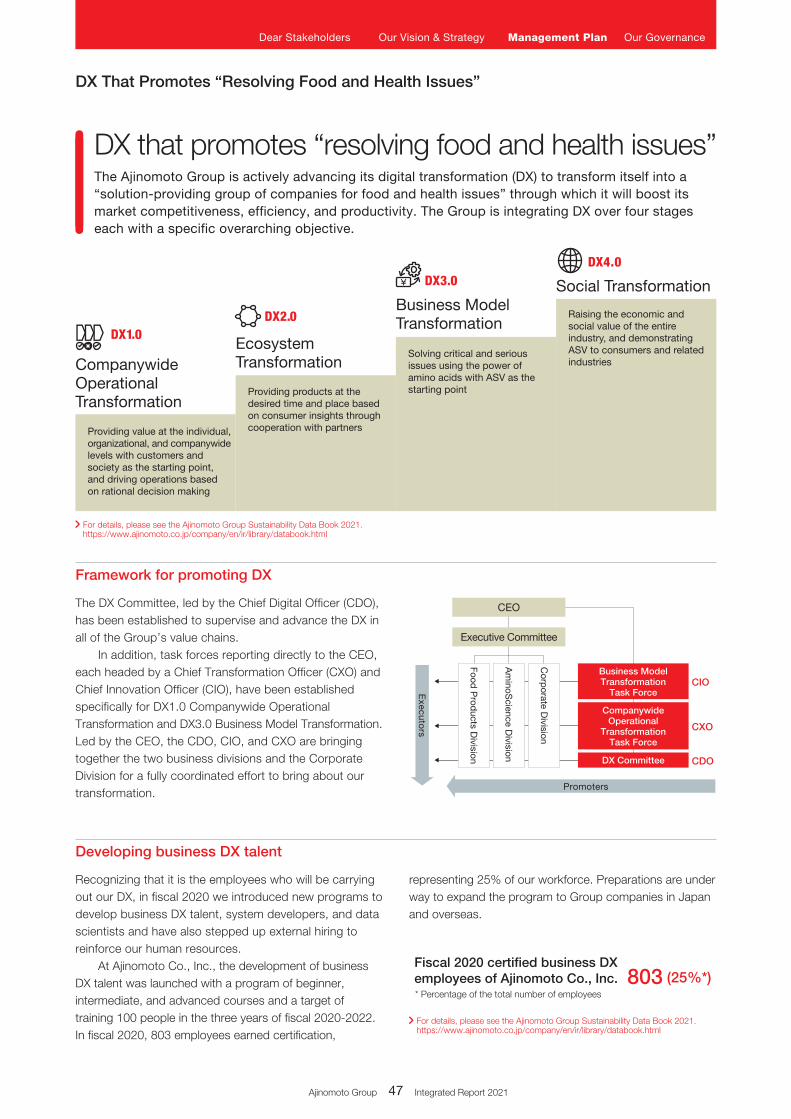
Providing value at the individual, organizational, and companywide levels with customers and society as the starting point, and driving operations based on rational decision making
Providing products at the desired time and place based on consumer insights through cooperation with partners
DX2.0
Ecosystem Transformation
Solving critical and serious issues using the power of amino acids with ASV as the starting point
DX4.0
Social Transformation
Raising the economic and social value of the entire industry, and demonstrating ASV to consumers and related industries
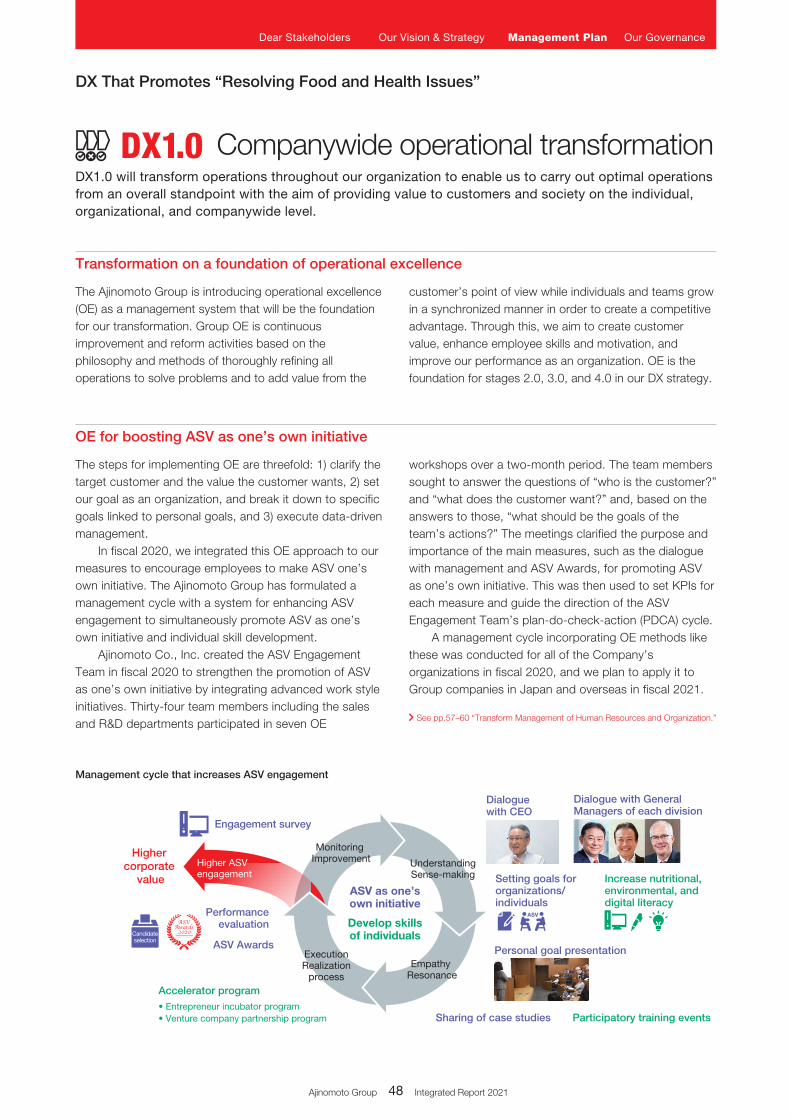
Management cycle that increases ASV engagement
• Entrepreneur incubator program• Venture company partnership program Sharing of case studies
Engagement survey
Personal goal presentation
ASV as one’sown initiative
Develop skillsof individuals
Participatory training events
Dialogue with CEO
Dialogue with General Managers of each division
Increase nutritional, environmental, anddigital literacy
ASV Awards
Performance evaluation
Accelerator program
UnderstandingSense-making
Empathy Resonance
ExecutionRealization
process
Monitoring ImprovementHigher ASV
engagement
Higher corporate
value
Candidateselection
Setting goals for organizations/individuals
Companywide Operational Transformation
DX1.0
DX3.0
Business Model Transformation
* Percentage of the total number of employees
CIO
CXO
CDO
representing 25% of our workforce. Preparations are under way to expand the program to Group companies in Japan and overseas.
The DX Committee, led by the Chief Digital Officer (CDO), has been established to supervise and advance the DX in all of the Group’s value chains.
In addition, task forces reporting directly to the CEO, each headed by a Chief Transformation Officer (CXO) and Chief Innovation Officer (CIO), have been established specifically for DX1.0 Companywide Operational Transformation and DX3.0 Business Model Transformation. Led by the CEO, the CDO, CIO, and CXO are bringing together the two business divisions and the Corporate Division for a fully coordinated effort to bring about our transformation.
Recognizing that it is the employees who will be carrying out our DX, in fiscal 2020 we introduced new programs to develop business DX talent, system developers, and data scientists and have also stepped up external hiring to reinforce our human resources.
At Ajinomoto Co., Inc., the development of business DX talent was launched with a program of beginner, intermediate, and advanced courses and a target of training 100 people in the three years of fiscal 2020-2022. In fiscal 2020, 803 employees earned certification,
DX That Promotes “Resolving Food and Health Issues”
DX that promotes “resolving food and health issues”The Ajinomoto Group is actively advancing its digital transformation (DX) to transform itself into a “solution-providing group of companies for food and health issues” through which it will boost its market competitiveness, efficiency, and productivity. The Group is integrating DX over four stages each with a specific overarching objective.
Framework for promoting DX
Developing business DX talent
For details, please see the Ajinomoto Group Sustainability Data Book 2021.https://www.ajinomoto.co.jp/company/en/ir/library/databook.html
For details, please see the Ajinomoto Group Sustainability Data Book 2021.https://www.ajinomoto.co.jp/company/en/ir/library/databook.html
Ajinomoto Group 47 Integrated Report 2021
Dear Stakeholders Our Vision & Strategy Management Plan Our Governance
803 (25%*)Fiscal 2020 certified business DX employees of Ajinomoto Co., Inc.
CEO
Executive Committee
Food P
roducts D
ivision
Am
inoScience D
ivision
Corp
orate Division
Business Model Transformation
Task Force
Companywide Operational
Transformation Task Force
DX Committee
Promoters
Executo
rs
Providing value at the individual, organizational, and companywide levels with customers and society as the starting point, and driving operations based on rational decision making
Providing products at the desired time and place based on consumer insights through cooperation with partners
DX2.0
Ecosystem Transformation
Solving critical and serious issues using the power of amino acids with ASV as the starting point
DX4.0
Social Transformation
Raising the economic and social value of the entire industry, and demonstrating ASV to consumers and related industries
Management cycle that increases ASV engagement
• Entrepreneur incubator program• Venture company partnership program Sharing of case studies
Engagement survey
Personal goal presentation
ASV as one’sown initiative
Develop skillsof individuals
Participatory training events
Dialogue with CEO
Dialogue with General Managers of each division
Increase nutritional, environmental, anddigital literacy
ASV Awards
Performance evaluation
Accelerator program
UnderstandingSense-making
Empathy Resonance
ExecutionRealization
process
Monitoring ImprovementHigher ASV
engagement
Higher corporate
value
Candidateselection
Setting goals for organizations/individuals
Companywide Operational Transformation
DX1.0
DX3.0
Business Model Transformation
* Percentage of the total number of employees
CIO
CXO
CDO
customer’s point of view while individuals and teams grow in a synchronized manner in order to create a competitive advantage. Through this, we aim to create customer value, enhance employee skills and motivation, and improve our performance as an organization. OE is the foundation for stages 2.0, 3.0, and 4.0 in our DX strategy.
workshops over a two-month period. The team members sought to answer the questions of “who is the customer?” and “what does the customer want?” and, based on the answers to those, “what should be the goals of the team’s actions?” The meetings clarified the purpose and importance of the main measures, such as the dialogue with management and ASV Awards, for promoting ASV as one’s own initiative. This was then used to set KPIs for each measure and guide the direction of the ASV Engagement Team’s plan-do-check-action (PDCA) cycle.
A management cycle incorporating OE methods like these was conducted for all of the Company’s organizations in fiscal 2020, and we plan to apply it to Group companies in Japan and overseas in fiscal 2021.
The Ajinomoto Group is introducing operational excellence (OE) as a management system that will be the foundation for our transformation. Group OE is continuous improvement and reform activities based on the philosophy and methods of thoroughly refining all operations to solve problems and to add value from the
The steps for implementing OE are threefold: 1) clarify the target customer and the value the customer wants, 2) set our goal as an organization, and break it down to specific goals linked to personal goals, and 3) execute data-driven management.
In fiscal 2020, we integrated this OE approach to our measures to encourage employees to make ASV one’s own initiative. The Ajinomoto Group has formulated a management cycle with a system for enhancing ASV engagement to simultaneously promote ASV as one’s own initiative and individual skill development.
Ajinomoto Co., Inc. created the ASV Engagement Team in fiscal 2020 to strengthen the promotion of ASV as one’s own initiative by integrating advanced work style initiatives. Thirty-four team members including the sales and R&D departments participated in seven OE
DX That Promotes “Resolving Food and Health Issues”
DX1.0 will transform operations throughout our organization to enable us to carry out optimal operations from an overall standpoint with the aim of providing value to customers and society on the individual, organizational, and companywide level.
Companywide operational transformationDX1.0
Transformation on a foundation of operational excellence
OE for boosting ASV as one’s own initiative
See pp.57–60 “Transform Management of Human Resources and Organization.”
Ajinomoto Group 47 Integrated Report 2021 Ajinomoto Group 48 Integrated Report 2021
Dear Stakeholders Our Vision & Strategy Management Plan Our Governance
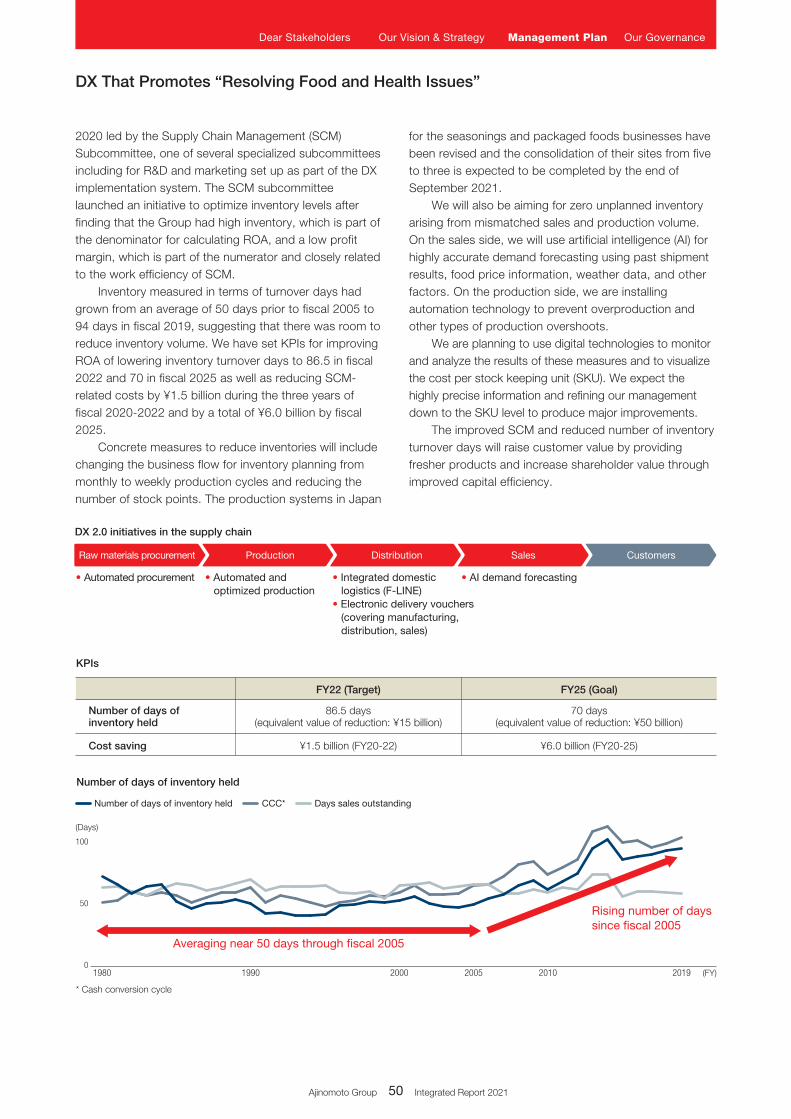
DX 2.0 initiatives in the supply chain
Number of days of inventory held
0
100
50
(Days)
Number of days of inventory held CCC* Days sales outstanding
Averaging near 50 days through fiscal 2005
Rising number of days since fiscal 2005
Number of days of inventory held
Cost saving
86.5 days(equivalent value of reduction: ¥15 billion)
¥1.5 billion (FY20-22)
FY22 (Target)
70 days(equivalent value of reduction: ¥50 billion)
¥6.0 billion (FY20-25)
FY25 (Goal)
KPIs
• Automated procurement • Automated and optimized production
• Integrated domestic logistics (F-LINE)
• Electronic delivery vouchers (covering manufacturing, distribution, sales)
• AI demand forecasting
Raw materials procurement Production Distribution Sales Customers
(FY)1980 1990 2000 20102005 2019
* Cash conversion cycle
DX That Promotes “Resolving Food and Health Issues”
We are aiming to build value co-creating ecosystems that enable us to continuously increase the value we provide to customers while leveraging smart partnerships with outside partners. To further that aim, we are also transforming the ecosystems of our management and businesses.
Ecosystem transformationDX2.0
connections between the marketing, R&D, procurement, production, and product sales functions. However, customer consumption and purchasing behaviors are becoming more diverse and are shifting away from being strictly based on the product to the CX of the product purchase and use. Rather than simply connecting the supply chains linearly, creating new value in this rapidly changing business environment will require the supply chain functions freely exchanging information centered on CX, the ability to leverage the supply chain strengths, and overall management that is able to effectively and agilely produce new CX. Steps in this direction have included reorganizing the Group R&D structure to better respond to the significant changes in the market environment and customer needs, and Ajinomoto Co., Inc. teaming with four other food manufacturers to establish F-LINE CORPORATION with the aim of building a sustainable logistics system.
The Ajinomoto Group will continue working with its diverse stakeholders to remake its ecosystems to promote social change and, by resolving food and health issues, contribute to people’s wellness.
also developing an ROIC tree incorporating data common to all businesses as well as data on individual businesses and daily operations, which will boost our ability to continuously enhance corporate value. We will also thoroughly enforce management with an emphasis on ROIC for allocating resources to core businesses and for downsizing or eliminating non-core businesses with the aim of establishing a highly efficient profit structure.
To date, the Group has been a vertical organization with a clear hierarchy, which is common for Japanese companies. Under this structure, employees have been essentially considered as strictly fixed to each organization. Advances in digital technology and IT systems and the increasing adoption of new work styles, such as remote work, are releasing individuals and organizations from the previously fixed organizational culture. We expect this trend to create new networks inside as well as outside the company with autonomous individuals and organizations. The Group will seek to form a seamless network untethered by the conventional organizational structure, and to establish a network-type management style with employees participating with diverse work styles and responsibilities. We are implementing various ways to create and optimize this network, including joint ventures and outsourcing corporate services as well as spinning off operations as service companies.
The transformation of the business ecosystem will also hinge on customer experience (CX). The Group’s business management has been made up of linear
While increasing ASV engagement to improve employee motivation, we also must improve our performance as an organization. The Ajinomoto Group has therefore begun devising and adopting management indicators that will apply throughout the Group to gauge each activity’s contribution to raising ROIC and realizing ASV.
As we introduce the common Group management indicators, we are standardizing managerial accounting and creating a Group-wide data collection and analysis system for visualization of Group management. We are See pp.73–77 “Financial Capital Strategy.”
Introduction of common management indicators across the Group
DX for improving supply chain management
Ajinomoto Group’s ecosystem transformation
ROA, which represents the ratio of business profit to total assets, as a particular issue that needs to be rectified. We have already started an effort to improve ROA in fiscal
The Group is aiming to maintain and improve ROIC, and ensure it exceeds WACC, with a profit structure of ROE > ROIC > ROA > WACC. At this point, we view the low
Ajinomoto Group 49 Integrated Report 2021
Dear Stakeholders Our Vision & Strategy Management Plan Our Governance
DX 2.0 initiatives in the supply chain
Number of days of inventory held
0
100
50
(Days)
Number of days of inventory held CCC* Days sales outstanding
Averaging near 50 days through fiscal 2005
Rising number of days since fiscal 2005
Number of days of inventory held
Cost saving
86.5 days(equivalent value of reduction: ¥15 billion)
¥1.5 billion (FY20-22)
FY22 (Target)
70 days(equivalent value of reduction: ¥50 billion)
¥6.0 billion (FY20-25)
FY25 (Goal)
KPIs
• Automated procurement • Automated and optimized production
• Integrated domestic logistics (F-LINE)
• Electronic delivery vouchers (covering manufacturing, distribution, sales)
• AI demand forecasting
Raw materials procurement Production Distribution Sales Customers
(FY)1980 1990 2000 20102005 2019
* Cash conversion cycle
DX That Promotes “Resolving Food and Health Issues”
for the seasonings and packaged foods businesses have been revised and the consolidation of their sites from five to three is expected to be completed by the end of September 2021.
We will also be aiming for zero unplanned inventory arising from mismatched sales and production volume. On the sales side, we will use artificial intelligence (AI) for highly accurate demand forecasting using past shipment results, food price information, weather data, and other factors. On the production side, we are installing automation technology to prevent overproduction and other types of production overshoots.
We are planning to use digital technologies to monitor and analyze the results of these measures and to visualize the cost per stock keeping unit (SKU). We expect the highly precise information and refining our management down to the SKU level to produce major improvements.
The improved SCM and reduced number of inventory turnover days will raise customer value by providing fresher products and increase shareholder value through improved capital efficiency.
2020 led by the Supply Chain Management (SCM) Subcommittee, one of several specialized subcommittees including for R&D and marketing set up as part of the DX implementation system. The SCM subcommittee launched an initiative to optimize inventory levels after finding that the Group had high inventory, which is part of the denominator for calculating ROA, and a low profit margin, which is part of the numerator and closely related to the work efficiency of SCM.
Inventory measured in terms of turnover days had grown from an average of 50 days prior to fiscal 2005 to 94 days in fiscal 2019, suggesting that there was room to reduce inventory volume. We have set KPIs for improving ROA of lowering inventory turnover days to 86.5 in fiscal 2022 and 70 in fiscal 2025 as well as reducing SCM-related costs by ¥1.5 billion during the three years of fiscal 2020-2022 and by a total of ¥6.0 billion by fiscal 2025.
Concrete measures to reduce inventories will include changing the business flow for inventory planning from monthly to weekly production cycles and reducing the number of stock points. The production systems in Japan
Ajinomoto Group 49 Integrated Report 2021 Ajinomoto Group 50 Integrated Report 2021
Dear Stakeholders Our Vision & Strategy Management Plan Our Governance
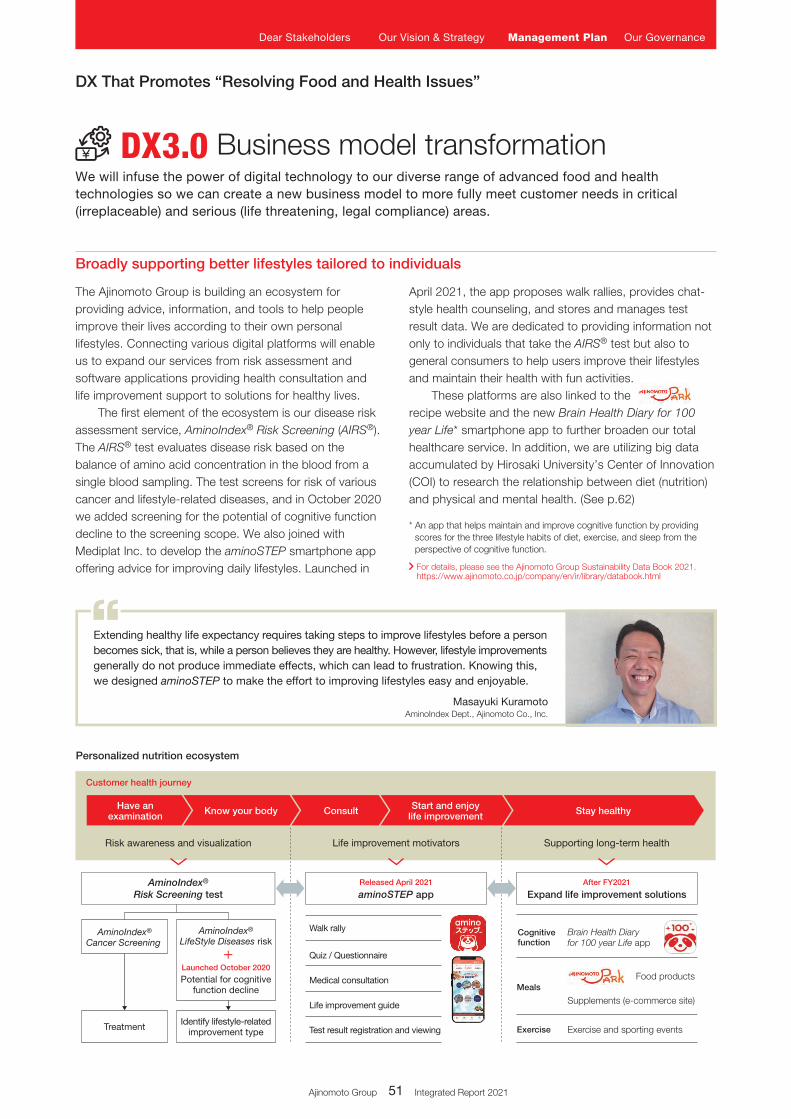
Personalized nutrition ecosystem
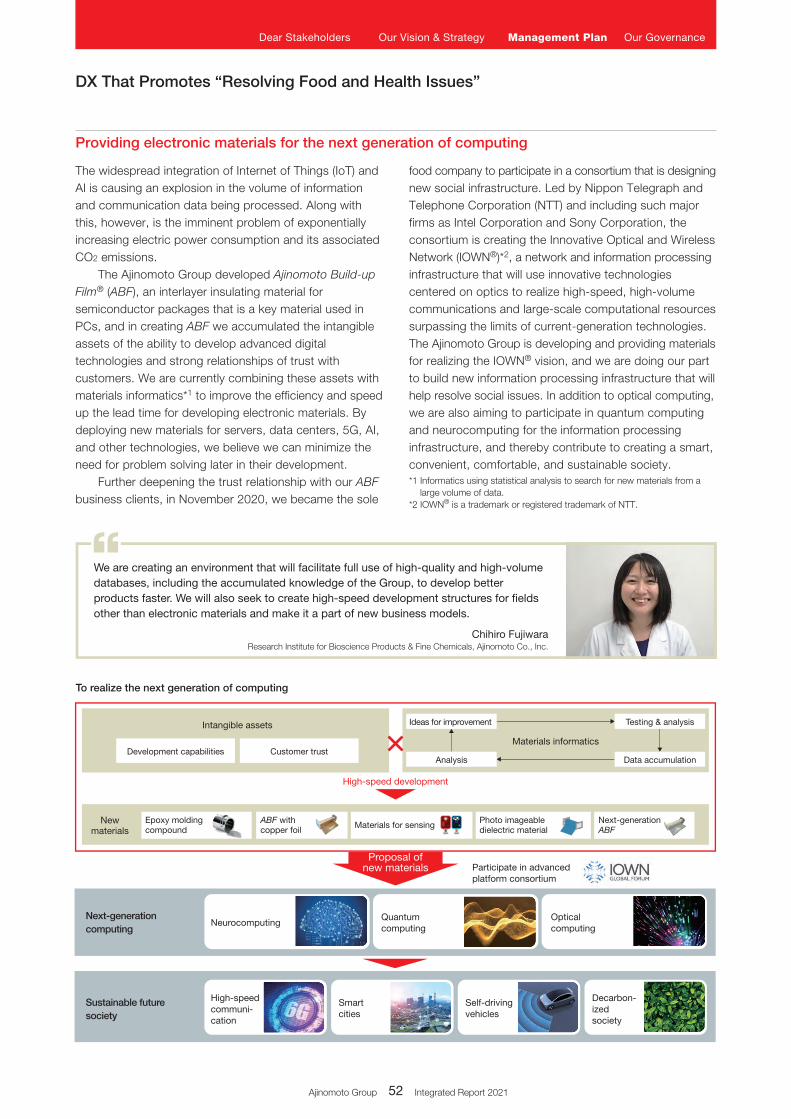
To realize the next generation of computing
Participate in advanced platform consortium
New materials
Intangible assets
Development capabilities Customer trust
Epoxy molding compound
ABF with copper foil Materials for sensing Photo imageable
dielectric materialNext-generation ABF
Have anexamination
Risk awareness and visualization
Customer health journey
AminoIndex®
Risk Screening test aminoSTEP appReleased April 2021 After FY2021
Expand life improvement solutions
Life improvement motivators Supporting long-term health
Know your body Consult Start and enjoylife improvement Stay healthy
Quiz / Questionnaire
Walk rally
Medical consultation
Life improvement guide
Test result registration and viewing
Brain Health Diary for 100 year Life app
Food products
Exercise and sporting events
Supplements (e-commerce site)
Cognitive function
Meals
Exercise
AminoIndex®
Cancer Screening
Treatment Identify lifestyle-relatedimprovement type
AminoIndex®
LifeStyle Diseases risk
Launched October 2020
Potential for cognitivefunction decline
High-speed development
Ideas for improvement Testing & analysis
Analysis Data accumulation
Proposal ofnew materials
Materials informatics
Next-generation computing
Neurocomputing
Sustainable future society
High-speed communi-cation
Smartcities
Self-driving vehicles
Quantumcomputing
Opticalcomputing
Decarbon-ized society
Extending healthy life expectancy requires taking steps to improve lifestyles before a person becomes sick, that is, while a person believes they are healthy. However, lifestyle improvements generally do not produce immediate effects, which can lead to frustration. Knowing this, we designed aminoSTEP to make the effort to improving lifestyles easy and enjoyable.
Masayuki Kuramoto AminoIndex Dept., Ajinomoto Co., Inc.
We are creating an environment that will facilitate full use of high-quality and high-volume databases, including the accumulated knowledge of the Group, to develop better products faster. We will also seek to create high-speed development structures for fields other than electronic materials and make it a part of new business models.
Chihiro FujiwaraResearch Institute for Bioscience Products & Fine Chemicals, Ajinomoto Co., Inc.
We will infuse the power of digital technology to our diverse range of advanced food and health technologies so we can create a new business model to more fully meet customer needs in critical (irreplaceable) and serious (life threatening, legal compliance) areas.
Business model transformationDX3.0
DX That Promotes “Resolving Food and Health Issues”
April 2021, the app proposes walk rallies, provides chat-style health counseling, and stores and manages test result data. We are dedicated to providing information not only to individuals that take the AIRS® test but also to general consumers to help users improve their lifestyles and maintain their health with fun activities.
These platforms are also linked to the recipe website and the new Brain Health Diary for 100 year Life* smartphone app to further broaden our total healthcare service. In addition, we are utilizing big data accumulated by Hirosaki University’s Center of Innovation (COI) to research the relationship between diet (nutrition) and physical and mental health. (See p.62)
The Ajinomoto Group is building an ecosystem for providing advice, information, and tools to help people improve their lives according to their own personal lifestyles. Connecting various digital platforms will enable us to expand our services from risk assessment and software applications providing health consultation and life improvement support to solutions for healthy lives.
The first element of the ecosystem is our disease risk assessment service, AminoIndex® Risk Screening (AIRS®). The AIRS® test evaluates disease risk based on the balance of amino acid concentration in the blood from a single blood sampling. The test screens for risk of various cancer and lifestyle-related diseases, and in October 2020 we added screening for the potential of cognitive function decline to the screening scope. We also joined with Mediplat Inc. to develop the aminoSTEP smartphone app offering advice for improving daily lifestyles. Launched in
* An app that helps maintain and improve cognitive function by providing scores for the three lifestyle habits of diet, exercise, and sleep from the perspective of cognitive function.
Broadly supporting better lifestyles tailored to individuals
For details, please see the Ajinomoto Group Sustainability Data Book 2021.https://www.ajinomoto.co.jp/company/en/ir/library/databook.html
Ajinomoto Group 51 Integrated Report 2021
Dear Stakeholders Our Vision & Strategy Management Plan Our Governance
Personalized nutrition ecosystem
To realize the next generation of computing
Participate in advanced platform consortium
New materials
Intangible assets
Development capabilities Customer trust
Epoxy molding compound
ABF with copper foil Materials for sensing Photo imageable
dielectric materialNext-generation ABF
Have anexamination
Risk awareness and visualization
Customer health journey
AminoIndex®
Risk Screening test aminoSTEP appReleased April 2021 After FY2021
Expand life improvement solutions
Life improvement motivators Supporting long-term health
Know your body Consult Start and enjoylife improvement Stay healthy
Quiz / Questionnaire
Walk rally
Medical consultation
Life improvement guide
Test result registration and viewing
Brain Health Diary for 100 year Life app
Food products
Exercise and sporting events
Supplements (e-commerce site)
Cognitive function
Meals
Exercise
AminoIndex®
Cancer Screening
Treatment Identify lifestyle-relatedimprovement type
AminoIndex®
LifeStyle Diseases risk
Launched October 2020
Potential for cognitivefunction decline
High-speed development
Ideas for improvement Testing & analysis
Analysis Data accumulation
Proposal ofnew materials
Materials informatics
Next-generation computing
Neurocomputing
Sustainable future society
High-speed communi-cation
Smartcities
Self-driving vehicles
Quantumcomputing
Opticalcomputing
Decarbon-ized society
Extending healthy life expectancy requires taking steps to improve lifestyles before a person becomes sick, that is, while a person believes they are healthy. However, lifestyle improvements generally do not produce immediate effects, which can lead to frustration. Knowing this, we designed aminoSTEP to make the effort to improving lifestyles easy and enjoyable.
Masayuki Kuramoto AminoIndex Dept., Ajinomoto Co., Inc.
We are creating an environment that will facilitate full use of high-quality and high-volume databases, including the accumulated knowledge of the Group, to develop better products faster. We will also seek to create high-speed development structures for fields other than electronic materials and make it a part of new business models.
Chihiro FujiwaraResearch Institute for Bioscience Products & Fine Chemicals, Ajinomoto Co., Inc.
DX That Promotes “Resolving Food and Health Issues”
food company to participate in a consortium that is designing new social infrastructure. Led by Nippon Telegraph and Telephone Corporation (NTT) and including such major firms as Intel Corporation and Sony Corporation, the consortium is creating the Innovative Optical and Wireless Network (IOWN®)*2, a network and information processing infrastructure that will use innovative technologies centered on optics to realize high-speed, high-volume communications and large-scale computational resources surpassing the limits of current-generation technologies. The Ajinomoto Group is developing and providing materials for realizing the IOWN® vision, and we are doing our part to build new information processing infrastructure that will help resolve social issues. In addition to optical computing, we are also aiming to participate in quantum computing and neurocomputing for the information processing infrastructure, and thereby contribute to creating a smart, convenient, comfortable, and sustainable society.
The widespread integration of Internet of Things (IoT) and AI is causing an explosion in the volume of information and communication data being processed. Along with this, however, is the imminent problem of exponentially increasing electric power consumption and its associated CO2 emissions.
The Ajinomoto Group developed Ajinomoto Build-up Film® (ABF), an interlayer insulating material for semiconductor packages that is a key material used in PCs, and in creating ABF we accumulated the intangible assets of the ability to develop advanced digital technologies and strong relationships of trust with customers. We are currently combining these assets with materials informatics*1 to improve the efficiency and speed up the lead time for developing electronic materials. By deploying new materials for servers, data centers, 5G, AI, and other technologies, we believe we can minimize the need for problem solving later in their development.
Further deepening the trust relationship with our ABF business clients, in November 2020, we became the sole
*1 Informatics using statistical analysis to search for new materials from a large volume of data.
*2 IOWN® is a trademark or registered trademark of NTT.
Providing electronic materials for the next generation of computing
Ajinomoto Group 51 Integrated Report 2021 Ajinomoto Group 52 Integrated Report 2021
Dear Stakeholders Our Vision & Strategy Management Plan Our Governance
Approx. ¥54 billion Approx. ¥50 billionApprox.
¥50 billionPlan to bringforward a portion
FY19 (Result) FY21 (Forecast)FY20 (Result) FY22 (Target) FY25 (Target)
ROIC
Pro�timprove-
ment
Assetreduction
Asset reduction (approx. ¥33 billion)
Resource allocation and sale of cross-sharehold-ings (approx. ¥32 billion)
Asset reduction(approx. ¥37 billion)
Resource allocation and sale of cross-sharehold-ings (approx. ¥17 billion)
Asset reduction (approx. ¥37 billion)
Continuous profit improvement (unit price growth due to creation of health value)
Resource allocation and sale of cross-sharehold-ings (approx. ¥13 billion)
Restructure businesses identi�ed as of FY22, control overall asset size (build ecosystem)
Approx. 6%(excludes
impairment loss)
Approx. 8% (excludes
impairment loss)
Approx. 8%(excludes structural reform expenses)
Approx. 5%
WACC hurdle rate
ROIC expected to temporarily fall below real capability due toimpairment accompanying structural reform
Approx. ¥65 billion
Pro�t improvement by approx. ¥30 billion over three years
Implemented FY20-22 (Phase 1) FY23-25 (Phase 2)
Reduce assets by ¥100 billion over three years from FY20-22
Reduce assets by a total of ¥200 billion by FY25
10%–
11%8%7.0%6.9%
3.0%
Target
Target
EfficiencyCapital costs (each business)
Low High
Low
High
Growthpotential
• Sauce & Seasonings • Quick Nourishment
• Solution & Ingredients • Frozen Foods
• Healthcare • Electronic Materials
• Some Seasonings & Foods businesses
• Some healthcare businesses
• Animal Nutrition (specialty)
Core businessesBusiness efficiency (monitor)
Businesses to be restructuredfor the growth strategy
(monitor)• Animal Nutrition (commodity)
• Some MSG businesses
• Some Frozen Foods businesses
Non-core businesses
Structural reform in non-core businesses Financial impact
• Amount of asset reduction: ¥15.6 billion (FY20)
• In April 2020, integrated Ajinomoto Animal Nutrition North America, Inc. into Ajinomoto Health & Nutrition North America, Inc. (feed-use amino acids production lines to be converted to multi-purpose amino acids)
• In April 2021, sold all shares of AJINOMOTO ANIMAL NUTRITION EUROPE S.A.S.
Animal Nutrition
MSG• Reduced business for BtoB customers
• Project to increase gross pro�t margin is underway
• Focusing on Asian food category in North America• Reduced unprofitable items for restaurant and industrial-use products in Japan
Frozen Foods • Improved gross pro�t margin by 1.4 points (FY20)
• Increased production capacity for Asian food category in North America (FY20)
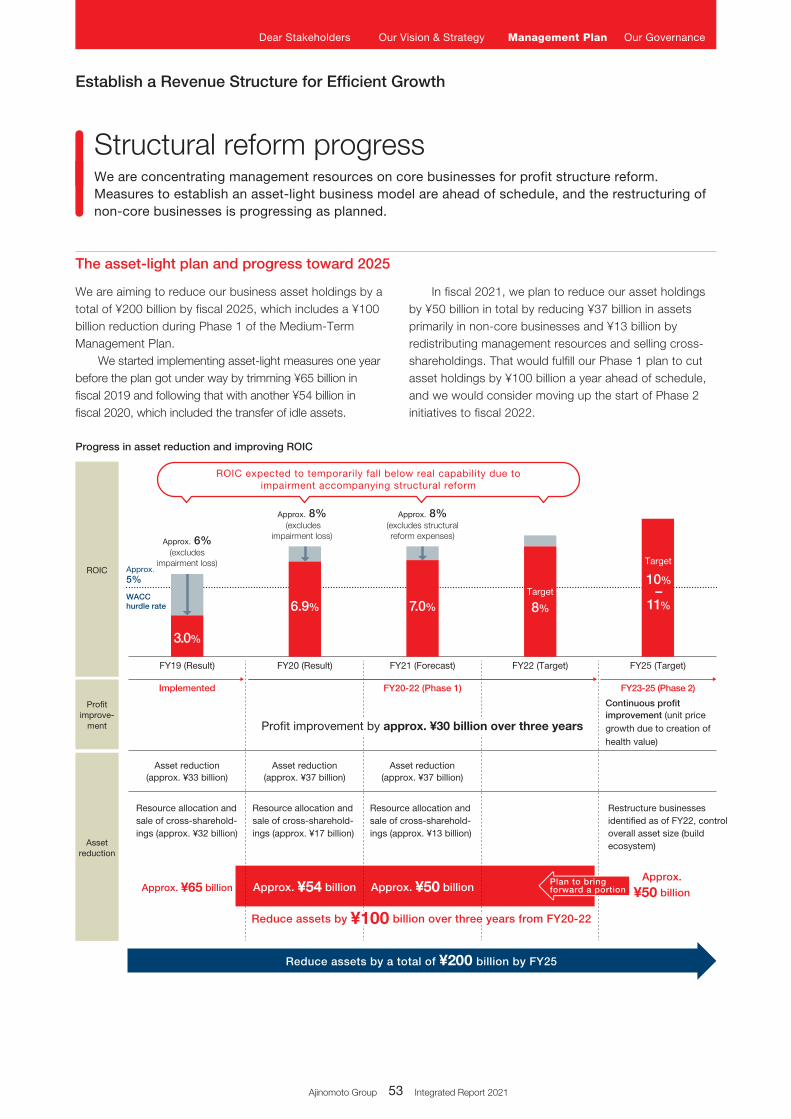
In fiscal 2021, we plan to reduce our asset holdings by ¥50 billion in total by reducing ¥37 billion in assets primarily in non-core businesses and ¥13 billion by redistributing management resources and selling cross-shareholdings. That would fulfill our Phase 1 plan to cut asset holdings by ¥100 billion a year ahead of schedule, and we would consider moving up the start of Phase 2 initiatives to fiscal 2022.
We are aiming to reduce our business asset holdings by a total of ¥200 billion by fiscal 2025, which includes a ¥100 billion reduction during Phase 1 of the Medium-Term Management Plan.
We started implementing asset-light measures one year before the plan got under way by trimming ¥65 billion in fiscal 2019 and following that with another ¥54 billion in fiscal 2020, which included the transfer of idle assets.
Establish a Revenue Structure for Efficient Growth
Progress in asset reduction and improving ROIC
Structural reform progressWe are concentrating management resources on core businesses for profit structure reform.Measures to establish an asset-light business model are ahead of schedule, and the restructuring of non-core businesses is progressing as planned.
The asset-light plan and progress toward 2025
Ajinomoto Group 53 Integrated Report 2021
Dear Stakeholders Our Vision & Strategy Management Plan Our Governance
Approx. ¥54 billion Approx. ¥50 billionApprox.
¥50 billionPlan to bringforward a portion
FY19 (Result) FY21 (Forecast)FY20 (Result) FY22 (Target) FY25 (Target)
ROIC
Pro�timprove-
ment
Assetreduction
Asset reduction (approx. ¥33 billion)
Resource allocation and sale of cross-sharehold-ings (approx. ¥32 billion)
Asset reduction(approx. ¥37 billion)
Resource allocation and sale of cross-sharehold-ings (approx. ¥17 billion)
Asset reduction (approx. ¥37 billion)
Continuous profit improvement (unit price growth due to creation of health value)
Resource allocation and sale of cross-sharehold-ings (approx. ¥13 billion)
Restructure businesses identi�ed as of FY22, control overall asset size (build ecosystem)
Approx. 6%(excludes
impairment loss)
Approx. 8% (excludes
impairment loss)
Approx. 8%(excludes structural reform expenses)
Approx. 5%
WACC hurdle rate
ROIC expected to temporarily fall below real capability due toimpairment accompanying structural reform
Approx. ¥65 billion
Pro�t improvement by approx. ¥30 billion over three years
Implemented FY20-22 (Phase 1) FY23-25 (Phase 2)
Reduce assets by ¥100 billion over three years from FY20-22
Reduce assets by a total of ¥200 billion by FY25
10%–
11%8%7.0%6.9%
3.0%
Target
Target
EfficiencyCapital costs (each business)
Low High
Low
High
Growthpotential
• Sauce & Seasonings • Quick Nourishment
• Solution & Ingredients • Frozen Foods
• Healthcare • Electronic Materials
• Some Seasonings & Foods businesses
• Some healthcare businesses
• Animal Nutrition (specialty)
Core businessesBusiness efficiency (monitor)
Businesses to be restructuredfor the growth strategy
(monitor)• Animal Nutrition (commodity)
• Some MSG businesses
• Some Frozen Foods businesses
Non-core businesses
Structural reform in non-core businesses Financial impact
• Amount of asset reduction: ¥15.6 billion (FY20)
• In April 2020, integrated Ajinomoto Animal Nutrition North America, Inc. into Ajinomoto Health & Nutrition North America, Inc. (feed-use amino acids production lines to be converted to multi-purpose amino acids)
• In April 2021, sold all shares of AJINOMOTO ANIMAL NUTRITION EUROPE S.A.S.
Animal Nutrition
MSG• Reduced business for BtoB customers
• Project to increase gross pro�t margin is underway
• Focusing on Asian food category in North America• Reduced unprofitable items for restaurant and industrial-use products in Japan
Frozen Foods • Improved gross pro�t margin by 1.4 points (FY20)
• Increased production capacity for Asian food category in North America (FY20)
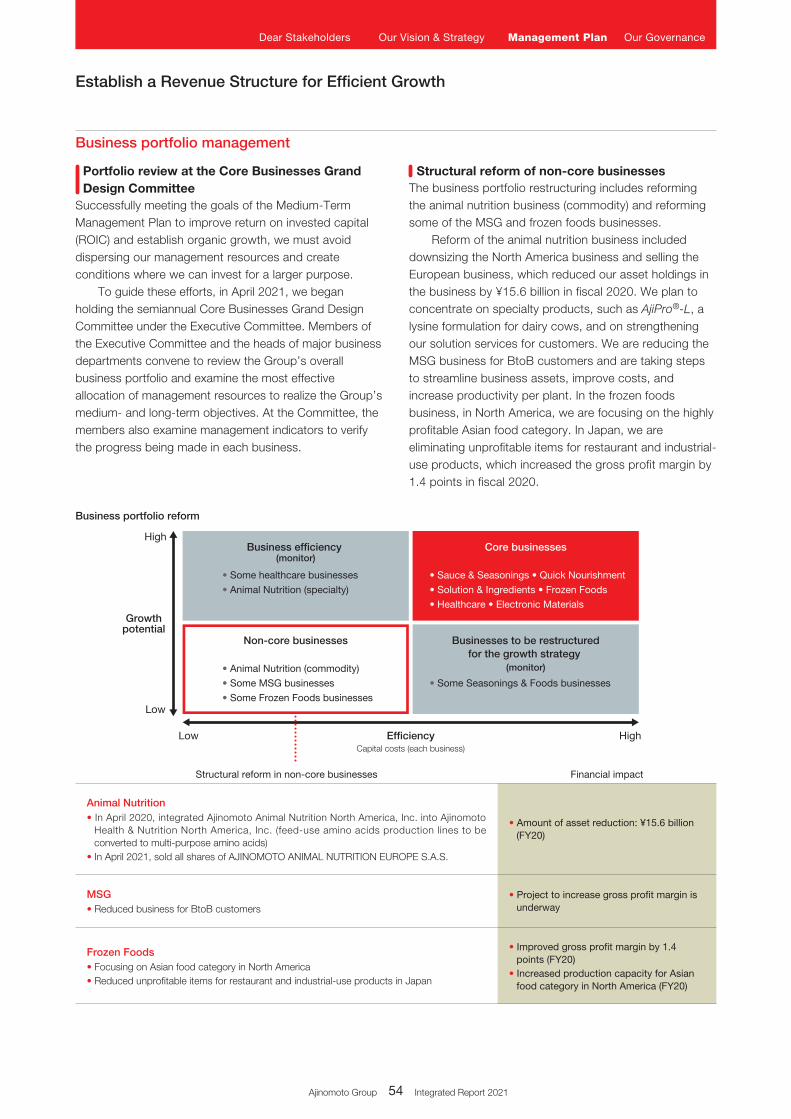
Successfully meeting the goals of the Medium-Term Management Plan to improve return on invested capital (ROIC) and establish organic growth, we must avoid dispersing our management resources and create conditions where we can invest for a larger purpose.
To guide these efforts, in April 2021, we began holding the semiannual Core Businesses Grand Design Committee under the Executive Committee. Members of the Executive Committee and the heads of major business departments convene to review the Group’s overall business portfolio and examine the most effective allocation of management resources to realize the Group’s medium- and long-term objectives. At the Committee, the members also examine management indicators to verify the progress being made in each business.
The business portfolio restructuring includes reforming the animal nutrition business (commodity) and reforming some of the MSG and frozen foods businesses.
Reform of the animal nutrition business included downsizing the North America business and selling the European business, which reduced our asset holdings in the business by ¥15.6 billion in fiscal 2020. We plan to concentrate on specialty products, such as AjiPro®-L, a lysine formulation for dairy cows, and on strengthening our solution services for customers. We are reducing the MSG business for BtoB customers and are taking steps to streamline business assets, improve costs, and increase productivity per plant. In the frozen foods business, in North America, we are focusing on the highly profitable Asian food category. In Japan, we are eliminating unprofitable items for restaurant and industrial-use products, which increased the gross profit margin by 1.4 points in fiscal 2020.
Establish a Revenue Structure for Efficient Growth
Business portfolio reform
Portfolio review at the Core Businesses Grand Design Committee
Structural reform of non-core businesses
Business portfolio management
Ajinomoto Group 53 Integrated Report 2021 Ajinomoto Group 54 Integrated Report 2021
Dear Stakeholders Our Vision & Strategy Management Plan Our Governance
Smart Saltproducts promoting
“delicious salt reduction”
Offering delicious low-salt recipes
using umamiand dashi
Masako®
(flavor seasoning)
Indonesia
Caldo SAZÓN® Light(flavor seasoning)
Brazil
Taking the reduced-salt initiative global
Ros Dee®
Less sodium(flavor seasoning)
Yum Yum Sood Ded Minced pork flavor(instant noodle)
Thailand
Bizim Mutfak® 25% Less Salt Ezogelin Soup
Bizim Mutfak® 25% Less Salt Chicken Bouillon
Turkey
Example) Adding value in the Seasonings & Foods business
Umami seasonings
Flavor seasonings
Menu-specific seasonings
Pro
du
ct ra
ng
e sp
rea
d
Diverse customer needs in different countries and regions
Reduced-salt products and health value-added products
Japan Thailand Indonesia Vietnam Philippines BrazilOther
countries
FY21 organic growth rate: Approx. 6%
Unit price growth by increasing added value
Aji-no-mix® Breading mix Apanado(menu-specific seasoning)
Aji-no-men® Tallarin Red(instant noodle)
Peru
Increasing added value(unit price growth)
VONO®
Chef Onion Cream with Reduced Sodium
(soup)
Promotion of reduced salt through owned media
Global
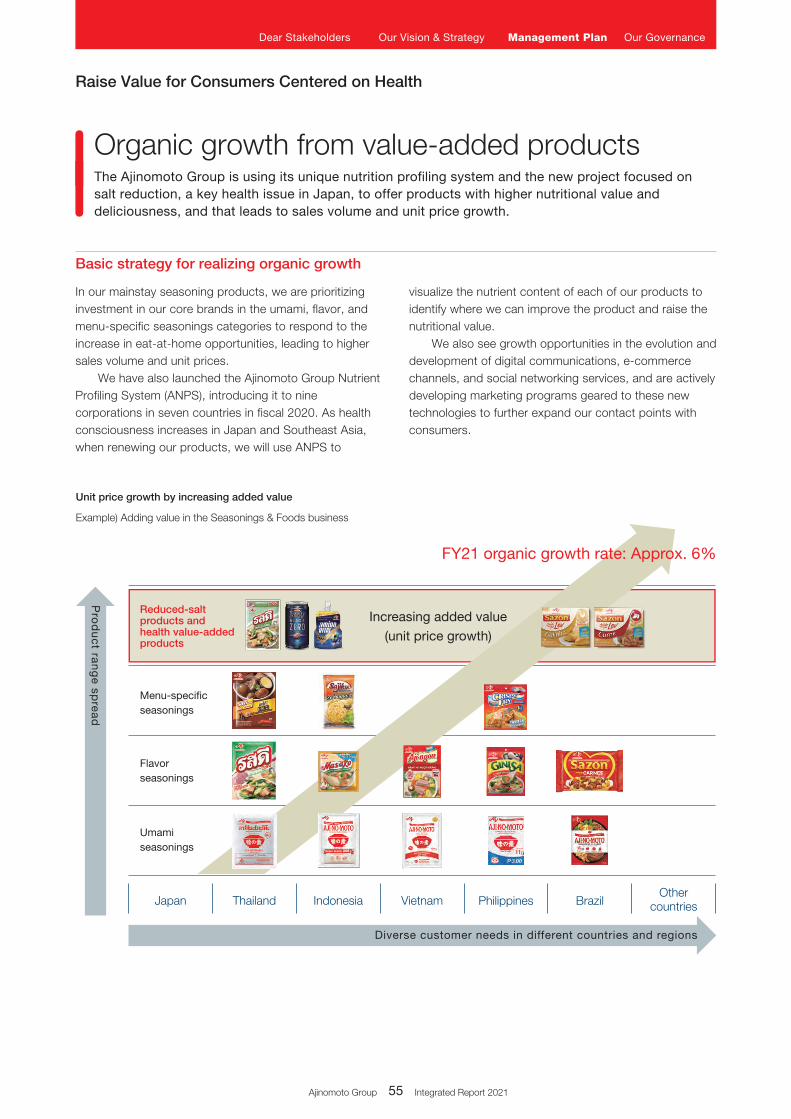
visualize the nutrient content of each of our products to identify where we can improve the product and raise the nutritional value.
We also see growth opportunities in the evolution and development of digital communications, e-commerce channels, and social networking services, and are actively developing marketing programs geared to these new technologies to further expand our contact points with consumers.
In our mainstay seasoning products, we are prioritizing investment in our core brands in the umami, flavor, and menu-specific seasonings categories to respond to the increase in eat-at-home opportunities, leading to higher sales volume and unit prices.
We have also launched the Ajinomoto Group Nutrient Profiling System (ANPS), introducing it to nine corporations in seven countries in fiscal 2020. As health consciousness increases in Japan and Southeast Asia, when renewing our products, we will use ANPS to
Raise Value for Consumers Centered on Health
Organic growth from value-added productsThe Ajinomoto Group is using its unique nutrition profiling system and the new project focused on salt reduction, a key health issue in Japan, to offer products with higher nutritional value and deliciousness, and that leads to sales volume and unit price growth.
Basic strategy for realizing organic growth
Ajinomoto Group 55 Integrated Report 2021
Dear Stakeholders Our Vision & Strategy Management Plan Our Governance
Smart Saltproducts promoting
“delicious salt reduction”
Offering delicious low-salt recipes
using umamiand dashi
Masako®
(flavor seasoning)
Indonesia
Caldo SAZÓN® Light(flavor seasoning)
Brazil
Taking the reduced-salt initiative global
Ros Dee®
Less sodium(flavor seasoning)
Yum Yum Sood Ded Minced pork flavor(instant noodle)
Thailand
Bizim Mutfak® 25% Less Salt Ezogelin Soup
Bizim Mutfak® 25% Less Salt Chicken Bouillon
Turkey
Example) Adding value in the Seasonings & Foods business
Umami seasonings
Flavor seasonings
Menu-specific seasonings
Pro
du
ct ra
ng
e sp
rea
d
Diverse customer needs in different countries and regions
Reduced-salt products and health value-added products
Japan Thailand Indonesia Vietnam Philippines BrazilOther
countries
FY21 organic growth rate: Approx. 6%
Unit price growth by increasing added value
Aji-no-mix® Breading mix Apanado(menu-specific seasoning)
Aji-no-men® Tallarin Red(instant noodle)
Peru
Increasing added value(unit price growth)
VONO®
Chef Onion Cream with Reduced Sodium
(soup)
Promotion of reduced salt through owned media
Global
Excess salt intake is a well-known health issue in Japan. Nevertheless, even though people are aware of the importance of reducing salt consumption, many find it difficult to do. The main reason is because the common perception is that reducing seasonings to reduce salt intake makes dishes sacrifice flavor and makes dishes taste bland. Our Smart Salt project seeks to provide information about how to use umami and flavor seasonings to make “delicious, healthy, easy, and new
salt reduction” dishes.The Smart Salt project offers reduced-salt recipes via
online videos and owned media as well as through local ecosystems engaging governments, communities, retailers, and the media. We are developing activities in Japan to increase the number of people who enjoy a low-sodium intake diet, and coupling this with customer development and marketing activities to create a “Japan model” for delicious, low-salt food consumption.
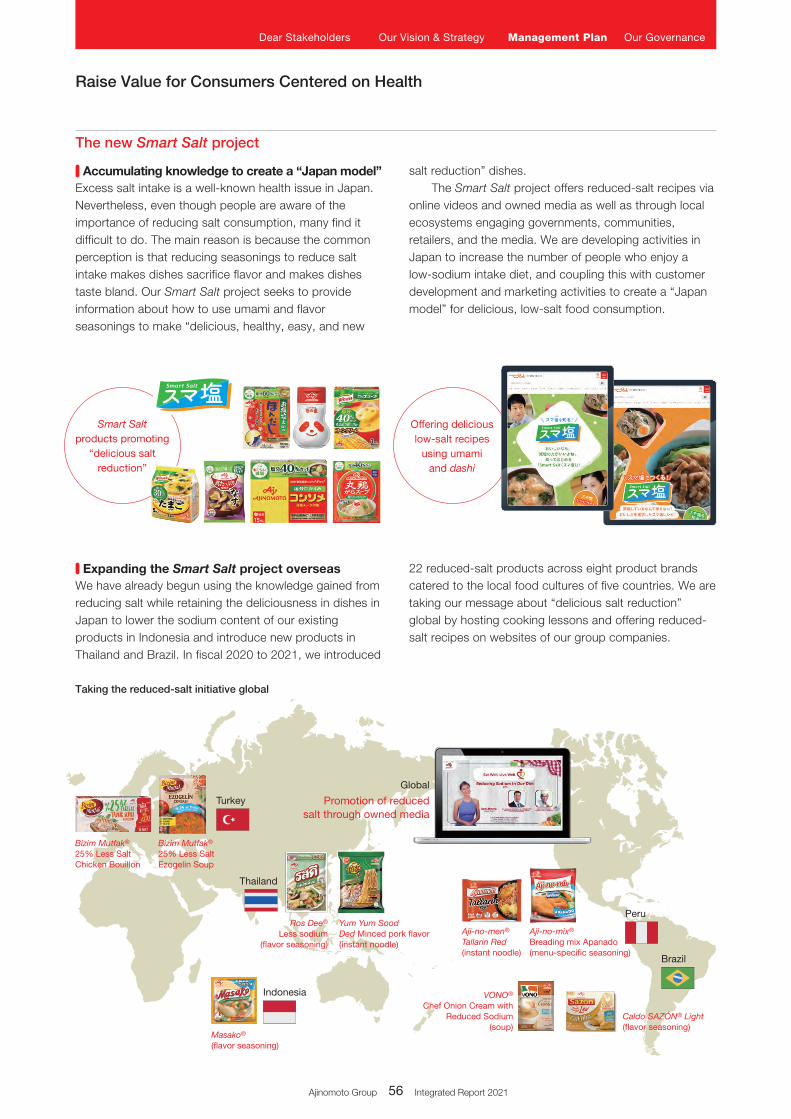
We have already begun using the knowledge gained from reducing salt while retaining the deliciousness in dishes in Japan to lower the sodium content of our existing products in Indonesia and introduce new products in Thailand and Brazil. In fiscal 2020 to 2021, we introduced
22 reduced-salt products across eight product brands catered to the local food cultures of five countries. We are taking our message about “delicious salt reduction” global by hosting cooking lessons and offering reduced-salt recipes on websites of our group companies.
Raise Value for Consumers Centered on Health
The new Smart Salt project
Accumulating knowledge to create a “Japan model”
Expanding the Smart Salt project overseas
Ajinomoto Group 55 Integrated Report 2021 Ajinomoto Group 56 Integrated Report 2021
Dear Stakeholders Our Vision & Strategy Management Plan Our Governance
The engagement of employees in creating customer value is indispensable to enhancing the Ajinomoto Group’s corporate value. Using the operational excellence (OE)*1 method, we set organizational and individual goals of
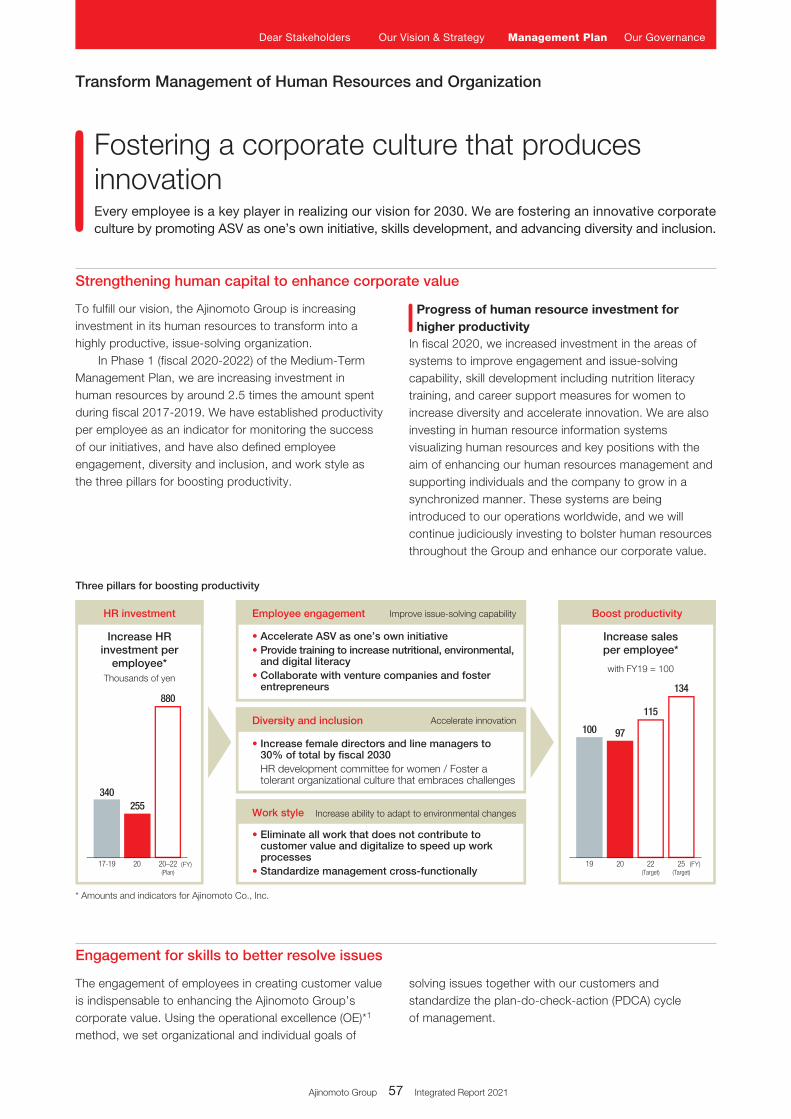
To fulfill our vision, the Ajinomoto Group is increasing investment in its human resources to transform into a highly productive, issue-solving organization.
In Phase 1 (fiscal 2020-2022) of the Medium-Term Management Plan, we are increasing investment in human resources by around 2.5 times the amount spent during fiscal 2017-2019. We have established productivity per employee as an indicator for monitoring the success of our initiatives, and have also defined employee engagement, diversity and inclusion, and work style as the three pillars for boosting productivity.
solving issues together with our customers and standardize the plan-do-check-action (PDCA) cycle of management.
Transform Management of Human Resources and Organization
Three pillars for boosting productivity
HR investment
Increase HRinvestment per
employee*Thousands of yen
Boost productivity
Increase salesper employee*
with FY19 = 100
Employee engagement Improve issue-solving capability
• Accelerate ASV as one’s own initiative• Provide training to increase nutritional, environmental,
and digital literacy• Collaborate with venture companies and foster
entrepreneurs
Diversity and inclusion Accelerate innovation
• Increase female directors and line managers to 30% of total by fiscal 2030HR development committee for women / Foster a tolerant organizational culture that embraces challenges
Work style Increase ability to adapt to environmental changes
• Eliminate all work that does not contribute to customer value and digitalize to speed up work processes
• Standardize management cross-functionally2017-19
255
880
340
20–22(Plan)
(FY) (FY)20 22(Target)
25(Target)
97
115
134
19
100
In fiscal 2020, we increased investment in the areas of systems to improve engagement and issue-solving capability, skill development including nutrition literacy training, and career support measures for women to increase diversity and accelerate innovation. We are also investing in human resource information systems visualizing human resources and key positions with the aim of enhancing our human resources management and supporting individuals and the company to grow in a synchronized manner. These systems are being introduced to our operations worldwide, and we will continue judiciously investing to bolster human resources throughout the Group and enhance our corporate value.
* Amounts and indicators for Ajinomoto Co., Inc.
Fostering a corporate culture that produces innovationEvery employee is a key player in realizing our vision for 2030. We are fostering an innovative corporate culture by promoting ASV as one’s own initiative, skills development, and advancing diversity and inclusion.
Strengthening human capital to enhance corporate value
Engagement for skills to better resolve issues
Progress of human resource investment for higher productivity
Ajinomoto Group 57 Integrated Report 2021
Dear Stakeholders Our Vision & Strategy Management Plan Our Governance
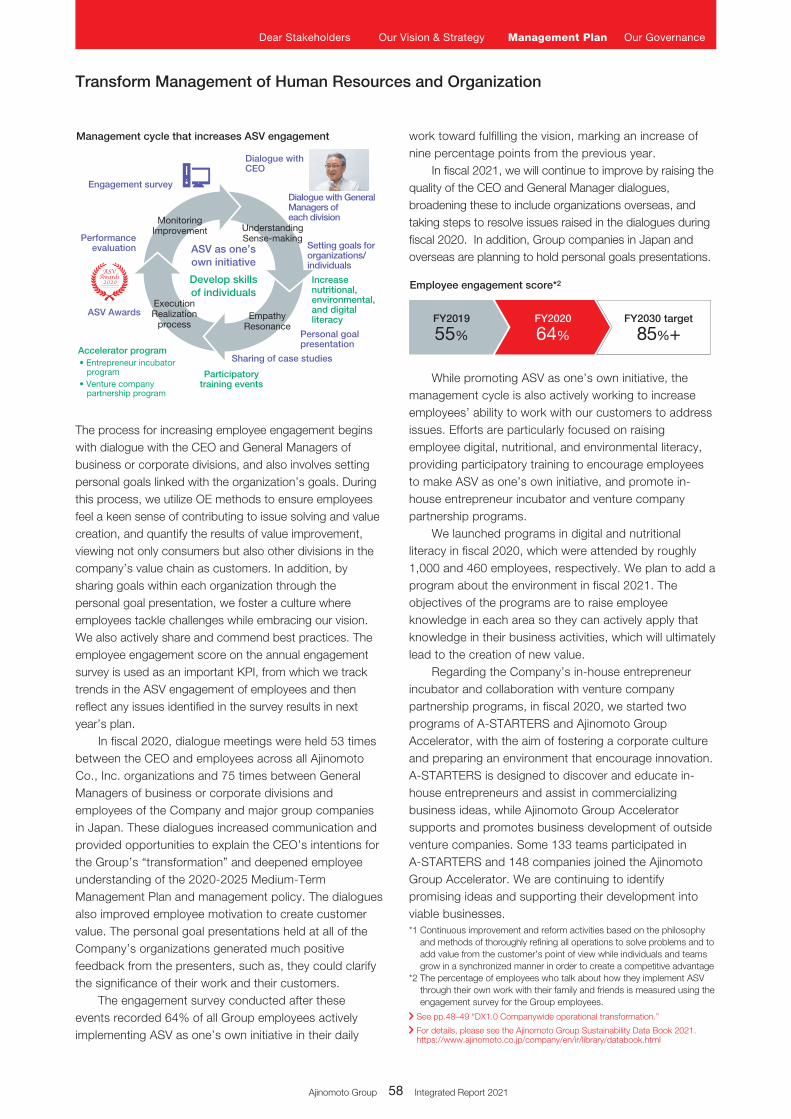
The process for increasing employee engagement begins with dialogue with the CEO and General Managers of business or corporate divisions, and also involves setting personal goals linked with the organization’s goals. During this process, we utilize OE methods to ensure employees feel a keen sense of contributing to issue solving and value creation, and quantify the results of value improvement, viewing not only consumers but also other divisions in the company’s value chain as customers. In addition, by sharing goals within each organization through the personal goal presentation, we foster a culture where employees tackle challenges while embracing our vision. We also actively share and commend best practices. The employee engagement score on the annual engagement survey is used as an important KPI, from which we track trends in the ASV engagement of employees and then reflect any issues identified in the survey results in next year’s plan.
In fiscal 2020, dialogue meetings were held 53 times between the CEO and employees across all Ajinomoto Co., Inc. organizations and 75 times between General Managers of business or corporate divisions and employees of the Company and major group companies in Japan. These dialogues increased communication and provided opportunities to explain the CEO’s intentions for the Group’s “transformation” and deepened employee understanding of the 2020-2025 Medium-Term Management Plan and management policy. The dialogues also improved employee motivation to create customer value. The personal goal presentations held at all of the Company’s organizations generated much positive feedback from the presenters, such as, they could clarify the significance of their work and their customers.
The engagement survey conducted after these events recorded 64% of all Group employees actively implementing ASV as one’s own initiative in their daily
work toward fulfilling the vision, marking an increase of nine percentage points from the previous year.
In fiscal 2021, we will continue to improve by raising the quality of the CEO and General Manager dialogues, broadening these to include organizations overseas, and taking steps to resolve issues raised in the dialogues during fiscal 2020. In addition, Group companies in Japan and overseas are planning to hold personal goals presentations.
While promoting ASV as one’s own initiative, the management cycle is also actively working to increase employees’ ability to work with our customers to address issues. Efforts are particularly focused on raising employee digital, nutritional, and environmental literacy, providing participatory training to encourage employees to make ASV as one’s own initiative, and promote in-house entrepreneur incubator and venture company partnership programs.
We launched programs in digital and nutritional literacy in fiscal 2020, which were attended by roughly 1,000 and 460 employees, respectively. We plan to add a program about the environment in fiscal 2021. The objectives of the programs are to raise employee knowledge in each area so they can actively apply that knowledge in their business activities, which will ultimately lead to the creation of new value.
Regarding the Company’s in-house entrepreneur incubator and collaboration with venture company partnership programs, in fiscal 2020, we started two programs of A-STARTERS and Ajinomoto Group Accelerator, with the aim of fostering a corporate culture and preparing an environment that encourage innovation. A-STARTERS is designed to discover and educate in-house entrepreneurs and assist in commercializing business ideas, while Ajinomoto Group Accelerator supports and promotes business development of outside venture companies. Some 133 teams participated in A-STARTERS and 148 companies joined the Ajinomoto Group Accelerator. We are continuing to identify promising ideas and supporting their development into viable businesses.
Transform Management of Human Resources and Organization
Management cycle that increases ASV engagement
• Entrepreneur incubator program• Venture company partnership program
Sharing of case studies
Engagement survey
Personal goal presentation
Participatorytraining events
Dialogue with CEO
Setting goals for organizations/individuals
Dialogue with General Managers ofeach division
Increase nutritional, environmental,and digital literacy
ASV Awards
Performanceevaluation
Accelerator program
ASV as one’sown initiative
Develop skillsof individuals
UnderstandingSense-making
EmpathyResonance
ExecutionRealization
process
MonitoringImprovement
Employee engagement score*2
FY2019
55%FY2020
64%FY2030 target
85%+
*1 Continuous improvement and reform activities based on the philosophy and methods of thoroughly refining all operations to solve problems and to add value from the customer’s point of view while individuals and teams grow in a synchronized manner in order to create a competitive advantage
*2 The percentage of employees who talk about how they implement ASV through their own work with their family and friends is measured using the engagement survey for the Group employees.
See pp.48–49 “DX1.0 Companywide operational transformation.”
For details, please see the Ajinomoto Group Sustainability Data Book 2021.https://www.ajinomoto.co.jp/company/en/ir/library/databook.html
Ajinomoto Group 57 Integrated Report 2021 Ajinomoto Group 58 Integrated Report 2021
Dear Stakeholders Our Vision & Strategy Management Plan Our Governance
ASV Awards recognizing the best practices in realizing ASV
Transform Management of Human Resources and Organization
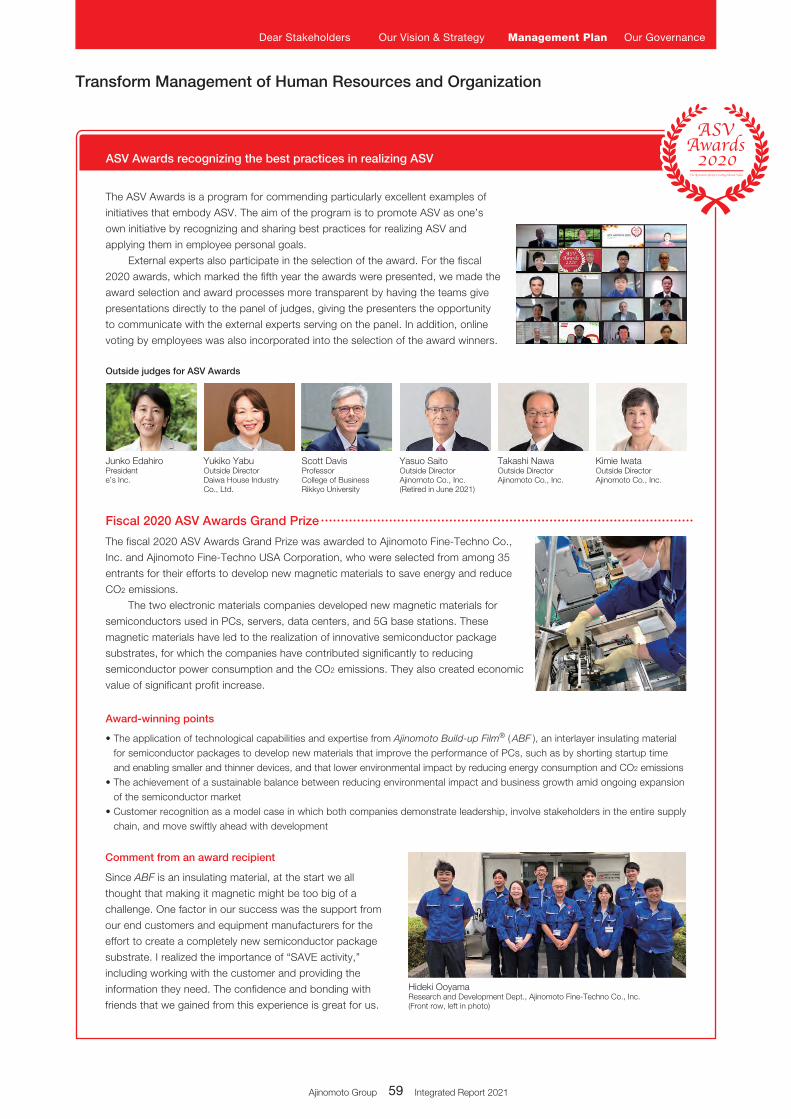
Outside judges for ASV Awards
Junko EdahiroPresident e’s Inc.
Scott DavisProfessorCollege of BusinessRikkyo University
Takashi NawaOutside DirectorAjinomoto Co., Inc.
Yukiko YabuOutside DirectorDaiwa House Industry Co., Ltd.
Yasuo SaitoOutside Director Ajinomoto Co., Inc.(Retired in June 2021)
Kimie IwataOutside DirectorAjinomoto Co., Inc.
The ASV Awards is a program for commending particularly excellent examples of
initiatives that embody ASV. The aim of the program is to promote ASV as one’s
own initiative by recognizing and sharing best practices for realizing ASV and
applying them in employee personal goals.
External experts also participate in the selection of the award. For the fiscal
2020 awards, which marked the fifth year the awards were presented, we made the
award selection and award processes more transparent by having the teams give
presentations directly to the panel of judges, giving the presenters the opportunity
to communicate with the external experts serving on the panel. In addition, online
voting by employees was also incorporated into the selection of the award winners.
• The application of technological capabilities and expertise from Ajinomoto Build-up Film® ( ABF ), an interlayer insulating material for semiconductor packages to develop new materials that improve the performance of PCs, such as by shorting startup time and enabling smaller and thinner devices, and that lower environmental impact by reducing energy consumption and CO2 emissions
• The achievement of a sustainable balance between reducing environmental impact and business growth amid ongoing expansion of the semiconductor market
• Customer recognition as a model case in which both companies demonstrate leadership, involve stakeholders in the entire supply chain, and move swiftly ahead with development
Award-winning points
The fiscal 2020 ASV Awards Grand Prize was awarded to Ajinomoto Fine-Techno Co.,
Inc. and Ajinomoto Fine-Techno USA Corporation, who were selected from among 35
entrants for their efforts to develop new magnetic materials to save energy and reduce
CO2 emissions.
The two electronic materials companies developed new magnetic materials for
semiconductors used in PCs, servers, data centers, and 5G base stations. These
magnetic materials have led to the realization of innovative semiconductor package
substrates, for which the companies have contributed significantly to reducing
semiconductor power consumption and the CO2 emissions. They also created economic
value of significant profit increase.
Fiscal 2020 ASV Awards Grand Prize
Since ABF is an insulating material, at the start we all
thought that making it magnetic might be too big of a
challenge. One factor in our success was the support from
our end customers and equipment manufacturers for the
effort to create a completely new semiconductor package
substrate. I realized the importance of “SAVE activity,”
including working with the customer and providing the
information they need. The confidence and bonding with
friends that we gained from this experience is great for us.
Comment from an award recipient
Hideki OoyamaResearch and Development Dept., Ajinomoto Fine-Techno Co., Inc.(Front row, left in photo)
Ajinomoto Group 59 Integrated Report 2021
Dear Stakeholders Our Vision & Strategy Management Plan Our Governance
Transform Management of Human Resources and Organization
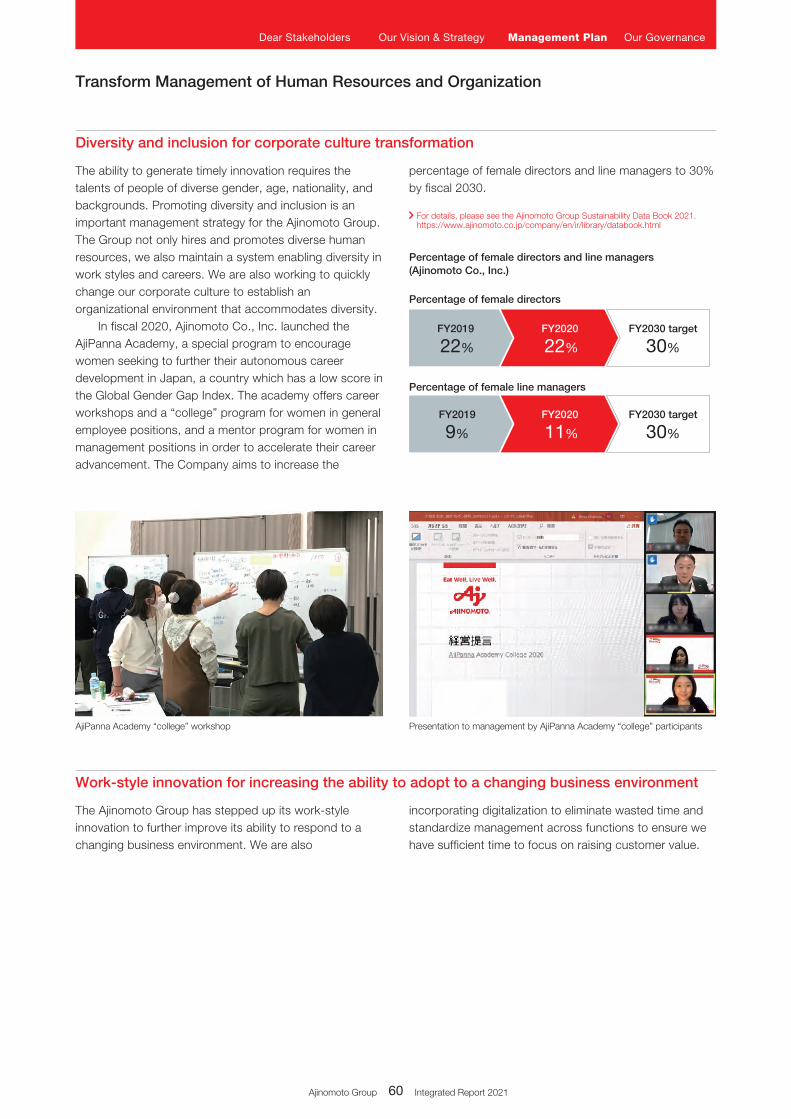
The ability to generate timely innovation requires the talents of people of diverse gender, age, nationality, and backgrounds. Promoting diversity and inclusion is an important management strategy for the Ajinomoto Group. The Group not only hires and promotes diverse human resources, we also maintain a system enabling diversity in work styles and careers. We are also working to quickly change our corporate culture to establish an organizational environment that accommodates diversity.
In fiscal 2020, Ajinomoto Co., Inc. launched the AjiPanna Academy, a special program to encourage women seeking to further their autonomous career development in Japan, a country which has a low score in the Global Gender Gap Index. The academy offers career workshops and a “college” program for women in general employee positions, and a mentor program for women in management positions in order to accelerate their career advancement. The Company aims to increase the
The Ajinomoto Group has stepped up its work-style innovation to further improve its ability to respond to a changing business environment. We are also
percentage of female directors and line managers to 30% by fiscal 2030.
incorporating digitalization to eliminate wasted time and standardize management across functions to ensure we have sufficient time to focus on raising customer value.
Percentage of female directors and line managers (Ajinomoto Co., Inc.)
Percentage of female directors
FY2019
9%
FY2020
11%
FY2030 target
30%
FY2019
22%
FY2020
22%
FY2030 target
30%
Percentage of female line managers
Presentation to management by AjiPanna Academy “college” participantsAjiPanna Academy “college” workshop
Diversity and inclusion for corporate culture transformation
Work-style innovation for increasing the ability to adopt to a changing business environment
For details, please see the Ajinomoto Group Sustainability Data Book 2021.https://www.ajinomoto.co.jp/company/en/ir/library/databook.html
Ajinomoto Group 59 Integrated Report 2021 Ajinomoto Group 60 Integrated Report 2021
Dear Stakeholders Our Vision & Strategy Management Plan Our Governance
Using big data to find solutions
Understand the relationship between diet (nutrition) and physical and mental health related
to healthy life expectancy
Diet (nutrition)• Food intake• Eating behavior
Physical health• Lifestyle-related diseases
(metabolic syndrome, hypertension, obesity, diabetes)
• Locomotive syndrome• Others (immunity, sleep,
exercise habits)
Mental health• State of mind • Health management• Stress (mental fatigue)• Cognitive function
(forgetfulness, memory loss)
Create digital risk screening with “AminoIndex technology”
Create food andhealth ecosystems
Diet (nutrition) AIRS®*
Suggest dietary improvements
Tracking Propose solutions
Utilizebig data
HirosakiCOI
Fact-finding
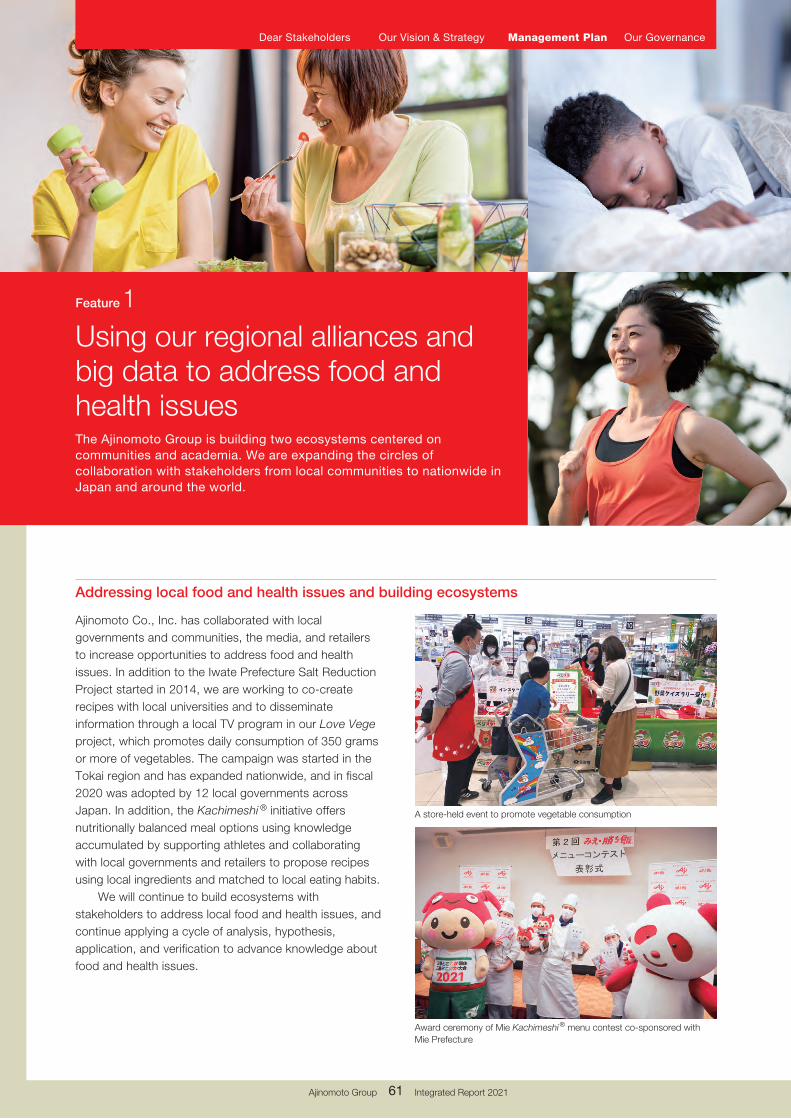
Ajinomoto Co., Inc. has collaborated with local governments and communities, the media, and retailers to increase opportunities to address food and health issues. In addition to the Iwate Prefecture Salt Reduction Project started in 2014, we are working to co-create recipes with local universities and to disseminate information through a local TV program in our Love Vege project, which promotes daily consumption of 350 grams or more of vegetables. The campaign was started in the Tokai region and has expanded nationwide, and in fiscal 2020 was adopted by 12 local governments across Japan. In addition, the Kachimeshi ® initiative offers nutritionally balanced meal options using knowledge accumulated by supporting athletes and collaborating with local governments and retailers to propose recipes using local ingredients and matched to local eating habits.
We will continue to build ecosystems with stakeholders to address local food and health issues, and continue applying a cycle of analysis, hypothesis, application, and verification to advance knowledge about food and health issues.
Feature 1
Using our regional alliances and big data to address food and health issuesThe Ajinomoto Group is building two ecosystems centered on communities and academia. We are expanding the circles of collaboration with stakeholders from local communities to nationwide in Japan and around the world.
Award ceremony of Mie Kachimeshi® menu contest co-sponsored with Mie Prefecture
A store-held event to promote vegetable consumption
Addressing local food and health issues and building ecosystems
Ajinomoto Group 61 Integrated Report 2021
Dear Stakeholders Our Vision & Strategy Management Plan Our Governance
Using big data to find solutions
Understand the relationship between diet (nutrition) and physical and mental health related
to healthy life expectancy
Diet (nutrition)• Food intake• Eating behavior
Physical health• Lifestyle-related diseases
(metabolic syndrome, hypertension, obesity, diabetes)
• Locomotive syndrome• Others (immunity, sleep,
exercise habits)
Mental health• State of mind • Health management• Stress (mental fatigue)• Cognitive function
(forgetfulness, memory loss)
Create digital risk screening with “AminoIndex technology”
Create food andhealth ecosystems
Diet (nutrition) AIRS®*
Suggest dietary improvements
Tracking Propose solutions
Utilizebig data
HirosakiCOI
Fact-finding
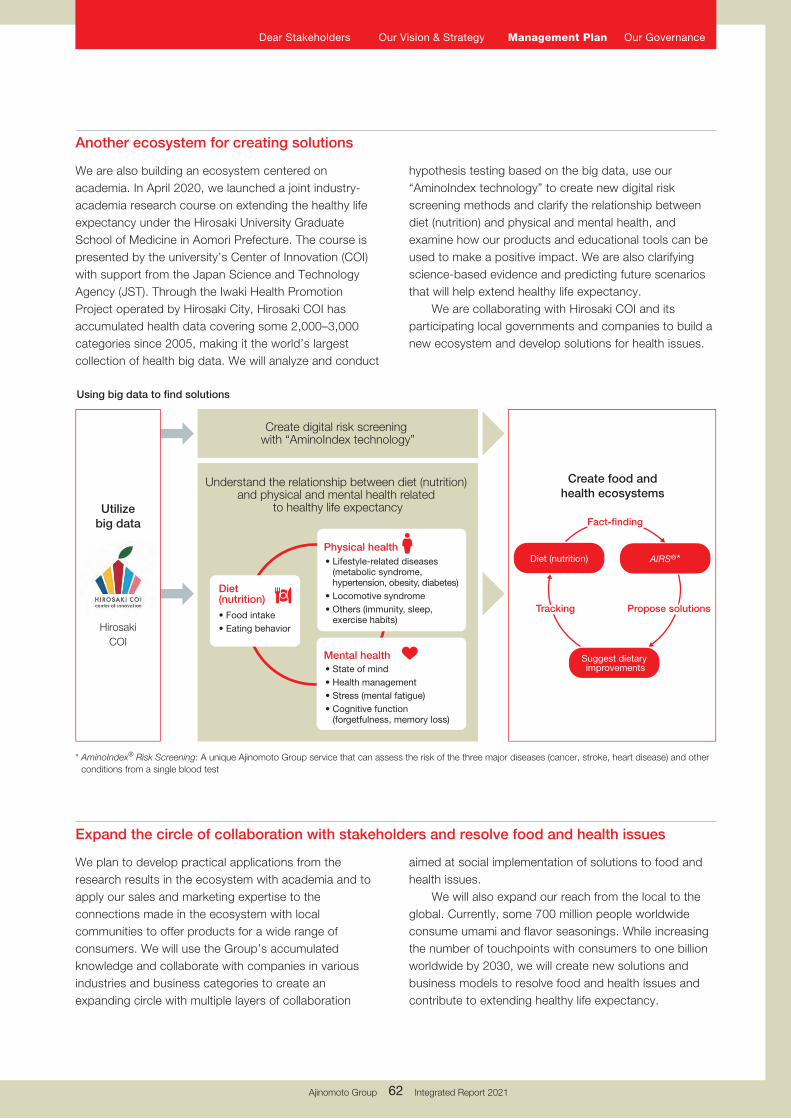
We are also building an ecosystem centered on academia. In April 2020, we launched a joint industry-academia research course on extending the healthy life expectancy under the Hirosaki University Graduate School of Medicine in Aomori Prefecture. The course is presented by the university’s Center of Innovation (COI) with support from the Japan Science and Technology Agency (JST). Through the Iwaki Health Promotion Project operated by Hirosaki City, Hirosaki COI has accumulated health data covering some 2,000–3,000 categories since 2005, making it the world’s largest collection of health big data. We will analyze and conduct
We plan to develop practical applications from the research results in the ecosystem with academia and to apply our sales and marketing expertise to the connections made in the ecosystem with local communities to offer products for a wide range of consumers. We will use the Group’s accumulated knowledge and collaborate with companies in various industries and business categories to create an expanding circle with multiple layers of collaboration
hypothesis testing based on the big data, use our “AminoIndex technology” to create new digital risk screening methods and clarify the relationship between diet (nutrition) and physical and mental health, and examine how our products and educational tools can be used to make a positive impact. We are also clarifying science-based evidence and predicting future scenarios that will help extend healthy life expectancy.
We are collaborating with Hirosaki COI and its participating local governments and companies to build a new ecosystem and develop solutions for health issues.
aimed at social implementation of solutions to food and health issues.
We will also expand our reach from the local to the global. Currently, some 700 million people worldwide consume umami and flavor seasonings. While increasing the number of touchpoints with consumers to one billion worldwide by 2030, we will create new solutions and business models to resolve food and health issues and contribute to extending healthy life expectancy.
* AminoIndex® Risk Screening: A unique Ajinomoto Group service that can assess the risk of the three major diseases (cancer, stroke, heart disease) and other conditions from a single blood test
Another ecosystem for creating solutions
Expand the circle of collaboration with stakeholders and resolve food and health issues
Ajinomoto Group 61 Integrated Report 2021 Ajinomoto Group 62 Integrated Report 2021
Dear Stakeholders Our Vision & Strategy Management Plan Our Governance
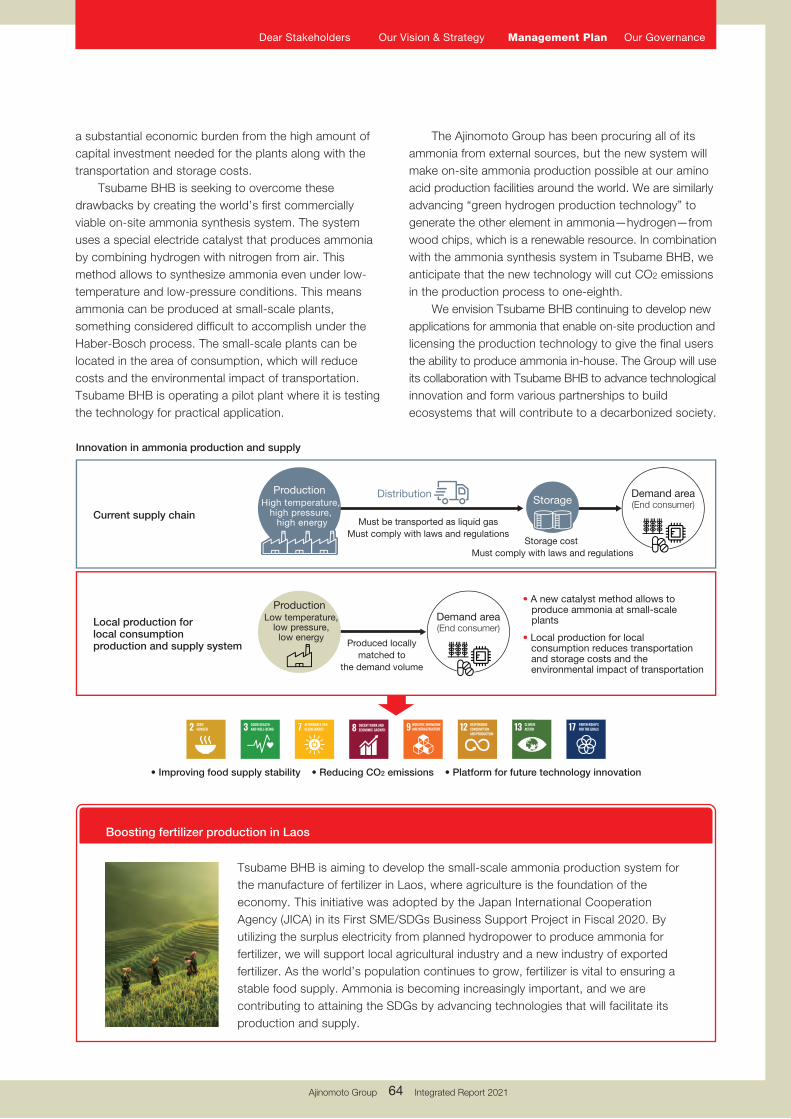
Innovation in ammonia production and supply
ProductionHigh temperature,
high pressure, high energy Must be transported as liquid gas
Must comply with laws and regulations
Produced locallymatched to
the demand volume
Storage cost Must comply with laws and regulations
Current supply chain
Local production for local consumption production and supply system
• Improving food supply stability • Reducing CO2 emissions • Platform for future technology innovation
• A new catalyst method allows to produce ammonia at small-scale plants
• Local production for local consumption reduces transportation and storage costs and the environmental impact of transportation
DistributionStorage
ProductionLow temperature,
low pressure,low energy
Demand area(End consumer)
Demand area(End consumer)
Ammonia is a widely used raw material in chemical fertilizers for agriculture, chemicals used in synthetic fibers and resins, and pharmaceuticals. Demand for ammonia has also been growing in recent years in the energy industry, which uses it in two main ways. The first is as an energy carrier for hydrogen. Hydrogen is a clean energy alternative to fossil fuels, but in gas form it cannot be transported or stored in large quantities and requires an “energy carrier” to transport and store hydrogen as a liquid or hydrogen compound. Ammonia is a promising candidate as an energy carrier for hydrogen. The rising tide of environmental measures around the world is creating growing demand for both hydrogen and ammonia.
The Ajinomoto Group uses ammonia as a sub raw material in the fermentation process for amino acids. In 2017, we established Tsubame BHB Co., Ltd. with Honorary and Institute Professor Hideo Hosono of the Tokyo Institute of Technology to develop technology for constructing production and supply systems for locally produced and locally consumed ammonia.
Ammonia is commonly produced through the Haber-
The second way the energy industry is using ammonia is as a fuel itself. As with hydrogen, ammonia is expected to be a key next-generation energy because it does not emit CO2 when burned. The Ministry of Economy, Trade and Industry “Green Growth Strategy” of December 2020 set the introduction of fuel ammonia as a key component in Japan’s future energy sector. Testing is currently under way to reduce CO2 emissions through co-combustion of ammonia- and coal-fired power generation, and technology is also advancing for power generation using only ammonia. Ammonia is attracting increasing attention as a solution for realizing decarbonization.
Bosch process, which uses natural gas. The chemical reaction needed for this process requires high temperature and high pressure, making it only viable to produce in large plants. This process produces significant CO2 emissions, and the environmental footprint grows further when adding emissions from the ships and dedicated heavy-duty vehicles needed to transport the ammonia to the final destination. This system also carries
Ammonia, a leading candidate as a hydrogen energy carrier
A revolutionary production and supply system for green innovation
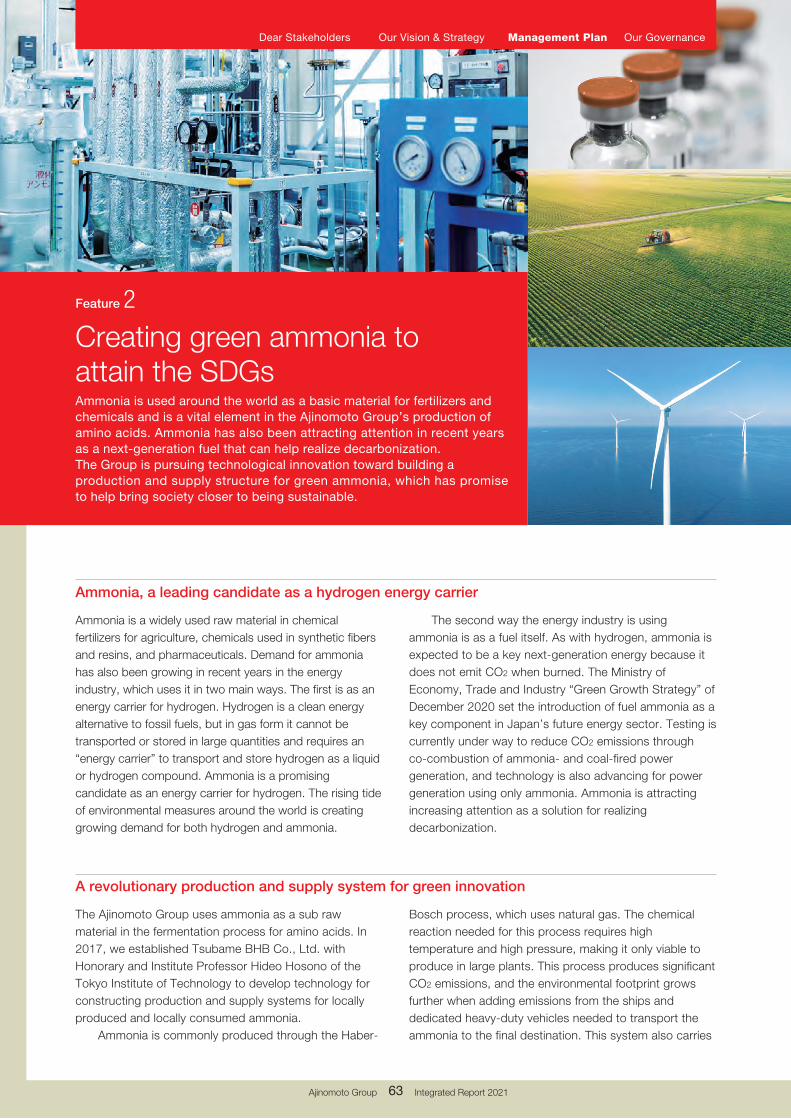
Creating green ammonia to attain the SDGs
Feature 2
Ammonia is used around the world as a basic material for fertilizers and chemicals and is a vital element in the Ajinomoto Group’s production of amino acids. Ammonia has also been attracting attention in recent years as a next-generation fuel that can help realize decarbonization.The Group is pursuing technological innovation toward building a production and supply structure for green ammonia, which has promise to help bring society closer to being sustainable.
Ajinomoto Group 63 Integrated Report 2021
Dear Stakeholders Our Vision & Strategy Management Plan Our Governance
Innovation in ammonia production and supply
ProductionHigh temperature,
high pressure, high energy Must be transported as liquid gas
Must comply with laws and regulations
Produced locallymatched to
the demand volume
Storage cost Must comply with laws and regulations
Current supply chain
Local production for local consumption production and supply system
• Improving food supply stability • Reducing CO2 emissions • Platform for future technology innovation
• A new catalyst method allows to produce ammonia at small-scale plants
• Local production for local consumption reduces transportation and storage costs and the environmental impact of transportation
DistributionStorage
ProductionLow temperature,
low pressure,low energy
Demand area(End consumer)
Demand area(End consumer)
a substantial economic burden from the high amount of capital investment needed for the plants along with the transportation and storage costs.
Tsubame BHB is seeking to overcome these drawbacks by creating the world’s first commercially viable on-site ammonia synthesis system. The system uses a special electride catalyst that produces ammonia by combining hydrogen with nitrogen from air. This method allows to synthesize ammonia even under low-temperature and low-pressure conditions. This means ammonia can be produced at small-scale plants, something considered difficult to accomplish under the Haber-Bosch process. The small-scale plants can be located in the area of consumption, which will reduce costs and the environmental impact of transportation. Tsubame BHB is operating a pilot plant where it is testing the technology for practical application.
The Ajinomoto Group has been procuring all of its ammonia from external sources, but the new system will make on-site ammonia production possible at our amino acid production facilities around the world. We are similarly advancing “green hydrogen production technology” to generate the other element in ammonia—hydrogen—from wood chips, which is a renewable resource. In combination with the ammonia synthesis system in Tsubame BHB, we anticipate that the new technology will cut CO2 emissions in the production process to one-eighth.
We envision Tsubame BHB continuing to develop new applications for ammonia that enable on-site production and licensing the production technology to give the final users the ability to produce ammonia in-house. The Group will use its collaboration with Tsubame BHB to advance technological innovation and form various partnerships to build ecosystems that will contribute to a decarbonized society.
Boosting fertilizer production in Laos
Tsubame BHB is aiming to develop the small-scale ammonia production system for the manufacture of fertilizer in Laos, where agriculture is the foundation of the economy. This initiative was adopted by the Japan International Cooperation Agency (JICA) in its First SME/SDGs Business Support Project in Fiscal 2020. By utilizing the surplus electricity from planned hydropower to produce ammonia for fertilizer, we will support local agricultural industry and a new industry of exported fertilizer. As the world’s population continues to grow, fertilizer is vital to ensuring a stable food supply. Ammonia is becoming increasingly important, and we are contributing to attaining the SDGs by advancing technologies that will facilitate its production and supply.
Ajinomoto Group 63 Integrated Report 2021 Ajinomoto Group 64 Integrated Report 2021
Dear Stakeholders Our Vision & Strategy Management Plan Our Governance
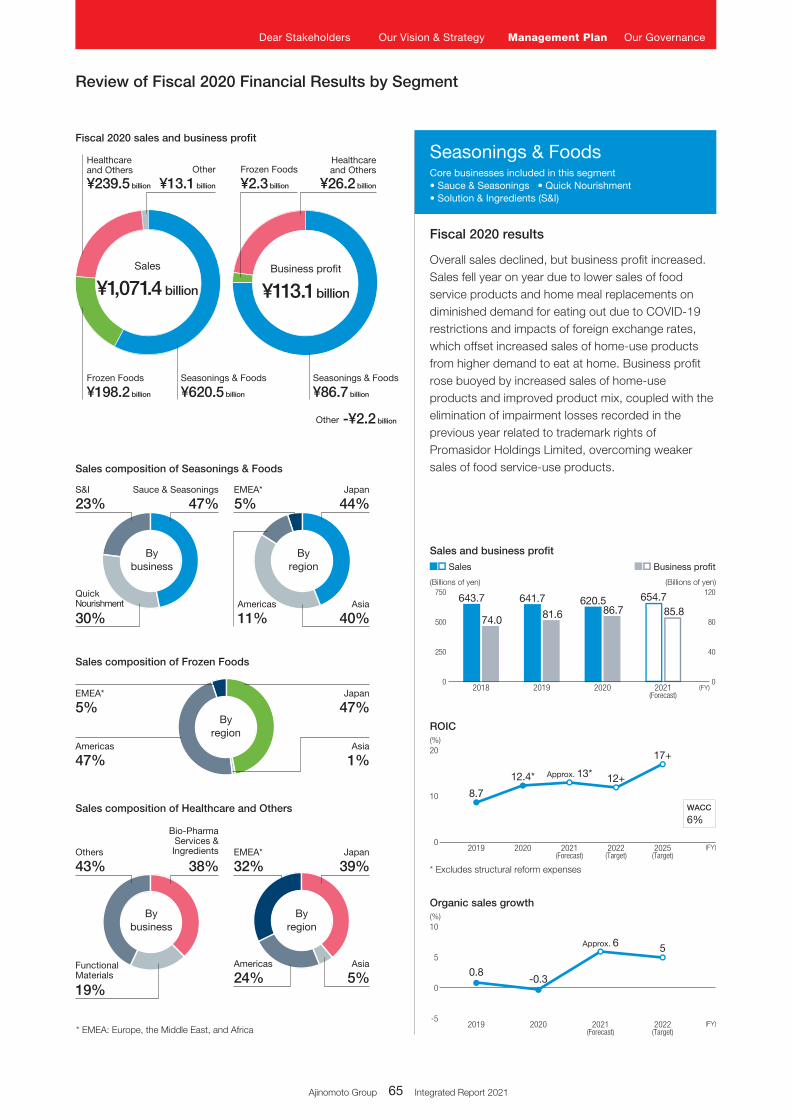
Sales Business pro�t Sales Business pro�t Sales Business pro�t
643.7 641.7 620.5
2018 2019 2020 2021(Forecast)
74.0 81.6 86.7654.7
85.8
0
250
500
750
0
40
80
120(Billions of yen) (Billions of yen)
(FY)
(Billions of yen) (Billions of yen)
243.2 239.5
2018 2020 2021(Forecast)
21.6
231.6
2019
19.5 26.2
231.3
29.2
0
100
200
300
0
40
80
120(Billions of yen) (Billions of yen)
(FY)
211.2 198.2
2019 2020 2021(Forecast)
2.3
213.0
2018
-1.8
208.2
2.4
0
120
240
-4
0
4
8
(FY)
0.0
¥620.5 billion
Seasonings & Foods
¥239.5 billion
Healthcareand Others
¥13.1 billion
Other
¥198.2 billion
Frozen Foods
Sales
¥1,071.4 billion
Business pro�t
¥113.1 billion
-¥2.2 billionOther
¥26.2 billion
Healthcareand Others
¥86.7 billion
Seasonings & Foods
¥2.3 billion
Frozen Foods
Seasonings & FoodsCore businesses included in this segment• Sauce & Seasonings • Quick Nourishment • Solution & Ingredients (S&I)
Healthcare and OthersCore businesses included in this segment• Healthcare • Electronic Materials
Frozen Foods
Fiscal 2020 results
Overall sales declined, but business profit increased. Sales fell year on year due to lower sales of food service products and home meal replacements on diminished demand for eating out due to COVID-19 restrictions and impacts of foreign exchange rates, which offset increased sales of home-use products from higher demand to eat at home. Business profit rose buoyed by increased sales of home-use products and improved product mix, coupled with the elimination of impairment losses recorded in the previous year related to trademark rights of Promasidor Holdings Limited, overcoming weaker sales of food service-use products.
S&I
23%Sauce & Seasonings
47%
Quick Nourishment
30%
Sales composition of Seasonings & Foods
* EMEA: Europe, the Middle East, and Africa
Sales composition of Frozen Foods
EMEA*
5%Japan
44%
Americas
11%Asia
40%
EMEA*
5%Japan
47%
Americas
47%Asia
1%
Fiscal 2020 results*
Overall sales and business profit both increased from the previous fiscal year. In the Bio-Pharma Services & Ingredients business, sales of amino acids for pharmaceuticals and foods increased, but declined largely for bio-pharma services, causing business profit to fall. In the Functional Materials business, however, both sales and business profit increased significantly mainly on strong sales of electronic materials. Others experienced a downturn in sales caused by weaker demand for sports nutrition and declining sales volume in animal nutrition, but business profit was up substantially over the previous year driven mainly by higher unit sales prices in animal nutrition.
Others
43%
Bio-PharmaServices &Ingredients
38%
FunctionalMaterials
19%
Sales composition of Healthcare and Others
EMEA*
32%Japan
39%
Americas
24%Asia
5%
Fiscal 2020 results
Overall sales declined, but business profit rose. Sales declined year on year owing to weaker sales of restaurant-use products, despite an increase in sales of home-use products underpinned by growing demand for eating at home. Business profit increased significantly driven by increased sales of home-use products, improved product mix, and the elimination of unprofitable items.
Bybusiness
By region
By business
By region
By region
Fiscal 2020 sales and business profit
* From fiscal 2021, the sub-segments of Healthcare and Others have been reclassified. All figures shown in pp.65–66 reflect this change.
12.4* Approx. 13*
1.2*
Approx. 7*0.6* Approx. 1*
Sales and business profit Sales and business profit Sales and business profit
20202019 2021 2022 2025
12+8.7
17+
(FY)(Target)(Target)(Forecast) (Forecast)
0
10
20(%)
ROIC
2019 2021 2022
0.8
Approx. 6 5
(FY)(Target)(Forecast)
-5
0
5
10(%)
Organic sales growth
2019 2021 2022 2025
0.8
2020
10+12+
(FY)0
10
20(%)
ROIC
2019 2021 2022-2.2
2020
3.5
Approx. 7
4
(FY)-5
0
5
10(%)
Organic sales growth
2019 2021 2022 2025
-0.3
2020
1+
5
(FY)(Target)(Target) (Forecast) (Target)(Target)
(Forecast) (Target)(Target)(Forecast)
-3
0
3
6(%)
ROIC
2019 2021 2022
1.1
2020
-5.0
Approx. 63
(FY)-7
0
7
14(%)
Organic sales growth
2020
-0.3
6%WACC
5%WACC
8%WACC
* Excludes structural reform expenses * Excludes structural reform expenses * Excludes structural reform expenses
Review of Fiscal 2020 Financial Results by Segment
Ajinomoto Group 65 Integrated Report 2021
Dear Stakeholders Our Vision & Strategy Management Plan Our Governance
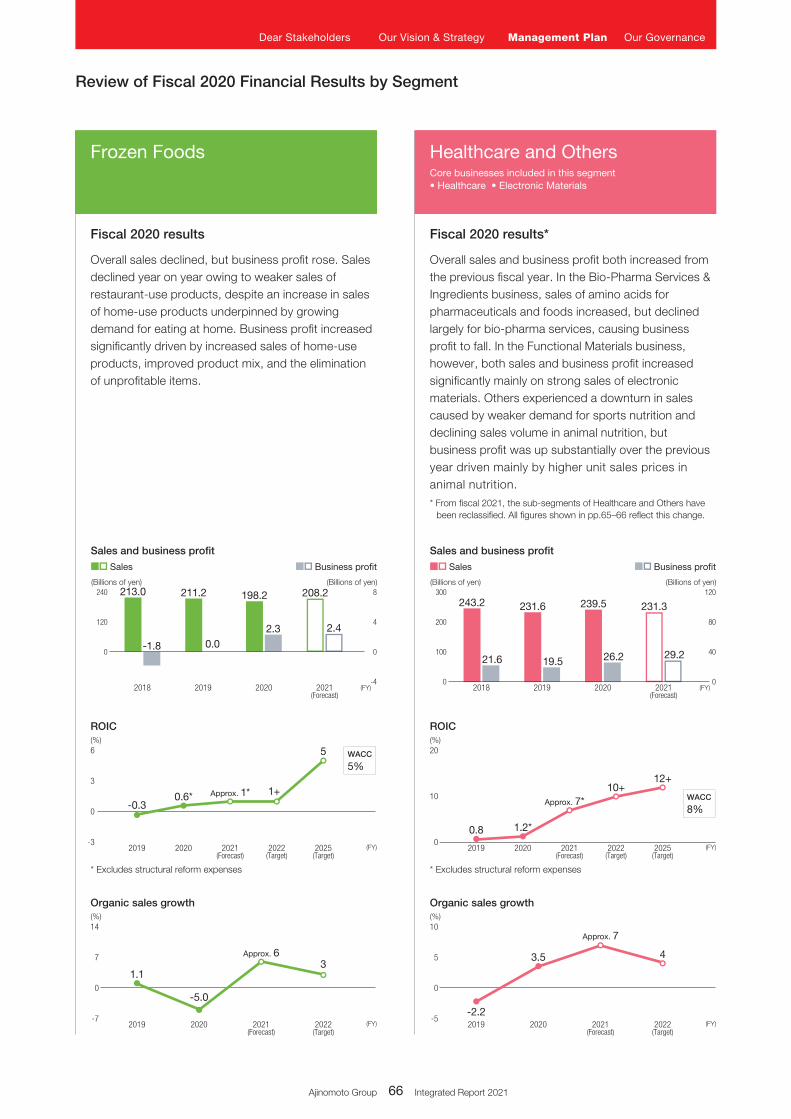
Sales Business pro�t Sales Business pro�t Sales Business pro�t
643.7 641.7 620.5
2018 2019 2020 2021(Forecast)
74.0 81.6 86.7654.7
85.8
0
250
500
750
0
40
80
120(Billions of yen) (Billions of yen)
(FY)
(Billions of yen) (Billions of yen)
243.2 239.5
2018 2020 2021(Forecast)
21.6
231.6
2019
19.5 26.2
231.3
29.2
0
100
200
300
0
40
80
120(Billions of yen) (Billions of yen)
(FY)
211.2 198.2
2019 2020 2021(Forecast)
2.3
213.0
2018
-1.8
208.2
2.4
0
120
240
-4
0
4
8
(FY)
0.0
¥620.5 billion
Seasonings & Foods
¥239.5 billion
Healthcareand Others
¥13.1 billion
Other
¥198.2 billion
Frozen Foods
Sales
¥1,071.4 billion
Business pro�t
¥113.1 billion
-¥2.2 billionOther
¥26.2 billion
Healthcareand Others
¥86.7 billion
Seasonings & Foods
¥2.3 billion
Frozen Foods
Seasonings & FoodsCore businesses included in this segment• Sauce & Seasonings • Quick Nourishment • Solution & Ingredients (S&I)
Healthcare and OthersCore businesses included in this segment• Healthcare • Electronic Materials
Frozen Foods
Fiscal 2020 results
Overall sales declined, but business profit increased. Sales fell year on year due to lower sales of food service products and home meal replacements on diminished demand for eating out due to COVID-19 restrictions and impacts of foreign exchange rates, which offset increased sales of home-use products from higher demand to eat at home. Business profit rose buoyed by increased sales of home-use products and improved product mix, coupled with the elimination of impairment losses recorded in the previous year related to trademark rights of Promasidor Holdings Limited, overcoming weaker sales of food service-use products.
S&I
23%Sauce & Seasonings
47%
Quick Nourishment
30%
Sales composition of Seasonings & Foods
* EMEA: Europe, the Middle East, and Africa
Sales composition of Frozen Foods
EMEA*
5%Japan
44%
Americas
11%Asia
40%
EMEA*
5%Japan
47%
Americas
47%Asia
1%
Fiscal 2020 results*
Overall sales and business profit both increased from the previous fiscal year. In the Bio-Pharma Services & Ingredients business, sales of amino acids for pharmaceuticals and foods increased, but declined largely for bio-pharma services, causing business profit to fall. In the Functional Materials business, however, both sales and business profit increased significantly mainly on strong sales of electronic materials. Others experienced a downturn in sales caused by weaker demand for sports nutrition and declining sales volume in animal nutrition, but business profit was up substantially over the previous year driven mainly by higher unit sales prices in animal nutrition.
Others
43%
Bio-PharmaServices &Ingredients
38%
FunctionalMaterials
19%
Sales composition of Healthcare and Others
EMEA*
32%Japan
39%
Americas
24%Asia
5%
Fiscal 2020 results
Overall sales declined, but business profit rose. Sales declined year on year owing to weaker sales of restaurant-use products, despite an increase in sales of home-use products underpinned by growing demand for eating at home. Business profit increased significantly driven by increased sales of home-use products, improved product mix, and the elimination of unprofitable items.
Bybusiness
By region
By business
By region
By region
Fiscal 2020 sales and business profit
* From fiscal 2021, the sub-segments of Healthcare and Others have been reclassified. All figures shown in pp.65–66 reflect this change.
12.4* Approx. 13*
1.2*
Approx. 7*0.6* Approx. 1*
Sales and business profit Sales and business profit Sales and business profit
20202019 2021 2022 2025
12+8.7
17+
(FY)(Target)(Target)(Forecast) (Forecast)
0
10
20(%)
ROIC
2019 2021 2022
0.8
Approx. 6 5
(FY)(Target)(Forecast)
-5
0
5
10(%)
Organic sales growth
2019 2021 2022 2025
0.8
2020
10+12+
(FY)0
10
20(%)
ROIC
2019 2021 2022-2.2
2020
3.5
Approx. 7
4
(FY)-5
0
5
10(%)
Organic sales growth
2019 2021 2022 2025
-0.3
2020
1+
5
(FY)(Target)(Target) (Forecast) (Target)(Target)
(Forecast) (Target)(Target)(Forecast)
-3
0
3
6(%)
ROIC
2019 2021 2022
1.1
2020
-5.0
Approx. 63
(FY)-7
0
7
14(%)
Organic sales growth
2020
-0.3
6%WACC
5%WACC
8%WACC
* Excludes structural reform expenses * Excludes structural reform expenses * Excludes structural reform expenses
Review of Fiscal 2020 Financial Results by Segment
Ajinomoto Group 65 Integrated Report 2021 Ajinomoto Group 66 Integrated Report 2021
Dear Stakeholders Our Vision & Strategy Management Plan Our Governance
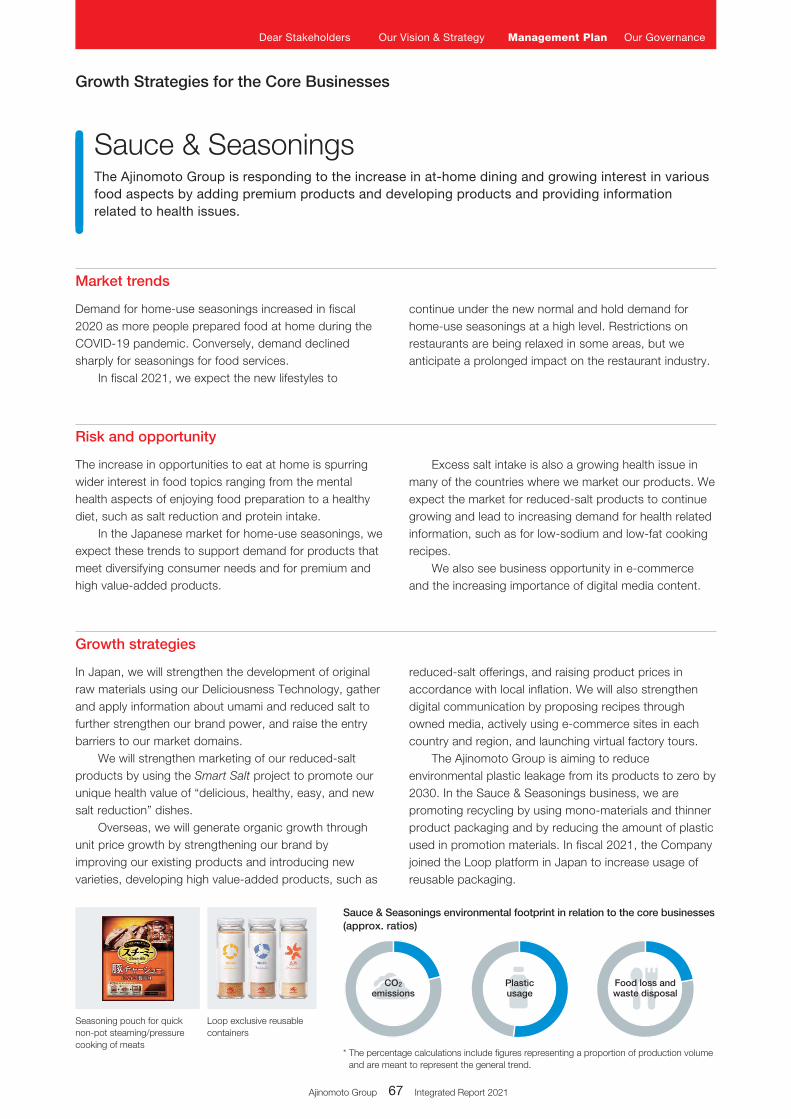
Seasoning pouch for quick non-pot steaming/pressure cooking of meats
Loop exclusive reusable containers
Growth Strategies for the Core Businesses
continue under the new normal and hold demand for home-use seasonings at a high level. Restrictions on restaurants are being relaxed in some areas, but we anticipate a prolonged impact on the restaurant industry.
Excess salt intake is also a growing health issue in many of the countries where we market our products. We expect the market for reduced-salt products to continue growing and lead to increasing demand for health related information, such as for low-sodium and low-fat cooking recipes.
We also see business opportunity in e-commerce and the increasing importance of digital media content.
reduced-salt offerings, and raising product prices in accordance with local inflation. We will also strengthen digital communication by proposing recipes through owned media, actively using e-commerce sites in each country and region, and launching virtual factory tours.
The Ajinomoto Group is aiming to reduce environmental plastic leakage from its products to zero by 2030. In the Sauce & Seasonings business, we are promoting recycling by using mono-materials and thinner product packaging and by reducing the amount of plastic used in promotion materials. In fiscal 2021, the Company joined the Loop platform in Japan to increase usage of reusable packaging.
Demand for home-use seasonings increased in fiscal 2020 as more people prepared food at home during the COVID-19 pandemic. Conversely, demand declined sharply for seasonings for food services.
In fiscal 2021, we expect the new lifestyles to
The increase in opportunities to eat at home is spurring wider interest in food topics ranging from the mental health aspects of enjoying food preparation to a healthy diet, such as salt reduction and protein intake.
In the Japanese market for home-use seasonings, we expect these trends to support demand for products that meet diversifying consumer needs and for premium and high value-added products.
In Japan, we will strengthen the development of original raw materials using our Deliciousness Technology, gather and apply information about umami and reduced salt to further strengthen our brand power, and raise the entry barriers to our market domains.
We will strengthen marketing of our reduced-salt products by using the Smart Salt project to promote our unique health value of “delicious, healthy, easy, and new salt reduction” dishes.
Overseas, we will generate organic growth through unit price growth by strengthening our brand by improving our existing products and introducing new varieties, developing high value-added products, such as
* The percentage calculations include figures representing a proportion of production volume and are meant to represent the general trend.
CO2
emissionsPlasticusage
Food loss andwaste disposal
Sauce & Seasonings environmental footprint in relation to the core businesses (approx. ratios)
Sauce & SeasoningsThe Ajinomoto Group is responding to the increase in at-home dining and growing interest in various food aspects by adding premium products and developing products and providing information related to health issues.
Growth strategies
Risk and opportunity
Market trends
Ajinomoto Group 67 Integrated Report 2021
Dear Stakeholders Our Vision & Strategy Management Plan Our Governance
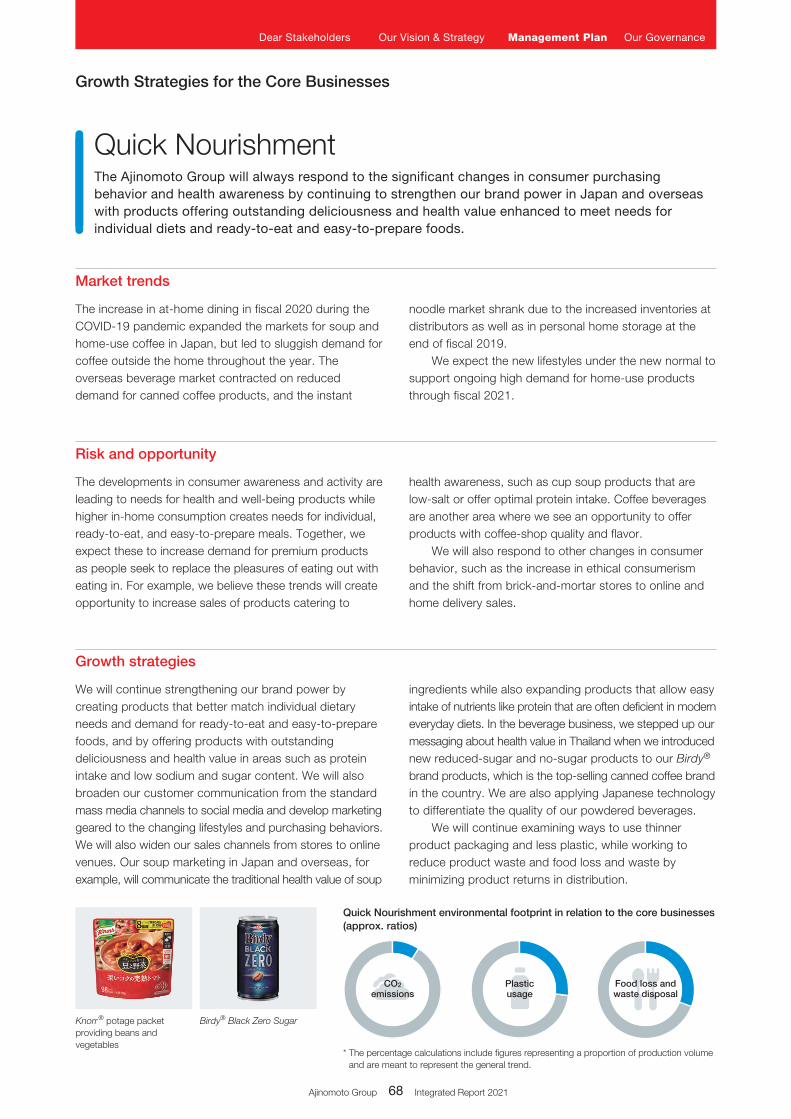
Knorr® potage packet providing beans and vegetables
Growth Strategies for the Core Businesses
noodle market shrank due to the increased inventories at distributors as well as in personal home storage at the end of fiscal 2019.
We expect the new lifestyles under the new normal to support ongoing high demand for home-use products through fiscal 2021.
health awareness, such as cup soup products that are low-salt or offer optimal protein intake. Coffee beverages are another area where we see an opportunity to offer products with coffee-shop quality and flavor.
We will also respond to other changes in consumer behavior, such as the increase in ethical consumerism and the shift from brick-and-mortar stores to online and home delivery sales.
ingredients while also expanding products that allow easy intake of nutrients like protein that are often deficient in modern everyday diets. In the beverage business, we stepped up our messaging about health value in Thailand when we introduced new reduced-sugar and no-sugar products to our Birdy® brand products, which is the top-selling canned coffee brand in the country. We are also applying Japanese technology to differentiate the quality of our powdered beverages.
We will continue examining ways to use thinner product packaging and less plastic, while working to reduce product waste and food loss and waste by minimizing product returns in distribution.
The increase in at-home dining in fiscal 2020 during the COVID-19 pandemic expanded the markets for soup and home-use coffee in Japan, but led to sluggish demand for coffee outside the home throughout the year. The overseas beverage market contracted on reduced demand for canned coffee products, and the instant
The developments in consumer awareness and activity are leading to needs for health and well-being products while higher in-home consumption creates needs for individual, ready-to-eat, and easy-to-prepare meals. Together, we expect these to increase demand for premium products as people seek to replace the pleasures of eating out with eating in. For example, we believe these trends will create opportunity to increase sales of products catering to
We will continue strengthening our brand power by creating products that better match individual dietary needs and demand for ready-to-eat and easy-to-prepare foods, and by offering products with outstanding deliciousness and health value in areas such as protein intake and low sodium and sugar content. We will also broaden our customer communication from the standard mass media channels to social media and develop marketing geared to the changing lifestyles and purchasing behaviors. We will also widen our sales channels from stores to online venues. Our soup marketing in Japan and overseas, for example, will communicate the traditional health value of soup
* The percentage calculations include figures representing a proportion of production volume and are meant to represent the general trend.
CO2
emissionsPlasticusage
Food loss andwaste disposal
Quick Nourishment environmental footprint in relation to the core businesses (approx. ratios)
Birdy® Black Zero Sugar
Quick NourishmentThe Ajinomoto Group will always respond to the significant changes in consumer purchasing behavior and health awareness by continuing to strengthen our brand power in Japan and overseas with products offering outstanding deliciousness and health value enhanced to meet needs for individual diets and ready-to-eat and easy-to-prepare foods.
Growth strategies
Risk and opportunity
Market trends
Ajinomoto Group 67 Integrated Report 2021 Ajinomoto Group 68 Integrated Report 2021
Dear Stakeholders Our Vision & Strategy Management Plan Our Governance
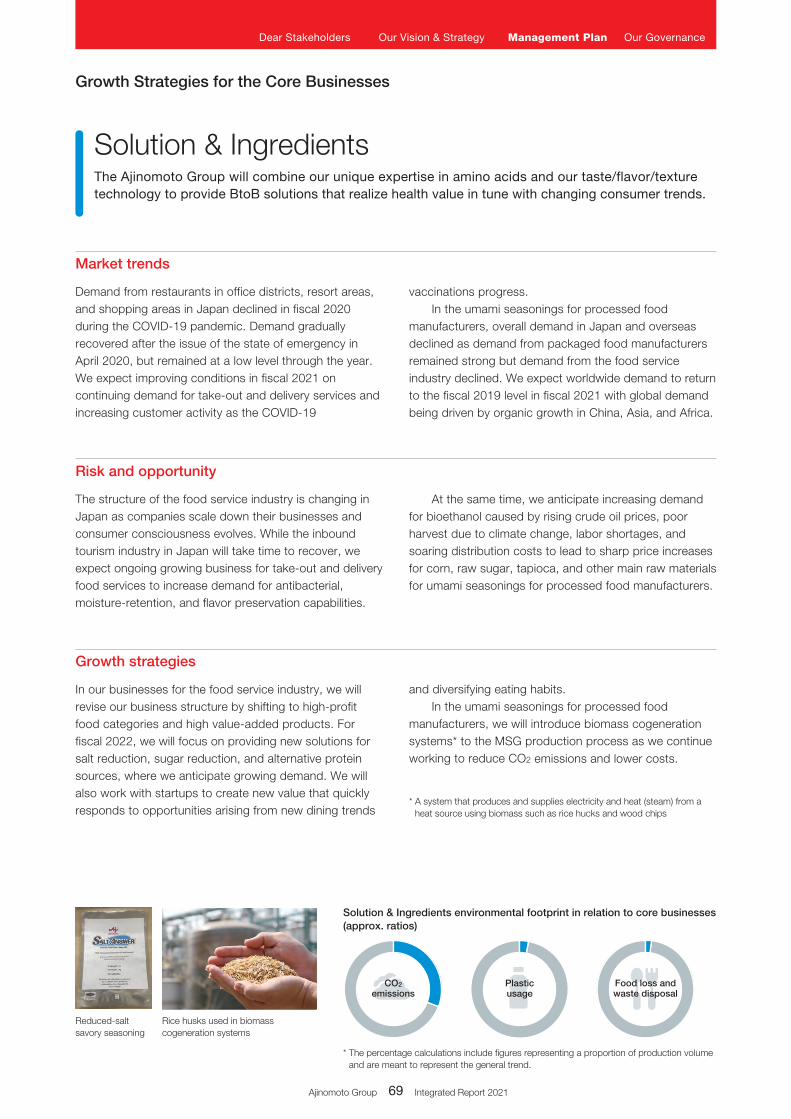
Reduced-salt savory seasoning
Rice husks used in biomass cogeneration systems
Growth Strategies for the Core Businesses
vaccinations progress.In the umami seasonings for processed food
manufacturers, overall demand in Japan and overseas declined as demand from packaged food manufacturers remained strong but demand from the food service industry declined. We expect worldwide demand to return to the fiscal 2019 level in fiscal 2021 with global demand being driven by organic growth in China, Asia, and Africa.
At the same time, we anticipate increasing demand for bioethanol caused by rising crude oil prices, poor harvest due to climate change, labor shortages, and soaring distribution costs to lead to sharp price increases for corn, raw sugar, tapioca, and other main raw materials for umami seasonings for processed food manufacturers.
Demand from restaurants in office districts, resort areas, and shopping areas in Japan declined in fiscal 2020 during the COVID-19 pandemic. Demand gradually recovered after the issue of the state of emergency in April 2020, but remained at a low level through the year. We expect improving conditions in fiscal 2021 on continuing demand for take-out and delivery services and increasing customer activity as the COVID-19
The structure of the food service industry is changing in Japan as companies scale down their businesses and consumer consciousness evolves. While the inbound tourism industry in Japan will take time to recover, we expect ongoing growing business for take-out and delivery food services to increase demand for antibacterial, moisture-retention, and flavor preservation capabilities.
and diversifying eating habits.In the umami seasonings for processed food
manufacturers, we will introduce biomass cogeneration systems* to the MSG production process as we continue working to reduce CO2 emissions and lower costs.
In our businesses for the food service industry, we will revise our business structure by shifting to high-profit food categories and high value-added products. For fiscal 2022, we will focus on providing new solutions for salt reduction, sugar reduction, and alternative protein sources, where we anticipate growing demand. We will also work with startups to create new value that quickly responds to opportunities arising from new dining trends
* A system that produces and supplies electricity and heat (steam) from a heat source using biomass such as rice hucks and wood chips
* The percentage calculations include figures representing a proportion of production volume and are meant to represent the general trend.
CO2
emissionsPlasticusage
Food loss andwaste disposal
Solution & Ingredients environmental footprint in relation to core businesses (approx. ratios)
Solution & IngredientsThe Ajinomoto Group will combine our unique expertise in amino acids and our taste/flavor/texture technology to provide BtoB solutions that realize health value in tune with changing consumer trends.
Growth strategies
Risk and opportunity
Market trends
Ajinomoto Group 69 Integrated Report 2021
Dear Stakeholders Our Vision & Strategy Management Plan Our Governance
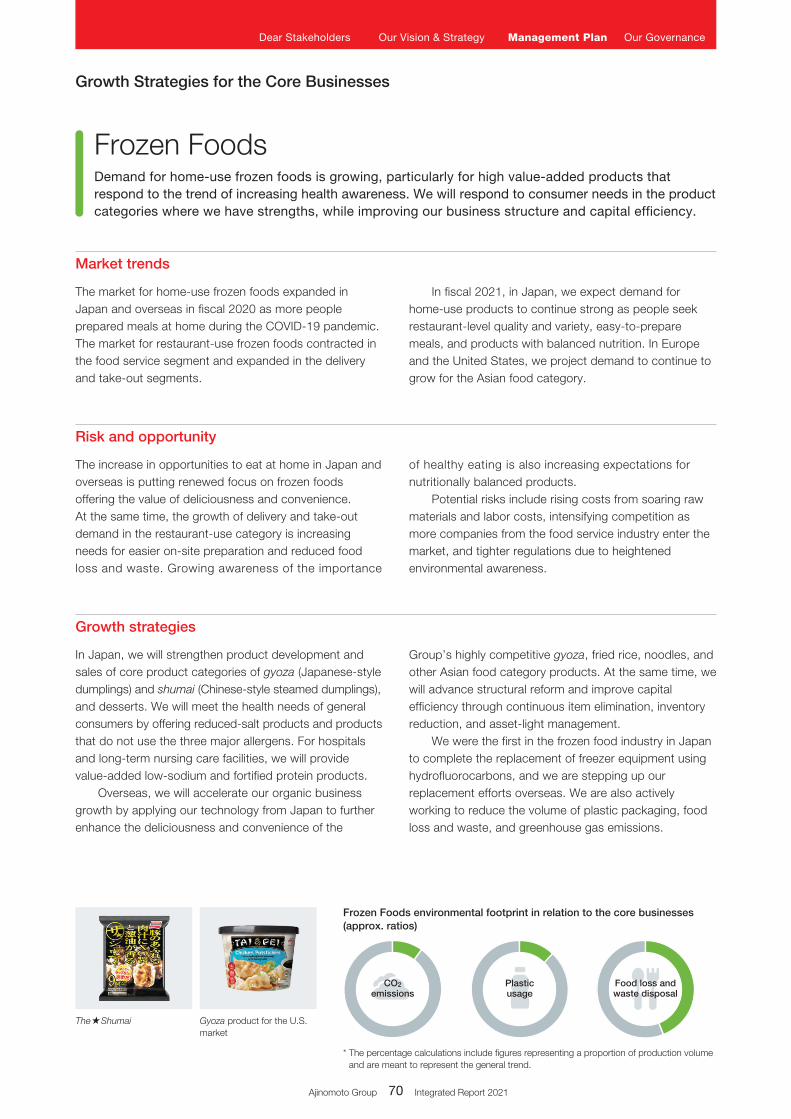
The Shumai
Growth Strategies for the Core Businesses
In fiscal 2021, in Japan, we expect demand for home-use products to continue strong as people seek restaurant-level quality and variety, easy-to-prepare meals, and products with balanced nutrition. In Europe and the United States, we project demand to continue to grow for the Asian food category.
of healthy eating is also increasing expectations for nutritionally balanced products.
Potential risks include rising costs from soaring raw materials and labor costs, intensifying competition as more companies from the food service industry enter the market, and tighter regulations due to heightened environmental awareness.
The market for home-use frozen foods expanded in Japan and overseas in fiscal 2020 as more people prepared meals at home during the COVID-19 pandemic. The market for restaurant-use frozen foods contracted in the food service segment and expanded in the delivery and take-out segments.
The increase in opportunities to eat at home in Japan and overseas is putting renewed focus on frozen foods offering the value of deliciousness and convenience. At the same time, the growth of delivery and take-out demand in the restaurant-use category is increasing needs for easier on-site preparation and reduced food loss and waste. Growing awareness of the importance
Group’s highly competitive gyoza, fried rice, noodles, and other Asian food category products. At the same time, we will advance structural reform and improve capital efficiency through continuous item elimination, inventory reduction, and asset-light management.
We were the first in the frozen food industry in Japan to complete the replacement of freezer equipment using hydrofluorocarbons, and we are stepping up our replacement efforts overseas. We are also actively working to reduce the volume of plastic packaging, food loss and waste, and greenhouse gas emissions.
In Japan, we will strengthen product development and sales of core product categories of gyoza (Japanese-style dumplings) and shumai (Chinese-style steamed dumplings), and desserts. We will meet the health needs of general consumers by offering reduced-salt products and products that do not use the three major allergens. For hospitals and long-term nursing care facilities, we will provide value-added low-sodium and fortified protein products.
Overseas, we will accelerate our organic business growth by applying our technology from Japan to further enhance the deliciousness and convenience of the
* The percentage calculations include figures representing a proportion of production volume and are meant to represent the general trend.
CO2
emissionsPlasticusage
Food loss andwaste disposal
Frozen Foods environmental footprint in relation to the core businesses (approx. ratios)
Gyoza product for the U.S. market
Frozen FoodsDemand for home-use frozen foods is growing, particularly for high value-added products that respond to the trend of increasing health awareness. We will respond to consumer needs in the product categories where we have strengths, while improving our business structure and capital efficiency.
Growth strategies
Risk and opportunity
Market trends
Ajinomoto Group 69 Integrated Report 2021 Ajinomoto Group 70 Integrated Report 2021
Dear Stakeholders Our Vision & Strategy Management Plan Our Governance
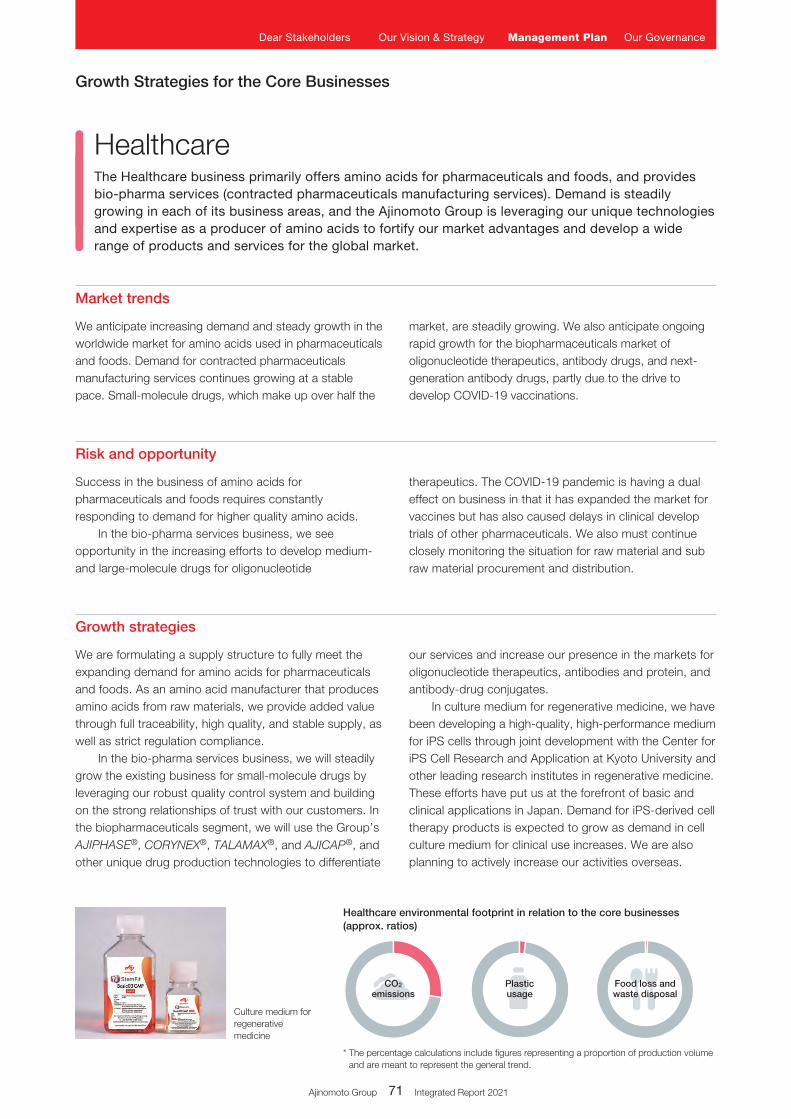
Culture medium for regenerative medicine
Growth Strategies for the Core Businesses
market, are steadily growing. We also anticipate ongoing rapid growth for the biopharmaceuticals market of oligonucleotide therapeutics, antibody drugs, and next-generation antibody drugs, partly due to the drive to develop COVID-19 vaccinations.
therapeutics. The COVID-19 pandemic is having a dual effect on business in that it has expanded the market for vaccines but has also caused delays in clinical develop trials of other pharmaceuticals. We also must continue closely monitoring the situation for raw material and sub raw material procurement and distribution.
We anticipate increasing demand and steady growth in the worldwide market for amino acids used in pharmaceuticals and foods. Demand for contracted pharmaceuticals manufacturing services continues growing at a stable pace. Small-molecule drugs, which make up over half the
Success in the business of amino acids for pharmaceuticals and foods requires constantly responding to demand for higher quality amino acids.
In the bio-pharma services business, we see opportunity in the increasing efforts to develop medium- and large-molecule drugs for oligonucleotide
our services and increase our presence in the markets for oligonucleotide therapeutics, antibodies and protein, and antibody-drug conjugates.
In culture medium for regenerative medicine, we have been developing a high-quality, high-performance medium for iPS cells through joint development with the Center for iPS Cell Research and Application at Kyoto University and other leading research institutes in regenerative medicine. These efforts have put us at the forefront of basic and clinical applications in Japan. Demand for iPS-derived cell therapy products is expected to grow as demand in cell culture medium for clinical use increases. We are also planning to actively increase our activities overseas.
We are formulating a supply structure to fully meet the expanding demand for amino acids for pharmaceuticals and foods. As an amino acid manufacturer that produces amino acids from raw materials, we provide added value through full traceability, high quality, and stable supply, as well as strict regulation compliance.
In the bio-pharma services business, we will steadily grow the existing business for small-molecule drugs by leveraging our robust quality control system and building on the strong relationships of trust with our customers. In the biopharmaceuticals segment, we will use the Group’s AJIPHASE®, CORYNEX®, TALAMAX®, and AJICAP®, and other unique drug production technologies to differentiate
* The percentage calculations include figures representing a proportion of production volume and are meant to represent the general trend.
CO2
emissionsPlasticusage
Food loss andwaste disposal
Healthcare environmental footprint in relation to the core businesses (approx. ratios)
HealthcareThe Healthcare business primarily offers amino acids for pharmaceuticals and foods, and provides bio-pharma services (contracted pharmaceuticals manufacturing services). Demand is steadily growing in each of its business areas, and the Ajinomoto Group is leveraging our unique technologies and expertise as a producer of amino acids to fortify our market advantages and develop a wide range of products and services for the global market.
Growth strategies
Risk and opportunity
Market trends
Ajinomoto Group 71 Integrated Report 2021
Dear Stakeholders Our Vision & Strategy Management Plan Our Governance
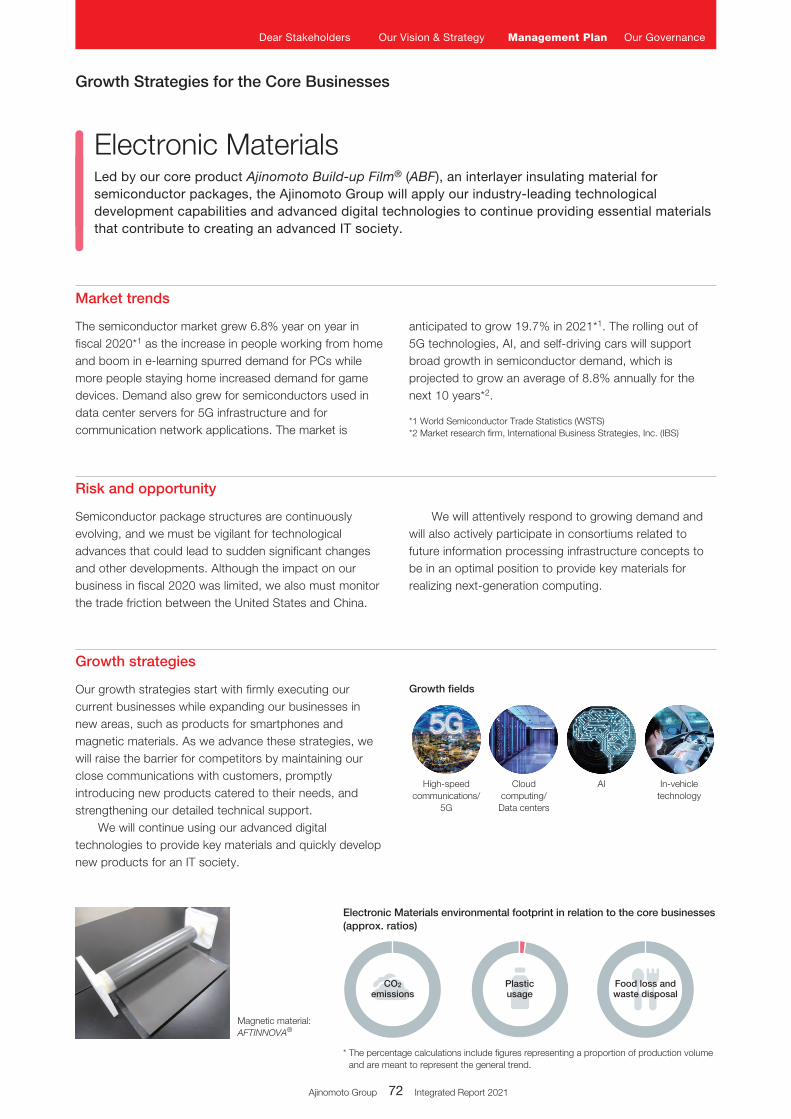
Magnetic material: AFTINNOVA®
Growth Strategies for the Core Businesses
anticipated to grow 19.7% in 2021*1. The rolling out of 5G technologies, AI, and self-driving cars will support broad growth in semiconductor demand, which is projected to grow an average of 8.8% annually for the next 10 years*2.
We will attentively respond to growing demand and will also actively participate in consortiums related to future information processing infrastructure concepts to be in an optimal position to provide key materials for realizing next-generation computing.
The semiconductor market grew 6.8% year on year in fiscal 2020*1 as the increase in people working from home and boom in e-learning spurred demand for PCs while more people staying home increased demand for game devices. Demand also grew for semiconductors used in data center servers for 5G infrastructure and for communication network applications. The market is
Semiconductor package structures are continuously evolving, and we must be vigilant for technological advances that could lead to sudden significant changes and other developments. Although the impact on our business in fiscal 2020 was limited, we also must monitor the trade friction between the United States and China.
Our growth strategies start with firmly executing our current businesses while expanding our businesses in new areas, such as products for smartphones and magnetic materials. As we advance these strategies, we will raise the barrier for competitors by maintaining our close communications with customers, promptly introducing new products catered to their needs, and strengthening our detailed technical support.
We will continue using our advanced digital technologies to provide key materials and quickly develop new products for an IT society.
*1 World Semiconductor Trade Statistics (WSTS)*2 Market research firm, International Business Strategies, Inc. (IBS)
* The percentage calculations include figures representing a proportion of production volume and are meant to represent the general trend.
CO2
emissionsPlasticusage
Food loss andwaste disposal
Electronic Materials environmental footprint in relation to the core businesses (approx. ratios)
Growth fields
In-vehicle technology
High-speed communications/
5G
AICloud computing/
Data centers
Electronic MaterialsLed by our core product Ajinomoto Build-up Film® (ABF), an interlayer insulating material for semiconductor packages, the Ajinomoto Group will apply our industry-leading technological development capabilities and advanced digital technologies to continue providing essential materials that contribute to creating an advanced IT society.
Growth strategies
Risk and opportunity
Market trends
Ajinomoto Group 71 Integrated Report 2021 Ajinomoto Group 72 Integrated Report 2021
Dear Stakeholders Our Vision & Strategy Management Plan Our Governance
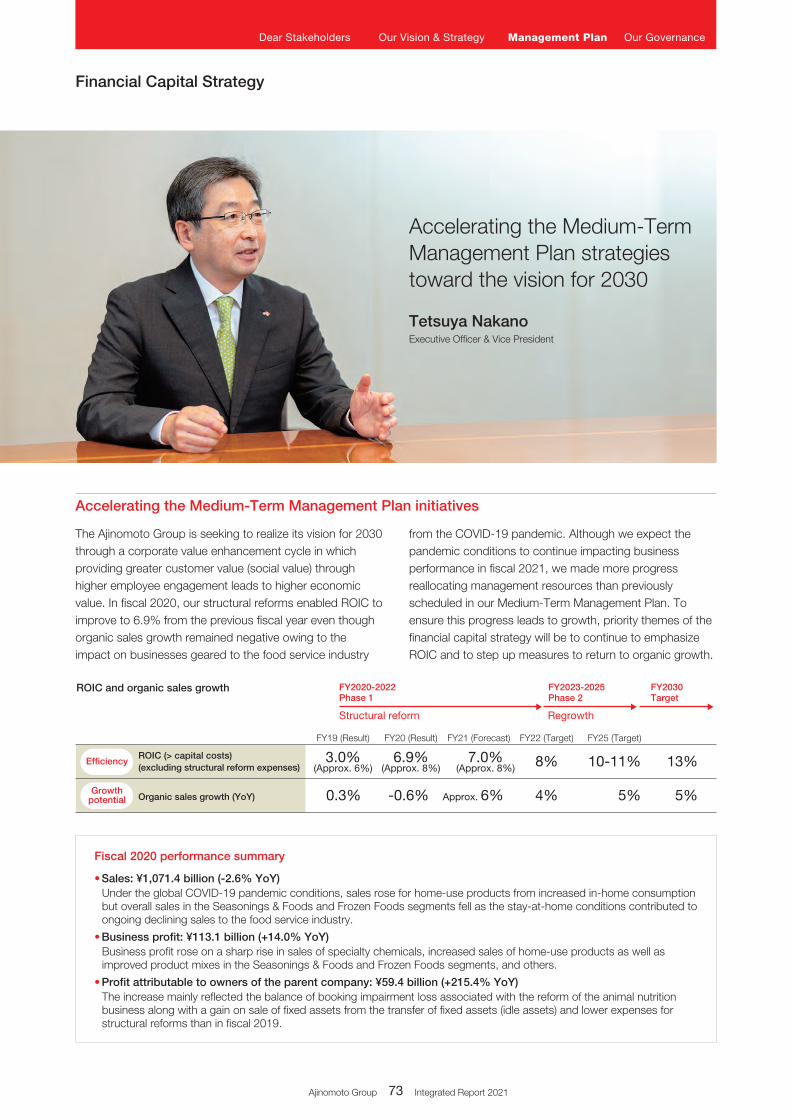
ROIC-oriented management
ROIC > hurdle rate
Business portfoliomanagement
Utilizing an ROIC treeto raise value
ROIC (> capital costs)(excluding structural reform expenses)
Organic sales growth (YoY)
ROIC and organic sales growth
Growthpotential
Efficiency
FY19 (Result)
0.3%
3.0%(Approx. 6%)
FY21 (Forecast)
Approx. 6%
7.0%(Approx. 8%)
FY22 (Target)
4%
8%
FY25 (Target)
5%
10-11%
5%
13%
FY20 (Result)
-0.6%
6.9%(Approx. 8%)
FY2020-2022Phase 1
Structural reform
FY2023-2025Phase 2
Regrowth
FY2030 Target
* Excluding structural reform expenses
Priority KPIs: Fiscal 2021 forecast by segment
Seasonings & Foods
Food Products
Segment FY20 result and FY21 forecast
Organic sales growthFY20(Result)
FY21(Forecast)
FY20(Result)
FY21(Forecast)
FY20*(Result)
FY21*(Forecast)
FY22(Target)
FY25(Target)
Unit price growth ROIC
Amino-Science
Frozen Foods
Healthcare and Others
Quick Nourishment
Bio-Pharma Services & Ingredients
Functional Materials
Others
Frozen Foods
Sauce & Seasonings
Solution & Ingredients
-0.3%Approx.
6%Approx.
13% 12%+ 17%+WACC 6%
Approx.
2%2.8%
-5.0%Approx.
6%Approx.
2%2.8%
3.5%Approx.
7% ––
12.4%
Approx.
1% 1%+ 5%WACC 5%
0.6%
Approx.
7% 10%+ 12%+WACC 8%
1.2%
Fiscal 2021 performance forecast
• Sales: ¥1,113.0 billionOverall sales are projected to increase on higher sales in the Seasonings & Foods and Frozen Foods segments, while sales decline in the Healthcare and Others segment.
• Business profit: ¥115.0 billionOverall business profit is expected to increase on higher sales in the Frozen Foods segment and in the core businesses of the Healthcare and Others segment.
• Profit attributable to owners of the parent company: ¥60.0 billionProfit attributable to owners of the parent company is expected to increase even with about ¥10 billion in structural reform expenses in fiscal 2021.
Fiscal 2020 performance summary
• Sales: ¥1,071.4 billion (-2.6% YoY)Under the global COVID-19 pandemic conditions, sales rose for home-use products from increased in-home consumption but overall sales in the Seasonings & Foods and Frozen Foods segments fell as the stay-at-home conditions contributed to ongoing declining sales to the food service industry.
• Business profit: ¥113.1 billion (+14.0% YoY)Business profit rose on a sharp rise in sales of specialty chemicals, increased sales of home-use products as well as improved product mixes in the Seasonings & Foods and Frozen Foods segments, and others.
• Profit attributable to owners of the parent company: ¥59.4 billion (+215.4% YoY)The increase mainly reflected the balance of booking impairment loss associated with the reform of the animal nutrition business along with a gain on sale of fixed assets from the transfer of fixed assets (idle assets) and lower expenses for structural reforms than in fiscal 2019.
Financial Capital Strategy
Accelerating the Medium-Term Management Plan strategies toward the vision for 2030
Tetsuya NakanoExecutive Officer & Vice President
from the COVID-19 pandemic. Although we expect the pandemic conditions to continue impacting business performance in fiscal 2021, we made more progress reallocating management resources than previously scheduled in our Medium-Term Management Plan. To ensure this progress leads to growth, priority themes of the financial capital strategy will be to continue to emphasize ROIC and to step up measures to return to organic growth.
The Ajinomoto Group is seeking to realize its vision for 2030 through a corporate value enhancement cycle in which providing greater customer value (social value) through higher employee engagement leads to higher economic value. In fiscal 2020, our structural reforms enabled ROIC to improve to 6.9% from the previous fiscal year even though organic sales growth remained negative owing to the impact on businesses geared to the food service industry
Accelerating the Medium-Term Management Plan initiatives
Ajinomoto Group 73 Integrated Report 2021
Dear Stakeholders Our Vision & Strategy Management Plan Our Governance
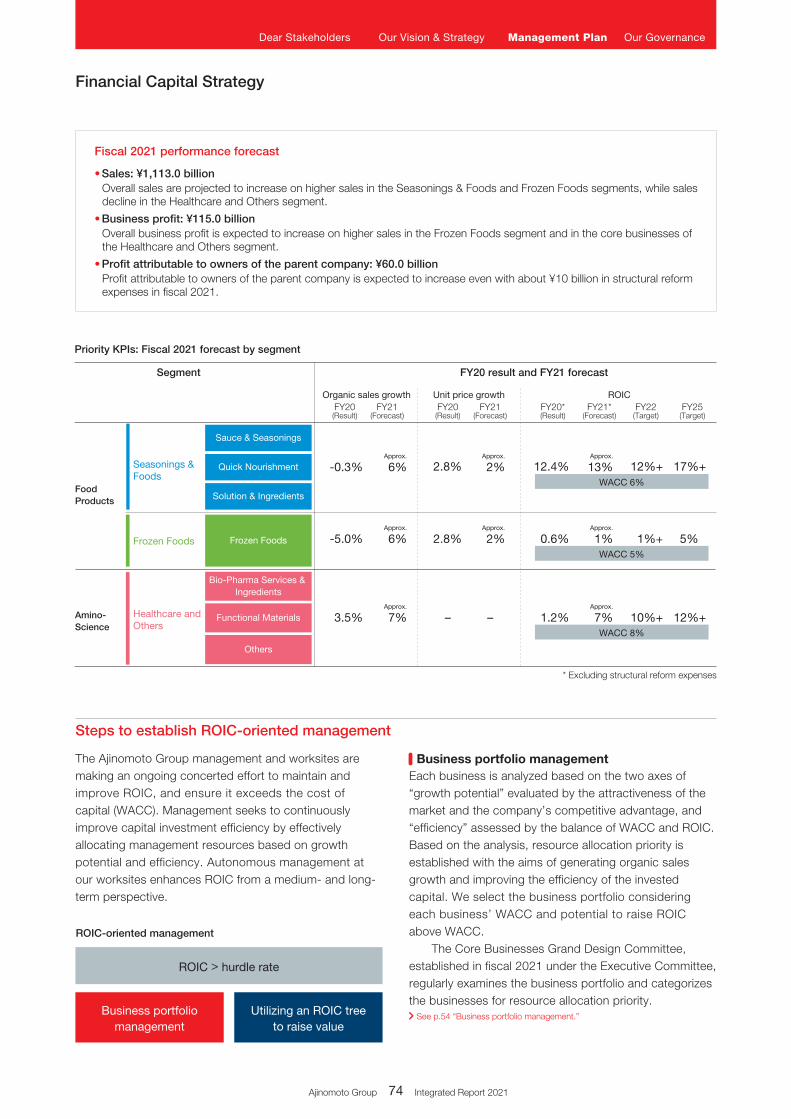
ROIC-oriented management
ROIC > hurdle rate
Business portfoliomanagement
Utilizing an ROIC treeto raise value
ROIC (> capital costs)(excluding structural reform expenses)
Organic sales growth (YoY)
ROIC and organic sales growth
Growthpotential
Efficiency
FY19 (Result)
0.3%
3.0%(Approx. 6%)
FY21 (Forecast)
Approx. 6%
7.0%(Approx. 8%)
FY22 (Target)
4%
8%
FY25 (Target)
5%
10-11%
5%
13%
FY20 (Result)
-0.6%
6.9%(Approx. 8%)
FY2020-2022Phase 1
Structural reform
FY2023-2025Phase 2
Regrowth
FY2030 Target
* Excluding structural reform expenses
Priority KPIs: Fiscal 2021 forecast by segment
Seasonings & Foods
Food Products
Segment FY20 result and FY21 forecast
Organic sales growthFY20(Result)
FY21(Forecast)
FY20(Result)
FY21(Forecast)
FY20*(Result)
FY21*(Forecast)
FY22(Target)
FY25(Target)
Unit price growth ROIC
Amino-Science
Frozen Foods
Healthcare and Others
Quick Nourishment
Bio-Pharma Services & Ingredients
Functional Materials
Others
Frozen Foods
Sauce & Seasonings
Solution & Ingredients
-0.3%Approx.
6%Approx.
13% 12%+ 17%+WACC 6%
Approx.
2%2.8%
-5.0%Approx.
6%Approx.
2%2.8%
3.5%Approx.
7% ––
12.4%
Approx.
1% 1%+ 5%WACC 5%
0.6%
Approx.
7% 10%+ 12%+WACC 8%
1.2%
Fiscal 2021 performance forecast
• Sales: ¥1,113.0 billionOverall sales are projected to increase on higher sales in the Seasonings & Foods and Frozen Foods segments, while sales decline in the Healthcare and Others segment.
• Business profit: ¥115.0 billionOverall business profit is expected to increase on higher sales in the Frozen Foods segment and in the core businesses of the Healthcare and Others segment.
• Profit attributable to owners of the parent company: ¥60.0 billionProfit attributable to owners of the parent company is expected to increase even with about ¥10 billion in structural reform expenses in fiscal 2021.
Fiscal 2020 performance summary
• Sales: ¥1,071.4 billion (-2.6% YoY)Under the global COVID-19 pandemic conditions, sales rose for home-use products from increased in-home consumption but overall sales in the Seasonings & Foods and Frozen Foods segments fell as the stay-at-home conditions contributed to ongoing declining sales to the food service industry.
• Business profit: ¥113.1 billion (+14.0% YoY)Business profit rose on a sharp rise in sales of specialty chemicals, increased sales of home-use products as well as improved product mixes in the Seasonings & Foods and Frozen Foods segments, and others.
• Profit attributable to owners of the parent company: ¥59.4 billion (+215.4% YoY)The increase mainly reflected the balance of booking impairment loss associated with the reform of the animal nutrition business along with a gain on sale of fixed assets from the transfer of fixed assets (idle assets) and lower expenses for structural reforms than in fiscal 2019.
Financial Capital Strategy
Each business is analyzed based on the two axes of “growth potential” evaluated by the attractiveness of the market and the company’s competitive advantage, and “efficiency” assessed by the balance of WACC and ROIC. Based on the analysis, resource allocation priority is established with the aims of generating organic sales growth and improving the efficiency of the invested capital. We select the business portfolio considering each business’ WACC and potential to raise ROIC above WACC.
The Core Businesses Grand Design Committee, established in fiscal 2021 under the Executive Committee, regularly examines the business portfolio and categorizes the businesses for resource allocation priority.
The Ajinomoto Group management and worksites are making an ongoing concerted effort to maintain and improve ROIC, and ensure it exceeds the cost of capital (WACC). Management seeks to continuously improve capital investment efficiency by effectively allocating management resources based on growth potential and efficiency. Autonomous management at our worksites enhances ROIC from a medium- and long-term perspective.
Steps to establish ROIC-oriented management
Business portfolio management
See p.54 “Business portfolio management.”
Ajinomoto Group 73 Integrated Report 2021 Ajinomoto Group 74 Integrated Report 2021
Dear Stakeholders Our Vision & Strategy Management Plan Our Governance
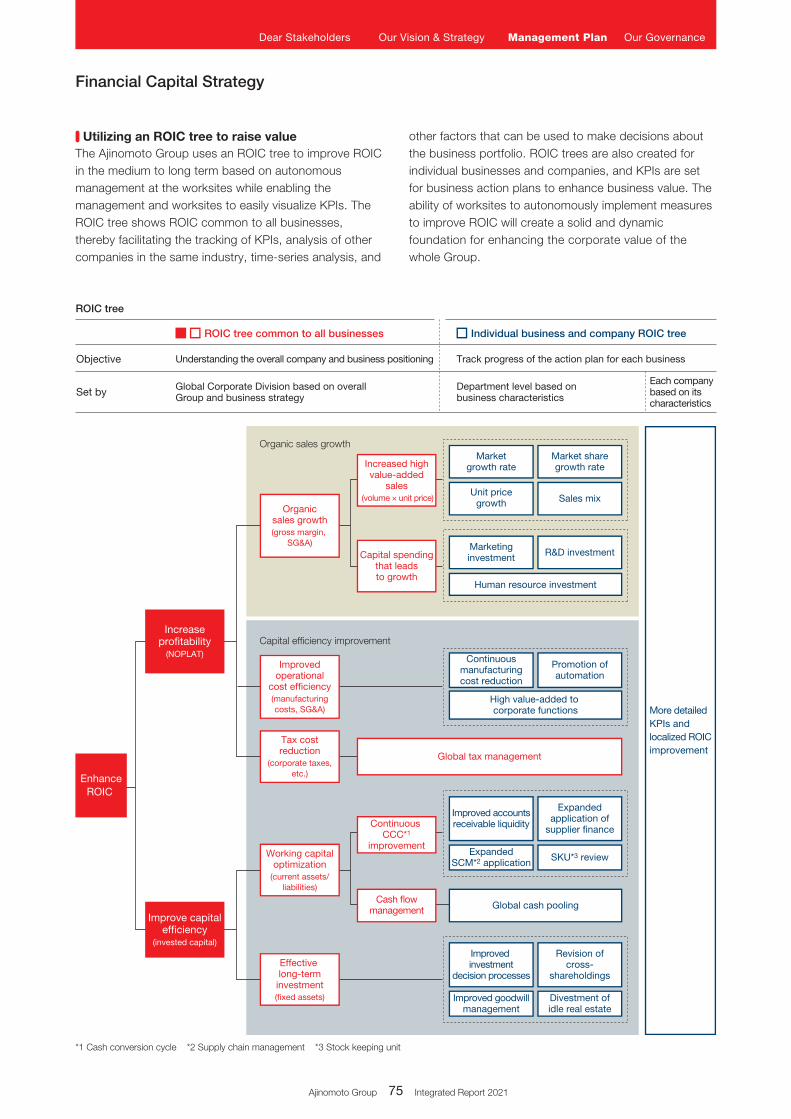
ROIC tree
Objective Understanding the overall company and business positioning
Global Corporate Division based on overall Group and business strategy
Track progress of the action plan for each business
Department level based on business characteristics
Each company based on its characteristics
Set by
Organic sales growth
Capital efficiency improvement
More detailedKPIs andlocalized ROICimprovement
Marketgrowth rate
Market sharegrowth rate
Unit pricegrowth Sales mix
Human resource investment
R&D investmentMarketinginvestment
Promotion ofautomation
High value-added to corporate functions
Continuousmanufacturingcost reduction
Revision ofcross-
shareholdings
Divestment ofidle real estate
Improved investment
decision processes
Improved goodwillmanagement
Effective long-terminvestment(�xed assets)
Improved accountsreceivable liquidity
Expandedapplication of
supplier �nance
ExpandedSCM*2 application SKU*3 reviewWorking capital
optimization(current assets/
liabilities)
Continuous CCC*1
improvement
Cash �owmanagement Global cash pooling
Improvedoperational
cost ef�ciency(manufacturingcosts, SG&A)
Tax costreduction
(corporate taxes, etc.)
Global tax management
Capital spendingthat leadsto growth
Increased highvalue-added
sales (volume × unit price)
Organicsales growth(gross margin,
SG&A)
Improve capitalef�ciency
(invested capital)
Increasepro�tability
(NOPLAT)
ROIC tree common to all businesses
EnhanceROIC
¥1,353.6 billion
Net debt-equity ratio
0.57
Net debt-equity ratio
0.44
¥1,431.2 billion
Net debt-equity ratio
under 0.50
¥1,400 billion
As of March 31, 2020(Actual)
As of March 31, 2021(Actual)
As of March 31, 2023(Plan)
Total assets
Cash flow strategy for fiscal 2020-2022
Inflow Outflow
Operating cash �ow,asset reduction
¥400+ billion
Investments ¥290 billion
Shareholder return ¥100+ billion
Operating cash �ow
FY20 ¥165.6 billionFY21 forecast approx.
¥150 billion
Capital expenditure ¥210 billionFY20 ¥91.8 billionFY21 forecast approx.
¥75 billion
Interest-bearing debt balance by type of procurement (excluding lease liabilities) (As of March 31, 2021)
¥350.4 billion
Interest-bearingdebt balance
¥149.6 billion
Corporate bonds
¥141.9 billion
Long-termborrowings
Interest ratestructure
85%
Fixedinterest rate
7.4 years
Average remaining years
Long-term interest-bearing debt
¥10.8 billion
Short-term borrowings
¥18.0 billion
Current portion oflong-term
borrowings
¥30.0 billion
Commercialpapers
Other, partlysecuritized trade
receivables
15%
Variableinterest rate
Individual business and company ROIC tree
Financial Capital Strategy
other factors that can be used to make decisions about the business portfolio. ROIC trees are also created for individual businesses and companies, and KPIs are set for business action plans to enhance business value. The ability of worksites to autonomously implement measures to improve ROIC will create a solid and dynamic foundation for enhancing the corporate value of the whole Group.
The Ajinomoto Group uses an ROIC tree to improve ROIC in the medium to long term based on autonomous management at the worksites while enabling the management and worksites to easily visualize KPIs. The ROIC tree shows ROIC common to all businesses, thereby facilitating the tracking of KPIs, analysis of other companies in the same industry, time-series analysis, and
*1 Cash conversion cycle *2 Supply chain management *3 Stock keeping unit
Utilizing an ROIC tree to raise value
Ajinomoto Group 75 Integrated Report 2021
Dear Stakeholders Our Vision & Strategy Management Plan Our Governance
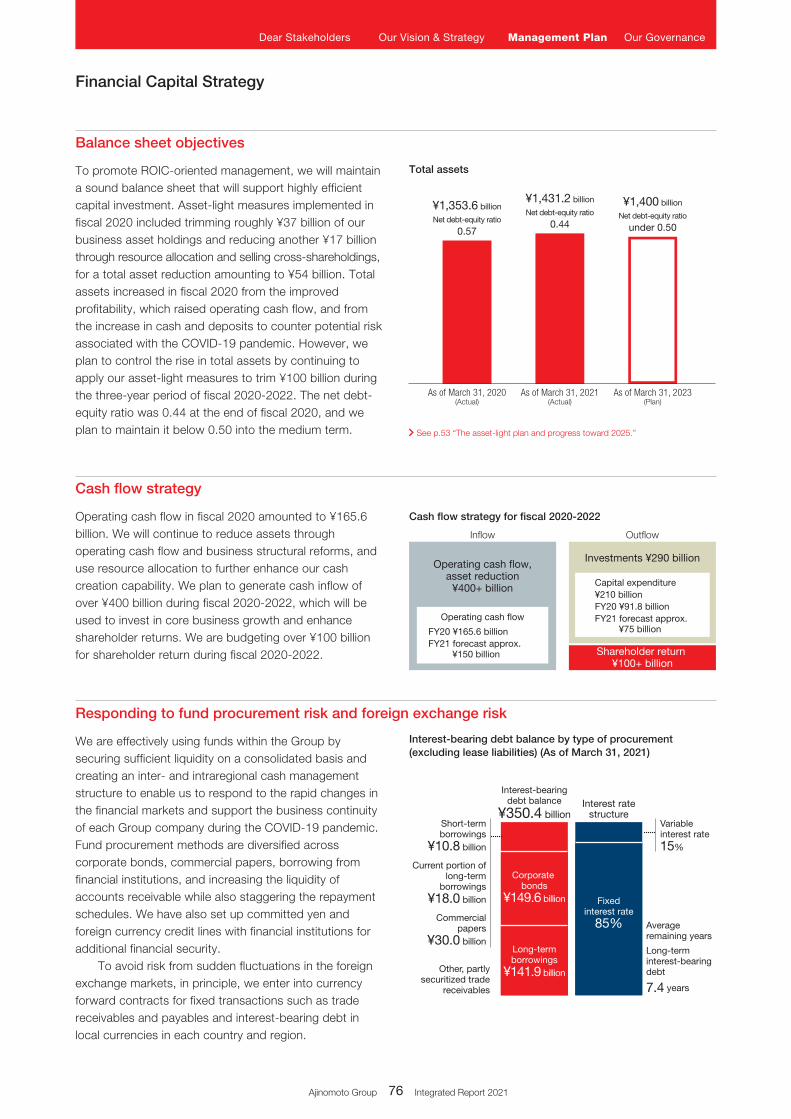
ROIC tree
Objective Understanding the overall company and business positioning
Global Corporate Division based on overall Group and business strategy
Track progress of the action plan for each business
Department level based on business characteristics
Each company based on its characteristics
Set by
Organic sales growth
Capital efficiency improvement
More detailedKPIs andlocalized ROICimprovement
Marketgrowth rate
Market sharegrowth rate
Unit pricegrowth Sales mix
Human resource investment
R&D investmentMarketinginvestment
Promotion ofautomation
High value-added to corporate functions
Continuousmanufacturingcost reduction
Revision ofcross-
shareholdings
Divestment ofidle real estate
Improved investment
decision processes
Improved goodwillmanagement
Effective long-terminvestment(�xed assets)
Improved accountsreceivable liquidity
Expandedapplication of
supplier �nance
ExpandedSCM*2 application SKU*3 reviewWorking capital
optimization(current assets/
liabilities)
Continuous CCC*1
improvement
Cash �owmanagement Global cash pooling
Improvedoperational
cost ef�ciency(manufacturingcosts, SG&A)
Tax costreduction
(corporate taxes, etc.)
Global tax management
Capital spendingthat leadsto growth
Increased highvalue-added
sales (volume × unit price)
Organicsales growth(gross margin,
SG&A)
Improve capitalef�ciency
(invested capital)
Increasepro�tability
(NOPLAT)
ROIC tree common to all businesses
EnhanceROIC
¥1,353.6 billion
Net debt-equity ratio
0.57
Net debt-equity ratio
0.44
¥1,431.2 billion
Net debt-equity ratio
under 0.50
¥1,400 billion
As of March 31, 2020(Actual)
As of March 31, 2021(Actual)
As of March 31, 2023(Plan)
Total assets
Cash flow strategy for fiscal 2020-2022
Inflow Outflow
Operating cash �ow,asset reduction
¥400+ billion
Investments ¥290 billion
Shareholder return ¥100+ billion
Operating cash �ow
FY20 ¥165.6 billionFY21 forecast approx.
¥150 billion
Capital expenditure ¥210 billionFY20 ¥91.8 billionFY21 forecast approx.
¥75 billion
Interest-bearing debt balance by type of procurement (excluding lease liabilities) (As of March 31, 2021)
¥350.4 billion
Interest-bearingdebt balance
¥149.6 billion
Corporate bonds
¥141.9 billion
Long-termborrowings
Interest ratestructure
85%
Fixedinterest rate
7.4 years
Average remaining years
Long-term interest-bearing debt
¥10.8 billion
Short-term borrowings
¥18.0 billion
Current portion oflong-term
borrowings
¥30.0 billion
Commercialpapers
Other, partlysecuritized trade
receivables
15%
Variableinterest rate
Individual business and company ROIC tree
Financial Capital Strategy
Operating cash flow in fiscal 2020 amounted to ¥165.6 billion. We will continue to reduce assets through operating cash flow and business structural reforms, and use resource allocation to further enhance our cash creation capability. We plan to generate cash inflow of over ¥400 billion during fiscal 2020-2022, which will be used to invest in core business growth and enhance shareholder returns. We are budgeting over ¥100 billion for shareholder return during fiscal 2020-2022.
We are effectively using funds within the Group by securing sufficient liquidity on a consolidated basis and creating an inter- and intraregional cash management structure to enable us to respond to the rapid changes in the financial markets and support the business continuity of each Group company during the COVID-19 pandemic. Fund procurement methods are diversified across corporate bonds, commercial papers, borrowing from financial institutions, and increasing the liquidity of accounts receivable while also staggering the repayment schedules. We have also set up committed yen and foreign currency credit lines with financial institutions for additional financial security.
To avoid risk from sudden fluctuations in the foreign exchange markets, in principle, we enter into currency forward contracts for fixed transactions such as trade receivables and payables and interest-bearing debt in local currencies in each country and region.
To promote ROIC-oriented management, we will maintain a sound balance sheet that will support highly efficient capital investment. Asset-light measures implemented in fiscal 2020 included trimming roughly ¥37 billion of our business asset holdings and reducing another ¥17 billion through resource allocation and selling cross-shareholdings, for a total asset reduction amounting to ¥54 billion. Total assets increased in fiscal 2020 from the improved profitability, which raised operating cash flow, and from the increase in cash and deposits to counter potential risk associated with the COVID-19 pandemic. However, we plan to control the rise in total assets by continuing to apply our asset-light measures to trim ¥100 billion during the three-year period of fiscal 2020-2022. The net debt-equity ratio was 0.44 at the end of fiscal 2020, and we plan to maintain it below 0.50 into the medium term.
Balance sheet objectives
Cash flow strategy
Responding to fund procurement risk and foreign exchange risk
See p.53 “The asset-light plan and progress toward 2025.”
Ajinomoto Group 75 Integrated Report 2021 Ajinomoto Group 76 Integrated Report 2021
Dear Stakeholders Our Vision & Strategy Management Plan Our Governance
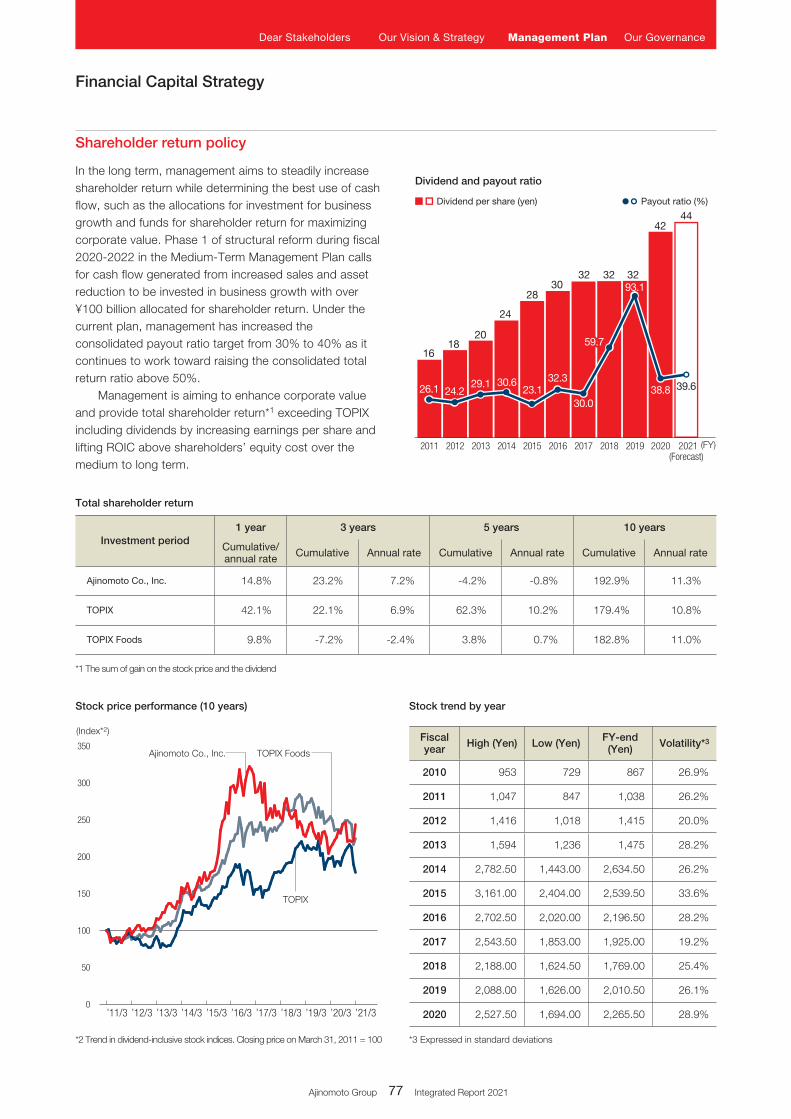
(Index*2)
0
50
100
150
200
250
300
350
’11/3 ’12/3 ’13/3 ’14/3 ’15/3 ’17/3 ’18/3 ’20/3 ’21/3’16/3 ’19/3
Ajinomoto Co., Inc. TOPIX Foods
TOPIX
Dividend and payout ratio
2011 2012 2013 2014 2015 2016 2017 2018 2019 2020 2021(Forecast)
(FY)
Payout ratio (%)Dividend per share (yen)
1618
20
24
2830
32 32 32
4244
26.1 24.229.1 30.6
23.132.3
30.0
93.1
38.8 39.6
59.7
Financial Capital Strategy
In the long term, management aims to steadily increase shareholder return while determining the best use of cash flow, such as the allocations for investment for business growth and funds for shareholder return for maximizing corporate value. Phase 1 of structural reform during fiscal 2020-2022 in the Medium-Term Management Plan calls for cash flow generated from increased sales and asset reduction to be invested in business growth with over ¥100 billion allocated for shareholder return. Under the current plan, management has increased the consolidated payout ratio target from 30% to 40% as it continues to work toward raising the consolidated total return ratio above 50%.
Management is aiming to enhance corporate value and provide total shareholder return*1 exceeding TOPIX including dividends by increasing earnings per share and lifting ROIC above shareholders’ equity cost over the medium to long term.
Stock price performance (10 years) Stock trend by year
Fiscal year High (Yen) Low (Yen) FY-end
(Yen) Volatility*3
2010 953 729 867 26.9%
2011 1,047 847 1,038 26.2%
2012 1,416 1,018 1,415 20.0%
2013 1,594 1,236 1,475 28.2%
2014 2,782.50 1,443.00 2,634.50 26.2%
2015 3,161.00 2,404.00 2,539.50 33.6%
2016 2,702.50 2,020.00 2,196.50 28.2%
2017 2,543.50 1,853.00 1,925.00 19.2%
2018 2,188.00 1,624.50 1,769.00 25.4%
2019 2,088.00 1,626.00 2,010.50 26.1%
2020 2,527.50 1,694.00 2,265.50 28.9%
*3 Expressed in standard deviations*2 Trend in dividend-inclusive stock indices. Closing price on March 31, 2011 = 100
Total shareholder return
Investment period1 year 3 years 5 years 10 years
Cumulative/ annual rate Cumulative Annual rate Cumulative Annual rate Cumulative Annual rate
Ajinomoto Co., Inc. 14.8% 23.2% 7.2% -4.2% -0.8% 192.9% 11.3%
TOPIX 42.1% 22.1% 6.9% 62.3% 10.2% 179.4% 10.8%
TOPIX Foods 9.8% -7.2% -2.4% 3.8% 0.7% 182.8% 11.0%
*1 The sum of gain on the stock price and the dividend
Shareholder return policy
Ajinomoto Group 77 Integrated Report 2021
Dear Stakeholders Our Vision & Strategy Management Plan Our Governance
Related Documents