Welcome message from author
This document is posted to help you gain knowledge. Please leave a comment to let me know what you think about it! Share it to your friends and learn new things together.
Transcript
mft-1110.indd 1 10/22/10 4:51 PM

Contents
Futures PerspectiveInvesting in managed futures: The timing question ...............................4Buying a managed futures program in a drawdown can pay dividends, but there are many variables to consider.By MFT Staff
Constructing a managed futures portfolio .....................................8The basics of allocating to multiple managed futures programs follows the golden rules of investing: Know your risk tolerance, diversify, and perform the necessary due diligence.By MFT Staff
Who is minding my money? ...............12CTA registration requirements promote due diligence.By MFT Staff
Strategy FocusPosition sizing: Balancing trades and managing risk ...............................14Balancing the risk of different markets is part of the managed futures trading process.By MFT Staff
Managed Futures PerformanceYear-to-date returns and assets under management ...............................18
Commodity SnapshotKey trends drive bullish move in commodity futures markets. .....................................19
Key Concepts .....................................19
Editor-in-chief: Mark Etzkorn [email protected]
Managing editor: Molly Goad [email protected]
Editorial assistant and webmaster: Kesha Green
President: Phil Dorman [email protected]
Publisher: Bob Dorman
Volume 1, Issue 3. Managed Futures Today is pub-lished quarterly by TechInfo, Inc., PO Box 487 Lake Zurich, IL 60047-0487. Copyright © 2010 TechInfo, Inc. All rights reserved. Information in this publication may not be stored or reproduced in any form without written permission from the publisher.
The information in Managed Futures Today is intended for educational purposes only. It is not meant to rec-ommend, promote, or in any way imply the effective-ness of any trading system, strategy, or approach. Traders are advised to do their own research and test-ing to determine the validity of a trading idea. Trading and investing carry a high level of risk. Past perfor-mance does not guarantee future results.
For a free subscription, visit our Web site:
managedfuturestodaymag.com
2 November2010•MAnAGED FuTurEs TODAY
mft-1110.indd 2 10/22/10 4:51 PM
INVESTMENT MYTH NO. 1:
What goes up must come down.
Not necessarily.
Markets rise and fall, but your investment portfolio doesn’t have to. Managed futures—an alternative asset class that has achieved strong performance in both up and down markets— invest across a broad spectrum of asset classes to achieve solid, long-term returns.
For more than a century, CME Group has helped investors and business leaders around the world manage—and mitigate—their risk. And now we can help you. As the world’s leading futures and options marketplace, we’re built on a tradition of trust and transparency. Today firms you’ve known for years are building managed futures portfolios to suit your needs. Ask your broker or advisor for more information on managed futures.
Futures trading is not suitable for all investors, and involves the risk of loss. Futures are a leveraged investment, and because only a percentage of a contract’s value is required to trade, it is possible to lose more than the amount of money deposited for a futures position. Therefore, traders should only use funds that they can afford to lose without affecting their lifestyles. And only a portion of those funds should be devoted to any one trade because they cannot expect to profit on every trade. All references to options refer to options on futures. Copyright © 2010 CME Group Inc. All rights reserved. CME Group is a trademark of CME Group Inc. The Globe Logo is a trademark of Chicago Mercantile Exchange Inc.
Learn more at www.cmegroup.com/mf
mft-1110.indd 3 10/22/10 4:51 PM
4 Q22010•MAnAGED FuTurEs TODAY
Strategy Focus
4 November2010•MAnAGED FuTurEs TODAY
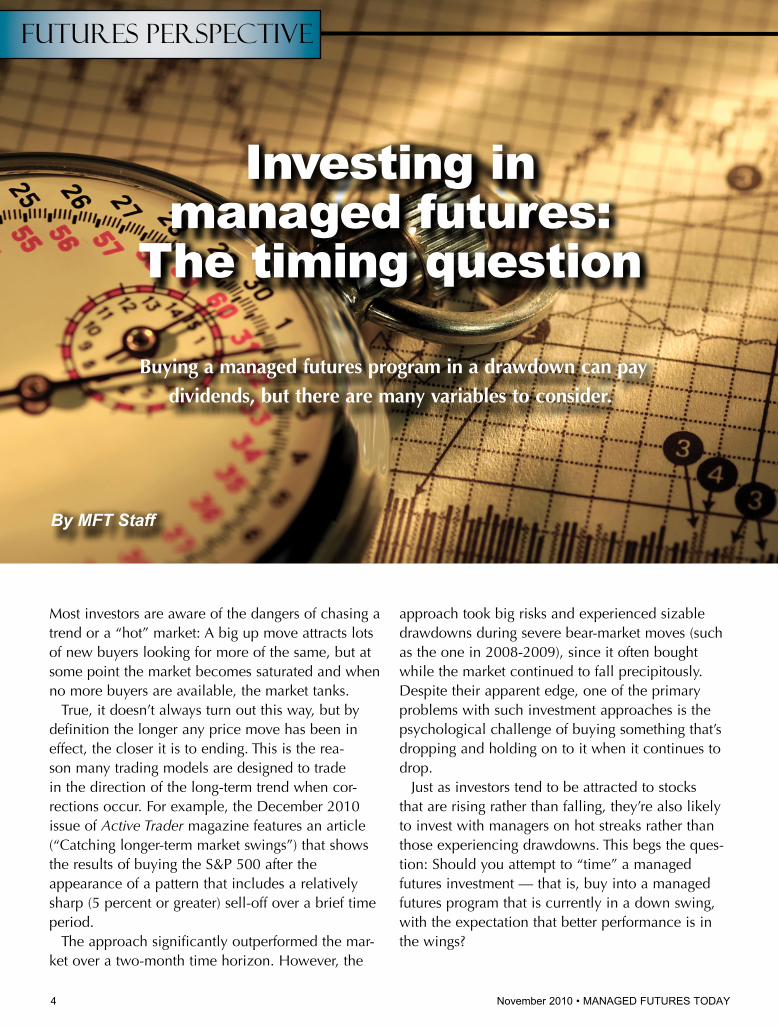
Most investors are aware of the dangers of chasing a trend or a “hot” market: A big up move attracts lots of new buyers looking for more of the same, but at some point the market becomes saturated and when no more buyers are available, the market tanks.
True, it doesn’t always turn out this way, but by definition the longer any price move has been in effect, the closer it is to ending. This is the rea-son many trading models are designed to trade in the direction of the long-term trend when cor-rections occur. For example, the December 2010 issue of Active Trader magazine features an article (“Catching longer-term market swings”) that shows the results of buying the S&P 500 after the appearance of a pattern that includes a relatively sharp (5 percent or greater) sell-off over a brief time period.
The approach significantly outperformed the mar-ket over a two-month time horizon. However, the
approach took big risks and experienced sizable drawdowns during severe bear-market moves (such as the one in 2008-2009), since it often bought while the market continued to fall precipitously. Despite their apparent edge, one of the primary problems with such investment approaches is the psychological challenge of buying something that’s dropping and holding on to it when it continues to drop.
Just as investors tend to be attracted to stocks that are rising rather than falling, they’re also likely to invest with managers on hot streaks rather than those experiencing drawdowns. This begs the ques-tion: Should you attempt to “time” a managed futures investment — that is, buy into a managed futures program that is currently in a down swing, with the expectation that better performance is in the wings?
Investing in managed futures:
The timing question
Buying a managed futures program in a drawdown can pay dividends, but there are many variables to consider.
By MFT Staff
Futures Perspective
mft-1110.indd 4 10/22/10 4:51 PM

5 Q22010•MANAGEDFUTURESTODAYMANAGEDFUTURESTODAY•November2010 5
Buying drawdowns
Two widely referenced studies from the 1990s, one originally published by noted author Jack Schwager in his book Managed Trading: Myths & Truths (John Wiley & Sons, 1996), and another from around the same time written by commodity trading advi-sor (CTA) Tom Basso, then of TrendStat Capital Management, argued that investing in managed futures programs during drawdowns was a profitable approach.
For example, Basso’s study, which simulated buy-ing CTAs experiencing three-month drawdowns, found the odds were better than 2 to 1 for positive performance over the following 12 months. Brandon Langley and Jon Robinson of Robinson-Langley Capital Management (www.rlcap.com) revisited the approach earlier this year (using trend-following CTAs) and also found it to be successful. Using data from three CTA-ranking sites, the authors compiled a portfolio of 32 trend-following programs with at least three-year track records and a minimum of $5 million under manage-ment. Negative three-month periods were followed by profitable 12-month peri-ods 1,393 times vs. unprofitable 12-month periods only 301 times for a ratio of 4.6:1. Also, both the Basso and Robinson-Langley studies found the opposite approach — selling after big equity run-ups — didn’t provide a similar benefit. (The article is available at: http://rlcap.com/downloads/RL%20Capital%20-%20Drawdown%20Study.pdf.)
Robinson and Langley conducted a similar test that replaced the three-month losing period with a six-month losing period and increased the forward-
performance window from 12 to 18 months. The performance was even better: 1,091 profitable vs. 156 unprofitable 18-month periods, a 7:1 ratio.
One of the limitations these studies acknowledged is that they incorporate some measure of “survivor-ship bias.” Because they’re based on portfolios of CTAs that have survived over the length of the anal-ysis period, the analysis by default is selecting “win-ners” and doesn’t reflect the performance of those funds that might have failed during that time.
Another recent study by Jeff Malec, CEO and founding partner of Chicago-based asset manage-ment firm Attain Capital Management (www.attaincapital.com), incorporated losing CTAs in its drawdown-buying analysis to combat survivor-ship bias. Malec analyzed the performance of five
separate CTA portfo-lios using different start dates between January 2002 and January 2006, adding to the invest-ment in a CTA when its drawdown reached half its maximum his-torical drawdown. This approach outperformed simply buying and holding all the CTAs, as well as an alternate approach that exited
CTAs when they reached 1.5 times their maximum historical drawdowns, and then rolled the funds into another CTA.
A subsequent study (www.attaincapital.com/alternative-investment-education/managed-futures-newsletter/investment_research_analysis/389) Malec’s firm conducted, which used drawdown duration rather than magnitude, showed that invest-ing in a program at its 21-month low point resulted
Just as investors tend to be attracted to stocks that are rising rather than falling,
they are also likely to invest with managers on hot
streaks rather than those experiencing drawdowns.
Continued on p. 6
mft-1110.indd 5 10/22/10 4:51 PM

6 November2010•MANAGEDFUTURESTODAY
in performance over the following 12 months that was two times the historical average 12-month per-formance. (Conversely, investing in a program at a 21-month high resulted in performance over the next 12 months that was only .70 of the average.)
The challenge, of course, is being able to apply such an approach with real money, which is an understandably difficult task for many investors.
“The success of it centers around being a contrar-ian investor and not chasing returns,” Malec says. “Most [investors] do not wait for drawdowns; [they] invest in programs at equity highs — likely because their brains are hard wired to avoid something that causes pain. It’s a rare investor who can look at a program at a 21-month low and say, ‘That’s the one I want to get in, instead of the one that has been going up the past two years.’”
Malec’s study also notes the importance of having a “line in the sand” — a stop-trading point at which you will exit an unsuccessful program (see “Track record length” for more information).
CompliCations
Investing in the real world is always more difficult than in a simulated environment. It could be argued the benefit of buying CTAs experiencing drawdowns hinges upon the ability to proactively identify “qual-ity” trading programs that are likely to survive and prosper in the long term — as much a challenge for an investor as knowing which individual stocks in a group are likely to go up or down over the next 12 months.
Using different drawdown definitions (time- or depth-based), altering the length of a time-based drawdown, deciding how often reinvestment will
occur, and changing the subsequent review period (two years, five years), will change the outcome of any historical analysis. These are decisions investors have to work out beforehand.
And these aren’t the only variables.BarclayHedge.com president Sol Waksman argues
the issue of investing in fund drawdowns isn’t as straightforward as some make it. He points out that one CTA’s drawdown might be a natural function of the program’s trading style — say, the tendency
of a trend-following fund to go into a draw-down when markets are wandering in trading ranges — while another CTA’s drawdown might be a case of a genuine breakdown in the trad-ing program.
“The question it really comes down to is whether the [draw-down] means the
wheels are coming off, or just that the system isn’t designed to deal with the current environment,” he says. “If you know the answer to that question, then yes, maybe [a drawdown] is a good time to add to your investment or to make an investment.”
But Waksman also points out investors must con-sider the other half of the “timing” equation.
“If you’re going to start timing, how do you deter-mine when to get out?” he asks.
Waksman says research he conducted years ago indicated that from a true investment perspective, there was little benefit to timing.
“If you’re a long-term investor, it doesn’t really matter,” he says. “Say you get in at a little bet-ter time. After a few years, what difference does it make whether you had a little bit more or less volatility in the first few months? In the end you still need a diversified portfolio.”
FuTurEs PErsPECTIVE
One CTA’s drawdown might be a natural function of
the program’s trading style, while another’s might be a
case of a genuine breakdown in the trading program.
mft-1110.indd 6 10/22/10 4:51 PM
MAnAGED FuTurEs TODAY•November2010 7
Waksman stresses that managed futures investors must do their due diligence and outline their risk and trade goals in advance.
“I think there are two things you need to ask yourself,” he says. “Number one — and this is before you put any money in — how much are you willing to lose? Where’s the exit? The only time you can have a rational opinion on that, in my mind, is before you’ve made the investment.”
More food for thought: Just as markets that have dropped significantly can some-times drop even more — just ask all the people who bought stocks in July and August 2008 — a negative trend in a CTA can be difficult to buck. Waksman gives the example of a fund with a compound annual rate of return of more than 20 percent over more than two decades, but which for the past four to five years has suffered massive redemptions — on the order of 90 percent.
“A rate of return over 20 percent for more than 20 years is a remarkable, remarkable achievement,” he notes. “Does that argue the case that [the fund] is going through a rough spot and now is a good time to buy? Well, maybe, but more people are voting in the other direc-tion. That’s telling you what investors are thinking.”
Ultimately, Waksman says, investing is hard work, and investors have to be hon-est with themselves about their goals as well as why they’re making decisions.
“The question is, why do you believe this manager is going to continue to pro-vide returns like the ones you’ve seen in the past? How are you coming to that decision?” he says. ◆
Track record length
One question many potential managed futures investors ask is, how long of a track record should a CTA have before I invest?
some advisors advocate looking for at least two, and preferably three years of returns; others recommend five years. But all usually qualify these thresholds with other criteria such as maximum historical drawdown and assets under management, among others.
Like the issue of buying on drawdowns, it’s not a cut-and-dried issue. Everything else being equal, of course, it’s dif-ficult to argue against investing in a CTA with a (successful) five-year track record vs. one with only a six-month record. More data means you have more information about the investment program’s longer-term potential and risk level. But in the real world “everything else” is rarely equal.
It is also not difficult to imagine exceptions. For example, what if the program with less than one year of performance is a new fund launched by an advisor with a longer-term record of successful funds? What if another new fund is designed to capture market conditions you believe are emerging?
sol Waksman of BarclayHedge says there could be valid reasons to invest in a new CTA with a brief track record. “Maybe they’re doing something new, and maybe you’re convinced this new methodology is the wave of the future and you’re willing to take a bet on that.”
Also, Waksman notes, in the case of the CTA with a lon-ger track record, you should consider the more recent per-formance results. “Are the risk-adjusted returns on a rolling basis improving or deteriorating?” he says. In other words, even if the CTA is profitable overall, has it been on a down-ward trajectory for the past two years?
“We generally like to see at least five years of track record before giving statistical significance to compound rate of return, maximum drawdown, sortino ratio (see p. 19 for definition), etc., but we realize that can eliminate a lot of talented emerging managers,” says Jeff Malec of Attain Capital Management.
For “emerging managers” (less than five years), Malec recommends at least a full year of performance. He then adjusts the maximum drawdown based on the track record length to determine the potential stop-out point. For exam-ple, the exit point for a CTA with a 10-year track record would be 1.5 times its maximum historical drawdown, while the exit point for a CTA with a one-year record would be five to 10 times its maximum drawdown. ◆
mft-1110.indd 7 10/22/10 4:51 PM

8 November2010•MAnAGED FuTurEs TODAY
Once you have decided to add managed futures to your investment portfolio, the next step is to build a sub-portfolio of CTA (commodity trading advisor) programs. There are more than 1,000 CTA programs available, and selecting the right mix of CTAs is necessary to achieve your investment objectives. At this stage it is very important to work with an expe-rienced managed futures portfolio advisor.
We spoke with numerous portfolio managers and there was consensus on the basic steps to integrat-ing managed futures into a portfolio. All agreed the first step is to set realistic objectives for the role of managed futures in the portfolio.
“The primary objective is to provide a return stream that is uncorrelated to traditional asset classes such as equities and fixed income,” says John FitzGibbon, managing director of Lighthouse Partners, a fund-of-funds manager with $4.5 billion under management. “When you think about periods like 1998, 2002, and 2008 (see Figure 1) — the most stressful periods in the markets — managed futures provided positive returns and dampened volatility in investors portfolios.”
Portfolio managers emphasize that investors need to view managed futures as a long-term invest-ment. “The returns in managed futures can come
in short bursts, and then there are often extended periods of side-ways movement or even a draw-down, so an investor needs to be patient,” says Matt Osborne, man-aging director of Altegris Advisors, an alternative investment advisor with $2.7 billion under advise-ment. “Investors need to view managed futures on a minimum three-year time frame.”
“Managed futures are about where the investment portfolio is going to be three to five years from now,” says Walter Gallwas, president of Attain Capital Management, a firm specializing
Constructing a managed futures portfolio
The basics of allocating to multiple managed futures programs follows the golden rules of
investing: Know your risk tolerance, diversify, and perform the necessary due diligence.
By MFT Staff
Futures Perspective
Figure 1: BArClAy CTA index vs. s&P 500 (ThrOugh July 2010)The Barclay CTA index has returned more than the S&P 500 over the past 30 years, and it has done especially well during times of financial stress, such as 2000-2002 and 2008.
Continued on p. 10
mft-1110.indd 8 10/22/10 4:51 PM
INVESTMENT MYTH NO. 2:
You’re already diversified.
Check again.
Stocks and bonds are a staple of a diversified portfolio, but are they enough? True diversi-fication means investing in assets that have low correlations with traditional asset classes like stocks and bonds. Managed futures offer this type of diversification.
For more than a century, CME Group has helped investors and business leaders around the world manage—and mitigate—their risk. And now we can help you. As the world’s leading futures and options marketplace, we’re built on a tradition of trust and transparency. Today firms you’ve known for years are building managed futures portfolios to suit your needs. Ask your broker or advisor for more information on managed futures.
Futures trading is not suitable for all investors, and involves the risk of loss. Futures are a leveraged investment, and because only a percentage of a contract’s value is required to trade, it is possible to lose more than the amount of money deposited for a futures position. Therefore, traders should only use funds that they can afford to lose without affecting their lifestyles. And only a portion of those funds should be devoted to any one trade because they cannot expect to profit on every trade. All references to options refer to options on futures. Copyright © 2010 CME Group Inc. All rights reserved. CME Group is a trademark of CME Group Inc. The Globe Logo is a trademark of Chicago Mercantile Exchange Inc.
Learn more at www.cmegroup.com/mf
mft-1110.indd 9 10/22/10 4:51 PM

10 Q22010•MANAGEDFUTURESTODAY
in managed futures through individually managed accounts. “It’s not about where corn is going to be after the next corn export report.”
diversifiCation
Just as the purpose of managed futures is to diversify an investment portfolio, the CTA programs chosen must be diversified within the asset class. Portfolio managers highlight four criteria of managed futures programs necessary to get the right mix of CTA trad-ing programs.
The first level of diversification is to invest in CTA programs that trade different markets. Futures offer exposure to a wide range of markets, such as energy, grains, foodstuffs, currencies, interest rates, and equity indexes. “The different markets give you some diversification right off the bat because they don’t necessarily move in tandem with each other or other assets,” FitzGibbon says.
The second level of diversification is to combine trend following and non-trend following CTAs. Trend followers try to profit from long-term trends in the markets, such as the natural gas downtrend in Figure 2. Note that trend followers, like all CTAs, can be either long (profit in rising markets) or short (profit in declining markets). As previously men-tioned, managed futures are a long-term investment: The sizable trends in natural gas occurred on aver-age every 67 weeks and lasted for an average of 38 weeks. It is also interesting to note that large trends in natural gas and many other commodity markets occurred in 2008-2009 when the equity markets lost nearly one-half their value.
“The non-correlation benefit of managed futures (to equities and fixed income) is primarily driven by the trend-following managers,” Osborne says. “That’s not to say that non-trend strategies aren’t great and can’t be integrated into a portfolio. We believe they should be, but the predominance is trend following.”
Non-trend following CTAs include short-term trad-ers, fundamental traders, spread trading and indi-vidual market specialists. Short-term traders often try to profit from brief reversals of the long-term trend or trading off the news and events of the day or week. Fundamental traders use the traditional supply and demand for a commodity as a predictor
of its future price. Spread traders exploit differentials between markets such as corn vs. wheat or between different delivery months of the same commodity. Individual market specialists are CTAs who focus on a specific market segment such as grains, energies or interest rates. “Typically the non-trend-following segments are non-correlated with each other and non-correlated with the trend-following compo-nent,” Osborne says.
The third level of diversification is the time frame on which a CTA trades. The time frame is basically the average length of time the CTA is in a trade. Trading time frames are either short-term (10 days or less), medium-term (11 to 30 days) or long-term (more than 30 days), although it is common for long-term trend followers to hold a position for six months to a year or more. By investing with CTAs using different time frames you have the potential to take advantage of short, medium and long-term market moves. For example, short-term traders tend to outperform long-term traders in choppy, sideways markets but long-term traders can capture huge moves when markets go into long-term trends.
Investors should work with their advisor to choose CTAs that diversify the managed futures allocation across markets, trading styles, and time frames. “You could achieve diversification with as few as seven or eight managers, or as many as 30,” FitzGibbon says. “Our Lighthouse Managed Futures Program currently has 23 CTA managers diversified across trend-following programs, short-term trading pro-grams and fundamentally based programs. The fundamentally based programs are predominantly specialists in their markets such as metals, energy, grains, livestock equity indexes and financial futures.”
risk level
It is an old adage in futures trading that rewards and risks are always balanced. If a CTA is producing large percentage gains, it is probably also incurring large drawdowns (the percentage of the portfolio lost before it regains its former peak value). A man-aged futures portfolio advisor will have measures of CTAs’ risk-adjusted returns, such as the Sharpe Ratio and Sortino Ratio (see p. 19 for definitions), that will help investors chose a portfolio of CTAs with
10 November2010•MAnAGED FuTurEs TODAY
FuTurEs PErsPECTIVE
mft-1110.indd 10 10/22/10 4:51 PM

MAnAGED FuTurEs TODAY•Q22010 11MANAGEDFUTURESTODAY•November2010 11
risk-reward ratios commensurate with an investor’s risk tolerance. (See “Looking beyond return” in Managed Futures Today, May 2010.)
“The first conversation we like to have with a client is about risk,” Gallwas says. “If a client says he’s comfortable with 20-percent risk, we’ll look at managers who have a 10-percent drawdown, where we’ve given the program room to exceed its historical risk.”
due diligenCe
As with all trading, it is imperative for an investor to do his home-work. Working with a portfolio advisor can make this process easier.
“A typical mistake investors make is to be wooed by the return profile of a CTA without doing full and complete due diligence on the manager,” Osborne says. “Investors overweight a performance assess-ment instead of looking at the experience of the people involved and their process in terms of run-ning a business. We’ve seen many great traders whose businesses failed because of lack of opera-tional discipline and infrastructure.”
“Our due diligence process can take six to nine months,” Gallwas says. “We try to quantify opera-tional risk as much as possible. Is it a one-man band out of his basement? Is he building an infra-structure? There are a lot of times we like the per-formance of a CTA but operationally he just doesn’t know what he’s doing, and we’re not willing to take that risk on any manager.”
However, the biggest mistake investors make, according to the portfolio advisors we spoke with, is chasing the hot, new CTA. “It’s human nature to assume that what happened in the past will per-sist into the future,” FitzGibbon says. “But when it comes to allocating to trend-following managers, it’s not uncommon that their best-performing periods are followed by their steepest drawdowns.”
Using the example of natural gas from Figure 2, a trend-following CTA probably would have had stel-lar profits through the first half of 2006, been flat or down for the remainder of 2006 and all of 2007, and experienced renewed profitability from the large uptrend in the first half of 2008 and the huge downtrend for the rest of 2008 and the first three quarters of 2009. (Remember, CTAs can profit from both rising and falling markets, so profitability is determined by the size and breadth of the trend, not its direction.)
According to FitzGibbon, a common error is “to invest in a trend-following program very late in the cycle and then watch the program go into a signifi-cant drawdown. [Investors] buy the top and effec-tively sell the bottom.” He adds: “It’s probably easier to know when to get on the train than it is to know when to get off.”
While there are myriad details in constructing a managed futures portfolio, the basics are pretty sim-ple: Set realistic objectives and know your risk toler-ance. Think long-term. Diversify you CTA portfolio in terms of markets traded, trading styles, and time frames. Do as much due diligence on how a CTA runs his business as you do on his returns. Don’t chase the hot, new CTA. Finally, work with an expe-rienced managed futures portfolio advisor.◆
Figure 2: lOng-Term Trends in nATurAl gAsLike many commodity markets, the natural gas market exhibits trending periods followed by non-trending, choppy price action. Long-term trend followers tend to profit in uptrends and downtrends while short-term trad-ers profit when no clear trend exists.
mft-1110.indd 11 10/22/10 4:51 PM

The financial crisis of 2008-2009 left many investors asking “Who exactly is managing my money?” With the explosion in new financial products over the last decade, many new money managers were not registered with any government agency or industry self-regulatory organization. The Dodd-Frank Wall Street Reform and Consumer Protection Act now requires many of these new financial product man-gers to register.
However, registration is nothing new in the man-aged futures industry; it’s been required since 1983. Your commodity trading advisor (CTA) must be registered with the Commodities Futures Trading Commission (CFTC), the government agency that oversees futures trading, and be a member of the National Futures Association (NFA), the futures industry self-regulatory organization. In addition,
every CTA must pass the National Commodity Futures Examination, often referred to as the Series 3 Exam.
The Series 3 Exam uses 120 questions to test applicants’ knowledge of futures trading theory and practice and market regulation. Experienced traders are advised to devote 40-50 hours studying for the exam, while newer traders will need to study more than 100 hours to pass the exam.
During registration, CTAs are required to provide extensive background information about their busi-ness, including: the listed principals of the firm, and which of the principals holds more than 10 percent financial interest in the firm; the business address and contact information of the CTA; whether the firm has been involved in any regulatory actions, NFA arbitrations or CFTC reparations; and the his-
tory of the firm’s NFA status. The NFA makes all the information
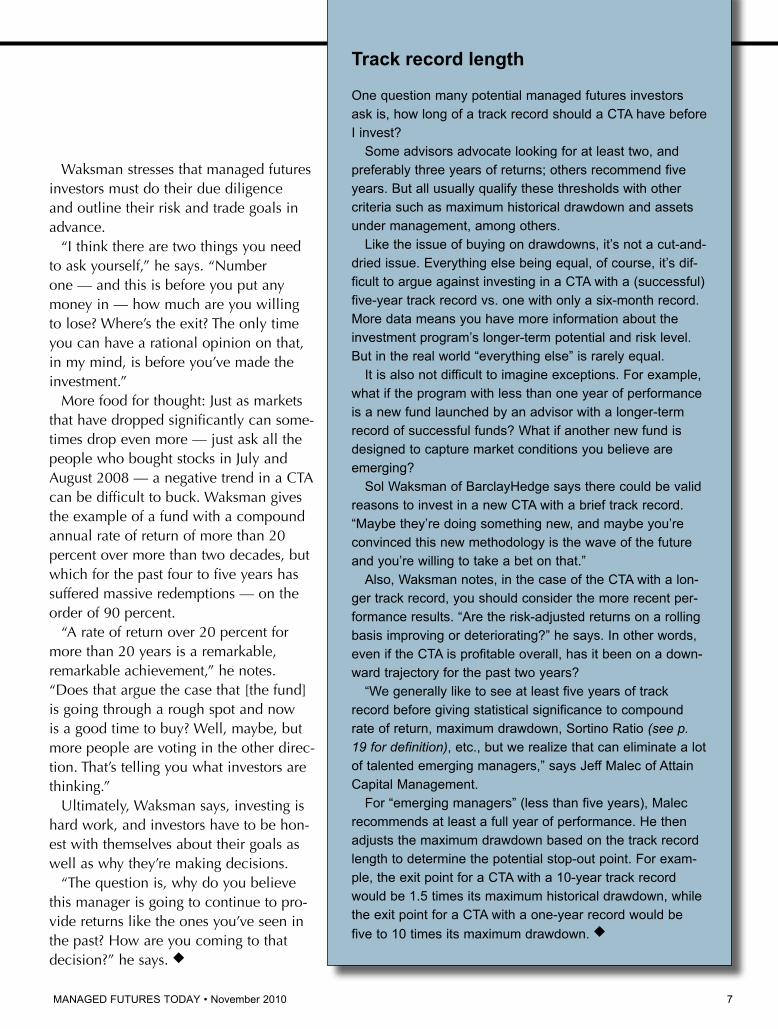
available in an easy-to-use web format called the Background Affiliation Status Information Center (BASIC) portion of its website at www.nfa.futures.org/basicnet/welcome.aspx.
“The best investor protection is inves-tor education,” says Larry Dyekman, NFA director of communications and education. “All investors should do extensive due diligence before making any investment.” ◆
Who is minding my money?
CTA registration requirements promote due diligence.
By MFT Staff
12 November2010•MAnAGED FuTurEs TODAY
Futures Perspective
The NFA’s BASIC system makes it easy to find registration information about CTAs, CPOs and futures trading firms.
nFA BACkgrOund AFFiliATiOn sTATus inFOrmATiOn CenTer
mft-1110.indd 12 10/22/10 4:51 PM

3-Day Admission is $99 per person*
*Early-bird price is valid until 11/3/10, afterwhich the price is $199 per person.
Silver Sponsorsto Register Today! Mention priority code 019523
www.AdvisorsMoneyShow.com Call 800/970-4355 or Visit
MoneyShow | Githler Center | 1258 North Palm Ave. | Sarasota, FL 34236 USA
a Production of
The
Join Fellow Financial Advisors in Orlando This Fall & Discover the Best Ways to Navigate Choppy Markets
The Peabody Hotel | November 17-19, 2010
Orlando, FL
Newt GingrichCharles Maxwell David WyssDaniel Fuss Margaret PatelJack Ablin
SAVE $100Register Before
November 3, 2010!
Earn CE Credits!
Thought Leadership Provided by
Attend and Identify:• Unique Perspectives on the Economy and the Markets• Innovative Ways to Grow Your Business in a New World Order• New Trends in ETFs, Asset Allocation, and Alternative Strategies• Tactics for Managing Risk, Income, and Safety• Profitable Opportunities in Promising Sectors• The Latest in Alternative Investments for Your Clients
Exchange Partner
Gold Sponsors
mft-1110.indd 13 10/22/10 4:51 PM
14 November2010•MANAGEDFUTURESTODAY
Strategy Focus
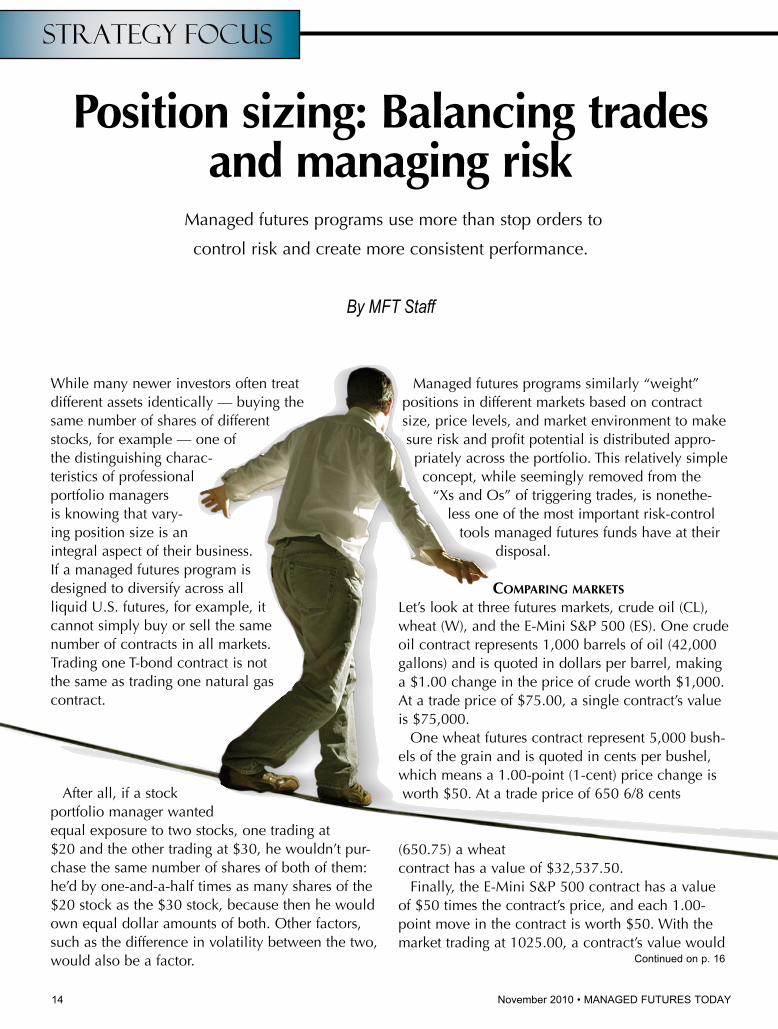
While many newer investors often treat different assets identically — buying the same number of shares of different stocks, for example — one of the distinguishing charac-teristics of professional portfolio managers is knowing that vary-ing position size is an integral aspect of their business. If a managed futures program is designed to diversify across all liquid U.S. futures, for example, it cannot simply buy or sell the same number of contracts in all markets. Trading one T-bond contract is not the same as trading one natural gas contract.
After all, if a stock portfolio manager wanted equal exposure to two stocks, one trading at $20 and the other trading at $30, he wouldn’t pur-chase the same number of shares of both of them: he’d by one-and-a-half times as many shares of the $20 stock as the $30 stock, because then he would own equal dollar amounts of both. Other factors, such as the difference in volatility between the two, would also be a factor.
Managed futures programs similarly “weight” positions in different markets based on contract size, price levels, and market environment to make sure risk and profit potential is distributed appro-priately across the portfolio. This relatively simple concept, while seemingly removed from the
“Xs and Os” of triggering trades, is nonethe-less one of the most important risk-control
tools managed futures funds have at their disposal.
Comparing markets
Let’s look at three futures markets, crude oil (CL), wheat (W), and the E-Mini S&P 500 (ES). One crude oil contract represents 1,000 barrels of oil (42,000 gallons) and is quoted in dollars per barrel, making a $1.00 change in the price of crude worth $1,000. At a trade price of $75.00, a single contract’s value is $75,000.
One wheat futures contract represent 5,000 bush-els of the grain and is quoted in cents per bushel, which means a 1.00-point (1-cent) price change is worth $50. At a trade price of 650 6/8 cents
(650.75) a wheat contract has a value of $32,537.50.
Finally, the E-Mini S&P 500 contract has a value of $50 times the contract’s price, and each 1.00-point move in the contract is worth $50. With the market trading at 1025.00, a contract’s value would
Position sizing: Balancing trades and managing risk
Managed futures programs use more than stop orders to
control risk and create more consistent performance.
By MFT Staff
Continued on p. 16
mft-1110.indd 14 10/22/10 4:51 PM
INVESTMENT MYTH NO. 3:
A higher return means higher risk.
Maybe.
It’s a bedrock principle of investing. Or is it? You can reduce risk and increase returns by adding managed futures to a portfolio of stocks and bonds.
For more than a century, CME Group has helped investors and business leaders around the world manage—and mitigate—their risk. And now we can help you. As the world’s leading futures and options marketplace, we’re built on a tradition of trust and transparency. Today firms you’ve known for years are building managed futures portfolios to suit your needs. Ask your broker or advisor for more information on managed futures.
Futures trading is not suitable for all investors, and involves the risk of loss. Futures are a leveraged investment, and because only a percentage of a contract’s value is required to trade, it is possible to lose more than the amount of money deposited for a futures position. Therefore, traders should only use funds that they can afford to lose without affecting their lifestyles. And only a portion of those funds should be devoted to any one trade because they cannot expect to profit on every trade. All references to options refer to options on futures. Copyright © 2010 CME Group Inc. All rights reserved. CME Group is a trademark of CME Group Inc. The Globe Logo is a trademark of Chicago Mercantile Exchange Inc.
Learn more at www.cmegroup.com/mf
mft-1110.indd 15 10/22/10 4:51 PM
16 November2010•MANAGEDFUTURESTODAY
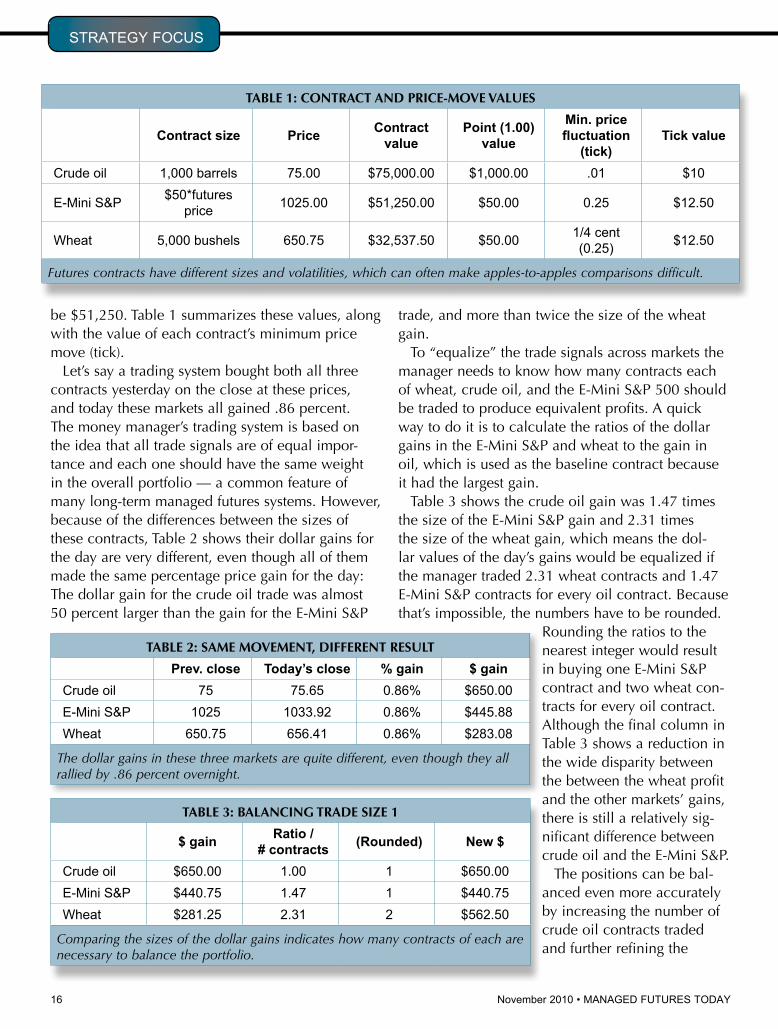
be $51,250. Table 1 summarizes these values, along with the value of each contract’s minimum price move (tick).
Let’s say a trading system bought both all three contracts yesterday on the close at these prices, and today these markets all gained .86 percent. The money manager’s trading system is based on the idea that all trade signals are of equal impor-tance and each one should have the same weight in the overall portfolio — a common feature of many long-term managed futures systems. However, because of the differences between the sizes of these contracts, Table 2 shows their dollar gains for the day are very different, even though all of them made the same percentage price gain for the day: The dollar gain for the crude oil trade was almost 50 percent larger than the gain for the E-Mini S&P
trade, and more than twice the size of the wheat gain.
To “equalize” the trade signals across markets the manager needs to know how many contracts each of wheat, crude oil, and the E-Mini S&P 500 should be traded to produce equivalent profits. A quick way to do it is to calculate the ratios of the dollar gains in the E-Mini S&P and wheat to the gain in oil, which is used as the baseline contract because it had the largest gain.
Table 3 shows the crude oil gain was 1.47 times the size of the E-Mini S&P gain and 2.31 times the size of the wheat gain, which means the dol-lar values of the day’s gains would be equalized if the manager traded 2.31 wheat contracts and 1.47 E-Mini S&P contracts for every oil contract. Because that’s impossible, the numbers have to be rounded.
Rounding the ratios to the nearest integer would result in buying one E-Mini S&P contract and two wheat con-tracts for every oil contract. Although the final column in Table 3 shows a reduction in the wide disparity between the between the wheat profit and the other markets’ gains, there is still a relatively sig-nificant difference between crude oil and the E-Mini S&P.
The positions can be bal-anced even more accurately by increasing the number of crude oil contracts traded and further refining the
sTrATEGY FOCus
TABle 2: sAme mOvemenT, diFFerenT resulT
Prev. close Today’s close % gain $ gainCrude oil 75 75.65 0.86% $650.00E-Mini s&P 1025 1033.92 0.86% $445.88Wheat 650.75 656.41 0.86% $283.08
The dollar gains in these three markets are quite different, even though they all rallied by .86 percent overnight.
TABle 3: BAlAnCing TrAde siZe 1
$ gain Ratio / # contracts (Rounded) New $
Crude oil $650.00 1.00 1 $650.00E-Mini s&P $440.75 1.47 1 $440.75Wheat $281.25 2.31 2 $562.50
Comparing the sizes of the dollar gains indicates how many contracts of each are necessary to balance the portfolio.
TABle 1: COnTrACT And PriCe-mOve vAlues
Contract size Price Contract value
Point (1.00) value
Min. price fluctuation
(tick)Tick value
Crude oil 1,000 barrels 75.00 $75,000.00 $1,000.00 .01 $10
E-Mini s&P $50*futures price 1025.00 $51,250.00 $50.00 0.25 $12.50
Wheat 5,000 bushels 650.75 $32,537.50 $50.00 1/4 cent (0.25) $12.50
Futures contracts have different sizes and volatilities, which can often make apples-to-apples comparisons difficult.
mft-1110.indd 16 10/22/10 4:51 PM

MAnAGED FuTurEs TODAY•November2010 17
ratios. For example, if the sys-tem purchased two oil contracts instead of one, the profit the next day would have doubled to $1,300. Table 4 shows nearly the same dollar profit would have been achieved by trading 2.95 E-Mini contracts and 4.62 wheat contracts —double the ratios from Table 3. Because these new ratios are much closer to whole numbers, when rounded the result of trading five wheat contracts and three E-Mini S&P contracts for every two crude oil contracts results in fairly comparable dollar results between the different markets, as shown in the final two columns. The balance between markets could be further refined by continuing this process, depending on the how much capital the manager has to allocate.
faCtoring in volatility
The previous example showed how positions in different futures markets could be made more com-parable based on one day’s trading activity and identical percentage moves in the three markets. Of course, in reality market conditions are constantly changing and trades are being opened and closed at different times, which makes the position-balancing process much more dynamic.
Although related futures contracts (such as dif-ferent stock indices) may often make similar-sized moves from day to day or week to week, most mar-kets have different volatility levels, which means position sizes will need to be adjusted on a regular basis as market conditions change. For example,
a manager could use the average daily percentage change over a certain period (for example, 20 days) as a simple volatility measure and adjust the number of contracts traded as this figure changes.
Instead of showing the percentage price change for a single day, Table 5 shows the average daily change for the past 20 days. (Note: The absolute value of price changes would be used, since we are concerned with the total amount of price move-ment, not its direction.) In this case, the markets’ different volatilities would result in different average dollar gains than those from Table 1. Here, the ratios between the crude oil, E-Mini S&P, and wheat con-tracts become 1 to 2.14 to 6.87 or, when rounded, 1 to 2 to 7. The final column shows trading seven wheat contracts and two E-Mini S&P 500 contracts for every crude oil contract produces fairly compa-rable dollar results. As in the previous example, the contract ratios could be refined further as desired.
ConsistenCy and risk management
Although position balancing might seem like a rela-tively unimportant aspect of trading, it is actually an integral part of any futures portfolio manager’s risk-control process: Managing the size and volatility dif-ferences between different futures contracts creates a stable trading framework and more-consistent and predictable performance results.◆
TABle 5: AdJusTing FOr vOlATiliTy
20-day avg. % gain Avg. $ gain Contract ratios (Rounded) New $Crude oil 1.26% $945.00 1.00 1 $945.00E-Mini s&P 0.86% $440.75 2.14 2 $881.50Wheat 0.42% $137.50 6.87 7 $962.50
Based on the average daily percentage price changes over the past 20 days, seven wheat contracts and two E-Mini S&P contracts will result in comparable dollar results.
TABle 4: BAlAnCing TrAde siZe 2
Ratio / # contracts $ Profit (Rounded) Actual $
Crude oil 2 $1,300.00 2 $1,300.00E-Mini s&P 2.95 $1,300.21 3 $1,322.25Wheat 4.62 $1,299.38 5 $1,406.25
Further refining the number of contracts produces more balanced results.
mft-1110.indd 17 10/22/10 4:51 PM
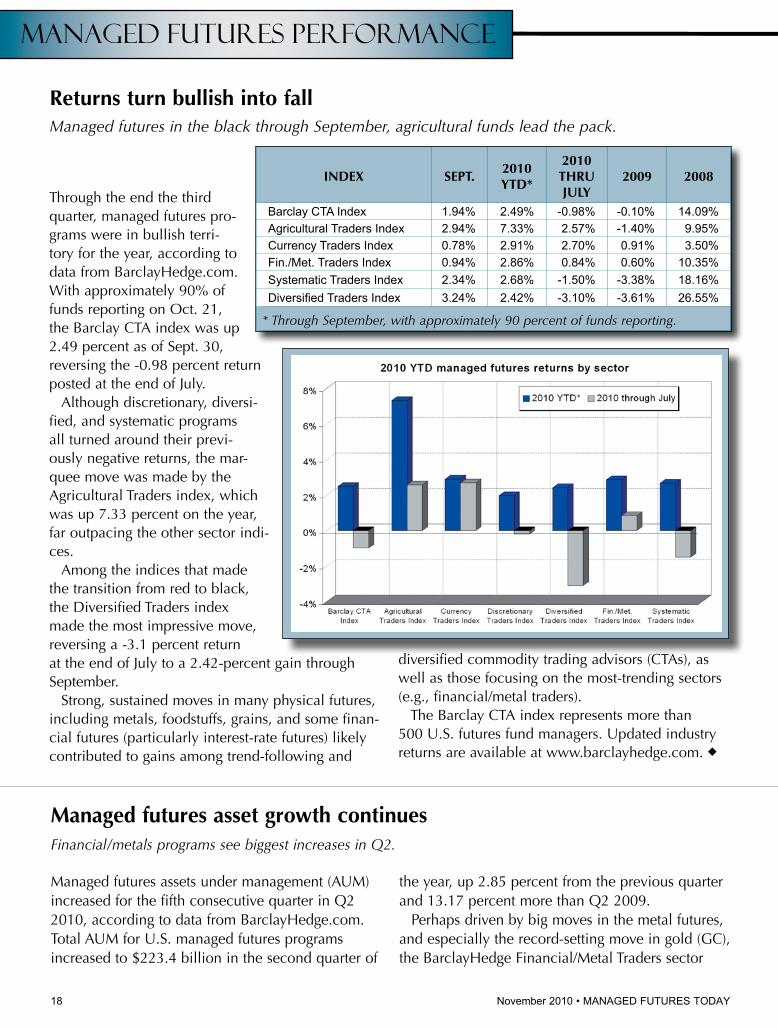
Through the end the third quarter, managed futures pro-grams were in bullish terri-tory for the year, according to data from BarclayHedge.com. With approximately 90% of funds reporting on Oct. 21, the Barclay CTA index was up 2.49 percent as of Sept. 30, reversing the -0.98 percent return posted at the end of July.
Although discretionary, diversi-fied, and systematic programs all turned around their previ-ously negative returns, the mar-quee move was made by the Agricultural Traders index, which was up 7.33 percent on the year, far outpacing the other sector indi-ces.
Among the indices that made the transition from red to black, the Diversified Traders index made the most impressive move, reversing a -3.1 percent return at the end of July to a 2.42-percent gain through September.
Strong, sustained moves in many physical futures, including metals, foodstuffs, grains, and some finan-cial futures (particularly interest-rate futures) likely contributed to gains among trend-following and
diversified commodity trading advisors (CTAs), as well as those focusing on the most-trending sectors (e.g., financial/metal traders).
The Barclay CTA index represents more than 500 U.S. futures fund managers. Updated industry returns are available at www.barclayhedge.com. ◆
18 November2010•MAnAGED FuTurEs TODAY
Managed Futures Performance
returns turn bullish into fall Managed futures in the black through September, agricultural funds lead the pack.
Managed futures assets under management (AUM) increased for the fifth consecutive quarter in Q2 2010, according to data from BarclayHedge.com. Total AUM for U.S. managed futures programs increased to $223.4 billion in the second quarter of
the year, up 2.85 percent from the previous quarter and 13.17 percent more than Q2 2009.
Perhaps driven by big moves in the metal futures, and especially the record-setting move in gold (GC), the BarclayHedge Financial/Metal Traders sector
managed futures asset growth continuesFinancial/metals programs see biggest increases in Q2.
index sePT.2010 yTd*
2010Thru July
2009 2008
Barclay CTA Index 1.94% 2.49% -0.98% -0.10% 14.09%Agricultural Traders Index 2.94% 7.33% 2.57% -1.40% 9.95%Currency Traders Index 0.78% 2.91% 2.70% 0.91% 3.50%Fin./Met. Traders Index 0.94% 2.86% 0.84% 0.60% 10.35%systematic Traders Index 2.34% 2.68% -1.50% -3.38% 18.16%DiversifiedTradersIndex 3.24% 2.42% -3.10% -3.61% 26.55%
* Through September, with approximately 90 percent of funds reporting.
mft-1110.indd 18 10/22/10 4:51 PM
MANAGEDFUTURESTODAY•November2010 19
Commodities at highest levels in two years Commodity indices challenging resistance in late October.
Commodity Snapshot
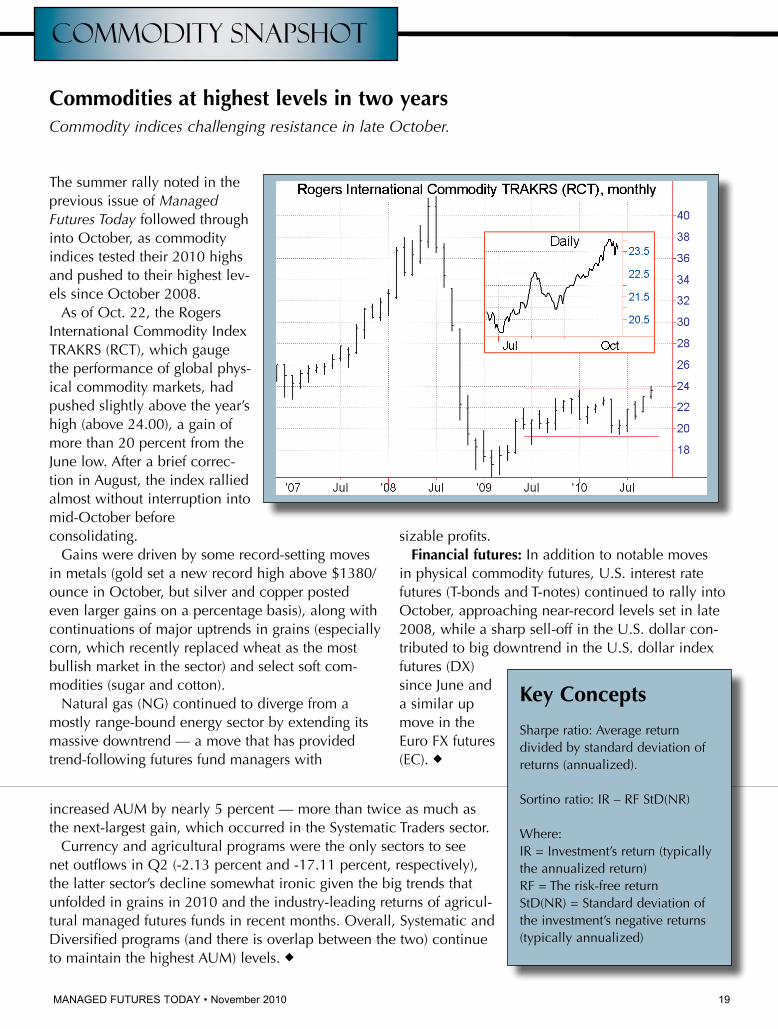
The summer rally noted in the previous issue of Managed Futures Today followed through into October, as commodity indices tested their 2010 highs and pushed to their highest lev-els since October 2008.
As of Oct. 22, the Rogers International Commodity Index TRAKRS (RCT), which gauge the performance of global phys-ical commodity markets, had pushed slightly above the year’s high (above 24.00), a gain of more than 20 percent from the June low. After a brief correc-tion in August, the index rallied almost without interruption into mid-October before consolidating.
Gains were driven by some record-setting moves in metals (gold set a new record high above $1380/ounce in October, but silver and copper posted even larger gains on a percentage basis), along with continuations of major uptrends in grains (especially corn, which recently replaced wheat as the most bullish market in the sector) and select soft com-modities (sugar and cotton).
Natural gas (NG) continued to diverge from a mostly range-bound energy sector by extending its massive downtrend — a move that has provided trend-following futures fund managers with
sizable profits.Financial futures: In addition to notable moves
in physical commodity futures, U.S. interest rate futures (T-bonds and T-notes) continued to rally into October, approaching near-record levels set in late 2008, while a sharp sell-off in the U.S. dollar con-tributed to big downtrend in the U.S. dollar index futures (DX) since June and a similar up move in the Euro FX futures (EC). ◆
increased AUM by nearly 5 percent — more than twice as much as the next-largest gain, which occurred in the Systematic Traders sector.
Currency and agricultural programs were the only sectors to see net outflows in Q2 (-2.13 percent and -17.11 percent, respectively), the latter sector’s decline somewhat ironic given the big trends that unfolded in grains in 2010 and the industry-leading returns of agricul-tural managed futures funds in recent months. Overall, Systematic and Diversified programs (and there is overlap between the two) continue to maintain the highest AUM) levels. ◆
key Concepts
Sharpe ratio: Average return divided by standard deviation of returns (annualized).
Sortino ratio: IR – RF StD(NR)
Where:IR = Investment’s return (typically the annualized return)RF = The risk-free returnStD(NR) = Standard deviation of the investment’s negative returns (typically annualized)
mft-1110.indd 19 10/22/10 4:51 PM

INVESTMENT MYTH NO. 4:
Smart money sticks to stocks and bonds.
Not anymore.
A simple switch to your portfolio can help you outsmart the smart money. Investors who add managed futures to their portfolios can achieve strong performance in any kind of economic environment. Be it a bull or bear market, managed futures generate strong, long-term track records.
For more than a century, CME Group has helped investors and business leaders around the world manage—and mitigate—their risk. And now we can help you. As the world’s leading futures and options marketplace, we’re built on a tradition of trust and transparency. Today firms you’ve known for years are building managed futures portfolios to suit your needs. Ask your broker or advisor for more information on managed futures.
Learn more at www.cmegroup.com/mf
Futures trading is not suitable for all investors, and involves the risk of loss. Futures are a leveraged investment, and because only a percentage of a contract’s value is required to trade, it is possible to lose more than the amount of money deposited for a futures position. Therefore, traders should only use funds that they can afford to lose without affecting their lifestyles. And only a portion of those funds should be devoted to any one trade because they cannot expect to profit on every trade. All references to options refer to options on futures. Copyright © 2010 CME Group Inc. All rights reserved. CME Group is a trademark of CME Group Inc. The Globe Logo is a trademark of Chicago Mercantile Exchange Inc.
mft-1110.indd 20 10/22/10 4:51 PM
Related Documents