RESEARCH M25 OFFICES INVESTMENT, DEVELOPMENT & OCCUPIER MARKETS Q1 2016 SOUTH EAST TAKE-UP RISES BY 30% PRIME RENTS CONTINUE TO INCREASE SEGRO PORTFOLIO SALE LARGEST DEAL FOR 2 YEARS

Welcome message from author
This document is posted to help you gain knowledge. Please leave a comment to let me know what you think about it! Share it to your friends and learn new things together.
Transcript
RESEARCH
M25 OFFICESINVESTMENT, DEVELOPMENT & OCCUPIER MARKETS Q1 2016
SOUTH EAST TAKE-UP RISES BY 30%
PRIME RENTS CONTINUE TO INCREASE
SEGRO PORTFOLIO SALE LARGEST DEAL FOR 2 YEARS
32
MARKET IN BRIEF Q1 2016
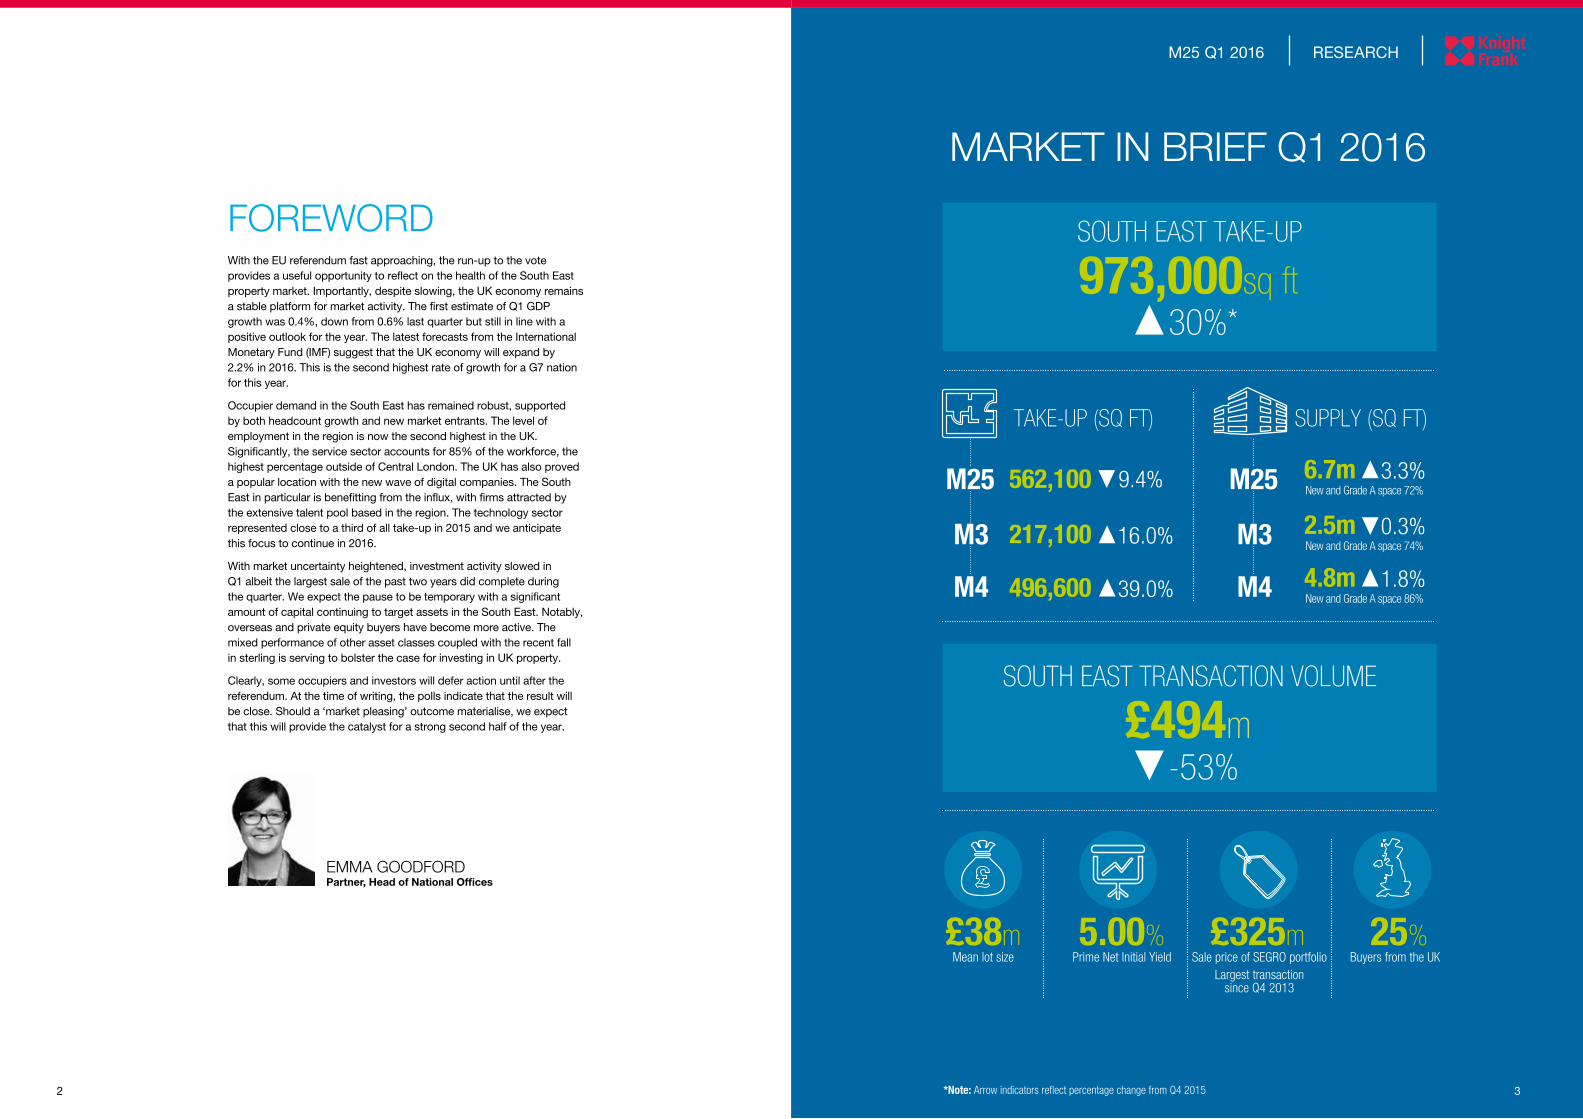
SOUTH EAST TAKE-UP
SOUTH EAST TRANSACTION VOLUME
TAKE-UP (SQ FT) SUPPLY (SQ FT)
New and Grade A space 72%
New and Grade A space 74%
New and Grade A space 86%
973,000sq ft
£494m
Buyers from the UKMean lot size Prime Net Initial Yield Sale price of SEGRO portfolioLargest transaction
since Q4 2013
25%£38m 5.00% £325m
30%*
-53%
9.4% 3.3%
0.3%
1.8%39.0%
16.0%
562,100 6.7m
2.5m
4.8m
217,100
496,600
M25 M25
M3 M3
M4 M4
*Note: Arrow indicators reflect percentage change from Q4 2015 3
RESEARCHM25 Q1 2016
With the EU referendum fast approaching, the run-up to the vote provides a useful opportunity to reflect on the health of the South East property market. Importantly, despite slowing, the UK economy remains a stable platform for market activity. The first estimate of Q1 GDP growth was 0.4%, down from 0.6% last quarter but still in line with a positive outlook for the year. The latest forecasts from the International Monetary Fund (IMF) suggest that the UK economy will expand by 2.2% in 2016. This is the second highest rate of growth for a G7 nation for this year.
Occupier demand in the South East has remained robust, supported by both headcount growth and new market entrants. The level of employment in the region is now the second highest in the UK. Significantly, the service sector accounts for 85% of the workforce, the highest percentage outside of Central London. The UK has also proved a popular location with the new wave of digital companies. The South East in particular is benefitting from the influx, with firms attracted by the extensive talent pool based in the region. The technology sector represented close to a third of all take-up in 2015 and we anticipate this focus to continue in 2016.
With market uncertainty heightened, investment activity slowed in Q1 albeit the largest sale of the past two years did complete during the quarter. We expect the pause to be temporary with a significant amount of capital continuing to target assets in the South East. Notably, overseas and private equity buyers have become more active. The mixed performance of other asset classes coupled with the recent fall in sterling is serving to bolster the case for investing in UK property.
Clearly, some occupiers and investors will defer action until after the referendum. At the time of writing, the polls indicate that the result will be close. Should a ‘market pleasing’ outcome materialise, we expect that this will provide the catalyst for a strong second half of the year.
FOREWORD
EMMA GOODFORD Partner, Head of National Offices
54
RESEARCHM25 Q1 2016
FIGURE 2
M25 Supply
0
2
4
6
8
10
12
Q1-Q42006
Q1-Q42007
Q1-Q42008
Q1-Q42009
Q1-Q42010
Q1-Q42011
Q1-Q42012
Q1-Q42013
Q1-Q42014
Q1-Q42015
Q12016
Mill
ions
(Sq
ft)
10-YEAR AVERAGEAVAILABILITY
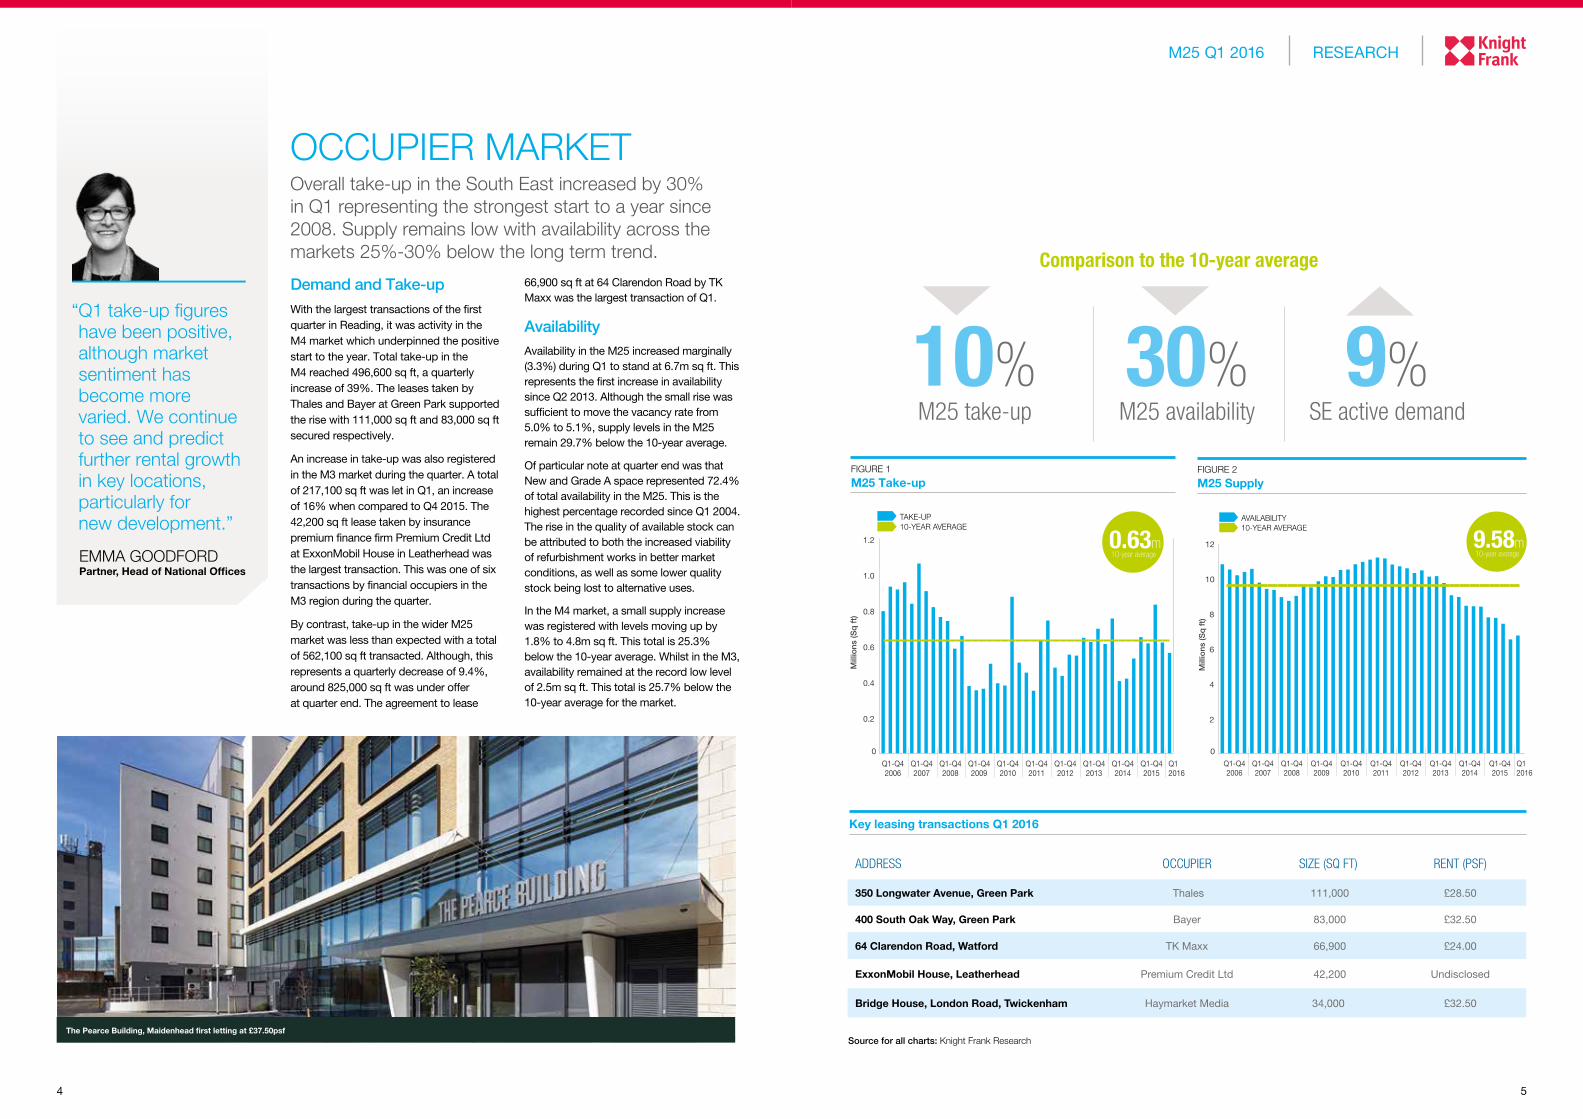
9.58m10-year average
FIGURE 1
M25 Take-up
0
0.2
0.4
0.6
0.8
1.0
1.2
Q1-Q42006
Q1-Q42007
Q1-Q42008
Q1-Q42009
Q1-Q42010
Q1-Q42011
Q1-Q42012
Q1-Q42013
Q1-Q42014
Q1-Q42015
Q12016
Mill
ions
(Sq
ft)
10-YEAR AVERAGETAKE-UP
0.63m10-year average
Demand and Take-upWith the largest transactions of the first quarter in Reading, it was activity in the M4 market which underpinned the positive start to the year. Total take-up in the M4 reached 496,600 sq ft, a quarterly increase of 39%. The leases taken by Thales and Bayer at Green Park supported the rise with 111,000 sq ft and 83,000 sq ft secured respectively.
An increase in take-up was also registered in the M3 market during the quarter. A total of 217,100 sq ft was let in Q1, an increase of 16% when compared to Q4 2015. The 42,200 sq ft lease taken by insurance premium finance firm Premium Credit Ltd at ExxonMobil House in Leatherhead was the largest transaction. This was one of six transactions by financial occupiers in the M3 region during the quarter.
By contrast, take-up in the wider M25 market was less than expected with a total of 562,100 sq ft transacted. Although, this represents a quarterly decrease of 9.4%, around 825,000 sq ft was under offer at quarter end. The agreement to lease
66,900 sq ft at 64 Clarendon Road by TK Maxx was the largest transaction of Q1.
AvailabilityAvailability in the M25 increased marginally (3.3%) during Q1 to stand at 6.7m sq ft. This represents the first increase in availability since Q2 2013. Although the small rise was sufficient to move the vacancy rate from 5.0% to 5.1%, supply levels in the M25 remain 29.7% below the 10-year average.
Of particular note at quarter end was that New and Grade A space represented 72.4% of total availability in the M25. This is the highest percentage recorded since Q1 2004. The rise in the quality of available stock can be attributed to both the increased viability of refurbishment works in better market conditions, as well as some lower quality stock being lost to alternative uses.
In the M4 market, a small supply increase was registered with levels moving up by 1.8% to 4.8m sq ft. This total is 25.3% below the 10-year average. Whilst in the M3, availability remained at the record low level of 2.5m sq ft. This total is 25.7% below the 10-year average for the market.
OCCUPIER MARKETOverall take-up in the South East increased by 30% in Q1 representing the strongest start to a year since 2008. Supply remains low with availability across the markets 25%-30% below the long term trend.
Source for all charts: Knight Frank ResearchThe Pearce Building, Maidenhead first letting at £37.50psf
“ Q1 take-up figures have been positive, although market sentiment has become more varied. We continue to see and predict further rental growth in key locations, particularly for new development.”
EMMA GOODFORD Partner, Head of National Offices
ADDRESS OCCUPIER SIZE (SQ FT) RENT (PSF)
350 Longwater Avenue, Green Park Thales 111,000 £28.50
400 South Oak Way, Green Park Bayer 83,000 £32.50
64 Clarendon Road, Watford TK Maxx 66,900 £24.00
ExxonMobil House, Leatherhead Premium Credit Ltd 42,200 Undisclosed
Bridge House, London Road, Twickenham Haymarket Media 34,000 £32.50
Key leasing transactions Q1 2016
30% M25 availability
9% SE active demand
10% M25 take-up
Comparison to the 10-year average
76
RESEARCHM25 Q1 2016
DEMAND
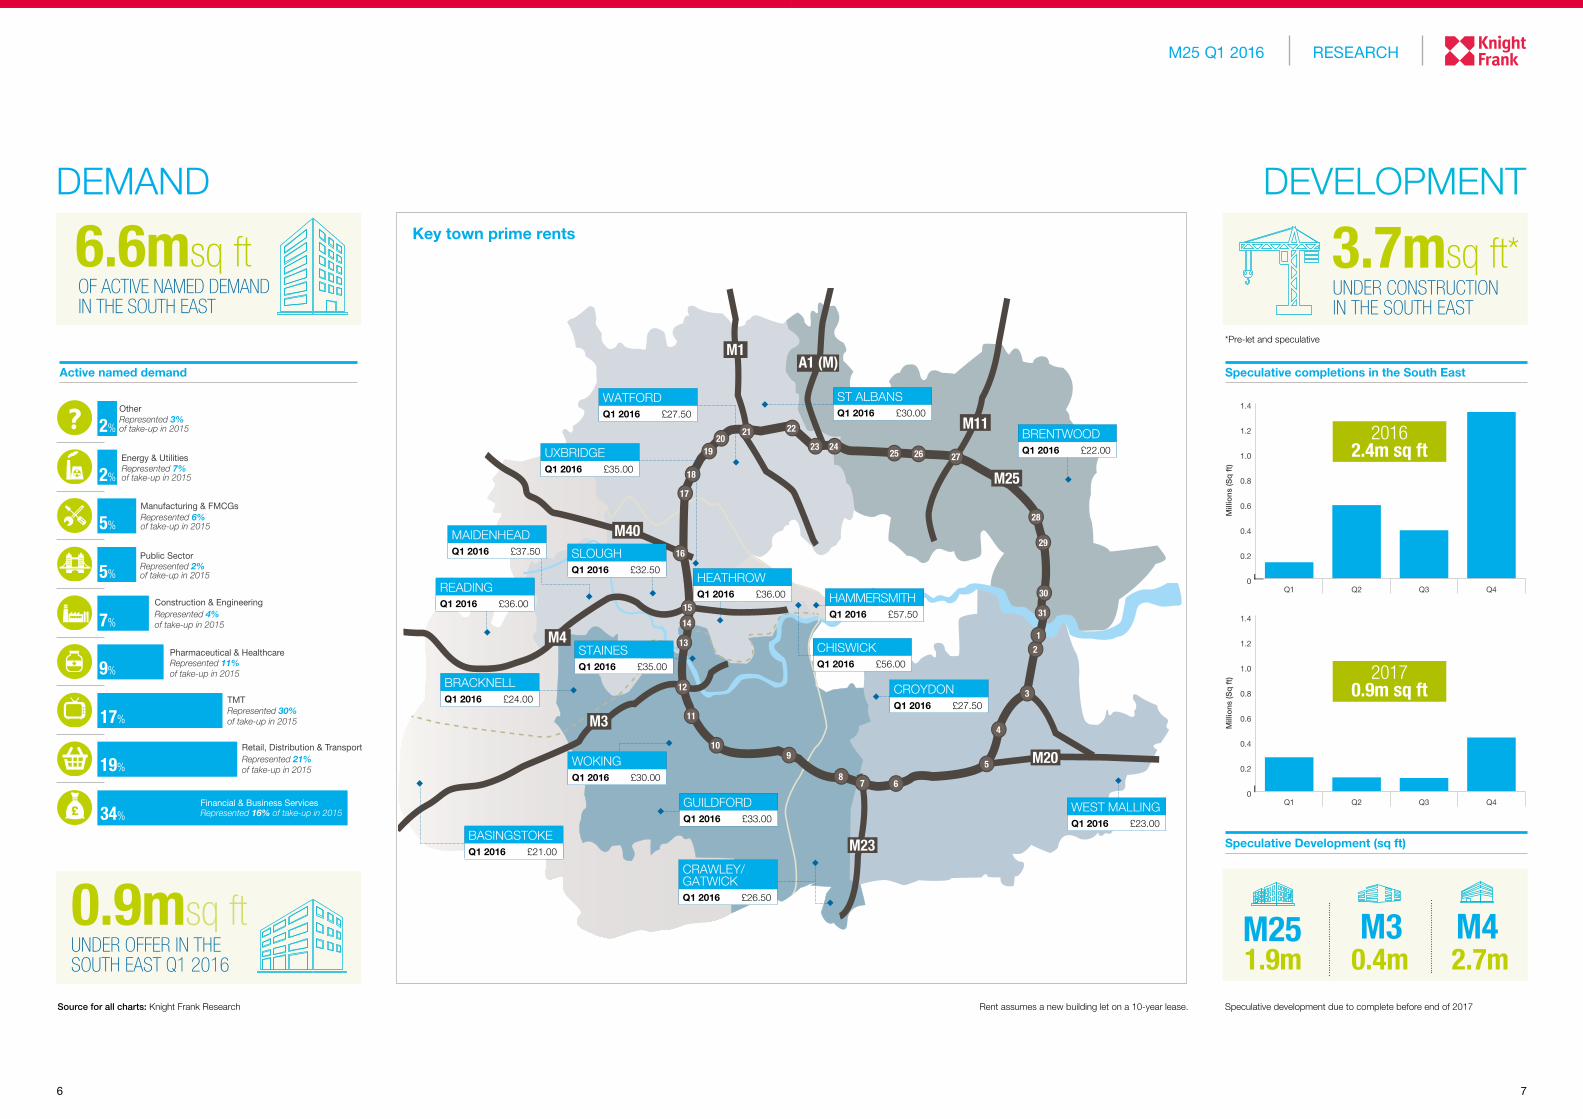
Source for all charts: Knight Frank Research Rent assumes a new building let on a 10-year lease. Speculative development due to complete before end of 2017
*Pre-let and speculative
Key town prime rents
UNDER CONSTRUCTION IN THE SOUTH EAST
3.7msq ft*
DEVELOPMENT
OF ACTIVE NAMED DEMAND IN THE SOUTH EAST
6.6msq ft
UNDER OFFER IN THE SOUTH EAST Q1 2016
0.9msq ft
Active named demand
Other
Energy & Utilities
Represented 3%of take-up in 2015
Pharmaceutical & Healthcare
Construction & Engineering
Manufacturing & FMCGs
Represented 2%of take-up in 2015
Represented 6%of take-up in 2015
Represented 7%of take-up in 2015
Represented 11%of take-up in 2015
Represented 4%of take-up in 2015
Represented 16% of take-up in 2015
Represented 21%of take-up in 2015
Represented 30%of take-up in 2015
Public Sector
Financial & Business Services
Retail, Distribution & Transport
TMT
2%
2%
5%
5%
7%
9%
17%
19%
34%
£
£
?
12
11
109
85
4
3
29
28
27262524
21
21
22
23
30
31
M25
M20
M23
A1 (M)
M11
M40
M4
M3
M1
2019
18
17
16
14
13
15
7 6
CHISWICKQ1 2016 £56.00
CROYDONQ1 2016 £27.50
ST ALBANSQ1 2016 £30.00
READINGQ1 2016 £36.00
WEST MALLINGQ1 2016 £23.00
GUILDFORDQ1 2016 £33.00
WOKINGQ1 2016 £30.00
BASINGSTOKEQ1 2016 £21.00
UXBRIDGEQ1 2016 £35.00
STAINESQ1 2016 £35.00
HAMMERSMITHQ1 2016 £57.50
HEATHROWQ1 2016 £36.00
0.4m 2.7m1.9mM25 M3 M4
Speculative completions in the South East
Speculative Development (sq ft)
Mill
ions
(Sq
ft)
0
0.2
0.4
0.6
0.8
1.0
1.2
1.4
Q4Q3Q2Q1
Mill
ions
(Sq
ft)
0
0.2
0.4
0.6
0.8
1.0
1.2
1.4
Q4Q3Q2Q1
Mill
ions
(Sq
ft)
0
0.2
0.4
0.6
0.8
1.0
1.2
1.4
Q4Q3Q2Q1
Mill
ions
(Sq
ft)
0
0.2
0.4
0.6
0.8
1.0
1.2
1.4
Q4Q3Q2Q1
2016 2.4m sq ft
2017 0.9m sq ftBRACKNELL
Q1 2016 £24.00
SLOUGHQ1 2016 £32.50
WATFORDQ1 2016 £27.50
CRAWLEY/GATWICKQ1 2016 £26.50
MAIDENHEADQ1 2016 £37.50
BRENTWOODQ1 2016 £22.00
98
RESEARCHM25 Q1 2016
FIGURE 3
Investment volumes
0
0.2
0.4
0.6
0.8
1.0
1.2
1.4
1.6 50
45
40
35
30
25
20
15
10
5
0Q1-Q42007
Q1-Q42008
Q1-Q42009
Q1-Q42010
Q1-Q42011
Q1-Q42012
Q1-Q42013
Q1-Q42014
Q1-Q42015
Q12016
Num
ber
of d
eals
Sto
ck tr
ansa
cted
(£bn
)
NUMBER OF DEALSSTOCK TRANSACTED (£m)
FIGURE 4
Prime net initial yield & finance
%
3 MONTH LIBOR
5 YEARSWAP
PRIME NETINITIAL YIELD
0
1
2
3
4
5
6
7
8
5.00
0.591.00
Q1-Q42007
Q1-Q42008
Q1-Q42009
Q1-Q42010
Q1-Q42011
Q1-Q42012
Q1-Q42013
Q1-Q42014
Q1-Q42015
Q12016
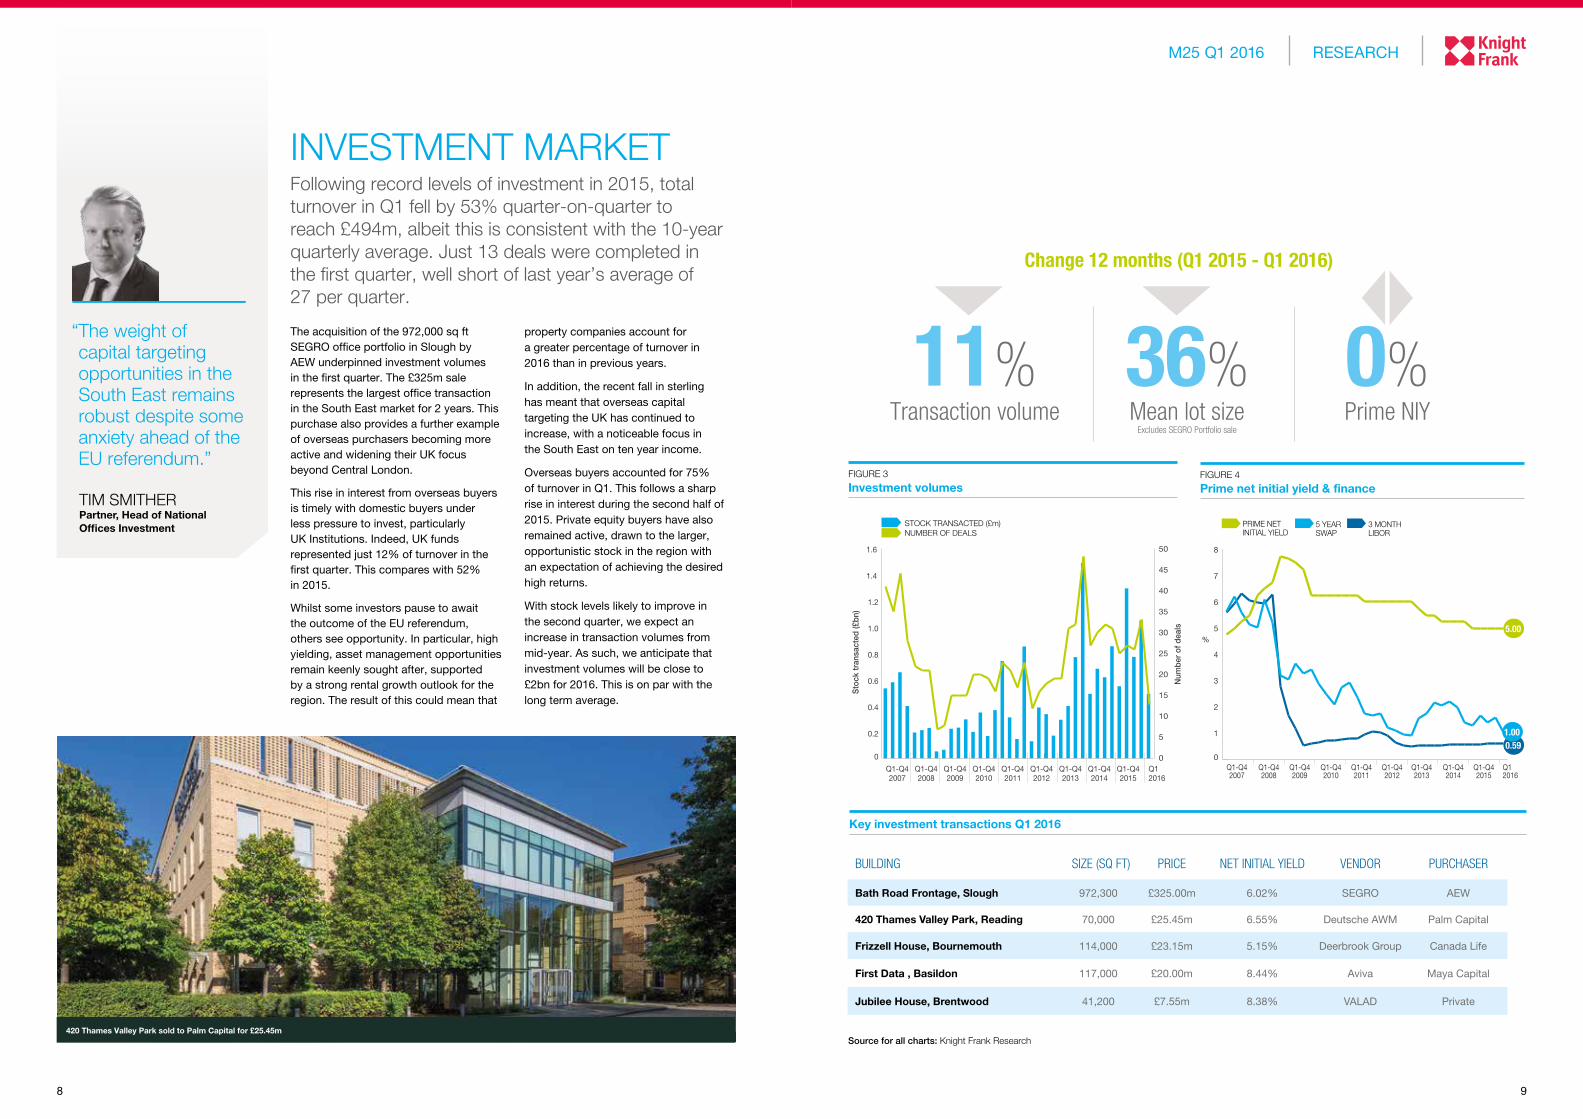
The acquisition of the 972,000 sq ft SEGRO office portfolio in Slough by AEW underpinned investment volumes in the first quarter. The £325m sale represents the largest office transaction in the South East market for 2 years. This purchase also provides a further example of overseas purchasers becoming more active and widening their UK focus beyond Central London.
This rise in interest from overseas buyers is timely with domestic buyers under less pressure to invest, particularly UK Institutions. Indeed, UK funds represented just 12% of turnover in the first quarter. This compares with 52% in 2015.
Whilst some investors pause to await the outcome of the EU referendum, others see opportunity. In particular, high yielding, asset management opportunities remain keenly sought after, supported by a strong rental growth outlook for the region. The result of this could mean that
property companies account for a greater percentage of turnover in 2016 than in previous years.
In addition, the recent fall in sterling has meant that overseas capital targeting the UK has continued to increase, with a noticeable focus in the South East on ten year income.
Overseas buyers accounted for 75% of turnover in Q1. This follows a sharp rise in interest during the second half of 2015. Private equity buyers have also remained active, drawn to the larger, opportunistic stock in the region with an expectation of achieving the desired high returns.
With stock levels likely to improve in the second quarter, we expect an increase in transaction volumes from mid-year. As such, we anticipate that investment volumes will be close to £2bn for 2016. This is on par with the long term average.
INVESTMENT MARKETFollowing record levels of investment in 2015, total turnover in Q1 fell by 53% quarter-on-quarter to reach £494m, albeit this is consistent with the 10-year quarterly average. Just 13 deals were completed in the first quarter, well short of last year’s average of 27 per quarter.
Source for all charts: Knight Frank Research
BUILDING SIZE (SQ FT) PRICE NET INITIAL YIELD VENDOR PURCHASER
Bath Road Frontage, Slough 972,300 £325.00m 6.02% SEGRO AEW
420 Thames Valley Park, Reading 70,000 £25.45m 6.55% Deutsche AWM Palm Capital
Frizzell House, Bournemouth 114,000 £23.15m 5.15% Deerbrook Group Canada Life
First Data , Basildon 117,000 £20.00m 8.44% Aviva Maya Capital
Jubilee House, Brentwood 41,200 £7.55m 8.38% VALAD Private
Key investment transactions Q1 2016
420 Thames Valley Park sold to Palm Capital for £25.45m
“ The weight of capital targeting opportunities in the South East remains robust despite some anxiety ahead of the EU referendum.”
TIM SMITHER Partner, Head of National Offices Investment
Change 12 months (Q1 2015 - Q1 2016)
36% Mean lot size
Excludes SEGRO Portfolio sale
0% Prime NIY
11% Transaction volume

RYAN DEANPartnerNational Offices+44 20 7861 [email protected]
ASHLEY DREWETTPartnerNational Offices+44 20 7861 [email protected]
RODDY ABRAMPartnerNational Offices+44 20 7861 [email protected]
WILL FOSTERPartnerNational Offices+44 20 7861 [email protected]
1110
RICHARD CLAXTONPartner+44 20 7861 [email protected]
TIM SMITHERPartner Head of National Offices Investment+44 20 7861 [email protected]
SIMON RICKARDSPartner+44 20 7861 [email protected]
DR LEE ELLIOTTPartner Head of Commercial Research+44 20 7861 [email protected]
DARREN MANSFIELDAssociate+44 20 7861 [email protected]
EMMA GOODFORDPartnerHead of National Offices+44 20 7861 1144 [email protected]
DISRUPTION = DEMANDThere has arguably never been a more disruptive time to be in business. The orthodoxy surrounding the global economic cycle has been severely challenged. The onset and subsequent aftermath of the Global Financial Crisis (GFC) has reset the definition of normal and instilled a new, more cautious corporate mind-set.
CONTACTS
Capital Markets
Research
National Offices
“ Business is faced with a new disruptive landscape. Companies that recognise the contribution that real estate can make in advancing strategic intent are winning through.”
DR LEE ELLIOTT Partner, Head of Commercial Research
Businesses are consequently responding to operating conditions characterised by lower growth trajectories; lower levels of demand; lower levels of inflation; greater globalisation; greater geo-political uncertainty; and, accordingly, greater economic and demand side volatility.
It doesn’t end there. Structural disruption is at work too and is having a marked impact upon the operating models, competitive position and the viability of businesses the world over. King amongst these structural disruptions is the insatiable and inescapable rise of technology. As well as emerging as a dominant sector in its own right, technology has transformed the how, where and why of all businesses. It has redefined working processes, increased the speed to market for innovative products and services, decreased the duration of competitive advantage associated with such innovation, and has had markedly positive impacts on business productivity and efficiency. Furthermore, technology has necessitated and facilitated an on-line presence to promote brand, services and drive revenue.
But perhaps most fundamentally technology has reshaped the very quantum and quality of skills required by
modern business. This skills requirement, so necessary for the transformation of traditional businesses into modern, digital and hence sustainable enterprises, exposes them to a further pressure – the war for talent.
Business is thus faced with a new disruptive landscape. Competitive, compelling businesses must not only negotiate the changeable macro-economic environment of a post GFC world, but must also effectively respond to the twin challenges of technology and talent. What are the implications of these challenges to the corporate real estate decision? How does the choice of location or building support or detract from the ability to respond effectively?
Real estate mattersCompanies that recognise the contribution that real estate can make in advancing strategic intent are winning through. Resilience and competitive advantage derives from well considered real estate choices. In contrast, those that operate with a staid supply-chain driven mentality with steady-state projections of real estate needs lose their edge as they are frequently challenged by the disruptive impacts of new technology, the associated need for new talent and emergent organisational change.
In an age of disruption we maintain that the real estate decision is:
• More complex and has far greater strategic significance attached to it than ever before
• Increasingly predicated by the supply of talent
• Leading to new patterns of occupancy where traditional market boundaries are breaking down
• Focused upon locations and buildings that foster a compelling sense of place and serve as talent magnets
War for Talent
A new approach to space
Technology
Mobility
Restructuring
Co-working
CAUS
EEF
FECT
For the latest news, views and analysisof the commercial property market, visitknightfrankblog.com/commercial-briefing/
COMMERCIAL BRIEFING
Important Notice© Knight Frank LLP 2016 – This report is published for general information only and not to be relied upon in any way. Although high standards have been used in the preparation of the information, analysis, views and projections presented in this report, no responsibility or liability whatsoever can be accepted by Knight Frank LLP for any loss or damage resultant from any use of, reliance on or reference to the contents of this document. As a general report, this material does not necessarily represent the view of Knight Frank LLP in relation to particular properties or projects. Reproduction of this report in whole or in part is not allowed without prior written approval of Knight Frank LLP to the form and content within which it appears. Knight Frank LLP is a limited liability partnership registered in England with registered number OC305934. Our registered office is 55 Baker Street, London, W1U 8AN, where you may look at a list of members’ names.
Knight Frank Commercial Research provides strategic advice, consultancy services and forecasting to a wide range of clients worldwide including developers, investors, funding organisations, corporate institutions and the public sector. All our clients recognise the need for expert independent advice customised to their specific needs.
RECENT MARKET-LEADING RESEARCH PUBLICATIONS
Central London Quarterly Q1 2016
Knight Frank Research Reports are available at KnightFrank.com/Research
Specialist Property Report 2016
Global Cities Skyscrapers 2015
SKYSCRAPERS2015 REPORT
GLOBAL CITIES
OVERVIEW POTENTIAL BRAKES OUTLOOK
SPECIALIST PROPERTY
momentum
2016
RESEARCH
SUPPLY REMAINS CONSTRAINED
CENTRAL LONDONQUARTERLY – OFFICES Q1 2016
RESEARCH
RENTS IN MOST DISTRICTS AT HISTORIC HIGHS
PRIME YIELDS REMAIN STABLE
Global Cities The 2016 Report
GL
OB
AL
CIT
IES
THE 2016 REPORT
KNIGHTFRANK.COM/GLOBALCITIES
NGKF.COM/GLOBALCITIES
THE FUTURE OF REAL ESTATE IN THE WORLD’S LEADING CITIES
GLOBALCITIES
THE 2016 REPORT
TECHNICAL NOTE• Knight Frank define the M4 market as extending from Hammersmith, west to Newbury, incorporating Uxbridge and
High Wycombe to the north and Staines and Bracknell to the south. Reading is also included. Existing built office stock in the M4 market totals 72m sq ft.
• The M3 market incorporates the main South West London boroughs and encompasses Leatherhead, Guildford and Basingstoke extending north to the M4 boundary described above. Farnborough and Camberley are also included. Existing built office stock in the M3 market totals 42.0m sq ft.
• The figures in this report relate to the availability of built, up-and-ready office/B1 accommodation within the M25 market. Vacant premises and leased space which is being actively marketed are included.
• The market definition used, shown in the map on page 3, is based on Local Authority District boundaries.
• All floorspace figures are given on a net internal area basis (as defined by the RICS).
• A minimum 10,000 sq ft (net) cut-off has been employed throughout. Major and minor refurbishment have been treated as new and second-hand respectively. Data is presented on a centre and quadrant basis. Classification by centre relates to the locational details contained within the marketing material for available properties. Classification in this manner is clearly somewhat arbitrary. Vacancy rate data is based on a total M25 stock measure of 132m sq ft (net), an M4 market stock of 72m sq ft (net) and an M3 market stock of 42.0m sq ft (net).
• Second-hand floorspace has been sub-divided into A and B grade accommodation, reflecting high and low quality respectively. Whilst subjective, this categorisation is based on an assessment of each property’s age, specification, location and overall attractiveness.
• The South East is defined as the market area shown in the map on page 7.
• Pre-let = The letting of proposed schemes not yet under construction and those let during the construction process.
• All data presented is correct as at March 31st 2016.
• Front Cover: The Bower, Stockley Park.
Related Documents