1 CHAPTER-1 Introduction

Welcome message from author
This document is posted to help you gain knowledge. Please leave a comment to let me know what you think about it! Share it to your friends and learn new things together.
Transcript
7/21/2019 LSCM Project Savitha
http://slidepdf.com/reader/full/lscm-project-savitha 1/59
1
CHAPTER-1
Introduction
7/21/2019 LSCM Project Savitha
http://slidepdf.com/reader/full/lscm-project-savitha 2/59
2
1.1 GENERAL INTRODUCTION:
Pareto Analysis:
Pareto Analysis is a statistical technique in decision-making used for the selection
of a limited number of tasks that produce significant overall effect. It uses the Pareto
Principle (also known as the 80/20 rule) the idea that by doing 20% of the work you can
generate 80% of the benefit of doing the entire job. In terms of quality improvement, a
large majority of problems (80%) are produced by a few key causes (20%). This is also
known as the vital few and the trivial many.
In the late 1940s quality management guru, Joseph M. Juran, suggested the principle
and named it after Italian economist Vilfredo Pareto, who observed that 80% of income
in Italy went to 20% of the population. Pareto later carried out surveys on a number of
other countries and found to his surprise that a similar distribution applied.
The 80/20 rule can be applied to almost anything:
80% of customer complaints arise from 20% of your products and services.
80% of delays in the schedule result from 20% of the possible causes of the delays.
20% of your products and services account for 80% of your profit.
20% of your sales-force produces 80% of your company revenues.
20% of a systems defects cause 80% of its problems.
The Pareto Principle has many applications in quality control. It is the basis for
the Pareto diagram, one of the key tools used in total quality control and Six Sigma.
In PMBOK, Pareto ordering is used to guide corrective action and to help the
project team take action to fix the problems that are causing the greatest number of
defects first.
7/21/2019 LSCM Project Savitha
http://slidepdf.com/reader/full/lscm-project-savitha 3/59
3
Eight steps to identifying the principal causes you should focus on, using Pareto
Analysis:
1. Create a vertical bar chart with causes on the x-axis and count (number of
occurrences) on the y-axis.2. Arrange the bar chart in descending order of cause importance, that is, the cause
with the highest count first.
3. Calculate the cumulative count for each cause in descending order.
4. Calculate the cumulative count percentage for each cause in descending order.
(Percentage calculation: {Individual Cause Count} / {Total Causes Count} *100)
5. Create a second y-axis with percentages descending in increments of 10 from
100% to 0%.
6. Plot the cumulative count percentage of each cause on the x-axis.
7. Join the points to form a curve.
8. Draw a line at 80% on the y-axis running parallel to the x-axis. Then drop the line
at the point of intersection with the curve on the x-axis. This point on the x-axis
separates the important causes on the left (vital few) from the less important
causes on the right (trivial many).
It enables you to see what 20% of cases are causing 80% of the problems and whereefforts should be focused to achieve the greatest improvement. In this case, we can see
that broken links, spelling errors and missing title tags should be the focus.
The value of the Pareto Principle for a project manager is that it reminds you to focus on
the 20% of things that matter. Of the things you do during your project, only 20% are
crucial. Those 20% produce 80% of your results. Identify and focus on those things first,
but don't entirely ignore the remaining 80% of causes.
Pareto analysis for prioritization:
Ideally, you want to focus your attention on fixing the most important problems. But how
do you decide which problems you need to deal with first? And are some problems caused
by the same underlying issue?
7/21/2019 LSCM Project Savitha
http://slidepdf.com/reader/full/lscm-project-savitha 4/59
4
Pareto Analysis is a simple technique for prioritizing possible changes by identifying the
problems that will be resolved by making these changes. By using this approach, you can
prioritize the individual changes that will most improve the situation.
Pareto Analysis uses the Pareto Principle – also known as the "80/20 Rule" – which isthe idea that 20 percent of causes generate 80 percent of results. With this tool, we're
trying to find the 20 percent of work that will generate 80 percent of the results that doing
all of the work would deliver.
Competition is extremely high in Hyderabad restaurants for the following reasons:
The restaurant services from the service providers are similar;
Customers within the market are price-sensitive and they strongly believe quality
restaurant
Customers have stronger bargaining power as the cost to switch to another service
is considered as low.
The hospitality industry has strong market competition; therefore, customer satisfaction
and retaining loyalty will be crucial for a hotel’s success
Fine dining restaurants representing full service restaurants offer specific serving of
restaurant, with thematic ambience, formally dressed and well skilled staff. Fine diningrestaurant usually targets rich and upper middle class consumer segments and serves
the purpose of social gathering with tempting restaurant from local flavors to continental
cuisines.
1.2 NEED FOR THE PROECT:
These analysis finds how they are providing services to the customer’s needs.
These study helps to find which restaurants are giving better services in
Hyderabad.
To learn general market perception for restaurants in Hyderabad.
These study helps to find out the problems in restaurants
7/21/2019 LSCM Project Savitha
http://slidepdf.com/reader/full/lscm-project-savitha 5/59
5
1.3 SCOPE OF THE STUDY:
This project is useful for the better understanding of the services of restaurants. The
project encompasses the various behavior of customer, their pre and post behavior whenthey eat. There is also overview of the consumer’s attraction towards food restaurants
services, mostly consumer perceptions are changing and most of the consumer now
prefers to eat in restaurants. The project work involves specific guidelines for the
restaurant and helps the restaurants to understand the food dining restaurants services
according to the customer perception.
1.4 OBJECTIVE OF THE STUDY:
To know how they are providing Quality food service at competitive price.
To know Quality Dining Area.
To analyze the consumer behavior towards consumption of food services
To know how they are providing Quick Services and Enjoyable atmosphere for
customers.
7/21/2019 LSCM Project Savitha
http://slidepdf.com/reader/full/lscm-project-savitha 6/59
6
CHAPTER – 2
REVIEW OF LITERATURE
7/21/2019 LSCM Project Savitha
http://slidepdf.com/reader/full/lscm-project-savitha 7/59
7
REVIEW OF LITERATURE:
Project report on entrepreneurship fast restaurant restaurant services:
Our Fast restaurant business is a new addition in the fast restaurant industry with
high aims to facilitate people with healthy restaurants, which have marvelous health full
ingredients. Our promise is to give your body healthful products. Due to increasing the
needs, wants and demand of foreign cuisine we decided to launched our fast restaurant
center on a small scale. It’s a partnership based business. And we provided self-
purchasing services and free home delivery within Jalal purjattan. We also make our
contract with schools and colleges that we deliver our products at the time of recess
(break) in schools and colleges. We also launched a playground area for kids because if
families come then their kids don’t get bore, the basic purpose of playground are is to
entertain and here opportunity is there are no playground.
Analysis of competitor:
It’s a fundamental of business where you have competition along your business. If
you want to overcome your competitor you must have knowledge of that business as
much you have your own. Similarly 3ArS Fast Restaurant is facing considerable competitors
in Gujarat area like;
KFC
MacDonald’s
UFC
Sawad
AFC
Domino
Pizza huts…etc But here our opportunity is, no one have any branch in Jalal pur Jattan.
7/21/2019 LSCM Project Savitha
http://slidepdf.com/reader/full/lscm-project-savitha 8/59
8
Marketing plan:
Objective of marketing manager: According to the marketing manager of 3ArS Fast
Restaurant that marketing department has two objectives;
The first department of 3ArS Fast Restaurant is to create the awareness
and provide the following information to the higher authorities of 3ArS
Fast Restauran t
This department shows the marketing position of the organization.
This department shows the market share of 3ArS Fast Restaurant
This department gives the suggestion to the higher authorities for the future
improvement.
This department provides the information about their competitors to the higher
authorities of 3ArS Fast Restauran t
The second basic objective of Marketing Department is that it meets the budget in
the required time span. The marketing department of 3ArS Fast Restaurant is to
promote its products and make the future plan to live in the budget.
Every business needs the information’s about market before going to start. These
information’s will help in achieving the goals and setting targets. There are different
contents for the assessment of any market, which are given under here:
Market Segmentation:
3ArS Fast Restaurant will be marketed to people on the basis of demographic,
psychographic and geographic characteristics.
Behavioral characteristics:
In behavioral aspect they segmented the market on the basis of quality, taste
and price. Following are the different possible segments in this regard.
Taste conscious
Quality conscious
Class conscious
Combination of price and quality
7/21/2019 LSCM Project Savitha
http://slidepdf.com/reader/full/lscm-project-savitha 9/59
9
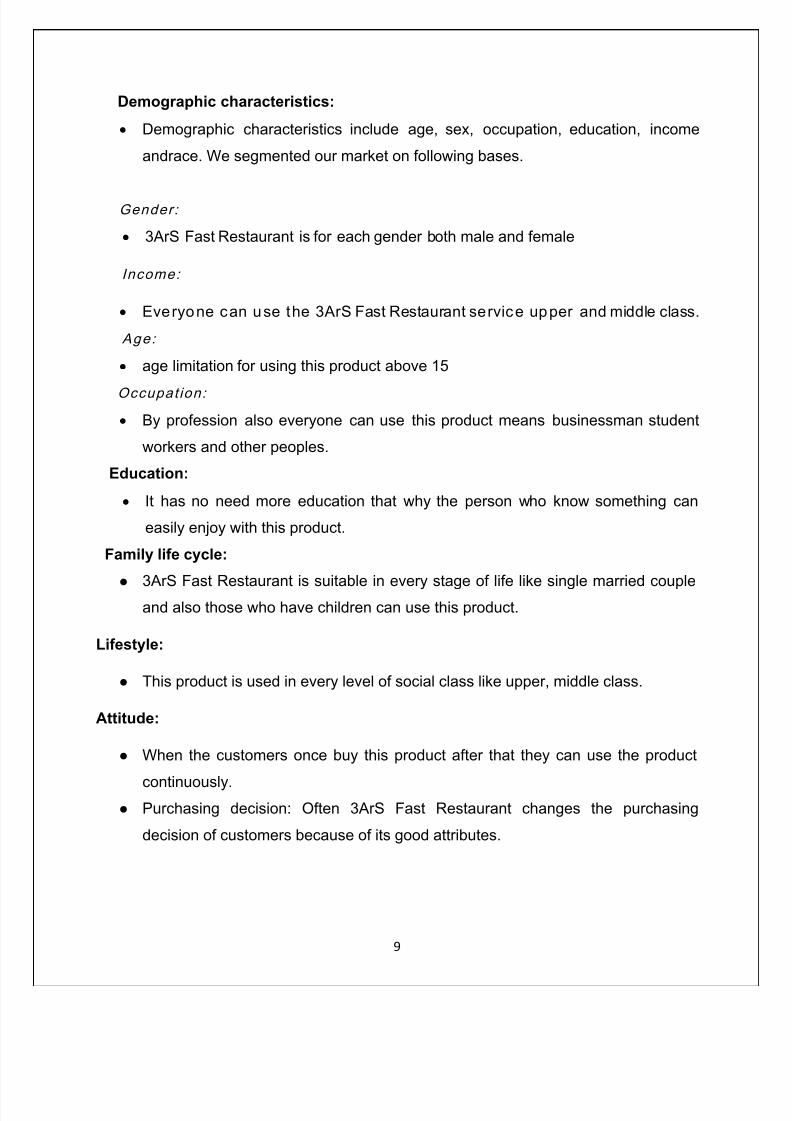
Demographic characteristics:
Demographic characteristics include age, sex, occupation, education, income
andrace. We segmented our market on following bases.
Gender:
3ArS Fast Restaurant is for each gender both male and female
Income:
Everyone can use the 3ArS Fast Restaurant service upper and middle class.
Age:
age limitation for using this product above 15
Occupat ion:
By profession also everyone can use this product means businessman student
workers and other peoples.
Education:
It has no need more education that why the person who know something can
easily enjoy with this product.
Family life cycle:
3ArS Fast Restaurant is suitable in every stage of life like single married couple
and also those who have children can use this product.
Lifestyle:
This product is used in every level of social class like upper, middle class.
Attitude:
When the customers once buy this product after that they can use the product
continuously. Purchasing decision: Often 3ArS Fast Restaurant changes the purchasing
decision of customers because of its good attributes.
7/21/2019 LSCM Project Savitha
http://slidepdf.com/reader/full/lscm-project-savitha 10/59
10
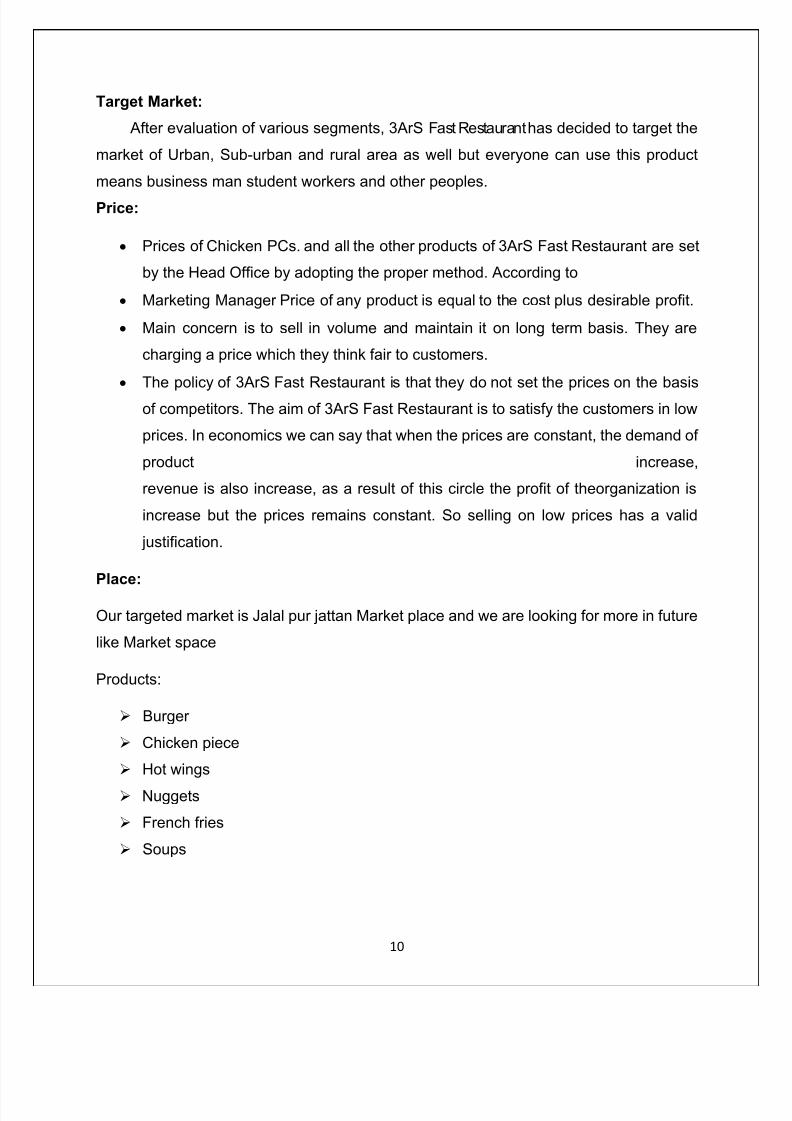
Target Market:
After evaluation of various segments, 3ArS Fast Restaurant has decided to target the
market of Urban, Sub-urban and rural area as well but everyone can use this product
means business man student workers and other peoples.
Price:
Prices of Chicken PCs. and all the other products of 3ArS Fast Restaurant are set
by the Head Office by adopting the proper method. According to
Marketing Manager Price of any product is equal to the cost plus desirable profit.
Main concern is to sell in volume and maintain it on long term basis. They are
charging a price which they think fair to customers.
The policy of 3ArS Fast Restaurant is that they do not set the prices on the basis
of competitors. The aim of 3ArS Fast Restaurant is to satisfy the customers in low
prices. In economics we can say that when the prices are constant, the demand of
product increase,
revenue is also increase, as a result of this circle the profit of theorganization is
increase but the prices remains constant. So selling on low prices has a valid
justification.
Place:
Our targeted market is Jalal pur jattan Market place and we are looking for more in future
like Market space
Products:
Burger
Chicken piece
Hot wings
Nuggets
French fries
Soups
7/21/2019 LSCM Project Savitha
http://slidepdf.com/reader/full/lscm-project-savitha 11/59
11
CHAPTER - 3
ABOUT THE COMPANY
7/21/2019 LSCM Project Savitha
http://slidepdf.com/reader/full/lscm-project-savitha 12/59
12
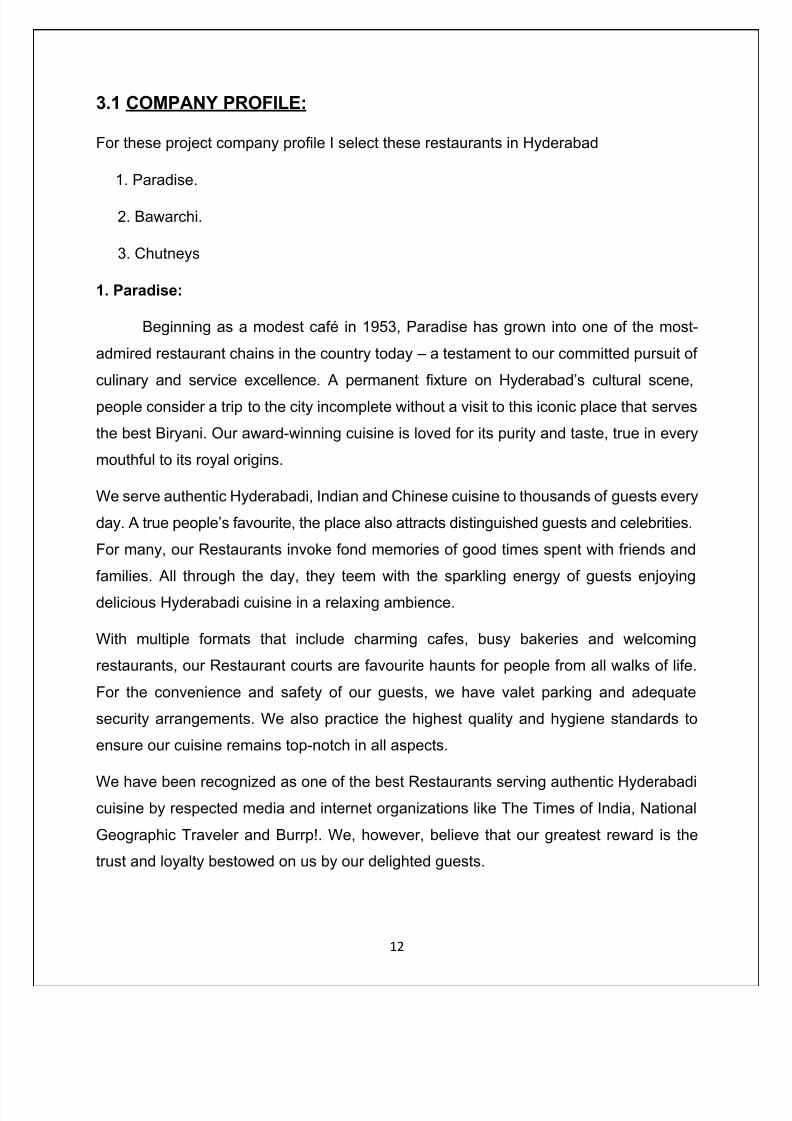
3.1 COMPANY PROFILE:
For these project company profile I select these restaurants in Hyderabad
1. Paradise.
2. Bawarchi.
3. Chutneys
1. Paradise:
Beginning as a modest café in 1953, Paradise has grown into one of the most-
admired restaurant chains in the country today – a testament to our committed pursuit of
culinary and service excellence. A permanent fixture on Hyderabad’s cultural scene,
people consider a trip to the city incomplete without a visit to this iconic place that serves
the best Biryani. Our award-winning cuisine is loved for its purity and taste, true in every
mouthful to its royal origins.
We serve authentic Hyderabadi, Indian and Chinese cuisine to thousands of guests every
day. A true people’s favourite, the place also attracts distinguished guests and celebrities.
For many, our Restaurants invoke fond memories of good times spent with friends and
families. All through the day, they teem with the sparkling energy of guests enjoying
delicious Hyderabadi cuisine in a relaxing ambience.
With multiple formats that include charming cafes, busy bakeries and welcoming
restaurants, our Restaurant courts are favourite haunts for people from all walks of life.
For the convenience and safety of our guests, we have valet parking and adequate
security arrangements. We also practice the highest quality and hygiene standards to
ensure our cuisine remains top-notch in all aspects.
We have been recognized as one of the best Restaurants serving authentic Hyderabadicuisine by respected media and internet organizations like The Times of India, National
Geographic Traveler and Burrp!. We, however, believe that our greatest reward is the
trust and loyalty bestowed on us by our delighted guests.
7/21/2019 LSCM Project Savitha
http://slidepdf.com/reader/full/lscm-project-savitha 13/59
13
2. Bawarchi Restaurant:
Our aim is to bring the best in Indian subcontinent cuisine with an emphasis on
refined yet creative cooking that applies eastern flavours with a western twist, on
traditional method. Our chefs have devised the traditional and seasonal dishes throughtheir expert knowledge of regional cooking and preparation diversity of sources and
developments. They make every effort to select and combine the very finest ingredients
so that you can enjoy a delicious, high quality meal every time. These unique and
innovative new dishes create the ultimate dining experience that ensures customers to
visit again. Experience our revolutionary cuisines today and leave with a par excellence
feeling of dining out event.
Any user interacting with our site and providing Bawarchi Biryani Point with name,address, telephone number, e-mail address, domain name or URL or any other personally
identifiable information permits Bawarchi Biryani Point (www.bawarchibiryanipoint.com)
to use such information for commercial purposes of its own, including contacting Users
about products and services which may be of interest. For each visitor to our web site,
our web server recognizes only the visitor's domain name, not the e-mail address. We
collect information volunteered by the visitor, such as form submittals and/or site
registrations. This information is used to improve the content of our web site, it is not
shared with other organizations for commercial purposes. Any User who does not wish
to receive further contacts from Bawarchi Biryani Point should send Bawarchi Biryani
Point a specific request (i.e., stating do not use or do not shareorboth) by email marked
"Privacy-Urgent" addressed to Bawarchi Biryani Point does not sell, rent or otherwise
disclose its mailing lists to third parties. Bawarchi Biryani Point reserves the right to modify
this Acceptable Use Policy at any time in its sole and absolute discretion
3. Chutney's Restaurant:
Chutney's focuses on modern and traditional Indian restaurant...
Established in 2000, Chutney's is one of the South West's best eateries, located
in the heart of North Dorset on the ever evolving Gold Hill. For almost a decade, Chutneys
has graced Shaftesbury with its fine cuisine and has grown to be recognised locally and
7/21/2019 LSCM Project Savitha
http://slidepdf.com/reader/full/lscm-project-savitha 14/59
14
internationally with a reputation for excellence. We have created a relaxed and welcoming
ambiance, and our award winning chefs and front of house staff will offer you a unique
dining experience.
7/21/2019 LSCM Project Savitha
http://slidepdf.com/reader/full/lscm-project-savitha 15/59
15
2.2 INDUSTRY PROFILE:
The restaurant processing industry is one of the largest in terms of production,
consumption, export and growth prospects. Users can get detailed information on the
restaurant industry, restaurant productions, restaurant producers and opportunities in
restaurant processing sector in the country.
There are about 8 million restaurants in the world and some 300,000 restaurant
companies. The restaurant industry divides itself into full-service and fast-restaurant
restaurants. Full-service restaurants include family restaurants (such as Denny's), dinner
houses (Darden Restaurants' Red Lobster), and grill/buffet type eateries (Metromedia's
Ponderosa). The fast-restaurant sector includes sandwich shops, which means
hamburgers and Mexican restaurant, as well as pizza and chicken joints. Companies in
this sector include giants such as Kahala (Great Steak & Potato, Frullati Cafe), Texas
Pacific Group (Burger King), YUM! Brands (Taco Bell, KFC, Pizza Hut), and of course,
McDonald's. In a weak economy, the former category's stock suffers as people with less
disposable income settle for cheaper fare.
Overall restaurant sales have been rising just over 5% annually. However, the
supply of workers age 16 to 24, the primary pool for restaurant employees, has been
declining. To solve the problem, companies are hiring more retirees and immigrants, and
are increasingly making use of automation. A slowing economy should help offset a
shrinking labor force by keeping wages (often minimum) stable, thus posing less threat
to profits.
The restaurant industry is a classic mature market. Companies face stiff competition and
low profit margins. Given the latter, expect companies to continue growing through
acquisition rather than through building new units, which cost upwards of $1 million even
for a fast-restaurant unit. Making acquisitions gives companies a larger revenue base
over which to spread costs, and it also gives them more leverage with suppliers to keep
costs down. Demand should stay steady. With the rise of two-working adult families since
the 1980s, Americans have less time and energy to prepare their own meals and have
been eating out more frequently.
7/21/2019 LSCM Project Savitha
http://slidepdf.com/reader/full/lscm-project-savitha 16/59
16
COMPETITIVE LANDSCAPE:
Demographics, consumer tastes, and personal income drive demand. The
profitability of individual companies can vary: while QSRs rely on efficient operations and
high volume sales, FSRs rely on high-margin items and effective marketing. Large
companies have advantages in purchasing, finance, and marketing. Small companies
can compete by offering superior restaurant or service. The US industry is highly
fragmented: the 50 largest companies account for about 20% of revenue.
Restaurants compete with companies that serve meals or prepared restaurants,
including grocery stores, warehouse clubs, delis, and convenience stores. In addition,
restaurants compete with home cooking.
PRODUCTS, OPERATIONS & TECHNOLOGY
Products include appetizers, entrées/main dishes, desserts, and beverages. The
restaurant processing industry in India is a sunrise sector that has gained prominence in
recent years. Availability of raw materials, changing lifestyles and relaxation in policies
has given a considerable push to the industry’s growth. This sector is among the few that
serves as a vital link between the agriculture and industrial segments of the economy.
Strengthening this link is of critical importance to improve the value of agricultural
produce; ensure remunerative prices to farmers and at the same time create favourable
demand for Indian agricultural products in the world market. A thrust to the restaurant
processing sector implies significant development of the agriculture sector and ensures
value addition to it.
The Indian restaurant processing industry holds tremendous potential to grow,
considering the still nascent levels of processing at present. Though India’s agricultural
production base is reasonably strong, wastage of agricultural produce is sizeable.
Processing of fruits and vegetables is a low 2%, around 35% in milk, 21% in meat and
6% in poultry products. By international comparison, these levels are significantly low -
processing of agriculture produce is around 40% in China, 30% in Thailand, 70% in Brazil,
7/21/2019 LSCM Project Savitha
http://slidepdf.com/reader/full/lscm-project-savitha 17/59
17
78% in the Philippines and 80% in Malaysia. Value addition to agriculture produce in India
is just 20%, wastage is estimated to be valued at around US$ 13 bn (Rs 580 bn).
India, with an arable land of 184 mn hectares is, the highest producer of milk in the
world at 90 mn tonnes p.a., second largest producer of fruits & vegetables (150 mntonnes), third largest producer of restaurantgrains and fish and has the largest livestock
population. Considering the wide-ranging and large raw material base that the country
offers, along with a consumer base of over one billion people, the industry holds
tremendous opportunities for large investments.
Ministry of Restaurant Processing Industries
The Ministry was set up in 1998 and the industry segments that come under its purview
are:
Fruit & Vegetable processing (including freezing and dehydration)
Grain Processing
Processing of Fish (including canning and freezing)
Processing and refrigeration of certain agricultural products, dairy products, poultry
and eggs, meat and meat products
Industries related to bread, oilseeds, meals (edible), breakfast restaurants,
biscuits, confectionery, malt extract, protein isolate, high protein restaurant,
weaning restaurant and extruded restaurant products (including other ready-to-eat
restaurants)
Beer, including non-alcoholic beer
Alcoholic drinks from non-molasses base
Aerated water and soft drinks
Specialised packaging for restaurant processing industries.
The Ministry of Restaurant Processing Industries, GoI, has estimated the size of the
India restaurant market at US$ 191 bn (Rs 8,600 bn). The processed restaurant market
is projected to be over US$ 100 bn, of which the primarily processed restaurant market
accounts for 60%, while the value-added processed restaurant market is around 40%.
7/21/2019 LSCM Project Savitha
http://slidepdf.com/reader/full/lscm-project-savitha 18/59
18
The average annual growth of the restaurant processing industry has been around
8% between FY01-FY06. The segments that have driven the growth are the beverages
and meat & meat products and processed fish sectors. The restaurant processing
industry in India has a share of 1.5% in the total GDP of the country, and as part of total
manufacturing accounts for 9%. India’s share in world trade in respect of processed
restaurant is about 1.6%.
An extensive and highly fragmented industry, the restaurant processing sector largely
comprises of the following sub-segments: fruits & vegetables, milk and milk products,
beer & alcoholic beverages, meat and poultry, marine products, grain processing,
packaged/convenience restaurant packaged drinks. A large number of players in this
industry are small sized companies, and are largely concentrated in the unorganised
segment. This segment accounts for more than 70% of the output in volume terms and
50% in value terms. However, though the organized sector is comparatively small, it is
growing at a much faster pace.
2.3 product portfolio:
Beverages
Food items
Veg items
Non-veg items
Soups
Roties etc…
Ice-creams
7/21/2019 LSCM Project Savitha
http://slidepdf.com/reader/full/lscm-project-savitha 19/59
19
CHAPTER - 4
RESEARCH METHODOLOGY
7/21/2019 LSCM Project Savitha
http://slidepdf.com/reader/full/lscm-project-savitha 20/59
20
4.1RESEARCH METHODOLOGY:
Marketing research is the systematic and objective process identifying, formulating
and objective stating of a marketing problem and collecting, processing analysing,
interpreting and presenting data in order to find a justified solution for a problem that
guides the data collection and analyse phases of a research projects .This research
implies the identification of present trends in their fields of marketing and also identify for
alternative courses of action.
There is never a single standard and correct method of carrying out a piece of
research. Because there are many ways to tackle a problem - some good, some bad, but
probably several good ways. There is no single perfect design. A research design is not
like the solution to a problem in algebra. There are three basic types of research
designs, viz., (i) Exploratory, (ii) Descriptive, and (iii) Casual, which are discussed in the
ensuing text.
Fundamental to the success of any formal research project is a sound research
design. A good research design has the characteristics, viz., problem definition, specific
methods of data collection and analysis, time required for research project, and estimate
of expenses to be incurred. The function of a research design is to ensure that the
required data are collected and they are collected accurately and economically.
A research design is purely and simply the framework or plan for a study that guides
the collection and analysis of data. It is a blueprint that is followed in completing a study.
It may be worthwhile to mention here that a research design is nothing more than the
framework for the study ensures that: (1) the study will be relevant to the problem, and
(2) the study will employ economical procedures.
All marketing research projects must start with exploratory design. This is a
preliminary phase and is absolutely essential in order to obtain a proper definition of
problem at hand. The major emphasis is on the discovery of ideas and insights.
Exploratory study is characterized by flexibility and informality; Formal design is
conspicuous by its absence in exploratory studies. Exploratory studies rarely uses
detailed (structured) questionnaires. These do not involve probability-sampling plans.
7/21/2019 LSCM Project Savitha
http://slidepdf.com/reader/full/lscm-project-savitha 21/59
21
Ingenuity, judgment and good luck play a part in such studies. Notwithstanding the
flexibility, the research experience has demonstrated that (i) literature surveys, (ii)
experience surveys, and (iii) analysis of selected cases, are particularly productive in
exploratory research design.
Descriptive research design is also called explanatory design. This is the one that
simply describes something such as demographic characteristics of individuals who use
the product. The descriptive study is typically concerned with determining frequency with
which something occurs or how two variables vary together. This study is typically guided
by an initial hypothesis.
As exploratory study is characterized by its flexibility and informality, a descriptive
study can be considered usually rigid and formal. A descriptive study requires a clearspecifications of what, who, when, where, why and how aspects of the research. It
requires formulation of more specific hypothesis and testing these through statistical
Inference techniques. Despite its merits, the important fundamental weakness is that
descriptive research does not find the cause and effect relationships among variables.
Studies that establish casual relationships between variables may be termed as
explanatory studies. The emphasis is on studying a situation or a problem in order to
explain the relationships between variables. Experimental or casual is a classical form ofresearch, which owes much to the natural sciences, although it features strongly in much
social science research, particularly psychology.
The methodology regarding to A Study on Dining & Food Services by Selected
Restaurants in Hyderabad. For these project I select both primary data and secondary
data.
7/21/2019 LSCM Project Savitha
http://slidepdf.com/reader/full/lscm-project-savitha 22/59
22
4.2 RESEARCH DESIGN AND AREA OF STUDY:
Research Design is the framework or plan for a study that guides the collection and
analysis of data.
The research design can either be
(i) Exploratory, (ii) Descriptive, or (iii) Experimental Design.
This type of research design chosen for this study is descriptive design and
quantitative in nature. Descriptive research design is a scientific method which involves
observing and describing the behavior of a subject without influencing it in any way or to
identify the cause of something that is happening. For instance, this research could be
used in order to find out the main role of top ecommerce websites in social media andhow much they are spending in social networks. It needs to analyze the situation in the
market.
4.3 DATA COLLECTION METHODS:
There are two types of data are there
Primary Data
Secondary Data
4.3.1 Primary Data
As a part of my study primary data has been used.
4.3.2 Secondary Data
As a part of my study Secondary data has been used from different websites
4.4 PERIOD OF STUDY:
The study was conducted on Dining & Food Services by Selected
Restaurants in Hyderabad through different websites .The duration of the project study
was 45 days.
7/21/2019 LSCM Project Savitha
http://slidepdf.com/reader/full/lscm-project-savitha 23/59
23
4.5 STATISTICAL TOOLS USED:
The percentage method was extensively used for finding various details as
mentioned in the chapter at analysis and interpretation. It can be generally calculated as
follow.
No of respondents favorablePercentage = ___________________________
Total respondents
7/21/2019 LSCM Project Savitha
http://slidepdf.com/reader/full/lscm-project-savitha 24/59
24
4.6 LIMITATIONS OF THE STUDY:
The major constant of the study was the short duration of time as the study was
conducted.
The market survey was conducted in different places but still it may not reflect the
original opinions of all the customers.
The percentages and averages calculated are rounded off to the nearest decimal
point, where absolute accuracy may be absent.
7/21/2019 LSCM Project Savitha
http://slidepdf.com/reader/full/lscm-project-savitha 25/59
25
CHAPTER-5
DATA ANALYSIS AND INTERPRETATION
7/21/2019 LSCM Project Savitha
http://slidepdf.com/reader/full/lscm-project-savitha 26/59
26
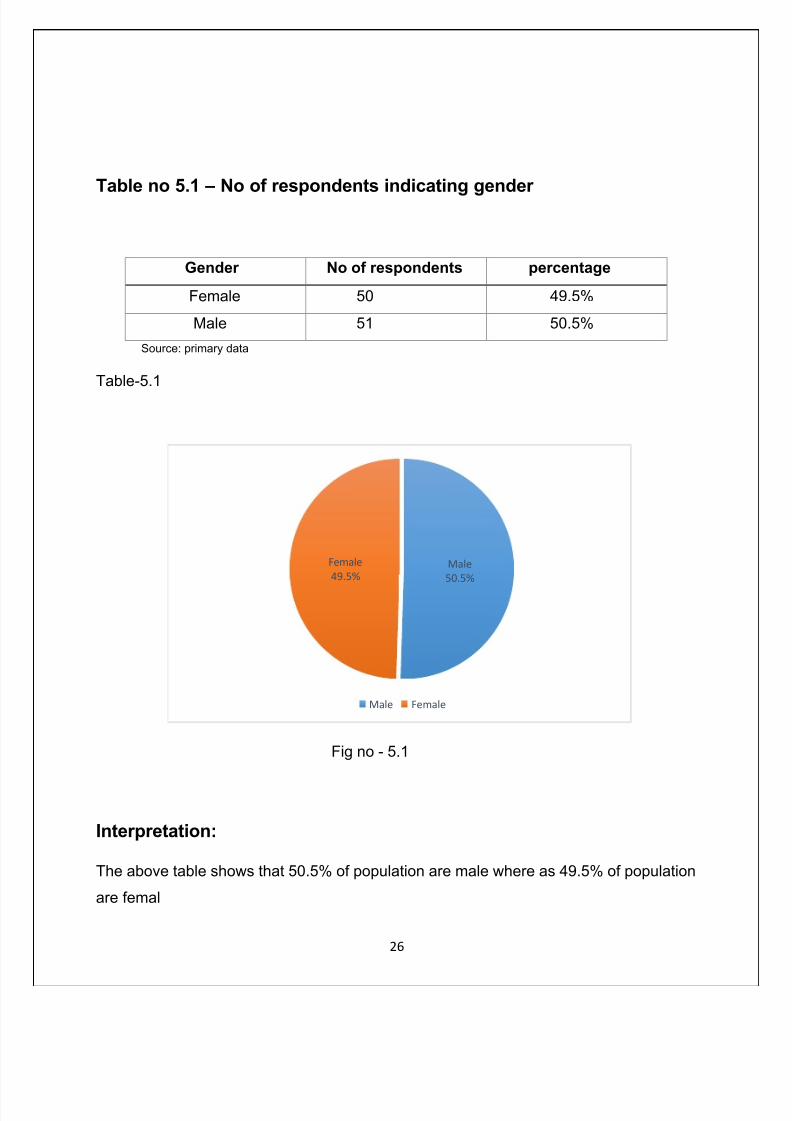
Table no 5.1 – No of respondents indicating gender
Gender No of respondents percentage
Female 50 49.5%
Male 51 50.5%
Source: primary data
Table-5.1
Fig no - 5.1
Interpretation:
The above table shows that 50.5% of population are male where as 49.5% of population
are femal
Male
50.5%
Female
49.5%
Male Female
7/21/2019 LSCM Project Savitha
http://slidepdf.com/reader/full/lscm-project-savitha 27/59
27
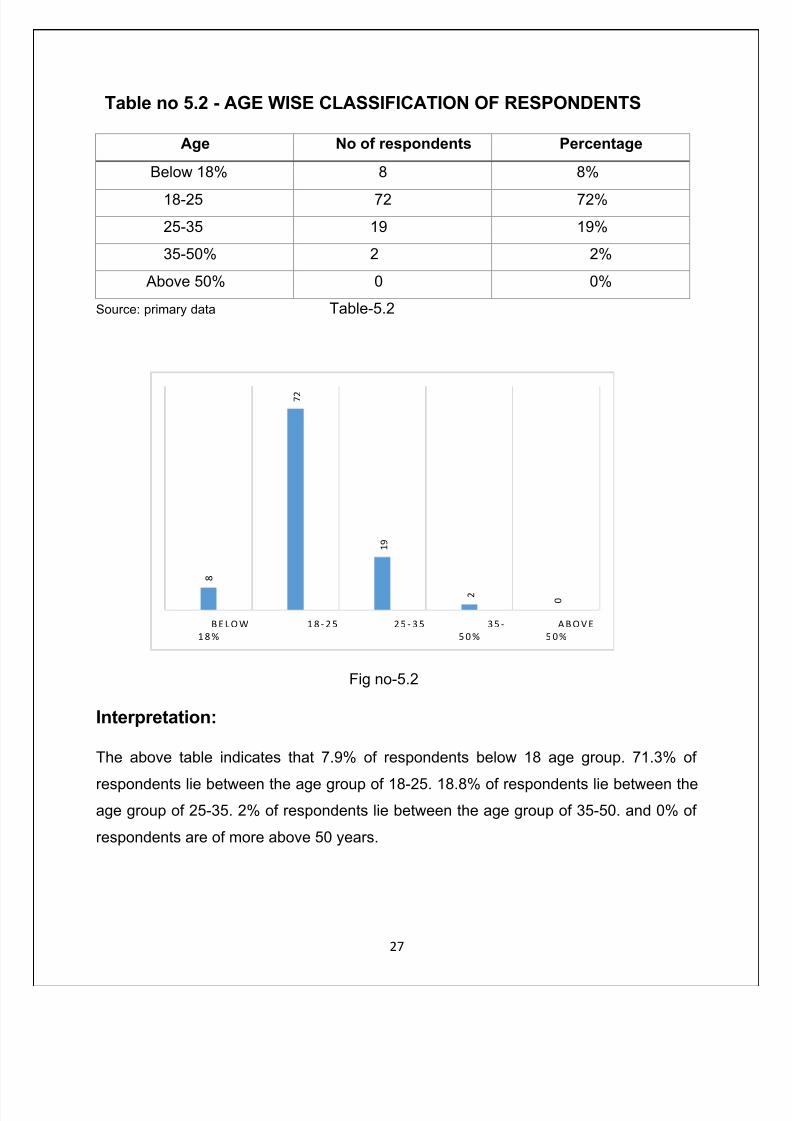
Table no 5.2 - AGE WISE CLASSIFICATION OF RESPONDENTS
Age No of respondents Percentage
Below 18% 8 8%
18-25 72 72%
25-35 19 19%
35-50% 2 2%
Above 50% 0 0%
Source: primary data Table-5.2
Fig no-5.2
Interpretation:
The above table indicates that 7.9% of respondents below 18 age group. 71.3% of
respondents lie between the age group of 18-25. 18.8% of respondents lie between theage group of 25-35. 2% of respondents lie between the age group of 35-50. and 0% of
respondents are of more above 50 years.
8
7 2
1 9
2 0
B E L O W
1 8 %
1 8 - 2 5 2 5 - 3 5 3 5 -
5 0 %
A B O V E
5 0 %
7/21/2019 LSCM Project Savitha
http://slidepdf.com/reader/full/lscm-project-savitha 28/59
28
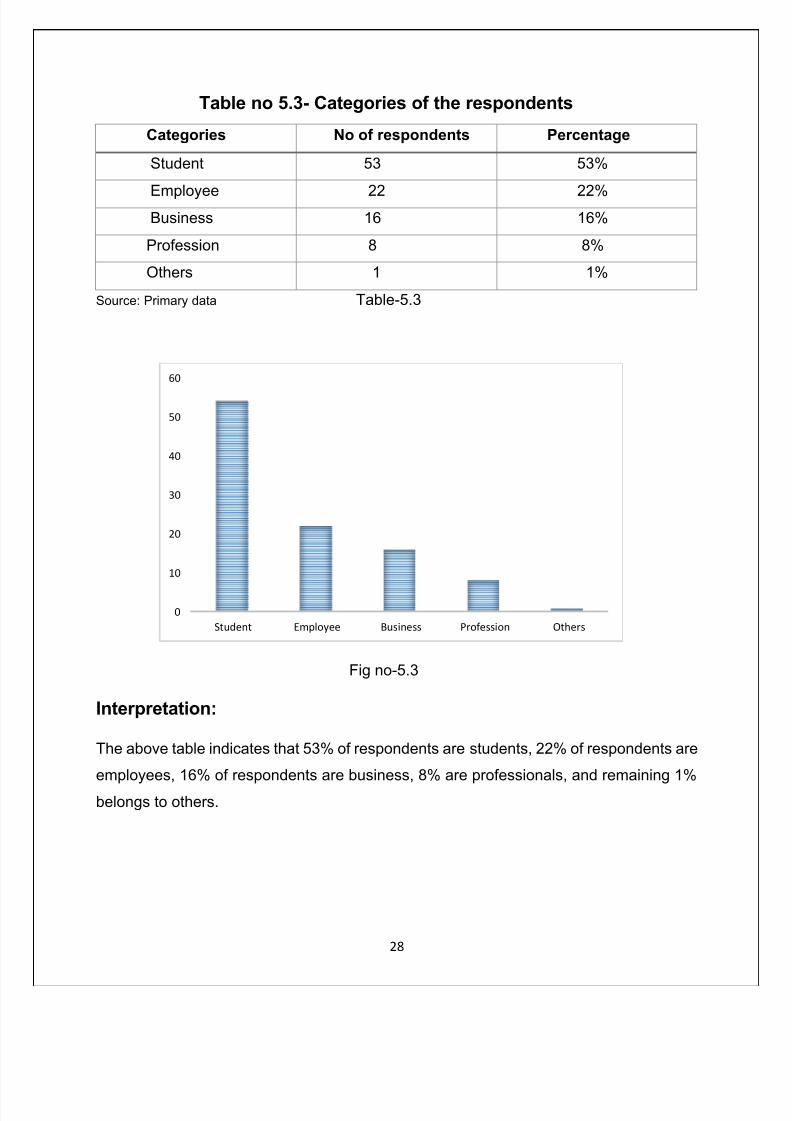
Table no 5.3- Categories of the respondents
Categories No of respondents Percentage
Student 53 53%
Employee 22 22%Business 16 16%
Profession 8 8%
Others 1 1%
Source: Primary data Table-5.3
Fig no-5.3
Interpretation:
The above table indicates that 53% of respondents are students, 22% of respondents are
employees, 16% of respondents are business, 8% are professionals, and remaining 1%
belongs to others.
0
10
20
30
40
50
60
Student Employee Business Profession Others
7/21/2019 LSCM Project Savitha
http://slidepdf.com/reader/full/lscm-project-savitha 29/59
29
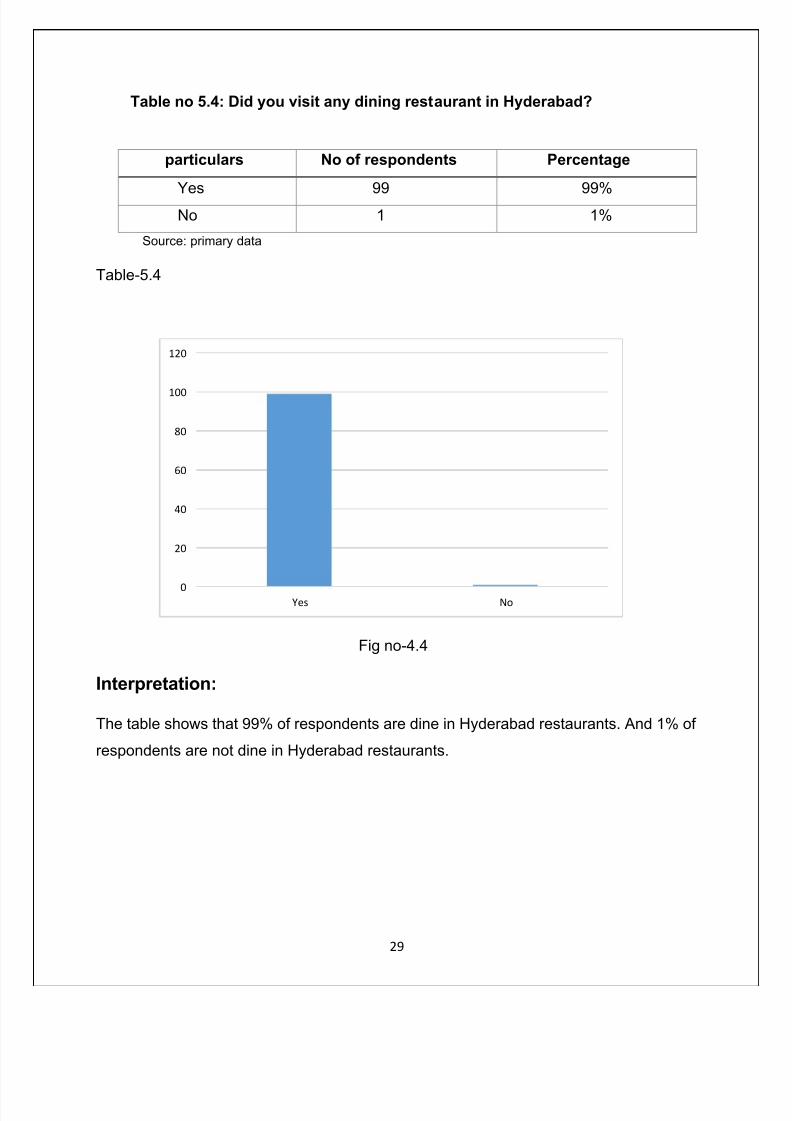
Table no 5.4: Did you visit any dining restaurant in Hyderabad?
particulars No of respondents Percentage
Yes 99 99%No 1 1%
Source: primary data
Table-5.4
Fig no-4.4
Interpretation:
The table shows that 99% of respondents are dine in Hyderabad restaurants. And 1% of
respondents are not dine in Hyderabad restaurants.
0
20
40
60
80
100
120
Yes No
7/21/2019 LSCM Project Savitha
http://slidepdf.com/reader/full/lscm-project-savitha 30/59
30
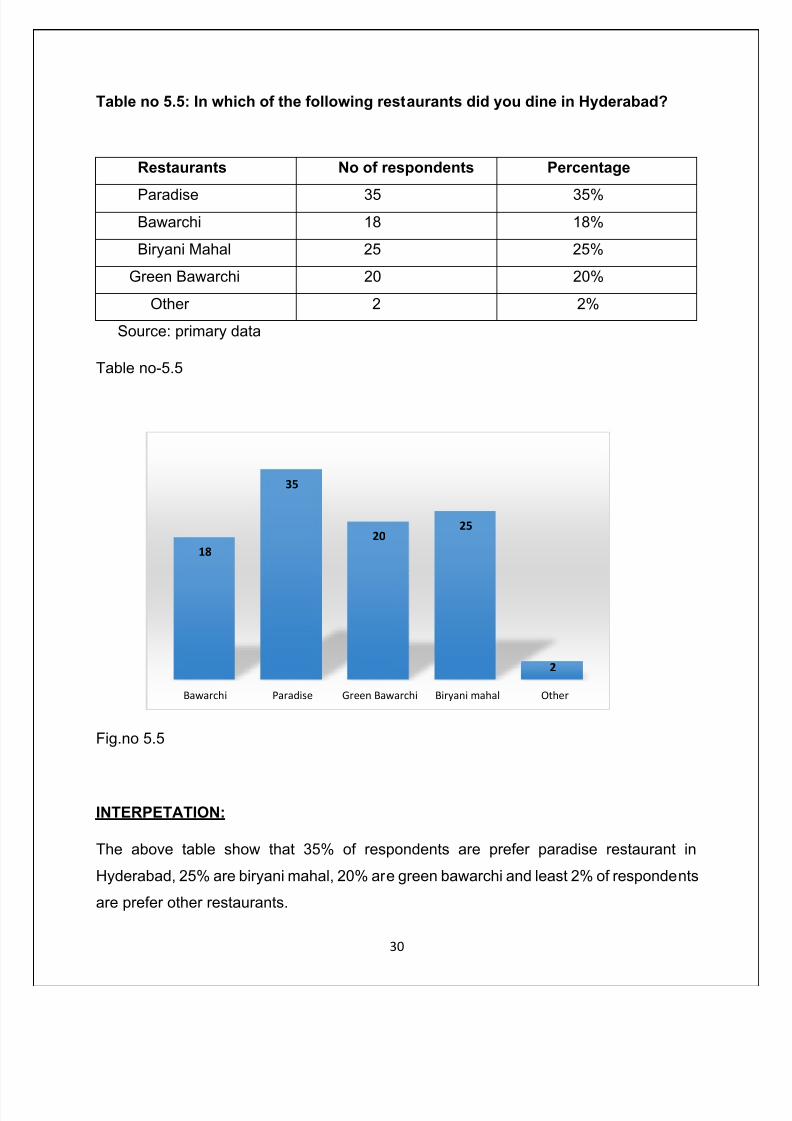
Table no 5.5: In which of the following restaurants did you dine in Hyderabad?
Restaurants No of respondents Percentage
Paradise 35 35%Bawarchi 18 18%
Biryani Mahal 25 25%
Green Bawarchi 20 20%
Other 2 2%
Source: primary data
Table no-5.5
Fig.no 5.5
INTERPETATION:
The above table show that 35% of respondents are prefer paradise restaurant in
Hyderabad, 25% are biryani mahal, 20% are green bawarchi and least 2% of respondents
are prefer other restaurants.
18
35
2025
2
Bawarchi Paradise Green Bawarchi Biryani mahal Other
7/21/2019 LSCM Project Savitha
http://slidepdf.com/reader/full/lscm-project-savitha 31/59
31
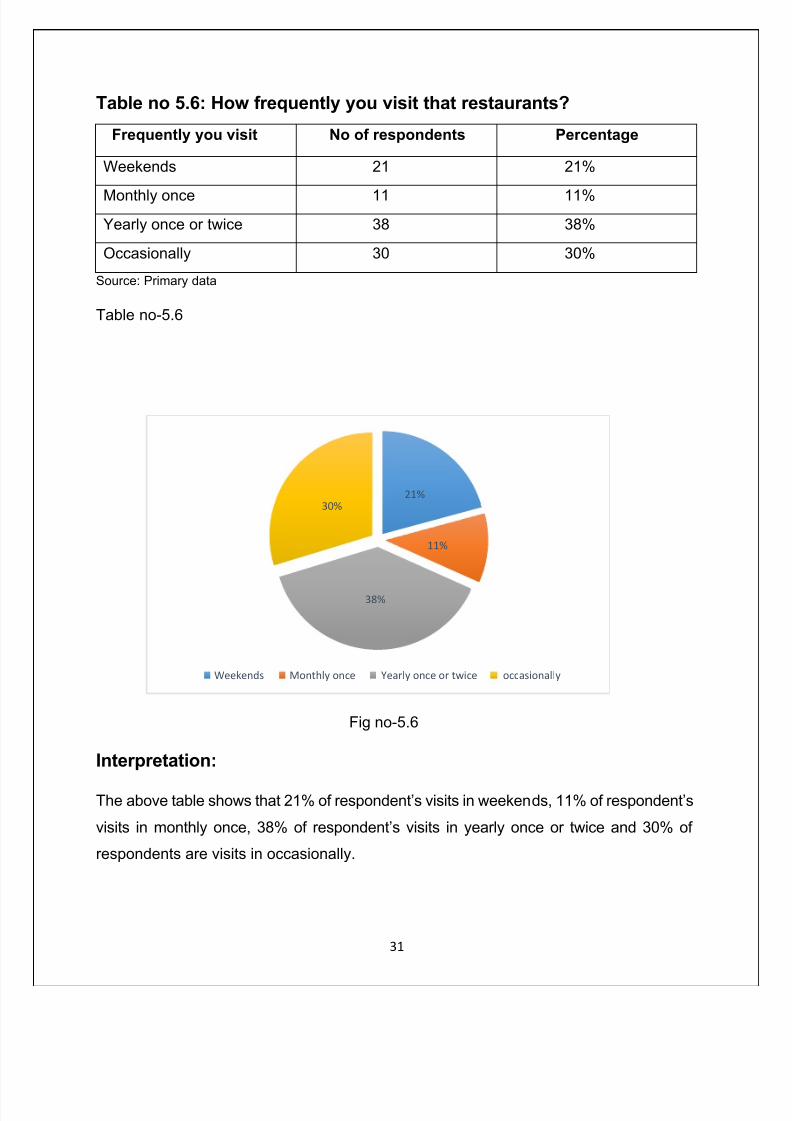
Table no 5.6: How frequently you visit that restaurants?
Frequently you visit No of respondents Percentage
Weekends 21 21%
Monthly once 11 11%
Yearly once or twice 38 38%
Occasionally 30 30%
Source: Primary data
Table no-5.6
Fig no-5.6
Interpretation:
The above table shows that 21% of respondent’s visits in weekends, 11% of respondent’s
visits in monthly once, 38% of respondent’s visits in yearly once or twice and 30% of
respondents are visits in occasionally.
21%
11%
38%
30%
Weekends Monthly once Yearly once or twice occasionally
7/21/2019 LSCM Project Savitha
http://slidepdf.com/reader/full/lscm-project-savitha 32/59
32
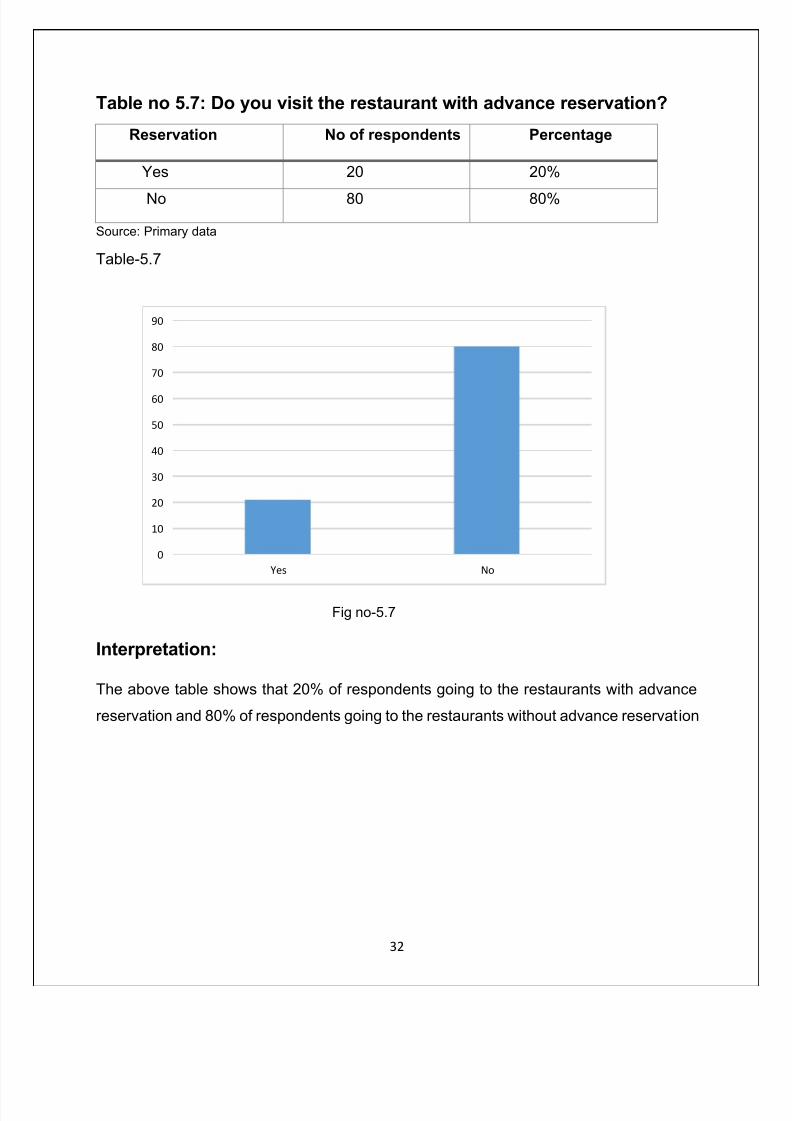
Table no 5.7: Do you visit the restaurant with advance reservation?
Reservation No of respondents Percentage
Yes 20 20%
No 80 80%
Source: Primary data
Table-5.7
Fig no-5.7
Interpretation:
The above table shows that 20% of respondents going to the restaurants with advance
reservation and 80% of respondents going to the restaurants without advance reservation
0
10
20
30
40
50
60
70
80
90
Yes No
7/21/2019 LSCM Project Savitha
http://slidepdf.com/reader/full/lscm-project-savitha 33/59
33
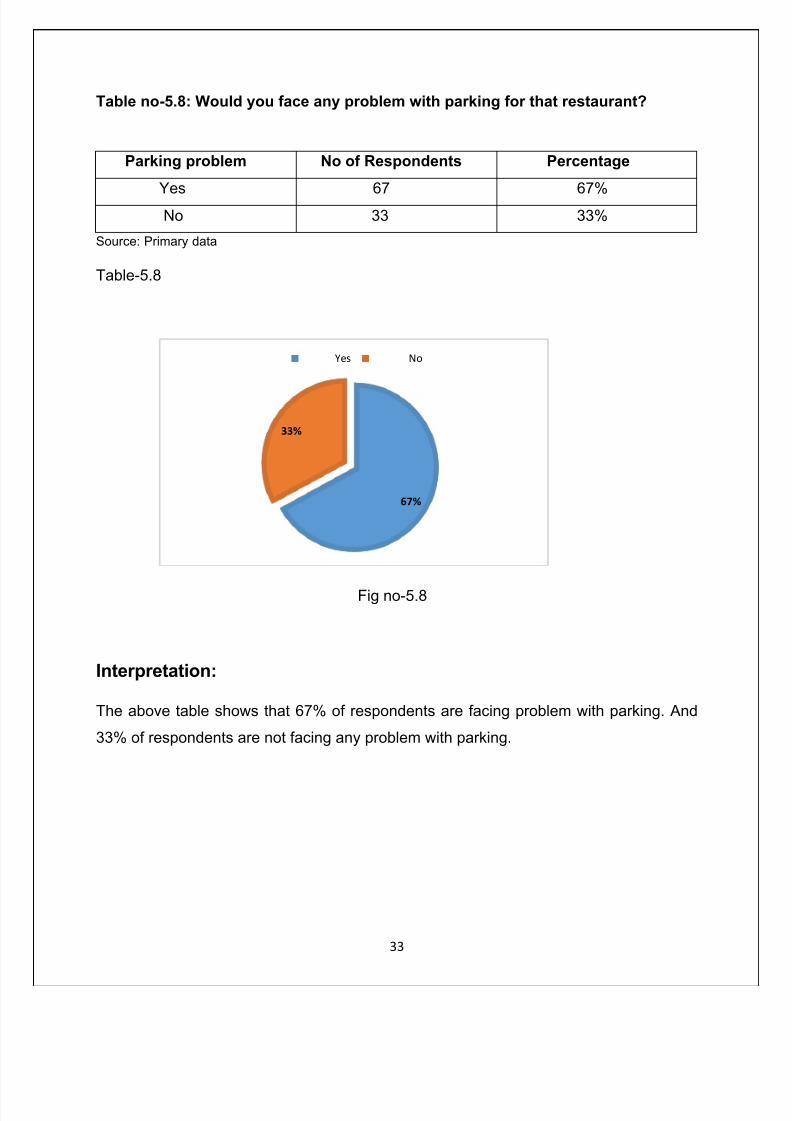
Table no-5.8: Would you face any problem with parking for that restaurant?
Parking problem No of Respondents Percentage
Yes 67 67%No 33 33%
Source: Primary data
Table-5.8
Fig no-5.8
Interpretation:
The above table shows that 67% of respondents are facing problem with parking. And
33% of respondents are not facing any problem with parking.
67%
33%
Yes No
7/21/2019 LSCM Project Savitha
http://slidepdf.com/reader/full/lscm-project-savitha 34/59
34
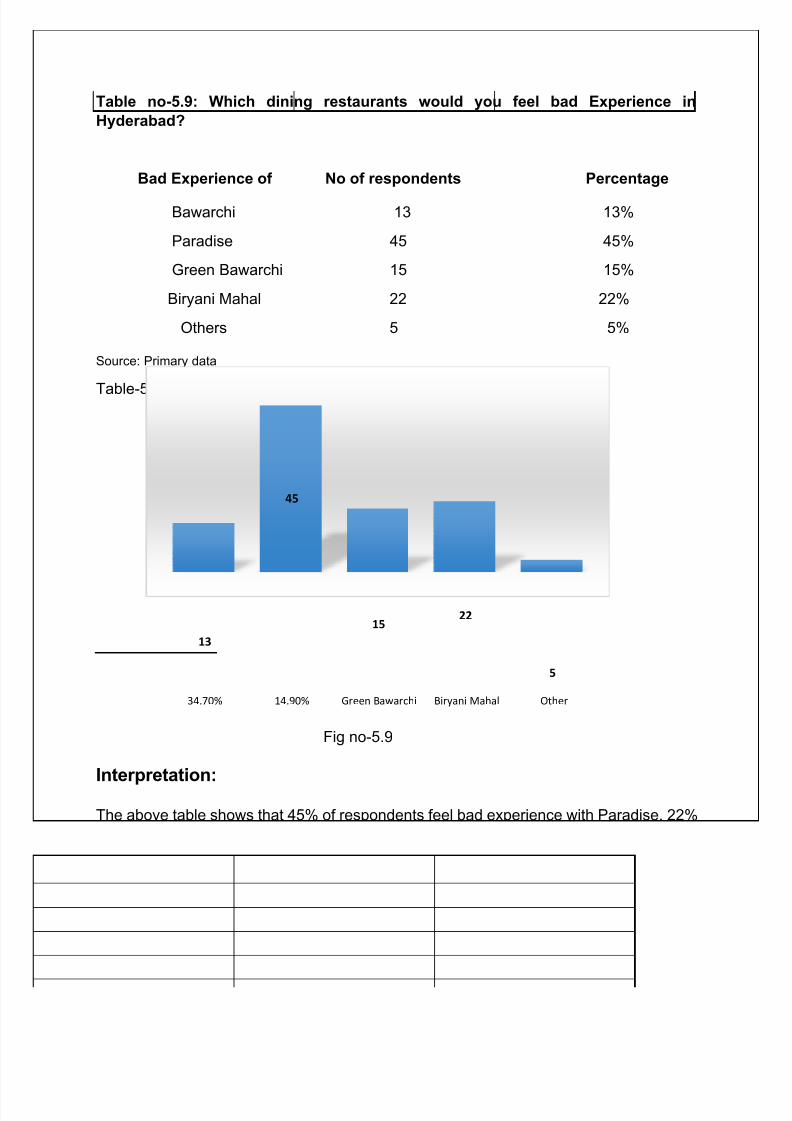
Table no-5.9: Which dining restaurants would you feel bad Experience in
Hyderabad?
Bad Experience of No of respondents Percentage
Bawarchi 13 13%
Paradise 45 45%
Green Bawarchi 15 15%
Biryani Mahal 22 22%
Others 5 5%
Source: Primary data
Table-5.9
Fig no-5.9
Interpretation:
The above table shows that 45% of respondents feel bad experience with Paradise, 22%
of respondents feel bad experience with BiryaniMahal,15% of respondents feel bad
experience with Green bawarchi, 13% of respondents feel bad experience with Bawarchi
and 5% of respondents feel bad experience with other restaurant.
13
45
1522
5
34.70% 14.90% Green Bawarchi Biryani Mahal Other
7/21/2019 LSCM Project Savitha
http://slidepdf.com/reader/full/lscm-project-savitha 35/59
35
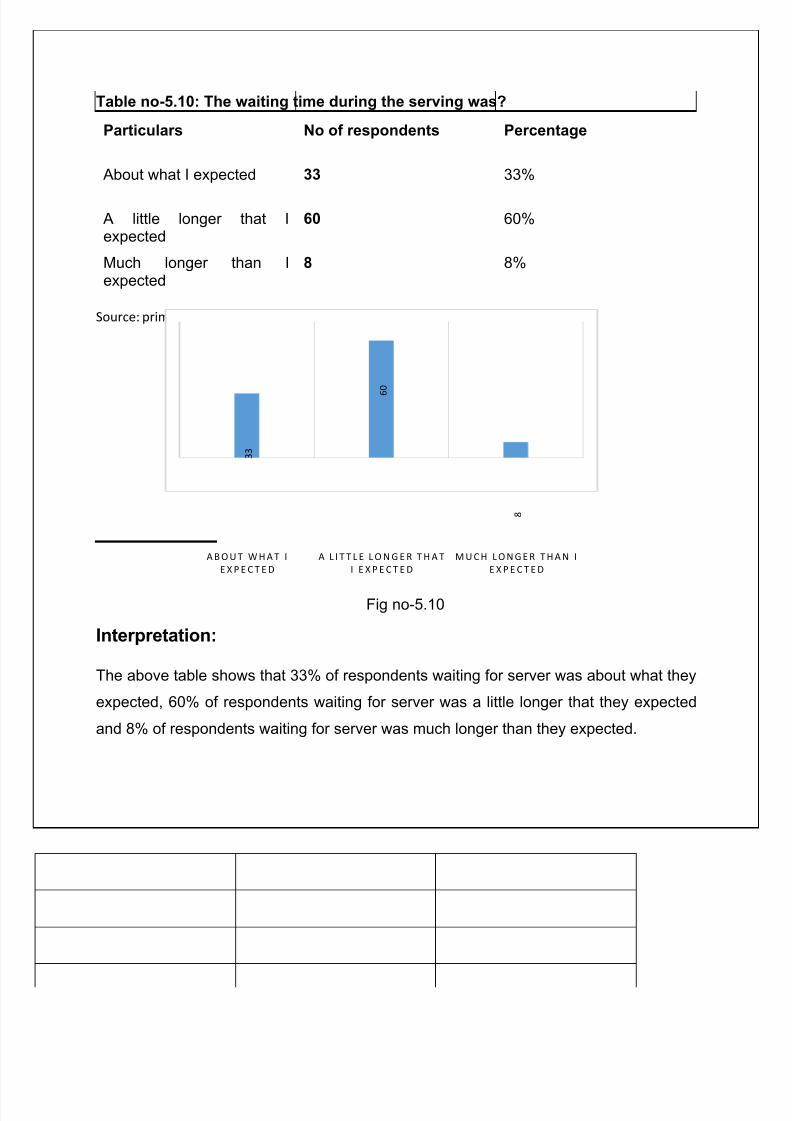
Table no-5.10: The waiting time during the serving was?
Particulars No of respondents Percentage
About what I expected 33 33%
A little longer that Iexpected
60 60%
Much longer than Iexpected
8 8%
Source: primary data table no-5.10
Fig no-5.10
Interpretation:
The above table shows that 33% of respondents waiting for server was about what they
expected, 60% of respondents waiting for server was a little longer that they expected
and 8% of respondents waiting for server was much longer than they expected.
3 3
6
0
8
A B O U T W H A T I
E X P E C T E D
A L I T T L E L O N G E R T H A T
I E X P E C T E D
M U C H L O N G E R T H A N I
E X P E C T E D
7/21/2019 LSCM Project Savitha
http://slidepdf.com/reader/full/lscm-project-savitha 36/59
36
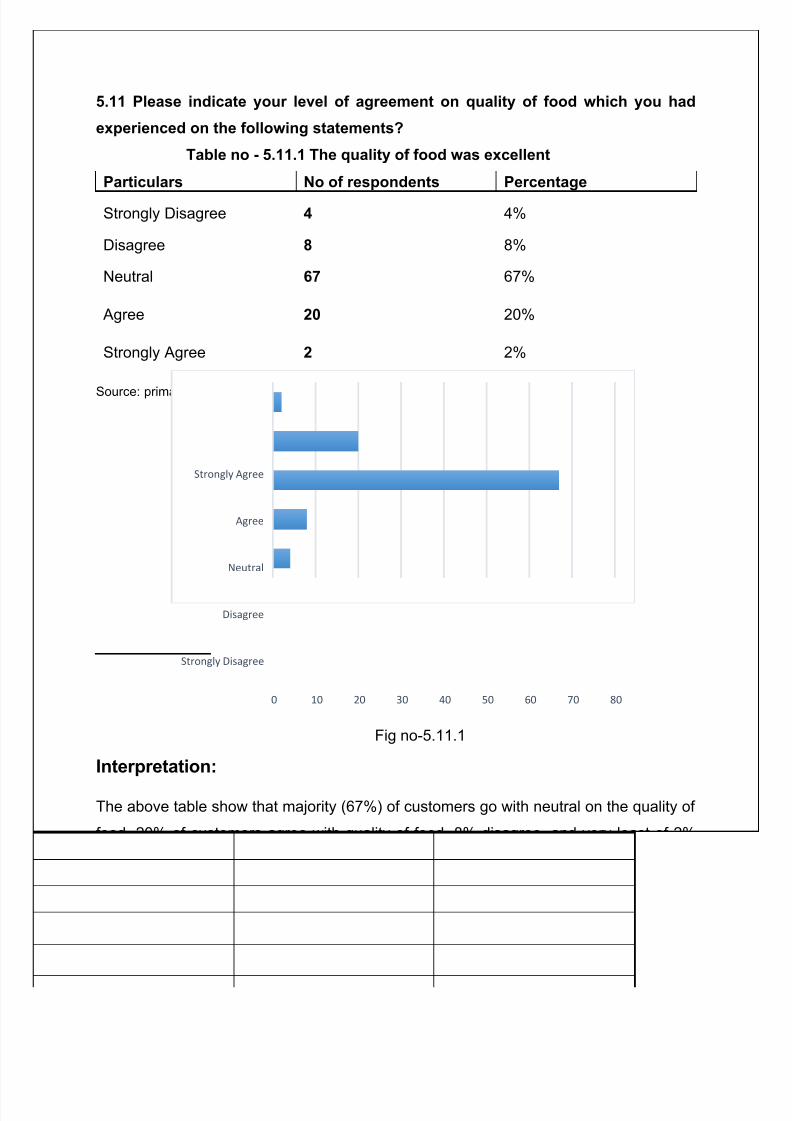
5.11 Please indicate your level of agreement on quality of food which you had
experienced on the following statements?
Table no - 5.11.1 The quality of food was excellent
Particulars No of respondents Percentage
Strongly Disagree 4 4%
Disagree 8 8%
Neutral 67 67%
Agree 20 20%
Strongly Agree 2 2%
Source: primary data Table no-5.11.1
Fig no-5.11.1
Interpretation:
The above table show that majority (67%) of customers go with neutral on the quality of
food, 20% of customers agree with quality of food, 8% disagree, and very least of 2%
strongly with quality of food.
0 10 20 30 40 50 60 70 80
Strongly Disagree
Disagree
Neutral
Agree
Strongly Agree
7/21/2019 LSCM Project Savitha
http://slidepdf.com/reader/full/lscm-project-savitha 37/59
37
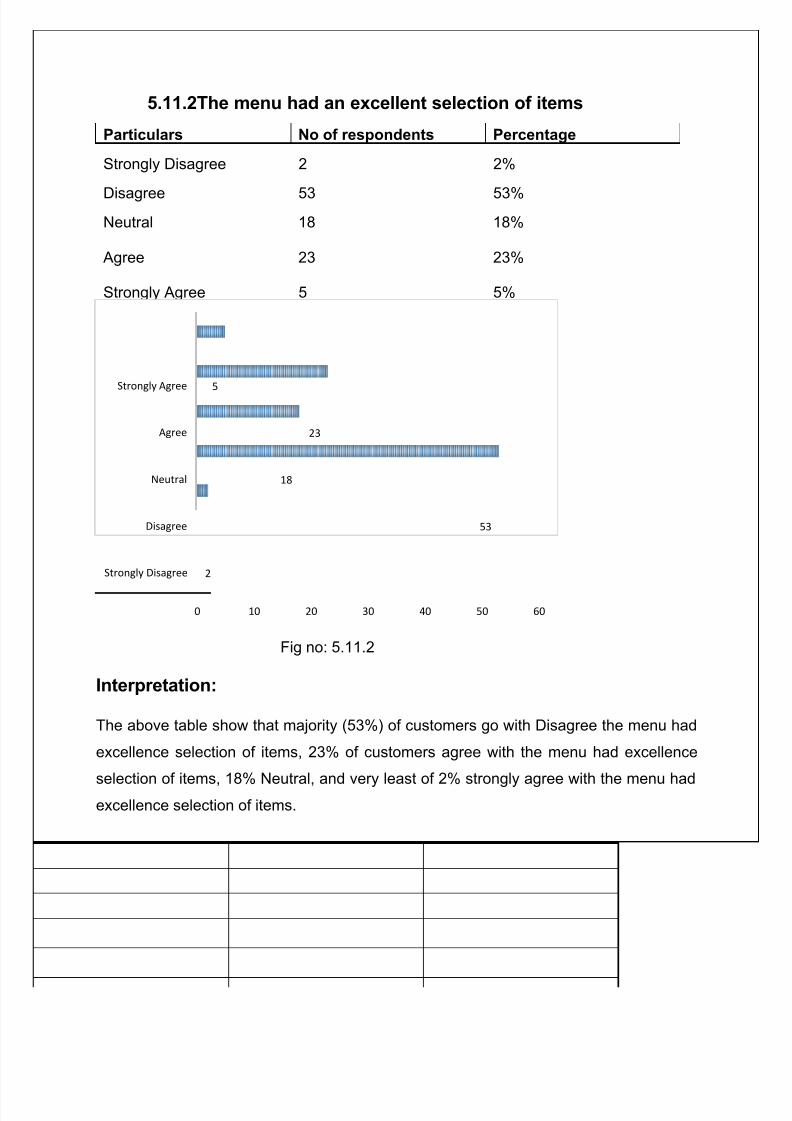
5.11.2The menu had an excellent selection of items
Particulars No of respondents Percentage
Strongly Disagree 2 2%
Disagree 53 53%Neutral 18 18%
Agree 23 23%
Strongly Agree 5 5%
Source: primary data Table-5.11.2
Fig no: 5.11.2
Interpretation:
The above table show that majority (53%) of customers go with Disagree the menu had
excellence selection of items, 23% of customers agree with the menu had excellence
selection of items, 18% Neutral, and very least of 2% strongly agree with the menu hadexcellence selection of items.
2
53
18
23
5
0 10 20 30 40 50 60
Strongly Disagree
Disagree
Neutral
Agree
Strongly Agree
7/21/2019 LSCM Project Savitha
http://slidepdf.com/reader/full/lscm-project-savitha 38/59
38
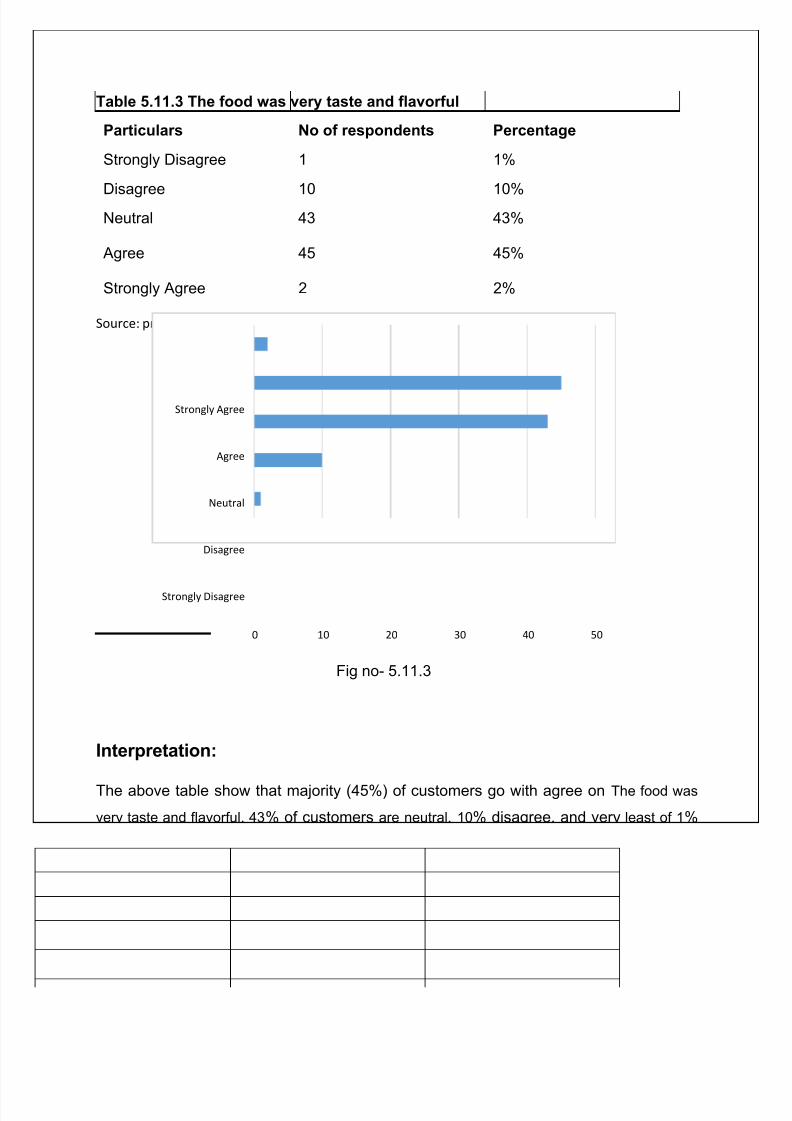
Table 5.11.3 The food was very taste and flavorful
Particulars No of respondents Percentage
Strongly Disagree 1 1%
Disagree 10 10%Neutral 43 43%
Agree 45 45%
Strongly Agree 2 2%
Source: primary data Table no- 5.11.3
Fig no- 5.11.3
Interpretation:
The above table show that majority (45%) of customers go with agree on The food was
very taste and flavorful, 43% of customers are neutral, 10% disagree, and very least of 1%
strongly Disagree with taste of food.
0 10 20 30 40 50
Strongly Disagree
Disagree
Neutral
Agree
Strongly Agree
7/21/2019 LSCM Project Savitha
http://slidepdf.com/reader/full/lscm-project-savitha 39/59
39
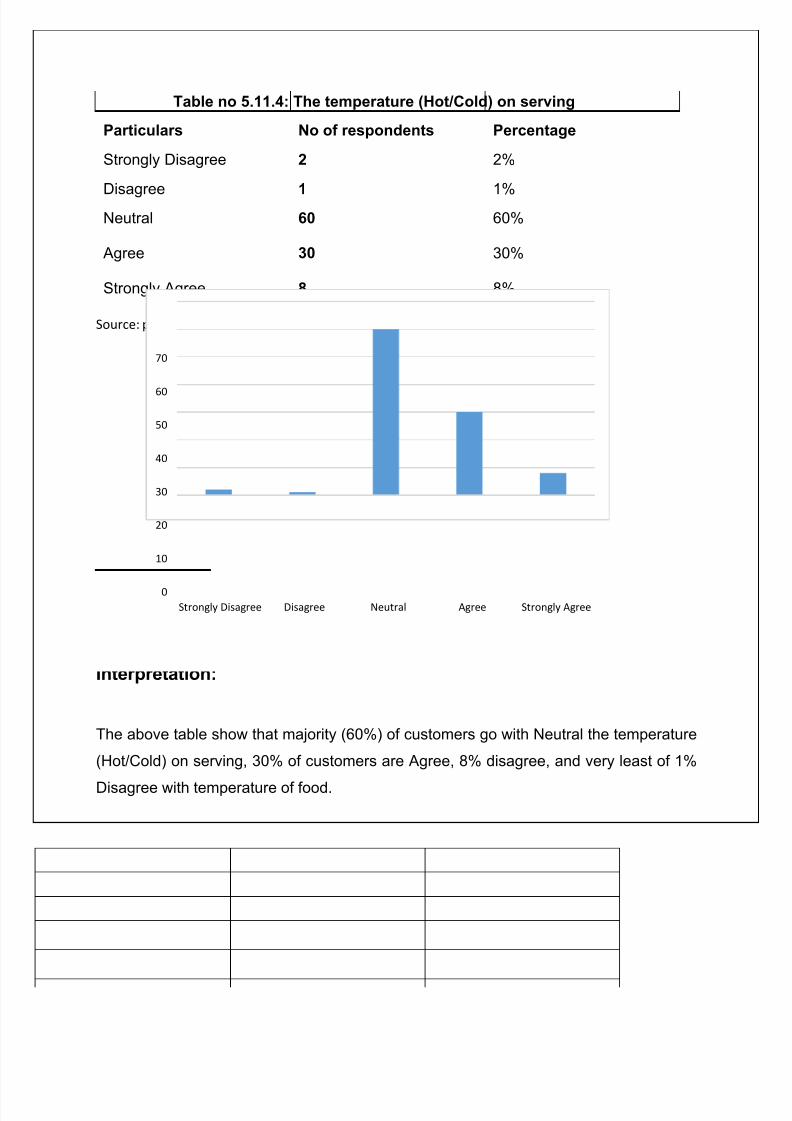
Table no 5.11.4: The temperature (Hot/Cold) on serving
Particulars No of respondents Percentage
Strongly Disagree 2 2%
Disagree 1 1%Neutral 60 60%
Agree 30 30%
Strongly Agree 8 8%
Source: primary data Table no-5.11.4
Fig no- 5.11.4
Interpretation:
The above table show that majority (60%) of customers go with Neutral the temperature
(Hot/Cold) on serving, 30% of customers are Agree, 8% disagree, and very least of 1%
Disagree with temperature of food.
0
10
20
30
40
50
60
70
Strongly Disagree Disagree Neutral Agree Strongly Agree
7/21/2019 LSCM Project Savitha
http://slidepdf.com/reader/full/lscm-project-savitha 40/59
40
Table no-5.12: Please indicate your level of agreement with your general level of
experienced about the restaurant?
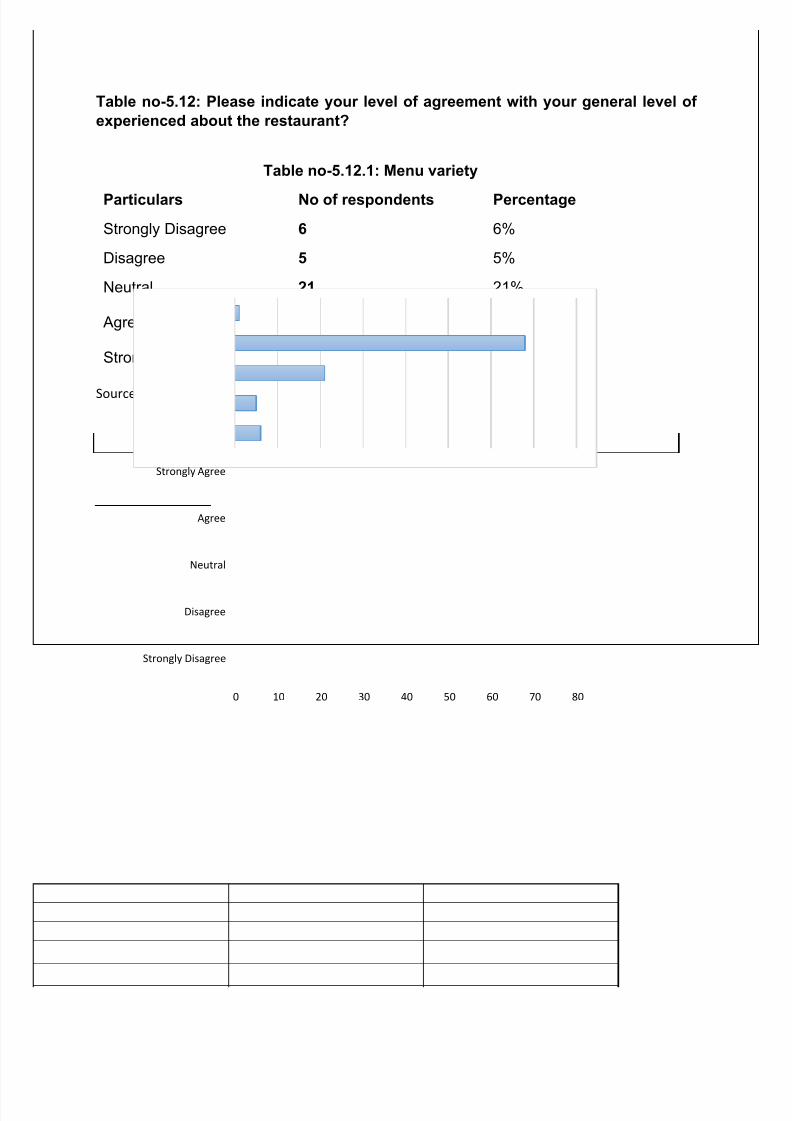
Table no-5.12.1: Menu variety
Particulars No of respondents Percentage
Strongly Disagree 6 6%
Disagree 5 5%
Neutral 21 21%
Agree 68 68%
Strongly Agree 1 1%
Source: primary data Table no- 5.12.1
Fig no-5.12.1
Interpretation:
The above table show that majority (68%) of customers Agree on the menu variety, 21%
of customers are neutral, 6% strongly disagree, and very least of 1% strongly agree
variety of menu.
0 10 20 30 40 50 60 70 80
Strongly Disagree
Disagree
Neutral
Agree
Strongly Agree
7/21/2019 LSCM Project Savitha
http://slidepdf.com/reader/full/lscm-project-savitha 41/59
41
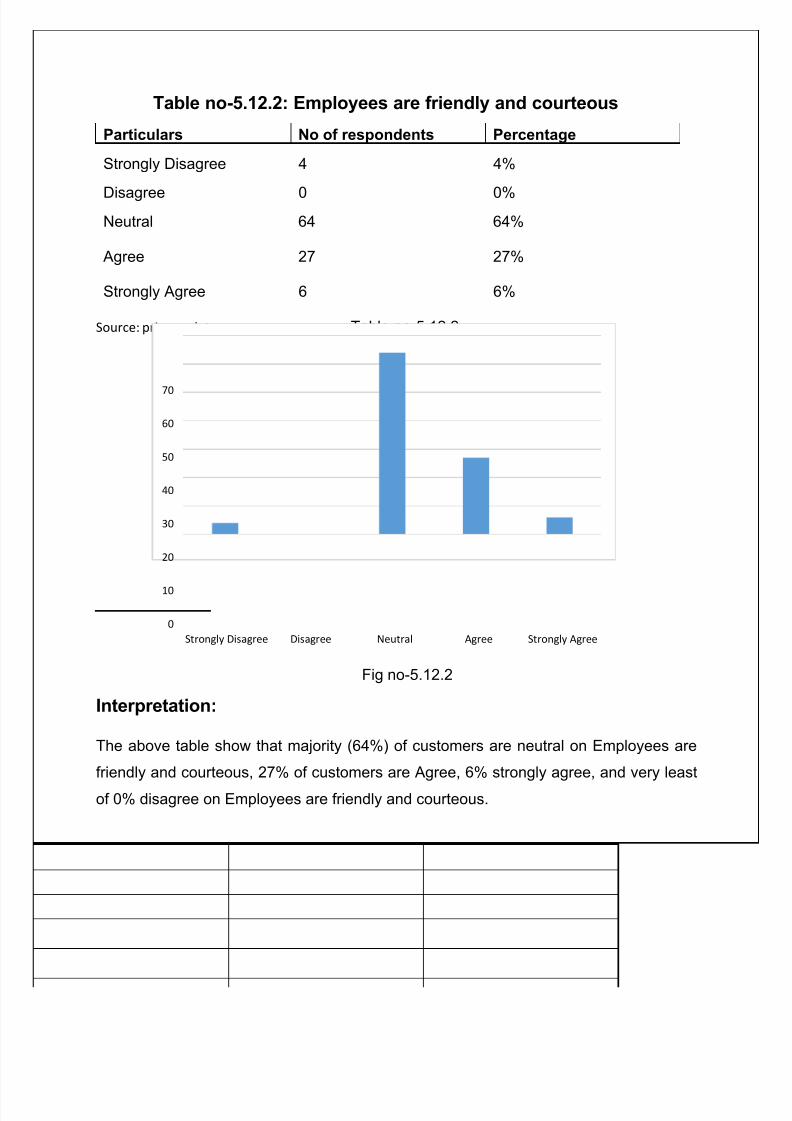
Table no-5.12.2: Employees are friendly and courteous
Particulars No of respondents Percentage
Strongly Disagree 4 4%
Disagree 0 0%Neutral 64 64%
Agree 27 27%
Strongly Agree 6 6%
Source: primary data Table no-5.12.2
Fig no-5.12.2
Interpretation:
The above table show that majority (64%) of customers are neutral on Employees are
friendly and courteous, 27% of customers are Agree, 6% strongly agree, and very least
of 0% disagree on Employees are friendly and courteous.
0
10
20
30
40
50
60
70
Strongly Disagree Disagree Neutral Agree Strongly Agree
7/21/2019 LSCM Project Savitha
http://slidepdf.com/reader/full/lscm-project-savitha 42/59
42
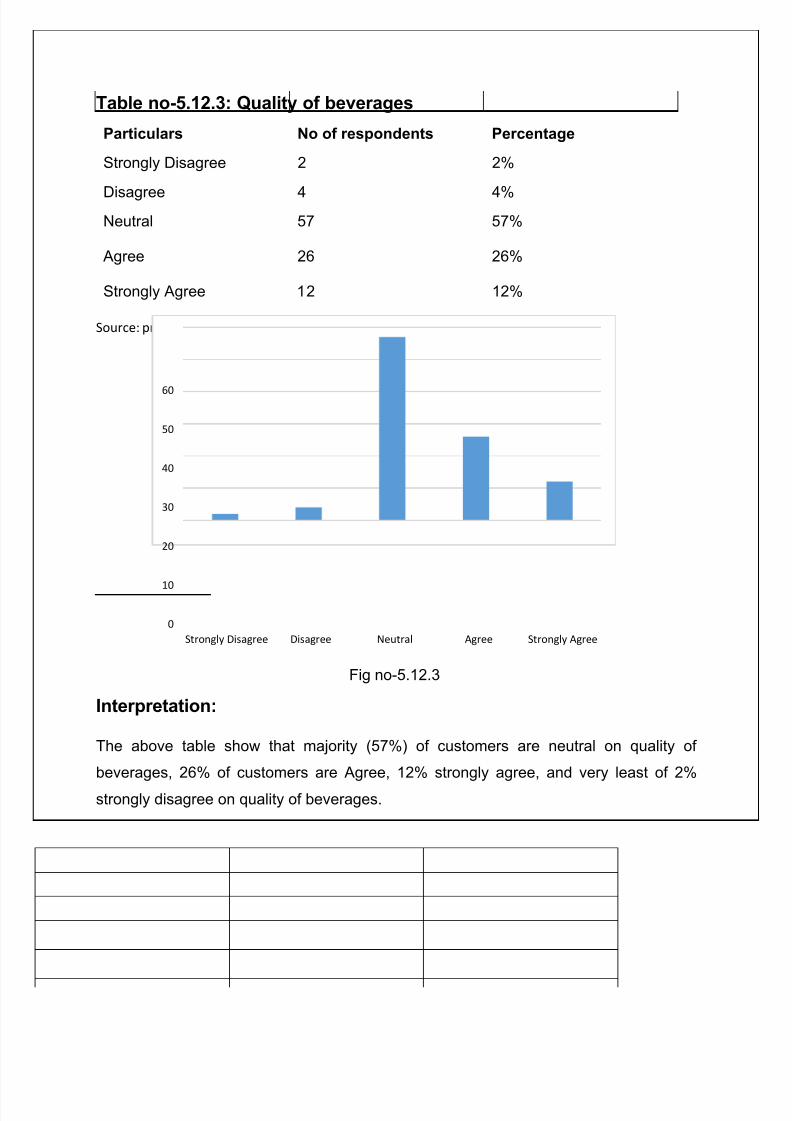
Table no-5.12.3: Quality of beverages
Particulars No of respondents Percentage
Strongly Disagree 2 2%
Disagree 4 4%Neutral 57 57%
Agree 26 26%
Strongly Agree 12 12%
Source: primary data Table no-5.12.3
Fig no-5.12.3
Interpretation:
The above table show that majority (57%) of customers are neutral on quality of
beverages, 26% of customers are Agree, 12% strongly agree, and very least of 2%
strongly disagree on quality of beverages.
0
10
20
30
40
50
60
Strongly Disagree Disagree Neutral Agree Strongly Agree
7/21/2019 LSCM Project Savitha
http://slidepdf.com/reader/full/lscm-project-savitha 43/59
43
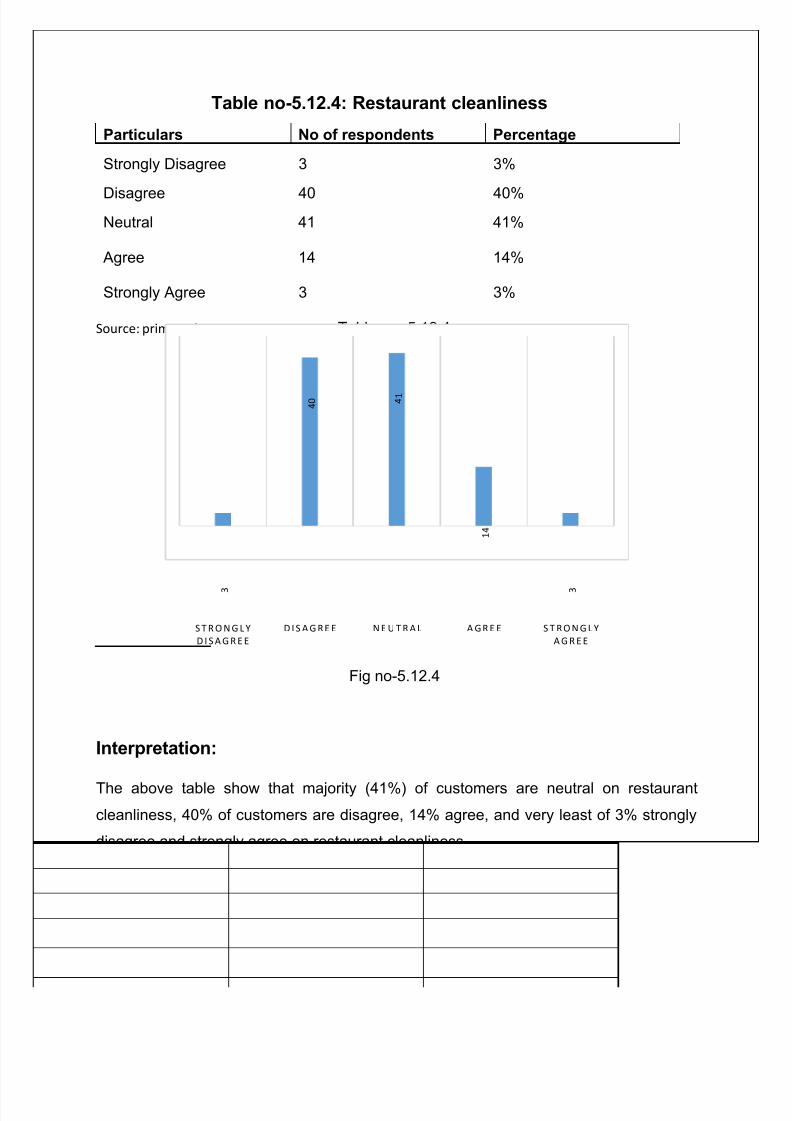
Table no-5.12.4: Restaurant cleanliness
Particulars No of respondents Percentage
Strongly Disagree 3 3%
Disagree 40 40%Neutral 41 41%
Agree 14 14%
Strongly Agree 3 3%
Source: primary data Table no- 5.12.4
Fig no-5.12.4
Interpretation:
The above table show that majority (41%) of customers are neutral on restaurant
cleanliness, 40% of customers are disagree, 14% agree, and very least of 3% strongly
disagree and strongly agree on restaurant cleanliness
3
4 0 4
1
1 4
3
S T R O N G L Y
D I S A G R E E
D I S A G R E E N E U T R A L A G R E E S T R O N G L Y
A G R E E
7/21/2019 LSCM Project Savitha
http://slidepdf.com/reader/full/lscm-project-savitha 44/59
44
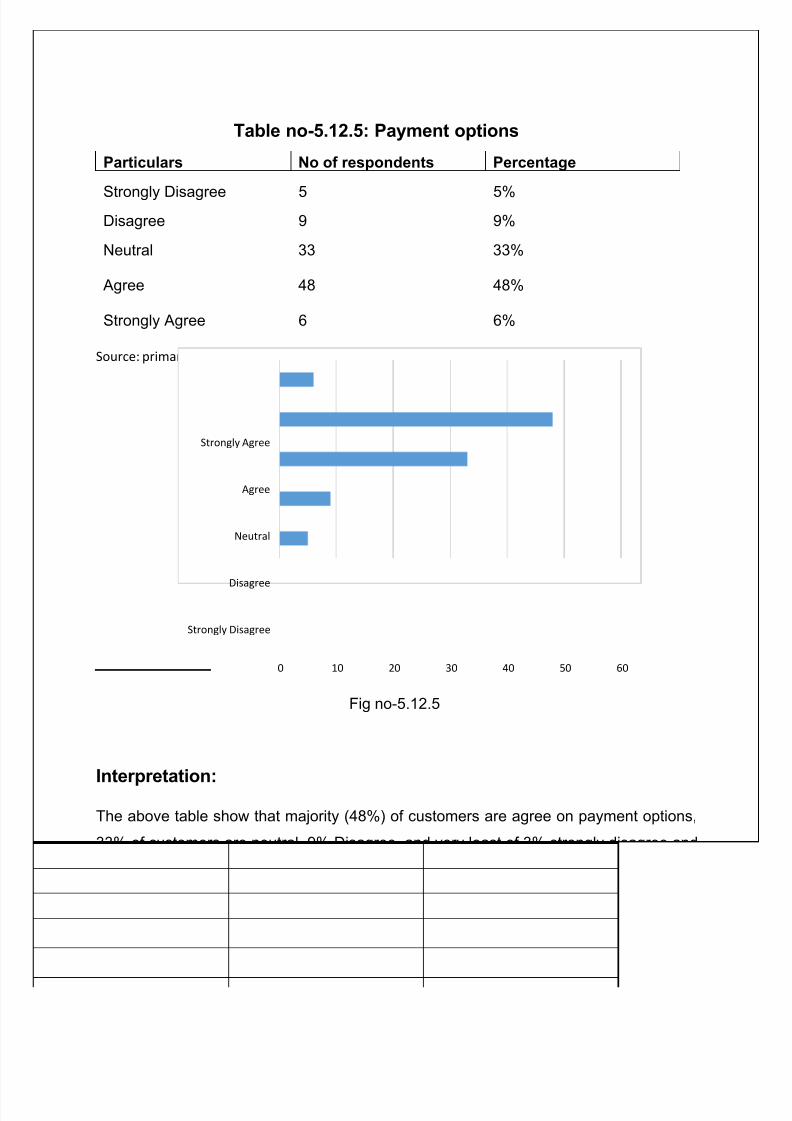
Table no-5.12.5: Payment options
Particulars No of respondents Percentage
Strongly Disagree 5 5%Disagree 9 9%
Neutral 33 33%
Agree 48 48%
Strongly Agree 6 6%
Source: primary data Table no-5.12.5
Fig no-5.12.5
Interpretation:
The above table show that majority (48%) of customers are agree on payment options,
33% of customers are neutral, 9% Disagree, and very least of 3% strongly disagree and
strongly disagree on payment options.
0 10 20 30 40 50 60
Strongly Disagree
Disagree
Neutral
Agree
Strongly Agree
7/21/2019 LSCM Project Savitha
http://slidepdf.com/reader/full/lscm-project-savitha 45/59
45
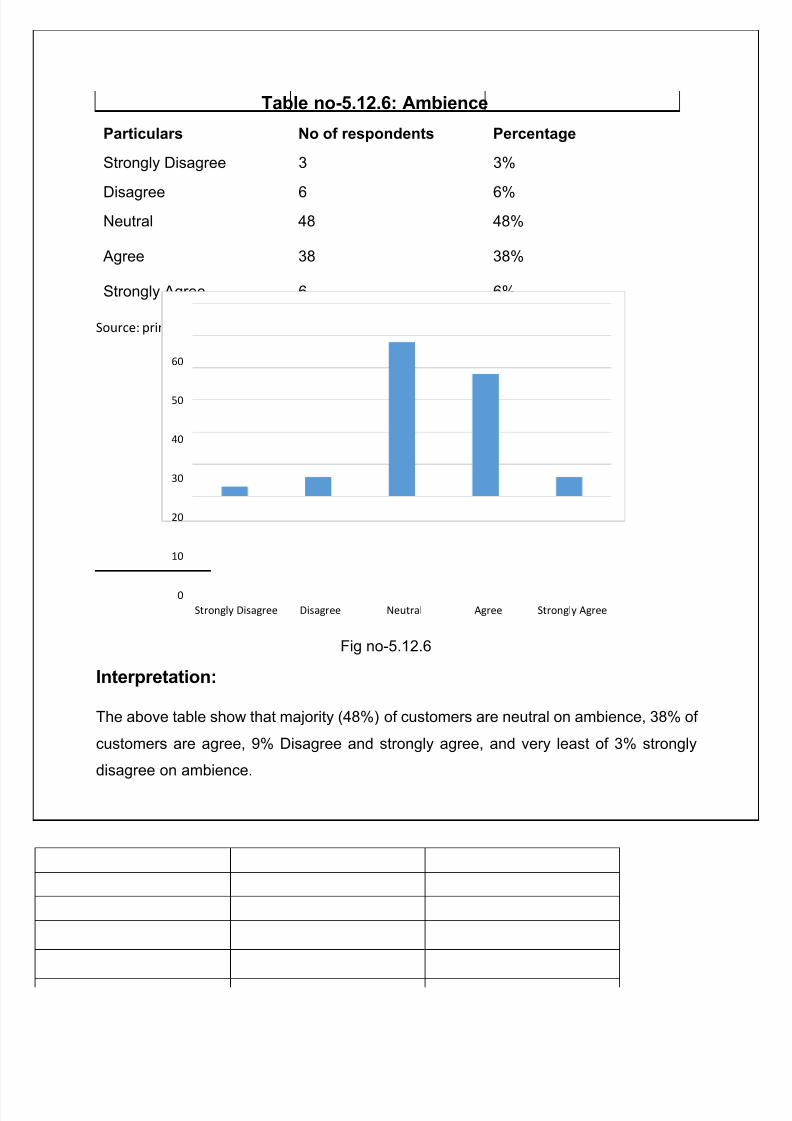
Table no-5.12.6: Ambience
Particulars No of respondents Percentage
Strongly Disagree 3 3%
Disagree 6 6%Neutral 48 48%
Agree 38 38%
Strongly Agree 6 6%
Source: primary data Table no-5.12.6
Fig no-5.12.6
Interpretation:
The above table show that majority (48%) of customers are neutral on ambience, 38% of
customers are agree, 9% Disagree and strongly agree, and very least of 3% strongly
disagree on ambience.
0
10
20
30
40
50
60
Strongly Disagree Disagree Neutral Agree Strongly Agree
7/21/2019 LSCM Project Savitha
http://slidepdf.com/reader/full/lscm-project-savitha 46/59
46
Table no-5.13: Please indicate your level of agreement on the service person of the
restaurant?
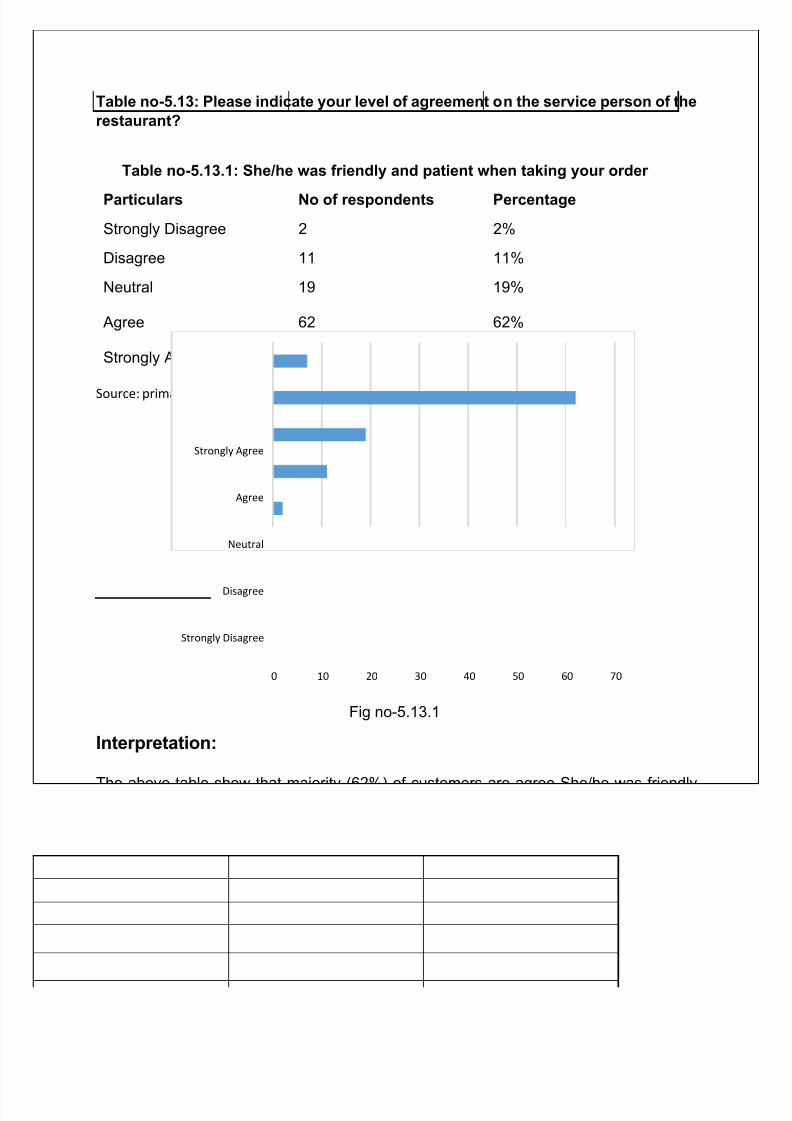
Table no-5.13.1: She/he was friendly and patient when taking your order
Particulars No of respondents Percentage
Strongly Disagree 2 2%
Disagree 11 11%
Neutral 19 19%
Agree 62 62%
Strongly Agree 7 7%
Source: primary data Table no-5.13.1
Fig no-5.13.1
Interpretation:
The above table show that majority (62%) of customers are agree She/he was friendlyand patient when taking your order, 19% of customers are neutral, 11% Disagree, and
very least of 2% strongly disagree on She/he was friendly and patient when taking your
order.
0 10 20 30 40 50 60 70
Strongly Disagree
Disagree
Neutral
Agree
Strongly Agree
7/21/2019 LSCM Project Savitha
http://slidepdf.com/reader/full/lscm-project-savitha 47/59
47
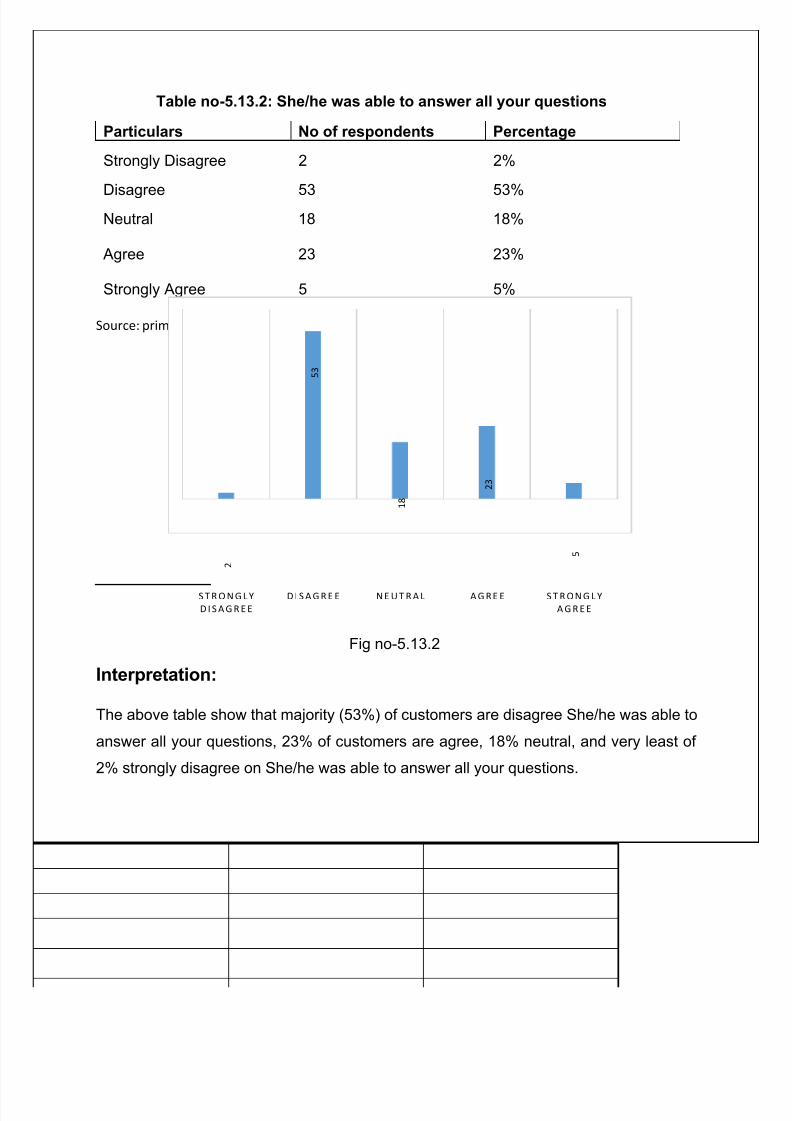
Table no-5.13.2: She/he was able to answer all your questions
Particulars No of respondents Percentage
Strongly Disagree 2 2%
Disagree 53 53%Neutral 18 18%
Agree 23 23%
Strongly Agree 5 5%
Source: primary data Table no-5.13.2
Fig no-5.13.2
Interpretation:
The above table show that majority (53%) of customers are disagree She/he was able to
answer all your questions, 23% of customers are agree, 18% neutral, and very least of
2% strongly disagree on She/he was able to answer all your questions.
2
5 3
1 8
2 3
5
S T R O N G L Y
D I S A G R E E
D I S A G R E E N E U T R A L A G R E E S T R O N G L Y
A G R E E
7/21/2019 LSCM Project Savitha
http://slidepdf.com/reader/full/lscm-project-savitha 48/59
48
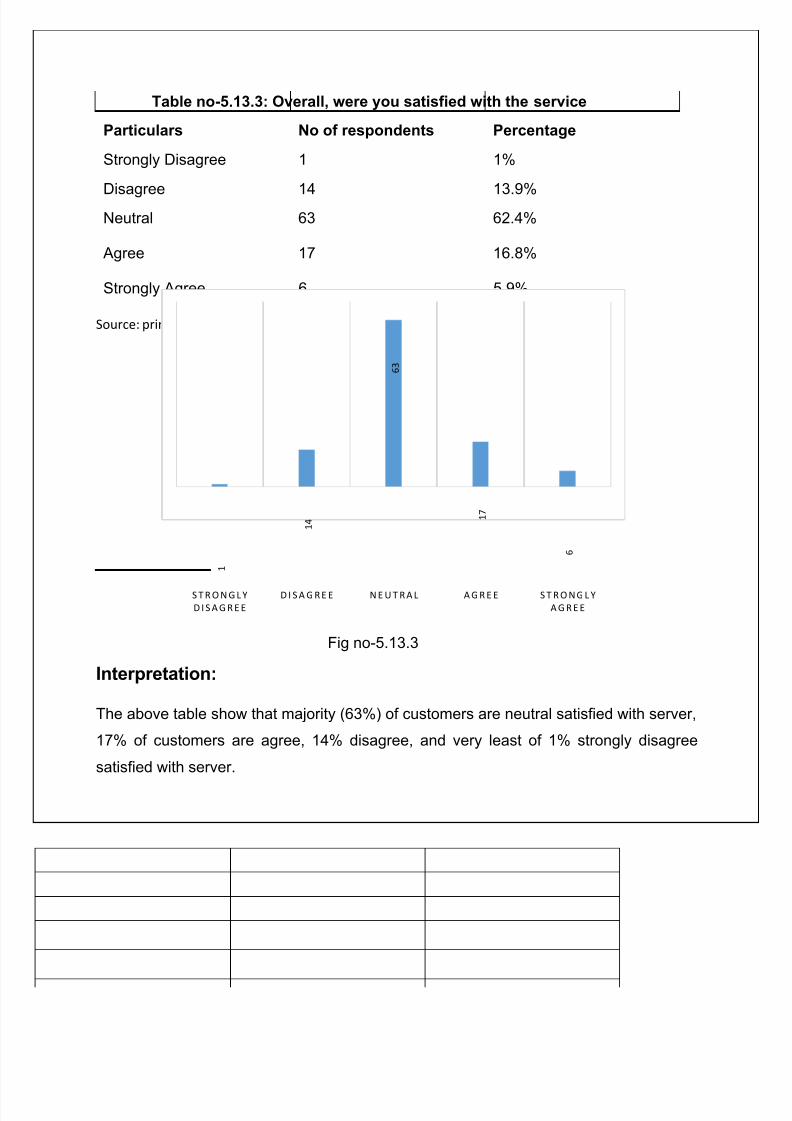
Table no-5.13.3: Overall, were you satisfied with the service
Particulars No of respondents Percentage
Strongly Disagree 1 1%
Disagree 14 13.9%Neutral 63 62.4%
Agree 17 16.8%
Strongly Agree 6 5.9%
Source: primary data Table no-5.13.3
Fig no-5.13.3
Interpretation:
The above table show that majority (63%) of customers are neutral satisfied with server,
17% of customers are agree, 14% disagree, and very least of 1% strongly disagree
satisfied with server.
1
1 4
6 3
1 7
6
S T R O N G L Y
D I S A G R E E
D I S A G R E E N E U T R A L A G R E E S T R O N G L Y
A G R E E
7/21/2019 LSCM Project Savitha
http://slidepdf.com/reader/full/lscm-project-savitha 49/59
49
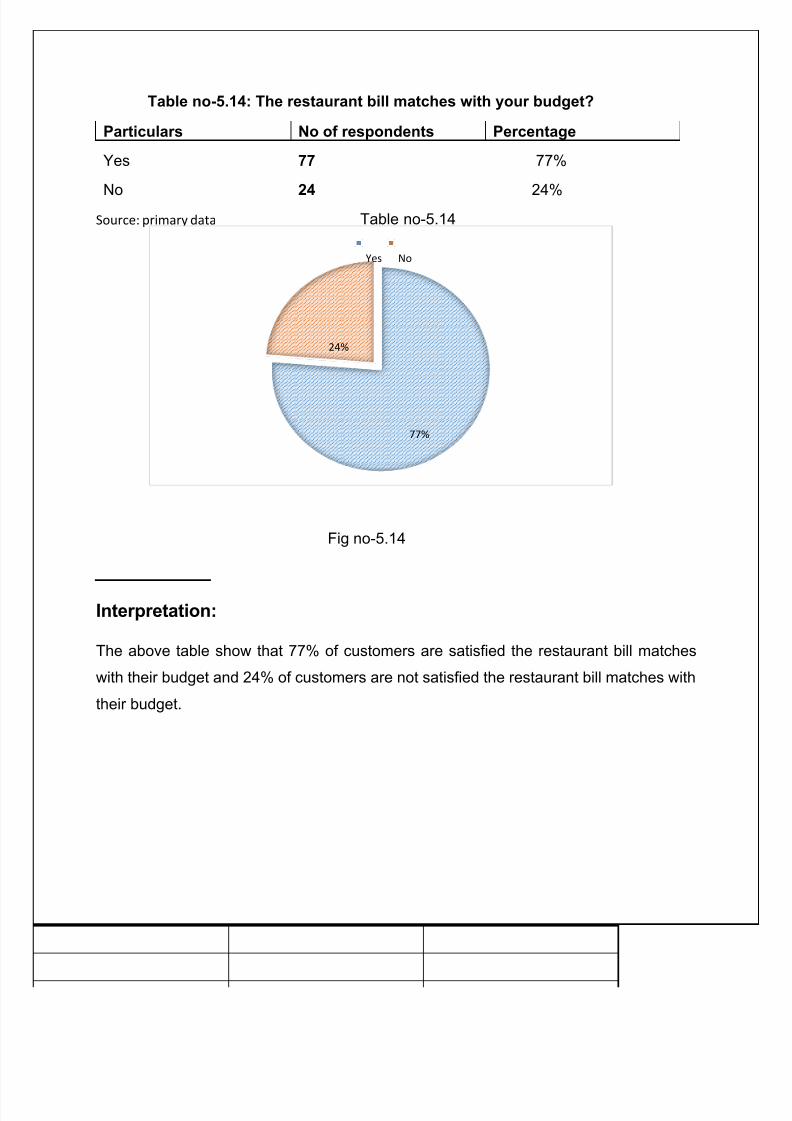
Table no-5.14: The restaurant bill matches with your budget?
Particulars No of respondents Percentage
Yes 77 77%
No 24 24%Source: primary data Table no-5.14
Fig no-5.14
Interpretation:
The above table show that 77% of customers are satisfied the restaurant bill matches
with their budget and 24% of customers are not satisfied the restaurant bill matches with
their budget.
77%
24%
Yes No
7/21/2019 LSCM Project Savitha
http://slidepdf.com/reader/full/lscm-project-savitha 50/59
50
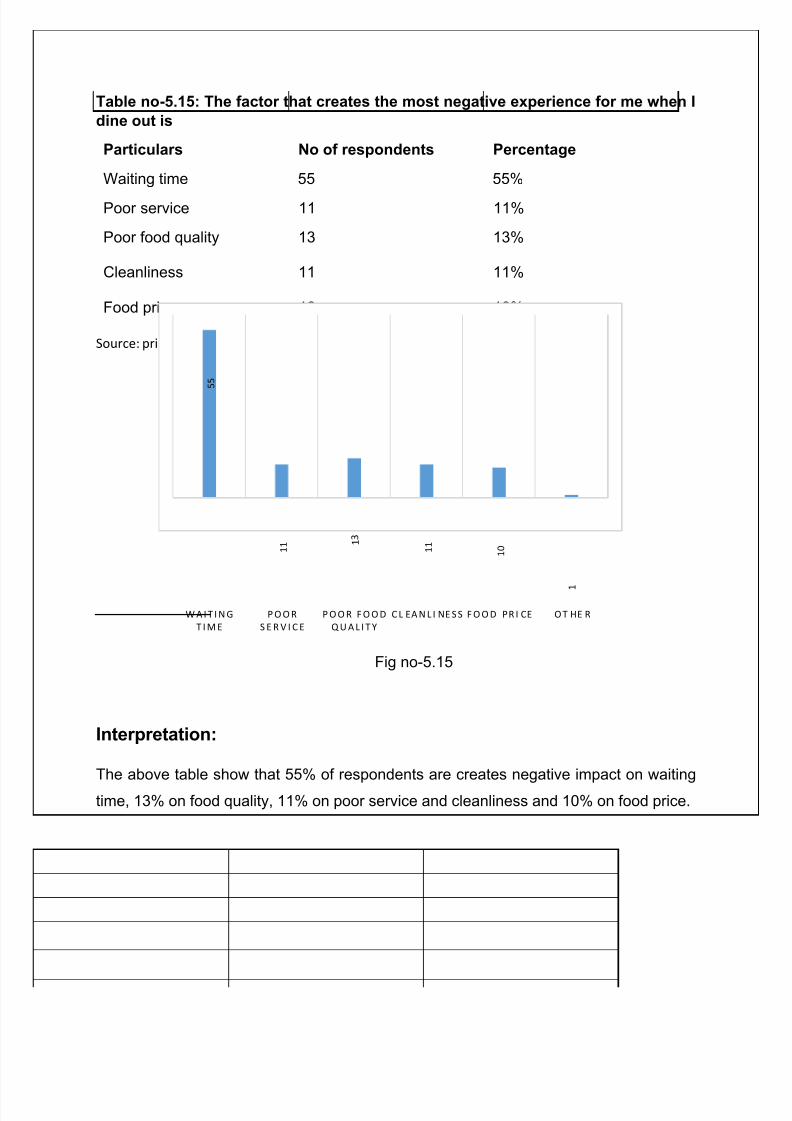
Table no-5.15: The factor that creates the most negative experience for me when I
dine out is
Particulars No of respondents Percentage
Waiting time 55 55%
Poor service 11 11%
Poor food quality 13 13%
Cleanliness 11 11%
Food price 10 10%
Source: primary data Table no-5.15
Fig no-5.15
Interpretation:
The above table show that 55% of respondents are creates negative impact on waiting
time, 13% on food quality, 11% on poor service and cleanliness and 10% on food price.
5 5
1 1 1
3
1 1
1 0
1
W A I T I N G
T I M E
P O O R
S E R V I C E
P O O R F O O D
Q U A L I T Y
C L EA N L I NE S S F O O D PR I CE O T HE R
7/21/2019 LSCM Project Savitha
http://slidepdf.com/reader/full/lscm-project-savitha 51/59
51
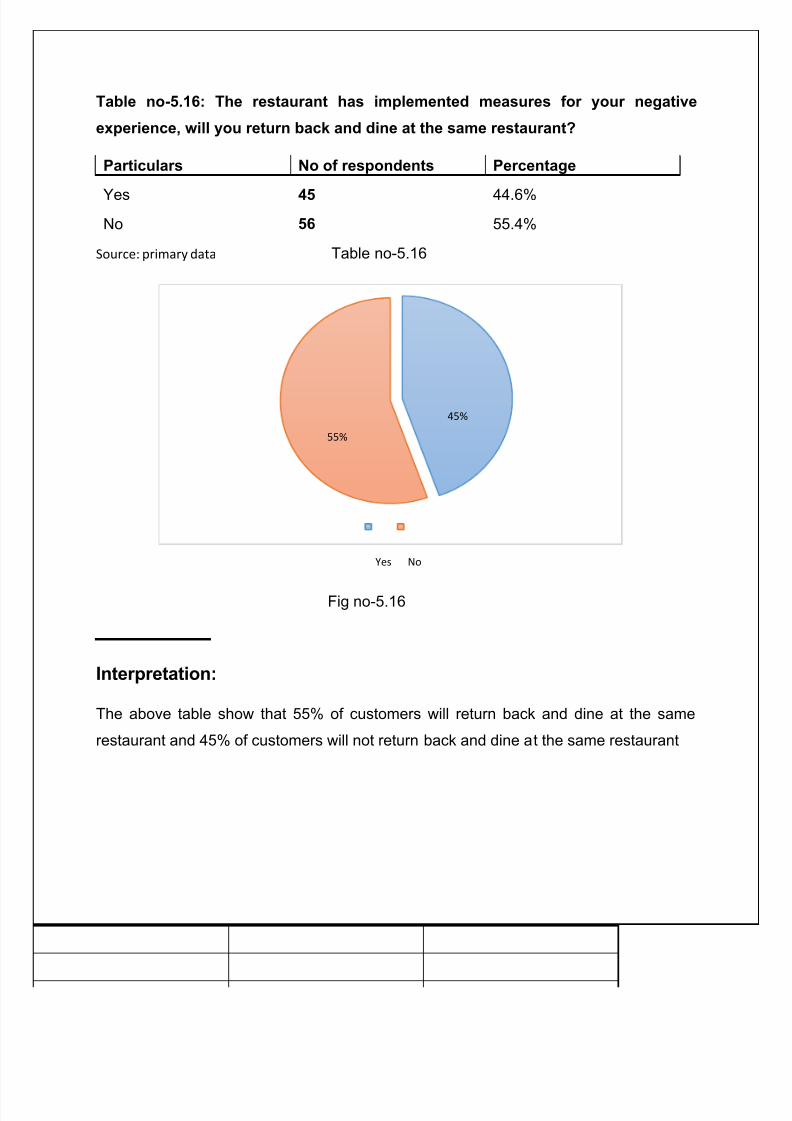
Table no-5.16: The restaurant has implemented measures for your negative
experience, will you return back and dine at the same restaurant?
Particulars No of respondents Percentage
Yes 45 44.6%
No 56 55.4%
Source: primary data Table no-5.16
Fig no-5.16
Interpretation:
The above table show that 55% of customers will return back and dine at the same
restaurant and 45% of customers will not return back and dine at the same restaurant
45%
55%
Yes No
7/21/2019 LSCM Project Savitha
http://slidepdf.com/reader/full/lscm-project-savitha 52/59
52
CHAPTER-6
SUMMARY OF FINDINGS AND SUGGESTIONS &RECOMMENDATIONS
7/21/2019 LSCM Project Savitha
http://slidepdf.com/reader/full/lscm-project-savitha 53/59
53
5.1Summary of Findings:
According to these survey 99% of respondents are dine in Hyderabad restaurants.
35% of respondents are prefer paradise restaurant in Hyderabad.
80% of respondents going to the restaurants without advance reservation.
67% of respondents are facing problem with parking.
45% of respondents feel bad experience mostly with Paradise.
60% of respondents waiting for server was a little longer that they expected
60% Hyderabad restaurants food was Neutral.
53% of customers go with Disagree the menu had excellence selection of items
60% of customers go with Neutral the temperature (Hot/Cold) on serving.
64% of customers are neutral on Employees are friendly and courteous.
41% of customers are neutral on restaurant cleanliness
48% of customers are neutral on ambience.
53% of customers are disagree she/he was able to answer all your questions.
63% of customers are neutral satisfied with server.
55% of respondents are feeling bad on waiting time
According to these survey by using Pareto analysis (80% of loss is caused by 20%
of reasons) 20% of reasons are parking problem, waiting for serving, cleanliness,
beverages, payment options and ambience in Hyderabad restaurants for these
80% of loss occurs.
7/21/2019 LSCM Project Savitha
http://slidepdf.com/reader/full/lscm-project-savitha 54/59
54
Suggestions and recommendations:
Hyderabad restaurants food was Neutral for that they improve food quality.
According to my survey the parking was very bad for that they allocate more space
for parking.
Customers are not satisfied with ambience for that they create good atmosphere
in restaurants.
Respondents are feeling bad on waiting time for that server serves on times for
customers.
Cleanliness is one of the problem in restaurants for that they keep clean.
7/21/2019 LSCM Project Savitha
http://slidepdf.com/reader/full/lscm-project-savitha 55/59
55
Conclusion:
One of the most effective cost analysis tool is Pareto analysis. A typical Pareto diagram
for internal failures. The diagram can be used as a prioritization tool for qualitative initiative
project successfully.
Pareto Analysis uses the Pareto Principle – also known as the "80/20 Rule" – which is
the idea that 20 percent of causes generate 80 percent of results. With this tool, we're
trying to find the 20 percent of work that will generate 80 percent of the results that doing
all of the work would deliver.
According to these survey by using Pareto analysis (80% of loss is caused by 20% of
reasons) 20% of reasons are parking problem, waiting for serving, cleanliness,
beverages, payment options and ambience in Hyderabad restaurants for these 80% of
loss occurs.
Pareto Analysis is a simple technique for prioritizing possible changes by identifying the
problems that will be resolved by making these changes. By using this approach, you can
prioritize the individual changes that will most improve the situation.
7/21/2019 LSCM Project Savitha
http://slidepdf.com/reader/full/lscm-project-savitha 56/59
56
Bibliography:
Websites:
https://www.mindtools.com/pages/article/newTED_01.htm.
http://www.ece.rutgers.edu/~marsic/books/SE/projects/Restaurant/2012-g2-report3.pdf.
http://www.ghd.com/pdf/6.%20Pareto%20Analysis.pdf.
info@Chutney’srestaurant.com
BOOKS:Project smart article- By Duncan Haughey
7/21/2019 LSCM Project Savitha
http://slidepdf.com/reader/full/lscm-project-savitha 57/59
57
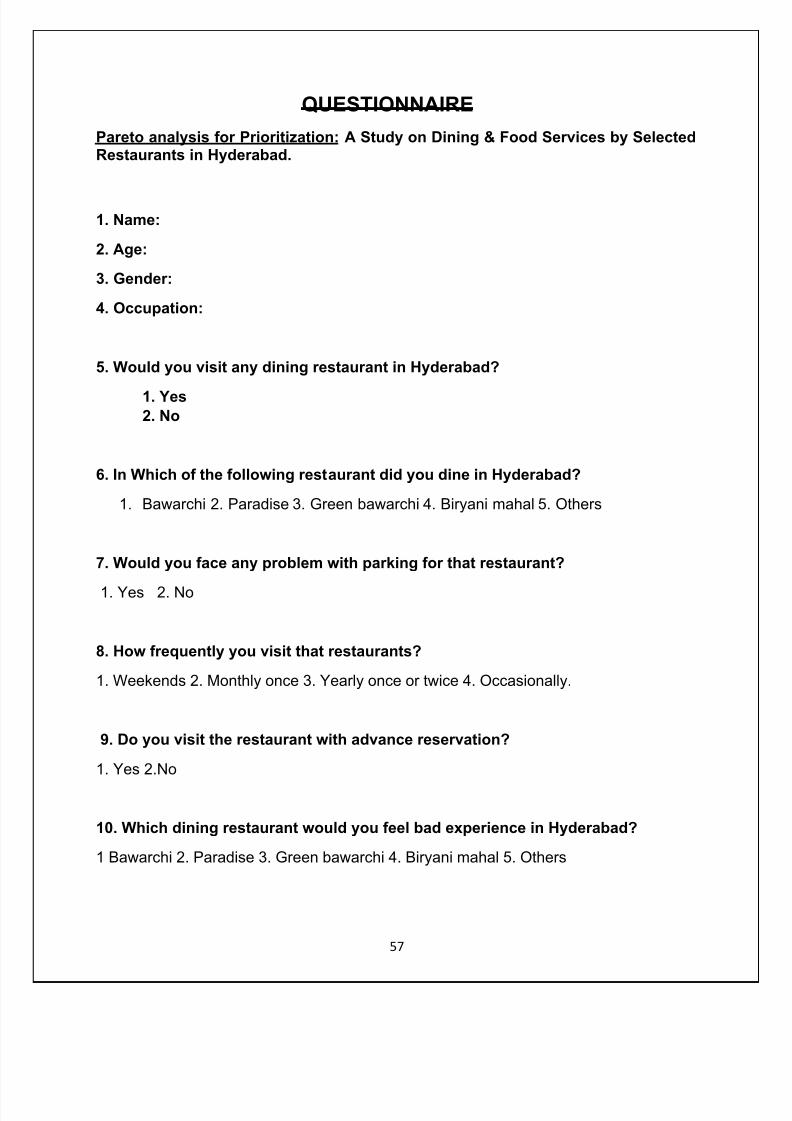
QUESTIONNAIRE
Pareto analysis for Prioritization: A Study on Dining & Food Services by SelectedRestaurants in Hyderabad.
1. Name:
2. Age:
3. Gender:
4. Occupation:
5. Would you visit any dining restaurant in Hyderabad?
1. Yes2. No
6. In Which of the following restaurant did you dine in Hyderabad?
1. Bawarchi 2. Paradise 3. Green bawarchi 4. Biryani mahal 5. Others
7. Would you face any problem with parking for that restaurant?
1. Yes 2. No
8. How frequently you visit that restaurants?
1. Weekends 2. Monthly once 3. Yearly once or twice 4. Occasionally.
9. Do you visit the restaurant with advance reservation?
1. Yes 2.No
10. Which dining restaurant would you feel bad experience in Hyderabad?
1 Bawarchi 2. Paradise 3. Green bawarchi 4. Biryani mahal 5. Others
7/21/2019 LSCM Project Savitha
http://slidepdf.com/reader/full/lscm-project-savitha 58/59
58
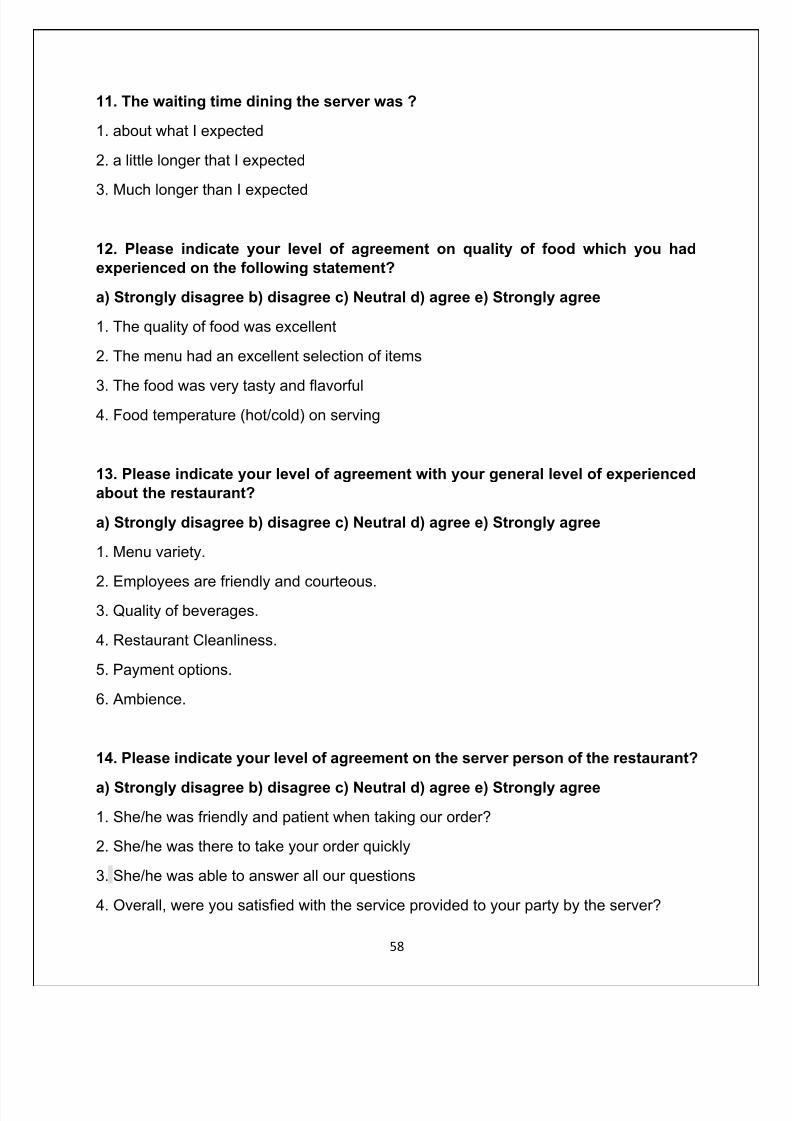
11. The waiting time dining the server was ?
1. about what I expected
2. a little longer that I expected
3. Much longer than I expected
12. Please indicate your level of agreement on quality of food which you had
experienced on the following statement?
a) Strongly disagree b) disagree c) Neutral d) agree e) Strongly agree
1. The quality of food was excellent
2. The menu had an excellent selection of items
3. The food was very tasty and flavorful4. Food temperature (hot/cold) on serving
13. Please indicate your level of agreement with your general level of experienced
about the restaurant?
a) Strongly disagree b) disagree c) Neutral d) agree e) Strongly agree
1. Menu variety.
2. Employees are friendly and courteous.3. Quality of beverages.
4. Restaurant Cleanliness.
5. Payment options.
6. Ambience.
14. Please indicate your level of agreement on the server person of the restaurant?
a) Strongly disagree b) disagree c) Neutral d) agree e) Strongly agree
1. She/he was friendly and patient when taking our order?
2. She/he was there to take your order quickly
3. She/he was able to answer all our questions
4. Overall, were you satisfied with the service provided to your party by the server?
7/21/2019 LSCM Project Savitha
http://slidepdf.com/reader/full/lscm-project-savitha 59/59
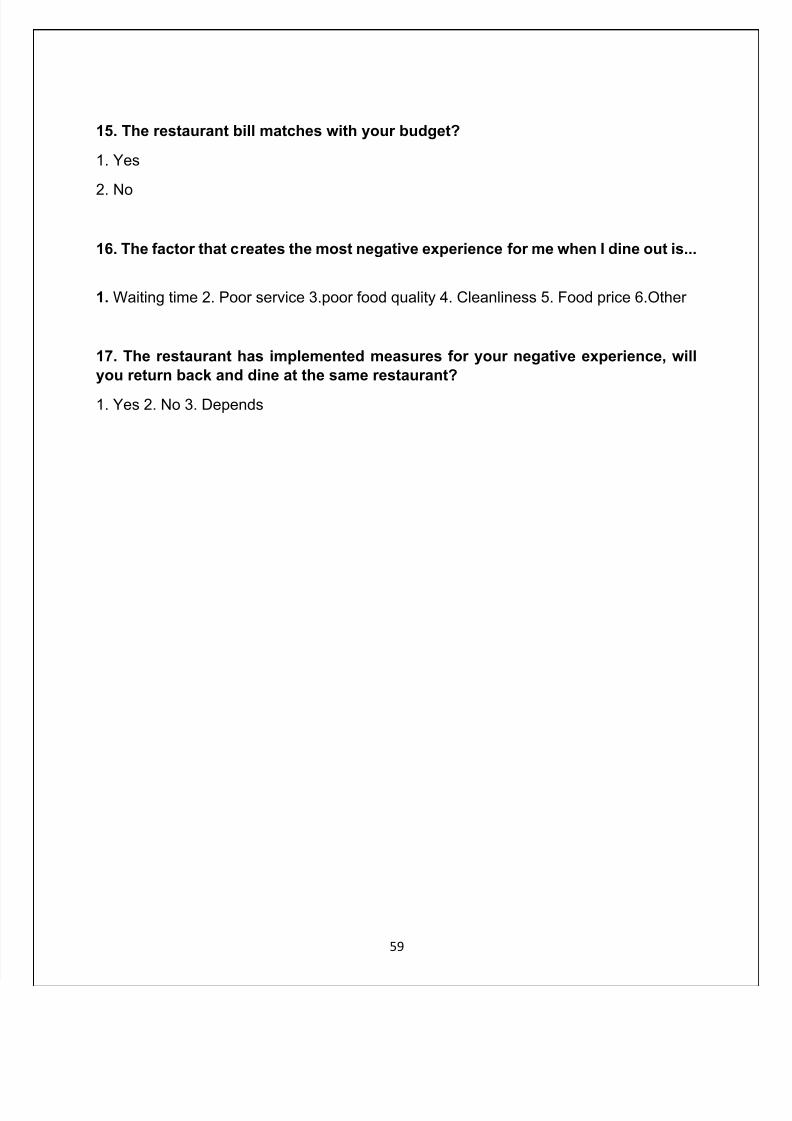
15. The restaurant bill matches with your budget?
1. Yes
2. No
16. The factor that creates the most negative experience for me when I dine out is...
1. Waiting time 2. Poor service 3.poor food quality 4. Cleanliness 5. Food price 6.Other
17. The restaurant has implemented measures for your negative experience, will
you return back and dine at the same restaurant?
1. Yes 2. No 3. Depends
Related Documents