© 2007 DRM ASSOCIATES DRM ASSOCIATES CAPABILITIES WITH LEAN PRODUCT DEVELOPMENT (LPD) Contact: Kenneth Crow | Tel: 310-377-5569 | Email: [email protected]

LPD Capabilities
Oct 25, 2015
LEAN PRODUCT DEVELOPMENT (LPD)
Welcome message from author
This document is posted to help you gain knowledge. Please leave a comment to let me know what you think about it! Share it to your friends and learn new things together.
Transcript
© 2007 DRM ASSOCIATES
DRM ASSOCIATES CAPABILITIES
WITH LEAN PRODUCT DEVELOPMENT (LPD)
Contact: Kenneth Crow | Tel: 310-377-5569 | Email: [email protected]
© 2007 DRM ASSOCIATES
KENNETH CROW
• 30+ years consulting in product development & manufacturing
– Former Director, Mfg. Consulting, Ernst & Young
– President, DRM Associates• Recognized expert in product
development, project management, design to cost, QFD, VA, DFM and lean practices
• Certified New Product Development Professional• Frequent international speaker and author• Former President & Director of the Society of
Concurrent Product Development
For further information on Ken, see www.npd-solutions.com/kcrow.html
© 2007 DRM ASSOCIATES
DRM ASSOCIATES
• Firm with recognized expertise in new product development & core focus on value
• Kenneth Crow is the firm’s Principal consultant
• Nine highly-experienced consultants
• Extensive client list - Fortune 500 and international clients
• Led consortium to identify 270 best practices of product development
• Extensive training experience and materials -conducted over 200 workshops
For further information on DRM Associates, see www.npd-solutions.com
© 2007 DRM ASSOCIATES
LEAN THINKING
Lean refers to a way of thinking and specific practices the emphasize less of everything – less resources, less work-in-process, less time, and less cost – to produce
something, either a physical product, knowledge product (e.g. product design), or service product.
© 2007 DRM ASSOCIATES
LEAN THINKING PRINCIPLES
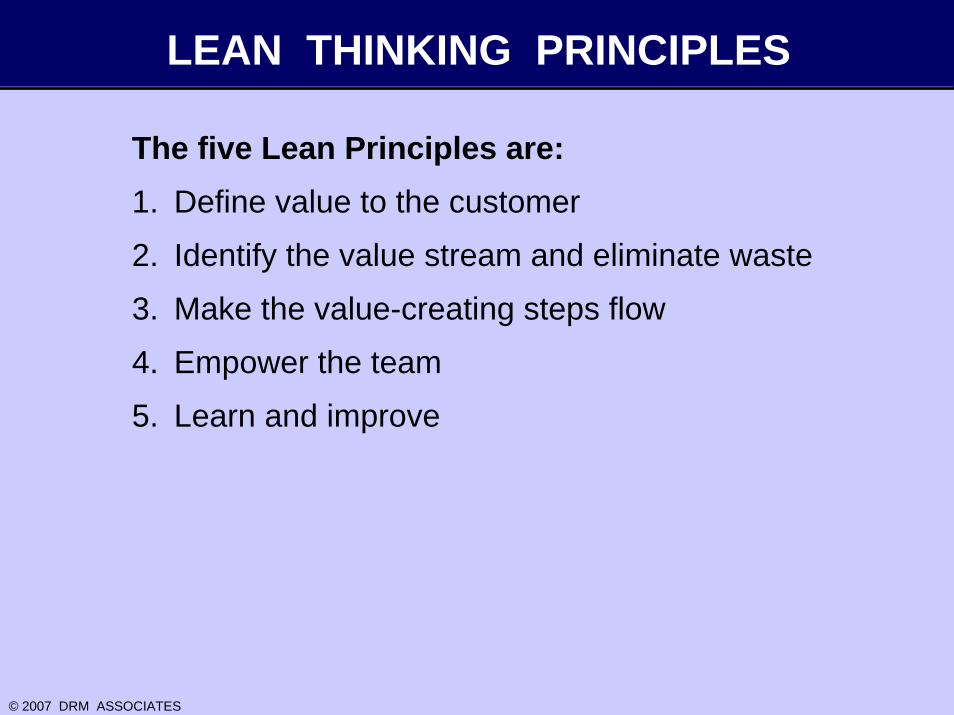
The five Lean Principles are:1. Define value to the customer
2. Identify the value stream and eliminate waste
3. Make the value-creating steps flow
4. Empower the team
5. Learn and improve
© 2007 DRM ASSOCIATES
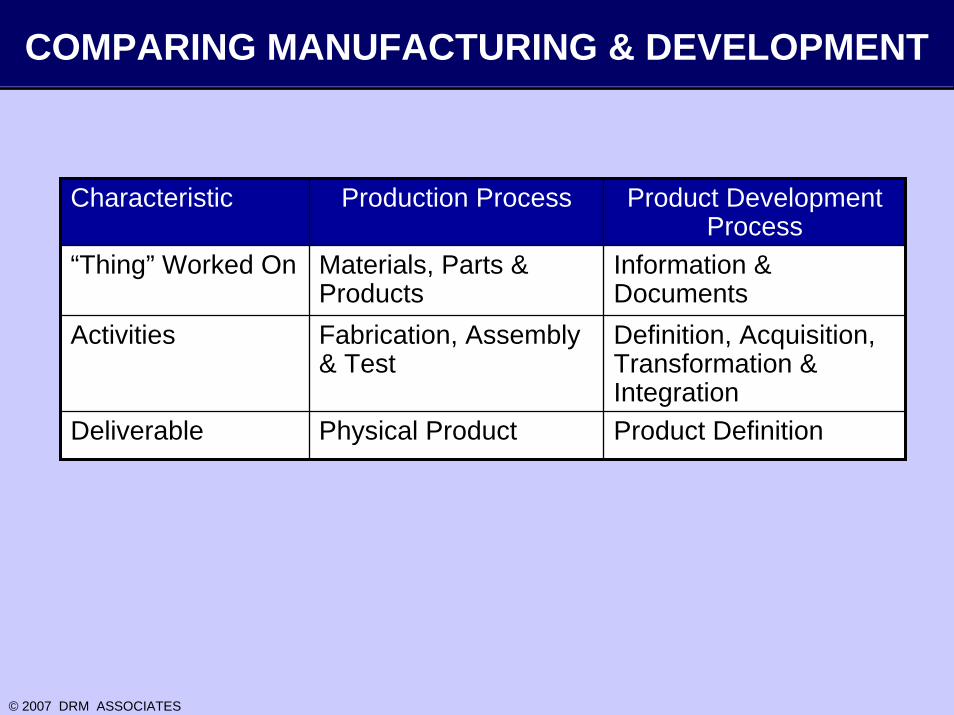
COMPARING MANUFACTURING & DEVELOPMENT
Characteristic Production Process Product Development Process
“Thing” Worked On Materials, Parts & Products
Information & Documents
Activities Fabrication, Assembly & Test
Definition, Acquisition, Transformation & Integration
Deliverable Physical Product Product Definition
© 2007 DRM ASSOCIATES
LEAN PD PRACTICES & TOOLS
Voi
ce o
f the
Cus
tom
erQ
ualit
y Fu
nctio
n D
eplo
ymen
tLe
an D
esig
nP
latfo
rms
& D
esig
n R
euse
Rap
idly
Exp
lore
Alte
rnat
ives
Val
ue S
tream
Map
ping
5S W
orkp
lace
Sta
ndar
dize
d W
ork
Pip
elin
e M
anag
emen
tFl
ow P
roce
ss &
Pul
l Sch
edul
ing
Red
uced
Bat
ch S
izes
Syn
chro
nize
Act
iviti
esD
elay
Com
mitm
ent
Cro
ss F
unct
iona
l Tea
mW
orkf
orce
Em
pow
erm
ent
Rig
ht R
esou
rces
Am
plify
Lea
rnin
g
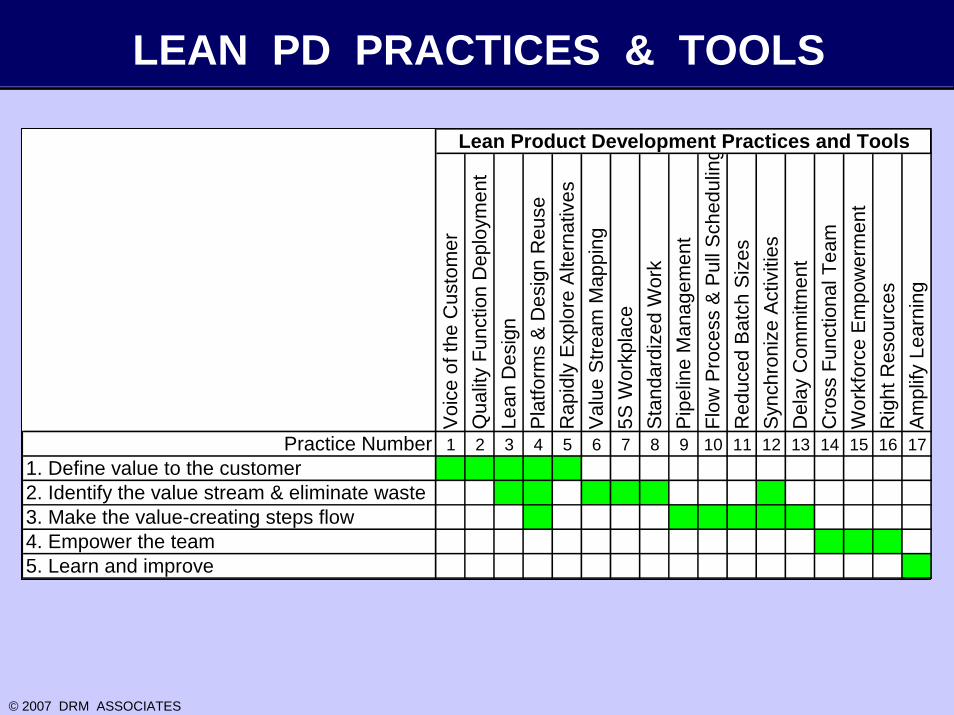
Practice Number 1 2 3 4 5 6 7 8 9 10 11 12 13 14 15 16 171. Define value to the customer 2. Identify the value stream & eliminate waste 3. Make the value-creating steps flow 4. Empower the team 5. Learn and improve
Lean Product Development Practices and Tools
© 2007 DRM ASSOCIATES
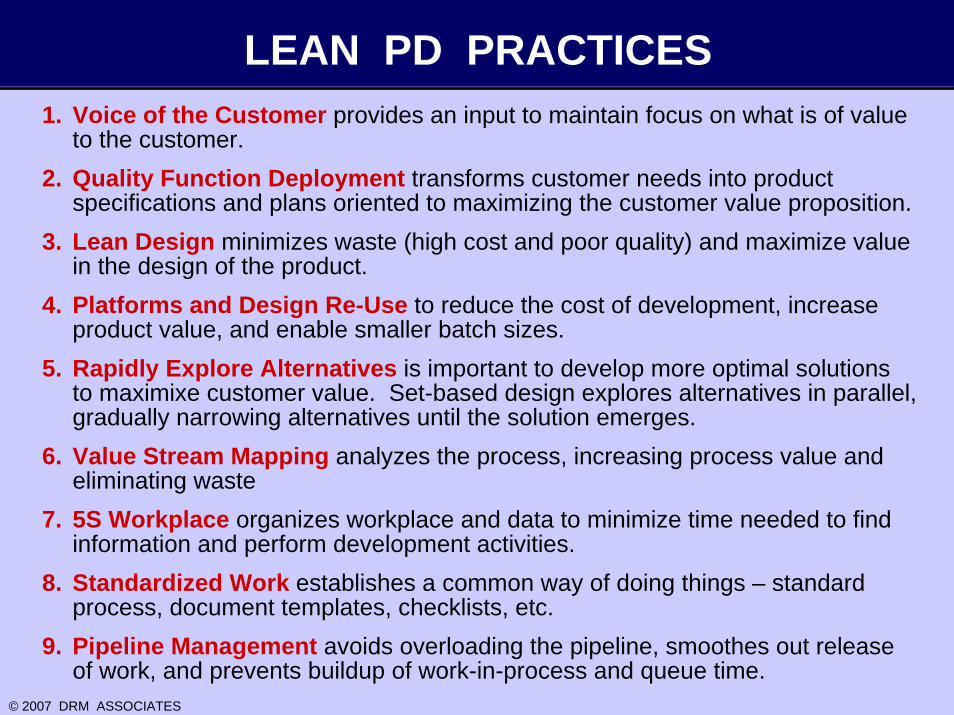
LEAN PD PRACTICES1. Voice of the Customer provides an input to maintain focus on what is of value
to the customer.2. Quality Function Deployment transforms customer needs into product
specifications and plans oriented to maximizing the customer value proposition.3. Lean Design minimizes waste (high cost and poor quality) and maximize value
in the design of the product.4. Platforms and Design Re-Use to reduce the cost of development, increase
product value, and enable smaller batch sizes.5. Rapidly Explore Alternatives is important to develop more optimal solutions
to maximixe customer value. Set-based design explores alternatives in parallel, gradually narrowing alternatives until the solution emerges.
6. Value Stream Mapping analyzes the process, increasing process value and eliminating waste
7. 5S Workplace organizes workplace and data to minimize time needed to find information and perform development activities.
8. Standardized Work establishes a common way of doing things – standard process, document templates, checklists, etc.
9. Pipeline Management avoids overloading the pipeline, smoothes out release of work, and prevents buildup of work-in-process and queue time.
© 2007 DRM ASSOCIATES
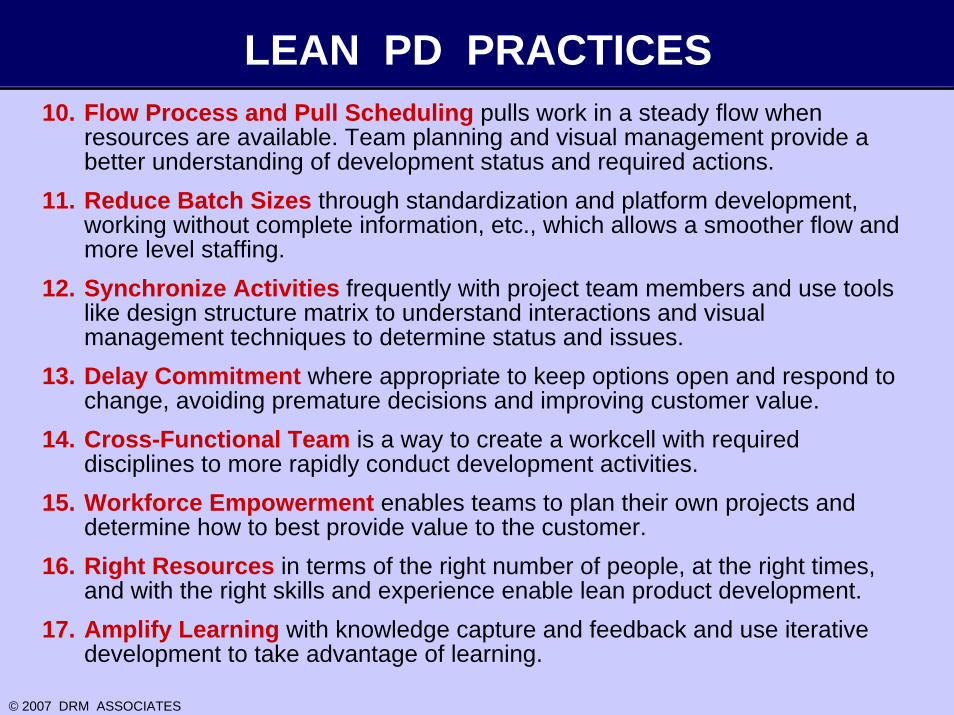
LEAN PD PRACTICES10. Flow Process and Pull Scheduling pulls work in a steady flow when
resources are available. Team planning and visual management provide a better understanding of development status and required actions.
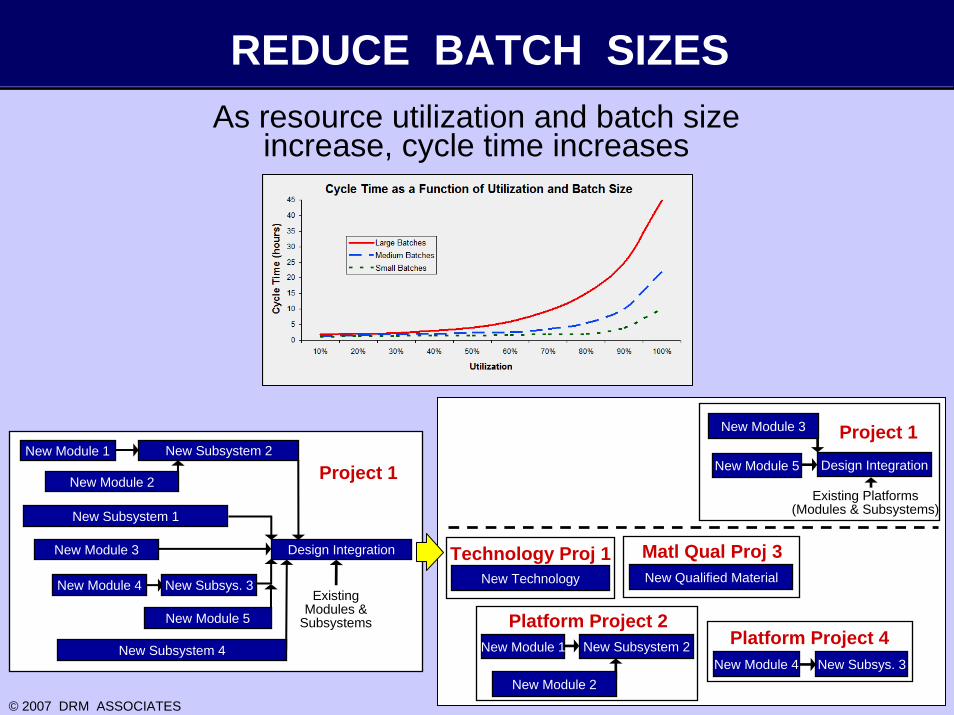
11. Reduce Batch Sizes through standardization and platform development, working without complete information, etc., which allows a smoother flow and more level staffing.
12. Synchronize Activities frequently with project team members and use tools like design structure matrix to understand interactions and visual management techniques to determine status and issues.
13. Delay Commitment where appropriate to keep options open and respond to change, avoiding premature decisions and improving customer value.
14. Cross-Functional Team is a way to create a workcell with required disciplines to more rapidly conduct development activities.
15. Workforce Empowerment enables teams to plan their own projects and determine how to best provide value to the customer.
16. Right Resources in terms of the right number of people, at the right times, and with the right skills and experience enable lean product development.
17. Amplify Learning with knowledge capture and feedback and use iterative development to take advantage of learning.
© 2007 DRM ASSOCIATES
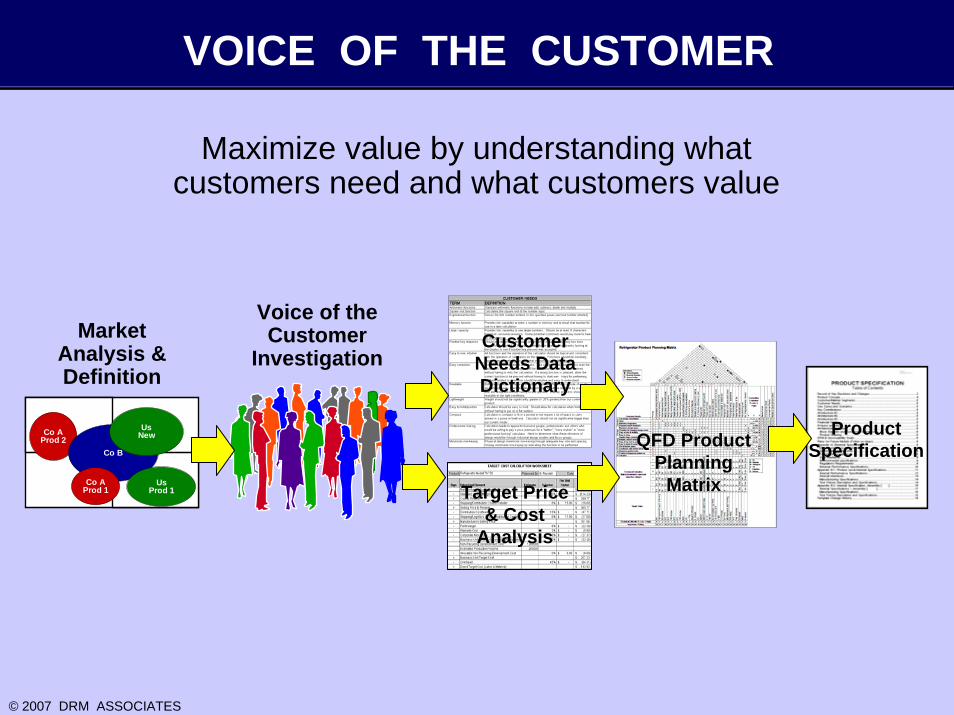
VOICE OF THE CUSTOMER
Maximize value by understanding what customers need and what customers value
Co AProd 2
Co B
UsNew
UsProd 1
Co AProd 1 Target Price
& Cost Analysis
QFD Product Planning
Matrix
ProductSpecification
Customer Needs Data Dictionary
Voice of the Customer
InvestigationMarket
Analysis & Definition
© 2007 DRM ASSOCIATES
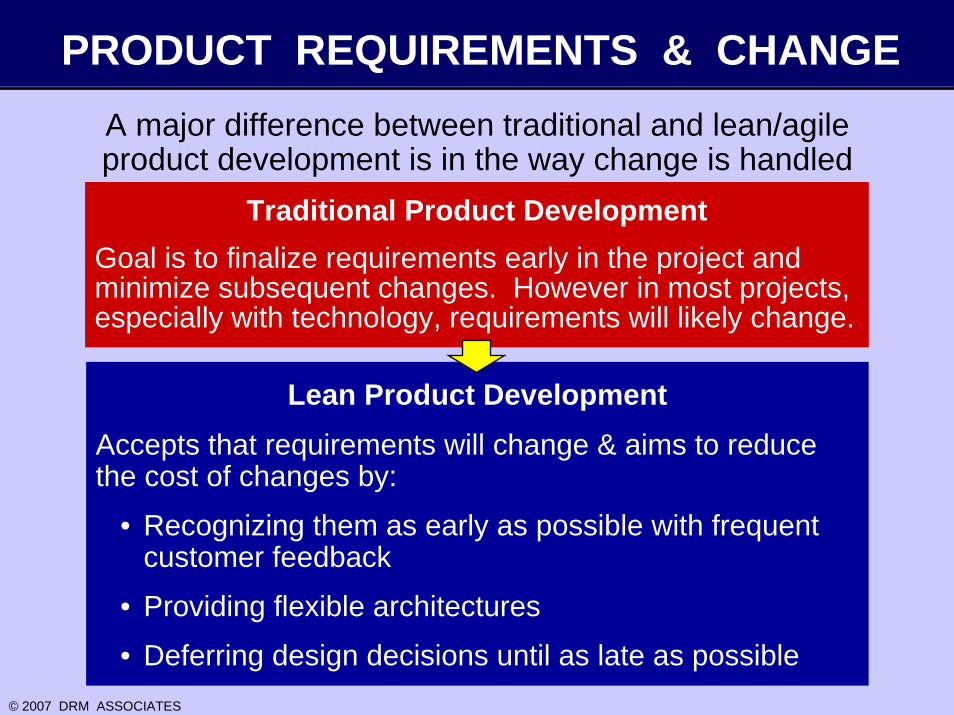
PRODUCT REQUIREMENTS & CHANGEA major difference between traditional and lean/agile product development is in the way change is handled
Traditional Product DevelopmentGoal is to finalize requirements early in the project and minimize subsequent changes. However in most projects, especially with technology, requirements will likely change.
Lean Product DevelopmentAccepts that requirements will change & aims to reduce the cost of changes by:
• Recognizing them as early as possible with frequent customer feedback
• Providing flexible architectures
• Deferring design decisions until as late as possible
© 2007 DRM ASSOCIATES
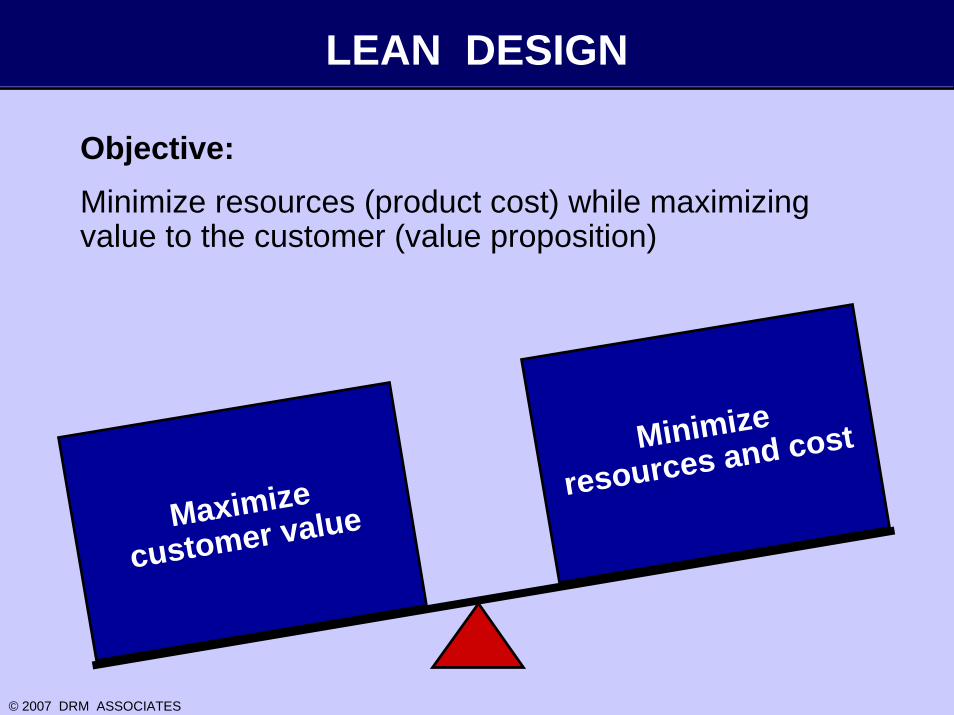
LEAN DESIGN
Objective:Minimize resources (product cost) while maximizing value to the customer (value proposition)
Maximize
customer value
Minimize
resources and cost
© 2007 DRM ASSOCIATES
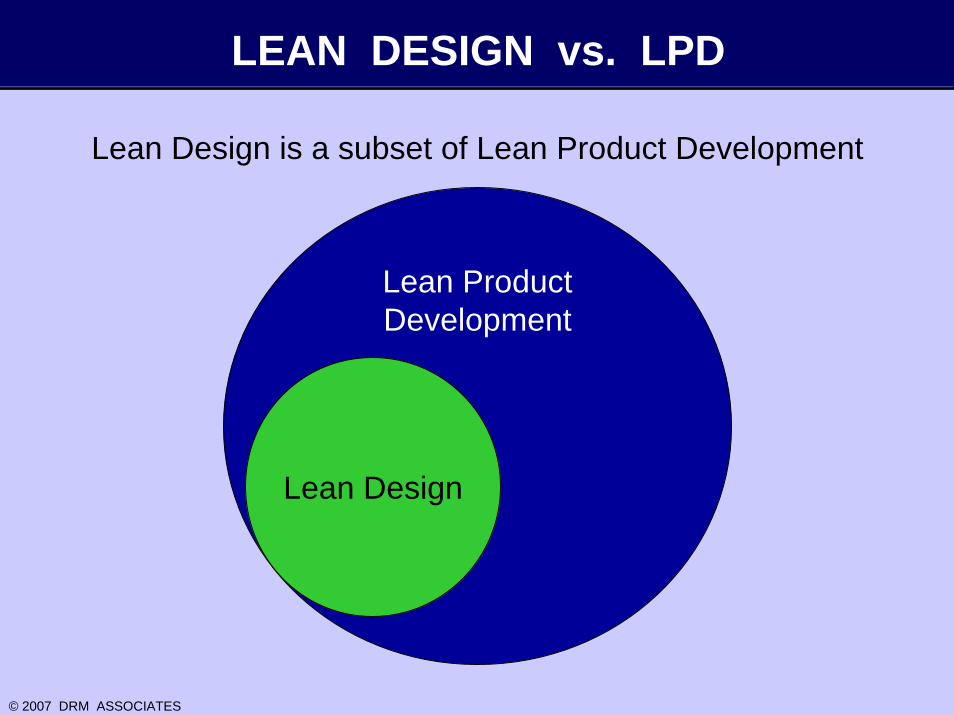
LEAN DESIGN vs. LPD
Lean Design is a subset of Lean Product Development
Lean ProductDevelopment
Lean Design
© 2007 DRM ASSOCIATES
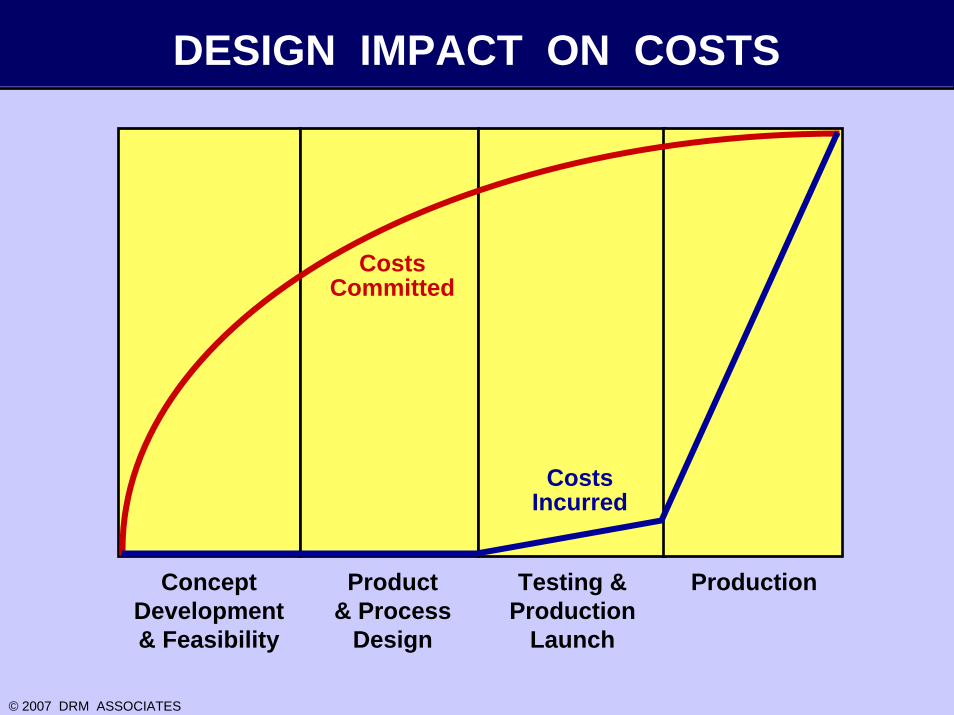
DESIGN IMPACT ON COSTS
ConceptDevelopment& Feasibility
Product& Process
Design
ProductionTesting &Production
Launch
CostsCommitted
CostsIncurred
© 2007 DRM ASSOCIATES
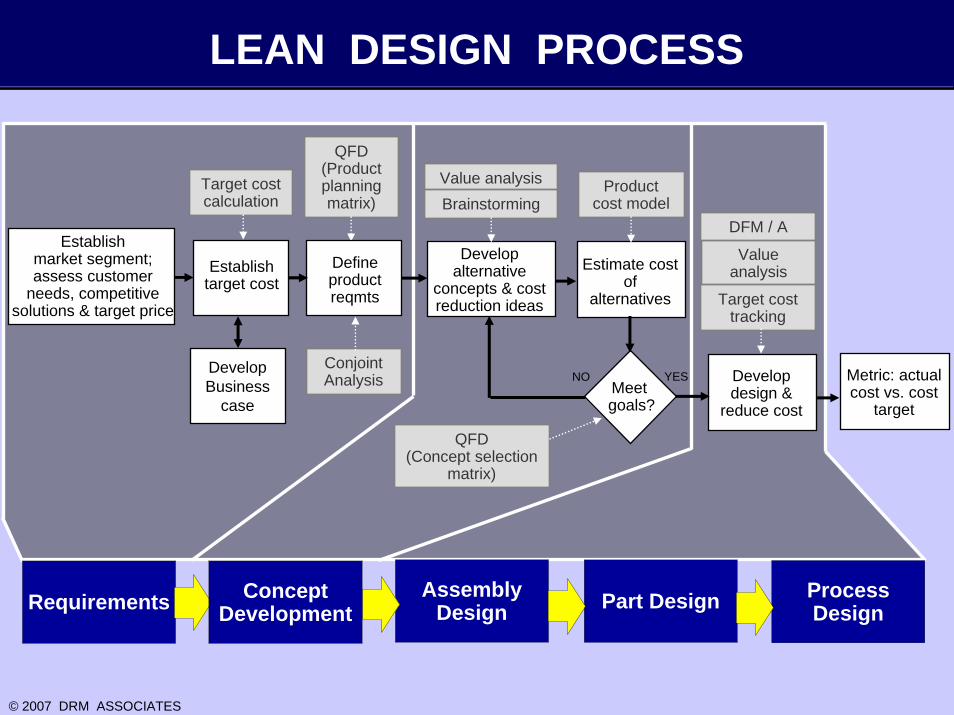
LEAN DESIGN PROCESS
Establishmarket segment; assess customer
needs, competitive solutions & target price
Establish target cost
Develop alternative
concepts & cost reduction ideas
Meet goals?
Estimate cost of
alternatives
Develop design &
reduce cost
Target cost calculation
Value analysis Product cost model
DFM / A
Metric: actual cost vs. cost
target
YESNO
Brainstorming
Value analysis
Target cost tracking
QFD(Product planning matrix)
QFD(Concept selection
matrix)
Define product reqmts
Requirements AssemblyDesign
ProcessDesignPart DesignConcept
Development
DevelopBusiness
case
Conjoint Analysis
© 2007 DRM ASSOCIATES
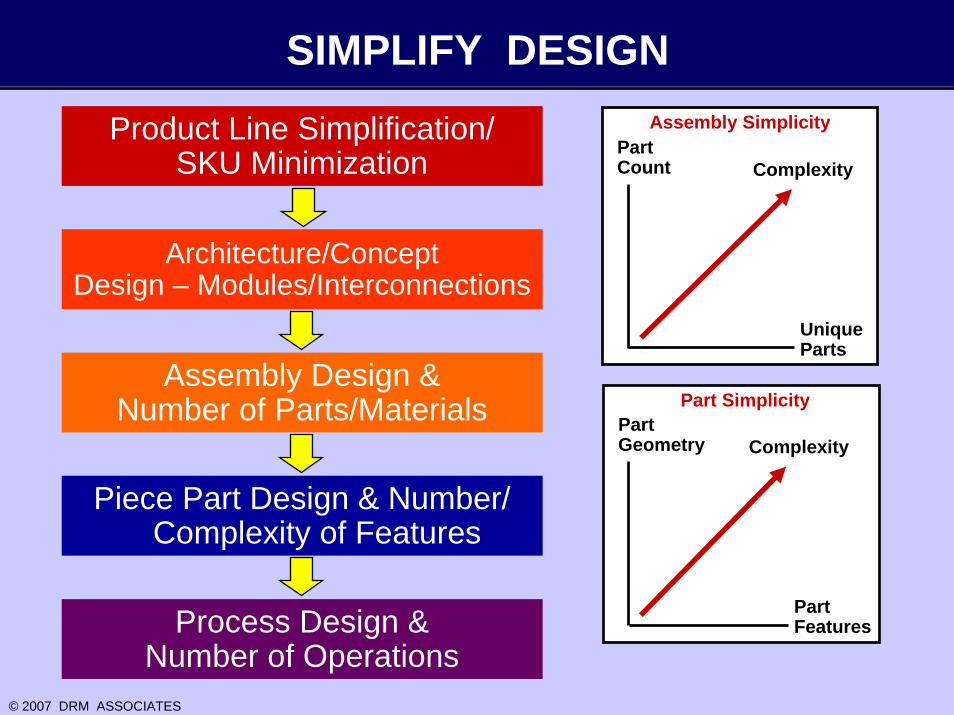
SIMPLIFY DESIGN
PartCount
UniqueParts
Complexity
Assembly SimplicityProduct Line Simplification/SKU Minimization
Architecture/ConceptDesign – Modules/Interconnections
Assembly Design & Number of Parts/Materials Part
Geometry
PartFeatures
Complexity
Part Simplicity
Piece Part Design & Number/ Complexity of Features
Process Design & Number of Operations
© 2007 DRM ASSOCIATES
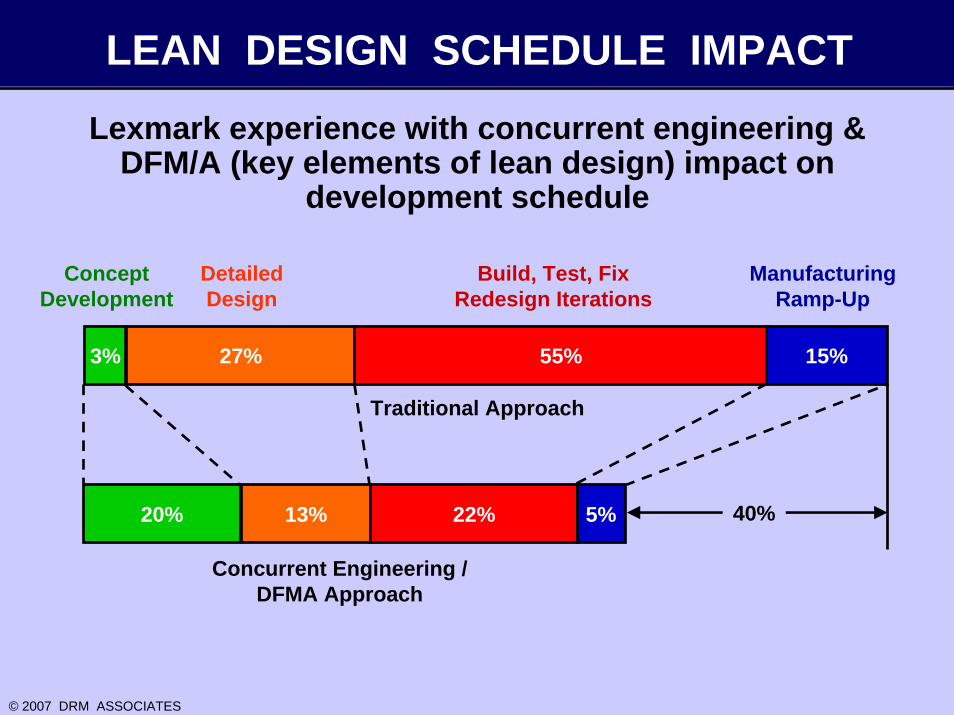
LEAN DESIGN SCHEDULE IMPACT
Lexmark experience with concurrent engineering & DFM/A (key elements of lean design) impact on
development schedule
Concept Development
Detailed Design
Build, Test, Fix Redesign Iterations
Manufacturing Ramp-Up
3% 27% 55% 15%
20% 13% 22% 5% 40%
Traditional Approach
Concurrent Engineering / DFMA Approach
© 2007 DRM ASSOCIATES
DESIGN REUSE PHILOSOPHY
The more a company can leverage its existing products, knowledge, and expertise with new product designs, the more it can reduce the
need to invest resources and time in creating those products
© 2007 DRM ASSOCIATES
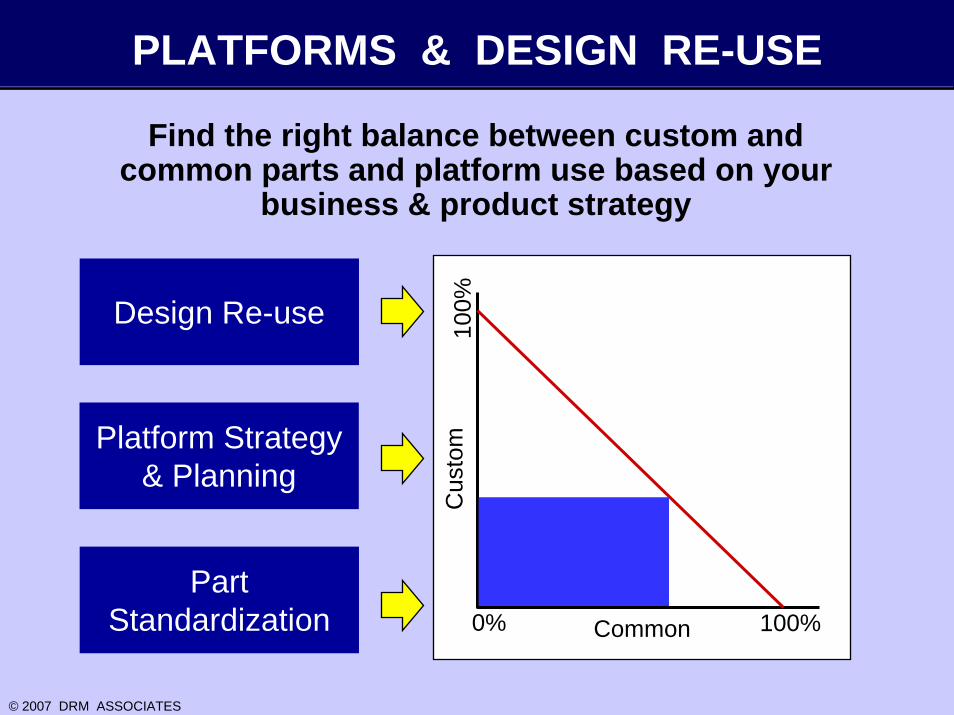
PLATFORMS & DESIGN RE-USE
Find the right balance between custom and common parts and platform use based on your
business & product strategy
Common0%
100%
100%
Cus
tom
Design Re-use
Platform Strategy & Planning
Part Standardization
© 2007 DRM ASSOCIATES
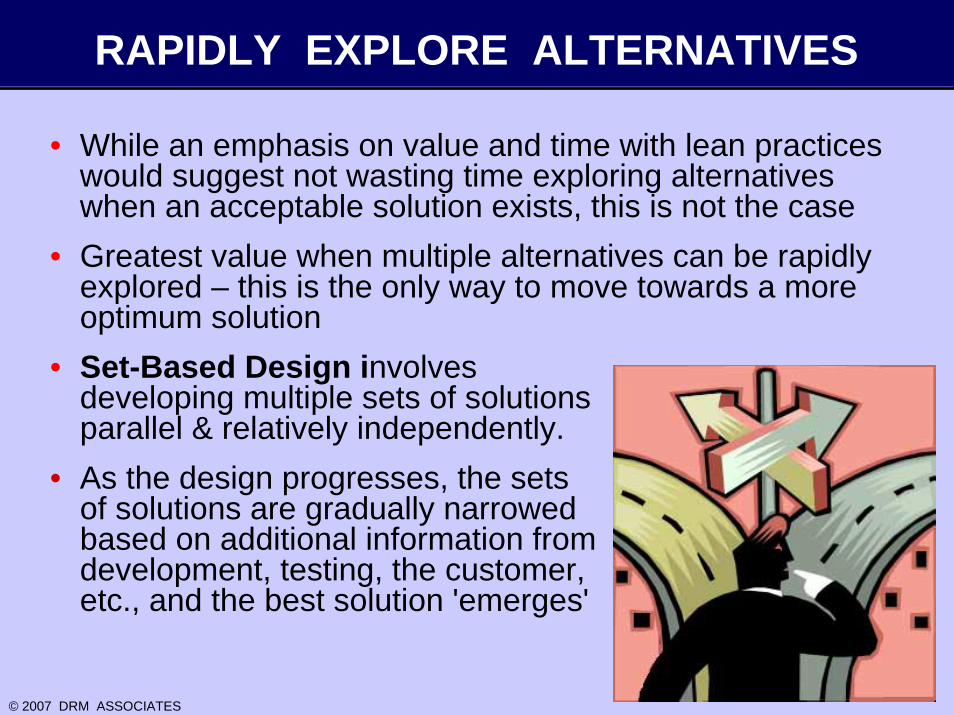
RAPIDLY EXPLORE ALTERNATIVES
• While an emphasis on value and time with lean practices would suggest not wasting time exploring alternatives when an acceptable solution exists, this is not the case
• Greatest value when multiple alternatives can be rapidly explored – this is the only way to move towards a more optimum solution
• Set-Based Design involves developing multiple sets of solutions in parallel & relatively independently.
• As the design progresses, the sets of solutions are gradually narrowed based on additional information from development, testing, the customer, etc., and the best solution 'emerges'
© 2007 DRM ASSOCIATES
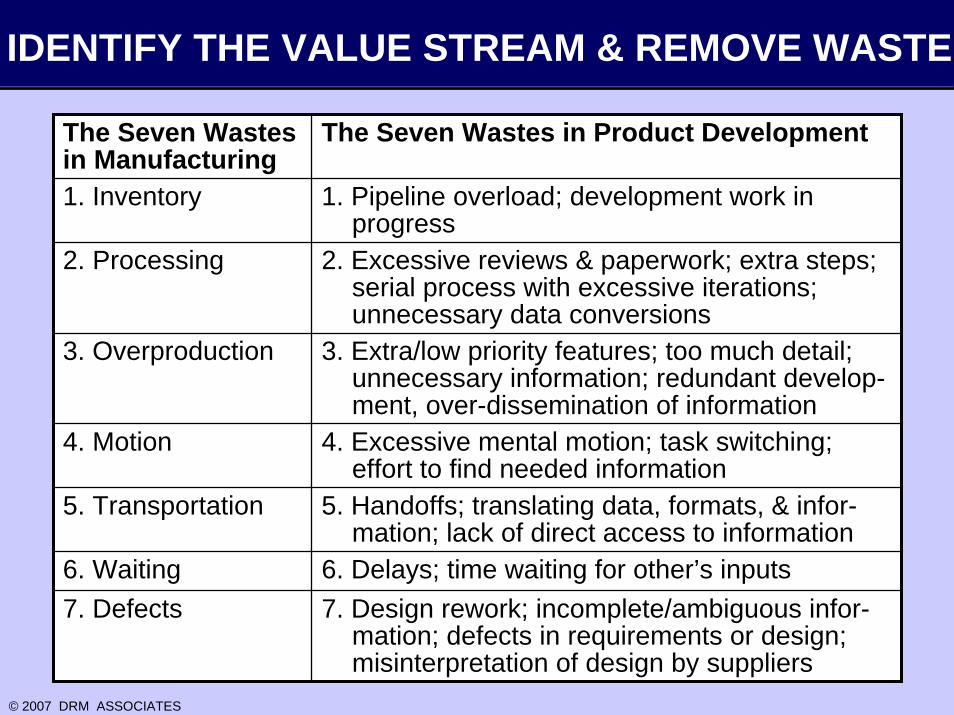
IDENTIFY THE VALUE STREAM & REMOVE WASTE
The Seven Wastes in Manufacturing
The Seven Wastes in Product Development
1. Inventory 1. Pipeline overload; development work in progress
2. Processing 2. Excessive reviews & paperwork; extra steps; serial process with excessive iterations; unnecessary data conversions
3. Overproduction 3. Extra/low priority features; too much detail; unnecessary information; redundant develop-ment, over-dissemination of information
4. Motion 4. Excessive mental motion; task switching; effort to find needed information
5. Transportation 5. Handoffs; translating data, formats, & infor-mation; lack of direct access to information
6. Waiting 6. Delays; time waiting for other’s inputs7. Defects 7. Design rework; incomplete/ambiguous infor-
mation; defects in requirements or design; misinterpretation of design by suppliers
© 2007 DRM ASSOCIATES
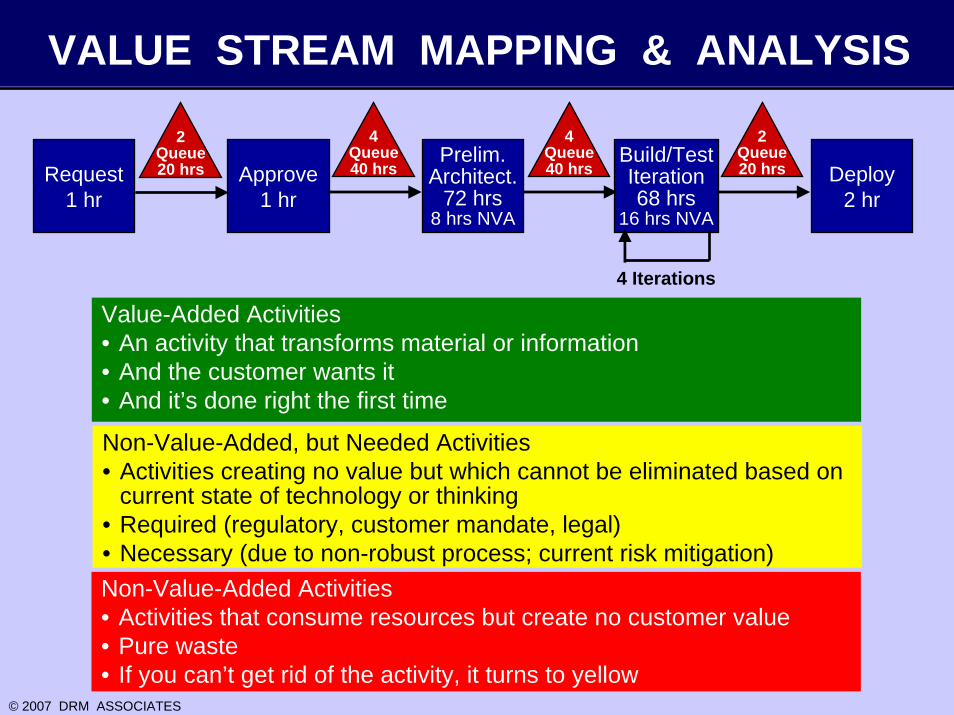
VALUE STREAM MAPPING & ANALYSIS
Request1 hr
Approve1 hr
Prelim.Architect.
72 hrs8 hrs NVA
Build/TestIteration68 hrs
16 hrs NVA
Deploy2 hr
4Queue40 hrs
2Queue20 hrs
4Queue40 hrs
2Queue20 hrs
4 Iterations
Value-Added Activities• An activity that transforms material or information• And the customer wants it• And it’s done right the first time
Non-Value-Added, but Needed Activities• Activities creating no value but which cannot be eliminated based on
current state of technology or thinking• Required (regulatory, customer mandate, legal)• Necessary (due to non-robust process; current risk mitigation)Non-Value-Added Activities• Activities that consume resources but create no customer value• Pure waste• If you can’t get rid of the activity, it turns to yellow
© 2007 DRM ASSOCIATES
STANDARDIZE WORK
• Standardize the development process to simplify planning and avoid relearning
• Define multiple processes as required to support different development needs
– New products
– Product enhancements & product line extensions
– Technology development or platform development that does not lead directly to a new product
• Facilitates training and process documentation (e.g., ISO 9001)
© 2007 DRM ASSOCIATES
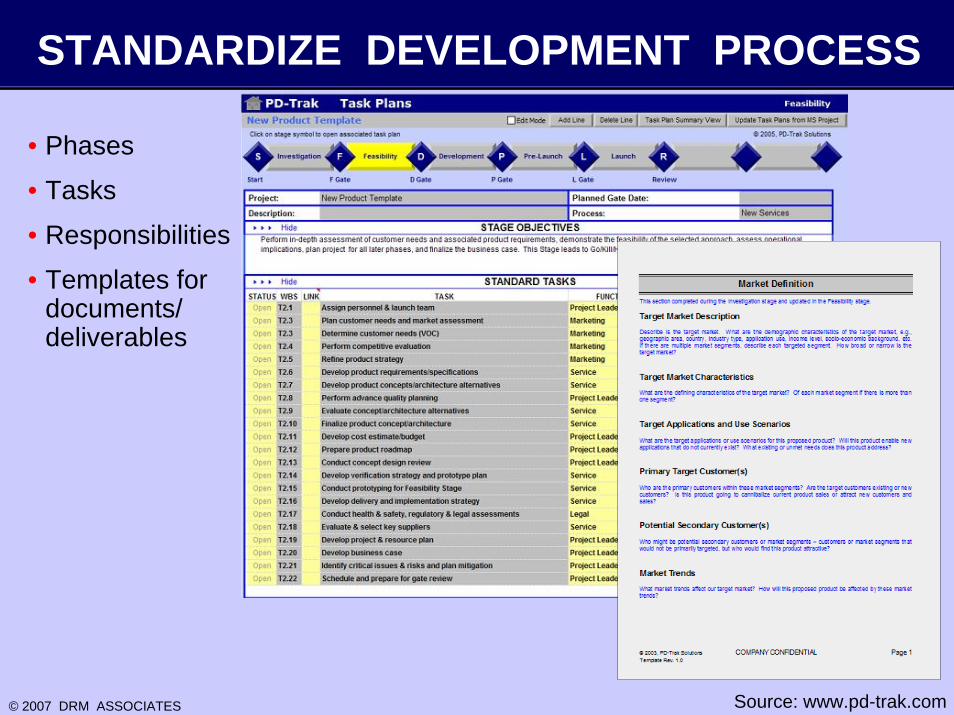
STANDARDIZE DEVELOPMENT PROCESS
• Phases
• Tasks
• Responsibilities
• Templates for documents/ deliverables
Source: www.pd-trak.com
© 2007 DRM ASSOCIATES
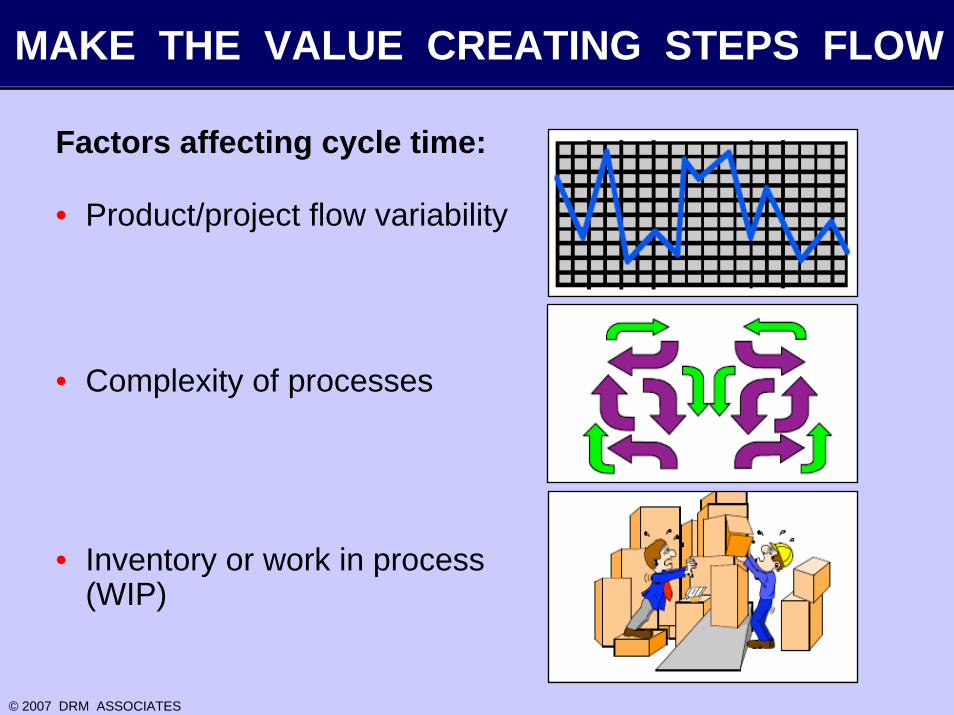
MAKE THE VALUE CREATING STEPS FLOW
Factors affecting cycle time:
• Product/project flow variability
• Complexity of processes
• Inventory or work in process (WIP)
© 2007 DRM ASSOCIATES
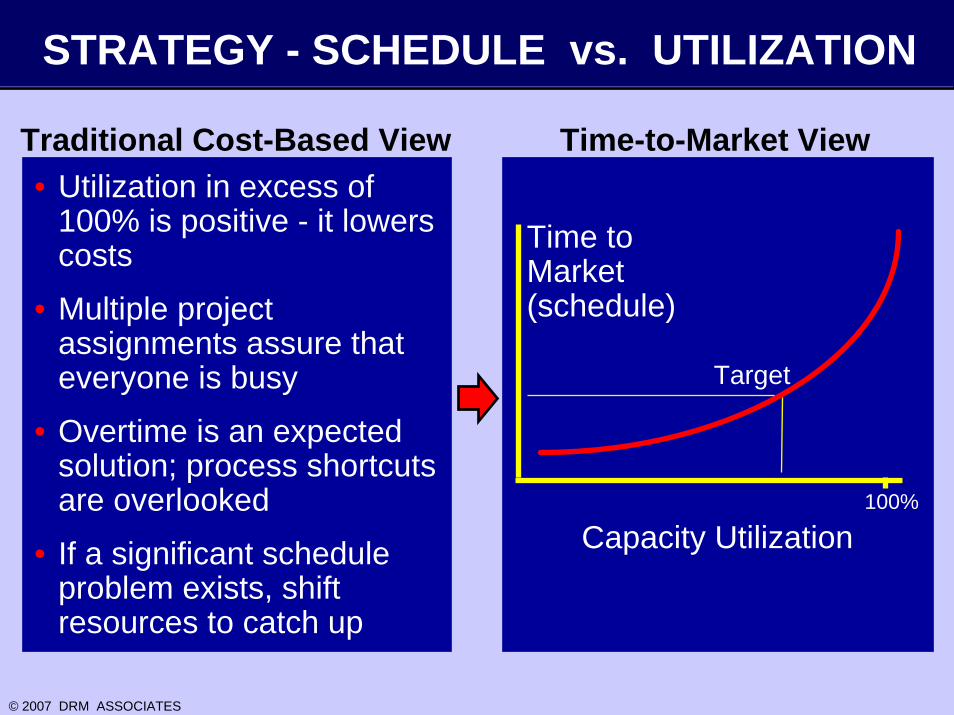
STRATEGY - SCHEDULE vs. UTILIZATION
• Utilization in excess of 100% is positive - it lowers costs
• Multiple project assignments assure that everyone is busy
• Overtime is an expected solution; process shortcuts are overlooked
• If a significant schedule problem exists, shift resources to catch up
100%
Capacity Utilization
Time toMarket(schedule)
Target
Traditional Cost-Based View Time-to-Market View
© 2007 DRM ASSOCIATES
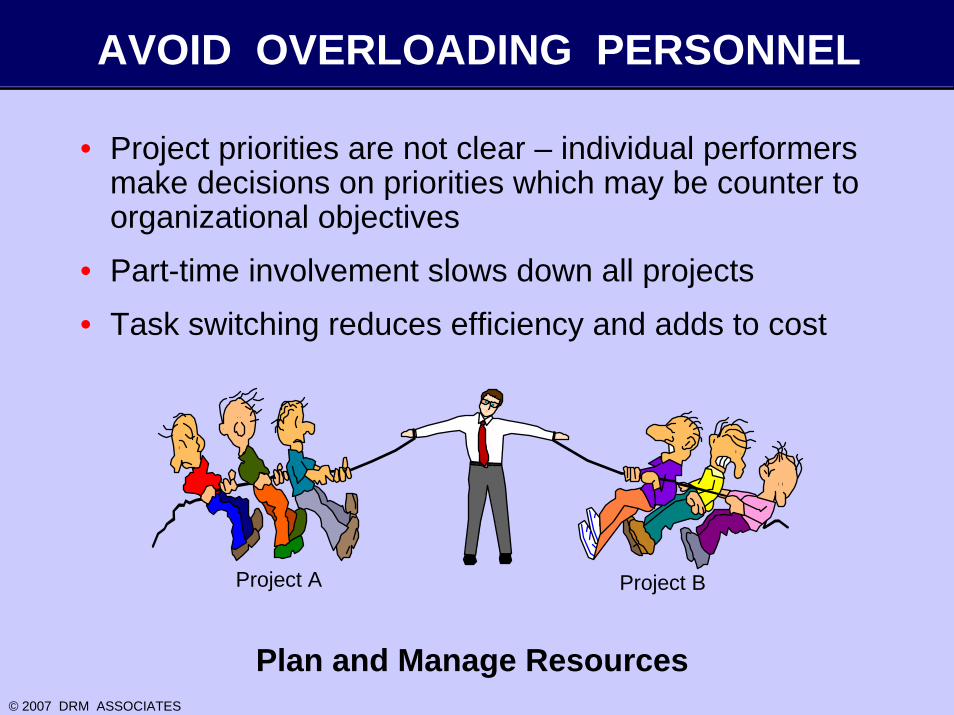
AVOID OVERLOADING PERSONNEL
• Project priorities are not clear – individual performers make decisions on priorities which may be counter to organizational objectives
• Part-time involvement slows down all projects
• Task switching reduces efficiency and adds to cost
Project A Project B
Plan and Manage Resources
© 2007 DRM ASSOCIATES
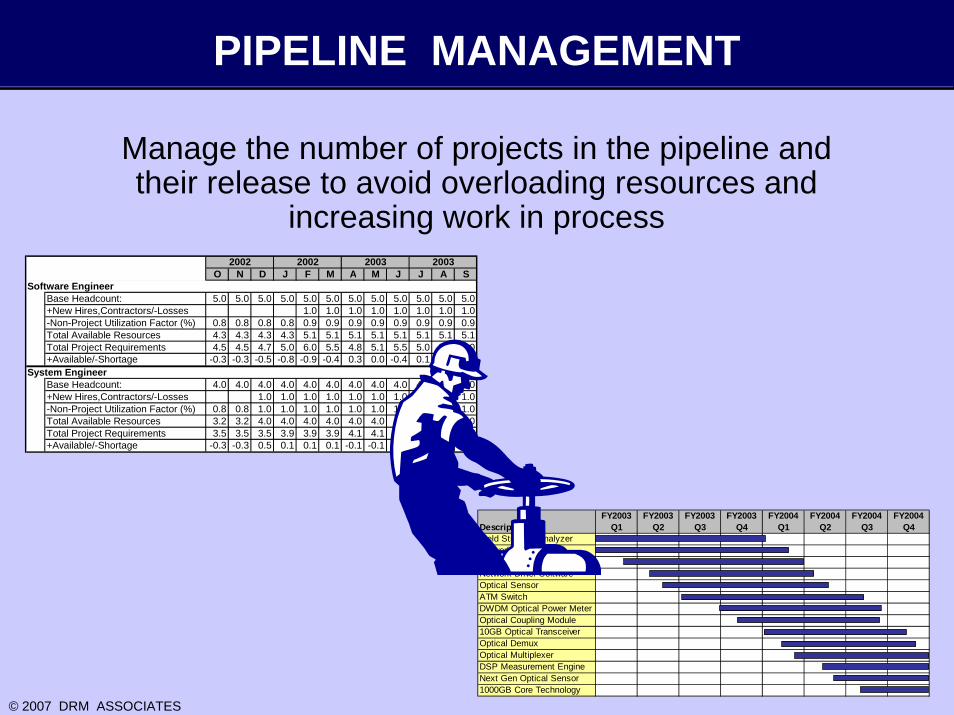
PIPELINE MANAGEMENT
Manage the number of projects in the pipeline and their release to avoid overloading resources and
increasing work in process
DescriptionFY2003
Q1FY2003
Q2FY2003
Q3FY2003
Q4FY2004
Q1FY2004
Q2FY2004
Q3FY2004
Q4Field Strength AnalyzerNetwork TesterBroadband Optical DetectorNetwork Driver SoftwareOptical SensorATM SwitchDWDM Optical Power MeterOptical Coupling Module10GB Optical TransceiverOptical DemuxOptical MultiplexerDSP Measurement EngineNext Gen Optical Sensor1000GB Core Technology
O N D J F M A M J J A SSoftware Engineer
Base Headcount: 5.0 5.0 5.0 5.0 5.0 5.0 5.0 5.0 5.0 5.0 5.0 5.0+New Hires,Contractors/-Losses 1.0 1.0 1.0 1.0 1.0 1.0 1.0 1.0-Non-Project Utilization Factor (%) 0.8 0.8 0.8 0.8 0.9 0.9 0.9 0.9 0.9 0.9 0.9 0.9Total Available Resources 4.3 4.3 4.3 4.3 5.1 5.1 5.1 5.1 5.1 5.1 5.1 5.1Total Project Requirements 4.5 4.5 4.7 5.0 6.0 5.5 4.8 5.1 5.5 5.0 5.0 5.0+Available/-Shortage -0.3 -0.3 -0.5 -0.8 -0.9 -0.4 0.3 0.0 -0.4 0.1 0.1 0.1
System EngineerBase Headcount: 4.0 4.0 4.0 4.0 4.0 4.0 4.0 4.0 4.0 4.0 4.0 4.0+New Hires,Contractors/-Losses 1.0 1.0 1.0 1.0 1.0 1.0 1.0 1.0 1.0 1.0-Non-Project Utilization Factor (%) 0.8 0.8 1.0 1.0 1.0 1.0 1.0 1.0 1.0 1.0 1.0 1.0Total Available Resources 3.2 3.2 4.0 4.0 4.0 4.0 4.0 4.0 4.0 4.0 4.0 4.0Total Project Requirements 3.5 3.5 3.5 3.9 3.9 3.9 4.1 4.1 4.1 3.7 3.7 3.7+Available/-Shortage -0.3 -0.3 0.5 0.1 0.1 0.1 -0.1 -0.1 -0.1 0.3 0.3 0.3
2002 2002 2003 2003
© 2007 DRM ASSOCIATES
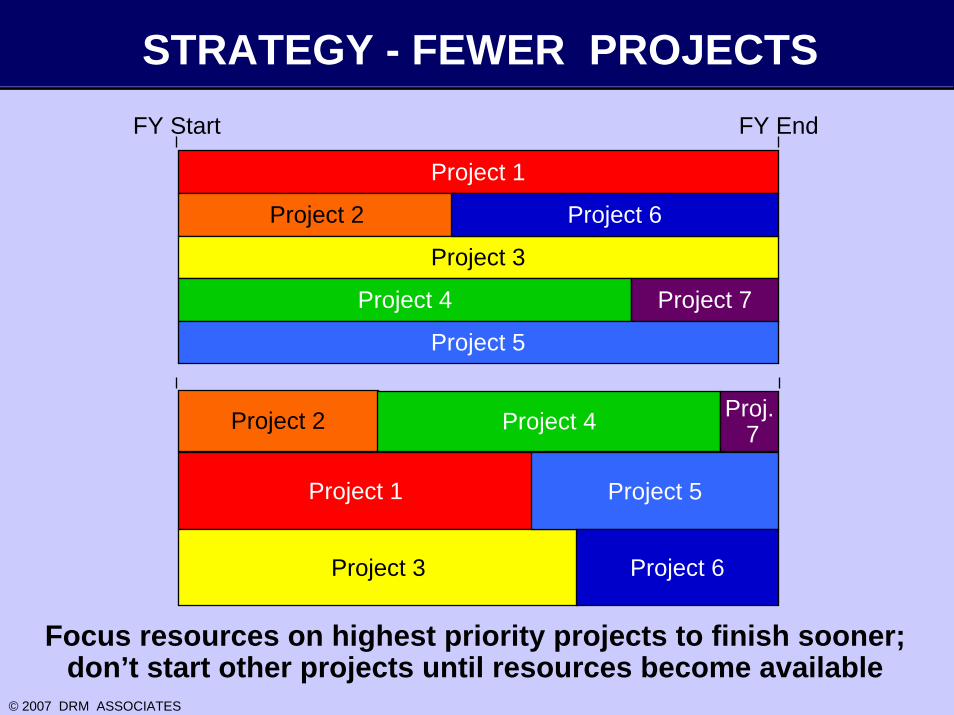
STRATEGY - FEWER PROJECTS
Project 1
Project 2
Project 3
Project 4
Project 6
Project 7
Project 5
FY Start FY End
Project 1
Project 2
Project 3
Project 4
Project 5
Project 6
Proj.7
Focus resources on highest priority projects to finish sooner;don’t start other projects until resources become available
© 2007 DRM ASSOCIATES
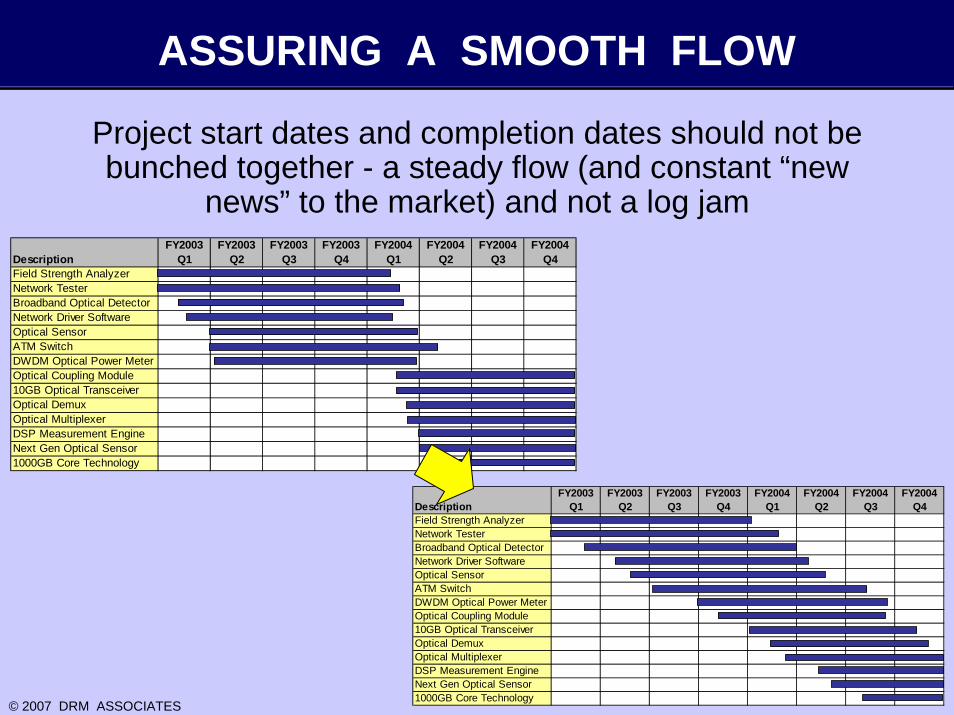
ASSURING A SMOOTH FLOW
Project start dates and completion dates should not be bunched together - a steady flow (and constant “new
news” to the market) and not a log jamDescription
FY2003 Q1
FY2003 Q2
FY2003 Q3
FY2003 Q4
FY2004 Q1
FY2004 Q2
FY2004 Q3
FY2004 Q4
Field Strength AnalyzerNetwork TesterBroadband Optical DetectorNetwork Driver SoftwareOptical SensorATM SwitchDWDM Optical Power MeterOptical Coupling Module10GB Optical TransceiverOptical DemuxOptical MultiplexerDSP Measurement EngineNext Gen Optical Sensor1000GB Core Technology
DescriptionFY2003
Q1FY2003
Q2FY2003
Q3FY2003
Q4FY2004
Q1FY2004
Q2FY2004
Q3FY2004
Q4Field Strength AnalyzerNetwork TesterBroadband Optical DetectorNetwork Driver SoftwareOptical SensorATM SwitchDWDM Optical Power MeterOptical Coupling Module10GB Optical TransceiverOptical DemuxOptical MultiplexerDSP Measurement EngineNext Gen Optical Sensor1000GB Core Technology
© 2007 DRM ASSOCIATES
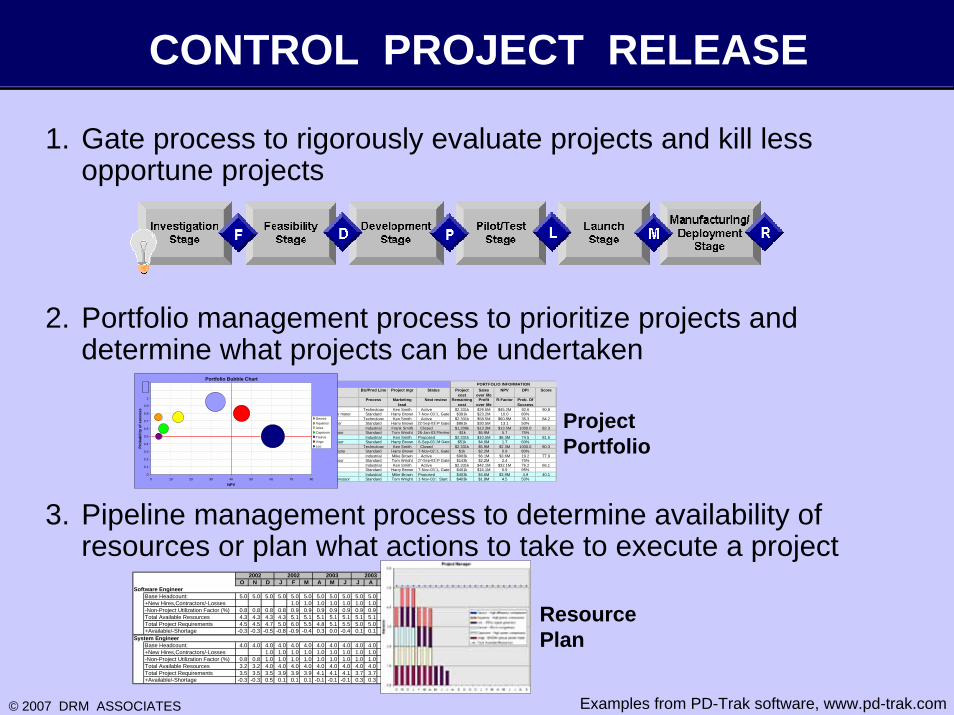
CONTROL PROJECT RELEASE
1. Gate process to rigorously evaluate projects and kill less opportune projects
2. Portfolio management process to prioritize projects and determine what projects can be undertaken
3. Pipeline management process to determine availability of resources or plan what actions to take to execute a project
PROJECT NAME BU/Prod Line Project mgr Projectcost
Salesover life
NPV DPI
Description Process Marketing lead
Remainingcost
Profitover life
R-Factor Prob. Of Success
Virgo Technology Ken Smith Active $2,331k $29.5M $45.2M 92.6 90.8DWDM optical power meter Standard Harry Brown 7-Nov-03 L Gate $391k $23.2M 10.0 80%Leo Technology Ken Smith Active $2,331k $58.5M $60.8M 35.3 84.23GHz signal generator Standard Harry Brown 22-Sep-03 P Gate $861k $30.5M 13.1 50%Aries Industrial Frank Smith Closed $1,209k $13.3M $13.5M 1000.0 82.3High speed compressor Standard Tom Wright 26-Jan-03 Review -$1k $6.9M 5.7 75%Capricorn Industrial Ken Smith Proposed $2,331k $10.5M $6.3M 74.5 81.5High power compressor Standard Harry Brown 6-Sep-03 M Gate $51k $4.0M 1.7 60%Cancer Technology Ken Smith Closed $2,331k $5.9M $2.3M 1000.0 80.38GHz spectrum analyzer Standard Harry Brown 7-Nov-02 L Gate $1k $2.2M 0.9 80%Aquarius Industrial Mike Brown Active $903k $6.1M $3.6M 19.2 77.9High power compressor Standard Tom Wright 27-Sep-03 P Gate $143k $2.2M 2.4 75%Gemini Industrial Ken Smith Active $2,331k $42.1M $32.1M 76.2 66.1Micro compressor Standard Harry Brown 7-Nov-03 L Gate $401k $16.1M 6.9 95%Taurus Industrial Mike Brown Proposed $403k $4.6M $3.9M 4.9 40.1High efficiency compressor Standard Tom Wright 1-Nov-03 Start $403k $1.8M 4.5 50%
MPS baseline date: 10/10/03 PORTFOLIO INFORMATIONStatus
Next review
Score
Proposed/On holdActivePortfolio Bubble Chart
0
0.1
0.2
0.3
0.4
0.5
0.6
0.7
0.8
0.9
1
1.1
1.2
0 10 20 30 40 50 60 70 80
NPV
Prob
abili
ty o
f suc
cess
GeminiAquariusAriesCapricornTaurusVirgoLeo
Project Portfolio
O N D J F M A M J J A SSoftware Engineer
Base Headcount: 5.0 5.0 5.0 5.0 5.0 5.0 5.0 5.0 5.0 5.0 5.0 5.0+New Hires,Contractors/-Losses 1.0 1.0 1.0 1.0 1.0 1.0 1.0 1.0-Non-Project Utilization Factor (%) 0.8 0.8 0.8 0.8 0.9 0.9 0.9 0.9 0.9 0.9 0.9 0.9Total Available Resources 4.3 4.3 4.3 4.3 5.1 5.1 5.1 5.1 5.1 5.1 5.1 5.1Total Project Requirements 4.5 4.5 4.7 5.0 6.0 5.5 4.8 5.1 5.5 5.0 5.0 5.0+Available/-Shortage -0.3 -0.3 -0.5 -0.8 -0.9 -0.4 0.3 0.0 -0.4 0.1 0.1 0.1
System EngineerBase Headcount: 4.0 4.0 4.0 4.0 4.0 4.0 4.0 4.0 4.0 4.0 4.0 4.0+New Hires,Contractors/-Losses 1.0 1.0 1.0 1.0 1.0 1.0 1.0 1.0 1.0 1.0-Non-Project Utilization Factor (%) 0.8 0.8 1.0 1.0 1.0 1.0 1.0 1.0 1.0 1.0 1.0 1.0Total Available Resources 3.2 3.2 4.0 4.0 4.0 4.0 4.0 4.0 4.0 4.0 4.0 4.0Total Project Requirements 3.5 3.5 3.5 3.9 3.9 3.9 4.1 4.1 4.1 3.7 3.7 3.7+Available/-Shortage -0.3 -0.3 0.5 0.1 0.1 0.1 -0.1 -0.1 -0.1 0.3 0.3 0.3
2002 2002 2003 2003
Resource Plan
Examples from PD-Trak software, www.pd-trak.com
© 2007 DRM ASSOCIATES
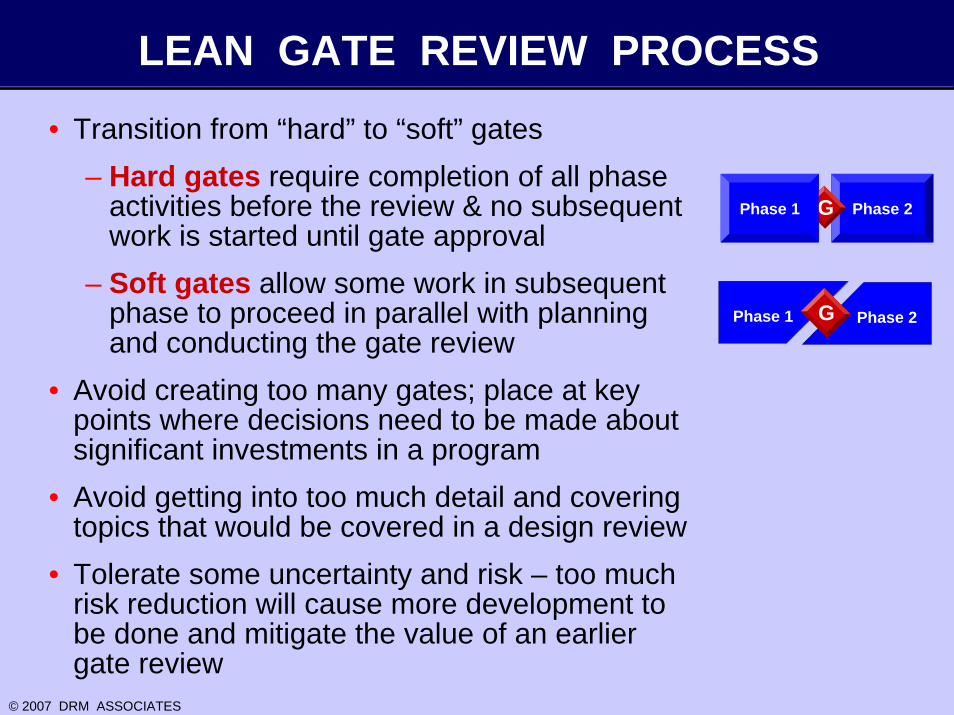
LEAN GATE REVIEW PROCESS• Transition from “hard” to “soft” gates
– Hard gates require completion of all phase activities before the review & no subsequent work is started until gate approval
– Soft gates allow some work in subsequent phase to proceed in parallel with planning and conducting the gate review
• Avoid creating too many gates; place at key points where decisions need to be made about significant investments in a program
• Avoid getting into too much detail and covering topics that would be covered in a design review
• Tolerate some uncertainty and risk – too much risk reduction will cause more development to be done and mitigate the value of an earlier gate review
Phase 2GPhase 1
Phase 1 Phase 2G
© 2007 DRM ASSOCIATES
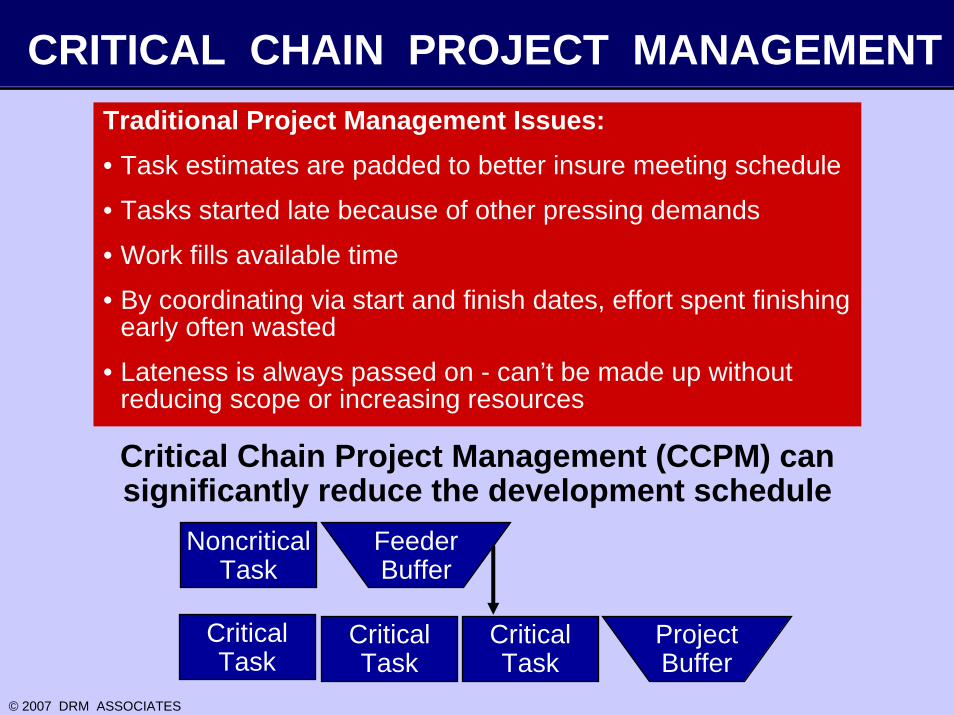
CRITICAL CHAIN PROJECT MANAGEMENTTraditional Project Management Issues:• Task estimates are padded to better insure meeting schedule
• Tasks started late because of other pressing demands
• Work fills available time
• By coordinating via start and finish dates, effort spent finishing early often wasted
• Lateness is always passed on - can’t be made up without reducing scope or increasing resources
Critical Chain Project Management (CCPM) can significantly reduce the development schedule
CriticalTask
CriticalTask
CriticalTask
ProjectBuffer
NoncriticalTask
FeederBuffer
© 2007 DRM ASSOCIATES
REDUCE BATCH SIZESAs resource utilization and batch size
increase, cycle time increases
New Module 1
New Subsystem 1
New Module 2
New Module 5
New Module 3 Design Integration
New Subsystem 2
New Subsys. 3
New Subsystem 4
New Module 4Existing
Modules & Subsystems
Project 1
New Module 3
New Module 5 Design Integration
Existing Platforms (Modules & Subsystems)
Project 1
New Module 1
New Module 2
New Subsystem 2
Platform Project 2
New Technology
Technology Proj 1New Qualified Material
Matl Qual Proj 3
New Module 4 New Subsys. 3
Platform Project 4
© 2007 DRM ASSOCIATES
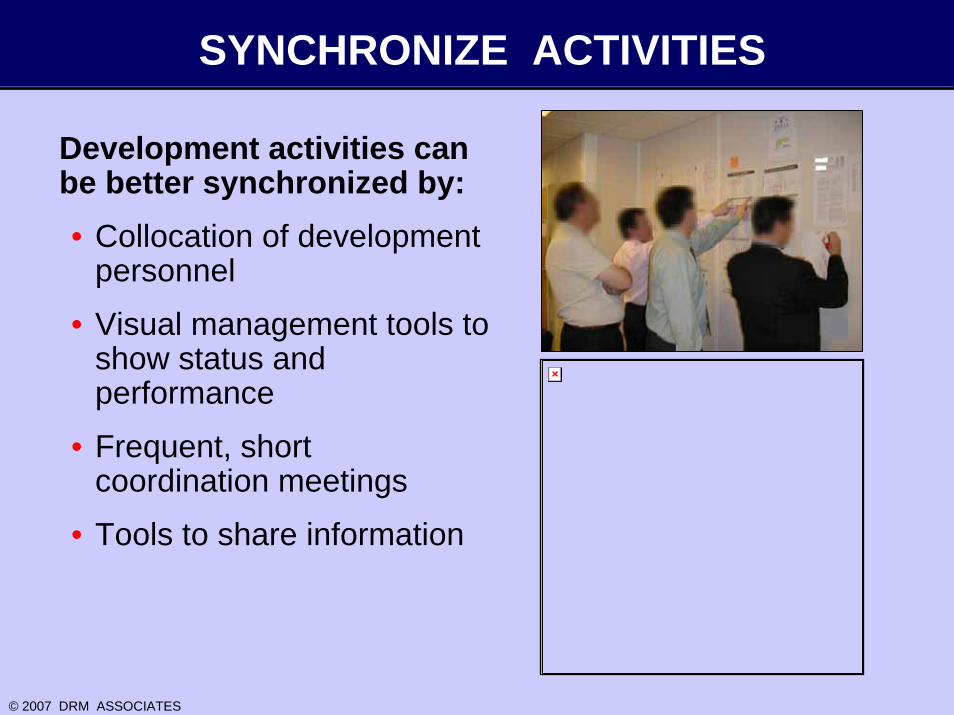
SYNCHRONIZE ACTIVITIES
Development activities can be better synchronized by:• Collocation of development
personnel
• Visual management tools to show status and performance
• Frequent, short coordination meetings
• Tools to share information
© 2007 DRM ASSOCIATES
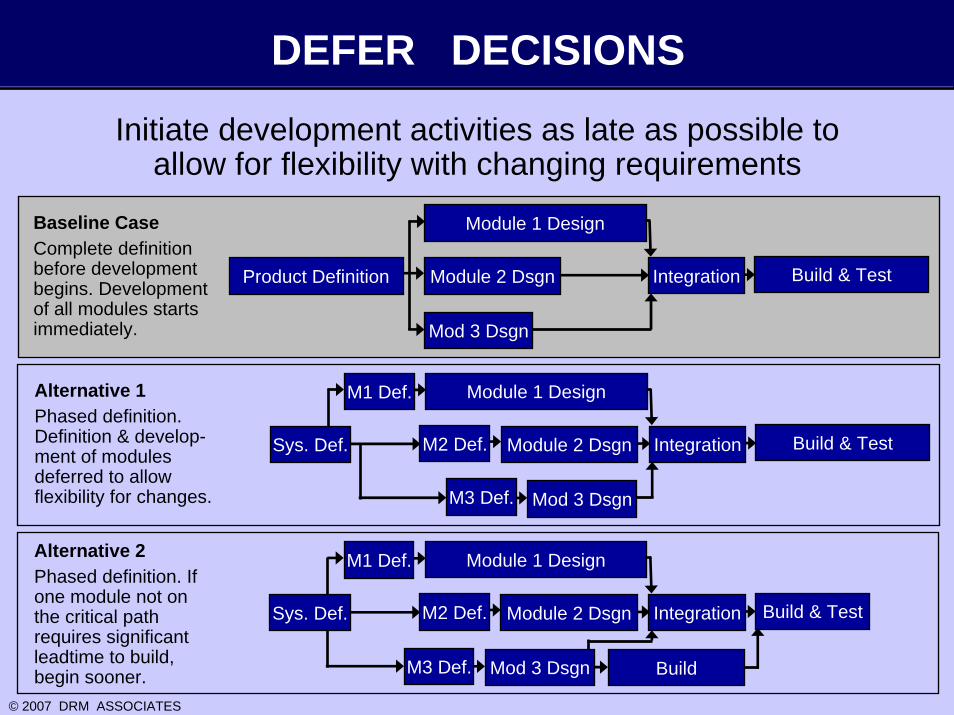
DEFER DECISIONS
Initiate development activities as late as possible to allow for flexibility with changing requirements
Product Definition
Module 1 Design
Module 2 Dsgn Integration
Mod 3 Dsgn
Build & Test
Baseline CaseComplete definition before development begins. Development of all modules starts immediately.
Module 1 Design
Integration Build & TestModule 2 Dsgn
Mod 3 Dsgn
M1 Def.
M2 Def.Sys. Def.
M3 Def.
Alternative 1Phased definition. Definition & develop-ment of modules deferred to allow flexibility for changes.
Alternative 2Phased definition. If one module not on the critical path requires significant leadtime to build, begin sooner.
Module 1 Design
Integration Build & TestModule 2 Dsgn
M1 Def.
M2 Def.
M3 Def. Mod 3 Dsgn
Sys. Def.
Build
© 2007 DRM ASSOCIATES
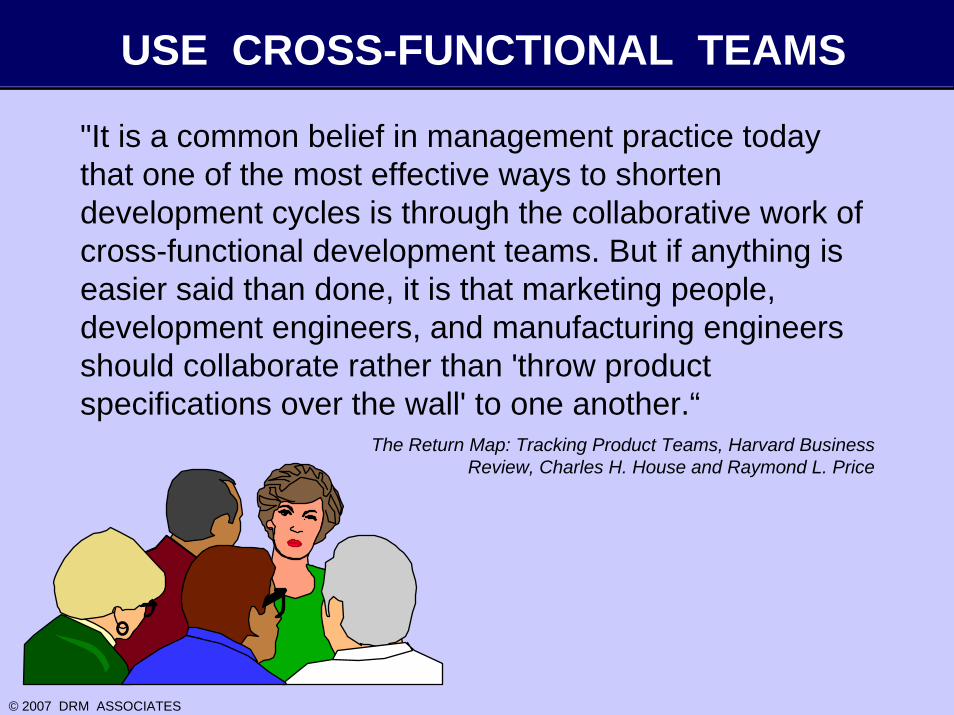
USE CROSS-FUNCTIONAL TEAMS
"It is a common belief in management practice today that one of the most effective ways to shorten development cycles is through the collaborative work of cross-functional development teams. But if anything is easier said than done, it is that marketing people, development engineers, and manufacturing engineers should collaborate rather than 'throw product specifications over the wall' to one another.“
The Return Map: Tracking Product Teams, Harvard Business Review, Charles H. House and Raymond L. Price
© 2007 DRM ASSOCIATES
EMPOWER THE TEAM
EMPOWER (def.) give power or authority to; to authorize; to enable; to delegate
• Functional managers empower team members to represent functional discipline without approval for decisions or actions
• Self directed teams - describe what is required; let teams determine how
• Requires more management planning & capable, trained personnel
• Results in greater commitment and ownership
© 2007 DRM ASSOCIATES
PROVIDE THE RIGHT RESOURCES
• Right skills and experience
• Right level of resources
• Resources available when needed
© 2007 DRM ASSOCIATES
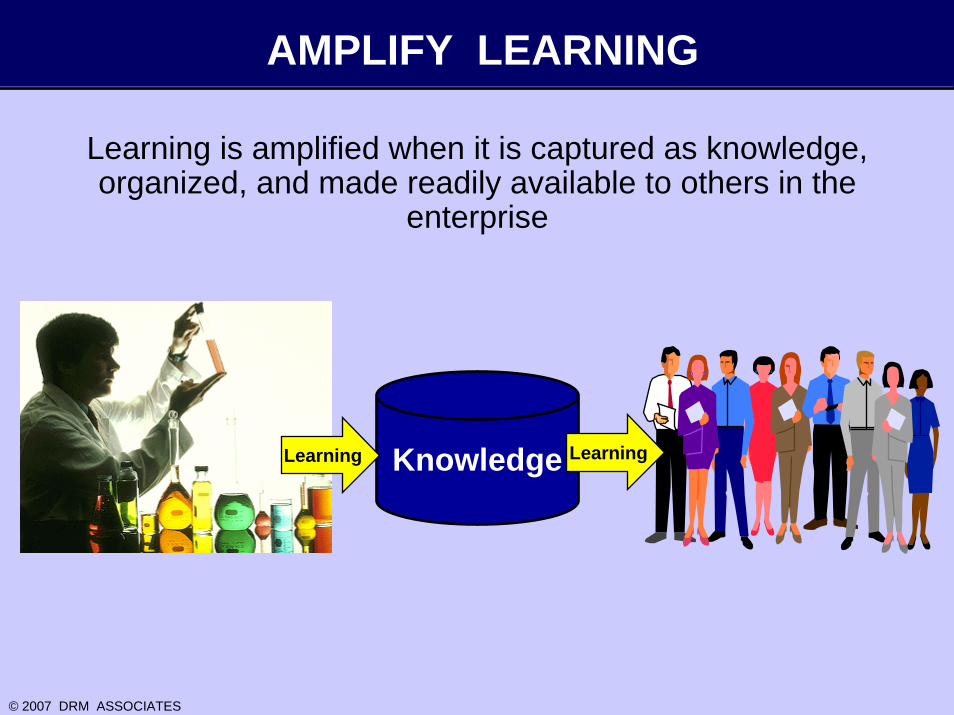
AMPLIFY LEARNING
Learning is amplified when it is captured as knowledge, organized, and made readily available to others in the
enterprise
KnowledgeLearning Learning
© 2007 DRM ASSOCIATES
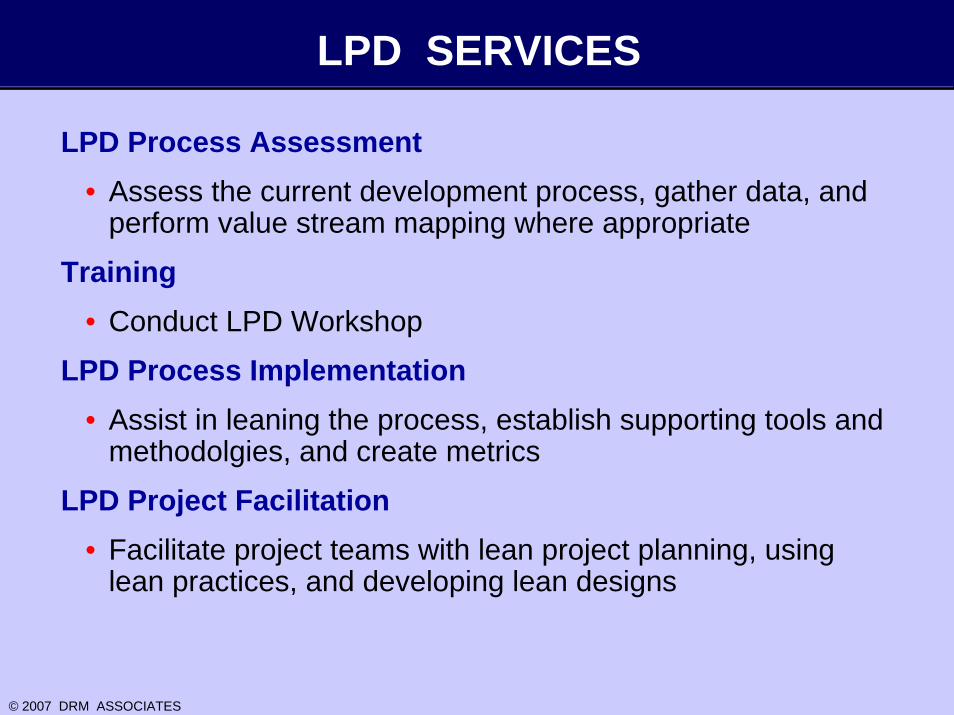
LPD SERVICES
LPD Process Assessment• Assess the current development process, gather data, and
perform value stream mapping where appropriate
Training• Conduct LPD Workshop
LPD Process Implementation• Assist in leaning the process, establish supporting tools and
methodolgies, and create metrics
LPD Project Facilitation• Facilitate project teams with lean project planning, using
lean practices, and developing lean designs
© 2007 DRM ASSOCIATES
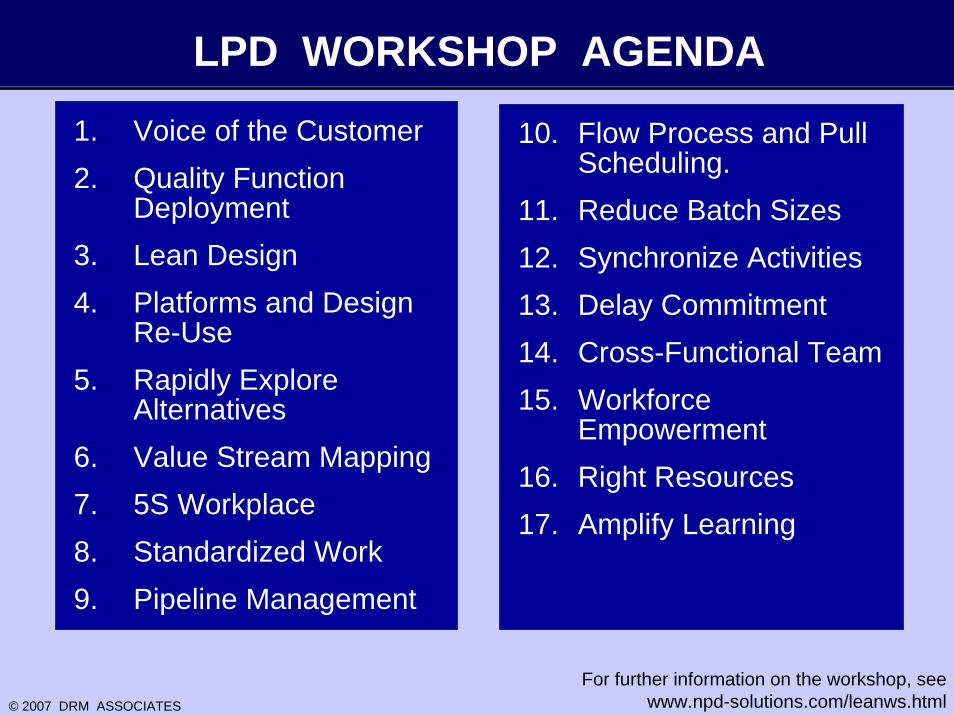
LPD WORKSHOP AGENDA
1. Voice of the Customer2. Quality Function
Deployment3. Lean Design4. Platforms and Design
Re-Use 5. Rapidly Explore
Alternatives6. Value Stream Mapping7. 5S Workplace8. Standardized Work9. Pipeline Management
10. Flow Process and Pull Scheduling.
11. Reduce Batch Sizes12. Synchronize Activities13. Delay Commitment14. Cross-Functional Team15. Workforce
Empowerment16. Right Resources17. Amplify Learning
For further information on the workshop, see www.npd-solutions.com/leanws.html
© 2007 DRM ASSOCIATES
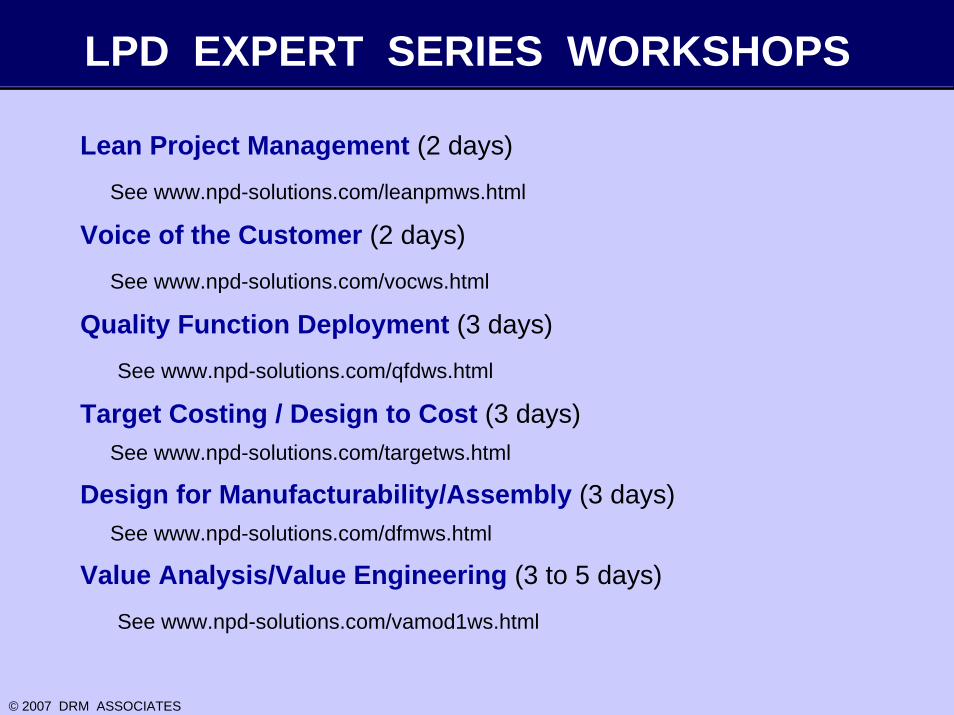
LPD EXPERT SERIES WORKSHOPS
Lean Project Management (2 days)
See www.npd-solutions.com/leanpmws.html
Voice of the Customer (2 days)
See www.npd-solutions.com/vocws.html
Quality Function Deployment (3 days)
See www.npd-solutions.com/qfdws.html
Target Costing / Design to Cost (3 days)See www.npd-solutions.com/targetws.html
Design for Manufacturability/Assembly (3 days)See www.npd-solutions.com/dfmws.html
Value Analysis/Value Engineering (3 to 5 days)
See www.npd-solutions.com/vamod1ws.html
© 2007 DRM ASSOCIATES
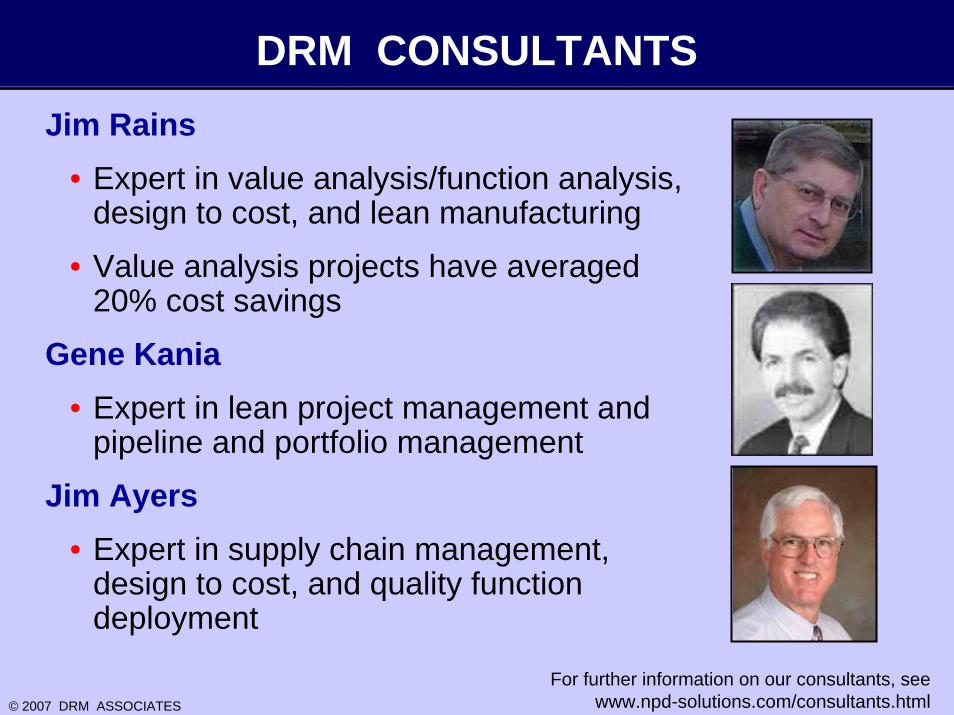
DRM CONSULTANTSJim Rains
• Expert in value analysis/function analysis, design to cost, and lean manufacturing
• Value analysis projects have averaged 20% cost savings
Gene Kania• Expert in lean project management and
pipeline and portfolio management
Jim Ayers• Expert in supply chain management,
design to cost, and quality function deployment
For further information on our consultants, see www.npd-solutions.com/consultants.html
Related Documents