Geophys. J. Int. (2010) doi: 10.1111/j.1365-246X.2010.04516.x GJI Seismology Love-wave group velocity maps of Turkey and surrounding regions M. Didem Cambaz and Hayrullah Karabulut Bogazici University, Kandilli Observatory and Earthquake Research Institute, 36684, Cengelkoy Istanbul, Turkey. E-mail: [email protected] Accepted 2010 January 8. Received 2009 December 23; in original form 2009 February 15 SUMMARY We present the analysis of a Love-wave dispersion study performed across Turkey and the surroundings. Group velocity dispersion curves were obtained from the local and regional earthquakes recorded at both permanent and temporary stations operated in the region. Love- wave group velocity maps in the period range of 10–50 s were computed using a tomographic inversion method. The study shows the existence of significantly different crustal types in the area. The group velocity anomalies are associated with the major geological structures in the region. Low group velocities at shorter periods (10–20 s) are observed in the local sedimentary basins, the eastern Mediterranean and the Black Sea. The eastern Anatolia region is also characterized by low group velocities while Pontides and Bitlis–P¨ ot¨ urge massif display higher group velocities. The central Anatolia exhibits uniform velocity distribution indicating more homogenous crust. The Isparta angle is marked by a wedge-shaped low group velocity anomaly. The low velocities observed in the Isparta angle are related to crustal thickening and subduction-related complex. High velocities observed on the maps are associated with metamorphics, magmatic arcs along the orogenic belts of Pontides, P¨ ot¨ urge massif and crustal thinning in the Aegean region. At larger periods (40–50 s) the Anatolian block shows low and uniform group velocity distribution while its surroundings display higher group velocities with the exception of the eastern Mediterranean region. Key words: Composition of the continental crust; Surface waves and free oscillations; Seismic tomography. 1 INTRODUCTION Surface wave tomography has proven to be very useful in de- termining the structure of the crust and uppermost mantle on both regional and global scale (Dziewonski 1971; Woodhouse & Dziewonski 1984; Trampert & Woodhouse 1995; van Heijst & Woodhouse 1999). Their large amplitudes with relatively low atten- uation and long propagation paths have provided significant con- tribution to our knowledge of the Earth’s upper-mantle and crustal structure. One-dimensional earth models have been routinely ob- tained along great circle paths using the dispersive nature of surface waves (Oliver 1962; Knopoff 1972) while long-period surface waves have been the main source of the observation for determining the tomographic image of the mantle. During the last decade with the availability of high-quality digital broad-band seismic data we have seen a rapid progress in imaging the structure of crust and upper mantle with increasing resolu- tions. Studies at local and regional scales are now common for regions with a good coverage of stations and earthquakes. Phase- and group-velocity distributions obtained from dispersive surface waves correlate well with the main tectonic belts and geological units providing better constrains on their geometry and relation to the regional tectonics (Levshin et al. 1992, 1994; Ritzwoller et al. 2002; Pasyanos 2005). Turkey and the surrounding areas have been the target of many geophysical studies due to its active tectonics and high seismicity rate. Continuous regional deformation along the seismically active boundaries contains diverse structures such as suture zones, meta- morphic core complexes and young orogens (Stampfli 2000 and ref- erences therein). Significant variations exist on the tectonic styles and crustal structures. Until recently, investigations on the crustal thickness and seismic velocities used sparse distribution of seismic stations in the region (e.g. Mindevalli & Mitchell 1989; Saunders et al. 1998; Maggi & Priestly 2005). Temporary experiments along with the existing data from the permanent seismic stations pro- vided more details on the lithospheric structure and composition (e.g. Al-Lazki et al. 2003; G¨ ok et al. 2003; Sandvol et al. 2003; Zor et al. 2003; Zhu et al. 2006). Some other works have also been performed in the region at greater scales to estimate group- and phase-velocity variations (e.g. Curtis et al. 1998; Ritzwoller & Levshin 1998; Pasyanos et al. 2001; Karagianni et al. 2002, 2005; Pasyanos 2005; Sodoudi et al. 2006; DiLuccio & Pasyanos 2007; G¨ ok et al. 2007). In this study, we obtained Love-wave group velocity maps for 10–50 s periods using local and regional earthquakes. We used avail- able data from the broad-band stations operated between 1997 and 2009 in Turkey and the surrounding regions. We analysed 285 earth- quakes with magnitudes greater than 4.5. Fundamental mode group C 2010 The Authors 1 Journal compilation C 2010 RAS Geophysical Journal International

Welcome message from author
This document is posted to help you gain knowledge. Please leave a comment to let me know what you think about it! Share it to your friends and learn new things together.
Transcript
Geophys. J. Int. (2010) doi: 10.1111/j.1365-246X.2010.04516.x
GJI
Sei
smol
ogy
Love-wave group velocity maps of Turkey and surrounding regions
M. Didem Cambaz and Hayrullah KarabulutBogazici University, Kandilli Observatory and Earthquake Research Institute, 36684, Cengelkoy Istanbul, Turkey. E-mail: [email protected]
Accepted 2010 January 8. Received 2009 December 23; in original form 2009 February 15
S U M M A R YWe present the analysis of a Love-wave dispersion study performed across Turkey and thesurroundings. Group velocity dispersion curves were obtained from the local and regionalearthquakes recorded at both permanent and temporary stations operated in the region. Love-wave group velocity maps in the period range of 10–50 s were computed using a tomographicinversion method. The study shows the existence of significantly different crustal types inthe area. The group velocity anomalies are associated with the major geological structuresin the region. Low group velocities at shorter periods (10–20 s) are observed in the localsedimentary basins, the eastern Mediterranean and the Black Sea. The eastern Anatolia regionis also characterized by low group velocities while Pontides and Bitlis–Poturge massif displayhigher group velocities. The central Anatolia exhibits uniform velocity distribution indicatingmore homogenous crust. The Isparta angle is marked by a wedge-shaped low group velocityanomaly. The low velocities observed in the Isparta angle are related to crustal thickeningand subduction-related complex. High velocities observed on the maps are associated withmetamorphics, magmatic arcs along the orogenic belts of Pontides, Poturge massif and crustalthinning in the Aegean region. At larger periods (40–50 s) the Anatolian block shows lowand uniform group velocity distribution while its surroundings display higher group velocitieswith the exception of the eastern Mediterranean region.
Key words: Composition of the continental crust; Surface waves and free oscillations;Seismic tomography.
1 I N T RO D U C T I O N
Surface wave tomography has proven to be very useful in de-termining the structure of the crust and uppermost mantle onboth regional and global scale (Dziewonski 1971; Woodhouse &Dziewonski 1984; Trampert & Woodhouse 1995; van Heijst &Woodhouse 1999). Their large amplitudes with relatively low atten-uation and long propagation paths have provided significant con-tribution to our knowledge of the Earth’s upper-mantle and crustalstructure. One-dimensional earth models have been routinely ob-tained along great circle paths using the dispersive nature of surfacewaves (Oliver 1962; Knopoff 1972) while long-period surface waveshave been the main source of the observation for determining thetomographic image of the mantle.
During the last decade with the availability of high-quality digitalbroad-band seismic data we have seen a rapid progress in imagingthe structure of crust and upper mantle with increasing resolu-tions. Studies at local and regional scales are now common forregions with a good coverage of stations and earthquakes. Phase-and group-velocity distributions obtained from dispersive surfacewaves correlate well with the main tectonic belts and geologicalunits providing better constrains on their geometry and relation tothe regional tectonics (Levshin et al. 1992, 1994; Ritzwoller et al.2002; Pasyanos 2005).
Turkey and the surrounding areas have been the target of manygeophysical studies due to its active tectonics and high seismicityrate. Continuous regional deformation along the seismically activeboundaries contains diverse structures such as suture zones, meta-morphic core complexes and young orogens (Stampfli 2000 and ref-erences therein). Significant variations exist on the tectonic stylesand crustal structures. Until recently, investigations on the crustalthickness and seismic velocities used sparse distribution of seismicstations in the region (e.g. Mindevalli & Mitchell 1989; Saunderset al. 1998; Maggi & Priestly 2005). Temporary experiments alongwith the existing data from the permanent seismic stations pro-vided more details on the lithospheric structure and composition(e.g. Al-Lazki et al. 2003; Gok et al. 2003; Sandvol et al. 2003;Zor et al. 2003; Zhu et al. 2006). Some other works have alsobeen performed in the region at greater scales to estimate group-and phase-velocity variations (e.g. Curtis et al. 1998; Ritzwoller &Levshin 1998; Pasyanos et al. 2001; Karagianni et al. 2002, 2005;Pasyanos 2005; Sodoudi et al. 2006; DiLuccio & Pasyanos 2007;Gok et al. 2007).
In this study, we obtained Love-wave group velocity maps for10–50 s periods using local and regional earthquakes. We used avail-able data from the broad-band stations operated between 1997 and2009 in Turkey and the surrounding regions. We analysed 285 earth-quakes with magnitudes greater than 4.5. Fundamental mode group
C© 2010 The Authors 1Journal compilation C© 2010 RAS
Geophysical Journal International
2 M. D. Cambaz and H. Karabulut
velocities of Love and Rayleigh waves at more than 270 broad-bandstations along 13 171 paths were computed using Multiple-filteranalysis (MFA; Dziewonski et al. 1969; Pedersen et al. 2003). Ap-proximately 25 per cent of the paths for Love waves provided reliablegroup velocity measurements. The group velocity maps were inter-preted in relation to the geological and tectonic observations in theregion.
2 T E C T O N I C S A N D G E O L O G Y
Turkey is an east–west trending segment of the Alpine–Himalayanorogenic belt and located on the boundary between Gondwana in thesouth and Laurasia in the north. Within this belt different continentaland oceanic assemblages related to the opening and closure of thePaleozoic and Mesozoic oceanic basins can be found. These basinsare collectively named the Tethys Ocean (Goncuoglu et al. 1997).Although the geometry and evolution of the Tethys Ocean is still indebate, there is a consensus regarding the presence of Paleotethyson the north and Neotethys on the south both rifted from the Gond-wana margin (Stampfli 2000). The present tectonic regime of Turkeyfollows closure and the destruction of the Neo-Tethyan oceans(Fig. 1).
The northern Neotethys is located between the Sakarya continentin the north and the Anatolian–Tauride Platform in the south. Thesouthern Neotethys, which separated Arabian Platform in the southfrom Anatolide–Tauride Platform in the north, is located along theSoutheast Anatolian Suture. Two major E–W trending ophiolitebelts indicate the closure and destruction of Neotethys (Stampfli2000).
Various continental blocks that make up present-day tectonics ofTurkey are mainly divided into six major lithospheric fragments;the Strandja, the Istanbul (IZ) and the Sakarya zones (SZ), theAntolide–Tauride Block (A–T), the Kirsehir Massif (KM) and theArabian Platform (Sengor & Yılmaz 1981; Sengor et al. 1982; Okay1989; Okay et al. 1994).
The Strandja, Istanbul and Sakarya zones show similar geolog-ical patterns with Laurasia and are referred as the Pontides. TheIzmir–Ankara–Erzincan suture separates these units with the KMand the A–T block which show similar Paleozoic stratigraphy withthe Arabian Platform as well as northern margin of Gondwana(Okay & Tuysuz 1999).
The IZ is characterized by a thick Ordovician to Carbonifer-ous sedimentary sequence, which rests unconformably on a Pre-cambrian metamorphic basement. It is bordered by the Strandjamassif in the west, separated along the Intra-Pontide suture fromthe SZ in the south. The east–west oriented Intra-Pontide suture,marked by slivers of serpentinite, blueschist, basic volcanic rocksand pelagic limestone is the remnant of the Mesozoic Intra-Pontideocean (Sengor & Yılmaz 1981).
The A–T block forms the main part of the southern Turkey. Thisunit has a Paleozoic stratigraphy similar to the Arabian platform andGondwana. There is a massive ophiolite and accretionary complexaccumulation over this block. The A–T block can be describedin three regional metamorphic complexes: the Tavsanlı zone, theAfyon zone and the Menderes Massif. The Bornova Flysch Zonein this block exists between the Izmir–Ankara–Erzincan suture andthe Menderes Massif (Okay & Tuysuz 1999).
The central Anatolia displays a transitional character betweenthe extensional tectonic regime of the western Anatolia and the
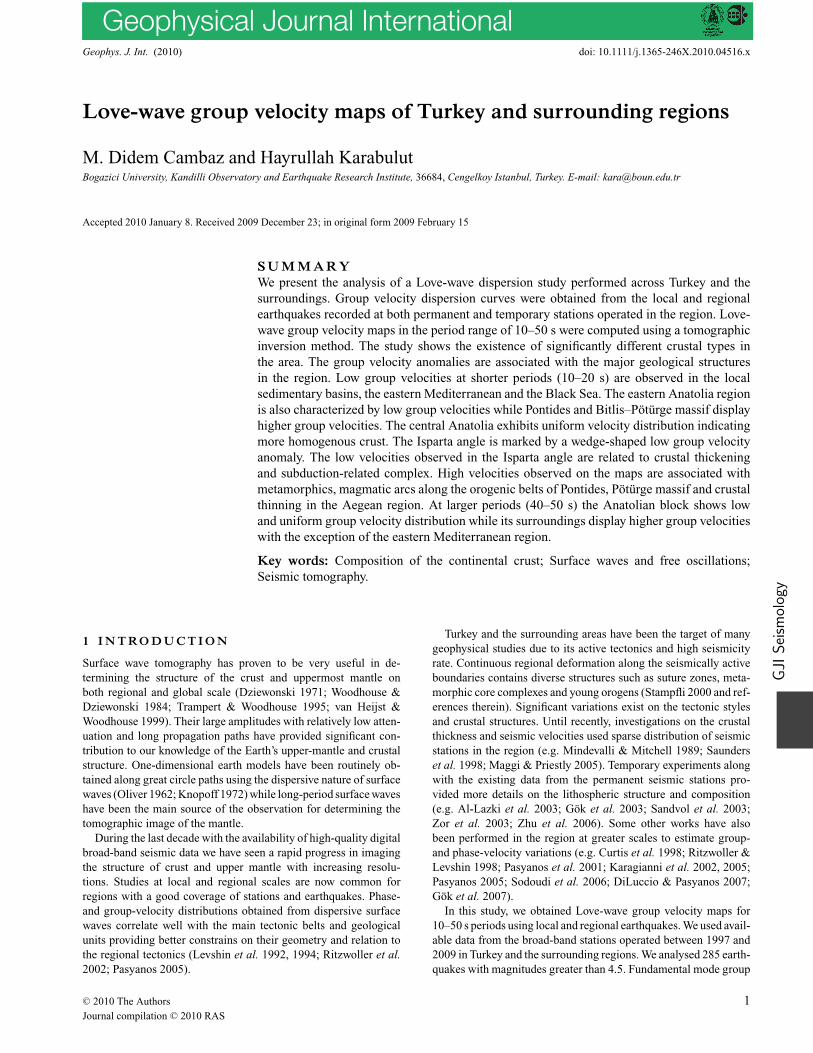
Figure 1. Tectonic setting of Turkey and surrounding areas; Abbreviations: AH, Andrusov High; AxB, Axion Basin; A–T, Anatolid–Tauride Block; BM, BitlisMassif; BZM, Bitlis–Zagros Suture; CAB, Ceyhan–Adana Basin; EBsB, Eastern Black Sea Basin; EAAC, East Anatolian Accretionary Complex; IA, IspartaAngle; IZ, Istanbul Zone; KM, Kırsehir Massif; LN, Lycian Nappes; Ms, Marmara Sea; MM, Menderes Massif; NAT, North Anatolian Through; PT, Pontides;RS, Rhodope–Strandja Zone; SBB, Sinop–Boyabat Basin; SZ, Sakarya Zone; ThB, Thrace Basin; WBsB, Western Black Sea Basin; Green units represent theophiolites. Bathymetry of the region derived from ETOPO5. Purple volcano signs show Neogene and quaternary volcanism. Red triangles show the suturesand earlier subduction zones. (Modified from Stampfli, http://www-sst.unil.ch/research/plate tecto /present_day.htm; Okay & Tuysuz 1999; Robertson 2000;Tatar et al. 2000).
C© 2010 The Authors, GJI
Journal compilation C© 2010 RAS
Love-wave group velocity maps 3
strike-slip tectonic regime of the eastern Anatolia. Most of the geo-logical structures of the central Anatolia and the Taurides, includingIsparta angle (IA), have been sourced from the tectonic and mag-matic events related to the active convergent plate boundary, north-dipping Hellenic–Cyprus subduction zone (Glover & Robertson1998).
In the central Anatolia, the KM consists of metamorphic andvoluminous granitic rocks. These metamorphic rocks from Cre-taceous age constitute a coherent metasedimentary sequence ofgranulite, gneiss, micashist, metaquarzite, marble and calc-silicaterocks. They are folded and multiply deformed (Seymen 1984; Okay& Tuysuz 1999). The accretionary complex and the metamorphicrocks, which are intruded by granitic rocks, cover large areas in theKM. The most prominent geological feature of the region is thewidespread volcanism. The origin of the volcanism is considered tobe arc related from the north-dipping oceanic slab of African Plate(Innocenti et al. 1982). However, more recent works also suggestthat it can be related to regional extension (Toprak & Goncuoglu1993).
The Arabian Platform consists of marine, sedimentary succes-sion accumulated from early Cambrian to middle Miocene time.Along the suture zone the ophiolits of the Arabian platform formsa giant nappe accumulation (Yılmaz 1993). The Bitlis Massif (BM)forming an E–W trending mountain range in southeast Anatoliais a metamorphic complex. Two tectonic units; an old, high-grademetamorphic core and a metamorphic cover representing a plat-form sequence constitute this massif (Yılmaz 1993). BM and itsophiolitic cover are fragmented by the rifting of the Maden Basin(MB). For this reason, the various ophiolit fragments were trans-ported into the basin. Widespread volcanic activity accompaniedthe sedimentation in this region (Yılmaz 1993).
The Black Sea is composed of two deep basins (Fig. 2); the west-ern Black Sea basin, which is underlain by oceanic to suboceanic
crust, contains a sedimentary cover of up to 19 km thick. The easternBlack Sea basin, which is underlain by thinned continental crust,has 12 km thickness of sediments (Nikishin et al. 2003). Thesebasins are separated by the Andrusov Ridge that is formed fromcontinental crust and overlain by 5–6 km thickness of sedimentarycover (Robinson 1997).
3 DATA
A waveform database for the surface wave investigations wasformed from the permanent and temporary digital broad-band sta-tions in the region between 1997 and 2009 (Fig. 3). The main sourceof the data is the National Network of Turkey operated by KandilliObservatory and Earthquake Research Institute. The network hasbeen continuously upgraded since 2004 and the number of broad-band stations has exceeded 100 in 2008. The majority of the sta-tions record at periods 100 s or higher. However, approximately10 per cent of the instruments have lower recording range(<40 s). Supplementary data from IRIS and ORFEUS depositorywere obtained for the permanent stations in the region.
Data from several portable deployments were also included in thestudy. A temporary network with 29 broad-band stations operatedbetween 1999 and 2001 during the Eastern Turkey Seismic Experi-ment (Sandvol et al. 2003). Data from local networks, which havebeen operating in the various regions of Turkey, also contributed tothe database. As a result, the total number of stations exceeds 270and distributed non-uniformly throughout the region. The stationcoverage is dense in the Marmara region and the eastern Anatoliawhile the central Anatolia, Black Sea and Eastern Mediterraneanregions are poorly sampled.
We selected 285 earthquakes that occurred between 1997 and2009 with magnitudes greater than 4.5 and depths less than 30 km(Fig. 3). The event distribution is also non-uniform. The majority
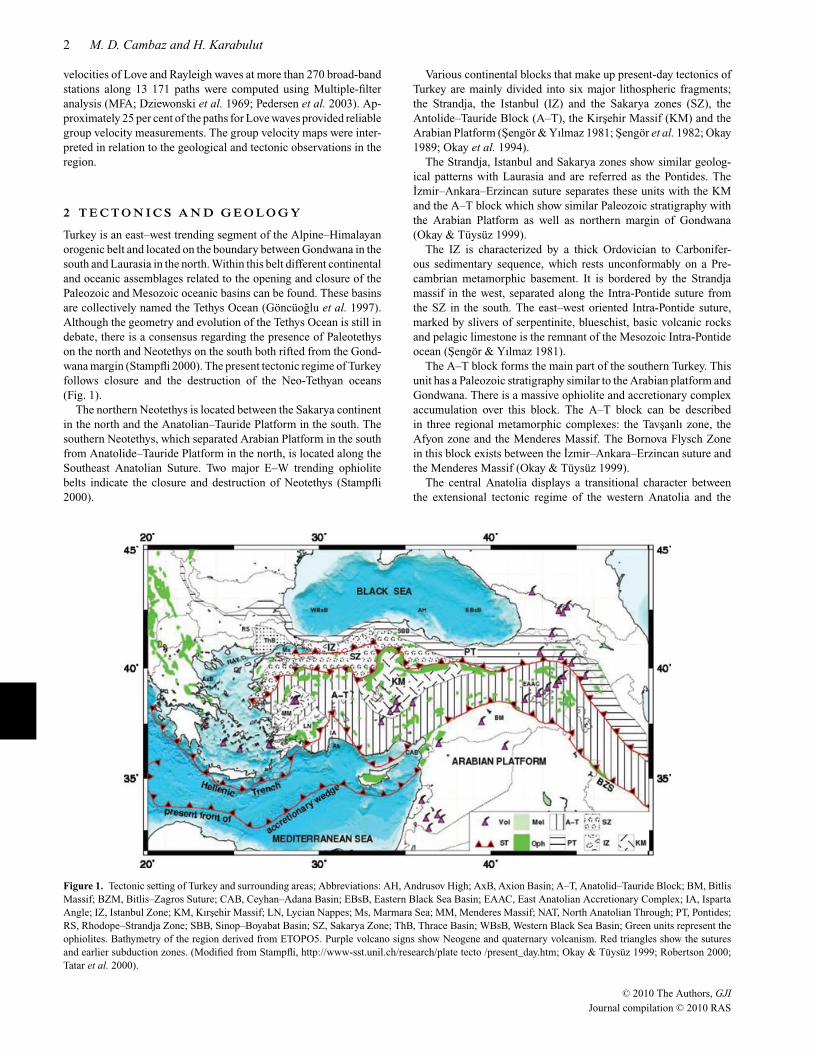
Figure 2. Topography, major fault lines and crustal thickness of Turkey and surrounding areas (Mooney et al. 1998); Abbreviations: EAF, East AnatolianFault; MoP, Moesian Platform; NAF, North Anatolian Fault; TgB, Tuz Golu Basin; Sb, Saros Bay. The red star shows the location of an aftershock of November12 Duzce earthquake (Mw = 5.0). The red triangles indicate the locations of the broad-band stations used for the construction dispersion curves in Fig. 12from the group velocity maps. Bathymetry and Topography of the region derived from ETOPO5 and GTOPO30.
C© 2010 The Authors, GJI
Journal compilation C© 2010 RAS
4 M. D. Cambaz and H. Karabulut
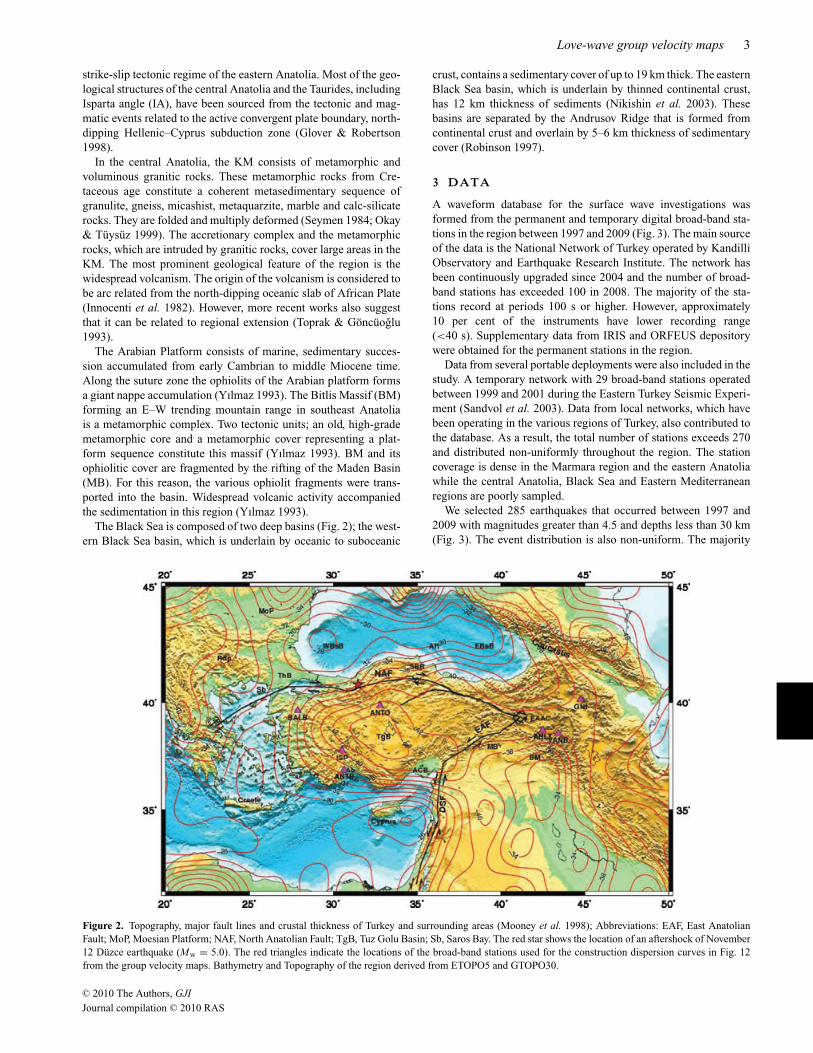
Figure 3. Distribution of earthquakes (circles) and seismic stations (triangles). The different colours indicate the stations from various networks (dark blue:KOERI; light green: NOA; dark green: THE; light blue: ETSE; magenta: GEOPHONE depository). The earthquakes with magnitudes greater 4.5 and occurredbetween 1997 and 2009 are selected.
of the earthquakes are located along the active seismic zones, NorthAnatolian Fault (NAF), East Anatolian Fault (EAF) and Aegeansubduction zone. Fewer earthquakes were included from Caucasesand Iran. The earthquakes along NAF and EAF have mostly strike-slip mechanisms while the majority of the events from the westernAnatolia and Aegean have normal and strike-slip mechanisms. Therange of the recording distances used for the surface wave analysiswas between 600 and 2200 km.
4 S U R FA C E WAV E D I S P E R S I O NM E A S U R E M E N T S
The surface wave dispersion curves were computed in several steps.The first step involved visual check of the waveform data to insurereasonable signal-to-noise ratios and eliminate problematic record-ings. Radial and transverse components were computed by rotatingNS and EW components into backazimuth directions. We obtainedLove waves from transverse components and Rayleigh waves fromvertical components. The instrument responses were removed fromthe selected waveforms and the waveforms were decimated to 5 sam-ples per second.
We employed both MFA (Dziewonski et al. 1969; Herrmann2002) and reassigned multiple-filter analysis (RMFA; Pedersen et al.2003) to estimate the surface wave group velocities. RMFA is animproved interpretation of MFA. Rather than attributing the en-ergy to the centre of the applied frequency and time windows,it is attributed to a location within the window that correspondsto the centre of gravity. Objective of the method is to improvethe precision of group velocity measurements with energy reas-signment in time-frequency domain (Pedersen et al. 2003). RMFA
provides better-constrained dispersion curves than classical MFAthat shows smeared image of group velocities especially at higherperiods.
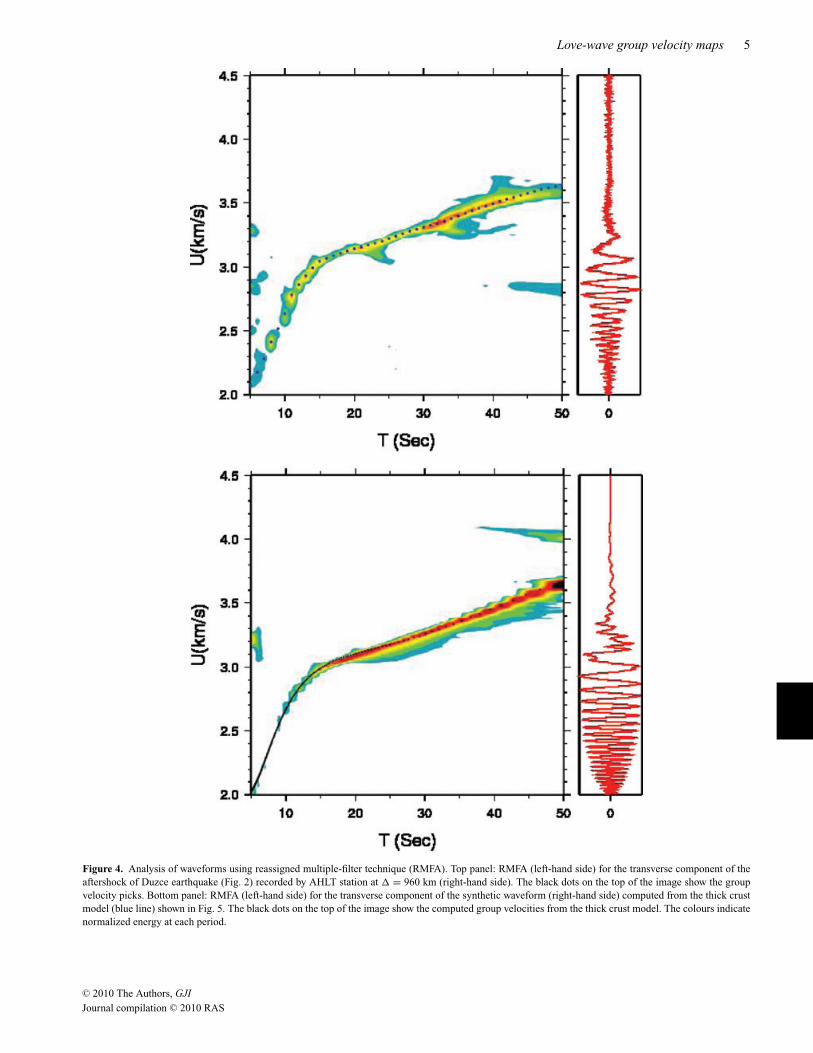
To test the accuracy of group velocity estimates we used bothsynthetic and recorded waveforms. Fig. 4(a) shows RMFA and thegroup velocity curve of the recording at AHLT station from anaftershock (Mw = 5.0) of 1999 November 12 Duzce (Mw = 7.2)earthquake (Fig. 2). Fig. 4(b) shows RMFA of a synthetic waveformfor a crustal model obtained by a simple grid search based on thedispersion curve in Fig. 4(a). We used discrete wavenumber summa-tion method (Herrmann 2002) to compute the synthetic waveform.The dispersion curve computed from the same model is also shownin Fig. 4(b) (Herrmann 2002). The computed group velocities usingRMFA is in good agreement with the dispersion curve calculatedfrom the crustal model (see Fig. S1).
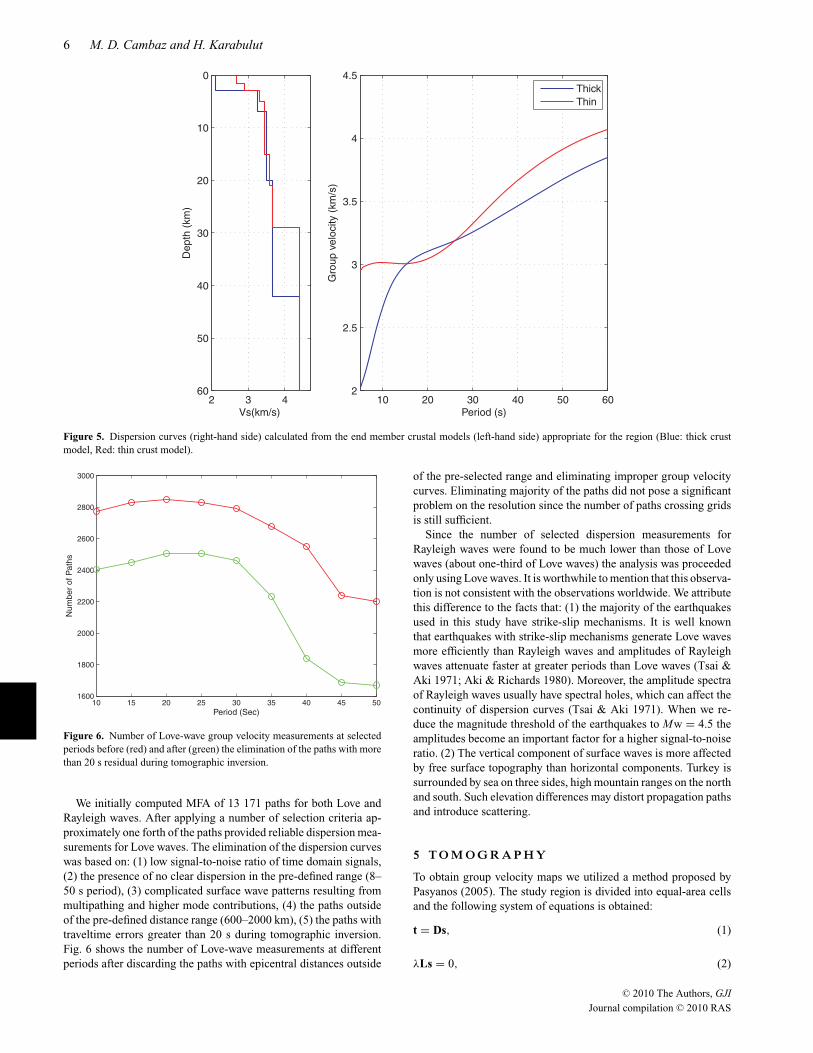
We interactively picked group velocities from both MFA andRMFA. MFA provided better continuity at lower periods whileRMFA provided increased resolution at greater periods. Two dis-persion curves calculated from the two crustal models were usedto guide the picks (Fig. 5). The first earth model with thick crustwas determined from a simple grid search as explained above whilethe second earth model corresponding thin crust was obtained fromAkyol et al. (2006) assuming a Vp/Vs ratio of 1.75. Using thegroup velocity picks we applied velocity filtering to the waveforms(Herrmann 2002) and recalculated RMFA of the velocity-filteredwaveforms. Group velocity picks were revised and improved. As-suming that the wave follows the great circle arc between the sourceand the receiver, the group velocity for a given period was estimatedby dividing the epicentral distance by the group arrival time. Stan-dard deviations of group velocities were estimated from 95 per centof group velocities.
C© 2010 The Authors, GJI
Journal compilation C© 2010 RAS
Love-wave group velocity maps 5
Figure 4. Analysis of waveforms using reassigned multiple-filter technique (RMFA). Top panel: RMFA (left-hand side) for the transverse component of theaftershock of Duzce earthquake (Fig. 2) recorded by AHLT station at � = 960 km (right-hand side). The black dots on the top of the image show the groupvelocity picks. Bottom panel: RMFA (left-hand side) for the transverse component of the synthetic waveform (right-hand side) computed from the thick crustmodel (blue line) shown in Fig. 5. The black dots on the top of the image show the computed group velocities from the thick crust model. The colours indicatenormalized energy at each period.
C© 2010 The Authors, GJI
Journal compilation C© 2010 RAS
6 M. D. Cambaz and H. Karabulut
10 20 30 40 50 602
2.5
3
3.5
4
4.5
Period (s)
Gro
up v
elo
city (
km
/s)
Thick
Thin
2 3 4
0
10
20
30
40
50
60
Depth
(km
)
Vs(km/s)
Figure 5. Dispersion curves (right-hand side) calculated from the end member crustal models (left-hand side) appropriate for the region (Blue: thick crustmodel, Red: thin crust model).
10 15 20 25 30 35 40 45 501600
1800
2000
2200
2400
2600
2800
3000
Period (Sec)
Num
ber
of P
ath
s
Figure 6. Number of Love-wave group velocity measurements at selectedperiods before (red) and after (green) the elimination of the paths with morethan 20 s residual during tomographic inversion.
We initially computed MFA of 13 171 paths for both Love andRayleigh waves. After applying a number of selection criteria ap-proximately one forth of the paths provided reliable dispersion mea-surements for Love waves. The elimination of the dispersion curveswas based on: (1) low signal-to-noise ratio of time domain signals,(2) the presence of no clear dispersion in the pre-defined range (8–50 s period), (3) complicated surface wave patterns resulting frommultipathing and higher mode contributions, (4) the paths outsideof the pre-defined distance range (600–2000 km), (5) the paths withtraveltime errors greater than 20 s during tomographic inversion.Fig. 6 shows the number of Love-wave measurements at differentperiods after discarding the paths with epicentral distances outside
of the pre-selected range and eliminating improper group velocitycurves. Eliminating majority of the paths did not pose a significantproblem on the resolution since the number of paths crossing gridsis still sufficient.
Since the number of selected dispersion measurements forRayleigh waves were found to be much lower than those of Lovewaves (about one-third of Love waves) the analysis was proceededonly using Love waves. It is worthwhile to mention that this observa-tion is not consistent with the observations worldwide. We attributethis difference to the facts that: (1) the majority of the earthquakesused in this study have strike-slip mechanisms. It is well knownthat earthquakes with strike-slip mechanisms generate Love wavesmore efficiently than Rayleigh waves and amplitudes of Rayleighwaves attenuate faster at greater periods than Love waves (Tsai &Aki 1971; Aki & Richards 1980). Moreover, the amplitude spectraof Rayleigh waves usually have spectral holes, which can affect thecontinuity of dispersion curves (Tsai & Aki 1971). When we re-duce the magnitude threshold of the earthquakes to Mw = 4.5 theamplitudes become an important factor for a higher signal-to-noiseratio. (2) The vertical component of surface waves is more affectedby free surface topography than horizontal components. Turkey issurrounded by sea on three sides, high mountain ranges on the northand south. Such elevation differences may distort propagation pathsand introduce scattering.
5 T O M O G R A P H Y
To obtain group velocity maps we utilized a method proposed byPasyanos (2005). The study region is divided into equal-area cellsand the following system of equations is obtained:
t = Ds, (1)
λLs = 0, (2)
C© 2010 The Authors, GJI
Journal compilation C© 2010 RAS
Love-wave group velocity maps 7
where, t is a vector of surface wave group arrival times, D is amatrix containing the distances travelled in each cell and s is avector of group velocity slowness. Eq. (2) imposes the smoothnessconstraint on the model parameters by constructing two dimensionalLaplacian operators L of the slowness. The damping factor of λ
controls the trade-off between fitting the traveltimes and smoothingthe model. The inversion does not strongly depend on the initialvelocity model. However, a fine grid could create regions with lowor no ray coverage. Pasyanos (2005) proposed a variable smoothingoperator to improve the resolution when the ray density is higher.We applied a variable smoothing operator with a multistep processfor the inversion. A larger grid size was adopted at the first stepwith a constant initial model resulting in a low-resolution solution.
The grid size was halved in the second step with the initial modelobtained in the previous step.
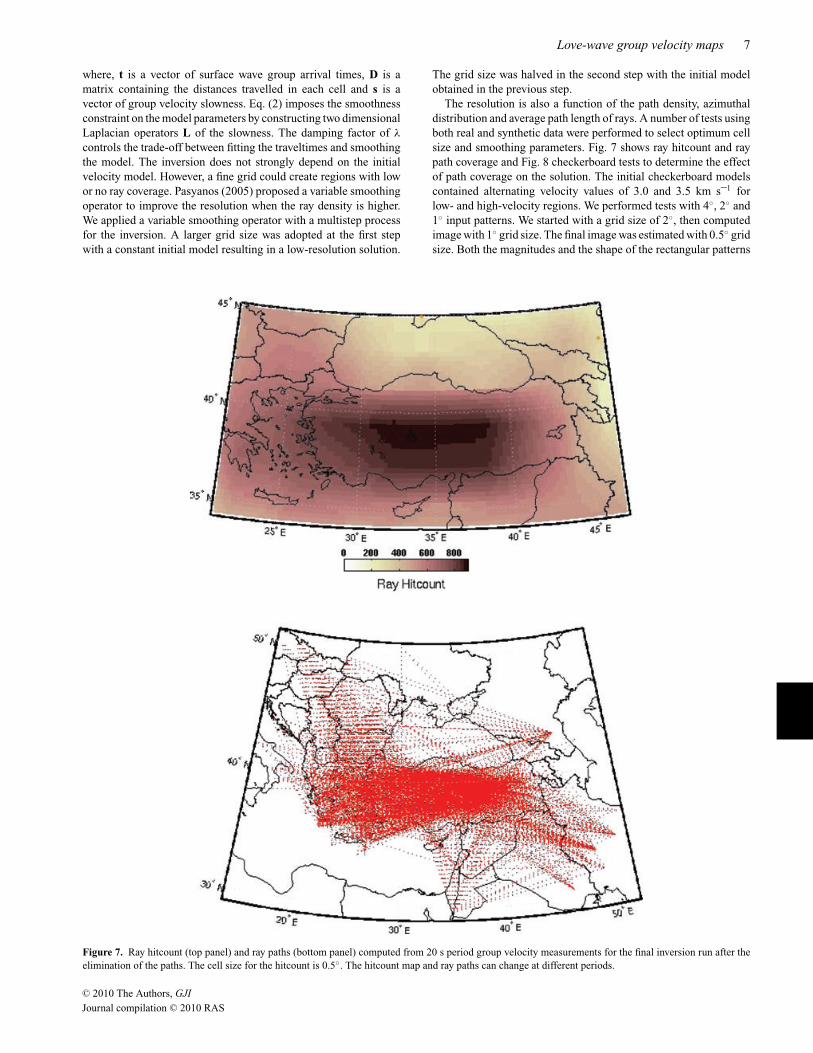
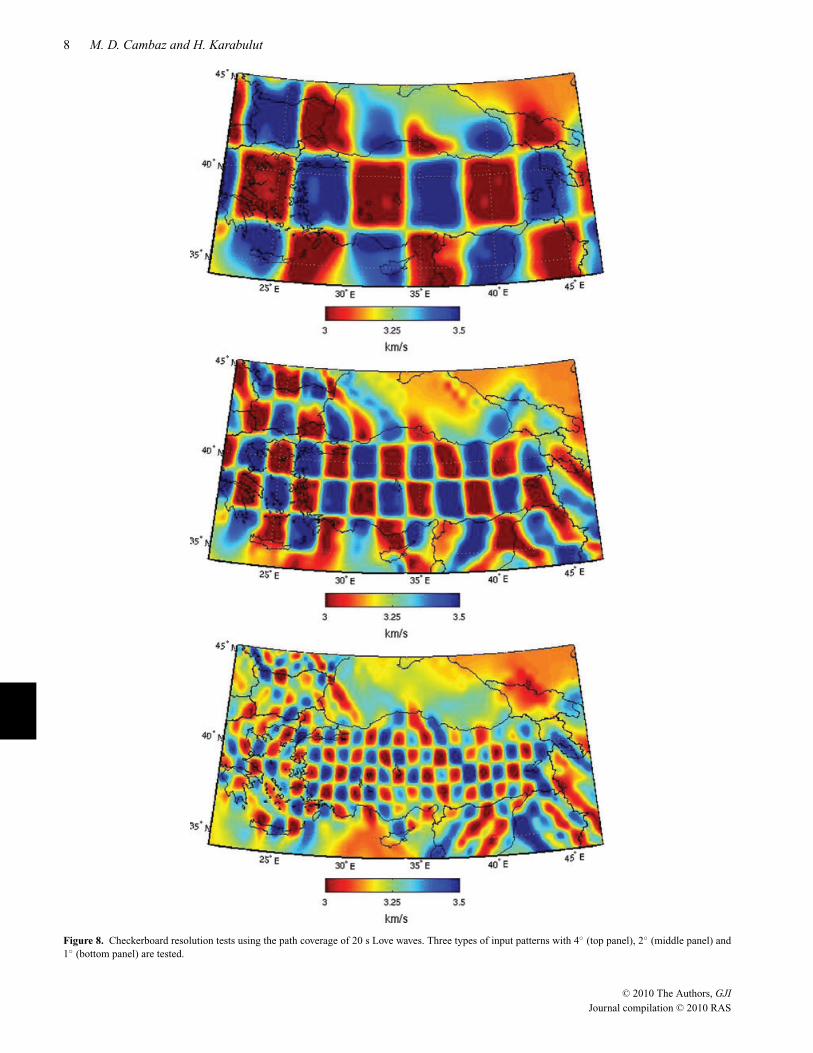
The resolution is also a function of the path density, azimuthaldistribution and average path length of rays. A number of tests usingboth real and synthetic data were performed to select optimum cellsize and smoothing parameters. Fig. 7 shows ray hitcount and raypath coverage and Fig. 8 checkerboard tests to determine the effectof path coverage on the solution. The initial checkerboard modelscontained alternating velocity values of 3.0 and 3.5 km s–1 forlow- and high-velocity regions. We performed tests with 4◦, 2◦ and1◦ input patterns. We started with a grid size of 2◦, then computedimage with 1◦ grid size. The final image was estimated with 0.5◦ gridsize. Both the magnitudes and the shape of the rectangular patterns
Figure 7. Ray hitcount (top panel) and ray paths (bottom panel) computed from 20 s period group velocity measurements for the final inversion run after theelimination of the paths. The cell size for the hitcount is 0.5◦. The hitcount map and ray paths can change at different periods.
C© 2010 The Authors, GJI
Journal compilation C© 2010 RAS
8 M. D. Cambaz and H. Karabulut
Figure 8. Checkerboard resolution tests using the path coverage of 20 s Love waves. Three types of input patterns with 4◦ (top panel), 2◦ (middle panel) and1◦ (bottom panel) are tested.
C© 2010 The Authors, GJI
Journal compilation C© 2010 RAS
Love-wave group velocity maps 9
were recovered in the majority of Turkey for 4◦, 2◦ and 1◦ patterns(Fig. 8). The results are consistent with the path densities shownin Fig. 7. The resolution degrades for 2◦ and 1◦ patterns outsideof Turkey with poor ray coverage, especially in the Black Sea andthe Mediterranean Sea. In the Arabian plateau the smearing of thepatterns also indicates insufficient ray coverage. Structures smallerthan 2◦ cannot be resolved in the areas with low ray coverage. Suchareas are located along the Black Sea coast, Hellenic arc and theMediterranean coast. However, the long wavelength features (>2◦)can still be recovered in majority of the domain with the exceptionon the northern part of the Black Sea. The checkerboard tests onlyindicate if the path coverage is sufficient. Therefore, we performedan additional test to determine the effect of the spatial sampling onthe inversion. We randomly selected 50 per cent of the paths withreplacement and determine the outcome of the initial checkerboard
pattern after several inversion runs. The results were consistent withthe full checkerboard test with complete database indicating that thenumber of paths used during the inversion is sufficient to attain thedesired resolution.
Group velocity maps of Love waves were computed in few steps.We initially obtained smooth group velocity maps at each period toidentify and discard group velocity measurements with traveltimeresiduals larger than 20 s (Fig. 9). We then computed final groupvelocity maps in three steps as explained during the checkerboardtest. We estimated group velocity maps with 2◦ grid interval andthen use the resulting maps as the input model to compute mapswith 1◦ grid spacing. Final images were calculated for 0.5◦ gridinterval.
There are additional concerns beside the path distribution,weighting of the data and spatial smoothing that may affect the
0 5 10 15 200
50
100
150
200
250
Time Erros (sec)
Co
un
t
0 5 10 15 200
50
100
150
200
250
300
350
400
450
Time Erros (sec)
Co
un
t
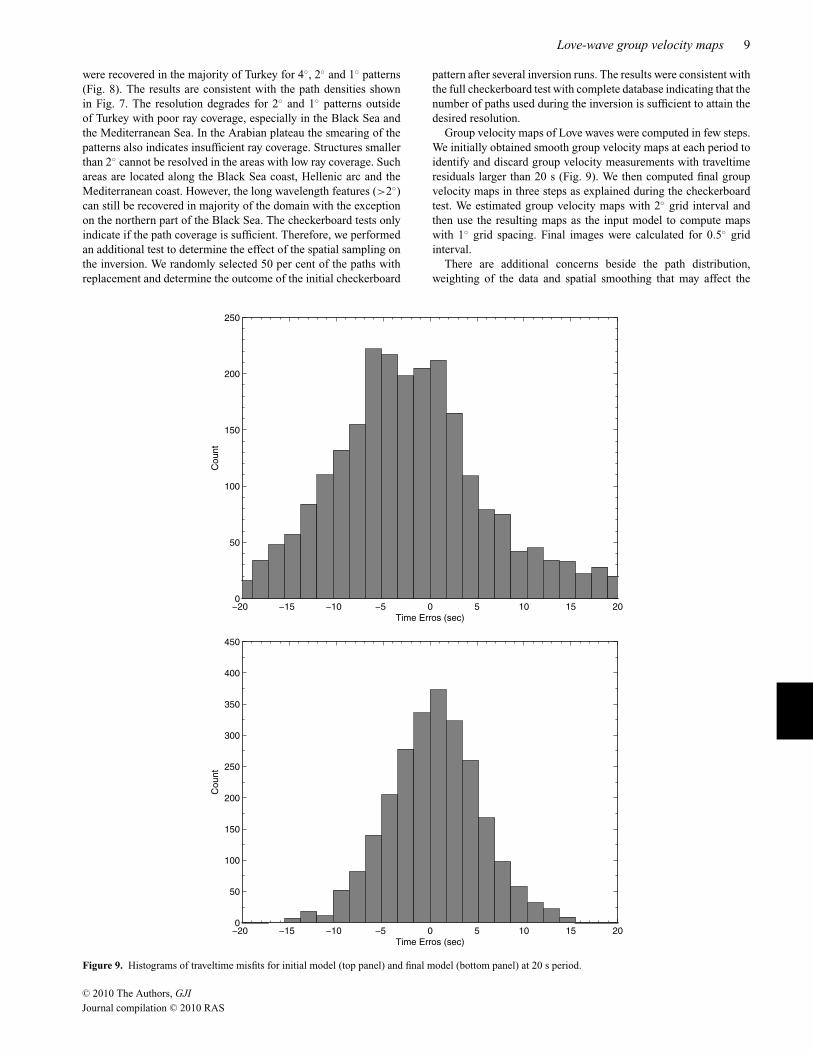
Figure 9. Histograms of traveltime misfits for initial model (top panel) and final model (bottom panel) at 20 s period.
C© 2010 The Authors, GJI
Journal compilation C© 2010 RAS
10 M. D. Cambaz and H. Karabulut
resulting maps. These are (1) location errors of the earthquakes,(2) distortions in 3-D wavefields due to lateral inhomogeneities, (3)anisotropy (Vdovin et al. 1999). The earthquakes selected for thegroup velocity dispersion measurements were also relocated usingthe available data. The hypocentral errors of the earthquakes inTurkey are less than 5 km. However, the estimated errors for theevents outside of the network coverage may reach 10 km. Thesevalues will have negligible effects on the estimated traveltimes forthe distance ranges used in this study.
The assumptions made in the formulation of tomography problemcontain significant simplifications. The effect of anisotropy anddeviations from straight ray paths are totally ignored in this study.It is well known that ray theory is a high-frequency approximation,which is not justified in the presence of large lateral heterogeneities.For the ray approximation to be valid, the first Fresnel zone mustbe smaller than the scale-length of the heterogeneity, which placeslimitations on the lateral resolution of seismic models based on raytheory (Levshin et al. 2005). Such effects are not investigated inthis study and may have varying degrees of importance when largelateral velocity contrasts exist.
6 G RO U P V E L O C I T Y M A P S
Using the tomographic inversion method as described in the pre-vious section, Love-wave’s group velocity maps at 10, 15, 20, 30,40 and 50 s were computed. Group velocity maps were producedfor several smoothing parameters, λ = 50, 100, 200. We preferredto use the value of λ = 200, which gives relatively smooth mapswith small solution errors. The rms traveltime errors for the initialand final velocity maps at different periods are listed in Table 1.We also computed histograms corresponding to traveltime errors ateach step for initial and final group velocity maps. Fig. 9 illustrateshistograms for the traveltime errors at 20 s period. The histogramsshow that the misfit for the data meets the criteria that eliminatetraveltimes errors greater than 20 s.
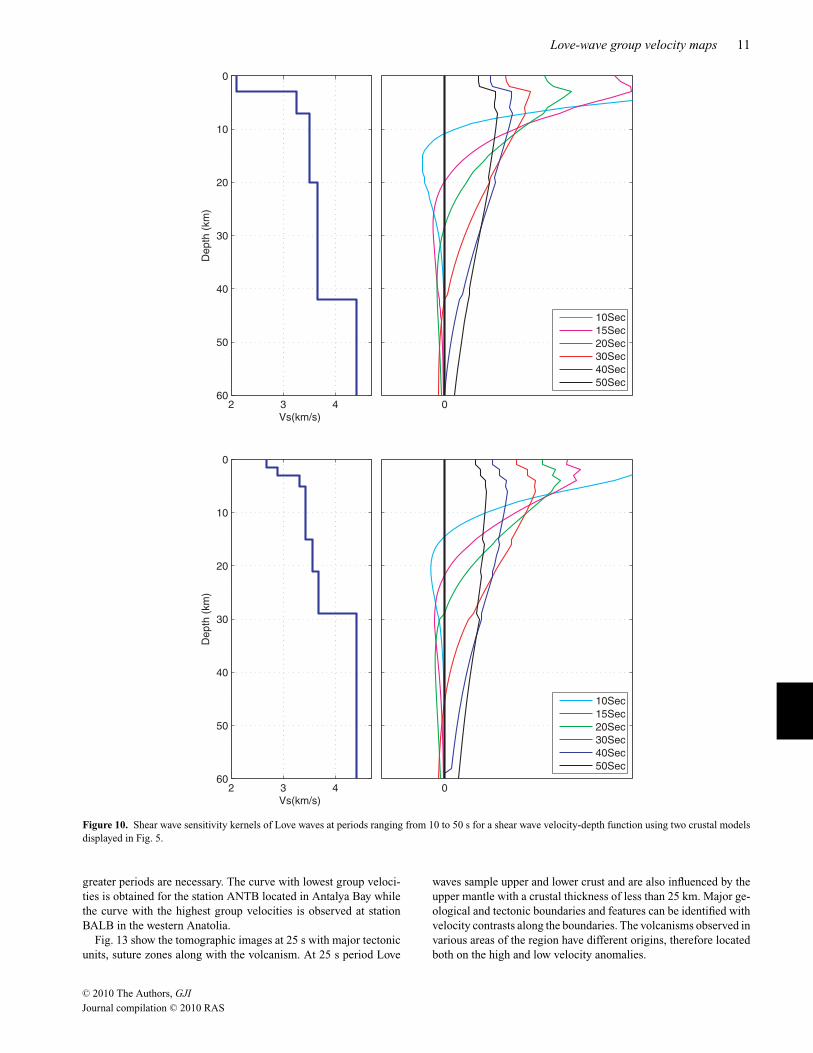
We computed sensitivity kernels of Love waves to determine howthe structure in a certain depth interval influences the group veloc-ities. These functions are the partial derivatives of group velocitywith respect to a perturbation of shear wave velocity in the referencemodel through which they are computed. Fig. 10 shows the sensi-tivity kernels for two earth models at a number of periods. Slowlyvarying sensitivities of Love waves limit the depth resolution andmask deeper structures. The shallow structures dominate at lowerperiods and have significant influence at higher periods. Vdovinet al. (1999) indicated that group velocity maps will have positivecorrelation with shear wave anomalies or boundary topography inthe neighbourhood of the positive maximum of the sensitivity ker-nel. The reason is that the negative values in the sensitivity kernelshas lower amplitudes and is more limited in depth extent.
At 10–15 s Love waves mainly sample the upper crust of10 km thickness. Waves with 20 s period are more sensitive up
to a depth of 20 km and therefore contain information on bothupper and lower crust. Intermediate periods (20–40 s) sample thecrust more uniformly and are influenced by the upper-mantle ve-locity for a crustal thickness of 28 km. At greater periods (>40 s)the low group velocities result mainly from thickened crust. Theinfluence of upper mantle is apparent for crustal thickness less than30 km when there is no significant masking from thick sedimentarybasins.
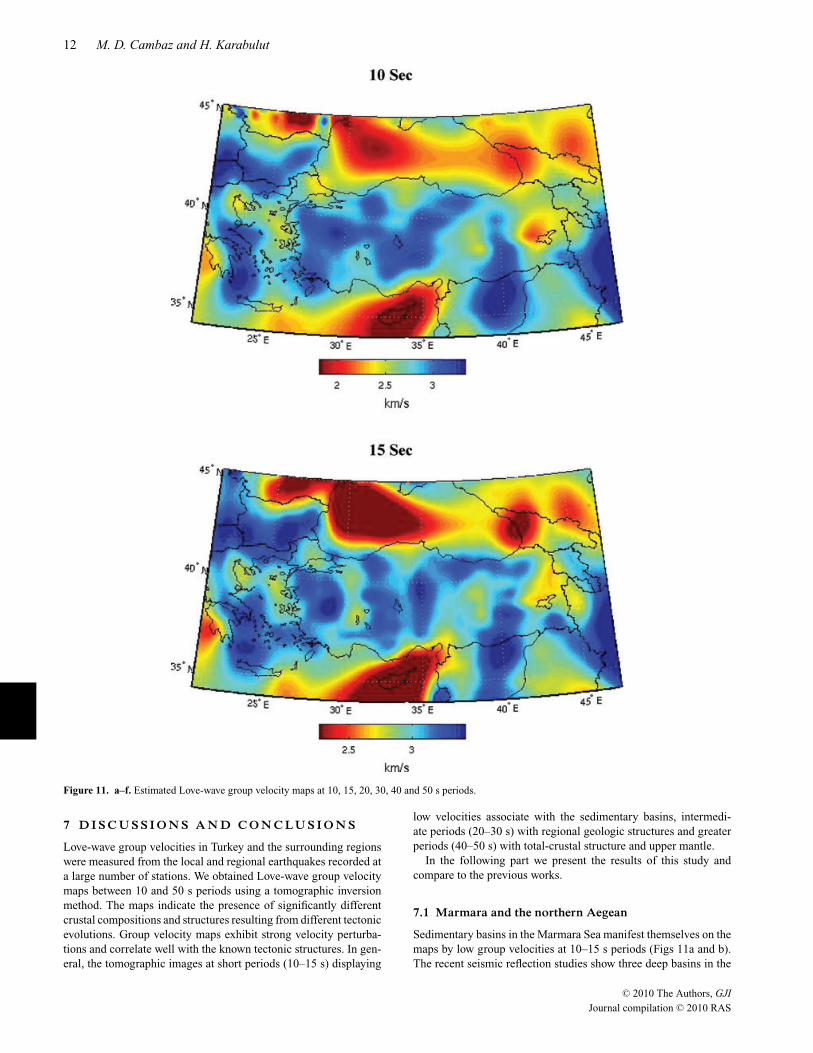
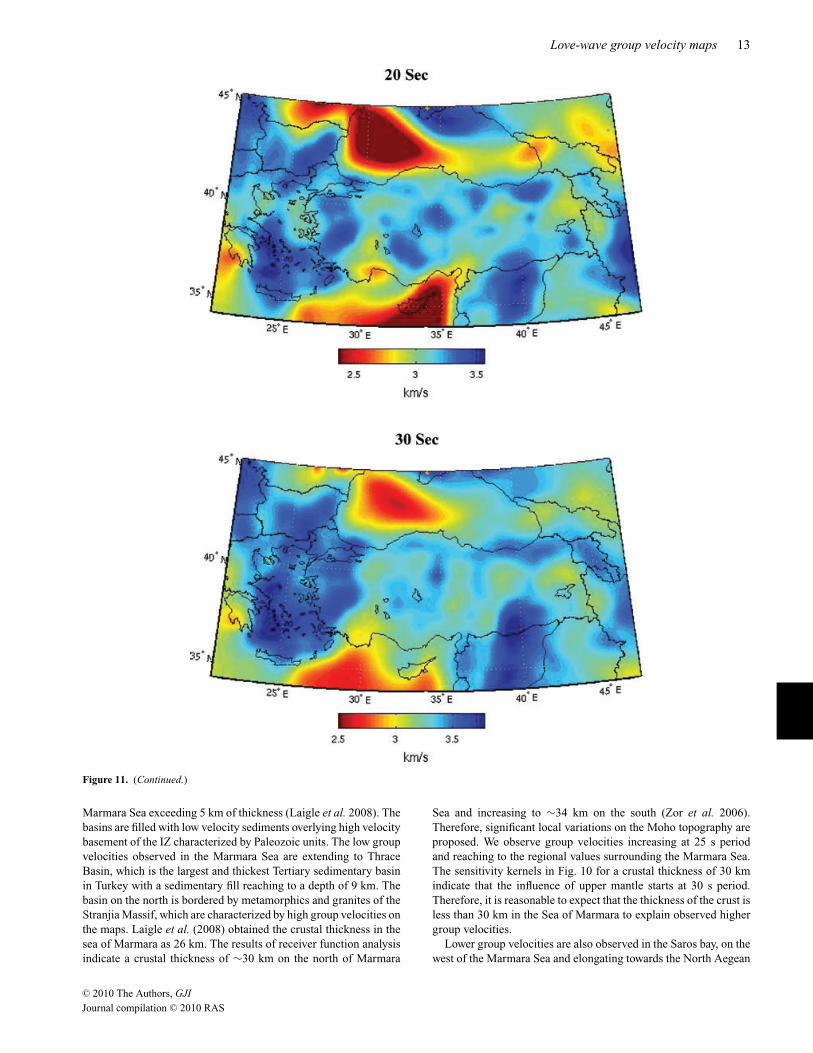
Group velocities at 10–15 s are sensitive to upper crust and in-fluenced by local sedimentary basins and topographical features(Figs 11a and b). Several inland and offshore basins exist inTurkey (e.g. Thrace basin, Cilicia–Adana basin, Tuz Golu basin,Sinop–Boyabat basin, Marmara Sea, Black Sea and Aegean Seaand Mediterranean Sea, Black Sea basins). Low group velocities areobserved in the Marmara Sea, Thrace basin, Saros Bay, Sinop basin,Black Sea and Mediterranean Sea, indicating the presence of thicksedimentary deposits. Low group velocities observed in the easternAnatolia take place at a region with widespread volcanic activity.
As indicated by the sensitivity kernels the group velocitiesat 20–30 s periods are influenced by a thickness of 20–25 km(Figs 11c and d). As a result, we observe anomalies associatedwith geological structures at crustal scale. Group velocities arehigher along the Pontides, IZ, Strandja massif on the north of theIzmir–Ankara–Erzincan suture zone. High group velocities are ob-served in central Anatolia, Hellenic arc and Menderes massif. Thecollision belt in Bitlis suture is characterized by high group veloci-ties. A larger velocity contrast exists between high group velocitiesin the BM and low group velocities in the eastern Anatolia. Lowgroup velocities are observed in Antalya Bay, west of Cyprus, witha continuation towards the IA. A wedge-shaped anomaly in the IAis a prominent feature on the group velocity maps starting from10 s period. The low group velocities observed in the Black Seacan be associated with two deep basins. Low velocities observedin the western Black Sea basin extend to Moesian Basin. However,both the geometry and magnitude of these anomalies may havesignificant uncertainties due to poor ray coverage.
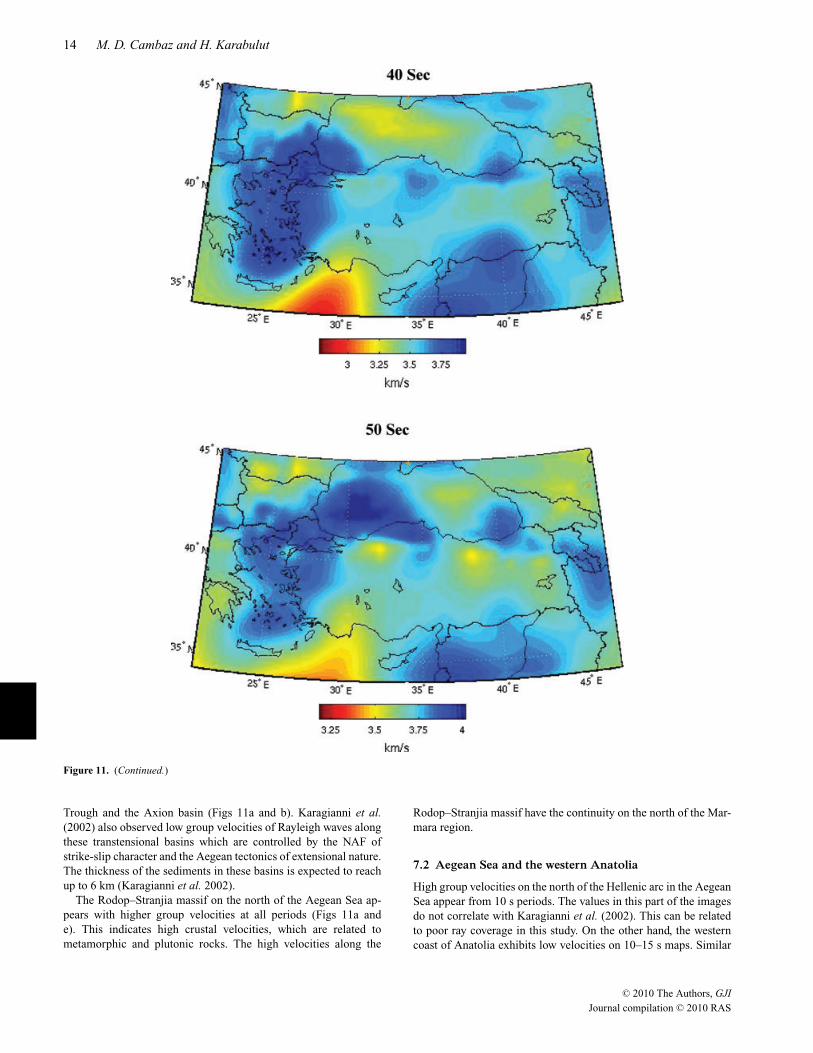
Group velocities at 40 and 50 s are influenced by the lower-crustand upper-mantle structure (Figs 11e and f). In this period range thewavelengths of the anomalies on the maps are larger with smallervelocity perturbations. The central Anatolia and Taurides have moreuniform distribution of group velocities. High group velocities areobserved in the Aegean region, Rodophe–Strandja massif, easternPontides and Bitlis suture zone while the low group velocities appearin the eastern Anatolia, the Antalya basin and the IA.
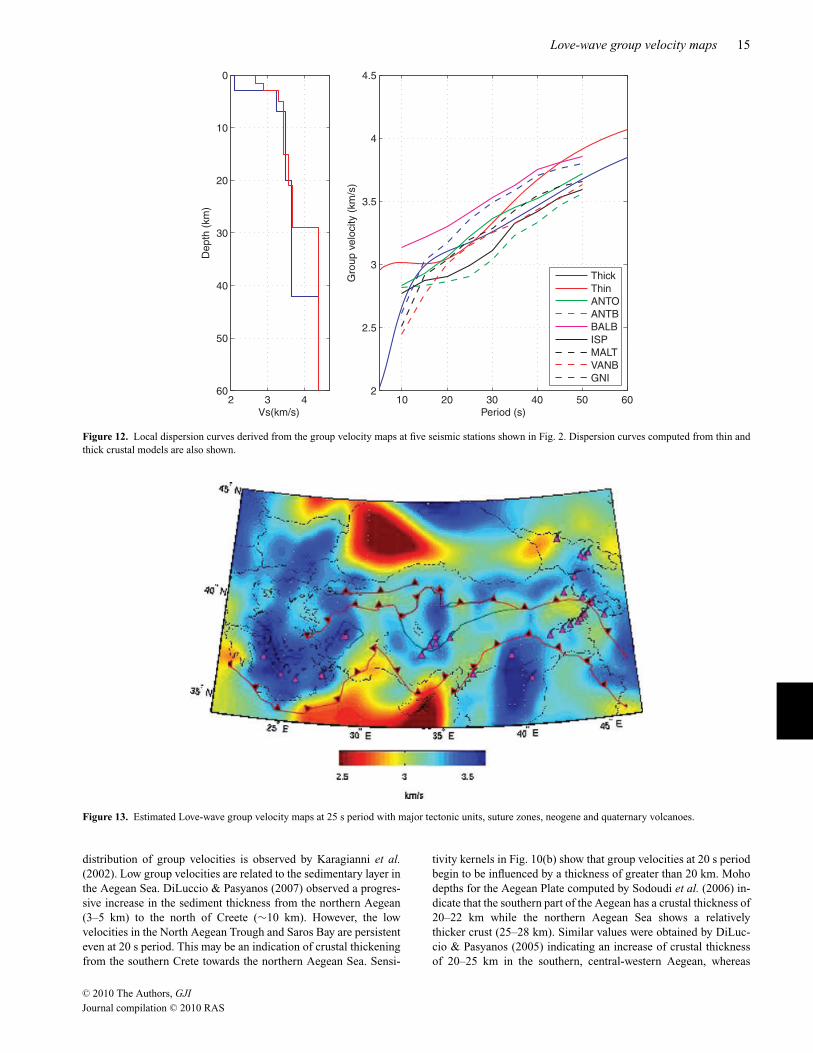
Using the group velocity maps of Love waves at different periodsobtained from tomography, local group velocity curves for the sta-tions shown in Fig. 2 are constructed (Fig. 12). Dispersion curvesindicate that there is a good continuity of tomographic images ofincreasing periods. They also show the geographical variations ofthe crustal structures in the area. However, the influence of the up-per mantle is not apparent on the curves indicating measurements at
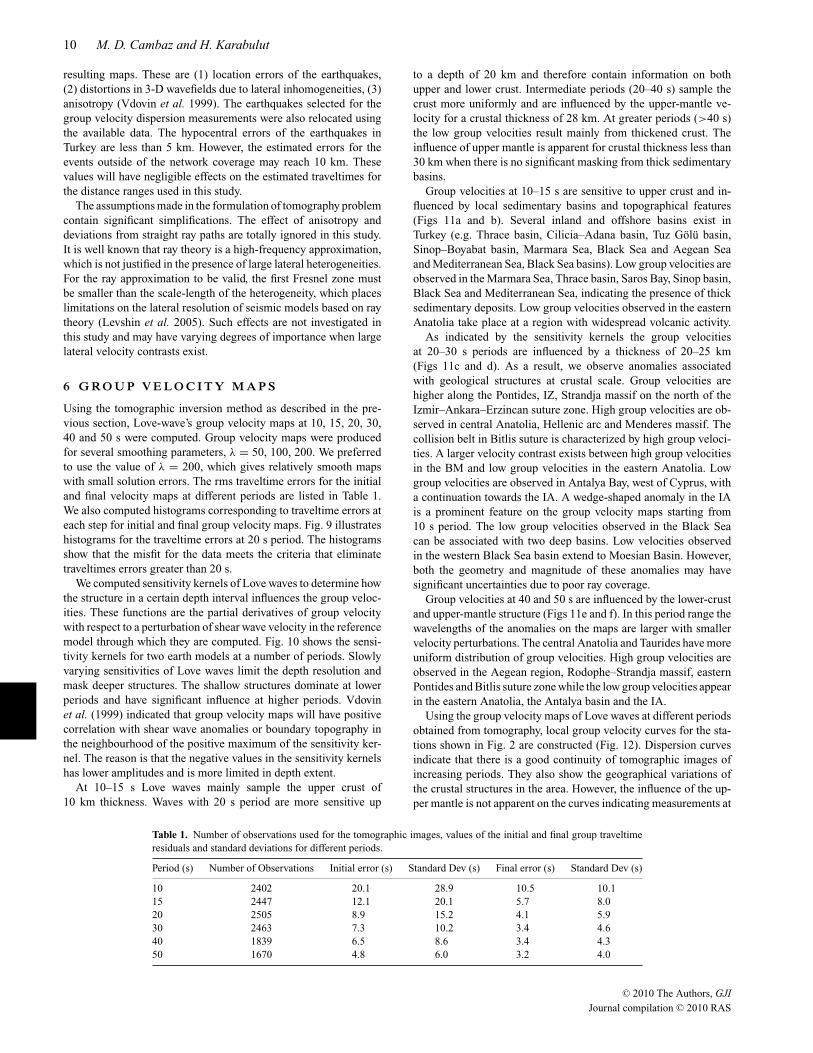
Table 1. Number of observations used for the tomographic images, values of the initial and final group traveltimeresiduals and standard deviations for different periods.
Period (s) Number of Observations Initial error (s) Standard Dev (s) Final error (s) Standard Dev (s)
10 2402 20.1 28.9 10.5 10.115 2447 12.1 20.1 5.7 8.020 2505 8.9 15.2 4.1 5.930 2463 7.3 10.2 3.4 4.640 1839 6.5 8.6 3.4 4.350 1670 4.8 6.0 3.2 4.0
C© 2010 The Authors, GJI
Journal compilation C© 2010 RAS
Love-wave group velocity maps 11
0
10Sec
15Sec
20Sec
30Sec
40Sec
50Sec
2 3 4
0
10
20
30
40
50
60
De
pth
(km
)
Vs(km/s)
0
10Sec
15Sec
20Sec
30Sec
40Sec
50Sec
2 3 4
0
10
20
30
40
50
60
De
pth
(km
)
Vs(km/s)
Figure 10. Shear wave sensitivity kernels of Love waves at periods ranging from 10 to 50 s for a shear wave velocity-depth function using two crustal modelsdisplayed in Fig. 5.
greater periods are necessary. The curve with lowest group veloci-ties is obtained for the station ANTB located in Antalya Bay whilethe curve with the highest group velocities is observed at stationBALB in the western Anatolia.
Fig. 13 show the tomographic images at 25 s with major tectonicunits, suture zones along with the volcanism. At 25 s period Love
waves sample upper and lower crust and are also influenced by theupper mantle with a crustal thickness of less than 25 km. Major ge-ological and tectonic boundaries and features can be identified withvelocity contrasts along the boundaries. The volcanisms observed invarious areas of the region have different origins, therefore locatedboth on the high and low velocity anomalies.
C© 2010 The Authors, GJI
Journal compilation C© 2010 RAS
12 M. D. Cambaz and H. Karabulut
Figure 11. a–f. Estimated Love-wave group velocity maps at 10, 15, 20, 30, 40 and 50 s periods.
7 D I S C U S S I O N S A N D C O N C LU S I O N S
Love-wave group velocities in Turkey and the surrounding regionswere measured from the local and regional earthquakes recorded ata large number of stations. We obtained Love-wave group velocitymaps between 10 and 50 s periods using a tomographic inversionmethod. The maps indicate the presence of significantly differentcrustal compositions and structures resulting from different tectonicevolutions. Group velocity maps exhibit strong velocity perturba-tions and correlate well with the known tectonic structures. In gen-eral, the tomographic images at short periods (10–15 s) displaying
low velocities associate with the sedimentary basins, intermedi-ate periods (20–30 s) with regional geologic structures and greaterperiods (40–50 s) with total-crustal structure and upper mantle.
In the following part we present the results of this study andcompare to the previous works.
7.1 Marmara and the northern Aegean
Sedimentary basins in the Marmara Sea manifest themselves on themaps by low group velocities at 10–15 s periods (Figs 11a and b).The recent seismic reflection studies show three deep basins in the
C© 2010 The Authors, GJI
Journal compilation C© 2010 RAS
Love-wave group velocity maps 13
Figure 11. (Continued.)
Marmara Sea exceeding 5 km of thickness (Laigle et al. 2008). Thebasins are filled with low velocity sediments overlying high velocitybasement of the IZ characterized by Paleozoic units. The low groupvelocities observed in the Marmara Sea are extending to ThraceBasin, which is the largest and thickest Tertiary sedimentary basinin Turkey with a sedimentary fill reaching to a depth of 9 km. Thebasin on the north is bordered by metamorphics and granites of theStranjia Massif, which are characterized by high group velocities onthe maps. Laigle et al. (2008) obtained the crustal thickness in thesea of Marmara as 26 km. The results of receiver function analysisindicate a crustal thickness of ∼30 km on the north of Marmara
Sea and increasing to ∼34 km on the south (Zor et al. 2006).Therefore, significant local variations on the Moho topography areproposed. We observe group velocities increasing at 25 s periodand reaching to the regional values surrounding the Marmara Sea.The sensitivity kernels in Fig. 10 for a crustal thickness of 30 kmindicate that the influence of upper mantle starts at 30 s period.Therefore, it is reasonable to expect that the thickness of the crust isless than 30 km in the Sea of Marmara to explain observed highergroup velocities.
Lower group velocities are also observed in the Saros bay, on thewest of the Marmara Sea and elongating towards the North Aegean
C© 2010 The Authors, GJI
Journal compilation C© 2010 RAS
14 M. D. Cambaz and H. Karabulut
Figure 11. (Continued.)
Trough and the Axion basin (Figs 11a and b). Karagianni et al.(2002) also observed low group velocities of Rayleigh waves alongthese transtensional basins which are controlled by the NAF ofstrike-slip character and the Aegean tectonics of extensional nature.The thickness of the sediments in these basins is expected to reachup to 6 km (Karagianni et al. 2002).
The Rodop–Stranjia massif on the north of the Aegean Sea ap-pears with higher group velocities at all periods (Figs 11a ande). This indicates high crustal velocities, which are related tometamorphic and plutonic rocks. The high velocities along the
Rodop–Stranjia massif have the continuity on the north of the Mar-mara region.
7.2 Aegean Sea and the western Anatolia
High group velocities on the north of the Hellenic arc in the AegeanSea appear from 10 s periods. The values in this part of the imagesdo not correlate with Karagianni et al. (2002). This can be relatedto poor ray coverage in this study. On the other hand, the westerncoast of Anatolia exhibits low velocities on 10–15 s maps. Similar
C© 2010 The Authors, GJI
Journal compilation C© 2010 RAS
Love-wave group velocity maps 15
10 20 30 40 50 602
2.5
3
3.5
4
4.5
Period (s)
Gro
up v
elo
city (
km
/s)
Thick
Thin
ANTO
ANTB
BALB
ISP
MALT
VANB
GNI
2 3 4
0
10
20
30
40
50
60
Depth
(km
)
Vs(km/s)
Figure 12. Local dispersion curves derived from the group velocity maps at five seismic stations shown in Fig. 2. Dispersion curves computed from thin andthick crustal models are also shown.
Figure 13. Estimated Love-wave group velocity maps at 25 s period with major tectonic units, suture zones, neogene and quaternary volcanoes.
distribution of group velocities is observed by Karagianni et al.(2002). Low group velocities are related to the sedimentary layer inthe Aegean Sea. DiLuccio & Pasyanos (2007) observed a progres-sive increase in the sediment thickness from the northern Aegean(3–5 km) to the north of Creete (∼10 km). However, the lowvelocities in the North Aegean Trough and Saros Bay are persistenteven at 20 s period. This may be an indication of crustal thickeningfrom the southern Crete towards the northern Aegean Sea. Sensi-
tivity kernels in Fig. 10(b) show that group velocities at 20 s periodbegin to be influenced by a thickness of greater than 20 km. Mohodepths for the Aegean Plate computed by Sodoudi et al. (2006) in-dicate that the southern part of the Aegean has a crustal thickness of20–22 km while the northern Aegean Sea shows a relativelythicker crust (25–28 km). Similar values were obtained by DiLuc-cio & Pasyanos (2005) indicating an increase of crustal thicknessof 20–25 km in the southern, central-western Aegean, whereas
C© 2010 The Authors, GJI
Journal compilation C© 2010 RAS
16 M. D. Cambaz and H. Karabulut
reaching 32 km in the northern Aegean. Such differences inthe crustal thicknesses has been interpreted that the extensionstrongly influenced the southern Aegean while presently undergo-ing high crustal deformation in the northern Aegean Sea (Sodoudiet al. 2006).
Significant velocity contrast exists between low group veloci-ties in the Aegean Sea and high group velocities of the westernTurkey. The contrast also appears on the Rayleigh wave maps ofKaragianni et al. (2002) between 6 and 19 s. The observed con-trast is the result of low velocity sediments of the Aegean and highvelocity metamorphic core complex in the region (e.g. MenderesMassif). The contrast disappears at periods greater than 25 s indi-cating the influence of the lower crust and upper mantle. However,a velocity contrast appears between the western Anatolia and thecentral Anatolia at 29◦E indicating a thicker and slower crust. Agradual thickening of the crust is observed from the Aegean to thewestern Turkey from 25 to 32 km and reaches to ∼40 towards thecentral Anatolia (Karagianni et al. 2005; Zhu et al. 2006; DiLuccio& Pasyanos 2007).
7.3 Southern Anatolia and IA
One of the prominent features of the group velocity maps is thepresence of a wedge-shaped low-velocity anomaly in the AntalyaBay elongating towards the IA. Low velocities start appearing at10 s map and continue to be present at greater periods with in-creasing wavelengths. The low velocity anomaly of IA is delimitedby the Menderes massif in the west and the Sultandag–Beysehirmassif in the east. In the centre of IA, a regional allochthonousunit, Antalya complex, represents a critical part of the evidenceof a southerly Neotethyan oceanic basin (Robertson 2000). Sev-eral carbonate platforms, sedimentary basins and ophiolits existin this complex. The deep structure of Antalya Bay, the offshoreextension of the IA, is poorly known. Earthquake locations sug-gest the existence of a detached oceanic slab beneath the Antalyabay even though the timing and the geometry of the slab remainsunclear (Engdahl et al. 1998; Robertson 2000). The crustal thick-ness obtained from receiver function analysis at ISP station, whichis located within IA is found as 42 km, significantly thicker than35 km of ANTO station (Zhu et al. 2006). This indicates significantcrustal thickening as a result of collision. DiLuccio & Pasyanos(2007) observed crustal thickening from 30 km near Cyprus to 50km in the central Turkey with lower crustal velocities. The 2–3km thick soft sediments presented on their maps can be related tothe allochthonous units in IA and appear on 10–20 s maps of thisstudy while at greater periods (40–50 s) slower velocities indicate athicker crust.
Low group velocities at 10–15 s appear in the Cilicia–Adana basinlocated between Turkey and the northern Cyprus. The seismic re-flection data show that this basin contains sediments with 3 km thick-ness (Aksu et al. 2005). The lower sections of the Cilicia–Adanabasin were not imaged by the seismic reflection data but expectedto contain a thicker sedimentary sequence. The low group veloc-ities observed on 10–20 s maps also support the presence of athicker sedimentary basin. Anomalously low velocities associatedthick layers of sediments on the west of Cyprus were observed byDiLuccio & Pasyanos (2007) while relatively higher velocities andthinner sedimentary section were found on the east of Cyprus. Incontrast we observed high group velocities in the east of Cyprus for10–20 s periods indicating the presence of thick sedimentarycolumn.
7.4 Eastern Anatolia
A prominent low velocity anomaly on the 10–30 s group velocitymaps appears in the Eastern Anatolia region surrounded by highervelocities of the eastern Pontides and the collision zone of Anatolia-Arabian plates. Sengor et al. (2003) and Keskin (2003) proposed thatthe eastern Anatolia region can be characterized by three tectonicunits; the Pontides on the north, in the centre the Eastern AnatolianAccretionary Complex (EAAC) and collision-related volcanics andfinally on the south Bitlis–Poturge massif.
The eastern Pontides characterized by higher group velocitiesare considered as a magmatic arc of Albian to Oligocene age. Itsbasement is represented by a metamorphic massive named the PulurComplex (Topuz et al. 2004). The magmatic arc formed by a north-dipping subduction under the Eurasian continental margin (Yılmazet al. 1998; Sengor et al. 2003). Along the suture zone separating thePontides from Anatolian–Iranian platform ophiolits, melanges andforearc deposits are exposed. There is a gradual crustal thickeningalong the Pontides starting at 32 km in the western Pontides andreaching to 44 km in the eastern Pontides (Mooney et al. 1998).Crustal thickening and initiation of volcanic activity started as aresult of subduction-related compression and consumption.
As Sengor et al. (2003) and Keskin (2003) suggested, the EAACis produced by the consumption of the Neo-Tethyan ocean and awidespread volcanic activity from upper Miocene to Quaternarywas observed in the region with the complete elimination of theNeo-Tethyan ocean floor as a result of collision between Arabia andEurasia during Early Miocene (Yılmaz et al. 1998). The volcanismstarted earlier in the north and migrated to the south as a resultof the slab steepening under the eastern Anatolia region. Severaltectonic models have been proposed to explain the subduction andpost-collisional evolution of the region. Based on the crustal thick-ness (Zor et al. 2003), low Pn velocities (Al-Lazki et al. 2003) andhigh Sn attenuation (Gok et al. 2003), Keskin (2003) and Sengoret al. (2003) proposed the absence of the subducting Arabian Platebeneath the Anatolian plateau. They suggested that the lithosphericmantle is either thinned or totally removed in the region. Keskin(2003) also proposed that the interaction of hot asthenosphere withthe EAAC that contains retained water decreases the melting tem-peratures at a giving depth, generating extensive melting in the crust.Such interaction can account for the variability of lava chemistryand magma–crust interaction as well as low velocity zones observedin this study. The shallowest Curie point depths are observed in thearea of the Quaternary volcanism and correlates well with the ob-served low-velocity zones (Aydın et al. 2005). The shallow Curiepoint depths imply that the magma source causing the low-velocityzones is located at shallower crustal depths.
At greater periods (>30 s) we still observe lower group velocitiesin eastern Anatolia. The average crustal thickness is varying from38 km from the Arabian platform to 50 km in the Pontides witha regional average of 45 km (Gok et al. 2007). Therefore, we donot expect the influence of upper mantle at 50 s. The low groupvelocities were also observed on the tomographic images presentedby Gok et al. (2007). They observed low S-wave velocities in theeastern Anatolia and high velocities on the Arabian foreland.
7.5 Central Anatolia
The KM located in the central Anatolia does not appear as a uni-form velocity block on 10–20 s group velocity maps. Higher groupvelocities are observed in the core of the massif and relatively lowervelocities in the area of the Tuz Golu basin. However, at greater
C© 2010 The Authors, GJI
Journal compilation C© 2010 RAS
Love-wave group velocity maps 17
periods (40–50 s) the group wave velocities have more uniformdistribution. This indicates that the heterogeneities are confined tothe upper crust in the massif. The KM is regarded either as themetamorphized northern margin of A–T terrain or a distinct ter-rane separated from A–T by the Inner Tauride suture. The massifcontains oceanic remnants derived from the Neo-Tethys Ocean,which separate them from the Sakarya continent. It is consideredto represent variably tectonized and subducted oceanic lithosphereand continental carbonate platform that were subsequently ejectedfrom an accretionary–subduction complex on the collision with theSakarya microcontinent (Floyd et al. 2000). The present seismicityof Turkey indicates that internal deformation of the central Anatoliaappears to be less than eastern and western Anatolia. Therefore, it isnot surprising to expect a more rigid and homogenous lower crust.We do not observe an obvious correlation between group velocitiesand volcanism in the central Anatolia in contrast to the eastern Ana-tolia. This indicates that the origin of the volcanism in the centralAnatolia is significantly different from the eastern Anatolia.
7.6 Black Sea
Two distinct group velocity anomalies appear in the Black Seastarting at 10 s period. Although additional ray coverage is neces-sary to increase the reliability of the maps the features with largerwavelengths (>2◦) can still be associated with the known geolog-ical features. The Black Sea is composed of two deep basins. Thewestern Black Sea basin has a maximum thickness of 19 km whilethe eastern Black Sea basin has 12 km of thick sediments. Thereis a significant crustal thinning (up to 10 km) below these basinswith a total crustal thickness of 20 km (Spadini et al. 1996). Wedo not clearly observe the effect of crustal thinning on the groupvelocity maps. The low-velocity basins mask the deeper structures,which can be observed from the slowly varying sensitivities of Lovewaves.
Based on the group velocity maps we divided the area into fivedistinct regions. The Anatolian block displays a heterogeneous up-per crust at 10–20 s periods while low group velocities at largerperiods (>30 s) indicate more uniform lower crust. The low groupvelocities observed at larger periods can be related to low crustalvelocities and/or thicker crust. Love waves at 50 s period are notsignificantly influenced by a crustal thickness of greater than 35 km.Significant velocity contrasts are observed between the Anatolianblock and the surroundings indicating variations on the crustal typesand tectonic styles. The Aegean region in the west is characterizedby high group velocities as a result of crustal thinning. The Pontideson the north exhibit high group velocities as a result of high crustalvelocities and crustal thickening from east to west along the BlackSea coast. The Mediterranean region on the south is characterizedby very low group wave velocities as a result of crustal thickeningand accretionary complex from the subduction. The Bitlis–Poturgemassif displays high velocities along the collision zone and uniformlower velocities on the Arabian platform.
A more quantitative analysis will be presented in the future bythe joint inversion of group velocities with receiver functions andPn velocities. Additional observations from ambient noise corre-lations may improve tomographic images in the areas with lowray coverage. Rayleigh wave observations with earthquakes andambient noise correlations are in progress and will provide betterresolution and higher sensitivity on the deeper part of the crust andmantle.
A C K N OW L E D G M E N T S
We would like to thank Michel Pasyanos, an anonymous reviewerand the Associate Editor, Saskia Goes for their critical reviews,Helle A. Pedersen for providing the RMFA code for group velocitymeasurements. We also would like to thank Esen Arpat and SerdarOzalaybey for reading the manuscript and suggestions. Some of thefigures were generated using the Generic Mapping Tools (GMT)software (Wessel & Smith 1998).
R E F E R E N C E S
Aki, K. & Richards, P.G., 1980. Quantitative Seismology, Theory and Meth-ods, Vol. 2, W.H. Freeman and company, NY.
Aksu, A.E., Calon, T.J., Hall, J., Mansfield, S. & Yasar, D., 2005. TheCilicia–Adana basin complex, Eastern Mediterranean: Neogene evolutionof an active fore-arc basin in an obliquely convergent margin, Mar. Geol.,221, 121–159.
Akyol, N., Zhu, L., Mitchell, B.J., Sozbilir, H. & Kekovalı K., 2006. Crustalstructure and local seismicity in Western Anatolia, Geophys. J. Int., 166/3,1259–1269.
Al-Lazki, A., Seber, D., Sandvol, E., Turkelli, N., Mohamad, R. & Barazangi,M., 2003. Tomographic Pn velocity and anisotropy structure beneath theAnatolian Plateau (Eastern Turkey) and the surrounding regions, Geophys.Res. Lett., 30(24), doi:10.1029/2003GL017391.
Aydın, I., Karat, H.I. & Kocak, A., 2005. Curie-point depth map of Turkey,Geophys. J. Int., 162, 633–640.
Curtis, A., Trampert, J., Snieder, R. & Dost, B., 1998. Eurasian fundamentalmode surface wave phase velocities and their relationship with tectonicstructures, J. geophys. Res., 103, 26 919–26 947.
DiLuccio, F. & Pasyanos, M.E., 2007. Crustal and upper-mantle structure inthe eastern Mediterranean from the analysis of surface wave dispersioncurves, Geophys. J. Int., 169, 1139–1152.
Dziewonski, A.M., Bloch, S. & Landisman, M., 1969. A technique forthe analysis of transient seismic signals, Bull. seism. Soc. Am., 59(1),427–444.
Dziewonski, A.M., 1971. On regional differences in dispersion of mantlewaves, Geophys. J. R. astr. Soc., 22, 289–325.
Engdahl, E.R., Van Der Hilst, R. & Buland, R., 1998. Global teleseismicearthquake relocation with improved travel times and procedures for depthdetermination. Bull. seism. Soc. Am., 88, 722–743.
Floyd, P.A., Goncuoglu, M.C., Winchester, J.A. & Yalınız, M.K., 2000.Geochemical character and tectonic environment of Neotethyan Ophi-olitic fragments and metabasites in the Central Anatolian CrystallineComplex, Turkey, in Tectonic and Magmatism in Turkey and theSurrounding Area, Vol. 173, pp. 183–202, eds Bozkurt, E., Winch-ester, J.A. & Piper, J.D.A., Geological Society, Special Publications,London.
Glover, C. & Robertson, A.H.F., 1998. Neogen intersection of the Aegeanand Cyprus arcs: extensional and strike-slip faulting in the Isparta Angle,SW Turkey. Tectonophysics, 298, 103–132.
Goncuoglu, M.C., Duruk, K. & Kozlu, H., 1997. General characteristicsof pre-Alpine and Alpine Terranes in Turkey: explanatory notes to theterrane map of Turkey, Annales Geologique de Pays Hellenique, 37,515–536.
Gok, R., Sandvol, E., Turkeli, N., Seber, D. & Barazangi, M.M., 2003. Snattenuation in the Anatolian and Iranian plateaus and surrounding regions,Geophys. Res. Lett., 30(24), 8042, doi:10.1029/2003GL018020.
Gok, R., Pasyanos, M.E. & Zor, E., 2007. Lithospheric structure of thecontinent–continent collision zone: eastern Turkey, Geophys. J. Int., 169,1079–1088.
Herrmann, R.B., 2002. Computer Programs in Seismology, Version 3.30, St.Louis University, Missouri.
Innocenti, F., Manetti, P., Mazzuoli, R., Pasquare G. & Villari, L., 1982.Anatolia and North-Western Iran, in Andesites: Orogenic Andesites and
C© 2010 The Authors, GJI
Journal compilation C© 2010 RAS
18 M. D. Cambaz and H. Karabulut
Related Rocks, pp. 327–349, ed. Thorpe, R.S., TheOpen Univ., Dept.Earth Sci., Milton Keynes, UK.
Karagianni, E.E. et al., 2002. Rayleigh wave group velocity tomography inthe Aegean area, Tectonophysics, 358, 187–209.
Karagianni, E.E., Papazachos, C.B., Panagiotopoulos, D.G., Suhadolc, P.,Vuan, A. & Panza, G.F., 2005. Shear velocity structure in the Aegeanarea obtained by inversion of Rayleigh waves, Geophys. J. Int., 160,127–143.
Keskin, M., 2003. Magma generation by slab steepening and breakoff be-neath a subduction–accretion complex: an alternative model for collision-related volcanism in Eastern Anatolia, Turkey, Geophys. Res. Lett., 30,8046.
Knopoff, L., 1972. Observation and inversion of surface wave dispersion,Tectonophysics, 13, 497–519.
Laigle, M., Becel, A., De Voogd, B., Hirn, A., Taymaz, T. & Ozalaybey, S.,2008. A first deep seismic survey in the Sea of Marmara: deep basins andwhole crust architecture and evolution, Earth planet. Sci. Lett., 270(3–4),168–179.
Levshin, A.L., Ratnikova, L.I. & Berger, J., 1992. Peculiarities of surfacewave propagation across central Eurasia, Bull. seism. Soc. Am., 82, 2464–2493.
Levshin, A.L., Ritzwoller, M.H. & Ratnikova, L.I., 1994. The nature andcause of polarization anomalies of surface waves crossing northern andcentral Eurasia, Geophys. J. Int., 117, 577–590.
Levshin, A.L., Barmin, M.P., Ritzwoller, M.H. & Trampert, J., 2005. Minor-arc and major-arc global surface wave diffraction tomography, Phys. Earthplanet. Inter., 149, 205–223.
Maggi A. & Priestly, K., 2005. Surface waveform tomography of theTurkish–Iranian plateau, Geophys. J. Int., 160, 1068–1080.
Mindevalli, O.Y. & Mitchell, M.J., 1989. Crustal structure and possibleanisotropy in Turkey from seismic surface wave dispersion, Geophys. J.Int., 98, 93–106.
Mooney, W., Laske, G. & Master, T., 1998. CRUST 5.1: a global crustalmodel at 5 × 5, J. geophys. Res. 103, 727–747.
Nikishin, A.M., Korotaev, M.V., Ershov, A.V. & Brunet, M-F., 2003. TheBlack Sea basin: tectonic history and Neogene–Quaternary rapid subsi-dence modeling, Sediment. Geol., 156, 149–168.
Okay, A.I., 1989. Tectonic units and sutures in the Pontides, northern Turkey,in Tectonic Evolution of the Tethyan Region, pp. 109–115, ed. Sengor,A.M.C., Kluwer Academic Publications, Dordrecht.
Okay, A.I., Sengor, A.M.C. & Gorur, N., 1994. Kinematic history of theopening of the Black Sea and its effect on the surrounding regions. Geol-ogy, 22, 267–270.
Okay, A.I. & Tuysuz, O., 1999. Tethyan sutures of northern Turkey,in “The Mediterranean Basins: Tertiary Extension within the Alpineorogen”, pp. 475–515, eds Durand, B., Jolivet, L., Horvath,F. & Seranne, M., Geological Society, Special Publication 156,London.
Oliver, J., 1962. A summary of observed surface wave dispersion, Bull.seism. Soc. Am., 52, 81–86.
Pasyanos, M., 2005. A variable resolution surface wave dispersion studyof Eurasia, North Africa, and surrounding regions, J. geophys. Res.,149, 462–480.
Pasyanos, M., Walter, W. & Hazler, S., 2001. A surface wave dis-persion study, of the Middle East and North Africa for monitoringthe comprehensive nuclear test ban treaty, Pure appl. Geophys., 158,1445–1474.
Pedersen, H.A., Mars, J.I. & Amblard, P.O., 2003. Improving surface wavegroup velocity measurements by energy reassignment, Geophysics, 68,679–684.
Ritzwoller, M.H. & Levshin, A.L., 1998. Eurasian surface wave tomography:group velocities, J. geophys. Res., 103, 4839–4878.
Ritzwoller, M.H., Shapiro, N.M., Barmin, M.P. & Levshin, A.L., 2002.Global surface wave diffraction tomography, J. geophys. Res., 107, 2335,doi:10.1029/2002JB001777.
Robertson, A.H.F., 2000. Mesozoic-Tertiary tectonic-sedimentary evo-lution of a South Tethyan oceanic basin and its margin in South-ern Turkey, in Tectonics and Magmatism in Turkey and the Sur-
rounding Area, Vol. 173, pp. 97–138, eds Bozkurt, E., Winchester,J.A. & Piper, J.D.A., Geological Society, Special Publications,London.
Robinson, A.G. (Ed.), 1997. Regional and Petroleum Geology of the BlackSea and Surrounding Region, Vol. 68, 385 pp. American Association ofPetroleum Geologists, Memoir, Tulsa, OK, USA.
Sandvol, E., Turkelli, N. & Barazangi, M., 2003. The Eastern Turkey Seis-mic Experiment: the study of a young continent—continent collision,Geophys. Res. Lett., 30(24), 8038, doi:10.1029/2003GL018912.
Saunders, P., Priestly, K. & Taymaz, T., 1998. Variations in thecrustal structure beneath Western Turkey, Geophys. J. Int., 134,373–389.
Seymen, I., 1984. Geological evolution of the metamorphic rocks of theKırsehir Massif (in Turkish). in Proceedings of the Ketin Symposium,pp. 133–148 , Geological Society, Ankara, Turkey.
Sodoudi, F. et al., 2006. Lithospheric structure of the Aegean obtainedfrom P and S receiver functions, J. geophys. Res., 111, B12307,doi:10.1029/2005JB003932.
Spadini, G., Robinson, A. & Cloetingh, S., 1996. Western versus EasternBlack Sea tectonic evolution: pre-rift lithospheric controls on basin for-mation, Tectonophysics, 266, 139–154.
Stampfli, G.M., 2000. Tethyan Oceans, in Tectonic and Magmatism inTurkey and the Surrounding Area, Vol. 173, eds Bozkurt, E., Winchester,J.A. & Piper, J.D.A., pp. 1–23, Geological Society, Special Publications,London.
Sengor, A.M.C. & Yılmaz, Y., 1981. Tethyan evolution of Turkey, a platetectonic approach, Tectonophysics, 75, 181–241.
Sengor, A.M.C., Yılmaz, Y. & Ketin, I., 1982. Remnants of apre-Late Jurassic ocean in northern Turkey, Fragments of Permo-Triassic Paleo-Tethys ?: reply, Geol. Soc. Am. Bull., 93, 932–936.
Sengor, A.M.C., Ozeren, S., Genc, T. & Zor, E., 2003. East Anatolian highplateau as a mantle-supported, N–S shortened domal structure, Geophys.Res. Lett., 30, 8044, doi:10.1029/2003GL017858.
Tatar O., Piper J.D. & Gursoy, H., 2000, “Paleomagnetic study of the Er-ciyes sector of the Ecemis Fault Zone: neotectonic deformation in thesoutheastern part of the anatolian Block,” in Tectonics and Magmatismin Turkey and the Surrounding Area, Vol. 173, pp. 423–440, eds Bozkurt,E., Winchester, J.A. & Piper, J.D.A., Geological Society, Special Publica-tions, London.
Trampert, J. & Woodhouse, J.H., 1995. Global phase velocity maps of Loveand Rayleigh waves between 40 and 150 seconds, Geophys. J. Int., 122,675–690.
Tsai, Y. & Aki, B.K., 1971. Amplitude spectra of surface waves from smallearthquakes and underground nuclear explosions, J. geophys. Res., 76,3940–3952.
Toprak, V. & Goncuoglu, M.C., 1993. Tectonic control on the developmentof the Neogene–Quaternary Central Anatolian volcanic province, Turkey.Geol. J., 28, 357–369.
Topuz, G., Altherr, R., Kalt, A., Satır, M., Werner, O. & Schwardz, W.H.,2004. Aluminus granulites from the Pulur complex, NE Turkey: a case ofpartial melting, efficient melt extraction and crystallization, Lithos, 72,183–207.
van Heijst, H.J. & Woodhouse, J., 1999. Global high-resolution phasevelocity distributions of overtone and fundamental-mode surfacewaves determined by mode branch stripping, Geophys. J. Int., 137,601–620.
Vdovin, O., Rial, J.A., Levshin, A.L. & Ritzwoller, M.H., 1999. Group veloc-ity tomography of South America and the surrounding oceans, Geophys.J. Int., 136, 324– 340.
Wessel, P. & Smith, W.H.F., 1998. New, improved version of GenericMapping Tools released, EOS, Trans. Am. geophys. Un., 79,579.
Woodhouse, J.H. & Dziewonski, A.M., 1984. Mapping the upper mantle:three-dimensional modeling of earth structure by inversion of seismicwavefroms, J. geophys. Res., 89, 5953–5986.
Yılmaz, Y., 1993. New evidence and model on the evolution of the southeastAnatolian orogen, Geol. Soc. Am. Bull., 105, 251–271.
C© 2010 The Authors, GJI
Journal compilation C© 2010 RAS
Love-wave group velocity maps 19
Yılmaz, Y., Guner Y. & Saroglu, F., 1998. Geology of the Quaternary vol-canic centers of the east Anatolia, J. Volc. Geotherm. Res., 85, 173–210.
Zhu, L., Mitchell, B.J., Akyol, N., Cemen, I. & Kekovali, K., 2006.Crustal thickness variations in the Aegean region and implicationsfor the extension of continental crust, J. geophys. Res., 111, B01301.doi:10.1029/2005JB003770.
Zor, E., Sandvol, E., Gurbuz, C., Turkeli, N., Seber, D. & Barazangi,M., 2003. The crustal structure of the East Anatolian Plateau(Turkey) from receiver functions, Geophys. Res. Lett., 30(24), 8044,doi:10.1029/2003GL018192.
Zor, E., Ozalaybey, S. & Gurbuz, C., 2006. The crustal structure of the East-ern Marmara Region (Turkey) by teleseismic receiver functions, Geophys.J. Int., 167, 213–222.
S U P P O RT I N G I N F O R M AT I O N
Additional Supporting Information may be found in the online ver-sion of this article:Figure S1. Examples of waveforms recorded at various distances(red) and reassigned multiple-filter analysis with picked dispersionvalues (blue marks).
Please note: Wiley-Blackwell are not responsible for the content orfunctionality of any supporting materials supplied by the authors.Any queries (other than missing material) should be directed to thecorresponding author for the article.
C© 2010 The Authors, GJI
Journal compilation C© 2010 RAS
Related Documents