Love or Money? The Effects of Owner Motivation in the California Wine Industry Fiona M. Scott Morton Joel M. Podolny Yale University and NBER Stanford University Box 208200, New Haven, CT 06520 Stanford, CA 94305-5015 [email protected] [email protected] September 2001 Abstract: Models that assume only consumer tastes determine the characteristics of supply are restrictive; producers can gain utility from aspects of production and pay for deviating from demand by accepting lower financial returns. We model and measure motivations of California winery owners, and analyze their effects on quality and price. We find utility-maximizers are more likely to produce high quality and set higher quality-adjusted prices. Profit-oriented owners are less likely to produce high quality wines. These results suggest that the presence of hobbyists who enjoy producing high quality may lower financial returns in the segment and discourage profit-maximizers from locating there. We thank Ben Polak, John Roberts, Scott Schaefer, lunch participants at Stanford GSB, and seminar participants at Chicago GSB, Cornell University, and the NBER Summer Institute IO Meetings for helpful comments. An anonymous referee and Pierre Regibeau improved the paper considerably. We are also grateful to the winery owners who shared their knowledge and insights with us. Fiona Scott Morton was partially supported by NSF grant SBR-9810178. 1

Welcome message from author
This document is posted to help you gain knowledge. Please leave a comment to let me know what you think about it! Share it to your friends and learn new things together.
Transcript

Love or Money? The Effects of Owner Motivation in the California Wine Industry
Fiona M. Scott Morton Joel M. Podolny Yale University and NBER Stanford University
Box 208200, New Haven, CT 06520 Stanford, CA 94305-5015 [email protected] [email protected]
September 2001
Abstract: Models that assume only consumer tastes determine the characteristics of supply are restrictive; producers can gain utility from aspects of production and pay for deviating from demand by accepting lower financial returns. We model and measure motivations of California winery owners, and analyze their effects on quality and price. We find utility-maximizers are more likely to produce high quality and set higher quality-adjusted prices. Profit-oriented owners are less likely to produce high quality wines. These results suggest that the presence of hobbyists who enjoy producing high quality may lower financial returns in the segment and discourage profit-maximizers from locating there.
We thank Ben Polak, John Roberts, Scott Schaefer, lunch participants at Stanford GSB, and seminar participants at Chicago GSB, Cornell University, and the NBER Summer Institute IO Meetings for helpful comments. An anonymous referee and Pierre Regibeau improved the paper considerably. We are also grateful to the winery owners who shared their knowledge and insights with us. Fiona Scott Morton was partially supported by NSF grant SBR-9810178.
1

I. Introduction
In a neoclassical model, firms supply those goods and services demanded by consumers. In many
markets, this description of the supply is not complete. Suppliers themselves may have preferences about what
to supply; that is, producers may get utility from certain characteristics of the product or production process. To
the extent these preferences deviate from consumer preferences, the owners will pay for this type of
consumption through a lower rate of return. For privately-owned firms, this is often quite feasible. For example,
professional sports teams, newspapers, art galleries, and wineries are often privately-owned by people who
enjoy some aspect of the product or production process. Integrating owner preferences into a study of the
supply-side of an industry enlarges the scope of Industrial Organization.
The typical assumption that the objective of the firm is pure profit-maximization seems justifiable on
evolutionary grounds. Because profit-maximization implies tremendous incentives to minimize costs, any firm
that does not behave as if it is a profit-maximizer may not be able to survive in the long-run. While this
evolutionary argument is not always explicitly invoked as justification for the assumption of profit-
maximization (see Alchian (1950) for an explicit statement), the essential claim has rich historical roots, dating
back to the classic writings of Smith, Marx, and Weber.
Our model allows owners to maximize utility, rather than profits. Any non profit-related motives an
owner has can raise a firm’s costs or create inefficiencies. However, an owner’s utility for the processes or
features of the firm that generate these costs or inefficiencies can compensate the owner for the lower financial
rate of return. For example, if the firm produces a high quality product, the owner may value the association
with the product. Or, if the firm’s activities further some social cause, the owner may derive utility from the
cause’s advancement. If the additional utility derived from the inefficient features of the firm is greater than the
disutility from the lower return, then the owner is willing to subsidize the firm and it can survive in the market.
In this paper we attempt to measure how much utility versus profit-maximization a firm’s owner
engages in, we discuss the type, extent, and implications of departures from the profit-maximization principle,
and then we empirically examine the behavioral consequences of utility-maximization. In the process, we gain
insight into the market consequences that result from the co-existence of utility- and profit-maximizing firms.
We begin with data on prices and characteristics of California wines and supplement it with a survey of
winery owners’ attitudes towards their firm and product. We find that many of the people owning and running
wineries in California have goals that depart from standard profit-maximization (PM). For example, 78% of our
respondents would be “somewhat” or “very” unlikely to sell their winery if they could get a higher return in the
stock market. Our model allows winery owners to care about the quality of their wine (separately from the effect
of quality on profits) and to gain utility from lifestyle expenditures that raise production costs.
2

We find that owners who derive strong non-financial returns from ownership charge more for their
product on a quality-adjusted basis. The price premium declines with the length of time the owner’s family has
owned the winery, which we interpret as evidence of learning-by-doing. Those same owners locate at the higher
end of the quality spectrum and are also unlikely to make the lowest quality wine. Owners who primarily care
about financial returns from their winery are less likely to produce high quality wine.
The results of the paper have implications for the equilibrium of the wine industry. Our first conclusion
is that utility-maximizing owners price higher, or more “softly,” and consequently one might expect the
existence of utility-maximizers to raise profits and attract entry, relative to a situation where utility-maximizers
were not in the industry. However, if utility-maximizing owners “oversupply” quality, they can drive down the
financial rate of return to producing high quality wine for any producer. The highest quality grape-growing land
is in relatively fixed supply. Utility-maximizers may be willing to bid for scarce high-quality inputs up to the
point justified by the sum of the financial and psychic returns.
The wine industry is not the only one in which we expect a significant proportion of owners to have
non-financial motivations. The owners of “Mom and pop” firms, family businesses, and larger private
businesses are not constrained by shareholders with a simple financial claim on the firm.1 Thus, while our focus
is on the wine industry, we believe that the findings of this paper have broader applicability.
The remainder of the paper will proceed as follows. A review of the existing literature is in Section II; a
discussion of the theoretical implications of this phenomenon is contained in Section III. Section IV describes
the data on California wines and the survey we designed and administered. It also discusses the general types of
owners we find in the industry. Section V tests the hypotheses on quality and price generated earlier in the
paper, and Section VI concludes.
II. Literature Review
Our interest in the market consequences of different objective functions than profit-maximization is
related to a number of distinct areas of research. For instance, there is a considerable literature on the differences
between and competition among for-profit and not-for-profit institutions such as hospitals and daycare centers.
(See Rose-Ackerman (1996) for a survey of nonprofit organizations and economic theory.) Rose-Ackerman
(1986) shows that nonprofit daycare centers produce high quality service, charge a low price and survive in a
competitive market because of donations. Customers queue for the right to purchase the nonprofit product, while
unmet demand patronizes the for-profit sector. Schiff and Weisbrod (1991) examine the issue of competition
1 The Family Business Center at Loyola University estimates that 80% of American businesses are privately owned. (Steinberg 1996). This estimate is most likely conservative. Eddy (1996) includes estimates that as much as 90% of
3

between nonprofit and for-profit organizations in ancillary commercial markets. In their model, nonprofits get
disutility from producing the ancillary commercial good, but produce it to earn profits to finance charitable
production. They find that the tax-free status of nonprofits causes distortions in the commercial market, and that
changes in donations will affect competition in the commercial market by causing nonprofits to compensate for
lost donations with commercial output.
Lakdawalla and Philipson (1998) try to explain the share of an industry that chooses nonprofit status. In
their setup, there is a limited supply of altruists in the world; altruists value the output of the firm as well as
profits, while traditional firms only value profits. As the level of available economic profit drops, the altruists
will give up the ability to distribute profits and choose to take nonprofit status because that frees up resources to
increase output. They find support for the comparative statics of their model in the US long-term care industry.
In Lakdawalla and Philipson (1998), Schiff and Weisbrod (1991), and our model, “altruists” can drive profit-
maximizing firms out of the industry if there are enough of them to satisfy demand.
Becker’s (1957) theoretical work on discrimination in labor markets is also related to our interest in the
market consequences of utility-maximizing firms. In contrast to the already mentioned research which uses
legal form of the organization to infer objective function, Becker allows employers (and consumers and
employees) to have individual tastes for discrimination. Firms that have tastes for discrimination against a
minority group will face higher total costs than firms that are not discriminatory.2
A second area of the literature that is closely related to our problem is analysis of worker-run firms. The
classic choice of objective function for a firm owned by its workers is income per worker (Ward (1958)).
Futagami and Okamura (1996) show that the labor-owned firm will use more capital-intensive technology and
produce more output than the profit-maximizing firm in a duopoly. Craig and Pencavel (1996, 1992) undertake
a similar project to ours by empirically examining worker-cooperative and profit-maximizing sawmills in the
Pacific Northwest. They find that when output prices change, cooperatives adjust wages more than for-profit
firms do. Traditional for-profit corporations are more likely to adjust working hours or employment with the
price of plywood.
While these lines of research document or postulate the existence of organizations with objective
functions that contain more than profits, or model competition between types, there is no work we know of that
attempts to measure directly owner motivations within one industry and then relate these motivations to
variations in market behavior. Our empirical work seeks to accomplish this for the California wine industry.
III. Theory
American business is private and as much as 40% to 60% of the U.S. Gross Domesic Product comes from privately owned enterprises. Prince (1996) reports that as many as 95% of U.S. businesses are family owned.
4

Potential entrants (owners) into the wine industry have varying levels of ability. This ability parameter,
α, determines a winery’s initial level of marginal cost of production; higher ability leads to lower marginal costs.
Starting a winery also requires paying a fixed entry cost. Some potential owners also enjoy (get utility from)
making wine. We will call these utility-maximizing owners, or UMs. We make an important assumption here,
which is consistent with our knowledge of the industry, that UM owners only get utility from producing good
quality wine. Because UM owners maximize total utility and not simply profits, UM owners are willing to
accept a lower financial return on their winery. 3 Profit-maximizing owners (PMs) care solely about financial
return from the winery.
One can immediately see that the entry decision will differ for the two types of owners. There will be a
cutoff level of ability α* below which a PM owner would earn negative profit if he entered. PMs with ability
levels below α* will choose to stay out. However, a UM owner with ability just below α* will enter because he
requires a lower rate of financial return. This owner’s net costs – financial and psychic – are lower than the costs
of an identical profit-maximizing firm. The entry of the UM will drive out a fraction of the marginal PM, who is
now making negative profits. Because the UM produces a smaller quantity than the PM, the substitution is not
one for one. Thus the entry of UMs increases the total number of firms in the industry. In addition, UMs will
only enter where they have an opportunity cost advantage, at the upper end of the quality spectrum. The first
important implication of the model is that UM owners will locate disproportionately at the high end of the
quality spectrum because they value producing quality separately from, and in addition to, profits.
We assume that competition in the wine industry is differentiated Bertrand. For example, one of two
bottles of the same quality level (no vertical differentiation) will generally be preferred by a consumer due to
personal taste (horizontal differentiation). Each producer faces a downward-sloping demand curve due to this
differentiation. The wine industry is an excellent example of a market in which small price differences can be
sustained in equilibrium due to heterogeneous tastes on the part of consumers for the wine, its label, the shape of
the bottle, etc. Entry will drive economic profit to zero for the marginal PM and below zero for the marginal
UM. We assume the relevant UMs have an existing stock of wealth out of which they can cover the losses of
their winery, should there be any.
We can combine our assumption about the ability of UM entrants and our assumption about competition
to generate our second prediction: UM owners will price higher, on a quality-adjusted basis, and sell somewhat
2 Managers have a legal obligation to maximize shareholder value, but may have personal incentives to utility-maximize; in this sense our work is related to the agency literature. 3 Our problem is also analogous to the compensating differential labor literature as in Weisbrod (1983). Suppose the manager of the winery were an employee instead of the owner, but this manager still gained utility from making good quality wine. One possible contract the owners might choose is to allow the manager to run the winery but lower his wage by an amount that makes him indifferent to his outside option. Naturally, this sort of contract is limited by the initial wealth of the manager. However, our interests in either case are policy changes due to the particular preferences of the manager-owner.
5

less than would an identical PM owner in the same market. The reason is that UM owners have, on average,
higher marginal costs because they have lower ability. These higher marginal costs cause owners to set higher
profit-maximizing prices. Ceteris paribus, this also leads to a lower quantity sold.
We assume that both UM and PM owners can reduce their marginal costs with experience producing
wine at their winery. Interviews with owners and general knowledge of the industry suggest that learning by
doing is likely to be an important part of wine-making. Because many aspects of making wine are not scientific,
but must be experienced, every owner is likely to be able to reduce costs over time. If learning by doing is
proportional to cost, UM owners (who begin with higher costs) can reduce costs more quickly with experience,
and will therefore have a larger reduction in their price premium over time than PM owners.4
It could also be the case that UM owners are more likely to have x-inefficiency in the management of
their winery. There are many tastes an owner could indulge that do not add to the value of the wine. For
example, the owner could live the life of a landowner engaging in rural and social pursuits in the company of
like-minded friends. Such an owner might tolerate some inefficiencies in running the winery that cater to that
lifestyle, such as paying employees more than marginal product, not exerting enough effort to reduce costs, or
continually interfering in the production process. This could generate higher marginal costs, perhaps without
any effect on quality.5 This cost structure would also produce higher quality adjusted prices and a lower quantity
sold. However, x-inefficiency by itself does not generate the learning by doing implication above, nor does it
predict location on the quality spectrum.
The arguments of an owner’s utility function are likely to be quite different in other industries; we are
not claiming that the specifics of the model above (quality and ability) apply to art galleries or other utility-
maximizing settings. For example, the owner of a magazine of opinion probably gets utility from higher
circulation figures for the magazine. We assume that quantity produced or sold is not an argument of a winery
owner’s utility function. Our interviews with owners did not ever indicate quantity was a goal. While an owner
4 A second plausible – and related – explanation is selection. Love owners who do not reduce costs and prices over time may exit and no longer be in the sample. However, we think selection should operate quite quickly, which is inconsistent with our small estimated interaction term. (See Table VII.) 5 Consider a model of x-inefficiency: There are two types of inputs the owner may value: quality, s, that consumers also value, and t (a wine-maker who has a French accent and costs more, but is not better than other wine-makers) that consumers do not value. A change in t does not alter the demand curve. α[g(s)+h(t)], represents the value of these benefits. PMs have α=0 while UMs have α=1. (h’(t)>0, h’’(t)<0, g’(s)>0, g’’(s)<0). The utility function of the owner is therefore:
U p s t q p s p g s h t C q p s s t( , , ) ( , ) ( ) ( )] ( ( , ), , )= ⋅ + + −α [ PM owners choose t=0 because t has a positive cost and does not increase revenue. However, the UM owner will invest in input t up to the point where marginal benefit equals marginal cost. A UM firm will have higher marginal costs than a PM firm, and will therefore charge a higher price relative to the wine’s merits and sell a smaller quantity than a PM owner. When the UM owner gets both a financial and private return on quality, he will invest more than is justified by the financial return alone. Thus we predict that UM owners will position their wines higher on the quality spectrum than PM owners. The three choice variables, price, quality expenditures, and lifestyle expenditures, will move together for UM owners if the utility function is supermodular. (Milgrom and Shannon (1994)) However, supermodularity is not necessary (although certainly sufficient) for the specific relationships above to be true.
6

wants to make enough wine to supply the restaurants, competitions, and friends he is anxious to impress; beyond
the small-scale production that can supply those parties, additional quantity does not increase private benefits.
In a world where suppliers have preferences, consumers face a different mix of products and product
characteristics than their own demand would generate in a neoclassical world. In addition, characteristics
“over”-supplied, or subsidized, by owners will fall in price relative to a world of pure profit-maximization. We
can see that the attractiveness of an industry for PM owners depends in part on the distribution of tastes across
UMs and consumers. If UMs provide daycare facilities in poor neighborhoods, PM demand from wealthy
neighborhoods is not affected. In contrast, if UM winemakers get utility from producing high quality, the high-
quality segment will be crowded with hobbyist suppliers. If consumers like the attribute too, then that same
space would normally be desirable for PMs. However, it may be sufficiently crowded with hobbyists that
positive financial returns are not attainable. This may be true despite relatively “soft” price competition from
UMs.
IV. Data
IV (i) Wine Data
The data on wine characteristics was collected by Beth Benjamin from the Bureau of Alcohol, Tobacco,
and Firearms, Wines and Vines Buyers Guide, Connoisseur's Guide, and other industry sources. The dataset has
complete information on California wines and wineries during the time period 1980-1990 (see Benjamin (1994)
for detailed information regarding collection of this data). A bottle of wine is described by its price, the year it
appears in Wines and Vines, vintage, grape varietal, the appellation on the label, the quality of the bottle and its
vintage, whether it is ready to drink, and a variety of characteristics of the winery producing the bottle. The
same bottle can appear in the data in more than one year; over time the bottle’s price and some other
characteristics (ready to drink, for example) may vary. Prices therefore belong to a bottle-calendar year
combination. Though the panel is not balanced, 71% of the observations describe a bottle that only appears
once, and 95% of observations describe bottles that appear three or fewer times.6 Price is taken from the
Connoisseurs’ Guide to California Wine; they report the suggested retail price of a bottle sold individually in a
particular year in California.7
6 The maximum number of times a bottle is surveyed is 8 out of 11 years; the bottles with over five showings comprise 1% of the dataset. 7 The Connoisseur’s Guide’s goal is to provide a price that will resemble what the reader encounters at the local wine store. The price they report is the actual price of the bottles they buy. Since the wines have just been released, they are not on sale. Occasionally, the Connoisseur’s Guide buys a bottle at a “discount” store, in which case they do not use the discounted price, but report the suggested retail price obtained from the winery. This winery suggested retail price is what a reputable wine store would usually charge.
7

A winery may produce many types of wine: wineries can produce different varietals under the same or
different labels (brands) that may reflect a particular quality positioning. The winery can also make multiple
products. Examples of popular products include table wine, dessert wine, sparkling wine, and brandy. The
average cost of a bottle in the dataset is $9.50; the minimum price is $2. The group of wines in the $2-$3.50
range includes many varietals: red table wine, zinfandel, cabernet sauvignon, and chenin blanc are the most
popular. The producers of these inexpensive wines include a range of producers such as Almaden, Beaulieu
Vineyards, Fetzer, Gallo, Glen Ellen, and Paul Masson. The most expensive wine in the dataset is Stag’s Leap
cabernet sauvignon which cost $75; other expensive wines in the dataset are produced by Heitz Cellar, Chateau
Woltner, Caymus, and Silver Oak Cellars. See Table A1 in the Appendix for means and standard deviations of
the variables in the wine dataset.
IV (ii) Survey Data
To determine the motivations of the owners in our dataset, we mailed a survey in January of 1997 to
each winery in the dataset for which we could find an address. A copy of the survey is located in the Appendix.
Approximately 13% of the wineries in the dataset were un-locatable; we searched in several data sources and if
we could not find an address, that winery did not get a survey. We asked the owner or majority partner of the
winery to fill out the survey and return it, which resulted in a total of 184 survey replies out of 411 mailed. We
received the replies in February-April of 1997. Our response rate is therefore 45%. Summary statistics for
surveys are in the Appendix in Table A2. We tried to construct questions that would get owners to quantify their
non-monetary benefits and describe what kinds of things the non-monetary benefits are. The replies indicate
there is a substantial amount of utility-maximizing behavior going on in the industry. 78% of owners would be
“somewhat” or “very” unlikely to sell their winery if they could get a higher return in the stock market. Almost
40% of respondents would lose over $10,000 to improve the quality of their wines. Although almost all
respondents aim to cover costs and earn some profit, less than half have a specific target rate of return in mind.
The mean respondent does between a quarter and a half of his socializing with “wine people.”
We assume the responses reflect actual preferences of the respondents. They were told the survey
contents would remain confidential, so unless they felt a need to convince the authors of their preferences, there
is no one to whom they could be sending a message.
Table Ia shows how different non-monetary benefits of owning a winery are correlated. Those who
socialize with “wine people” and list non-financial reasons for owning their winery are more likely to say that
an increase in resources would cause them to improve their winery. Being in business for the love of wine is
negatively correlated with the length of time the winery has been owned by the family. Feeling family
ownership of the winery is important is correlated with having a non-financial reason for owning the winery,
being unlikely to sell the winery for fair market value, and entertaining.
8
An owner’s view of Gallo seems to do a good job of capturing his general type. Gallo is the largest
winery in California and is known to be run in a professional manner that takes full advantage of its size and
market power, although it is family owned. The vast majority of the wines and spirits they produce are generally
regarded as being quite low quality, although the firm now makes some higher quality wines. Respondents who
rate Gallo as ‘a superior winery’ have owned their wineries longer, have a particular target rate of return in
mind, are not in the wine business for the lifestyle, and earn a significant portion of family income from their
winery.
We undertake a formal factor or “principal components” analysis to consolidate the data we gather in
the survey.8 The reason for this is that we have sixteen questions that are all trying to get at the same concept in
different ways. We suspect that the response to any one question does not fully capture the concept we are
interested in: the strength of the non-financial benefits from owning the winery. The intuition behind principal
components is to find (fewer) new variables that summarize an owner’s responses. The result of the factor
analysis will be two new variables that are correlated with the responses to the questions.
We perform a standard factor analysis to obtain six principal components and then rotate the
components using a varimax rotation. We use only two factors, those with the highest contribution to variance.
The factor loadings are presented in Table II. The first factor positively loads on entertaining, being willing to
lose money to improve quality, short ownership tenure, not having a particular rate of return in mind, being in
business for the love of wine, thinking that continuing family ownership of the winery is important, and
disliking Gallo. We call this the love factor; it is clearly picking up owners who derive substantial non-monetary
rewards from owning a winery. The second factor is complementary. It loads on entertaining also (including
business and community entertaining), being unwilling to lose money to improve quality, being willing to sell
the winery for a fair price, not socializing with “wine people,” not feeling it is important for the winery to stay in
the family, and undertaking little new investment if cash becomes available.9 This factor will be called the
money factor and summarizes a profit-maximizing and businesslike attitude on the part of owners.
Wineries that answered the survey clearly differ from wineries that did not. Principally, the non-
respondents are bigger; the mean storage capacity for a respondent is 705 (thousand gallons) versus 2337 for the
non-respondents. Kendall Jackson and Gallo did not return a survey. In terms of acreage, the respondents are
actually somewhat bigger (333 versus 181). These statistics suggest that the larger wineries producing the lowest
quality wines were less likely to answer; these wineries do not own their own land since the grapes they use are
a commodity, but their large scale of production requires more storage capacity. This group of wineries likely
contains the few public wineries that existed at the time. Additionally, we suspect that as wineries grow in size,
8 See Hotelling (1933) or Harman (1960) for an explanation of this technique. 9 This last correlation is likely due to the fact that a PM owner has access to capital markets and has therefore optimally improved his winery, whereas a UM owner might not be able to borrow for a project that will not yield adequate profits.
9
the use of professional management reduces the impact of owner preferences on particular operational choices.
Hence, the non-respondents may be a group of wineries with less variation in the characteristics we are
studying. However, mean price and quality ranking are almost equal across the two samples. Slight differences
exist in status, age, and availability; respondents are higher status (.53 v .48), older (31 v 21), and have slightly
less available wine (1.84 v 1.93). Distribution capabilities do not differ significantly across the two groups.
V. Empirical testing
V (i) Quality Choice
There are few exogenous features of a winery that predict quality, rather than being chosen
simultaneously with it. As a consequence, the quality regressions reported in Table III will be sparse. Bottle
quality is postulated to be a function of varietal (type of grape), vintage (year grape is grown), and appellation
(geographic source of grapes). Clearly a winery has no control over the weather, and in the short run,
particularly if it grows the majority of its own grapes, has less control over appellation and varietal selection.10
Winery age is also included as an explanatory variable. We use a random effects regression specification, which
allows the errors within a winery to be correlated.
Column one of the table includes answers to survey questions to see if these can predict bottle quality.
Two are significant at the five percent level, and the rest at 10 percent. Specification two includes love and
money rather than the raw survey answers and confirms the hypothesis of the theory section. The love factor
significantly increases the likelihood that a particular bottle will be high-quality wine. A one standard deviation
increase in love increases bottle quality by 3.3%. The money factor has a negative coefficient, but is not
statistically significant. Interestingly, the significant coefficients on owner motivations are conditional on
varietal choice. Since grape varietal is a choice variable in the medium to long run, this specification is a
relatively strong test. The next column shows similar results if the varietal dummy variables are ommitted.
However, removing appellation dummy variables considerably reduces the significance of love.
We also examine the determinants of a winery’s average, minimum, and maximum quality. The
variables are defined for a particular vintage year belonging to a particular winery. Average quality is not
weighted by volume or sales since we do not have that information. Only vintage dummy variables are included
since a winery’s average, best, or worst bottle in a given vintage could be one of a number of varietals or
appellations. In these regressions each winery-vintage has only one observation, so the number of observations
drops considerably. Average winery quality is again affected by the love factor, but its p-value is only 0.11. One
might think a winery’s minimum quality represents something about an owner’s taste and his or her willingness
10 Even when a winery purchases its grapes from a grower in another appellation region, the contracts for such purchases are typically of at least a three-year duration. Therefore, even if a winery does not use its own grapes, there are some constraints on the ability to chose an appellation.
10

to manufacture cheap products. Indeed, a one standard deviation increase in love increases the lowest quality a
winery will manufacture by 2.1% (while money is insignificant). Owners with substantial private benefits from
making wine are less willing to make low quality wines. The outcome is exactly reversed when predicting
maximum winery quality. A one standard deviation increase in the money factor lowers a winery’s maximum
quality by 3.5% (while love is insignificant).
The relationship documented in Table III can also be seen in the plot of average winery quality against
money shown in Figure 1. There is hardly any slope to the cluster of points. While the high quality and high
money quadrant is relatively empty, there are many owners who do not care about profits but do not seem to be
able to produce high quality either. Love is associated with high quality as can be seen in Figure 2. Here, as in
the regression, the correlation between winery quality and owner motivation is stronger.
--- place Figures 1 and 2 approximately here ---
We also expect to see winery owners who care more about financial returns being more likely to
compete in the low-end segment. We focus on the survey questions that most closely pick up an owners attitude
toward financial return. The question, ‘Do you have a specific rate of return in mind?’ is the best match for our
problem. We also include the other survey questions that particularly refer to financial conditions: ‘are you
willing to lose money to improve the quality of your wines?’ and ‘winery improvements would not be
undertaken with more resources’. Because we use many individual questions in this regression, including the
love factor would be redundant. Therefore we include questions that are correlated with love. Being unwilling to
sell the winery, wanting it to continue in the family, and being motivated by love of wine are in the
specification. These variables are used to explain whether or not the winery chooses to make a wine of quality
level zero, the minimum level. To test this proposition we use a random effects logit where the dependent
variable is a one if the winery chooses to make a wine of quality zero. The results are presented in Table IV.
Little attention to financial return decreases the probability of producing the lowest quality wines (p-value .08).
Having undertaken all desired improvements also raises the minimum quality choice of the winery, while older
wineries are more likely to produce the lowest quality wine.11
The implications of the dependence of quality choice on owner motivation are interesting. There are
some competitors who have a preference for the high quality segment of the market. We provide indirect
evidence that UMs are sacrificing financial returns to buy quality as a consumption good. Over-entry into the
11 The large positive demand shock for high quality wines in the late 80’s may have counteracted the crowding effect caused by utility-maximizing producers and raised the ex post return to producing high-quality wines. However, this shock was unanticipated and, because our sample ends in 1990, would only have affected prices for wines that had already been made.
11
high-quality end of the spectrum would lower returns to producers of high quality wines. We also find evidence
consistent with this, namely, PMs are less interested in occupying the high-quality segment.12
V(ii) Predicting Price
How should owner motivations affect price? Our theory predicts that quality-adjusted prices should fall
with marginal cost, or the owner’s ability parameter, α. This parameter is higher on average for UM owners,
whom we are able to identify from our survey. First we develop a specification that predicts price and compare
wineries that responded to the survey and those who didn’t. Secondly, we capture the broad types of owners
from the survey by including in the price regression the love and money variables constructed from the factor
analysis.
We use the natural log of price as the dependent variable. Several categories of fixed effects must be
included to pick up wine characteristics that strongly influence price. Varietal fixed effects control for different
prices attached to different species of grapes. Grapes differ in their difficulty and cost of cultivation and also in
their popularity. Vintage fixed effects are included because quality varies systematically across years, but is
more constant within years. Finally, there are of course year fixed effects to control for demand in any particular
year. We again use a random effects specification to allow the errors to be correlated within a winery. The
results are not surprising, so they are discussed only briefly and reported in Table V.
We expect price to be driven primarily by the quality of the wine. Quality is measured on different
dimensions by numerous variables in the dataset. The first quality variable is a numeric rating of bottle quality
from the Wines and Vines Buyers Guide that is an integer between zero and three inclusive. Although this
particular rating takes on only four values, we use it because of its complete coverage of varietals and the fact
that blind tasting determines the ratings.13 Secondly, the average quality rating of all the bottles produced by a
winery over the previous three years is also constructed. Other important quality variables are status and three
year average of winery status, which essentially measure the quality one would expect based on reading the
label. These were constructed by Benjamin and Podolny (1997) according to the deference ordering among the
appellations used on the labels of bottles of wine produced in California. A higher status appellation is one that a
12 The PMs most likely to remain in the high quality segment are those whose high quality wines create a positive externality for their lower quality wines. We test this idea by including variables measuring if a winery has a bottle on the shelf in the previous year of a higher or lower quality level. We find that higher “sister” products do create a positive externality on the price of the reference bottle, while lower sister products do not. The ‘sister’ premium is substantial (at the mean, approximately forty cents for each quality level difference) and could be a reason for a winery to continue to produce high-quality wines despite unremunerative direct financial returns. Large wineries will earn the premium on a greater volume of low quality wines and have distribution clout with supermarkets and other retailers that allows them to get a high-quality sister wine with low volume onto the shelf where it can be seen by and influence consumers. 13 The tasters taste different wines of the same vintage and variety at the same time, but do not know the identities of individual bottles.
12
winery chooses – over other options allowed by the grapes that compose the wine – to write on a label.14 Note
that status is picking up other aspects of quality than those measured in the simple rating above; the correlation
between status and tasting rating is only 0.15. However, over the longer term the two are more closely related; a
winery’s average tasting rating over three years and the average status of its bottles over three years have a
correlation coefficient of 0.59. The remaining quality variables include vintage and varietal, a rating of the
vintage, whether the wine is drinkable, whether or not the wine is considered to have a tannic character, and
whether the wine is irregular. Wines and Vines also notes if the wine is early maturing, whether the wine is
available, and whether it is ready to drink.
We would expect a winery’s marginal cost to affect its choice of an optimal price for a bottle of wine
when it faces a downward sloping demand curve.15 The most important determinant of costs observable to the
econometrician is the scale of production. There are several variables in the dataset that proxy for winery size,
although, unfortunately there is no direct measure of output or cases sold in a particular year. Vineyard acreage,
and storage capacity reflect size, and therefore economies on the manufacturing side.16 Additional economies of
distribution are picked up in several distribution and wholesaling variables (e.g. wholesale, export) that indicate
the firm has permission from ATF to ship the wine to different places. We also include number of brands (e.g.
Turning Leaf) because this might be another proxy for size, although we would expect costs to be higher as the
number of brands increases.
The effects of the variables on log price are reported in Table V. Because the tasting rating variable
takes on only four values, it is included as three separate quality dummies rather than as a continuous variable.
The results are what one would expect. Higher rated wines and higher status wines cost more. All the quality
coefficients show that price increases as quality increases except for the vintage rating, which has a negative and
significant coefficient. Ready to drink has a negative coefficient, which may be the cost to the buyer of not being
able to store the wine.17 The cost variables are largely insignificant, although they have the predicted signs.
However, larger wineries, measured by number of brands or acreage, charge less for their wines. The most
expensive varietals include the most popular grapes, Cabernet, Chardonnay, Merlot, and some others such as
14 See Benjamin and Podolny (1997) for a detailed discussion of the construction of the status variables and their implications for price and the returns to investments in quality. 15 Wineries are not tax shelters and never have been. However, before 1986 a vineyard was a tax shelter because it is agriculture. The farming cost of planting new vines could be immediately expensed, generating a loss for the vineyard that year even though the project as a whole might have positive net present value. The tax shelter reason for owning a vineyard has disappeared due to the tax reform act of 1986. As far as we can tell there is not really a reason to think that marginal costs differ across firms for tax reasons, for example. 16 Note that a winery makes wine and a vineyard grows grapes. A winery can be vertically integrated, leading to the usual results on relationship-specific investment in grape-growing by the vineyard. A winery could instead have a long term contract(s) with vineyard(s) or purchase grapes of any quality on the spot market. Hence acreage may be correlated with production but is not necessarily an accurate sign of production levels. 17 Ready to drink may also be picking up unobserved quality, since lower quality wines are not intended for storage and are always ready to drink.
13
Marsanne, Voigner, and Pinot Noir. Prices increase over the years in the dataset, particularly in the late 80’s.18
The age of the winery has a negative and significant coefficient; increasing age from zero to the mean of 23
years reduces price by 1.3%.
Note that the measures we have of scale are not measures of quantity. Unfortunately, the dataset does
not have production quantity information. Thus, the storage capacity and distribution variables actually measure
the size of the winery's operation, not its choice of quantity in response to price in a particular year.19
V(iii) The Effect of Preferences on Prices
Table VI reports the same price regression as Table V with the addition of love and money.20 Those
wineries scoring high on the love factor have higher prices, while the money factor has an insignificant effect on
price. This evidence is consistent with our theory that UMs have higher (marginal) costs than PMs. A one
standard deviation increase in the love factor increases a wine’s price by 3.4%, which is 36 cents for the mean
bottle of wine in the sample ($10.60). This result is the second major contribution of the paper. The coefficients
measuring quality do not change significantly from the previous specification. However, including owner
preferences makes age of winery insignificant.
It is possible that the love variable is picking up unobserved quality, which then drives price. In such a
case, the estimated coefficient on love will represent unobserved quality correlated with love rather than the
behavioral effect of those owners who love making wine. Note, however, that quality is well controlled for in
the regression; we have the quality rating variable, status of the label, three-year quality of winery, three-year
status of winery, vintage dummies, varietal dummies, tannic, and ready to drink, among other variables that all
measure aspects of the quality of the wine. We also include question 5 from the survey (“additional resources
would not cause winery improvements”) which is not an important component of love but will pick up any
unobserved quality. The only change is an increase in magnitude of the money coefficient, although it remains
statistically insignificant.21
18 An interesting feature of the results is the importance of the age of the vineyard, which is not present in the later years of the dataset. The effect of age on pricing is quite robust and is shaped like a sideways, backwards “s.” Prices increase steeply in age from zero up to ten or so, then there is a gentle dip that bottoms out at about 75 years, followed by an increase in price for older firms, catching up to the earlier peak at about age 120. Very new firms have no reputation among consumers and appear to charge an “introductory” price to build demand; wineries ten years old or less charge less for a bottle conditional on quality and scale of operation. Firms in their prime -- those between ten and 50 years old -- have the highest prices. 19 In addition, simultaneity between price and quantity is not a problem because of the nature of wine production, particularly at the top end. Producers presumably do make quantity choices based on current and expected prices, but by the time the wine is ready to be sold the demand curve has moved in unexpected ways (several years have gone by) and by then price cannot physically affect quantity provided. 20 We do not report the regression using the raw answers to the survey questions as the factors do a much better job explaining prices. 21 We also experimented with interactions between these variables and financial resources to reflect the situation where the owner has a preference for quality and additionally has sufficient wealth to carry out that preference. Importantly, the
14

We create a test for the presence of unobserved quality in an indirect manner. We examine how love and
money owners’ prices vary with the length of time they have owned their wineries. Our assumption is that two
owners with the same love score should have the same unobserved quality, regardless of the length of time each
has owned his winery. However, if there is learning by doing in the wine industry, we might expect marginal
costs to decline, and therefore the price premium to decline, with years of experience running the winery. We
interact the number of years the owner or his family has owned the winery with love and with money. To make
the experiment as clean as possible, we construct new love and money factors that are identical to the original
ones except they do not include the ownership years variable.22 Ownership years is included separately in the
regression. The third column of Table VI shows the results of the specification. The coefficient on years of
ownership is -.0031, which means that all wineries reduce quality adjusted prices with experience. The
important finding is that love owners show more strongly declining prices with the amount of time they have
owned the winery. Their coefficient is an additional significant -.0025. The main love coefficient is positive,
significant, and almost twice as large as in previous results.
These results imply that an owner who has just purchased his winery will price 5.5% higher than his PM
peers (60 cents on the average bottle). An owner with the mean number of years of experience (23) who raises
his love score by one standard deviation will price 2.0% higher (21 cents). The effect of increasing an owner’s
love score reaches zero at 36 years of ownership. Only 10% of the wineries in the sample have been owned by
the same family for longer than 36 years, so for the vast majority of owners, the net effect of the love variable is
positive. The love variable, therefore, does not seem to be measuring only unobserved quality. The main love
result may be unobserved quality, but the decline over time in love firms’ prices is most consistent with initially
high marginal costs.
Another alternative hypothesis we want to address is that hobbyist owners are selling their image and
story, rather than the quality of the wine. Buyers know the attitude of the owner, and they place a higher value
on wine produced by someone who shares their values. In our view, such an explanation for the price difference
is likely to apply to few consumers and few wineries since the explanation hinges on consumers having a
relatively intimate knowledge of the motivations of individual owners. Most consumers are not well-enough
informed to be paying for “values,” particularly in the face of advertising by PMs intent on convincing
consumers that they too have values.
In conclusion, we find evidence that owners with strong non-financial motivations choose higher prices
for their wines, controlling for quality. That price premium declines with the length of time the winery has been
in the owner’s family
coefficients on the love and money factors are almost entirely unchanged and continue to be significant regardless of the specification. 22 These factors are correlated .98 with the original ones and have nearly identical means and standard deviations.
15

VI. Conclusions
In this paper we argue that non-profit-maximizing organizations should be observed in a market
economy – despite higher costs – when production creates some sort of non-financial return for the firm’s
owner. In this paper we document several ways in which such owner motivation alters the policy choice of the
firm. We conclude that explicitly recognizing heterogeneity of objective functions among firms in an industry is
important in understanding outcomes such as quality provision and price. Our results have implications for
several areas of the economics literature. Producers who gain utility from some aspect of their product or
process supply more of those characteristics to the market than consumers would demand on their own. The
equilibrium relative price of those characteristics will be lower than in a world without the UM producers.
Consumers who happen to enjoy the same characteristics that producers value will be better off, since their
preferred goods will be “over” supplied. The mixture of goods we see in the economy will therefore not just be
driven by consumer tastes, but by producer tastes also.
Because we find that different types of owners systematically price differently and the type of owner is
correlated with the quality of the wine, ordinary hedonic regressions of wine prices will not be correct. A
standard hedonic pricing regression using data from wineries with different objective functions will consistently
mis-specify the cost of the features of a high quality bottle of wine. Further, our results are also relevant for the
traditional strategy literature; for example, the classic strategy of moving first with a large capacity in order to
deter entry by UM competitors will need to be re-evaluated. When competitors are not maximizing profit, they
will not respond according to the standard model.
The fact that UMs have a lower threshold for profits has clear and important implications for the
evolutionary argument to which we alluded at the outset. Rather than PMs driving UMs from the market or
selected market segments, the UMs end up being more “competitive” than their PM counterparts. An obvious
extension of this empirical research is to undertake a dynamic analysis of the entry and exit of firms, and see
how the motivations and wealth levels of owners explain operational choices of the firm over time. Another
interesting area for thought and future research lies in how motives of subsequent generations of owners differ
from the original owner and the implications for evolution of an industry.23 We suspect that this kind of research
project could be carried out in industries other than the wine industry. For example, opinion magazines, films,
bars, and horse-racing would also seem to be activities where a large proportion of owners derive utility from
some feature of the organization other than its level of profitability.
23 If non-financial benefits are not as strong (regression to the mean) for subsequent owners then the objective function of the organization will revert to profit maximization. This sort of pattern seems to describe entry in the software industry, for example, where founders have goals other than profit-maximization, but after selling to shareholders and professional management, the organization changes its behavior and maximizes profits.
16
References:
Alchian, Armen (1950) “Uncertainty, Evolution, and Economic Theory,” Journal of Political
Economy:58:3:211-221. Becker, Gary S. (1957) The Economics of Discrimination, University of Chicago Press, Chicago. Benjamin, Beth A. (1994) Identity Construction Through Collective Affiliation. PhD Dissertation. Stanford
University. Benjamin, Beth A. and Joel M. Podolny (1997) “Social Order and Status in the California Wine Industry”
RAND Corporation Working Paper. Cremer, Helmuth and Jacques Crémer (1992) “Duopoly with Employee-Controlled and Profit-Maximizing
Firms: Bertrand vs Cournot Competition” Journal of Comparative Economics:16:241-258. Craig, Ben and John Pencavel (1992) “The Behavior of Worker Cooperatives: The Plywood Companies of the
Pacific Northwest” American Economic Review :82:5:1083-1105. Eddy, Peg (1996) “Lessons, legends, and legacies: serving the family business” Journal of Financial Planning
9:76-79. Futagami, Koichi, and Makoto Okamura (1996) “Strategic Investment: The Labor-Managed Firm and the Profit-
Maximizing Firm” Journal of Comparative Economics:23:73-91. Hotelling, Harold (1933) “Analysis of a complex of statistical variables into principal components” Journal of
Educational Psychology:24:417-441, 498-520. Harman, Harry (1960) Modern Factor Analysis, University of Chicago Press, Chicago. Lakdawalla, Darius and Tomas Philipson (1998), “Nonprofit Production and Competition,” University of
Chicago manuscript. Milgrom, Paul and Chris Shannon (1994) “Monotone Comparative Statics” Econometrica: 62:1:157-180. Pencavel, John and Ben Craig (1994) “The Empirical Performance of Orthodox Models of the Firm:
Conventional Firms and Worker Cooperative” Journal of Political Economy: 102:4:718-44. Prince, Alan R. (1996) “Understanding the Eight Types of Business Owners” Trusts and Estates 135: 41-43 Rose-Ackerman, Susan (1986) “Altruistic Nonprofit Firms in Competitive Markets: The Case of Day-Care
Centers in the United States” Journal of Consumer Policy:9:291-310. Rose-Ackerman, Susan (1996) “Altruism, Nonprofits, and Economic Theory” Journal of Economic Literature:
34:701-728. Schiff, Jerald, and Burton Weisbrod (1991) “Competition between For-Profit and Nonprofit Organizations in
Commercial Markets,” Annals of Public and Cooperative Economics: 62: 4: 619-39. Steinberg, Carol (1996) “The Next Generation” Success 43:85-88.
17
Stewart, Geoff (1991) “Strategic Entry Interactions Involving Profit-Maximizing and Labour-Managed Firms”
Oxford Economic Papers:43:570-583. Stewart, Geoff (1992) “Management Objectives and Strategic Interactions among Capitalist and Labour-
Managed Firms” Journal of Economic Behavior and Organization:17:423-431. Weisbrod, Burton (1983) “Nonprofit and Proprietary Sector Behavior: Wage Differentials among Lawyers”
Journal of Labor Economics:1:3:246-63.
18

Table Ia: Correlations between Survey Variables and Correlations between Factors and Selected Variables
(*=significant at 5% level or better, N=172) 1tot 2 3 4 5 6 7 8b 9tot 9lv 9lf 9ot 10 11 12m 1tot 1 2 -.26* 1 3 -.13 .14 1 4 .14* -.11 -.14 1 5 .14 .04 -.09 -.07 1 6 -.12 -.03 -.02 .02 -.26* 1 7 -.08 -.04 .09 .18* -.01 -.03 1 8b .27* .02 -.01 -.01 .01 -.05 .00 1 9tot .19* .04 .11 .00 -.01 .12 -.06 .09 1 9lv .23* .02 .11 -.03 .01 .02 -.15* .13 .73* 1 9lf .22* .07 -.05 .12 .08 .10 -.02 .09 .66* .36* 1 9ot -.03 .02 .19* .12 -.19* .07 .06 .02 .42* .11 .00 1 10 .16* -.07 -.26* -.10 .11 -.03 -.12 -.02 -.17* -.15* .02 -.22* 1 11 .08 -.01 -.01 -.06 .02 -.11 -.21* -.00 -.08 -.15* -.06 -.03 .13 1 12m -.21* -.10 .11 -.05 .09 .08 .16* -.24* -.10 -.08 -.13 .04 -.13 -.12 1 12g -.10 -.05 -.04 -.02 .03 -.03 .25* -.26* -.13 -.12 -.18* .05 .07 -.15* .52* Love Money Price Quality Status Money -0.055 1 Price 0.137 -0.080 1 Quality 0.109 -0.084 0.342 1 Status -0.035 -0.107 0.175 0.152 1
All correlations significant at 1% or better except (love, status) at 4.5%. N=10341
Table Ib: Key for Table Ia
1tot Entertain business + entertain nonprofits + entertain wine people 2 willing to lose money for quality 3 unlikely to sell winery for fair value 4 Percentage of wines named after family. 5 Increases in resources would cause little additional investment in winery. 6 Amount of socializing with wine people 7 length of time owned winery. 8b no specific target rate of return in mind 9tot sum of motivations checked or written in. One point for each. 9lv Motivated by love of wine 9lf Motivated by lifestyle 9ot other non-financial reason for owning winery written in. 10 Continuing family ownership of winery unimportant 11 winery profits small part of family income. 12m Mondavi superior 12g Gallo superior
19

Table II: Factor Loadings
Survey Variable Love Money entertain wine community .202 .404 willing to lose money for quality .116 -.295 unlikely to sell winery for fair value .040 -.462 percentage of wines named after family. .006 .107 increases in resources would cause little additional investment in winery.
.005 .218
amount of socializing with wine people -.044 -.093 length of time have owned winery -.242 -.110 no specific target rate of return in mind .489 .049 motivated by love of wine .403 -.074 continuing family ownership of winery unimportant -.127 .461 winery profits small part of family income. -.009 -.001 Gallo superior -.499 .083
20

Table III: Random Effects Regression of Bottle and Vintage Quality Rating (rating takes on four values only, 0-3)
Dependent Variable:
Bottle Rating
Bottle Rating
Bottle Rating
Bottle Rating
Avg Winery Rating
Min Winery Rating
Max Winery Rating
Love Factor --- .160 * (.056)
.167 * (.055)
.109 (.060)
.091 (.057)
.100 * (.079)
.021 (.078)
Money Factor --- -.013 (.053)
-.013 (.052)
-.025 (.060)
-.035 (.056)
.037 (.046)
-.154 * (.076)
Willing to lose money for quality
.065 * (.031)
--- --- --- --- --- ---
Own winery because love wine
.146 * (.072)
--- --- --- --- --- ---
No further investment if more resources
.056 † (.032)
--- --- --- --- --- ---
Think Gallo is superior winery
-.027 † (.014)
--- --- --- --- --- ---
Age -.0015 † (.0009)
-.0013 (.0009)
-.0013 (.0009)
-.0013 (.0010)
-.0020 † (.0011)
-.0017 * (.0009)
-.0021 (.0015)
Varietal dummies? Yes yes no no no no no Vintage dummies? Yes yes yes yes yes yes yes Appellation dummies?
Yes yes yes no no no no
Random Winery Effects?
Yes yes yes yes yes yes yes
R-squared .153 .136 .124 .052 .083 .106 .077 Observations 2608 2608 2608 2608 807 807 807 The sample in columns 1 & 2 is bottle quality of respondents who owned their winery for the relevant observation. Average, minimum and maximum winery qualities are defined within a vintage. In columns 3-5 each winery-vintage combination that responded to the survey and owned the winery within three years after the vintage has one observation in the sample. * indicates significance at the 5% level or better. † indicates significance at the 10% level.
21
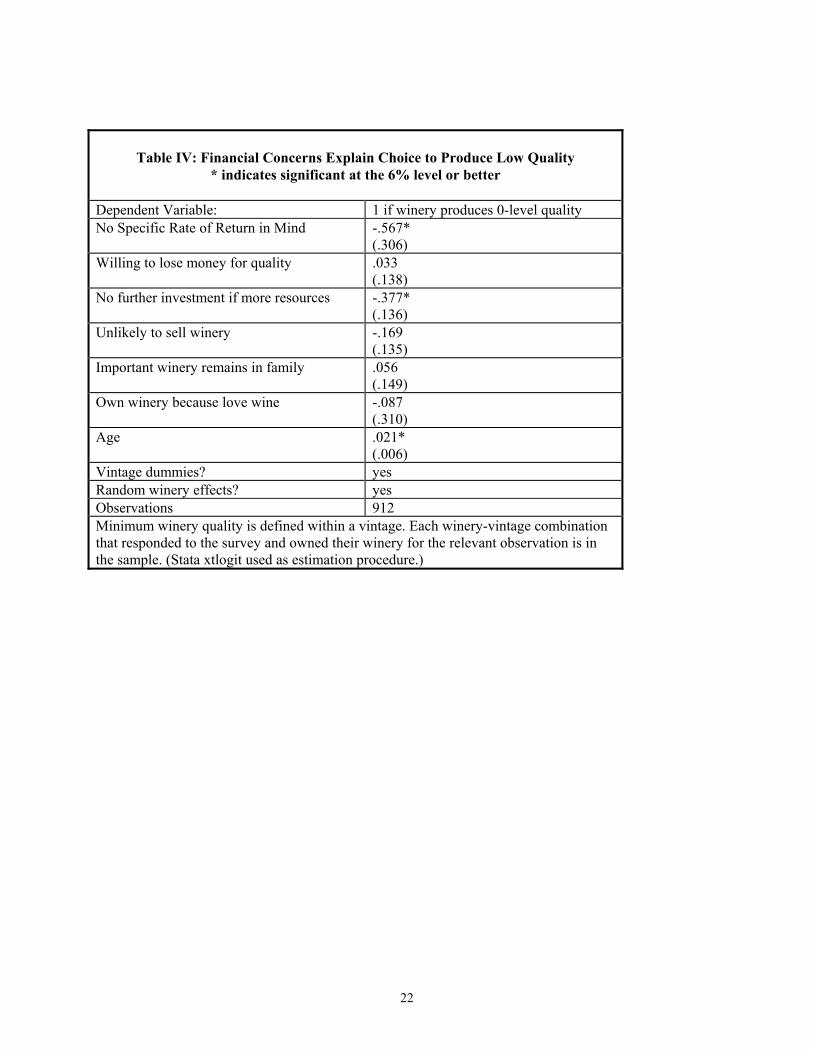
Table IV: Financial Concerns Explain Choice to Produce Low Quality
* indicates significant at the 6% level or better
Dependent Variable: 1 if winery produces 0-level quality No Specific Rate of Return in Mind -.567*
(.306) Willing to lose money for quality .033
(.138) No further investment if more resources -.377*
(.136) Unlikely to sell winery -.169
(.135) Important winery remains in family .056
(.149) Own winery because love wine -.087
(.310) Age .021*
(.006) Vintage dummies? yes Random winery effects? yes Observations 912 Minimum winery quality is defined within a vintage. Each winery-vintage combination that responded to the survey and owned their winery for the relevant observation is in the sample. (Stata xtlogit used as estimation procedure.)
22
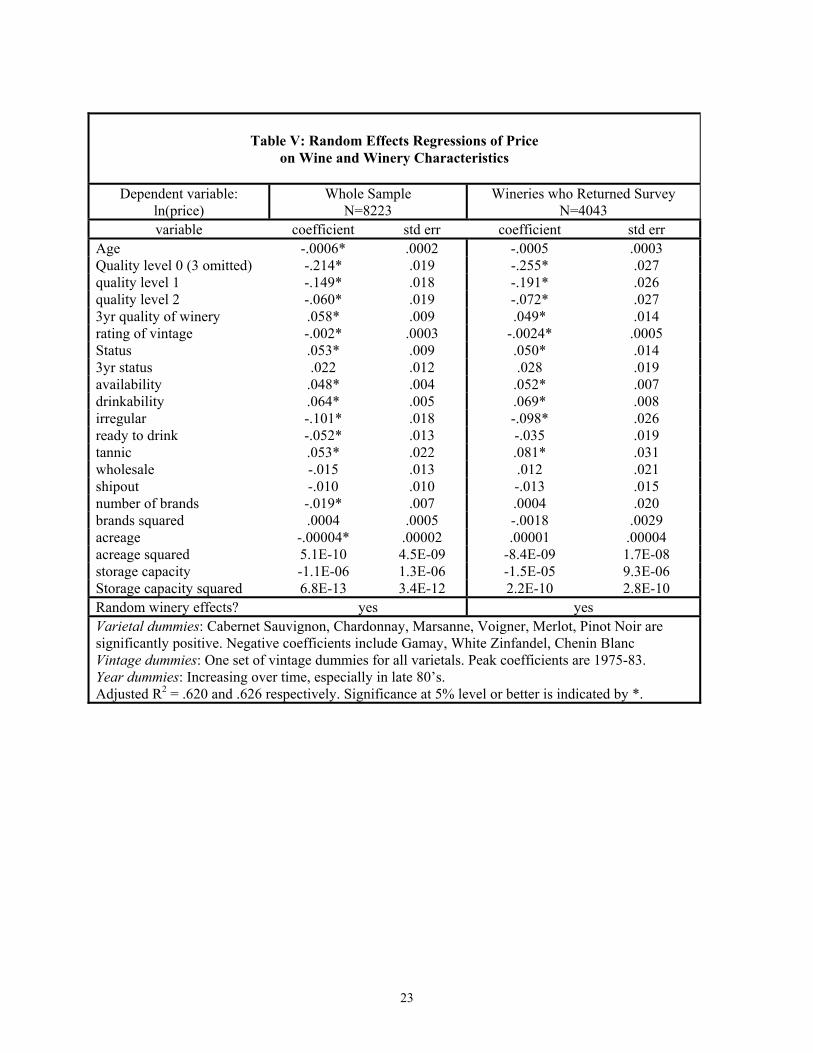
Table V: Random Effects Regressions of Price on Wine and Winery Characteristics
Dependent variable:
ln(price) Whole Sample
N=8223 Wineries who Returned Survey
N=4043 variable coefficient std err coefficient std err
Age -.0006* .0002 -.0005 .0003 Quality level 0 (3 omitted) -.214* .019 -.255* .027 quality level 1 -.149* .018 -.191* .026 quality level 2 -.060* .019 -.072* .027 3yr quality of winery .058* .009 .049* .014 rating of vintage -.002* .0003 -.0024* .0005 Status .053* .009 .050* .014 3yr status .022 .012 .028 .019 availability .048* .004 .052* .007 drinkability .064* .005 .069* .008 irregular -.101* .018 -.098* .026 ready to drink -.052* .013 -.035 .019 tannic .053* .022 .081* .031 wholesale -.015 .013 .012 .021 shipout -.010 .010 -.013 .015 number of brands -.019* .007 .0004 .020 brands squared .0004 .0005 -.0018 .0029 acreage -.00004* .00002 .00001 .00004 acreage squared 5.1E-10 4.5E-09 -8.4E-09 1.7E-08 storage capacity -1.1E-06 1.3E-06 -1.5E-05 9.3E-06 Storage capacity squared 6.8E-13 3.4E-12 2.2E-10 2.8E-10 Random winery effects? yes yes Varietal dummies: Cabernet Sauvignon, Chardonnay, Marsanne, Voigner, Merlot, Pinot Noir are significantly positive. Negative coefficients include Gamay, White Zinfandel, Chenin Blanc Vintage dummies: One set of vintage dummies for all varietals. Peak coefficients are 1975-83. Year dummies: Increasing over time, especially in late 80’s. Adjusted R2 = .620 and .626 respectively. Significance at 5% level or better is indicated by *.
23

Table VI: Random Effects Regression of Log Price on Factors
as well as wine and winery characteristics
Dependent variable: ln(bottle price) 1 2 3 Money Factor .0007
(.023) -.014 (.024)
.022 (.050)
Love Factor .054* (.024)
.051* (.024)
.091* (.036)
additional outside resources would not result in more winery investment
--- .029* (.015)
---
Money*Years Owned by Family --- --- -.0016* (.0019)
Love*Years Owned by Family --- --- -.0025* (.0013)
Years Owned by Family --- --- -.0031* (.0012)
Quality level 0
-.256* (.032)
-.255* (.033)
-.254* (.033)
Quality level 1
-.201* (.032)
-.200* (.032)
-.200* (.032)
Quality level 2
-.073* (.034)
-.072* (.034)
-.072* (.034)
Random winery effects? yes yes yes Adj. R2 N
.633 2567
.637 2567
.645 2567
Dollar change in mean bottle price when love increases by one standard deviation and years owned is 23 (mean).
+ $ 0.36
+ $ 0.34
+ $ 0.21
The full sample is respondents who owned their winery for the relevant observation. The sample size drops from Table III to this table because of missing observations. (love and money cannot be constructed if a survey is missing responses.) All explanatory variables from Table II are included in all regressions, but their coefficients are not reported to conserve space. The love and money factors in column 3 are constructed without family ownership years; it enters separately and in interactions with love and money. * indicates significant at the 5% level, two-tail test.
24

Figure 1A
vg Q
ua
lity
Winery Quality versus Money MotivationMoney Factor
-2 -1 0 1 2
0
.5
1
1.5
2
Figure 2
Avg
Qu
alit
y
Winery Quality versus Love MotivationLove Factor
-2 -1 0 1
0
.5
1
1.5
2
25

Appendix:
Table A1. Summary Statistics Dataset of California Wineries
Survey Respondents Full Sample Variable Mean Obs Mean Std. Dev. Min Max Obs price (nominal $) 10.7 4750 10.7 5.25 2 75 10079Quality .604 4885 .581 .759 0 3 103413-yr quality of winery .440 4885 .411 .452 0 3 10341Rating 58.0 4885 58.2 40.1 0 94 10341Status .528 4885 .501 .416 0 1 103413-yr status .423 4885 .388 .402 0 1 10341Availability 1.84 4885 1.89 .810 0 3 10341Drinkability 1.41 4885 1.40 .685 0 3 10341Irregular .252 4885 .263 .440 0 1 10341ready to drink .321 4885 .319 .466 0 1 10341Tannic .034 4885 .032 .176 0 1 10341Wholesale .788 4885 .768 .422 0 1 10341ship out of state .578 4885 .527 .499 0 1 10341Export .349 4885 .308 .462 0 1 10341number of brands 1.47 4810 1.47 1.18 1 21 9885number of products 1.30 4861 1.35 .856 1 10 10170Vineyard acreage 333 4885 253 570.6 0 6401 10341storage capacity (‘000 gal)
705 4885 1,570 16,300 0 430,000 10341
Age 31.4 4269 28.8 33.3 1 158 8930single owner .489 4885 .505 .500 0 1 10341multiple owners .413 4885 .386 .487 0 1 10341larger corporation .136 4885 .136 .343 0 1 10341 Table A2: Distribution of Observations across
Years Survey
Respondents* Full Sample
1981 443 1164 1982 416 1089 1983 194 489 1984 349 838 1985 489 1241 1986 456 1066 1987 534 1255 1988 484 1093 1989 388 940 1990 548 1166 * Survey respondents who report owning their winery in the relevant year.
26

Table A3: Summary Statistics for Surveys
# Question Upper limit
obs mean std dev min max
1a entertain- wine people Never 180 3.36 1.56 1 6 1b entertain- non-profits Never 180 4.22 1.37 1 6 1c entertain- business Never 180 4.24 1.65 1 6 2 lose $ for quality 1million 170 2.07 1.07 1 5 3 sell if higher return Unlikely 176 4.16 1.24 1 5 4 % wines family name 100% 176 2.97 2.23 1 6 5 invest more if richer None 177 2.19 1.12 1 4 6 % socialize w/wine 100% 178 4.12 1.37 1 7 7 years family owned -- 170 24.3 22.7 1 143 8 cover costs or profit? Profit 178 1.98 .149 1 2 8b target RoR? No 163 1.55 .499 1 2 9a motivation-lifestyle Yes 181 .558 .498 0 1 9b motivation-entertain Yes 181 .077 .267 0 1 9c motivation-community Yes 181 .309 .464 0 1 9d motivation-love wine Yes 181 .591 .463 0 1 9o motivation-other Wrote in 181 .448 .499 0 1 9t total nonfinancial motives Many 181 1.98 1.32 0 5 10 important family owned? No 170 1.85 1.04 1 4 11 profits big part of income Insignif 174 2.36 1.38 1 5 12g Gallo superior? Yes 165 5.92 2.56 1 10 12m Mondavi superior? Yes 166 7.87 1.64 2 10 12b Beringer superior? Yes 165 7.75 1.68 1 10 12s Sutter superior? Yes 147 5.61 2.51 1 10 14 copy of survey results? Yes 173 .86 .353 0 1 money factor 131 .019 .667 -1.36 2.24 love factor 131 .014 .672 -1.52 1.19
27

Stanford Business School Survey of Winery Owners Name of respondent: ______________________________________________ Title and Winery Name: _________________________________________________ Please provide current responses to the questions if your views have changed over time. 1. How often does your winery provide activities or a site for entertaining (either individually or in groups)? a) members of the wine community? (e.g growers, producers, buyers, service providers) at least several times a week several times a month once a month several times a year once a year never b) on behalf of local groups or non-profit organizations? at least several times a week several times a month once a month several times a year once a year never c) non-wine related business associates? (e.g. business lunches, meetings, events) at least several times a week several times a month once a month several times a year once a year never 2. Suppose that someone develops an innovation that would significantly improve the quality of the wines that you produce but is so costly you would lose money by purchasing the innovation. (The price of the innovation is greater than the improvement in wine quality is worth in the marketplace.) How much money would you be willing to lose on the investment in order to significantly improve the quality of your wines? None between $1 and $10,000 between $10,000 and $100,000 between $100,000 and $1,000,000 more than $1,000,000 3. Suppose you were offered a fair market value for your vineyard in cash and you knew you could earn a higher rate of return in the stock market. How likely is it that you would sell? Very likely somewhat likely neither likely nor unlikely
28

somewhat unlikely very unlikely 4. Approximately what percentage of your wines are named after your family? Less than 10% 10%-25% 26%-50% 51%-75% 75%-99% 100% 5. If your income or revenue from non-winery resources were suddenly bigger (times 10, for example) how much additional investment or improvements to your winery would you undertake? significant additional investment or improvement some additional investment or improvement a little additional investment or improvement additional resources would have no effect on winery investment or improvement 6. Which category below best reflects the percentage of your socializing in the last six months that has been with "wine people" and wine-related people? none less than 10% 10%-25% 26%-50% 51%-75% 75%-99% 100% 7. How long have you or your family owned your winery? ______________ years 8. What are your financial goals for your winery? a) cover costs b) cover costs and earn some profit If you answered b), do you have a rate of return in mind? yes no If so, what rate of return are you happy achieving? _________________ 9. Sometimes people have non-financial motives for owning a winery. Circle any of the following non-financial motives that are important to you. lifestyle associated with owning a vineyard being part of the wine community entertaining for non-wine-related business love of wine Are there any other important reasons why you own your vineyard? ____________ ___________________________________________________________________ 10. How important is it to you that your winery continue to be owned by a member of your family?
29
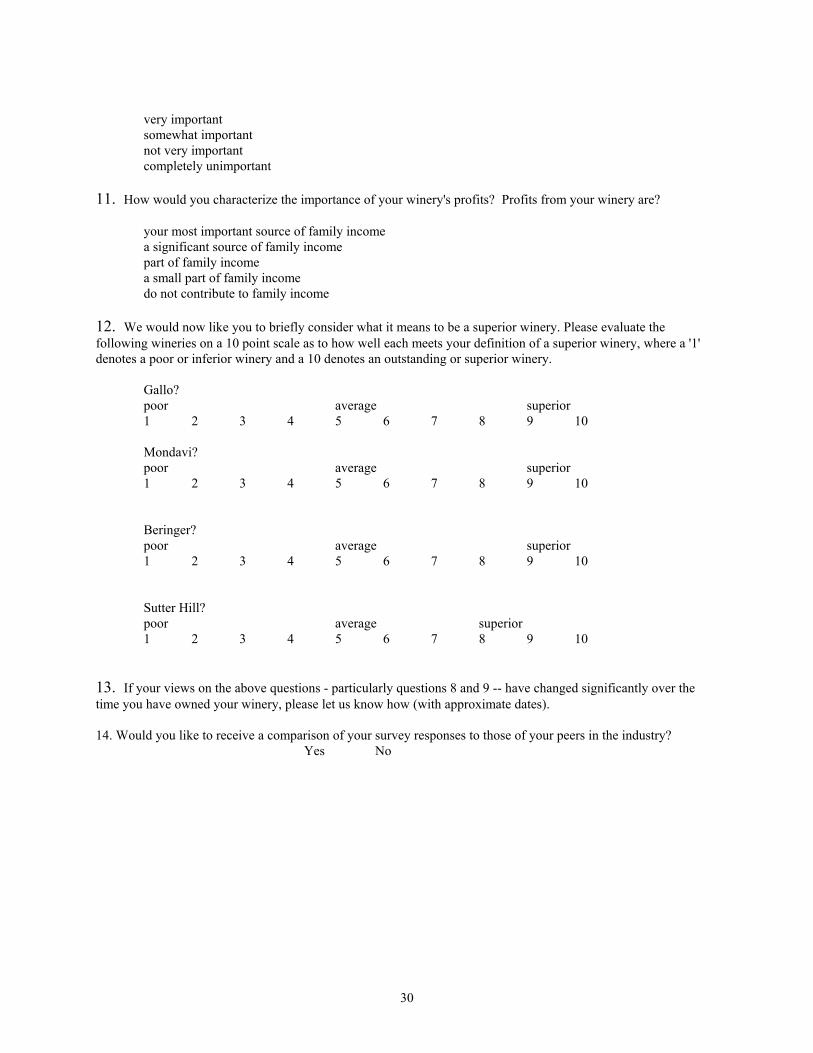
very important somewhat important not very important completely unimportant 11. How would you characterize the importance of your winery's profits? Profits from your winery are? your most important source of family income a significant source of family income part of family income a small part of family income do not contribute to family income 12. We would now like you to briefly consider what it means to be a superior winery. Please evaluate the following wineries on a 10 point scale as to how well each meets your definition of a superior winery, where a '1' denotes a poor or inferior winery and a 10 denotes an outstanding or superior winery. Gallo? poor average superior 1 2 3 4 5 6 7 8 9 10 Mondavi? poor average superior 1 2 3 4 5 6 7 8 9 10 Beringer? poor average superior 1 2 3 4 5 6 7 8 9 10 Sutter Hill? poor average superior 1 2 3 4 5 6 7 8 9 10 13. If your views on the above questions - particularly questions 8 and 9 -- have changed significantly over the time you have owned your winery, please let us know how (with approximate dates). 14. Would you like to receive a comparison of your survey responses to those of your peers in the industry? Yes No
30
Related Documents


