Long-term reliability of the Athabasca River (Alberta, Canada) as the water source for oil sands mining David J. Sauchyn a,1 , Jeannine-Marie St-Jacques a , and Brian H. Luckman b a Prairie Adaptation Research Collaborative, University of Regina, Regina, SK, Canada S4S 0A2; and b Department of Geography, University of Western Ontario, London, ON, Canada N64 5C2 Edited by Daniel L. Peters, Environment Canada, Water and Climate Impacts Research Centre, University of Victoria, Victoria, British Columbia, Canada, and accepted by the Editorial Board August 7, 2015 (received for review May 18, 2015) Exploitation of the Alberta oil sands, the world’s third-largest crude oil reserve, requires fresh water from the Athabasca River, an allo- cation of 4.4% of the mean annual flow. This allocation takes into account seasonal fluctuations but not long-term climatic variability and change. This paper examines the decadal-scale variability in river discharge in the Athabasca River Basin (ARB) with (i ) a gener- alized least-squares (GLS) regression analysis of the trend and var- iability in gauged flow and (ii ) a 900-y tree-ring reconstruction of the water-year flow of the Athabasca River at Athabasca, Alberta. The GLS analysis removes confounding transient trends related to the Pacific Decadal Oscillation (PDO) and Pacific North American mode (PNA). It shows long-term declining flows throughout the ARB. The tree-ring record reveals a larger range of flows and sever- ity of hydrologic deficits than those captured by the instrumental records that are the basis for surface water allocation. It includes periods of sustained low flow of multiple decades in duration, sug- gesting the influence of the PDO and PNA teleconnections. These results together demonstrate that low-frequency variability must be considered in ARB water allocation, which has not been the case. We show that the current and projected surface water allocations from the Athabasca River for the exploitation of the Alberta oil sands are based on an untenable assumption of the representative- ness of the short instrumental record. paleohydrology | statistical hydrology | oil sands | Alberta | climate variability O ver the past several decades, the province of Alberta has had Canada’s fastest growing economy, driven largely by the production of fossil fuels. Climatic change, periodic drought, and expanding human activities impact the province’s water re- sources, creating the potential for an impending water crisis (1). The Athabasca River (Fig. 1) is the only major river in Alberta with completely unregulated flows. It is the source of surface water for the exploitation of the Alberta oil sands, the world’s third-largest proven crude oil reserve at roughly 168 billion barrels. The oil and gas industry accounted for 74.5% of total surface water allocations in the Athabasca River Basin (ARB) in 2010 (Fig. 2) (2). An almost doubling of ARB water allocations since 2000, or 13 times the provincial average, is attributable to expanding oil sands production, which began in 1967 (Fig. 2). According to the Canadian Association of Petroleum Pro- ducers, in 2012, surface mining of the oil sands and in situ ex- traction (drilling) required 3.1 and 0.4 barrels of fresh water, respectively, to produce a barrel of crude oil (3). This amounted to 187 million cubic meters of fresh water use in 2012, or the equivalent of the residential water use of 1.7 million Canadians (4). Within the next decade, cumulative water use for oil sands production is projected to peak at about 505 million cubic meters per year or a rate of 16 m 3 ·s −1 (5). The current (2010 data) total water allocation represents only 4.4% of the mean annual Athabasca River flow (2) (Fig. 3); however, allocation and use as a proportion of average water levels does not account for the large variability in flow between seasons and years (interannual coefficient of variation = 22%). During 1952–2013, the Athabasca River gauge at Athabasca recorded mean seasonal flows of 100 m 3 · s −1 in winter (December−February) and 911 m 3 ·s −1 in summer (June−August), with extreme monthly flows of 48 m 3 · s −1 in Decem- ber 2000 and 2,280 m 3 · s −1 in June 1954. The mean, maximum, and minimum annual flows were 422 m 3 · s −1 , 702 m 3 · s −1 , and 245 m 3 · s −1 , respectively (Water Survey of Canada, wateroffice.ec.gc.ca/search/ search_e.html?sType=h2oArc). Assessing the sustainability of ARB surface water availability is difficult because most regional streamflow gauges have been operational for a few years to a few decades, with long intervals of missing values, including during the 1930s and 1940s when drought was prevalent throughout the North American western interior. Various critics (e.g., ref. 4) emphasize the intraannual variability and express concern about water withdrawals in the low-flow winter season. Less attention has been given to flow variability at interannual to decadal scales associated with cli- mate oscillations such as the Pacific Decadal Oscillation (PDO) and Pacific North American mode (PNA), which are known to have significant impacts on runoff from the Rocky Mountains, including in the ARB (6–9), and the potential consequences of a long period of predominantly low flow. We investigate the response of ARB flows to the low-frequency components of the PDO and PNA. This paper is the first, to our knowledge, to explicitly model the variability linked to the PDO and PNA, when testing for trends in discharge, thereby removing the ten- dencies associated with these climatic oscillations, which can confound trend detection in the relatively short instrumental records (6, 7). However, the available instrumental hydrologic records provide a limited sample of these low-frequency fluctu- ations; exploring longer records of this variability is critical. Therefore, we also reconstructed the Athabasca River annual flow from the growth rings in moisture-sensitive conifers at a network of sites in the upper reaches of the ARB and in an adjacent watershed (Fig. S1). We compare 900 y of inferred Significance We show that current and projected surface water allocations from the Athabasca River, Alberta, Canada, for the exploitation of the Alberta oil sands are based upon an untenable assump- tion of the representativeness of the short instrumental gauge record. Our trend analysis of the instrumental data shows de- clining regional flows. Our tree-ring reconstruction shows pe- riods of severe and prolonged low flows not captured by the instrumental record. Author contributions: D.J.S. designed research; D.J.S. and J.-M.St-J. performed research; D.J.S., J.-M.St-J., and B.H.L. analyzed data; and D.J.S. and J.-M.St-J. wrote the paper. The authors declare no conflict of interest. This article is a PNAS Direct Submission. D.L.P. is a guest editor invited by the Editorial Board. Freely available online through the PNAS open access option. 1 To whom correspondence should be addressed. Email: [email protected]. This article contains supporting information online at www.pnas.org/lookup/suppl/doi:10. 1073/pnas.1509726112/-/DCSupplemental. www.pnas.org/cgi/doi/10.1073/pnas.1509726112 PNAS | October 13, 2015 | vol. 112 | no. 41 | 12621–12626 EARTH, ATMOSPHERIC, AND PLANETARY SCIENCES

Welcome message from author
This document is posted to help you gain knowledge. Please leave a comment to let me know what you think about it! Share it to your friends and learn new things together.
Transcript
Long-term reliability of the Athabasca River (Alberta,Canada) as the water source for oil sands miningDavid J. Sauchyna,1, Jeannine-Marie St-Jacquesa, and Brian H. Luckmanb
aPrairie Adaptation Research Collaborative, University of Regina, Regina, SK, Canada S4S 0A2; and bDepartment of Geography, University of WesternOntario, London, ON, Canada N64 5C2
Edited by Daniel L. Peters, Environment Canada, Water and Climate Impacts Research Centre, University of Victoria, Victoria, British Columbia, Canada, andaccepted by the Editorial Board August 7, 2015 (received for review May 18, 2015)
Exploitation of the Alberta oil sands, the world’s third-largest crudeoil reserve, requires fresh water from the Athabasca River, an allo-cation of 4.4% of the mean annual flow. This allocation takes intoaccount seasonal fluctuations but not long-term climatic variabilityand change. This paper examines the decadal-scale variability inriver discharge in the Athabasca River Basin (ARB) with (i) a gener-alized least-squares (GLS) regression analysis of the trend and var-iability in gauged flow and (ii) a 900-y tree-ring reconstruction ofthe water-year flow of the Athabasca River at Athabasca, Alberta.The GLS analysis removes confounding transient trends relatedto the Pacific Decadal Oscillation (PDO) and Pacific North Americanmode (PNA). It shows long-term declining flows throughout theARB. The tree-ring record reveals a larger range of flows and sever-ity of hydrologic deficits than those captured by the instrumentalrecords that are the basis for surface water allocation. It includesperiods of sustained low flow of multiple decades in duration, sug-gesting the influence of the PDO and PNA teleconnections. Theseresults together demonstrate that low-frequency variability must beconsidered in ARB water allocation, which has not been the case.We show that the current and projected surface water allocationsfrom the Athabasca River for the exploitation of the Alberta oilsands are based on an untenable assumption of the representative-ness of the short instrumental record.
paleohydrology | statistical hydrology | oil sands | Alberta |climate variability
Over the past several decades, the province of Alberta hashad Canada’s fastest growing economy, driven largely by the
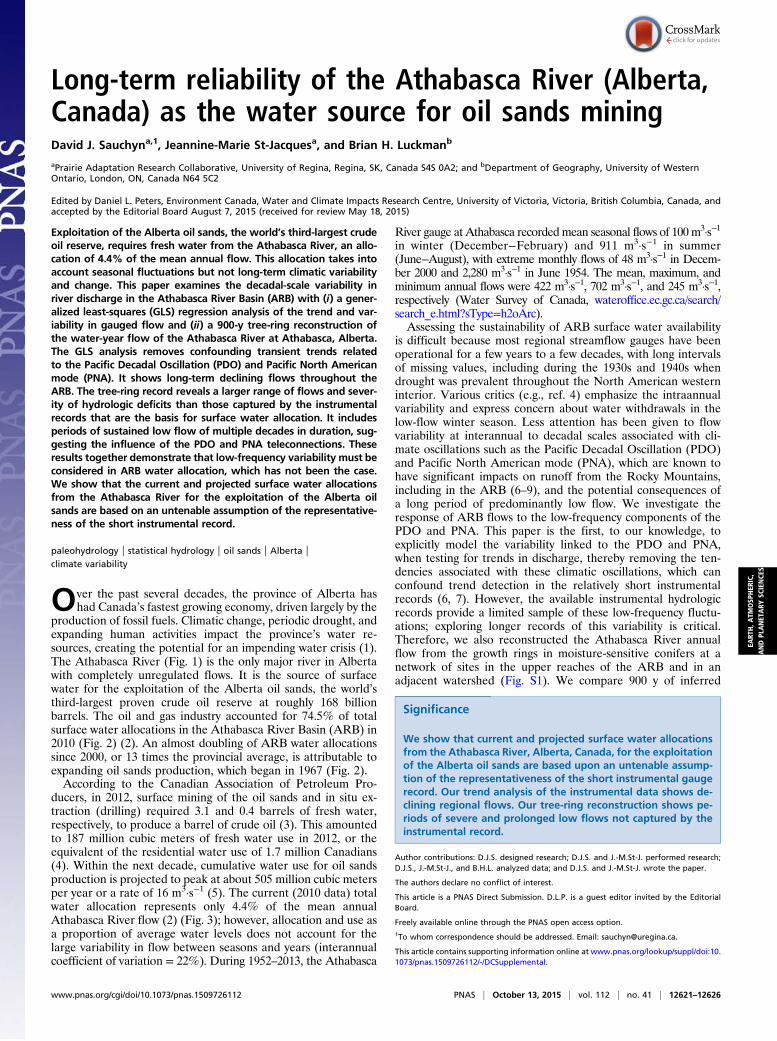
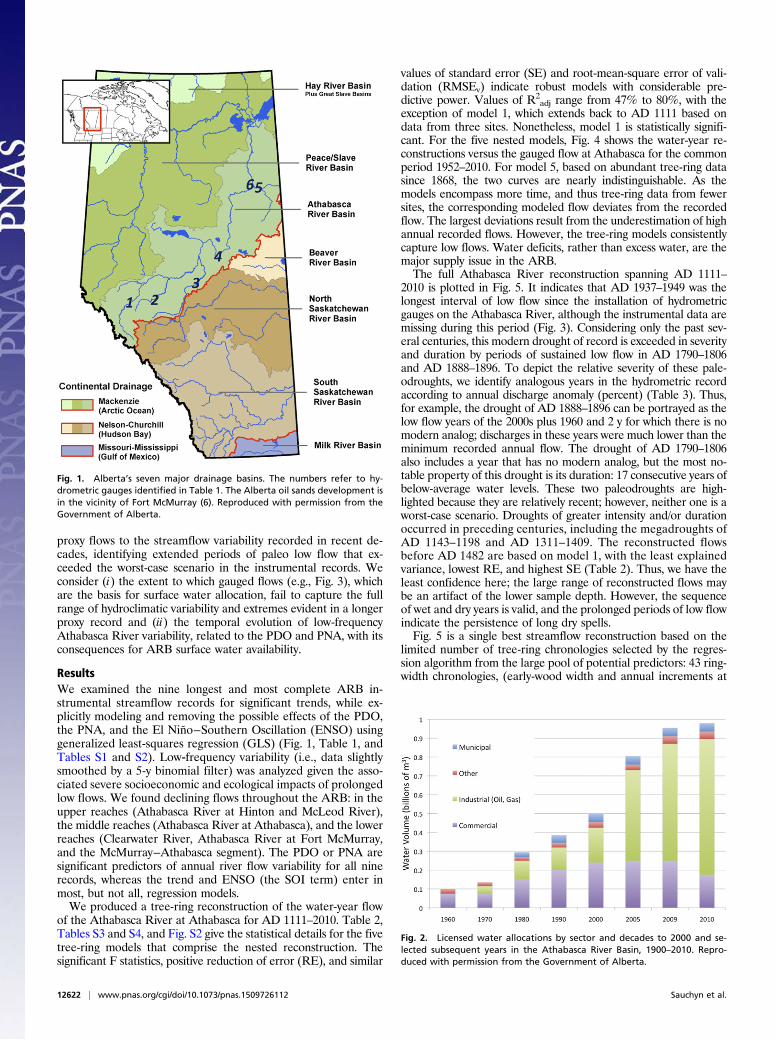
production of fossil fuels. Climatic change, periodic drought, andexpanding human activities impact the province’s water re-sources, creating the potential for an impending water crisis (1).The Athabasca River (Fig. 1) is the only major river in Albertawith completely unregulated flows. It is the source of surfacewater for the exploitation of the Alberta oil sands, the world’sthird-largest proven crude oil reserve at roughly 168 billionbarrels. The oil and gas industry accounted for 74.5% of totalsurface water allocations in the Athabasca River Basin (ARB) in2010 (Fig. 2) (2). An almost doubling of ARB water allocationssince 2000, or 13 times the provincial average, is attributable toexpanding oil sands production, which began in 1967 (Fig. 2).According to the Canadian Association of Petroleum Pro-
ducers, in 2012, surface mining of the oil sands and in situ ex-traction (drilling) required 3.1 and 0.4 barrels of fresh water,respectively, to produce a barrel of crude oil (3). This amountedto 187 million cubic meters of fresh water use in 2012, or theequivalent of the residential water use of 1.7 million Canadians(4). Within the next decade, cumulative water use for oil sandsproduction is projected to peak at about 505 million cubic metersper year or a rate of 16 m3·s−1 (5). The current (2010 data) totalwater allocation represents only 4.4% of the mean annualAthabasca River flow (2) (Fig. 3); however, allocation and use asa proportion of average water levels does not account for thelarge variability in flow between seasons and years (interannualcoefficient of variation = 22%). During 1952–2013, the Athabasca
River gauge at Athabasca recordedmean seasonal flows of 100 m3·s−1
in winter (December−February) and 911 m3·s−1 in summer(June−August), with extreme monthly flows of 48 m3·s−1 in Decem-ber 2000 and 2,280 m3·s−1 in June 1954. The mean, maximum, andminimum annual flows were 422 m3·s−1, 702 m3·s−1, and 245 m3·s−1,respectively (Water Survey of Canada, wateroffice.ec.gc.ca/search/search_e.html?sType=h2oArc).Assessing the sustainability of ARB surface water availability
is difficult because most regional streamflow gauges have beenoperational for a few years to a few decades, with long intervalsof missing values, including during the 1930s and 1940s whendrought was prevalent throughout the North American westerninterior. Various critics (e.g., ref. 4) emphasize the intraannualvariability and express concern about water withdrawals in thelow-flow winter season. Less attention has been given to flowvariability at interannual to decadal scales associated with cli-mate oscillations such as the Pacific Decadal Oscillation (PDO)and Pacific North American mode (PNA), which are known tohave significant impacts on runoff from the Rocky Mountains,including in the ARB (6–9), and the potential consequences ofa long period of predominantly low flow. We investigate theresponse of ARB flows to the low-frequency components of thePDO and PNA. This paper is the first, to our knowledge, toexplicitly model the variability linked to the PDO and PNA,when testing for trends in discharge, thereby removing the ten-dencies associated with these climatic oscillations, which canconfound trend detection in the relatively short instrumentalrecords (6, 7). However, the available instrumental hydrologicrecords provide a limited sample of these low-frequency fluctu-ations; exploring longer records of this variability is critical.Therefore, we also reconstructed the Athabasca River annualflow from the growth rings in moisture-sensitive conifers at anetwork of sites in the upper reaches of the ARB and in anadjacent watershed (Fig. S1). We compare 900 y of inferred
Significance
We show that current and projected surface water allocationsfrom the Athabasca River, Alberta, Canada, for the exploitationof the Alberta oil sands are based upon an untenable assump-tion of the representativeness of the short instrumental gaugerecord. Our trend analysis of the instrumental data shows de-clining regional flows. Our tree-ring reconstruction shows pe-riods of severe and prolonged low flows not captured by theinstrumental record.
Author contributions: D.J.S. designed research; D.J.S. and J.-M.St-J. performed research;D.J.S., J.-M.St-J., and B.H.L. analyzed data; and D.J.S. and J.-M.St-J. wrote the paper.
The authors declare no conflict of interest.
This article is a PNAS Direct Submission. D.L.P. is a guest editor invited by the EditorialBoard.
Freely available online through the PNAS open access option.1To whom correspondence should be addressed. Email: [email protected].
This article contains supporting information online at www.pnas.org/lookup/suppl/doi:10.1073/pnas.1509726112/-/DCSupplemental.
www.pnas.org/cgi/doi/10.1073/pnas.1509726112 PNAS | October 13, 2015 | vol. 112 | no. 41 | 12621–12626
EART
H,A
TMOSP
HER
IC,
ANDPL
ANET
ARY
SCIENCE
S
proxy flows to the streamflow variability recorded in recent de-cades, identifying extended periods of paleo low flow that ex-ceeded the worst-case scenario in the instrumental records. Weconsider (i) the extent to which gauged flows (e.g., Fig. 3), whichare the basis for surface water allocation, fail to capture the fullrange of hydroclimatic variability and extremes evident in a longerproxy record and (ii) the temporal evolution of low-frequencyAthabasca River variability, related to the PDO and PNA, with itsconsequences for ARB surface water availability.
ResultsWe examined the nine longest and most complete ARB in-strumental streamflow records for significant trends, while ex-plicitly modeling and removing the possible effects of the PDO,the PNA, and the El Niño−Southern Oscillation (ENSO) usinggeneralized least-squares regression (GLS) (Fig. 1, Table 1, andTables S1 and S2). Low‐frequency variability (i.e., data slightlysmoothed by a 5-y binomial filter) was analyzed given the asso-ciated severe socioeconomic and ecological impacts of prolongedlow flows. We found declining flows throughout the ARB: in theupper reaches (Athabasca River at Hinton and McLeod River),the middle reaches (Athabasca River at Athabasca), and the lowerreaches (Clearwater River, Athabasca River at Fort McMurray,and the McMurray−Athabasca segment). The PDO or PNA aresignificant predictors of annual river flow variability for all ninerecords, whereas the trend and ENSO (the SOI term) enter inmost, but not all, regression models.We produced a tree-ring reconstruction of the water-year flow
of the Athabasca River at Athabasca for AD 1111–2010. Table 2,Tables S3 and S4, and Fig. S2 give the statistical details for the fivetree-ring models that comprise the nested reconstruction. Thesignificant F statistics, positive reduction of error (RE), and similar
values of standard error (SE) and root-mean-square error of vali-dation (RMSEv) indicate robust models with considerable pre-dictive power. Values of R2
adj range from 47% to 80%, with theexception of model 1, which extends back to AD 1111 based ondata from three sites. Nonetheless, model 1 is statistically signifi-cant. For the five nested models, Fig. 4 shows the water-year re-constructions versus the gauged flow at Athabasca for the commonperiod 1952–2010. For model 5, based on abundant tree-ring datasince 1868, the two curves are nearly indistinguishable. As themodels encompass more time, and thus tree-ring data from fewersites, the corresponding modeled flow deviates from the recordedflow. The largest deviations result from the underestimation of highannual recorded flows. However, the tree-ring models consistentlycapture low flows. Water deficits, rather than excess water, are themajor supply issue in the ARB.The full Athabasca River reconstruction spanning AD 1111–
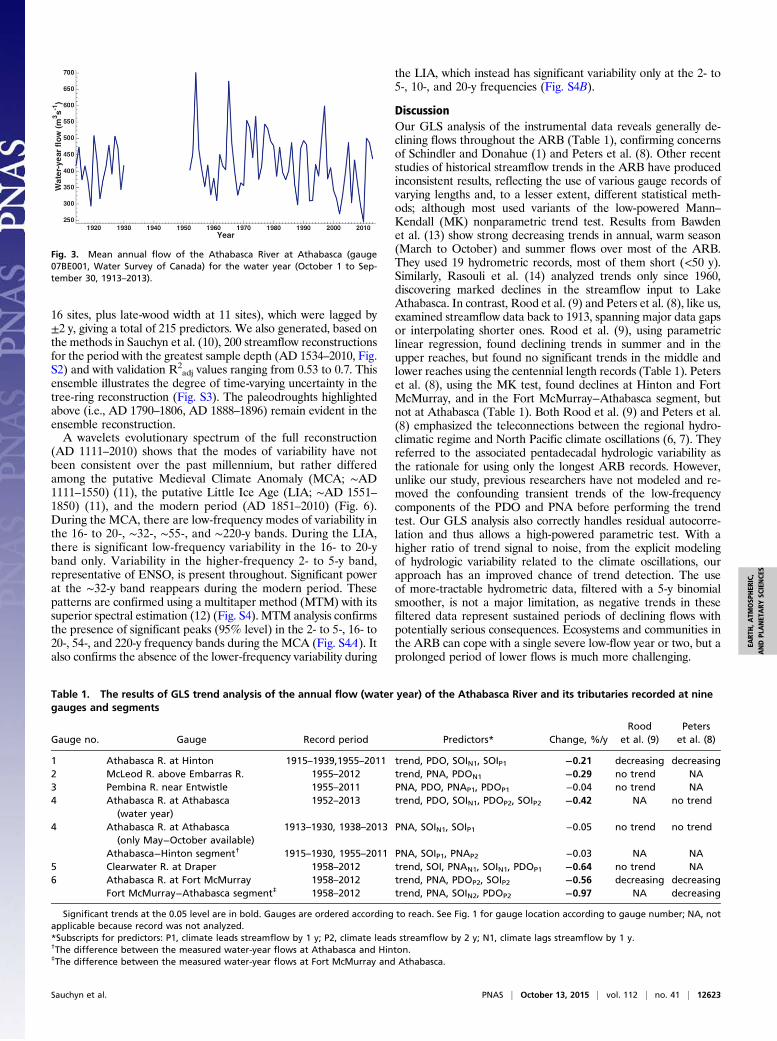
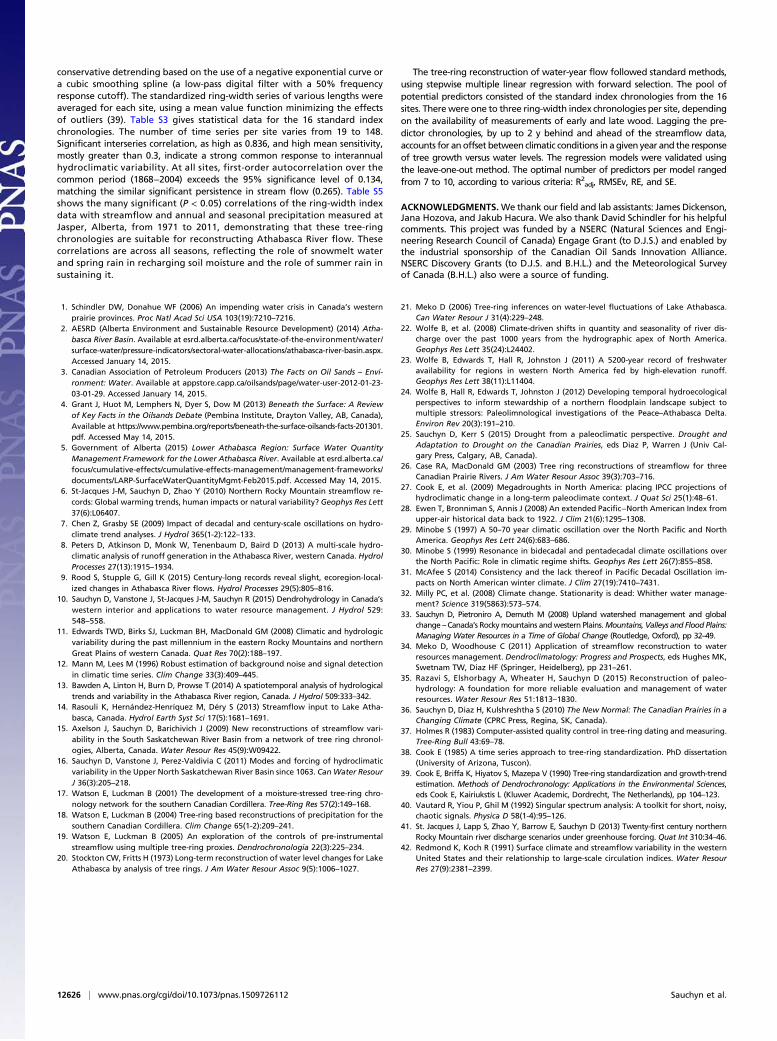
2010 is plotted in Fig. 5. It indicates that AD 1937–1949 was thelongest interval of low flow since the installation of hydrometricgauges on the Athabasca River, although the instrumental data aremissing during this period (Fig. 3). Considering only the past sev-eral centuries, this modern drought of record is exceeded in severityand duration by periods of sustained low flow in AD 1790–1806and AD 1888–1896. To depict the relative severity of these pale-odroughts, we identify analogous years in the hydrometric recordaccording to annual discharge anomaly (percent) (Table 3). Thus,for example, the drought of AD 1888–1896 can be portrayed as thelow flow years of the 2000s plus 1960 and 2 y for which there is nomodern analog; discharges in these years were much lower than theminimum recorded annual flow. The drought of AD 1790–1806also includes a year that has no modern analog, but the most no-table property of this drought is its duration: 17 consecutive years ofbelow-average water levels. These two paleodroughts are high-lighted because they are relatively recent; however, neither one is aworst-case scenario. Droughts of greater intensity and/or durationoccurred in preceding centuries, including the megadroughts ofAD 1143–1198 and AD 1311–1409. The reconstructed flowsbefore AD 1482 are based on model 1, with the least explainedvariance, lowest RE, and highest SE (Table 2). Thus, we have theleast confidence here; the large range of reconstructed flows maybe an artifact of the lower sample depth. However, the sequenceof wet and dry years is valid, and the prolonged periods of low flowindicate the persistence of long dry spells.Fig. 5 is a single best streamflow reconstruction based on the
limited number of tree-ring chronologies selected by the regres-sion algorithm from the large pool of potential predictors: 43 ring-width chronologies, (early-wood width and annual increments at
Fig. 1. Alberta’s seven major drainage basins. The numbers refer to hy-drometric gauges identified in Table 1. The Alberta oil sands development isin the vicinity of Fort McMurray (6). Reproduced with permission from theGovernment of Alberta.
Fig. 2. Licensed water allocations by sector and decades to 2000 and se-lected subsequent years in the Athabasca River Basin, 1900–2010. Repro-duced with permission from the Government of Alberta.
12622 | www.pnas.org/cgi/doi/10.1073/pnas.1509726112 Sauchyn et al.
16 sites, plus late-wood width at 11 sites), which were lagged by±2 y, giving a total of 215 predictors. We also generated, based onthe methods in Sauchyn et al. (10), 200 streamflow reconstructionsfor the period with the greatest sample depth (AD 1534–2010, Fig.S2) and with validation R2
adj values ranging from 0.53 to 0.7. Thisensemble illustrates the degree of time-varying uncertainty in thetree-ring reconstruction (Fig. S3). The paleodroughts highlightedabove (i.e., AD 1790–1806, AD 1888–1896) remain evident in theensemble reconstruction.A wavelets evolutionary spectrum of the full reconstruction
(AD 1111–2010) shows that the modes of variability have notbeen consistent over the past millennium, but rather differedamong the putative Medieval Climate Anomaly (MCA; ∼AD1111–1550) (11), the putative Little Ice Age (LIA; ∼AD 1551–1850) (11), and the modern period (AD 1851–2010) (Fig. 6).During the MCA, there are low-frequency modes of variability inthe 16- to 20-, ∼32-, ∼55-, and ∼220-y bands. During the LIA,there is significant low-frequency variability in the 16- to 20-yband only. Variability in the higher-frequency 2- to 5-y band,representative of ENSO, is present throughout. Significant powerat the ∼32-y band reappears during the modern period. Thesepatterns are confirmed using a multitaper method (MTM) with itssuperior spectral estimation (12) (Fig. S4). MTM analysis confirmsthe presence of significant peaks (95% level) in the 2- to 5-, 16- to20-, 54-, and 220-y frequency bands during the MCA (Fig. S4A). Italso confirms the absence of the lower-frequency variability during
the LIA, which instead has significant variability only at the 2- to5-, 10-, and 20-y frequencies (Fig. S4B).
DiscussionOur GLS analysis of the instrumental data reveals generally de-clining flows throughout the ARB (Table 1), confirming concernsof Schindler and Donahue (1) and Peters et al. (8). Other recentstudies of historical streamflow trends in the ARB have producedinconsistent results, reflecting the use of various gauge records ofvarying lengths and, to a lesser extent, different statistical meth-ods; although most used variants of the low-powered Mann–Kendall (MK) nonparametric trend test. Results from Bawdenet al. (13) show strong decreasing trends in annual, warm season(March to October) and summer flows over most of the ARB.They used 19 hydrometric records, most of them short (<50 y).Similarly, Rasouli et al. (14) analyzed trends only since 1960,discovering marked declines in the streamflow input to LakeAthabasca. In contrast, Rood et al. (9) and Peters et al. (8), like us,examined streamflow data back to 1913, spanning major data gapsor interpolating shorter ones. Rood et al. (9), using parametriclinear regression, found declining trends in summer and in theupper reaches, but found no significant trends in the middle andlower reaches using the centennial length records (Table 1). Peterset al. (8), using the MK test, found declines at Hinton and FortMcMurray, and in the Fort McMurray−Athabasca segment, butnot at Athabasca (Table 1). Both Rood et al. (9) and Peters et al.(8) emphasized the teleconnections between the regional hydro-climatic regime and North Pacific climate oscillations (6, 7). Theyreferred to the associated pentadecadal hydrologic variability asthe rationale for using only the longest ARB records. However,unlike our study, previous researchers have not modeled and re-moved the confounding transient trends of the low-frequencycomponents of the PDO and PNA before performing the trendtest. Our GLS analysis also correctly handles residual autocorre-lation and thus allows a high-powered parametric test. With ahigher ratio of trend signal to noise, from the explicit modelingof hydrologic variability related to the climate oscillations, ourapproach has an improved chance of trend detection. The useof more-tractable hydrometric data, filtered with a 5-y binomialsmoother, is not a major limitation, as negative trends in thesefiltered data represent sustained periods of declining flows withpotentially serious consequences. Ecosystems and communities inthe ARB can cope with a single severe low-flow year or two, but aprolonged period of lower flows is much more challenging.
Fig. 3. Mean annual flow of the Athabasca River at Athabasca (gauge07BE001, Water Survey of Canada) for the water year (October 1 to Sep-tember 30, 1913–2013).
Table 1. The results of GLS trend analysis of the annual flow (water year) of the Athabasca River and its tributaries recorded at ninegauges and segments
Gauge no. Gauge Record period Predictors* Change, %/yRood
et al. (9)Peters
et al. (8)
1 Athabasca R. at Hinton 1915–1939,1955–2011 trend, PDO, SOIN1, SOIP1 −0.21 decreasing decreasing2 McLeod R. above Embarras R. 1955–2012 trend, PNA, PDON1 −0.29 no trend NA3 Pembina R. near Entwistle 1955–2011 PNA, PDO, PNAP1, PDOP1 −0.04 no trend NA4 Athabasca R. at Athabasca
(water year)1952–2013 trend, PDO, SOIN1, PDOP2, SOIP2 −0.42 NA no trend
4 Athabasca R. at Athabasca(only May−October available)
1913–1930, 1938–2013 PNA, SOIN1, SOIP1 −0.05 no trend no trend
Athabasca−Hinton segment† 1915–1930, 1955–2011 PNA, SOIP1, PNAP2 −0.03 NA NA5 Clearwater R. at Draper 1958–2012 trend, SOI, PNAN1, SOIN1, PDOP1 −0.64 no trend NA6 Athabasca R. at Fort McMurray 1958–2012 trend, PNA, PDOP2, SOIP2 −0.56 decreasing decreasing
Fort McMurray−Athabasca segment‡ 1958–2012 trend, PNA, SOIN2, PDOP2 −0.97 NA decreasing
Significant trends at the 0.05 level are in bold. Gauges are ordered according to reach. See Fig. 1 for gauge location according to gauge number; NA, notapplicable because record was not analyzed.*Subscripts for predictors: P1, climate leads streamflow by 1 y; P2, climate leads streamflow by 2 y; N1, climate lags streamflow by 1 y.†The difference between the measured water-year flows at Athabasca and Hinton.‡The difference between the measured water-year flows at Fort McMurray and Athabasca.
Sauchyn et al. PNAS | October 13, 2015 | vol. 112 | no. 41 | 12623
EART
H,A
TMOSP
HER
IC,
ANDPL
ANET
ARY
SCIENCE
S
The collection and analysis of tree rings from dry sites in themontane forest of western Alberta (e.g., refs. 10 and 15–19) hasshown that the rate of tree growth at these sites is limited by theavailability of soil moisture. However, there has been no previousattempt to produce a long streamflow reconstruction for the ARBusing a network of tree-ring chronologies from the headwaters ofthe Athabasca River basin. Most of the previous research into thepaleohydrology of the ARB has been conducted near the mouth ofthe Athabasca River at the Peace−Athabasca Delta. There havebeen two tree-ring reconstructions of the past levels of Lake Atha-basca (20, 21); both were relatively short (<200 y). A major study ofthe paleolimnology of the Peace−Athabasca Delta by Wolfe et al.(22–24) provides important context for the interpretation of recenthydrological changes, although at coarser resolution than that en-abled by annual tree rings. Rasouli et al. (14) interpreted trends inrecorded streamflow in the context of the Wolfe et al. (23, 24)millennial-length lake level time series, concluding that Lake Atha-basca levels could drop by 2–3 m by the end of the 21st century.Our 900-y reconstruction of water-year flow revealed that the
long-term variability of the Athabasca River is considerably greaterthan recorded by the gauge near the community of Athabasca(Figs. 3 and 5). There are reconstructed pregauge periods of con-sistent low flows that far exceed the duration of the worst recordedhydrologic droughts. A prolonged interval of low flow occurs in thetree-ring reconstruction from AD 1936–1949, during the periodof missing data in the gauged flow of the Athabasca River. Thislow-flow period is seen throughout southern Alberta in variousinstrumental records. This modern drought, and more severe hy-drologic droughts from the paleorecord, such as in AD 1790–1806and AD 1888–1896, should be considered in the allocation and useof ARB surface water. The paleodroughts include years whendischarges were so low that there is no modern analog in the gaugerecords. Further evidence of extremely low flows in the AD 1790s
comes from Hudson Bay Company journals from Fort Edmontonon the North Saskatchewan River (25). “Amazing” is used to de-scribe the warmness of the winter and shallowness of the water. Inthe spring of 1796, low river flows caused damage to light canoesand prevented the transport of furs, timber, and supplies. Reportsof extensive grass and forest fire, and diminished populations ofbison and beaver, are further indications of unusually dry condi-tions. The adjacent Athabasca and North Saskatchewan Rivershave a similar hydroclimate and emanate from the same ice field.Thus, the ARB paleohydrology presented here shares many char-acteristics with an initial reconstruction of the flow of the NorthSaskatchewan River (26) and a subsequent reconstruction (16)using more recent tree-ring data and from more sites. Geograph-ically extensive hydroclimatic events include centennial-length low-flow periods during the megadroughts of AD 1143–1198 and AD1311–1409, which are well documented in proxy records from otherregions of western North America (27).Our reconstruction provides context that the short instrumental
record lacks (Figs. 3 and 5). Never during the last 62 y has theaverage annual flow of the Athabasca River at Athabasca been lessthan 200 m3·s−1. Our 900-y reconstruction shows 36 occurrences offlow below 200 m3·s−1. Within the instrumental period of 1952–2013, winter (DJF) flow was, on average, 23% of water-year flow. Ifwe assume this ratio roughly holds over a longer time period, then ayear with an annual flow of less than 200 m3·s−1, would have had awinter flow of less than 46 m3·s−1. The Government of Alberta (5)estimates that oil sands water use will reach 16 m3·s−1 in the nextdecade. This water is withdrawn from the Athabasca River in theFort McMurray region, not at Athabasca. Flow at Athabasca is68% of that downstream at Fort McMurray (1958−2012 average).If a low flow year of less than 200 m3·s−1 occurs at Athabasca, thisis roughly equivalent to 68 m3·s−1 in winter at Fort McMurray. Inthis case, water permanently withdrawn for oil sands extraction isan appreciable amount, particularly if these low flows repeatedlyoccur for a decade or more, as our reconstruction shows can bethe case.Our spectral analysis demonstrates the low-frequency variability
in ARB flows linked to teleconnections with large-scale climateoscillations (Fig. 6 and Fig. S4). The GLS trend analysis of in-strumental data confirms that the PDO and the PNA, with theirsimilar low-frequency components (28), have a significant impacton historical ARB flows (8). In the 900-y proxy flow record, theMCA spectrum contains the modes of variability typical of thePDO and the associated North Pacific Index. These frequencies(i.e., pentadecadal and bidecadal) are also seen in spectra of modern
Table 2. The statistics of the five nested tree-ring modelscomprising the Athabasca River at Athabasca reconstruction forAD 1111–2010
Model no. Yr1 R2 R2adj RE RMSEv SE P
5 1868 0.83 0.80 0.73 47.3 41.5 **4 1725 0.74 0.68 0.62 56.3 52.5 **3 1599 0.65 0.60 0.50 64.4 58.5 **2 1482 0.54 0.47 0.34 78.9 66.8 **1 1111 0.43 0.36 0.23 80.0 73.7 *
The regression model equations are given in Table S4. Yr1, first year ofreconstruction; P, P value of F statistic: ** < 0.0001, * < 0.001.
Fig. 4. Observed versus modeled flow of the Athabasca River at Athabascaover the calibration period (1952−2010) for the five tree-ring models de-scribed in Table 2 and Table S4.
Fig. 5. The full AD 1111–2010 tree-ring reconstruction of the water-year(October−September) flow (cubic meters per second) of the Athabasca Riverat Athabasca. Also plotted is the mean annual flow for the entire record(418 m3·s−1) and a 15-y running mean.
12624 | www.pnas.org/cgi/doi/10.1073/pnas.1509726112 Sauchyn et al.
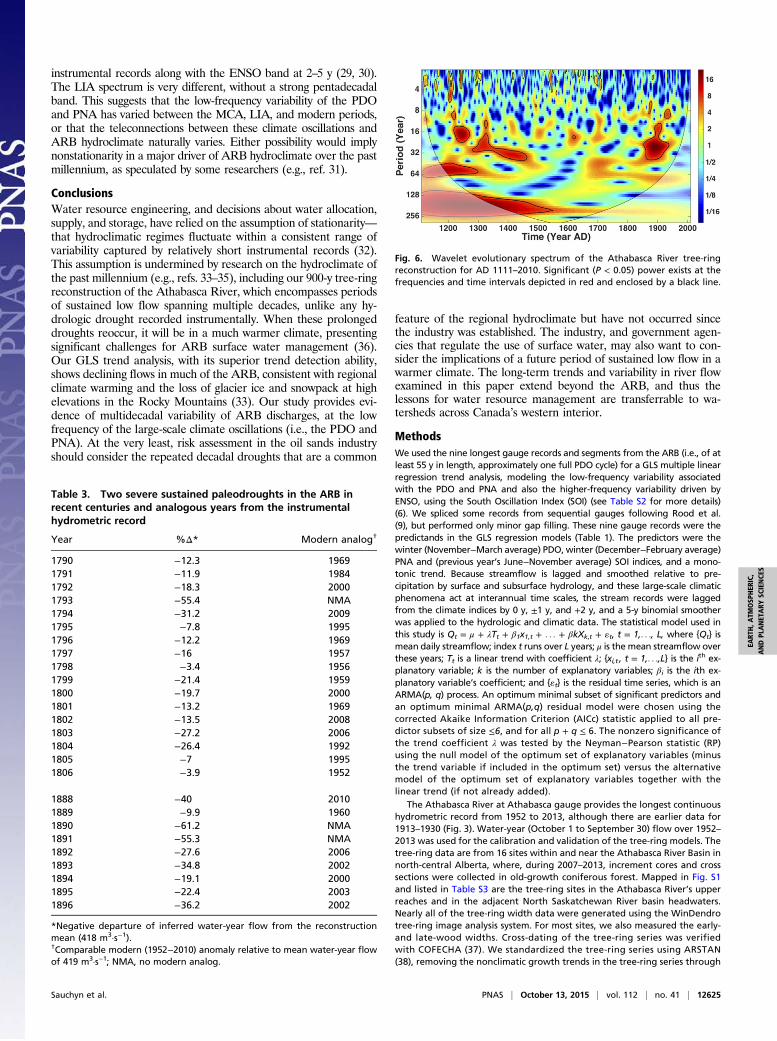
instrumental records along with the ENSO band at 2–5 y (29, 30).The LIA spectrum is very different, without a strong pentadecadalband. This suggests that the low-frequency variability of the PDOand PNA has varied between the MCA, LIA, and modern periods,or that the teleconnections between these climate oscillations andARB hydroclimate naturally varies. Either possibility would implynonstationarity in a major driver of ARB hydroclimate over the pastmillennium, as speculated by some researchers (e.g., ref. 31).
ConclusionsWater resource engineering, and decisions about water allocation,supply, and storage, have relied on the assumption of stationarity—that hydroclimatic regimes fluctuate within a consistent range ofvariability captured by relatively short instrumental records (32).This assumption is undermined by research on the hydroclimate ofthe past millennium (e.g., refs. 33–35), including our 900-y tree-ringreconstruction of the Athabasca River, which encompasses periodsof sustained low flow spanning multiple decades, unlike any hy-drologic drought recorded instrumentally. When these prolongeddroughts reoccur, it will be in a much warmer climate, presentingsignificant challenges for ARB surface water management (36).Our GLS trend analysis, with its superior trend detection ability,shows declining flows in much of the ARB, consistent with regionalclimate warming and the loss of glacier ice and snowpack at highelevations in the Rocky Mountains (33). Our study provides evi-dence of multidecadal variability of ARB discharges, at the lowfrequency of the large-scale climate oscillations (i.e., the PDO andPNA). At the very least, risk assessment in the oil sands industryshould consider the repeated decadal droughts that are a common
feature of the regional hydroclimate but have not occurred sincethe industry was established. The industry, and government agen-cies that regulate the use of surface water, may also want to con-sider the implications of a future period of sustained low flow in awarmer climate. The long-term trends and variability in river flowexamined in this paper extend beyond the ARB, and thus thelessons for water resource management are transferrable to wa-tersheds across Canada’s western interior.
MethodsWe used the nine longest gauge records and segments from the ARB (i.e., of atleast 55 y in length, approximately one full PDO cycle) for a GLS multiple linearregression trend analysis, modeling the low-frequency variability associatedwith the PDO and PNA and also the higher-frequency variability driven byENSO, using the South Oscillation Index (SOI) (see Table S2 for more details)(6). We spliced some records from sequential gauges following Rood et al.(9), but performed only minor gap filling. These nine gauge records were thepredictands in the GLS regression models (Table 1). The predictors were thewinter (November−March average) PDO, winter (December−February average)PNA and (previous year’s June−November average) SOI indices, and a mono-tonic trend. Because streamflow is lagged and smoothed relative to pre-cipitation by surface and subsurface hydrology, and these large‐scale climaticphenomena act at interannual time scales, the stream records were laggedfrom the climate indices by 0 y, ±1 y, and +2 y, and a 5-y binomial smootherwas applied to the hydrologic and climatic data. The statistical model used inthis study is Qt = μ + λTt + β1x1,t + . . . + βkXk,t + «t, t = 1,. . ., L, where {Qt} ismean daily streamflow; index t runs over L years; μ is the mean streamflow overthese years; Tt is a linear trend with coefficient λ; {xi,t , t = 1,. . .,L} is the ith ex-planatory variable; k is the number of explanatory variables; βi is the ith ex-planatory variable’s coefficient; and {«t} is the residual time series, which is anARMA(p, q) process. An optimum minimal subset of significant predictors andan optimum minimal ARMA(p,q) residual model were chosen using thecorrected Akaike Information Criterion (AICc) statistic applied to all pre-dictor subsets of size ≤6, and for all p + q ≤ 6. The nonzero significance ofthe trend coefficient λ was tested by the Neyman−Pearson statistic (RP)using the null model of the optimum set of explanatory variables (minusthe trend variable if included in the optimum set) versus the alternativemodel of the optimum set of explanatory variables together with thelinear trend (if not already added).
The Athabasca River at Athabasca gauge provides the longest continuoushydrometric record from 1952 to 2013, although there are earlier data for1913–1930 (Fig. 3). Water-year (October 1 to September 30) flow over 1952–2013 was used for the calibration and validation of the tree-ring models. Thetree-ring data are from 16 sites within and near the Athabasca River Basin innorth-central Alberta, where, during 2007–2013, increment cores and crosssections were collected in old-growth coniferous forest. Mapped in Fig. S1and listed in Table S3 are the tree-ring sites in the Athabasca River’s upperreaches and in the adjacent North Saskatchewan River basin headwaters.Nearly all of the tree-ring width data were generated using the WinDendrotree-ring image analysis system. For most sites, we also measured the early-and late-wood widths. Cross-dating of the tree-ring series was verifiedwith COFECHA (37). We standardized the tree-ring series using ARSTAN(38), removing the nonclimatic growth trends in the tree-ring series through
Table 3. Two severe sustained paleodroughts in the ARB inrecent centuries and analogous years from the instrumentalhydrometric record
Year %Δ* Modern analog†
1790 −12.3 19691791 −11.9 19841792 −18.3 20001793 −55.4 NMA1794 −31.2 20091795 −7.8 19951796 −12.2 19691797 −16 19571798 −3.4 19561799 −21.4 19591800 −19.7 20001801 −13.2 19691802 −13.5 20081803 −27.2 20061804 −26.4 19921805 −7 19951806 −3.9 1952
1888 −40 20101889 −9.9 19601890 −61.2 NMA1891 −55.3 NMA1892 −27.6 20061893 −34.8 20021894 −19.1 20001895 −22.4 20031896 −36.2 2002
*Negative departure of inferred water-year flow from the reconstructionmean (418 m3·s−1).†Comparable modern (1952−2010) anomaly relative to mean water-year flowof 419 m3·s−1; NMA, no modern analog.
Fig. 6. Wavelet evolutionary spectrum of the Athabasca River tree-ringreconstruction for AD 1111–2010. Significant (P < 0.05) power exists at thefrequencies and time intervals depicted in red and enclosed by a black line.
Sauchyn et al. PNAS | October 13, 2015 | vol. 112 | no. 41 | 12625
EART
H,A
TMOSP
HER
IC,
ANDPL
ANET
ARY
SCIENCE
S
conservative detrending based on the use of a negative exponential curve ora cubic smoothing spline (a low-pass digital filter with a 50% frequencyresponse cutoff). The standardized ring-width series of various lengths wereaveraged for each site, using a mean value function minimizing the effectsof outliers (39). Table S3 gives statistical data for the 16 standard indexchronologies. The number of time series per site varies from 19 to 148.Significant interseries correlation, as high as 0.836, and high mean sensitivity,mostly greater than 0.3, indicate a strong common response to interannualhydroclimatic variability. At all sites, first-order autocorrelation over thecommon period (1868−2004) exceeds the 95% significance level of 0.134,matching the similar significant persistence in stream flow (0.265). Table S5shows the many significant (P < 0.05) correlations of the ring-width indexdata with streamflow and annual and seasonal precipitation measured atJasper, Alberta, from 1971 to 2011, demonstrating that these tree-ringchronologies are suitable for reconstructing Athabasca River flow. Thesecorrelations are across all seasons, reflecting the role of snowmelt waterand spring rain in recharging soil moisture and the role of summer rain insustaining it.
The tree-ring reconstruction of water-year flow followed standard methods,using stepwise multiple linear regression with forward selection. The pool ofpotential predictors consisted of the standard index chronologies from the 16sites. Therewere one to three ring-width index chronologies per site, dependingon the availability of measurements of early and late wood. Lagging the pre-dictor chronologies, by up to 2 y behind and ahead of the streamflow data,accounts for anoffset between climatic conditions in agiven year and the responseof tree growth versus water levels. The regression models were validated usingthe leave-one-out method. The optimal number of predictors per model rangedfrom 7 to 10, according to various criteria: R2adj, RMSEv, RE, and SE.
ACKNOWLEDGMENTS.We thank our field and lab assistants: James Dickenson,Jana Hozova, and Jakub Hacura. We also thank David Schindler for his helpfulcomments. This project was funded by a NSERC (Natural Sciences and Engi-neering Research Council of Canada) Engage Grant (to D.J.S.) and enabled bythe industrial sponsorship of the Canadian Oil Sands Innovation Alliance.NSERC Discovery Grants (to D.J.S. and B.H.L.) and the Meteorological Surveyof Canada (B.H.L.) also were a source of funding.
1. Schindler DW, Donahue WF (2006) An impending water crisis in Canada’s westernprairie provinces. Proc Natl Acad Sci USA 103(19):7210–7216.
2. AESRD (Alberta Environment and Sustainable Resource Development) (2014) Atha-basca River Basin. Available at esrd.alberta.ca/focus/state-of-the-environment/water/surface-water/pressure-indicators/sectoral-water-allocations/athabasca-river-basin.aspx.Accessed January 14, 2015.
3. Canadian Association of Petroleum Producers (2013) The Facts on Oil Sands – Envi-ronment: Water. Available at appstore.capp.ca/oilsands/page/water-user-2012-01-23-03-01-29. Accessed January 14, 2015.
4. Grant J, Huot M, Lemphers N, Dyer S, Dow M (2013) Beneath the Surface: A Reviewof Key Facts in the Oilsands Debate (Pembina Institute, Drayton Valley, AB, Canada),Available at https://www.pembina.org/reports/beneath-the-surface-oilsands-facts-201301.pdf. Accessed May 14, 2015.
5. Government of Alberta (2015) Lower Athabasca Region: Surface Water QuantityManagement Framework for the Lower Athabasca River. Available at esrd.alberta.ca/focus/cumulative-effects/cumulative-effects-management/management-frameworks/documents/LARP-SurfaceWaterQuantityMgmt-Feb2015.pdf. Accessed May 14, 2015.
6. St-Jacques J-M, Sauchyn D, Zhao Y (2010) Northern Rocky Mountain streamflow re-cords: Global warming trends, human impacts or natural variability? Geophys Res Lett37(6):L06407.
7. Chen Z, Grasby SE (2009) Impact of decadal and century-scale oscillations on hydro-climate trend analyses. J Hydrol 365(1-2):122–133.
8. Peters D, Atkinson D, Monk W, Tenenbaum D, Baird D (2013) A multi-scale hydro-climatic analysis of runoff generation in the Athabasca River, western Canada. HydrolProcesses 27(13):1915–1934.
9. Rood S, Stupple G, Gill K (2015) Century-long records reveal slight, ecoregion-local-ized changes in Athabasca River flows. Hydrol Processes 29(5):805–816.
10. Sauchyn D, Vanstone J, St-Jacques J-M, Sauchyn R (2015) Dendrohydrology in Canada’swestern interior and applications to water resource management. J Hydrol 529:548–558.
11. Edwards TWD, Birks SJ, Luckman BH, MacDonald GM (2008) Climatic and hydrologicvariability during the past millennium in the eastern Rocky Mountains and northernGreat Plains of western Canada. Quat Res 70(2):188–197.
12. Mann M, Lees M (1996) Robust estimation of background noise and signal detectionin climatic time series. Clim Change 33(3):409–445.
13. Bawden A, Linton H, Burn D, Prowse T (2014) A spatiotemporal analysis of hydrologicaltrends and variability in the Athabasca River region, Canada. J Hydrol 509:333–342.
14. Rasouli K, Hernández-Henríquez M, Déry S (2013) Streamflow input to Lake Atha-basca, Canada. Hydrol Earth Syst Sci 17(5):1681–1691.
15. Axelson J, Sauchyn D, Barichivich J (2009) New reconstructions of streamflow vari-ability in the South Saskatchewan River Basin from a network of tree ring chronol-ogies, Alberta, Canada. Water Resour Res 45(9):W09422.
16. Sauchyn D, Vanstone J, Perez-Valdivia C (2011) Modes and forcing of hydroclimaticvariability in the Upper North Saskatchewan River Basin since 1063. Can Water ResourJ 36(3):205–218.
17. Watson E, Luckman B (2001) The development of a moisture-stressed tree-ring chro-nology network for the southern Canadian Cordillera. Tree-Ring Res 57(2):149–168.
18. Watson E, Luckman B (2004) Tree-ring based reconstructions of precipitation for thesouthern Canadian Cordillera. Clim Change 65(1-2):209–241.
19. Watson E, Luckman B (2005) An exploration of the controls of pre-instrumentalstreamflow using multiple tree-ring proxies. Dendrochronologia 22(3):225–234.
20. Stockton CW, Fritts H (1973) Long-term reconstruction of water level changes for LakeAthabasca by analysis of tree rings. J Am Water Resour Assoc 9(5):1006–1027.
21. Meko D (2006) Tree-ring inferences on water-level fluctuations of Lake Athabasca.Can Water Resour J 31(4):229–248.
22. Wolfe B, et al. (2008) Climate-driven shifts in quantity and seasonality of river dis-charge over the past 1000 years from the hydrographic apex of North America.Geophys Res Lett 35(24):L24402.
23. Wolfe B, Edwards T, Hall R, Johnston J (2011) A 5200-year record of freshwateravailability for regions in western North America fed by high-elevation runoff.Geophys Res Lett 38(11):L11404.
24. Wolfe B, Hall R, Edwards T, Johnston J (2012) Developing temporal hydroecologicalperspectives to inform stewardship of a northern floodplain landscape subject tomultiple stressors: Paleolimnological investigations of the Peace–Athabasca Delta.Environ Rev 20(3):191–210.
25. Sauchyn D, Kerr S (2015) Drought from a paleoclimatic perspective. Drought andAdaptation to Drought on the Canadian Prairies, eds Diaz P, Warren J (Univ Cal-gary Press, Calgary, AB, Canada).
26. Case RA, MacDonald GM (2003) Tree ring reconstructions of streamflow for threeCanadian Prairie Rivers. J Am Water Resour Assoc 39(3):703–716.
27. Cook E, et al. (2009) Megadroughts in North America: placing IPCC projections ofhydroclimatic change in a long-term paleoclimate context. J Quat Sci 25(1):48–61.
28. Ewen T, Bronniman S, Annis J (2008) An extended Pacific−North American Index fromupper-air historical data back to 1922. J Clim 21(6):1295–1308.
29. Minobe S (1997) A 50–70 year climatic oscillation over the North Pacific and NorthAmerica. Geophys Res Lett 24(6):683–686.
30. Minobe S (1999) Resonance in bidecadal and pentadecadal climate oscillations overthe North Pacific: Role in climatic regime shifts. Geophys Res Lett 26(7):855–858.
31. McAfee S (2014) Consistency and the lack thereof in Pacific Decadal Oscillation im-pacts on North American winter climate. J Clim 27(19):7410–7431.
32. Milly PC, et al. (2008) Climate change. Stationarity is dead: Whither water manage-ment? Science 319(5863):573–574.
33. Sauchyn D, Pietroniro A, Demuth M (2008) Upland watershed management and globalchange –Canada’s Rockymountains andwestern Plains.Mountains, Valleys and Flood Plains:Managing Water Resources in a Time of Global Change (Routledge, Oxford), pp 32–49.
34. Meko D, Woodhouse C (2011) Application of streamflow reconstruction to waterresources management. Dendroclimatology: Progress and Prospects, eds Hughes MK,Swetnam TW, Diaz HF (Springer, Heidelberg), pp 231–261.
35. Razavi S, Elshorbagy A, Wheater H, Sauchyn D (2015) Reconstruction of paleo-hydrology: A foundation for more reliable evaluation and management of waterresources. Water Resour Res 51:1813–1830.
36. Sauchyn D, Diaz H, Kulshreshtha S (2010) The New Normal: The Canadian Prairies in aChanging Climate (CPRC Press, Regina, SK, Canada).
37. Holmes R (1983) Computer-assisted quality control in tree-ring dating and measuring.Tree-Ring Bull 43:69–78.
38. Cook E (1985) A time series approach to tree-ring standardization. PhD dissertation(University of Arizona, Tuscon).
39. Cook E, Briffa K, Hiyatov S, Mazepa V (1990) Tree-ring standardization and growth-trendestimation. Methods of Dendrochronology: Applications in the Environmental Sciences,eds Cook E, Kairiukstis L (Kluwer Academic, Dordrecht, The Netherlands), pp 104–123.
40. Vautard R, Yiou P, Ghil M (1992) Singular spectrum analysis: A toolkit for short, noisy,chaotic signals. Physica D 58(1-4):95–126.
41. St. Jacques J, Lapp S, Zhao Y, Barrow E, Sauchyn D (2013) Twenty-first century northernRocky Mountain river discharge scenarios under greenhouse forcing. Quat Int 310:34–46.
42. Redmond K, Koch R (1991) Surface climate and streamflow variability in the westernUnited States and their relationship to large-scale circulation indices. Water ResourRes 27(9):2381–2399.
12626 | www.pnas.org/cgi/doi/10.1073/pnas.1509726112 Sauchyn et al.
Related Documents