March 2015 AMION Consulting Limited Department for Communities and Local Government London 2012 Olympics Regeneration legacy evaluation framework This research was commissioned by the previous government and is not necessarily a reflection of the current government’s policies and priorities. DCLG is publishing this report in the interests of transparency.

Welcome message from author
This document is posted to help you gain knowledge. Please leave a comment to let me know what you think about it! Share it to your friends and learn new things together.
Transcript
March 2015 AMION Consulting Limited
Department for Communities and Local Government
London 2012 Olympics
Regeneration legacy evaluation framework
This research was commissioned by the previous government and is not necessarily a reflection of the current government’s policies and priorities. DCLG is publishing this report in the interests of transparency.

© Queen’s Printer and Controller of Her Majesty’s Stationery Office, 2015
Copyright in the typographical arrangement rests with the Crown.
You may re-use this information (not including logos) free of charge in any format or medium, under the terms of
the Open Government Licence. To view this licence, visitis http://www.nationalarchives.gov.uk/doc/open-
government-licence/version/3/ or write to the Information Policy Team, The National Archives, Kew, London TW9 4DU, or e-mail: [email protected]. This document/publication is also available on our website at www.gov.uk/dclg Any enquiries regarding this document/publication should be sent to us at:
Department for Communities and Local Government Fry Building 2 Marsham Street London SW1P 4DF Telephone: 030 3444 0000
For all our latest news and updates follow us on Twitter: https://twitter.com/CommunitiesUK
March 2015
ISBN: 978-1-4098-3168-6
London 2012 Olympics | 3
Contents
1 Introduction 5
1.1 Overview 5
1.2 Purpose 7
1.3 Structure of the report 7
2 Delivering the Olympic and Paralympic Games and their legacy 9
2.1 Introduction 9
2.2 National policy context 9
2.3 The Games 10
2.4 The Olympic Park 10
2.5 Governance of the Games and their legacy 12
2.6 Funding the Games and their legacy 13
2.7 The Games legacy policy framework 16
2.8 Legacy themes and ambitions 21
2.9 Delivering the legacy 23
3 Scope of the Evaluation Framework 24
3.1 Introduction 24
3.2 Overview 24
3.3 Logic chains 27
3.4 Place and environment 29
3.5 Economy and skills 30
3.6 Social and community 31
3.7 Sport and health 32
4 Addressing the key evaluation questions 33
4.1 Introduction 33
4.2 Costs 33
4.3 Impacts 35
4.4 Processes 47
4.5 Value for money 49
5 Evidence sources and analytical methods 52
5.1 Introduction 52
5.2 ‘Top-down’ sources and analyses 54
5.3 ‘Bottom-up’ sources, analyses and scope 61
5.4 Valuation of impacts 70

4 | London 2012 Olympics
6 Conclusion and Recommendations 74
List of Acronyms 77
Bibliography 80
Appendix A: Evidence from previous Olympic Games 83
Appendix B: Baseline and trend analysis 93
London 2012 Olympics | 5
1 Introduction
1.1 Overview
This report presents a Framework for the Department for Communities and Local Government (DCLG) to measure the regeneration impacts and legacy of the London 2012 Olympics and Paralympics (referred to as the Games or 2012 Olympics) across a range of the Department’s key policy interests.
The successful staging of the 2012 Olympics is expected to deliver a legacy of very substantial economic, social and environmental benefits. In combination with the implementation of related regeneration strategies, it will transform the Lower Lea Valley and contribute to the regeneration of East London. The Games will also result in a range of wider sub-national and national benefits. The main areas of regeneration benefits likely to arise include:
• substantially increased job opportunities;
• the attraction of inward investment and the expansion of existing and new businesses;
• land use changes;
• a significant change in the scale and mix of new housing with a large proportion available to those on low incomes;
• the delivery of a major new urban park;
• significant transport benefits;
• an increase in participation in sports and the creation of a ‘sports hub’ in East London;
• an increase in pride and self esteem, along with cultural development and enhanced community and social cohesion; and
• an estimated 70,000 volunteers directly involved in the Games. Based on the Sydney Games experience, this will provide the opportunity to improve practical skills and enhance community spirit.
Evaluation of the extent to which legacy benefits are generated, and, particularly, of how they are generated, is important for a number of reasons. These partly involve issues of accountability regarding public money and an assessment of the degree to which it is being deployed in a cost-effective and relevant manner. They also involve the need to identify lessons for the effectiveness of future activities including regeneration activities generally, as well as maximising the benefits – and therefore value – derived from future major events.
Experience of previous Games illustrates the potential for such events, with appropriate supporting activities, to achieve wide ranging impacts.
6 | London 2012 Olympics
Appendix A presents a summary of previous Games impacts, based on published reports.1
The proposed evaluation focuses on DCLG’s policy remit and specifically the regeneration legacy effects on East London. It has been designed to be compatible with complementary evaluations undertaken by bodies such as the London Development Agency (LDA), International Olympic Committee (IOC) and other stakeholders (including the London 2012 Host Boroughs.)2 It will provide a crucial input for the Department for Culture, Media and Sports’ (DCMS’) meta-evaluation.
It is evident that the nature of potential regeneration impacts is highly complex and will be influenced by a range of extraneous factors, such as global economic performance and other major investments not related to the Games. This has been a key consideration in the formulation of this Evaluation Framework, which has been designed to focus on the critical themes and issues that the evaluation will need to address. The Evaluation Framework report should be read in conjunction with policy and other contextual documentation including, in particular:
• Economic and Social Research Council (ESRC), Olympic Games Impact Study (OGI) – London 2012 (Pre-Games Report), July 2010;
• Organisation for Economic Co-operation and Development (OECD), Local Economic and Employment Development (LEED) Programme, Local Development Benefits from Staging Global Events: Achieving the Local Development Legacy from 2012;
• DCMS, Before, during and after: making the most of the London 2012 Games, June 2008 (Legacy Action Plan);
• London 2012 Host Boroughs, Strategic Regeneration Framework (SRF): An Olympic Legacy for the Host Boroughs, October 2009;
• the Legacy Masterplan Framework (LMF);
• DCMS, Plans for the Legacy from the 2012 Olympic and Paralympic Games, December 2010; and
• DCMS’ meta evaluation reports – 1 (Scope, research questions and data strategy) and 2 (Methods: Meta–evaluation of the impacts and legacy of the London 2012 Olympic Games and Paralympic Games).
1 See, for example, Organisation for Economic Co-operation and Development (OECD), Local Economic and Employment Development (LEED) Programme, Local development benefits from staging global events: achieving the local development legacy from 2012.
2 At the time that this study was undertaken, there were five London 2012 Host Boroughs comprising the London Boroughs of Greenwich, Hackney, Newham, Tower Hamlets and Waltham Forest, who were working together to secure a lasting legacy for local people, communities and businesses. These are referred to in this report as the London 2012 Host Boroughs. Barking and Dagenham has subsequently become the sixth Host Borough. The baseline data in this report refers only to the original five London 2012 Host Boroughs, but any subsequent stages of the evaluation should incorporate Barking and Dagenham, including the retrospective collection of baseline data.
London 2012 Olympics | 7
1.2 Purpose
The purpose of this report is:
To develop a bespoke Evaluation Framework for the regeneration legacy impacts of the London 2012 Olympics and Paralympic Games for DCLG.
In particular, DCLG wants to understand how it might:
• measure the regeneration outcomes arising from the development of the Olympic sites and surrounding areas;
• assess the value for money of regeneration outcomes associated with London 2012;
• determine whether the Games have encouraged wider community involvement and volunteering (primarily but not exclusively in the London 2012 Host Boroughs);
• determine the contribution to the economic development and investment programme for the Thames Gateway;
• measure the impacts on the physical, natural and built environment, and land uses, including insofar as is possible, the impact of the Olympic Park Legacy Company (OPLC or any successor body) and the promise to transform the heart of East London;
• assess the sustainable development of the Olympic Park and wider area, including the extent to which the Games have promoted place-making, social inclusion and cohesion;
• assess the added value of the Strategic Regeneration Framework (SRF) for the London 2012 Host Boroughs, and their associated agreements and delivery arrangements, with respect to contributing to legacy effects; and
• assess how the London 2012 Host Boroughs can achieve convergence with the London average in socio-economic terms (linking with the SRF).
The Regeneration Legacy Evaluation Framework fits into the DCMS’ meta-evaluation and, going forward, given the changes of governance, it will be necessary to consider how to integrate this Framework with the other London 2012 regeneration evaluation initiatives that are being undertaken by the LDA, Greater London Authority (GLA) and others, such as the London 2012 Host Boroughs.
1.3 Structure of the report
This report consists of a further five sections, as follows:
• Section 2 – reviews the 2012 Olympic and Paralympic Games and their proposed legacy;
• Section 3 – discusses the scope of the Evaluation Framework;

8 | London 2012 Olympics
• Section 4 – sets out the key evaluation questions;
• Section 5 – assesses the evidence sources and analytical methods needed; and
• Section 6 – presents the conclusions reached.

London 2012 Olympics | 9
2 Delivering the Olympic and Paralympic Games and their legacy
2.1 Introduction
This section provides a brief contextual review of the Games, the Olympic Park, the governance and funding of the Games and the legacy arrangements that have been established to date. Firstly, it considers the new Government’s emerging policy framework, which is relevant to the delivery of the Games and their regeneration legacy.
2.2 National policy context
The Coalition Agreement was issued in May 2010 and is the Government’s five-year policy programme. It represents a manifesto for the Coalition’s time in Government and is structured around the themes of ‘Freedom’, ‘Fairness’ and ‘Responsibility’. The document sets out far reaching reforms that will affect all areas of Government. The Government recognises that a vibrant cultural, media and sporting sector is crucial to supporting well-being and quality of life. Furthermore, a commitment has been made to work with the Mayor of London to ensure a safe and successful Games and to deliver a genuine and lasting legacy.
The Local Growth White paper was issued in October 2010 and sets out the Government’s new approach to sub-national growth. It specifically highlights the importance of making the most of the potential economic, social and sporting benefits that will arise as a result of the Games, together with ensuring that key activities continue to ensure that these benefits are realised.
DCLG’s first annual Business Plan (November 2010) sets out a number of Actions and Milestones that expand on the overarching reforms outlined in the Structural Reform Plan. The Plan highlights the Coalition’s priority on regeneration, noting, amongst other things, that it will work with London’s Mayor to ensure a lasting legacy from the Games. Further details of DCLG’s priorities are included in Section 3.2.1 below.
The DCMS Business Plan (November 2010) recognises that the biggest most immediate challenge facing the Department is in delivering a safe and successful Games. Furthermore, the Department is focused on ensuring that the 2012 Olympics deliver a genuine and lasting legacy, and that they will be
10 | London 2012 Olympics
a symbol of economic vitality, social and cultural renewal, and increase the UK’s standing on the global stage.
A key feature of the changing context for delivery of the Games and its legacy is the Coalition Government’s commitment to decentralisation of power as articulated in the Localism Bill which was introduced to parliament in December 2010. The Bill includes a number of measures to devolve powers to the Mayor and London boroughs. DCMS has also recently published the Coalition Government’s plans for the legacy of the Games.3 These continue to emphasise the importance of the regeneration legacy.
2.3 The Games
The 2012 Olympic and Paralympic Games will take place between July and September 2012 and be centred on the Olympic Park in East London with further sporting, cultural and other events spread across the United Kingdom. Most of the events will be focused in the London 2012 Host Boroughs in the east of London – Greenwich, Hackney, Newham, Tower Hamlets and Waltham Forrest. Football will take place in a number of cities, including Glasgow, Newcastle, Cardiff and Birmingham, with the sailing taking place at Weymouth and the rowing at Eton.
The Olympics will feature approximately 300 events categorised in 26 sports. At the Beijing 2008 Games there were 11,000 competitors representing 204 nations and a worldwide television audience of 4.7 billion.
2.4 The Olympic Park
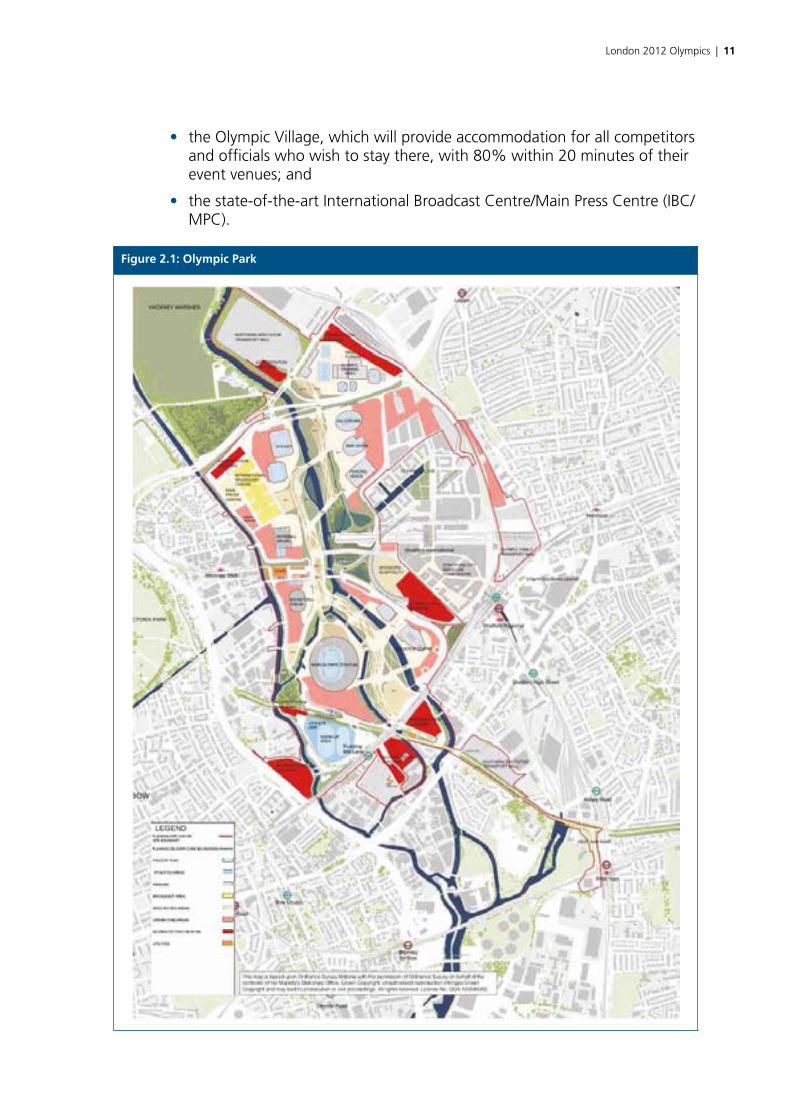
The Olympic Park in East London (see Figure 2.1) will be the focal point for the 2012 Games. The 300 hectare (750 acre) secure Park site will accommodate:
• the main 80,000 seat Olympic stadium, which will host the Opening and Closing Ceremonies, as well as the athletics events;
• the aquatics centre, which will include two 50 metre swimming pools and a diving pool;
• the hockey centre – with two stadia of different capacities and a warm up pitch;
• the Velopark, which will include the velodrome and a BMX track;
• four multi-sport arenas will be the setting for fencing, volleyball, basketball and handball;
3 DCMS 2010, ‘Plans for the Legacy from the 2012 Olympic and Paralympic Games’.
London 2012 Olympics | 11
• the Olympic Village, which will provide accommodation for all competitors and officials who wish to stay there, with 80% within 20 minutes of their event venues; and
• the state-of-the-art International Broadcast Centre/Main Press Centre (IBC/MPC).
Figure 2.1: Olympic Park
12 | London 2012 Olympics
2.5 Governance of the Games and their legacy
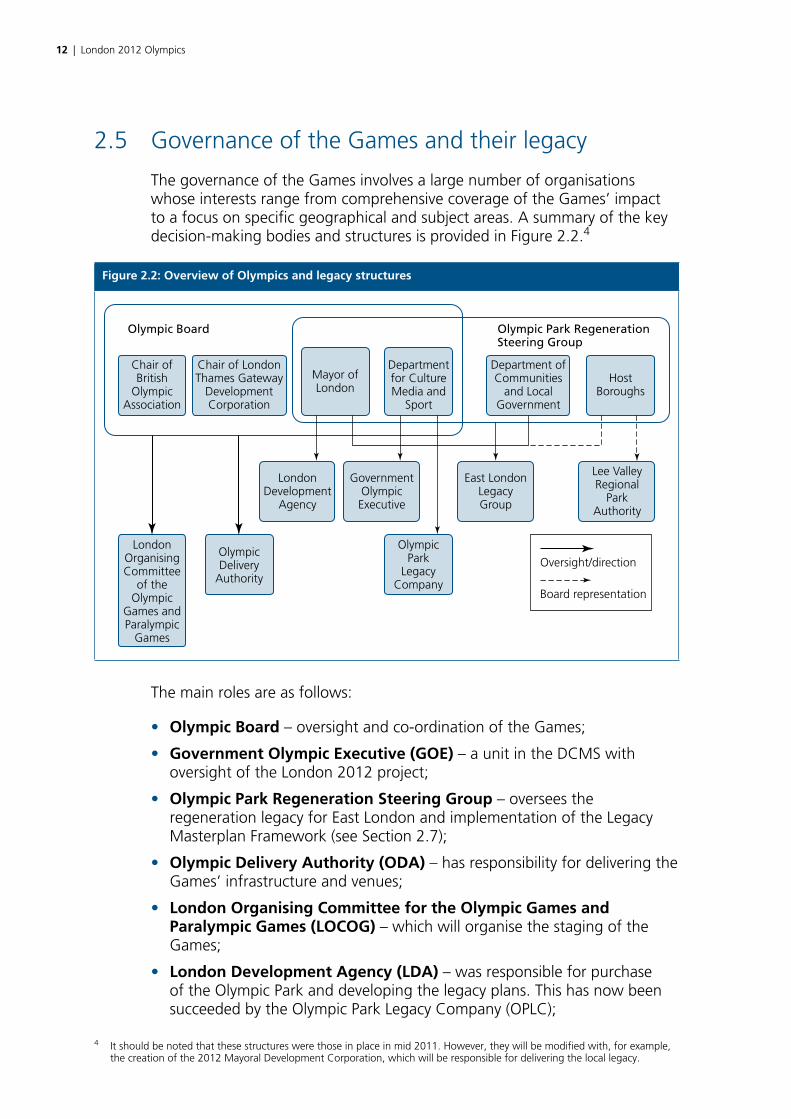
The governance of the Games involves a large number of organisations whose interests range from comprehensive coverage of the Games’ impact to a focus on specific geographical and subject areas. A summary of the key decision-making bodies and structures is provided in Figure 2.2.4
Figure 2.2: Overview of Olympics and legacy structures
Chair ofBritish
OlympicAssociation
Olympic Board Olympic Park RegenerationSteering Group
Chair of LondonThames Gateway
DevelopmentCorporation
Mayor ofLondon
Departmentfor CultureMedia and
Sport
Department ofCommunities
and LocalGovernment
HostBoroughs
OlympicPark
LegacyCompany
Oversight/directionOlympicDelivery
Authority
LondonOrganisingCommittee
of theOlympic
Games andParalympic
Games
Lee ValleyRegional
ParkAuthority
East LondonLegacyGroup
GovernmentOlympicExecutive
LondonDevelopment
Agency
Board representation
The main roles are as follows:
• Olympic Board – oversight and co-ordination of the Games;
• Government Olympic Executive (GOE) – a unit in the DCMS with oversight of the London 2012 project;
• Olympic Park Regeneration Steering Group – oversees the regeneration legacy for East London and implementation of the Legacy Masterplan Framework (see Section 2.7);
• Olympic Delivery Authority (ODA) – has responsibility for delivering the Games’ infrastructure and venues;
• London Organising Committee for the Olympic Games and Paralympic Games (LOCOG) – which will organise the staging of the Games;
• London Development Agency (LDA) – was responsible for purchase of the Olympic Park and developing the legacy plans. This has now been succeeded by the Olympic Park Legacy Company (OPLC);
4 It should be noted that these structures were those in place in mid 2011. However, they will be modified with, for example, the creation of the 2012 Mayoral Development Corporation, which will be responsible for delivering the local legacy.
London 2012 Olympics | 13
• OPLC – the OPLC is a not-for-profit partnership between national government (DCLG and the Olympics Minister) and the Mayor of London and was established to assume responsibility for taking forward the legacy. It is now proposed that, following legislation later this year, the OPLC will be merged into the new 2012 Mayoral Development Corporation (2012 MDC);
• East London Legacy Board – supports the implementation of the Strategic Regeneration Framework for delivering the legacy benefits for East London. It is one of four legacy boards established to oversee and co-ordinate legacy planning and management; and
• Lee Valley Regional Park Authority – manages the Lee Valley Regional Park and owns part of the Olympic Park.
2.6 Funding the Games and their legacy
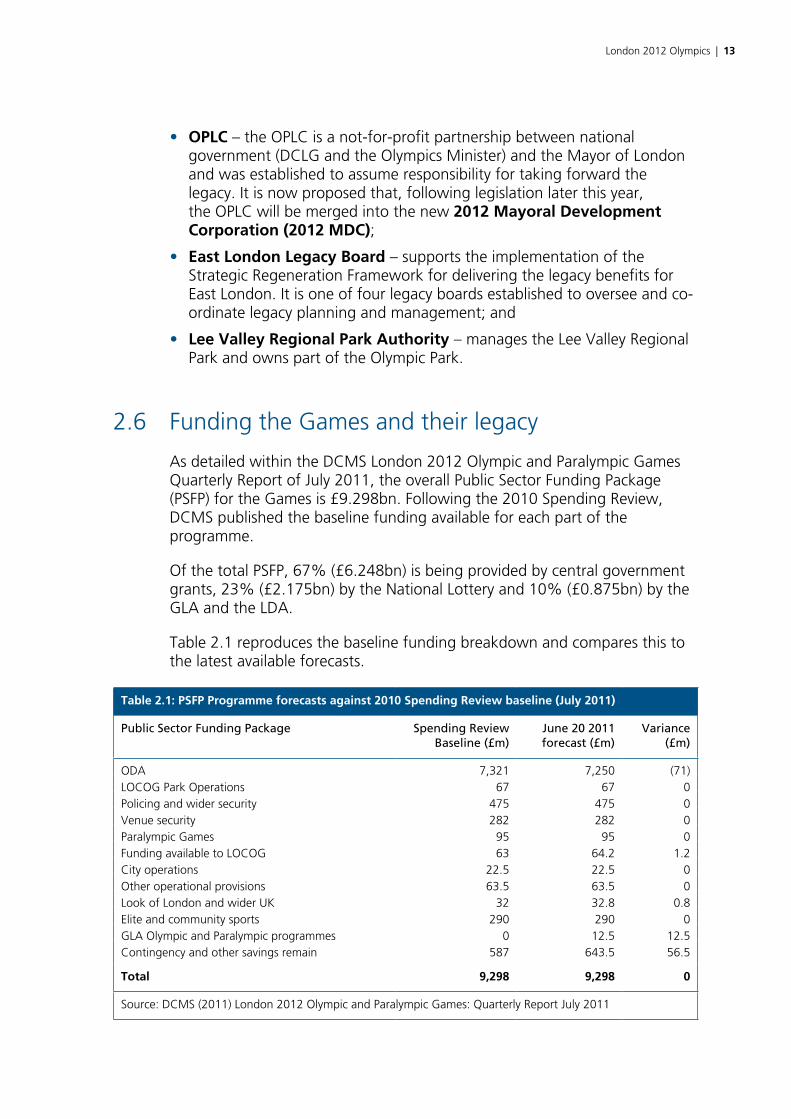
As detailed within the DCMS London 2012 Olympic and Paralympic Games Quarterly Report of July 2011, the overall Public Sector Funding Package (PSFP) for the Games is £9.298bn. Following the 2010 Spending Review, DCMS published the baseline funding available for each part of the programme.
Of the total PSFP, 67% (£6.248bn) is being provided by central government grants, 23% (£2.175bn) by the National Lottery and 10% (£0.875bn) by the GLA and the LDA.
Table 2.1 reproduces the baseline funding breakdown and compares this to the latest available forecasts.
Table 2.1: PSFP Programme forecasts against 2010 Spending Review baseline (July 2011)
Public Sector Funding Package Spending Review Baseline (£m)
June 20 2011 forecast (£m)
Variance (£m)
ODA 7,321 7,250 (71)LOCOG Park Operations 67 67 0Policing and wider security 475 475 0Venue security 282 282 0Paralympic Games 95 95 0Funding available to LOCOG 63 64.2 1.2City operations 22.5 22.5 0Other operational provisions 63.5 63.5 0Look of London and wider UK 32 32.8 0.8Elite and community sports 290 290 0GLA Olympic and Paralympic programmes 0 12.5 12.5Contingency and other savings remain 587 643.5 56.5
Total 9,298 9,298 0
Source: DCMS (2011) London 2012 Olympic and Paralympic Games: Quarterly Report July 2011
14 | London 2012 Olympics
At the time of the Spending Review Baseline, £587m of the £9.298bn funding package was held as contingency for the programme. As a result of the changes in forecasts, the forecast balance of contingency and other savings remaining has increased by £56.5m to £643.5m. The contingency is available for additional cross-programme issues that may arise, including any major changes in security circumstances.
£7.250bn is available to the ODA which is responsible for building the Olympic Park, whilst the majority of the rest is being spent on security and policing. Costs are net and are underpinned by certain assumptions concerning revenues from land and property disposals. They also exclude costs associated with other investments, such as transport projects which, while already planned, will have some bearing on the Games success.
In addition, LOCOG will spend some £2 billion on the actual event – with approximately one third of this provided by the IOC and the remainder sourced primarily from sponsorship, merchandising and ticket sales.
The intention is that securing the legacy benefits – many of which will come from enhancing existing programmes and from within existing Departmental budgets – will not add to the total funding package for the Games of £9.298 billion. Legacy impacts will be influenced by a wide range of activities and funding sources. These will include, for example, existing regeneration activities within the London 2012 Host Boroughs. They may also include new non-public funding sources. An example is Legacy Trust UK – a new charity established to use sporting and cultural activities to ensure communities from across the UK have a chance to take part in London 2012 and to leave a sustainable legacy after the Games. Using money from existing sources, including the Lottery and the Arts Council, it is endowed with £40 million of expendable funds, with a target to double the value of the fund by 2012.
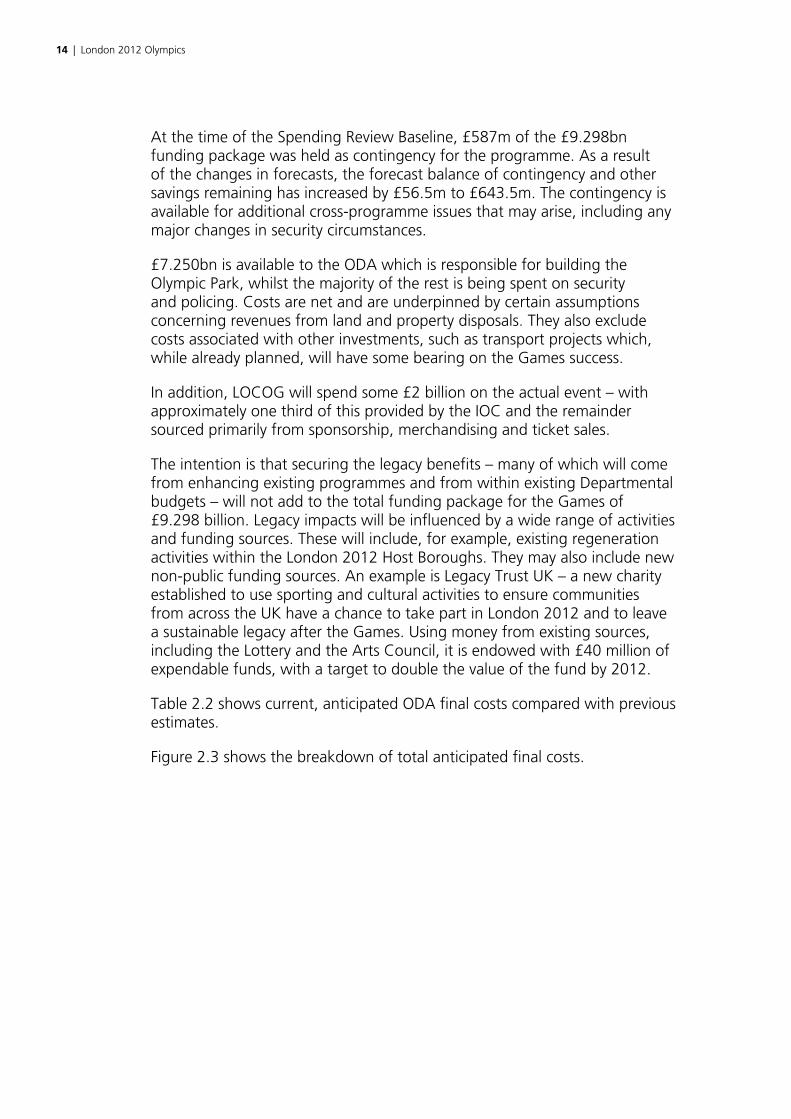
Table 2.2 shows current, anticipated ODA final costs compared with previous estimates.
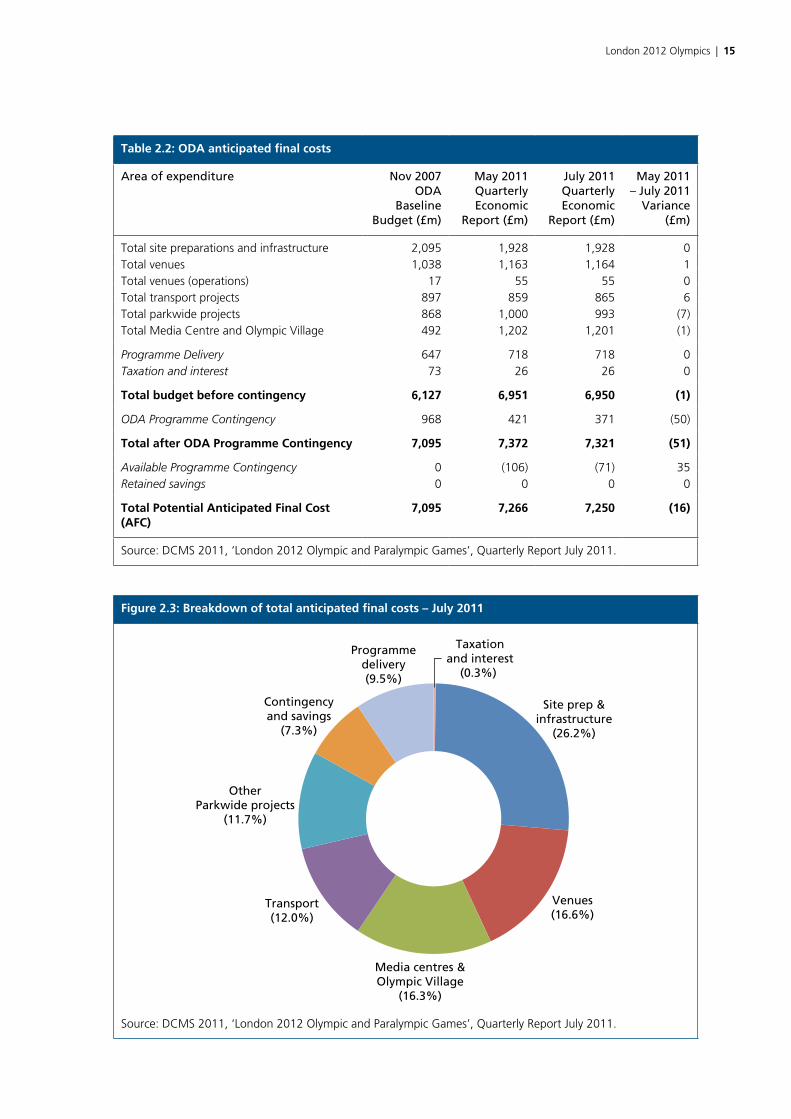
Figure 2.3 shows the breakdown of total anticipated final costs.
London 2012 Olympics | 15
Table 2.2: ODA anticipated final costs
Area of expenditure Nov 2007 ODA
Baseline Budget (£m)
May 2011 Quarterly Economic
Report (£m)
July 2011 Quarterly Economic
Report (£m)
May 2011 – July 2011
Variance (£m)
Total site preparations and infrastructure 2,095 1,928 1,928 0Total venues 1,038 1,163 1,164 1Total venues (operations) 17 55 55 0Total transport projects 897 859 865 6Total parkwide projects 868 1,000 993 (7)Total Media Centre and Olympic Village 492 1,202 1,201 (1)
Programme Delivery 647 718 718 0Taxation and interest 73 26 26 0
Total budget before contingency 6,127 6,951 6,950 (1)
ODA Programme Contingency 968 421 371 (50)
Total after ODA Programme Contingency 7,095 7,372 7,321 (51)
Available Programme Contingency 0 (106) (71) 35Retained savings 0 0 0 0
Total Potential Anticipated Final Cost (AFC)
7,095 7,266 7,250 (16)
Source: DCMS 2011, ‘London 2012 Olympic and Paralympic Games’, Quarterly Report July 2011.
Figure 2.3: Breakdown of total anticipated final costs – July 2011
Site prep &infrastructure
(26.2%)
Venues(16.6%)
Media centres &Olympic Village
(16.3%)
Transport(12.0%)
OtherParkwide projects
(11.7%)
Contingencyand savings
(7.3%)
Taxationand interest
(0.3%)
Programmedelivery(9.5%)
Source: DCMS 2011, ‘London 2012 Olympic and Paralympic Games’, Quarterly Report July 2011.
16 | London 2012 Olympics
2.7 The Games legacy policy framework
The rationale for investing substantial sums of public money in hosting the Games lies in the anticipated economic, social and environmental returns and, especially in the case of the London Games, in the regeneration of deprived areas. The extent to which such benefits will accrue – and the degree to which they will justify the levels of investment – will not be fully known for several years (hence the lengthy timeframe required for evaluation). It is also apparent that the degree to which previous Games have achieved such wide-ranging and transformational benefits is variable – with Barcelona being probably the most successful recent example. However, while seen in this context, the London Games’ aims are ambitious and there is a long history of regeneration activity in east London upon which to build.
A particular priority for regeneration and growth over the past decade has been the Thames Gateway – a 40 mile stretch from London Docklands to Southend in Essex and Sheerness in Kent. In 2003, the first dedicated funding programme was established to accelerate regeneration in the area. In addition, prior to the success of London’s bid to host the 2012 Games, DCLG had created (in 2004) the London Thames Gateway Development Corporation (LTGDC) to tackle the regeneration of large deprived areas in the Lower Lea Valley and London Riverside.
The 2012 Olympic bid was based, in part, on the vision of creating a sustainable legacy for London and the UK. This included the regeneration of one of the most deprived areas in the UK – East London – and creating one of Europe’s largest urban parks. In addition to physical regeneration, of which the transformation after 2012 of Olympic buildings for community use will be a significant part, the Government wanted to inspire people to get involved with the Games and to change the way they live their lives for the better. A Lower Lea Valley Masterplan was prepared in association with the bid.
A large number of aspirations, goals and promises related to the preparations for, and delivery of, the 2012 Games and their legacy have been produced by a range of organisations. Some cover the full spectrum of Games activities while others reflect the specific interests and needs of various groups. The aspirations, goals and promises include:
• 2012 Games Vision and Objectives
The Olympic Board has committed to “host an inspirational, safe and inclusive Olympic and Paralympic Games and leave a sustainable legacy for London and the UK”, with strategic objectives which include:
– delivering the Olympic Park and all venues.... “providing for a sustainable legacy”;
– maximising the economic, social, health and environmental benefits of the Games for the UK, particularly through regeneration and sustainable development in East London; and

London 2012 Olympics | 17
– achieving a sustained improvement in UK sport, in both elite performance and grassroots participation.
The IOC runs the OGI project which monitors the impact of successive Games on their host cities and countries. This goes beyond the hosting of the Games themselves and looks at wider sustainability issues – social, economic and environmental. For the 2012 Games, the OGI is being coordinated by LOCOG on behalf of the IOC. It explicitly monitors a number of disability-based indicators agreed with the International Paralympic Committee.
The then Government’s aspirations were set out in a Public Service Agreement (PSA 22) as being to “deliver a successful Olympic Games and Paralympic Games with a sustainable legacy”. Lead responsibility lies with GOE on behalf of all central government departments and agencies. The PSA was built around five indicators that were designed to ensure that the Games and their impacts are delivered effectively:
– the construction of the Olympic Park and other Olympic venues;
– regeneration benefits of the Games;
– design of the Olympic Park and venues according to sustainable principles;
– public participation in cultural and community activities and in sporting activities; and
– creation of a world-class system for physical education.
The PSA covered the period of the 2007 Spending Review and was therefore focused on the preparation and planning of the Games, the venues and the legacy pre-requisites. Although PSAs have been abolished, the Coalition Government has recently published its own plans for legacy, which confirm the commitment to maximise the Games’ positive impacts (see below).
• The Government’s Legacy Action Plan (LAP)
Five promises were made by the then Government for the London 2012 legacy:
– making the UK a world-leading sporting nation;
– transforming the heart of East London;
– inspiring a new generation of young people to take part in volunteering, cultural and physical activity;
– making the Olympic Park a blueprint for sustainable living; and
– demonstrating that the UK is a creative, inclusive and welcoming place to live in, visit and for business.
To achieve these outcomes the GOE developed the Legacy Action Plan (LAP) which sets out what will be delivered under each promise. The LAP provides a starting point for the development of the evaluation programme with a list of high level objectives and plans.
18 | London 2012 Olympics
The Coalition Government has recently identified four areas that will be focused on in order to make the most of the Games for the nation, as follows:
– harnessing the United Kingdom’s passion for sport to increase grass roots participation, particularly by young people – and to encourage the whole population to be more physically active;
– exploiting to the full the opportunities for economic growth offered by hosting the Games;
– promoting community engagement and achieving participation across all groups in society through the Games; and
– ensuring that the Olympic Park can be developed after the Games as one of the principal drivers of regeneration in East London.
The Nations and Regions Group (NRG) has the responsibility for ensuring the whole of the UK benefits from the 2012 Games. It is made up of twelve senior representatives from UK business and sport: nine from the English regions and one each from Scotland, Wales and Northern Ireland – the ‘home nations’.
However, while the legacy benefits will be felt regionally and nationally, the biggest impact will be for those living and working in East London, with the hosting of the Games potentially transforming lives by improving the social, physical and economic landscape in one of the most deprived areas of London.
• Legacy Masterplan Framework (LMF)
In relation to the Olympic Park, the OPLC was established early in 2009 to implement the LMF. The Company consists of private sector representatives, two public sector representatives (the Mayors of Newham and Hackney) board appointees made by the DCLG and GLA and a political advisory group that represents wider public sector interests. Legislation is due to be introduced to establish a new 2012 Mayoral Development Corporation that will assume overall responsibility for delivery of local legacy benefits.
The LMF is a spatial development masterplan for the Olympic Park after 2012. It will determine the form and function of the entire Park, including its stadia, neighbourhood areas and green space, with the aim to “transform the Olympic Park into a prosperous and sustainable community for east London and to be a successful catalyst for investment and development opportunities”.
The OPLC issued modified proposals for the Olympic Park in October 2010 which included development at a lower density. The latest proposals identify a number of sub areas, including:
– South Park – identified as an ‘entertainment’ area;
– North Park – a park roughly the same size as St James’s Park;
– Old Ford – a low rise residential district;
London 2012 Olympics | 19
– Creative district – which includes the press and broadcast centres, and will incorporate terraced town housing;
– North-east – further low-rise housing, bordering the Olympic Village, which is high-rise;
– Stratford Waterfront – the largest residential neighbourhood, with a mix of property types and densities; and
– Pudding Mill – a mix of housing, community and some light industrial uses.
Since the LMF deals primarily with physical regeneration it was agreed there was also a need for a strategic regeneration framework to cover broader Olympics legacy-related regeneration benefits in the London 2012 Host Boroughs (see below). The ambition is that the LMF and the Host Boroughs’ Strategic Regeneration Framework will be regarded as a single strategy.
• Strategic Regeneration Framework (SRF) for the Olympic Park and Lower Lea Valley
The purpose of the five host borough-led SRF is to ensure that the physical outcomes of the Legacy Masterplan Framework are accompanied by socio-economic interventions and benefits. Seven key outcomes were proposed in the SRF to provide a focus for all of the planning and policy decisions relevant to the legacy and are based on the key principle of “convergence”, i.e. the elimination of the deprivation gap between the London 2012 Host Boroughs and the London average between 2010 and 2030. The Framework includes interim targets to be met by 2015, which are set out in Section 2.8 below. The outcomes of the SRF are:
– creating a coherent and high-quality attractive city within a world city region;
– improving educational attainment, skills and raising aspirations;
– reducing worklessness, benefit dependency and child poverty;
– homes for all;
– enhancing health and wellbeing;
– reducing serious crime rates and anti-social behaviour; and
– maximising the sports legacy and raising participation levels.
At the time of writing, the London 2012 Host Boroughs were reviewing progress to date and were planning to publish an update of the SRF in late 2011.
A draft Multi Area Agreement (MAA) was also developed to take forward action in three areas identified as key economic drivers (worklessness and skills, housing and developing communities and the public realm) in the SRF. Signatories included the then Government, the London 2012 Host Boroughs, the Homes and Communities Agency, the ODA, the GLA, JobCentre Plus and the London Skills and Employment Board. While the formal process of Local Area and Multi Area Agreements has now been
20 | London 2012 Olympics
abolished, the principle of joint working across the London 2012 Host Boroughs to achieve legacy benefits continues to be supported. The Mayor of London and the Mayors and Leaders of the London 2012 Host Boroughs are all committed to the core principles of the SRF and are working to reflect it in their plans and priorities. The recent DCMS plans for the legacy document reaffirm the commitment to the London 2012 Host Boroughs’ convergence vision.
• The London policy framework
The Mayor of London – DCLG’s partner in the OPLC – has given five commitments, published by the GLA in January 2008 and based on the 2012 promises, which focus on ensuring that London and its residents benefit from, and take advantage of, the opportunities associated with the Games. They are:
– increase opportunities for Londoners to become involved in sport;
– ensure Londoners benefit from new jobs, business and volunteering opportunities;
– transform the heart of east London;
– deliver a sustainable Games; and
– showcase London as a diverse, creative and welcoming city.
To further these objectives, realising the Olympics’ legacy benefits is a key element within the wider London policy framework including, for example, the Mayor’s:
– Investment Strategy;
– Economic Development Strategy; and
– Tourism Action Plan.
In addition, a Sports Legacy Plan and a London 2012 Sustainability Plan have been produced. The London 2012 Sustainability Plan, Towards a One Planet 2012, addresses five areas – climate change, waste, biodiversity, inclusion and healthy living – and sets out how specific goals will be met before, during and after the Games. A Commission for a Sustainable London 2012 has also been established, tasked independently to assure the pledge to stage the most sustainable Games to date and that their legacy is achieved.
The Mayor of London has indicated that he considers the Games and ensuring their legacy “….will be London’s single most important regeneration project for the next 25 years”. Through the Localism Bill, the Government intends to give the Mayor of London the powers to drive forward Olympic regeneration in East London.

London 2012 Olympics | 21
2.8 Legacy themes and ambitions
Aligning and integrating the above plans and their related actions is essential if legacy benefits are to be maximised. Analysis of the plans reveals a broad commonality in terms of their main themes and ambitions. While the level of impact that the Games might have will inevitably vary by indicator and spatial level, a common, broad, thematic framework can be derived. It is proposed this should be used for structuring this evaluation’s assessment of impact. This comprises four regeneration legacy ‘themes’:
• Place and Environment;
• Economy and Skills;
• Social and Community; and
• Sport and Health.
Table 2.3 outlines the relationship between these themes and the national and local priorities for the London 2012 legacy contained in two of the key policy documents – namely, the Legacy Action Plan and the Strategic Regeneration Framework.
Table 2.3: Key themes and relationship to legacy policy priorities
Strategic Regeneration Framework Priority
Key theme Legacy Action Plan Priority
Provide homes for all
Place and Environment
Make the Olympic Park a blueprint for sustainable living
Create a coherent and attractive city within a city region
Transform the heart of East London
Improve educational attainment, skills and raise aspirations
Economy and Skills
Inspire young people
Reduce worklessness, benefit dependency and child poverty
Demonstrate the UK is a place to live in, work and do business
Reduce serious crime rates and antisocial behaviour
Social and Community
Maximise sports legacy and increase participation Sport and Health
Make the UK a world-leading sporting nation
Enhance health and well-being
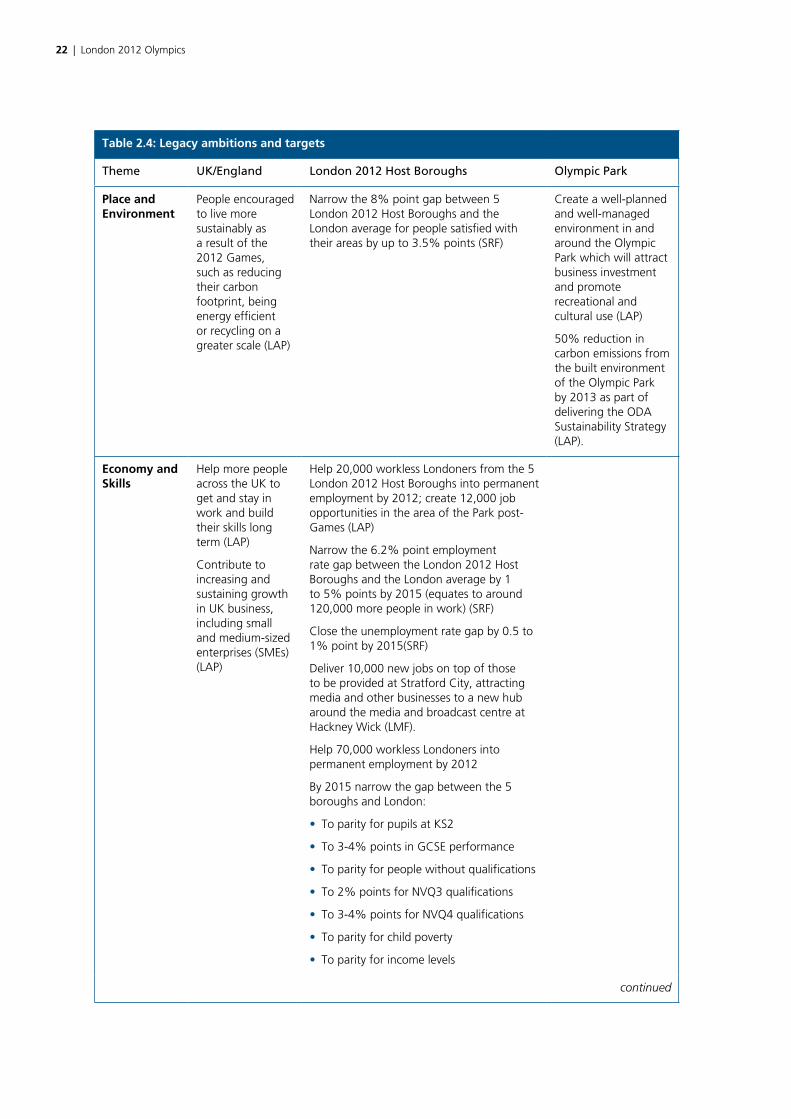
The plans and frameworks also incorporate a number of ambitions and targets. Table 2.4 provides a summary of these. It lists the identified targets according to their spatial coverage grouped according to the four broad themes.
22 | London 2012 Olympics
Table 2.4: Legacy ambitions and targets
Theme UK/England London 2012 Host Boroughs Olympic Park
Place and Environment
People encouraged to live more sustainably as a result of the 2012 Games, such as reducing their carbon footprint, being energy efficient or recycling on a greater scale (LAP)
Narrow the 8% point gap between 5 London 2012 Host Boroughs and the London average for people satisfied with their areas by up to 3.5% points (SRF)
Create a well-planned and well-managed environment in and around the Olympic Park which will attract business investment and promote recreational and cultural use (LAP)
50% reduction in carbon emissions from the built environment of the Olympic Park by 2013 as part of delivering the ODA Sustainability Strategy (LAP).
Economy and Skills
Help more people across the UK to get and stay in work and build their skills long term (LAP)
Contribute to increasing and sustaining growth in UK business, including small and medium-sized enterprises (SMEs) (LAP)
Help 20,000 workless Londoners from the 5 London 2012 Host Boroughs into permanent employment by 2012; create 12,000 job opportunities in the area of the Park post-Games (LAP)
Narrow the 6.2% point employment rate gap between the London 2012 Host Boroughs and the London average by 1 to 5% points by 2015 (equates to around 120,000 more people in work) (SRF)
Close the unemployment rate gap by 0.5 to 1% point by 2015(SRF)
Deliver 10,000 new jobs on top of those to be provided at Stratford City, attracting media and other businesses to a new hub around the media and broadcast centre at Hackney Wick (LMF).
Help 70,000 workless Londoners into permanent employment by 2012
By 2015 narrow the gap between the 5 boroughs and London:
• To parity for pupils at KS2
• To 3-4% points in GCSE performance
• To parity for people without qualifications
• To 2% points for NVQ3 qualifications
• To 3-4% points for NVQ4 qualifications
• To parity for child poverty
• To parity for income levels
continued
London 2012 Olympics | 23
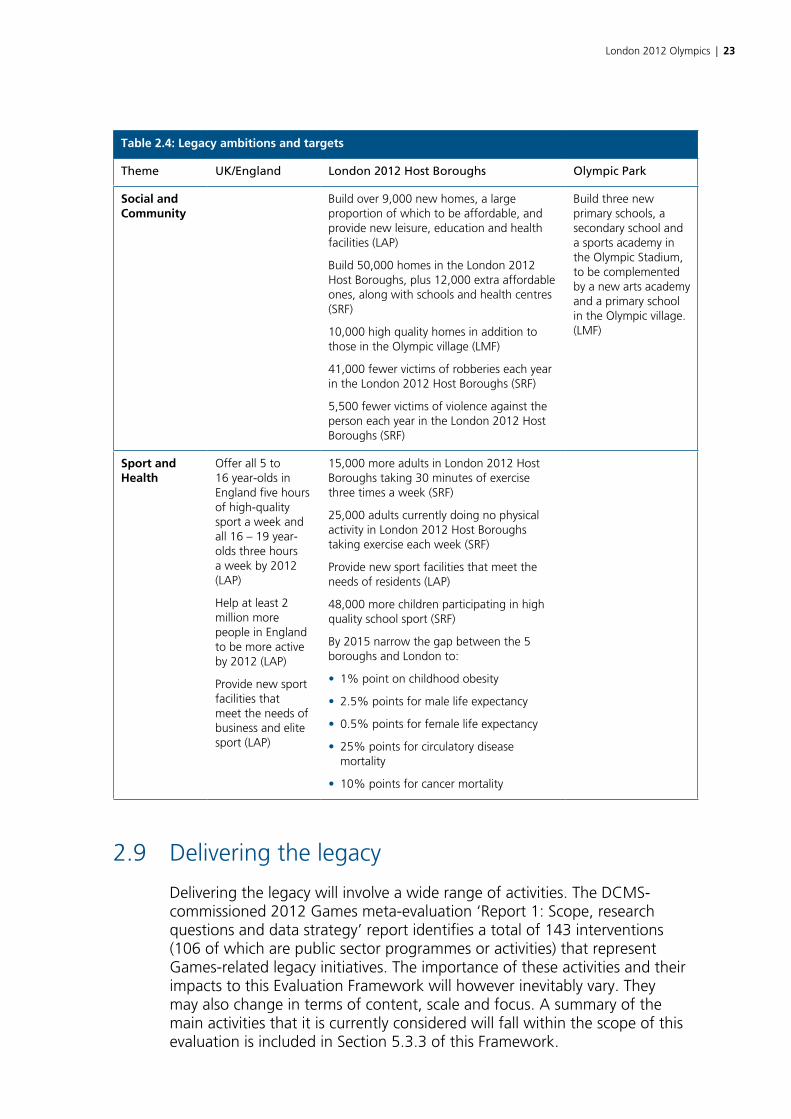
Table 2.4: Legacy ambitions and targets
Theme UK/England London 2012 Host Boroughs Olympic Park
Social and Community
Build over 9,000 new homes, a large proportion of which to be affordable, and provide new leisure, education and health facilities (LAP)
Build 50,000 homes in the London 2012 Host Boroughs, plus 12,000 extra affordable ones, along with schools and health centres (SRF)
10,000 high quality homes in addition to those in the Olympic village (LMF)
41,000 fewer victims of robberies each year in the London 2012 Host Boroughs (SRF)
5,500 fewer victims of violence against the person each year in the London 2012 Host Boroughs (SRF)
Build three new primary schools, a secondary school and a sports academy in the Olympic Stadium, to be complemented by a new arts academy and a primary school in the Olympic village. (LMF)
Sport and Health
Offer all 5 to 16 year-olds in England five hours of high-quality sport a week and all 16 – 19 year-olds three hours a week by 2012 (LAP)
Help at least 2 million more people in England to be more active by 2012 (LAP)
Provide new sport facilities that meet the needs of business and elite sport (LAP)
15,000 more adults in London 2012 Host Boroughs taking 30 minutes of exercise three times a week (SRF)
25,000 adults currently doing no physical activity in London 2012 Host Boroughs taking exercise each week (SRF)
Provide new sport facilities that meet the needs of residents (LAP)
48,000 more children participating in high quality school sport (SRF)
By 2015 narrow the gap between the 5 boroughs and London to:
• 1% point on childhood obesity
• 2.5% points for male life expectancy
• 0.5% points for female life expectancy
• 25% points for circulatory disease mortality
• 10% points for cancer mortality
2.9 Delivering the legacy
Delivering the legacy will involve a wide range of activities. The DCMS-commissioned 2012 Games meta-evaluation ‘Report 1: Scope, research questions and data strategy’ report identifies a total of 143 interventions (106 of which are public sector programmes or activities) that represent Games-related legacy initiatives. The importance of these activities and their impacts to this Evaluation Framework will however inevitably vary. They may also change in terms of content, scale and focus. A summary of the main activities that it is currently considered will fall within the scope of this evaluation is included in Section 5.3.3 of this Framework.
24 | London 2012 Olympics
3 Scope of the Evaluation Framework
3.1 Introduction
This section outlines the scope of the evaluation. It considers the aspects of the Games and legacy impacts and activities that will be of most interest to DCLG. A logic chain approach is used to identify the key measurables and their inter-relationships.
3.2 Overview
3.2.1 DCLG’s priorities
DCLG’s Business Plan 2011–2015 identifies that its major responsibilities include:
• supporting local government – the Department is to radically transform local government, freeing it from central regulation and regional control to ensure essential services are delivered according to local needs;
• communities and neighbourhoods – the Department will ensure that citizens are able to make the best of their communities, removing barriers so that they are able to overcome difficulties and using neighbourhoods as the building blocks for action;
• regeneration – the Department aims to support regeneration and reduce disadvantage and deprivation, ensuring value for money from European Union (EU) programmes, decentralising the Thames Gateway and working with London’s Mayor to ensure a lasting legacy from the Games;
• housing – the Department will oversee housing and homelessness policy in England; and
• planning, building and the environment – the Department is responsible for planning policy and building regulations in England.
The Department has overall responsibility within Government for coordination of the Olympic Legacy Programme. It has a particular interest in the regeneration impacts upon east London.
London 2012 Olympics | 25
3.2.2 Scope of activities
The evaluation will need to assess activities involved in:
• the preparation for the Games (i.e. from 2003 onwards – the date of the decision to bid) including the provision of venues and infrastructure;
• the staging of the Games themselves; and
• securing the post-Games legacy.
The latter will include activities that are:
• ‘new’ and are designed (at least in part) to help deliver legacy objectives; and
• ‘existing’ but which have been modified in some way (e.g. scale, scope or timing) to help achieve legacy objectives and/or capitalise upon the Games.
The focus will be on those interventions on which DCLG has direct spend, those where it exerts (varying) degrees of influence and those which will impact upon regeneration outcomes. These will include those that:
• are directly linked to delivery of the 2012 Games i.e. those programmes and projects which will be paid for from the allocated 2012 Budget (£9.3bn);
• are directly associated with delivery of the key commitments made by Government – especially those connected with the Legacy Action Plan, Legacy Masterplan Framework, Strategic Regeneration Framework and the Sustainability Plan and those which fall within the remit of the East London Legacy Board; and
• represent other significant initiatives which have been influenced by the 2012 Games – including in particular those connected with the Thames Gateway (for example, through the London Thames Gateway Development Corporation).
3.2.3 Geographical focus
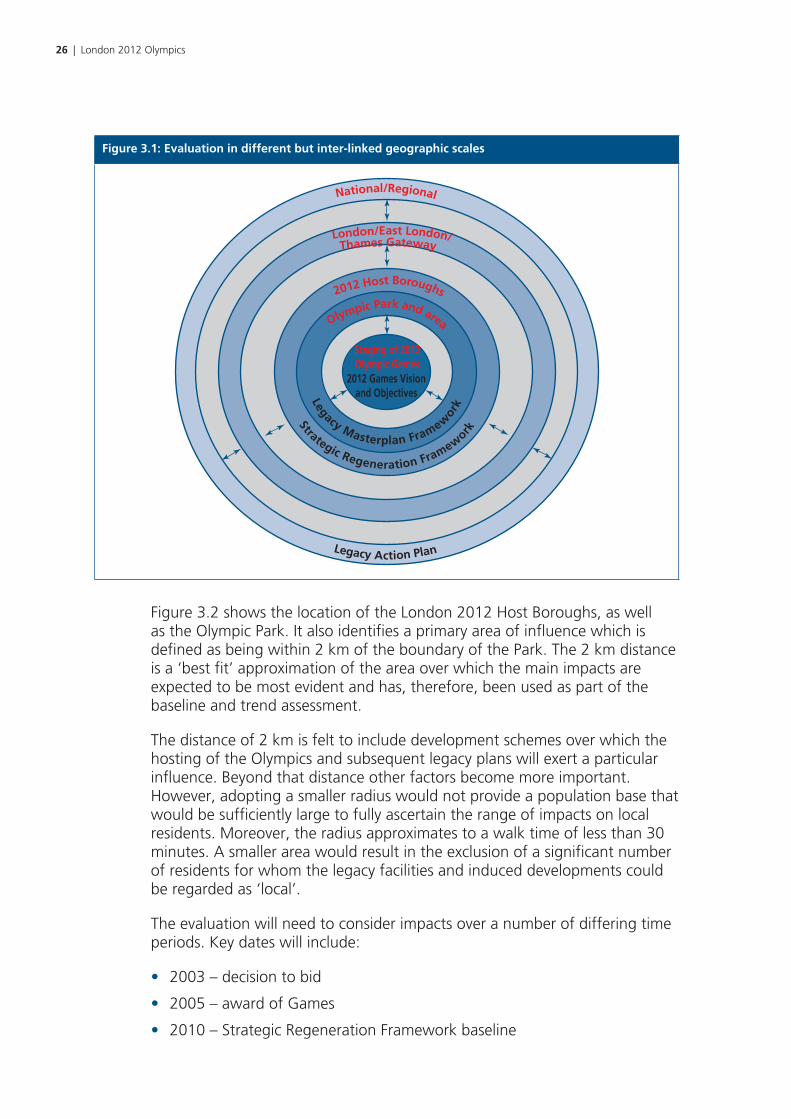
The evaluation will particularly (but not exclusively) focus on impacts across and within the Thames Gateway and East London. The transformation of the latter area was a key part of the rationale for hosting the Games and it is at this spatial scale that the greatest impacts will potentially be felt. The analysis will however need to consider ‘relative’ as well as ‘absolute’ change in condition. It will need to compare change at different spatial scales in order to determine the extent to which ‘gaps’ between areas may have changed – including convergence within the London 2012 Host Boroughs as well as between the boroughs and the rest of London (and the UK).
The varying and inter-linked geographic focuses for the evaluation are illustrated in Figure 3.1.
26 | London 2012 Olympics
Figure 3.1: Evaluation in different but inter-linked geographic scales
Staging of 2012Olympic Games
2012 Games Visionand ObjectivesLegacy Masterplan Framew
ork
Strategic Regeneration Framework
Legacy Action Plan
National/Regional
2012 Host Boroughs
London/East London/Thames Gateway
Olympic Park and area
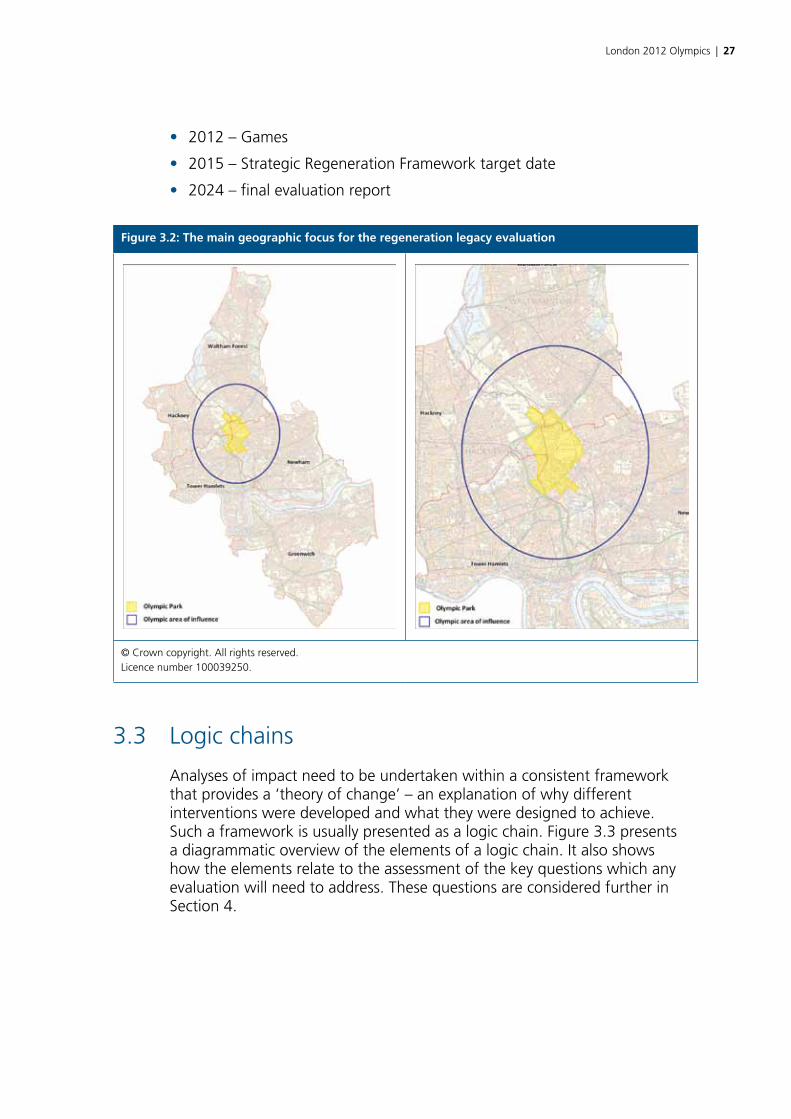
Figure 3.2 shows the location of the London 2012 Host Boroughs, as well as the Olympic Park. It also identifies a primary area of influence which is defined as being within 2 km of the boundary of the Park. The 2 km distance is a ‘best fit’ approximation of the area over which the main impacts are expected to be most evident and has, therefore, been used as part of the baseline and trend assessment.
The distance of 2 km is felt to include development schemes over which the hosting of the Olympics and subsequent legacy plans will exert a particular influence. Beyond that distance other factors become more important. However, adopting a smaller radius would not provide a population base that would be sufficiently large to fully ascertain the range of impacts on local residents. Moreover, the radius approximates to a walk time of less than 30 minutes. A smaller area would result in the exclusion of a significant number of residents for whom the legacy facilities and induced developments could be regarded as ‘local’.
The evaluation will need to consider impacts over a number of differing time periods. Key dates will include:
• 2003 – decision to bid
• 2005 – award of Games
• 2010 – Strategic Regeneration Framework baseline
London 2012 Olympics | 27
• 2012 – Games
• 2015 – Strategic Regeneration Framework target date
• 2024 – final evaluation report
Figure 3.2: The main geographic focus for the regeneration legacy evaluation
© Crown copyright. All rights reserved. Licence number 100039250.
3.3 Logic chains
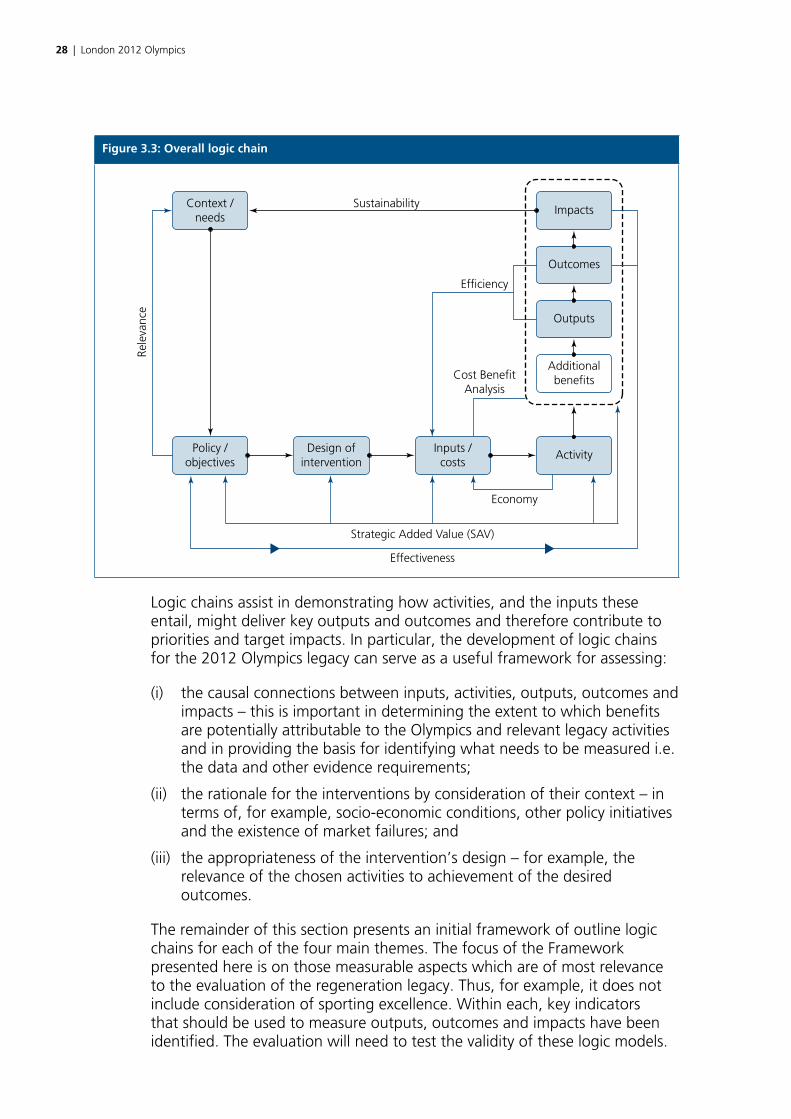
Analyses of impact need to be undertaken within a consistent framework that provides a ‘theory of change’ – an explanation of why different interventions were developed and what they were designed to achieve. Such a framework is usually presented as a logic chain. Figure 3.3 presents a diagrammatic overview of the elements of a logic chain. It also shows how the elements relate to the assessment of the key questions which any evaluation will need to address. These questions are considered further in Section 4.
28 | London 2012 Olympics
Figure 3.3: Overall logic chain
Context /needs
ImpactsSustainability
Efficiency
Rele
vanc
e
Cost BenefitAnalysis
Economy
Strategic Added Value (SAV)
Effectiveness
Policy /objectives
Design ofintervention
Inputs /costs
Activity
Outcomes
Outputs
Additionalbenefits
Logic chains assist in demonstrating how activities, and the inputs these entail, might deliver key outputs and outcomes and therefore contribute to priorities and target impacts. In particular, the development of logic chains for the 2012 Olympics legacy can serve as a useful framework for assessing:
(i) the causal connections between inputs, activities, outputs, outcomes and impacts – this is important in determining the extent to which benefits are potentially attributable to the Olympics and relevant legacy activities and in providing the basis for identifying what needs to be measured i.e. the data and other evidence requirements;
(ii) the rationale for the interventions by consideration of their context – in terms of, for example, socio-economic conditions, other policy initiatives and the existence of market failures; and
(iii) the appropriateness of the intervention’s design – for example, the relevance of the chosen activities to achievement of the desired outcomes.
The remainder of this section presents an initial framework of outline logic chains for each of the four main themes. The focus of the Framework presented here is on those measurable aspects which are of most relevance to the evaluation of the regeneration legacy. Thus, for example, it does not include consideration of sporting excellence. Within each, key indicators that should be used to measure outputs, outcomes and impacts have been identified. The evaluation will need to test the validity of these logic models.

London 2012 Olympics | 29
3.4 Place and environment
The main impacts of the Games will be felt within East London where the majority of events will be held. Therefore, this is the primary focus for investment in facilities and infrastructure. The opportunity to use the Games in order to develop more prosperous, coherent and integrated communities within the area is a key aspect of the rationale for public sector investment.
East London is characterised by major problems of multiple deprivation in the communities of the London 2012 Host Boroughs and a legacy of brownfield and contaminated sites – particularly in the Olympic Park area. The 2012 Olympics provides a significant opportunity to catalyse private and public sector investment to achieve the sustainable regeneration of the area. It is also being used to promote improved environmental sustainability and high quality architecture and design.
Figure 3.4 summarises the logic chain for ‘Place and environment’.
Figure 3.4: Place and environment logic chain
• Lack of a coherent and uniform high quality environment• Excellent eternal connectivity but limited internal connectivity within the 5 boroughs area.• Need for affordable quality housing• High levels of area deprivation and spatial inequality
Contextualconditions
Policycontext
Inputs Activities
• Legacy Action Plan• SRF for Olympic Park and Lower Lea• Local Developoment Frameworks• 2012 Sustainability Plan• London Plan
• Financial resources – public and private• Human resources – promoters and other partners• Co-ordination – of public and private inputs• Partnerships and engagement
• Deprivation levels• Population• Population density• Neighbourhood role• House prices• House affordability• Commercial property values
• Vacant/derelict previously developed land• Average PTAL• Total dwellings (by tenure)• Vacant dwellings• Greenspace per resident• Accessibility• Quality of place
• Staging of the Games• Related community events• Post-Games use of facilities• Site preparation and servicing• Public realm improvements• Transportation improvements
• Additional homes provided (by tenure)• New/improved transport infrastructure• Land developed• Industrial/commercial property improved• Industrial/commercial property let/ sold• Environemntal impacts of new developments• Amenities and facilities
Area conditions in terms of:• Waste produced and recycled• Air quality• Water quality• Biodiversity• Light and noise levels• CO2 and greenhouse gas• Energy efficiency
Outputs
Outcomes
Impacts

30 | London 2012 Olympics
3.5 Economy and skills
The Games will potentially generate economic benefits in a number of ways. The major direct investment in its staging and hosting plus the expenditure of visitors will lead to business activity and employment opportunities. In addition, the London 2012 legacy of modernised infrastructure, premises and land will include significant opportunities for the location of new employment-generating uses. Other benefits will be derived as a result of, for example, volunteering and associated skills development programmes. More indirectly, the Games through its ‘showcasing’ effects could lead to wider benefits ranging from the attraction of new investment and a more resilient local economy through to stimulating improved educational performance.
Figure 3.5 summarises the logic chain for ‘Economy and skills’.
Figure 3.5: Economy and skills logic chain
Within East London:• Low levels of educational attainment• Low employment rate• Child poverty• Diverse population often facing a range of barriers to work
Contextualconditions
Policycontext
Inputs Activities
• Legacy Action Plan• SRF for Olympic Park and Lower Lea• 2012 Sustainability Plan• Mayor’s Economic Development Strategy 2010• London Tourism Action Plan 2009–13• LDA Investment Strategy 2010–13• 5 Boroughs MAA
• Financial resources – public and private• Human resources – promoters and other partners• Co-ordination – of public and private inputs• Partnerships and engagement
• Workless rate• Job Seekers’ Allowance (JSA) rate• Employment rate• Lone parents on benefits• Child in poverty• Income levels• Net additional Gross Value Added (GVA)
• Business units• business turnover• Business start-ups• Employment (in local businesses)• Persons with degree level qualifications• Persons with no qualifications• Key Stage 4 average points scores• Key Stage 2 average points scores
• Staging of the Games• Related events e.g. Cultural Olympiad• Employment, skills and training programmes• Business, enterprise and investment programme• Post games employment generating uses – including press and media centres• Education programmes
• Investment (£)• Visitor numbers• Visitor spend• New and improved business floorspace• Volunteers• Games-related qualifications
Outputs
Outcomes
Impacts
London 2012 Olympics | 31
3.6 Social and community
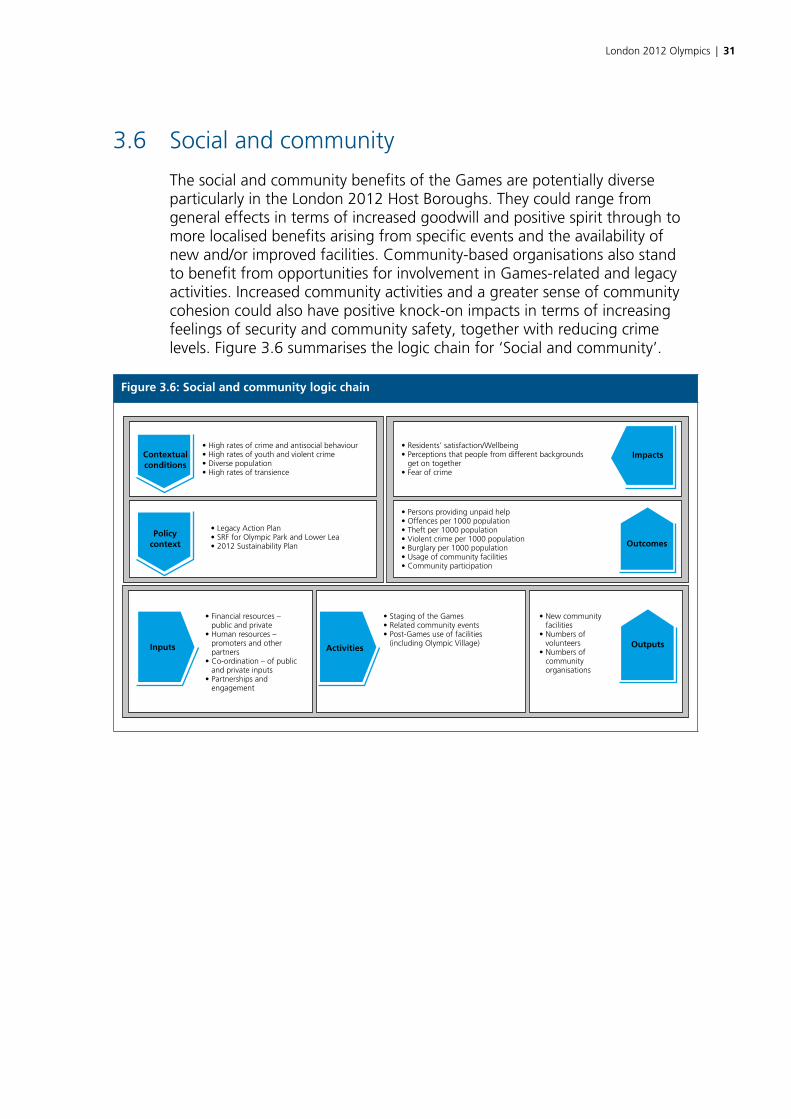
The social and community benefits of the Games are potentially diverse particularly in the London 2012 Host Boroughs. They could range from general effects in terms of increased goodwill and positive spirit through to more localised benefits arising from specific events and the availability of new and/or improved facilities. Community-based organisations also stand to benefit from opportunities for involvement in Games-related and legacy activities. Increased community activities and a greater sense of community cohesion could also have positive knock-on impacts in terms of increasing feelings of security and community safety, together with reducing crime levels. Figure 3.6 summarises the logic chain for ‘Social and community’.
Figure 3.6: Social and community logic chain
• High rates of crime and antisocial behaviour• High rates of youth and violent crime• Diverse population• High rates of transience
Contextualconditions
Policycontext
Inputs Activities
• Legacy Action Plan• SRF for Olympic Park and Lower Lea• 2012 Sustainability Plan
• Financial resources – public and private• Human resources – promoters and other partners• Co-ordination – of public and private inputs• Partnerships and engagement
• Residents’ satisfaction/Wellbeing• Perceptions that people from different backgrounds get on together• Fear of crime
• Persons providing unpaid help• Offences per 1000 population• Theft per 1000 population• Violent crime per 1000 population• Burglary per 1000 population• Usage of community facilities• Community participation
• Staging of the Games• Related community events• Post-Games use of facilities (including Olympic Village)
• New community facilities• Numbers of volunteers• Numbers of community organisations
Outputs
Outcomes
Impacts

32 | London 2012 Olympics
3.7 Sport and health
As a major event, the Olympics will raise the profile of sporting activity and therefore may well inspire people (across all ability levels) to become more physically active. It will also serve to leave a legacy of new and improved facilities. Any resulting increase in participation in physical exercise will generate a range of health benefits that, in turn, can lead to other regeneration benefits (such as reducing barriers to work). In addition, sport can fulfil a significant diversionary role leading to reduced anti-social behaviour. A number of specific initiatives (for example, as part of the Mayor’s Sports Legacy Plan) have been developed to help ensure that these benefits accrue.
Figure 3.7 summarises the logic chain for ‘Sport and health’.
Figure 3.7: Sport and health logic chain
• Significant health inequalities within East London• High levels of long-term limiting illness• Premature mortality• High circulatory disease mortality• High childhood obesity• Unhealthy lifestyles
Contextualconditions
Policycontext
Inputs Activities
• Legacy Action Plan• SRF for Olympic Park and Lower Lea• 2012 Sustainability Plan• Mayor’s Sports Legacy Plan, ‘A Sporting Future for London’
• Financial resources – public and private• Human resources – promoters and other partners• Co-ordination – of public and private inputs• Partnerships and engagement
• Children’s obesity• Self-reported well-being• Life expectancy at birth• Cancer mortality• Circulatory disease mortality
• Adult participation rates• Children’s participation rates
• Provision of facilities for the Games• Staging the Games• Awareness – raising activities• Community sports events• School sports• Official Sports London• Inclusive Fitness Initiative• London Leisure Academy• SRF actions
• New sporting facilities• Access to facilities
Outputs
Outcomes
Impacts
London 2012 Olympics | 33
4 Addressing the key evaluation questions
4.1 Introduction
This section summarises the key questions that the evaluation will need to address and the framework for their assessment. It considers them under four broad headings:
• costs;
• impacts;
• processes; and
• value for money.
4.2 Costs
The full financial and economic costs will need to be calculated. In terms of the public sector, these will comprise:
• the cost of the Games – estimated to be up to £9.3 billion in public or exchequer costs (treating National Lottery Funding as public);
• other exchequer costs linked to key programmes attempting to optimise/capitalise on the Games legacy. As well as major capital investments in infrastructure and public realm, this will also include increased operational and maintenance costs associated with, for example, management of the environment; and
• ‘transaction costs’ arising from the public sector’s participation in the various structures and processes established to administer the Games and its legacy.
However, only a proportion of these costs will be attributable to the regeneration legacy benefits. Consequently, a robust analysis will be required to (a) consider the counterfactual scenario (i.e. what would have happened without the Games) in relation to each area of expenditure and (b) identify the proportion of each area of expenditure that is primarily concerned to deliver regeneration benefits. Thus, for example, it would not be appropriate to attribute all of the security costs to the regeneration legacy. The disaggregation of expenditure to different benefits will need to be agreed as part of the meta-Evaluation Framework.
Box 4.1 sets out information about possible counterfactual regeneration programmes for the Lower Lea Valley, which were being developed and
34 | London 2012 Olympics
appraised in 2003 before the decision to bid to host the 2012 games. Further details of the forecast benefits associated with these expenditures is included in Box 4.2 in Section 4.3.
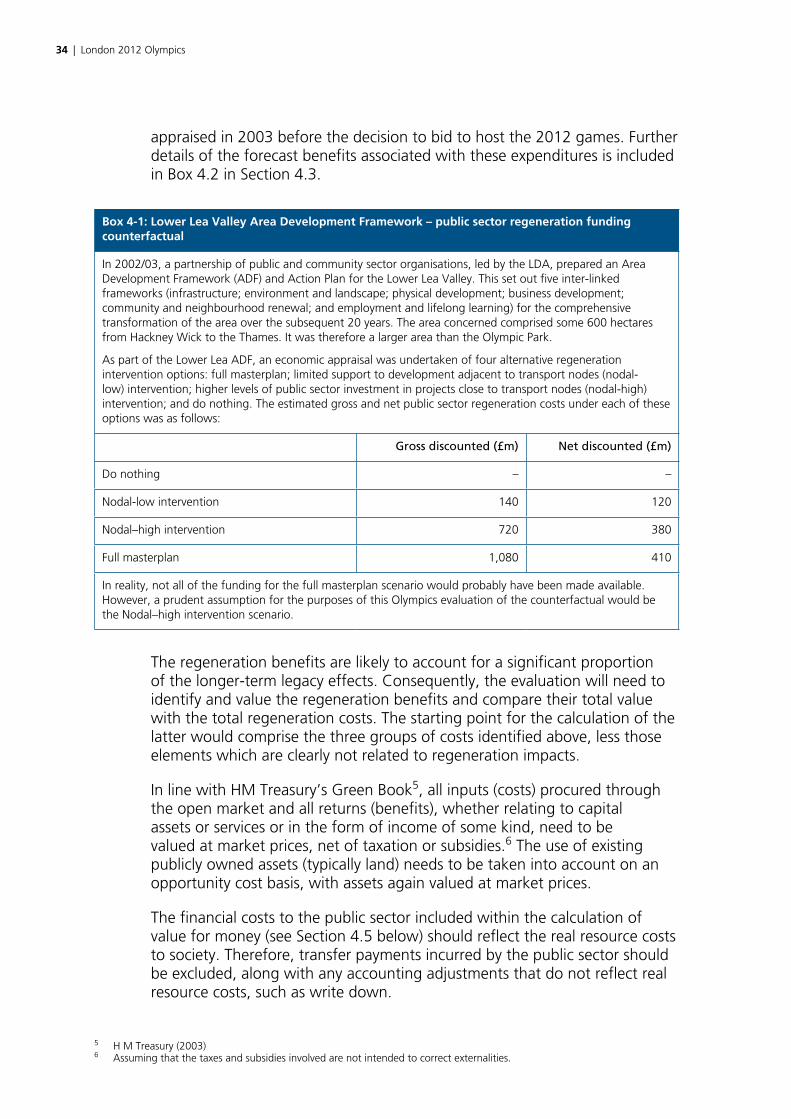
Box 4-1: Lower Lea Valley Area Development Framework – public sector regeneration funding counterfactual
In 2002/03, a partnership of public and community sector organisations, led by the LDA, prepared an Area Development Framework (ADF) and Action Plan for the Lower Lea Valley. This set out five inter-linked frameworks (infrastructure; environment and landscape; physical development; business development; community and neighbourhood renewal; and employment and lifelong learning) for the comprehensive transformation of the area over the subsequent 20 years. The area concerned comprised some 600 hectares from Hackney Wick to the Thames. It was therefore a larger area than the Olympic Park.
As part of the Lower Lea ADF, an economic appraisal was undertaken of four alternative regeneration intervention options: full masterplan; limited support to development adjacent to transport nodes (nodal-low) intervention; higher levels of public sector investment in projects close to transport nodes (nodal-high) intervention; and do nothing. The estimated gross and net public sector regeneration costs under each of these options was as follows:
Gross discounted (£m) Net discounted (£m)
Do nothing – –
Nodal-low intervention 140 120
Nodal–high intervention 720 380
Full masterplan 1,080 410
In reality, not all of the funding for the full masterplan scenario would probably have been made available. However, a prudent assumption for the purposes of this Olympics evaluation of the counterfactual would be the Nodal–high intervention scenario.
The regeneration benefits are likely to account for a significant proportion of the longer-term legacy effects. Consequently, the evaluation will need to identify and value the regeneration benefits and compare their total value with the total regeneration costs. The starting point for the calculation of the latter would comprise the three groups of costs identified above, less those elements which are clearly not related to regeneration impacts.
In line with HM Treasury’s Green Book5, all inputs (costs) procured through the open market and all returns (benefits), whether relating to capital assets or services or in the form of income of some kind, need to be valued at market prices, net of taxation or subsidies.6 The use of existing publicly owned assets (typically land) needs to be taken into account on an opportunity cost basis, with assets again valued at market prices.
The financial costs to the public sector included within the calculation of value for money (see Section 4.5 below) should reflect the real resource costs to society. Therefore, transfer payments incurred by the public sector should be excluded, along with any accounting adjustments that do not reflect real resource costs, such as write down.
5 H M Treasury (2003)6 Assuming that the taxes and subsidies involved are not intended to correct externalities.
London 2012 Olympics | 35
The Games will result in a range of negative externalities, such as adverse environmental impacts, meaning that market prices will differ from social valuations. These externalities should be dealt with as separate adjustments to the impacts (see below). The negative ‘effects’ will also include, for example:
• displacement of expenditures, for example, residents’ spend on Olympics rather than other activities in the area and tourist spend diverted from other areas/activities;
• relocation of business activity from the area; and
• ‘crowding out’ of other investment.
4.3 Impacts
4.3.1 Overview
The evaluation will need to assess:
• changes in conditions at different geographic levels – in particular, within the London 2012 Host Boroughs and Olympic Park and adjoining areas;
• changes in conditions for different people/communities, for example, by age, gender, ethnicity, disability; and
• the durability of the changes (including the extent to which new self-reinforcing processes have been established).
There will be a need to isolate the effects of the Olympics from other processes/activities. This will require the consideration (and quantification) of ‘counterfactual’ scenarios regarding:
• Activities – would activities have taken place without the Olympics? If so how and what likely changes would they have induced?
• Outputs, outcomes and impacts – what changes would have occurred without the Olympics and associated activities?
Establishing the ‘counterfactual’ will involve use of a combination of ‘bottom-up’ case study evidence (including interviews with funders, deliverers and beneficiaries) and ‘top-down’ quantitative analysis. The latter will include econometric modelling (see Section 4.3.3). Evidence will need to be derived from existing data sets, commissioned data and surveys, and case study reviews (including beneficiary surveys).
As with any evaluation, four broad questions concerning impact will need to be addressed namely:
• How have things changed?
• To what extent are these changes attributable to the Olympics? (i.e. are there identifiable additional impacts due to the Games)?
36 | London 2012 Olympics
• How durable are the changes?
• What is the value of these changes?
These are considered in turn.
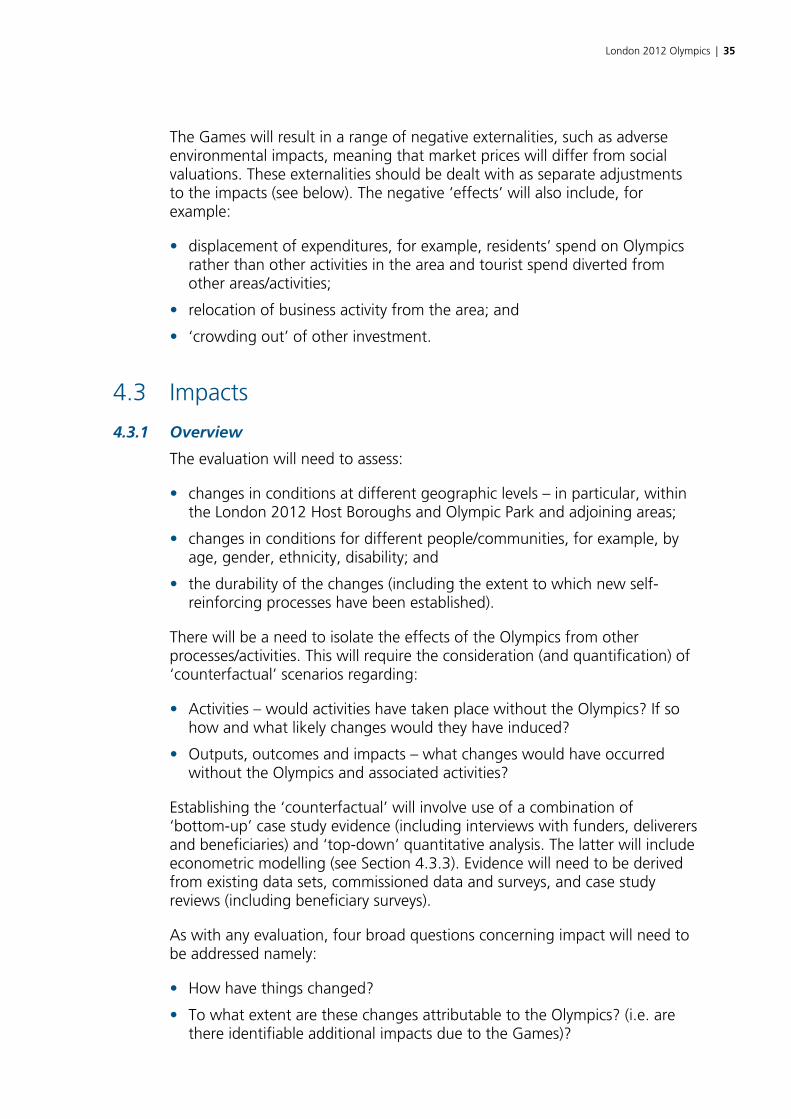
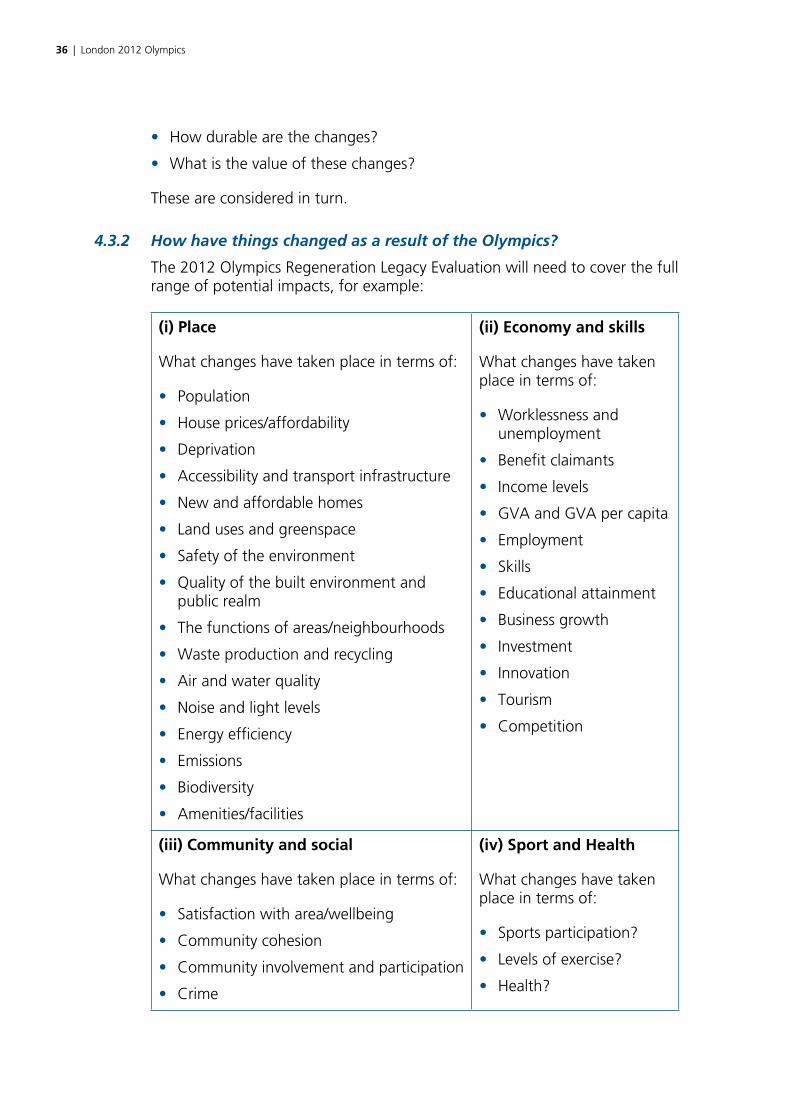
4.3.2 How have things changed as a result of the Olympics?
The 2012 Olympics Regeneration Legacy Evaluation will need to cover the full range of potential impacts, for example:
(i) Place
What changes have taken place in terms of:
• Population
• House prices/affordability
• Deprivation
• Accessibility and transport infrastructure
• New and affordable homes
• Land uses and greenspace
• Safety of the environment
• Quality of the built environment and public realm
• The functions of areas/neighbourhoods
• Waste production and recycling
• Air and water quality
• Noise and light levels
• Energy efficiency
• Emissions
• Biodiversity
• Amenities/facilities
(ii) Economy and skills
What changes have taken place in terms of:
• Worklessness and unemployment
• Benefit claimants
• Income levels
• GVA and GVA per capita
• Employment
• Skills
• Educational attainment
• Business growth
• Investment
• Innovation
• Tourism
• Competition
(iii) Community and social
What changes have taken place in terms of:
• Satisfaction with area/wellbeing
• Community cohesion
• Community involvement and participation
• Crime
(iv) Sport and Health
What changes have taken place in terms of:
• Sports participation?
• Levels of exercise?
• Health?
London 2012 Olympics | 37
It will need to assess:
• How did the above changes vary by area/neighbourhood and according to individual characteristics (for example, disability, gender, ethnicity, age)?
• Have socio-economic conditions in areas within East London become more or less divergent – i.e. how has the gap between deprived neighbourhoods and the rest changed?
Changes will need to be assessed against existing quantified ambitions and targets of the Games and the Legacy (as set out in Section 2.8), although these lack comprehensive coverage.
4.3.3 How additional are the Games’ effects?
The evaluation will need to identify the additional impact of the Games and specific interventions over and above what would have happened anyway. Two approaches are proposed to assessing additionality – ‘top down’ and ‘bottom up’.
The ‘top down’ approach will involve econometric modelling that will both isolate the factors that might explain the differential performance of areas and/or groups and provide an aggregate assessment of the 2012 Olympic impact. Performance needs to be defined according to key policy impact variables, such as changes in overall employment levels and worklessness rates. For each the modelling will need to identify the significance of a range of different factors. Examples of these factors in relation to areas – in addition to London 2012 – will include:
• internal area characteristics – such as type of area, functional role of area, economic structure, socio-economic conditions and population stability;
• external contextual factors – such as the economic performance of the wider sub-region; distance to, and accessibility of, other economic centres; and
• ‘administrative’ characteristics – such as the presence of other interventions (such as the impact of Thames Gateway funded programmes), the scale of other resource availability and the presence of other area-based initiatives.
The econometric modelling will establish a counterfactual by incorporating the use of ‘comparator units’ in the form of non-policy areas as well as enabling time series policy-on/policy-off comparisons to be drawn. By ‘neutralising’ other factors the modelling will enable a weighting or value to be placed on the contribution of the different variables to change. It would thus be used to provide a quantified ‘top down’ measure of London 2012 impact that could be disaggregated (and compared) for, for example, different sub-areas (such as the individual London 2012 Host Boroughs or the Lower Lea Valley). It would be able to assess a number of dimensions of any additional impact including its geographic ‘reach’ and any acceleration of activity over time – by, for example, using the modeling to assess the year-on-year variations in the policy impact weighing. The potential
38 | London 2012 Olympics
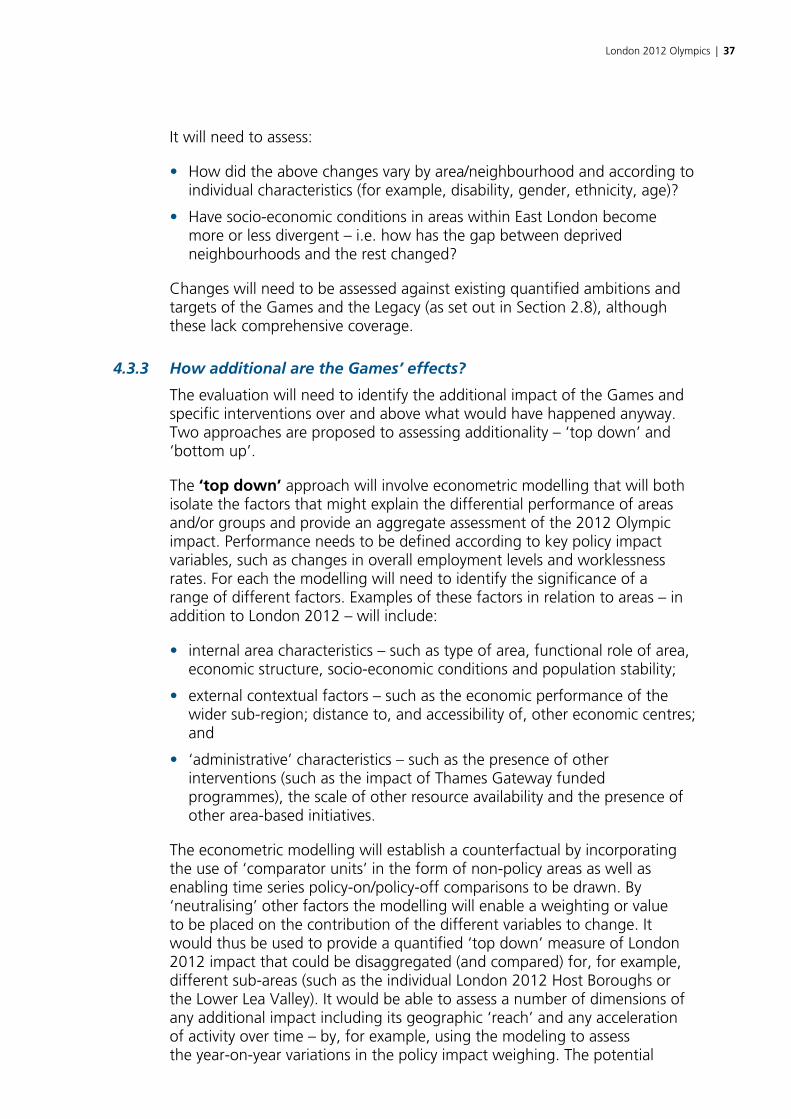
application of different forms of econometric modelling are discussed further in Section 5.2.3. Figure 4.1 presents an illustration of the ‘top down’ counterfactual approach.
Figure 4.1: ‘Top down’ approach
Start – Base Year Finish – End State
B
C
Baseline
Y (e.g., jobs)
Time
A = observed/expected change
B = Increase in Y under the counterfactual case
C = Additional impact of intervention (e.g., jobs created)
A
This ‘top down’ approach to identifying attributable impact will be complemented by use of ‘bottom up’ evidence (for example, from specific projects or activities) to validate findings and provide additional qualitative information.
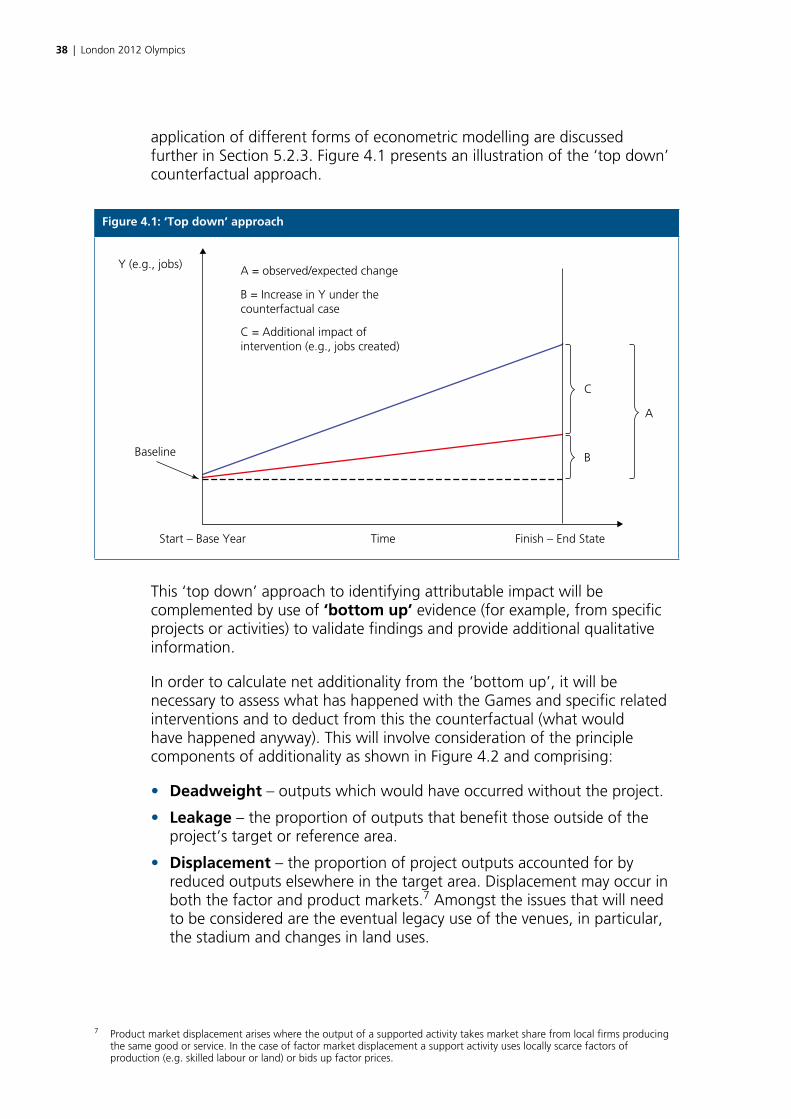
In order to calculate net additionality from the ‘bottom up’, it will be necessary to assess what has happened with the Games and specific related interventions and to deduct from this the counterfactual (what would have happened anyway). This will involve consideration of the principle components of additionality as shown in Figure 4.2 and comprising:
• Deadweight – outputs which would have occurred without the project.
• Leakage – the proportion of outputs that benefit those outside of the project’s target or reference area.
• Displacement – the proportion of project outputs accounted for by reduced outputs elsewhere in the target area. Displacement may occur in both the factor and product markets.7 Amongst the issues that will need to be considered are the eventual legacy use of the venues, in particular, the stadium and changes in land uses.
7 Product market displacement arises where the output of a supported activity takes market share from local firms producing the same good or service. In the case of factor market displacement a support activity uses locally scarce factors of production (e.g. skilled labour or land) or bids up factor prices.
London 2012 Olympics | 39
• Multiplier effects – further economic activity associated with additional local income and local supplier purchases.8
Figure 4.2: The ‘bottom up’ approach
Gross Direct Effects
Gross local direct effects
Net local direct effects
Less leakage fromtarget area/group
Total net local effects
Plus multiplier effects
Less displacement(factor and productmarket) substitution
Gross Direct Effects
The Games Counterfactual
LESS =
Net additional impact
Gross local direct effects
Net local direct effects
Less leakage fromtarget area/group
Total net local effects
Plus multiplier effects
Less displacement(factor and productmarket) substitution
Total net local additionaleffects
The above assessment will generate significant evidence demands. These will need to be secured through local research including analysis of programme and project management data as well as project and area case studies and surveys. Given the qualitative nature of a number of the impacts (such as levels of community engagement) which cannot be captured through existing data sources, there will be, in particular, a need for beneficiary surveys.
8 For analytical purposes two types of multiplier can be identified: • a supply linkage multiplier – due to purchases made as a result of the project and further purchases associated with
linked firms along the supply chain. In the absence of a fully articulated model of the local economy these effects are difficult to trace. However, multipliers derived through empirical research in previous studies can be used to approximate these impacts. Alternatively, estimates of the local content of purchases can be used to calculate the local supply linkage multiplier effects, assuming the proportion of expenditure net of non-recoverable indirect taxes incurred on local goods and services is similar throughout the supply chain.
• an income multiplier – associated with local expenditure as a result of those who derive incomes from the direct and supply linkage impacts of the project. Again, precise estimates are difficult to calculate. As a proxy, the results of previous research can be used or estimates can be calculated on the basis of local consumption patterns through the local economy. Again the assumption is that behaviour is similar at each point in the supply chain.
A number of impact studies have also identified a longer-term development multiplier associated with the retention of expenditure and population in an area.

40 | London 2012 Olympics
‘Bottom up’ assessments will enable the ‘reality checking’ of the top-down findings concerning the overall additionality of interventions and impacts and will provide an assessment of variations in additionality across different types of intervention. They will also help highlight examples of best practice for subsequent dissemination.
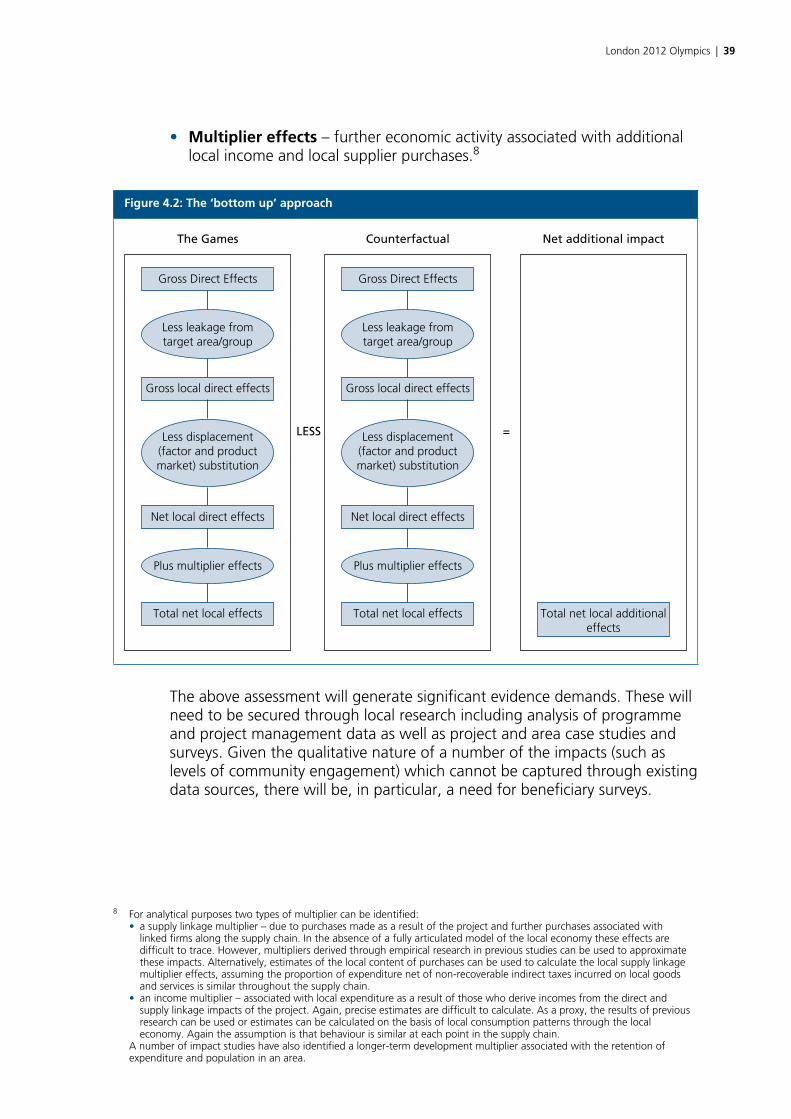
The key questions related to the additionality of effects of the projects and activities that will be assessed are summarised below together with the main sources of evidence that will be required. The questions relate to each of the components of any additionality appraisal – deadweight, leakage, displacement/substitution and multiplier effects.
Key questions Possible sources of information
Deadweight: What level of resources, activities, outputs, outcomes and impacts would have happened anyway without the Games?
• Evidence from evaluations and research
• Case study evidence of areas and sample projects
• Evidence from past and projected counterfactual changes in local and comparator areas
• Direct questioning of beneficiaries
• Interviews with agencies
Leakage: What are the target areas?
Who are the target beneficiaries?
Have the outputs/outcomes benefited non-target group(s) and/or area(s) at the expense of the target group and/or area? If yes, by how much?
• Published secondary sources, such as travel to work data
• Monitoring data
• Case study evidence of sample projects
• Direct questioning of beneficiaries
• Labour market studies on skills and travel to work flows
• Evaluations of individual projects that include estimates of leakage
• Case study evidence of projects and areas
London 2012 Olympics | 41
Key questions Possible sources of information
Displacement/ substitution:
Has the Games reduced existing activity from within the target group or area? If yes, where and by how much?
Have the Games resulted in organisations/firms substituting an activity or input for a similar one to take advantage of public funding? If yes, where and by how much?
• Analyses of relevant local markets
• Surveys and studies assessing, for example, where local competitors are based
• Evaluations of previous programmes that included estimates of displacement
• Direct questioning of beneficiaries
• Interviews with agencies
• Previous research/evaluations
Multiplier effects:
How many, if any, additional outputs and outcomes have occurred through purchases along the supply chain, employee spending rounds and longer-term effects?
• Surveys of beneficiary businesses and employees with regard to local expenditure and consumption
• Case study evidence of sample projects
• Previous research/evaluations
• Economic models to assess the scale of multiplier effects
As well as the above factors, consideration should also be given to ‘demonstration effects’. These are induced or indirect outputs arising as a further consequence of the Games – for example, direct beneficiaries serving as role models for the wider population. Surveys of residents will be a particular important source of evidence in assessing such changed behaviour and their causes.
In relation to the ‘bottom up’ counterfactual, some existing evidence is available from the earlier Lower Lea Area Development Framework economic impact assessment (see Box 4.2). However, in considering how to use this information, careful thought will need to be given to what resources would have been made available and to the changing economic context since 2003.
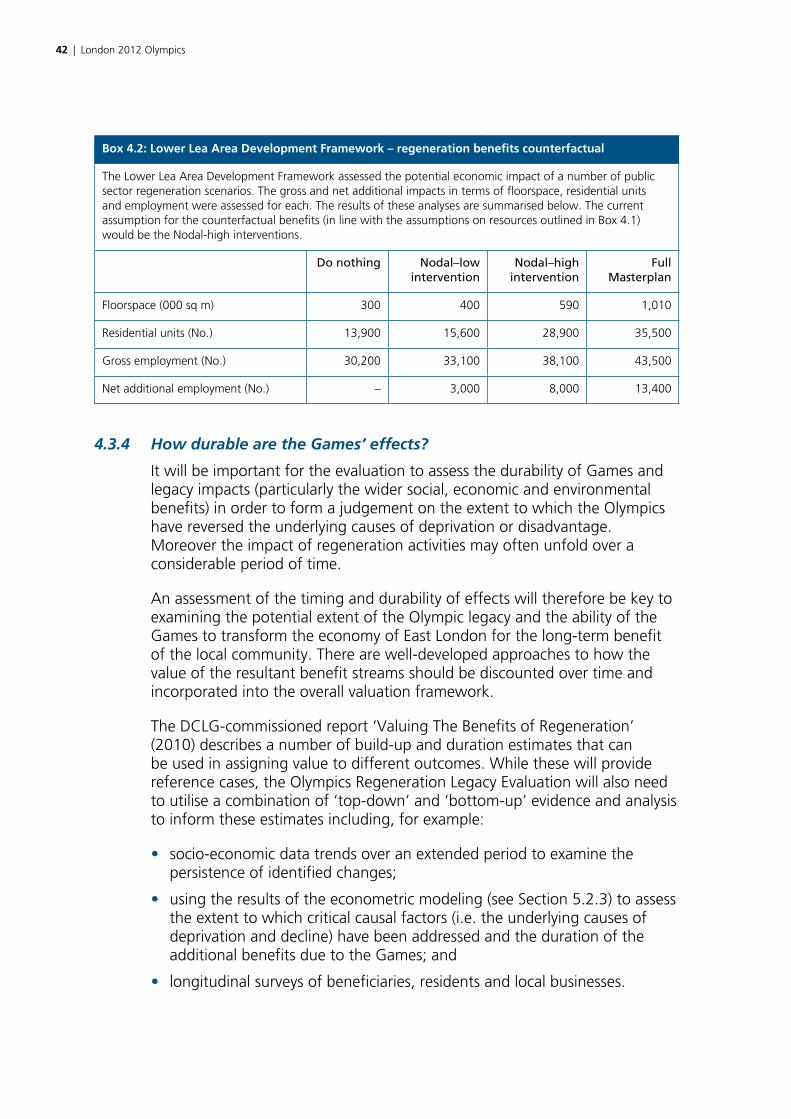
42 | London 2012 Olympics
Box 4.2: Lower Lea Area Development Framework – regeneration benefits counterfactual
The Lower Lea Area Development Framework assessed the potential economic impact of a number of public sector regeneration scenarios. The gross and net additional impacts in terms of floorspace, residential units and employment were assessed for each. The results of these analyses are summarised below. The current assumption for the counterfactual benefits (in line with the assumptions on resources outlined in Box 4.1) would be the Nodal-high interventions.
Do nothing Nodal–low intervention
Nodal–high intervention
Full Masterplan
Floorspace (000 sq m) 300 400 590 1,010
Residential units (No.) 13,900 15,600 28,900 35,500
Gross employment (No.) 30,200 33,100 38,100 43,500
Net additional employment (No.) – 3,000 8,000 13,400
4.3.4 How durable are the Games’ effects?
It will be important for the evaluation to assess the durability of Games and legacy impacts (particularly the wider social, economic and environmental benefits) in order to form a judgement on the extent to which the Olympics have reversed the underlying causes of deprivation or disadvantage. Moreover the impact of regeneration activities may often unfold over a considerable period of time.
An assessment of the timing and durability of effects will therefore be key to examining the potential extent of the Olympic legacy and the ability of the Games to transform the economy of East London for the long-term benefit of the local community. There are well-developed approaches to how the value of the resultant benefit streams should be discounted over time and incorporated into the overall valuation framework.
The DCLG-commissioned report ‘Valuing The Benefits of Regeneration’ (2010) describes a number of build-up and duration estimates that can be used in assigning value to different outcomes. While these will provide reference cases, the Olympics Regeneration Legacy Evaluation will also need to utilise a combination of ‘top-down’ and ‘bottom-up’ evidence and analysis to inform these estimates including, for example:
• socio-economic data trends over an extended period to examine the persistence of identified changes;
• using the results of the econometric modeling (see Section 5.2.3) to assess the extent to which critical causal factors (i.e. the underlying causes of deprivation and decline) have been addressed and the duration of the additional benefits due to the Games; and
• longitudinal surveys of beneficiaries, residents and local businesses.
London 2012 Olympics | 43
4.3.5 What is the value of the costs and benefits?
Where possible, benefits will need to be expressed in money terms and profiled annually so that their present value can be calculated. In a number of cases (such as employment or new developments) market values will be available.
However, for others, including for example, increases in satisfaction, other approaches will need to be applied to the valuing of benefits. These are discussed in more detail in Section 5.4. They essentially involve three methods or techniques:
• revealed preference techniques – that relate the value of a non-marketed good (for example, the new Olympic Park) to changes in the value of a marketed good (such as land and property values);
• stated preference techniques – that use survey methods to ask individuals/households how much they would be willing to pay (WTP) or willing to accept (WTA) in compensation for some change in the provision of a good or service; and
• benefits transfer – that involves applying available information from valuation studies already completed in another location and/or context.
It should be emphasised that it may not be possible or viable to monetise some benefits although it will still be important that they are assessed and reported.
The expected beneficiaries should be identified and the impact on priority groups assessed. These groups will depend on the nature of the specific project, but are likely to relate to factors such as a person’s age, gender, disability status, ethnic group and employment status. Further details on approaches to distributional weighting are included in Annex 5 of HM Treasury’s Green Book.
The choice of approach and use of distributional weighting will depend upon the type of benefit being assessed and the beneficiary. The different types of ‘value’ that might be derived from these benefits are discussed in turn below for each of the evaluation ‘themes’. DCLG has recently published evidence on valuing different aspects of regeneration activity.9 This has been used to inform the following discussion and will be an important source for the evaluation.
(i) Place and environment
The scope of activities requiring assessment under this heading includes new investment in the physical infrastructure of the area(s) as well as wider environmental impacts. It will be possible to monetise many of these costs and benefits through either market values or shadow pricing methods.
9 DCLG 2010, ‘Valuing the Benefits of Regeneration’, Economics Paper 7.
44 | London 2012 Olympics
An important component of the legacy proposals for the area relates to new housing and commercial development. Assessing the wider costs and benefits of new housing will involve an appraisal of a wide range of potential impacts including, for example:
• the removal of dereliction (and value uplifts through land use change);
• the provision of facilities benefiting the wider community;
• betterment effects;
• net amenity benefits;
• net savings to other public services;
• savings in external carbon costs, where these are not internalised in energy prices or reflected in property values;
• environmental benefits from not developing Greenfield sites; and
• any economic benefits associated with the change in net employment in areas of labour shortage.
In addition, social benefits will require consideration where social or other forms of affordable housing are being provided. In order to take account of these social benefits, the capital value of the social housing ‘component’ will need to be measured. It will equate to the Social Housing Grant (the policymaker’s traditional valuation) plus the present value of the rental stream minus the present value of future management and maintenance costs. In terms of affordable housing, the implicit cross-subsidy should be added back as a social benefit within the cost benefit analysis calculation (see Section 4.5). It may in some cases be appropriate to alternatively measure the specific benefits associated with social/affordable housing, including, reductions in homelessness, sharing with family and friends, council funded ‘bed and breakfast’ accommodation and the occupation of sub-standard accommodation.
In relation to more general ‘non-housing’ place and environment benefits, the following aspects will need to be assessed:
• the removal of negative externalities – most importantly, localised externalities (for example, costs associated with the treatment of derelict and contaminated sites) and the removal of blight. The reduction of non-localised externalities associated, for example, with reductions in CO2 emissions through the enhancement of energy efficiency will also be important;
• the generation of positive benefits through environmental enhancements (including better design), place-making and architectural aspects; and
• the provision of a range of amenities, in particular public realm, open space and other outdoor recreational facilities.
The major issues here relate to the assessment and valuation of the localised externalities, environmental enhancements and public good aspects of the provision of amenities (i.e. the amenity aspects which are not reflected,

London 2012 Olympics | 45
or are not fully reflected, in user charges). This will involve use of the quantitative valuation techniques already referred to and discussed in more detail in Section 5.4.
(ii) Economy and skills
The assessment of benefits in relation to economy and skills will need to include an analysis of the following:
• Economic development activities
To take account of the creation of additional economic activities, the Net Value Added (NVA) generated (i.e. the total value of the output produced less intermediate inputs and capital consumption) should be calculated. There are also other costs and benefits which should, in principle, be considered. For example, using NVA alone ignores on the one hand the ancillary costs of work (such as commuting and childcare costs) and the opportunity cost of foregone leisure, and on the other the psychological benefits to individuals and the wider social benefits of placing people into work. In practice, these are often assumed to counter-balance each other.
Where activity and jobs are created through the provision of industrial and commercial floorspace, NVA can be estimated either from direct survey evidence or from the number of jobs accommodated and evidence (from the Annual Business Survey and National Accounts) on NVA per employee in the relevant sector(s).
The assessment of NVA will need to focus on the net additional impact on the area. Therefore, NVA needs to be measured net of deadweight, leakage, displacement and multiplier effects. Evidence will also need to be made about the persistence of the benefits.
Where the productivity of firms is raised through other mechanisms, the NVA impact will typically need to be estimated from survey evidence or company accounts data.
• Worklessness or employability
Where activity is created through placing individuals into employment, the benefit can be measured as the additional stream of income generated to the individuals concerned, on the assumption that labour markets are competitive so that individuals are paid their marginal products.
This will involve multiplying the number of people who have found work as a result of the programme by the gross earnings associated with that work. Again, allowance will need to be made for additionality and the persistence of the benefits created.
In addition, the indirect benefits achieved through placing individuals into employment should also be valued. Evidence on these values, specifically in relation to health and crime, is provided by DWP research.10
10 Source: Fujiwara, D. 2010, ‘Methodologies for estimating and incorporating the wider social and economic impacts of work in Cost-Benefit Analysis of employment programmes’, The Department of Work and Pensions Social Cost-Benefit Analysis framework, Working Paper No 86.
46 | London 2012 Olympics
• Training/skills
The value of skills development should be assessed through the associated uplift in wage levels and then converted into an estimate of the impact on NVA.
The wage uplift associated with an improvement in skills of people already in employment can be measured at an individual level, by gathering information on wages before and after the project. Alternatively, benchmarks have been produced by the Institute of Fiscal Studies, which can be applied to a base median wage.11
The gross NVA impact can then be assessed by multiplying the annual wage impact by a sector specific NVA to wage ratio. Adjustments will need to be made for each additionality factor and the assumed persistence of the benefits.
(iii) Social and community
The social and community benefits that will require valuation are likely to include:
• Usage of community facilities
The number of users and any associated income should be incorporated within the assessment of value. However, typically this will not provide a full measure of the potential social benefits in terms of community development and the creation of social capital. Estimates of willingness to pay or impact on local property values should be used, where available.
• Community development
Stated or revealed preference techniques can be used to establish a value in terms of community development. An example of this approach is provided by the New Deal for Communities national evaluation that identified values associated with improvements such as an increase in the ability to influence decisions that affect the local area, using a shadow pricing approach (see Section 5.4(ii) below).12
• Crime reduction
In principle, crime reduction is quantifiable and measurable in monetary terms based upon either a ‘willingness to avoid’ basis (some evidence on the shadow price of reduced risk of crime is available from a recent national evaluation), or expected reductions in insurance premiums which should follow reductions in property crime.
• Volunteering
A range of studies have valued the benefits of volunteering based upon applying a notional value to the hours of work undertaken.13 This is
11 Source: Blundell, R., Dearden, L. and Sianesi, B. 1999 ‘Human capital investment: the returns of education and training to the individual, the firm and the economy’, Fiscal Studies, 20: 1–23.
12 DCLG 2010, ‘The New Deal for Communities Programme: Assessing Impact and Value of Money’, Volume 6.13 For example, a study by Scottish Heritage (Volunteering in the Natural Heritage: An Audit and Review of Natural Heritage in
Scotland, 2007) values volunteer hours on the basis of the average weekly wage. Heritage Lottery Fund allows volunteer time to be valued on a more differentiated basis, reflecting the skills of those involved, in the calculation of ‘in kind’ contributions/match funding within its application process.
London 2012 Olympics | 47
a potentially valid approach to estimating the community value of an unpaid service. However, in the case of the Games the work involved will presumably contribute to the experience for which spectators pay. The value of this contribution should be at least potentially reflected in admission charges. Nevertheless, it is clear that volunteers themselves derive a range of benefits from the experience and satisfaction of volunteering. This could include, for example, improved skills and work experience, as well as quality of life, social and wider community benefits. Consequently, careful consideration will need to be given to the appropriate notional hourly rate.
(iv) Sport and health
The potential demonstration effects of the Games and the availability of new or enhanced facilities as a result of legacy activities may result in increased participation in sport and exercise. These in turn can result in health benefits. Regular exercise can for example provide protection from heart disease and stroke, high blood pressure, diabetes, obesity, back pain, osteoporosis, and promote mental health. These improvements in health can be valued in a number of ways including, for example, through:
• the use of Quality Adjusted Life Years (QALYs)14; or
• through an assessment of the savings to the National Health Service.
4.4 Processes
The organisational arrangements for delivery of the Games and their legacy are complex and currently subject to review. A detailed mapping of structures as those evolve will be required. The current and proposed future arrangements are discussed in Section 2.5 above.
4.4.1 How well have legacy benefits been planned for, administered and delivered?
The evaluation will need to assess the adequacy of (and linkages between) the arrangements designed to bring relevant agencies and partners together in order to plan and/or administer and/or deliver the London 2012 legacy. This will be important in order to draw lessons for ongoing activity designed to maximise the London 2012 legacy and to inform the administration of other major events in the future. Key considerations will include:
• the scope, relevance, efficiency and effectiveness of the arrangements;
• linkages with other public sector activity;
• the degree of engagement with target groups including in particular local communities, business and specific interest groups; and
14 A Quality Adjusted Life Year (QALY) is a year of life adjusted for its quality or its value. A year in perfect health is considered equal to 1.0 QALY. The value of a year in ill health would be discounted. For example, a year bedridden might have a value equal to 0.5 QALY.
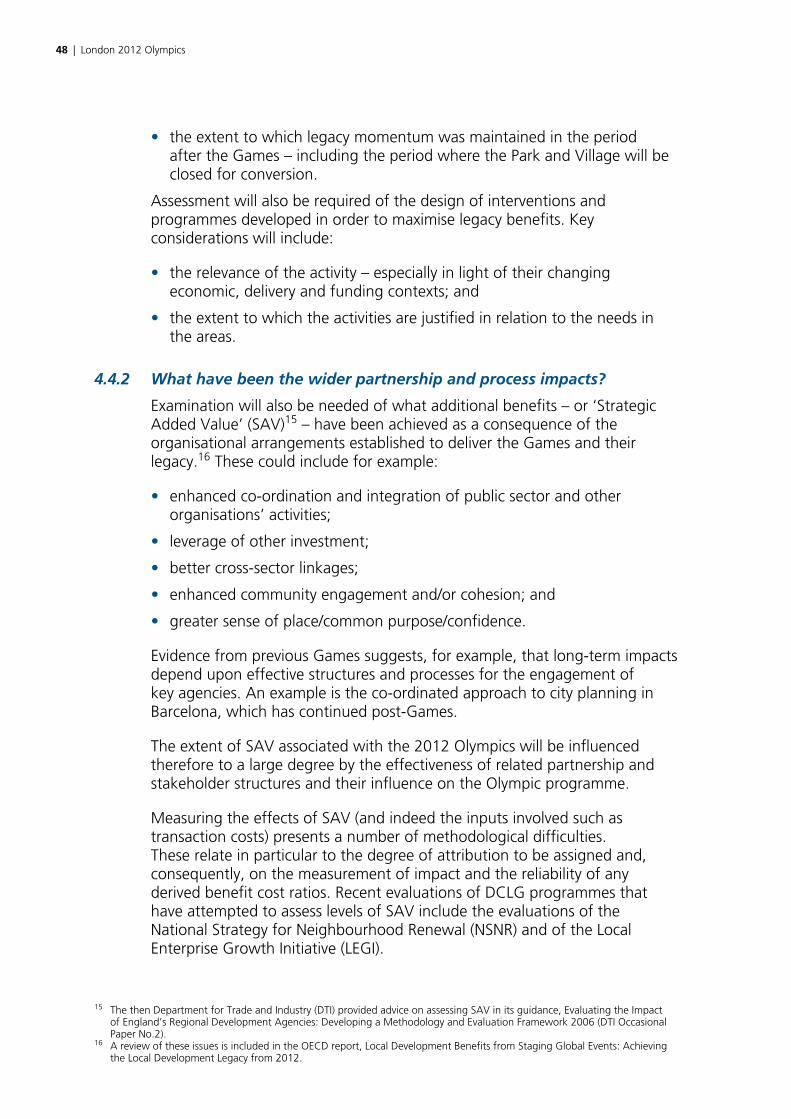
48 | London 2012 Olympics
• the extent to which legacy momentum was maintained in the period after the Games – including the period where the Park and Village will be closed for conversion.
Assessment will also be required of the design of interventions and programmes developed in order to maximise legacy benefits. Key considerations will include:
• the relevance of the activity – especially in light of their changing economic, delivery and funding contexts; and
• the extent to which the activities are justified in relation to the needs in the areas.
4.4.2 What have been the wider partnership and process impacts?
Examination will also be needed of what additional benefits – or ‘Strategic Added Value’ (SAV)15 – have been achieved as a consequence of the organisational arrangements established to deliver the Games and their legacy.16 These could include for example:
• enhanced co-ordination and integration of public sector and other organisations’ activities;
• leverage of other investment;
• better cross-sector linkages;
• enhanced community engagement and/or cohesion; and
• greater sense of place/common purpose/confidence.
Evidence from previous Games suggests, for example, that long-term impacts depend upon effective structures and processes for the engagement of key agencies. An example is the co-ordinated approach to city planning in Barcelona, which has continued post-Games.
The extent of SAV associated with the 2012 Olympics will be influenced therefore to a large degree by the effectiveness of related partnership and stakeholder structures and their influence on the Olympic programme.
Measuring the effects of SAV (and indeed the inputs involved such as transaction costs) presents a number of methodological difficulties. These relate in particular to the degree of attribution to be assigned and, consequently, on the measurement of impact and the reliability of any derived benefit cost ratios. Recent evaluations of DCLG programmes that have attempted to assess levels of SAV include the evaluations of the National Strategy for Neighbourhood Renewal (NSNR) and of the Local Enterprise Growth Initiative (LEGI).
15 The then Department for Trade and Industry (DTI) provided advice on assessing SAV in its guidance, Evaluating the Impact of England’s Regional Development Agencies: Developing a Methodology and Evaluation Framework 2006 (DTI Occasional Paper No.2).
16 A review of these issues is included in the OECD report, Local Development Benefits from Staging Global Events: Achieving the Local Development Legacy from 2012.

London 2012 Olympics | 49
The approach to the assessment of SAV associated with the Games will in particular need to involve an extensive programme of interviews with relevant staff and partners/stakeholders to enable informed judgments to be made on the extent to which changes in organisational behavior have occurred and to identify their consequences. Key questions will include:
• Are organisations pursuing a common agenda?
• How effectively has the London 2012 programme influenced the activities of other partners?
• To what extent have other organisations changed their practices as a result of the 2012 programme?
• Have new partnerships and relationships been established?
Surveys of partners and residents who have been involved in Games and Legacy-related arrangements will be an important source of evidence of SAV impacts – including those relating to community involvement and cohesion.
4.5 Value for money
The relationship between the regeneration resources (costs) and benefits or impacts achieved through the Olympics – its overall value for money (VfM) – will be a key issue for the evaluation. The approach to its assessment will require the following questions to be addressed:
• Do the total relevant benefits of the Games regeneration legacy programme exceed the total relevant costs? Does the programme have a positive net present value?
• Were the costs the minimum necessary given the nature and quality of the programme?
• Are the ratios of public sector costs to outputs reasonable compared with appropriate benchmarks?
• To what extent has public sector investment levered-in private sector finance?
VfM is determined by the relationship between total costs (the resources a project uses up) and total benefits (including the outputs and outcomes it is anticipated to achieve). For a project to offer VfM its benefits must exceed its costs.
Two approaches can be taken to the assessment of VfM – Cost Benefit Analysis (CBA) and 3Es analysis (involving the consideration of ‘economy’, ‘efficiency’ and ‘effectiveness’). CBA can be used as part of both top-down and bottom-up assessments while 3Es is principally a bottom-up tool. The evaluation should use CBA as the primary approach but also use 3Es in order to gain further insights concerning specific key interventions. The two approaches are described below.
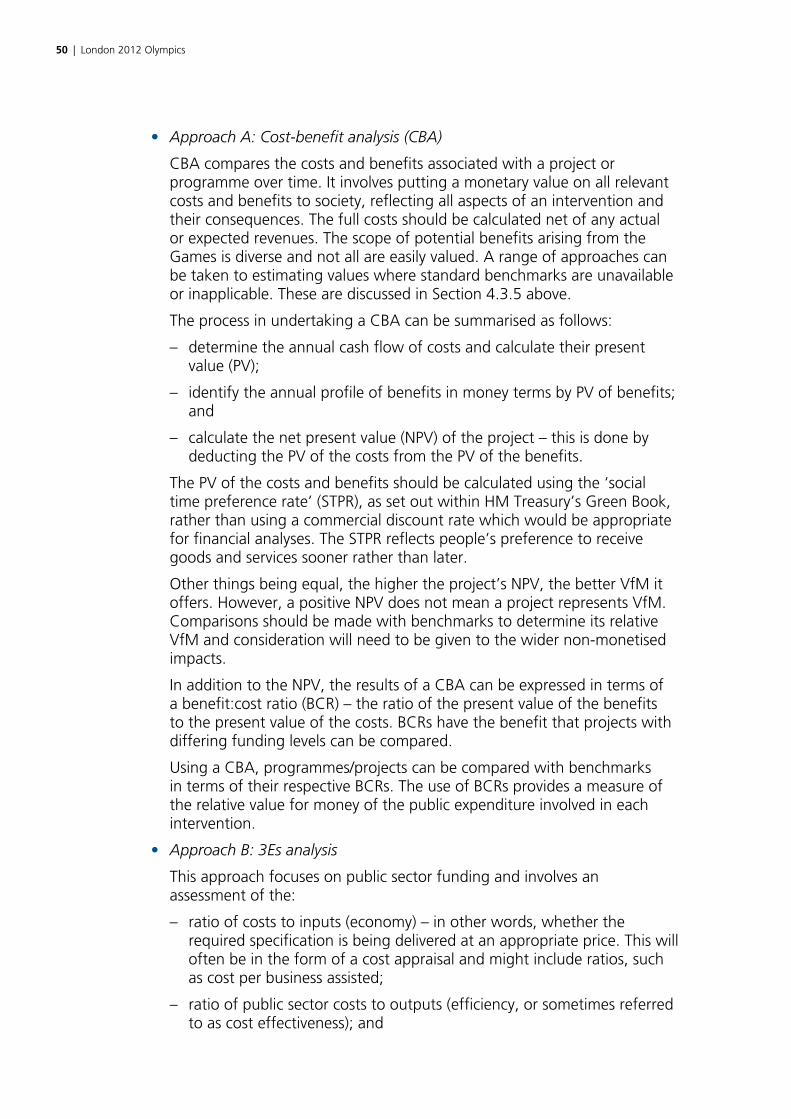
50 | London 2012 Olympics
• Approach A: Cost-benefit analysis (CBA)
CBA compares the costs and benefits associated with a project or programme over time. It involves putting a monetary value on all relevant costs and benefits to society, reflecting all aspects of an intervention and their consequences. The full costs should be calculated net of any actual or expected revenues. The scope of potential benefits arising from the Games is diverse and not all are easily valued. A range of approaches can be taken to estimating values where standard benchmarks are unavailable or inapplicable. These are discussed in Section 4.3.5 above.
The process in undertaking a CBA can be summarised as follows:
– determine the annual cash flow of costs and calculate their present value (PV);
– identify the annual profile of benefits in money terms by PV of benefits; and
– calculate the net present value (NPV) of the project – this is done by deducting the PV of the costs from the PV of the benefits.
The PV of the costs and benefits should be calculated using the ‘social time preference rate’ (STPR), as set out within HM Treasury’s Green Book, rather than using a commercial discount rate which would be appropriate for financial analyses. The STPR reflects people’s preference to receive goods and services sooner rather than later.
Other things being equal, the higher the project’s NPV, the better VfM it offers. However, a positive NPV does not mean a project represents VfM. Comparisons should be made with benchmarks to determine its relative VfM and consideration will need to be given to the wider non-monetised impacts.
In addition to the NPV, the results of a CBA can be expressed in terms of a benefit:cost ratio (BCR) – the ratio of the present value of the benefits to the present value of the costs. BCRs have the benefit that projects with differing funding levels can be compared.
Using a CBA, programmes/projects can be compared with benchmarks in terms of their respective BCRs. The use of BCRs provides a measure of the relative value for money of the public expenditure involved in each intervention.
• Approach B: 3Es analysis
This approach focuses on public sector funding and involves an assessment of the:
– ratio of costs to inputs (economy) – in other words, whether the required specification is being delivered at an appropriate price. This will often be in the form of a cost appraisal and might include ratios, such as cost per business assisted;
– ratio of public sector costs to outputs (efficiency, or sometimes referred to as cost effectiveness); and
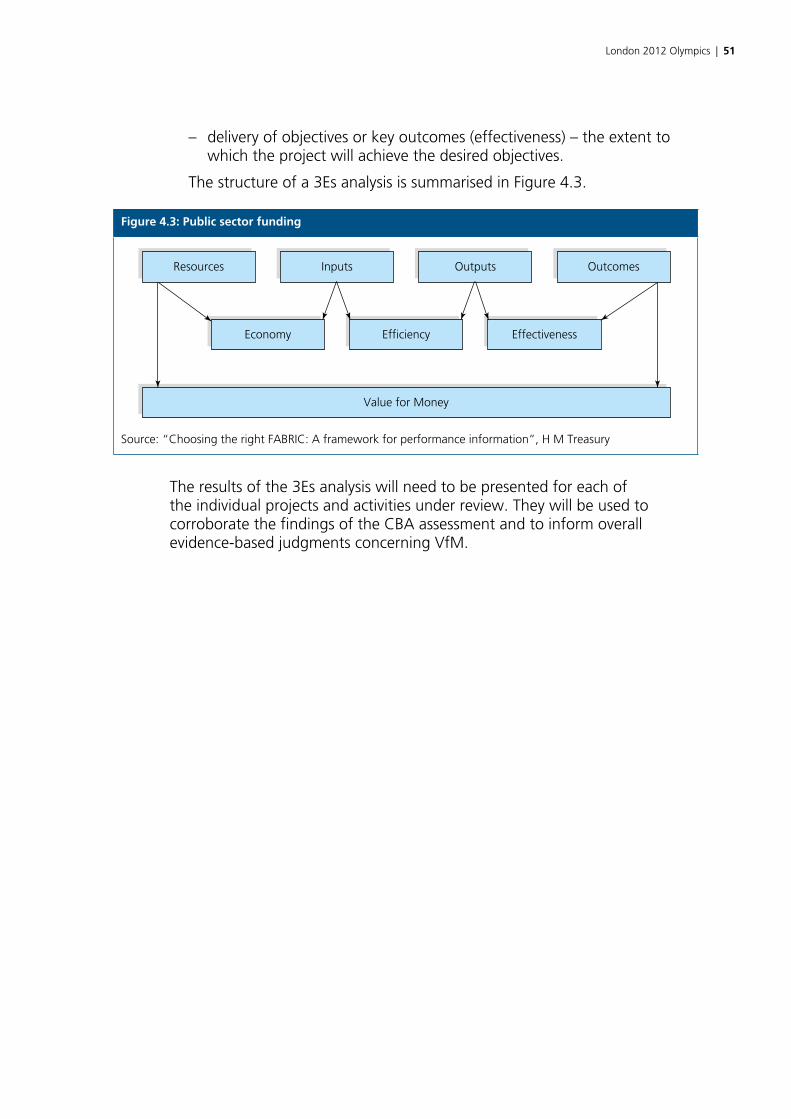
London 2012 Olympics | 51
– delivery of objectives or key outcomes (effectiveness) – the extent to which the project will achieve the desired objectives.
The structure of a 3Es analysis is summarised in Figure 4.3.
Figure 4.3: Public sector funding
Resources
Value for Money
Inputs Outputs
Economy Efficiency Effectiveness
Outcomes
Source: “Choosing the right FABRIC: A framework for performance information”, H M Treasury
The results of the 3Es analysis will need to be presented for each of the individual projects and activities under review. They will be used to corroborate the findings of the CBA assessment and to inform overall evidence-based judgments concerning VfM.
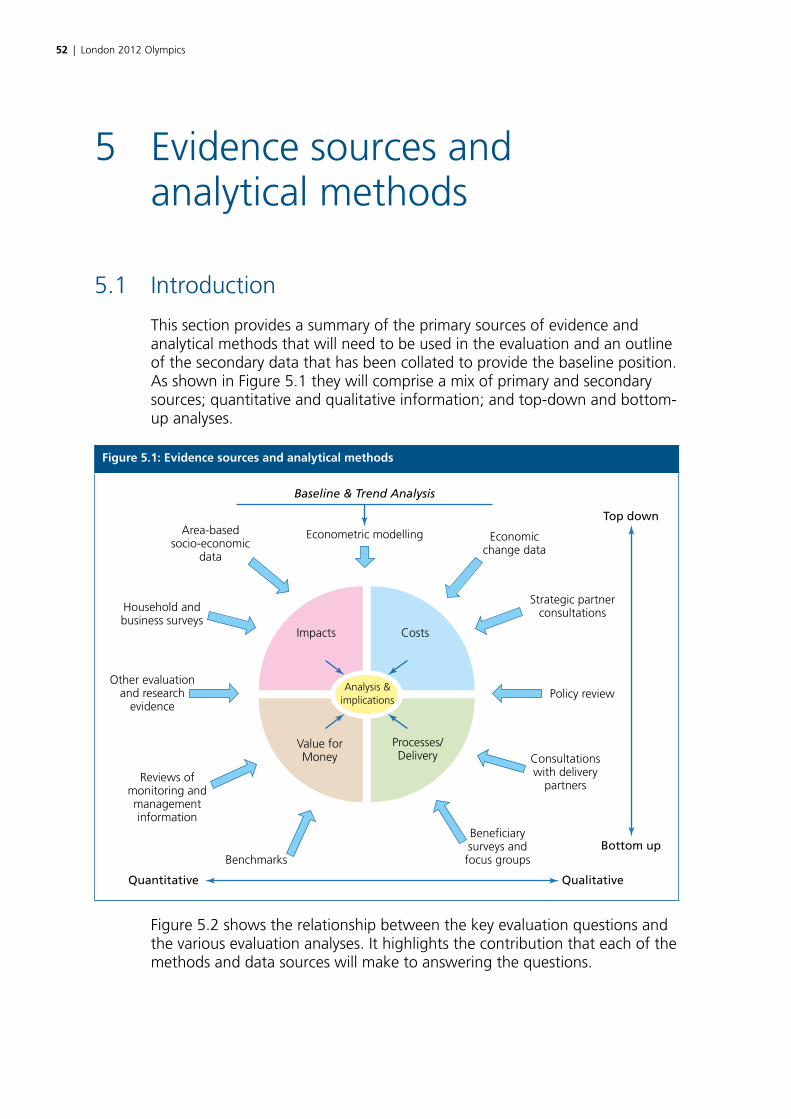
52 | London 2012 Olympics
5 Evidence sources and analytical methods
5.1 Introduction
This section provides a summary of the primary sources of evidence and analytical methods that will need to be used in the evaluation and an outline of the secondary data that has been collated to provide the baseline position. As shown in Figure 5.1 they will comprise a mix of primary and secondary sources; quantitative and qualitative information; and top-down and bottom-up analyses.
Figure 5.1: Evidence sources and analytical methods
Area-basedsocio-economic
data
Household andbusiness surveys
Other evaluationand research
evidence
Reviews ofmonitoring andmanagementinformation
Benchmarks
Beneficiarysurveys andfocus groups
Consultationswith delivery
partners
Policy review
Strategic partnerconsultations
Economicchange data
Econometric modelling
Value forMoney
Processes/Delivery
Impacts Costs
Baseline & Trend Analysis
Top down
Bottom up
Quantitative Qualitative
Analysis &implications
Figure 5.2 shows the relationship between the key evaluation questions and the various evaluation analyses. It highlights the contribution that each of the methods and data sources will make to answering the questions.
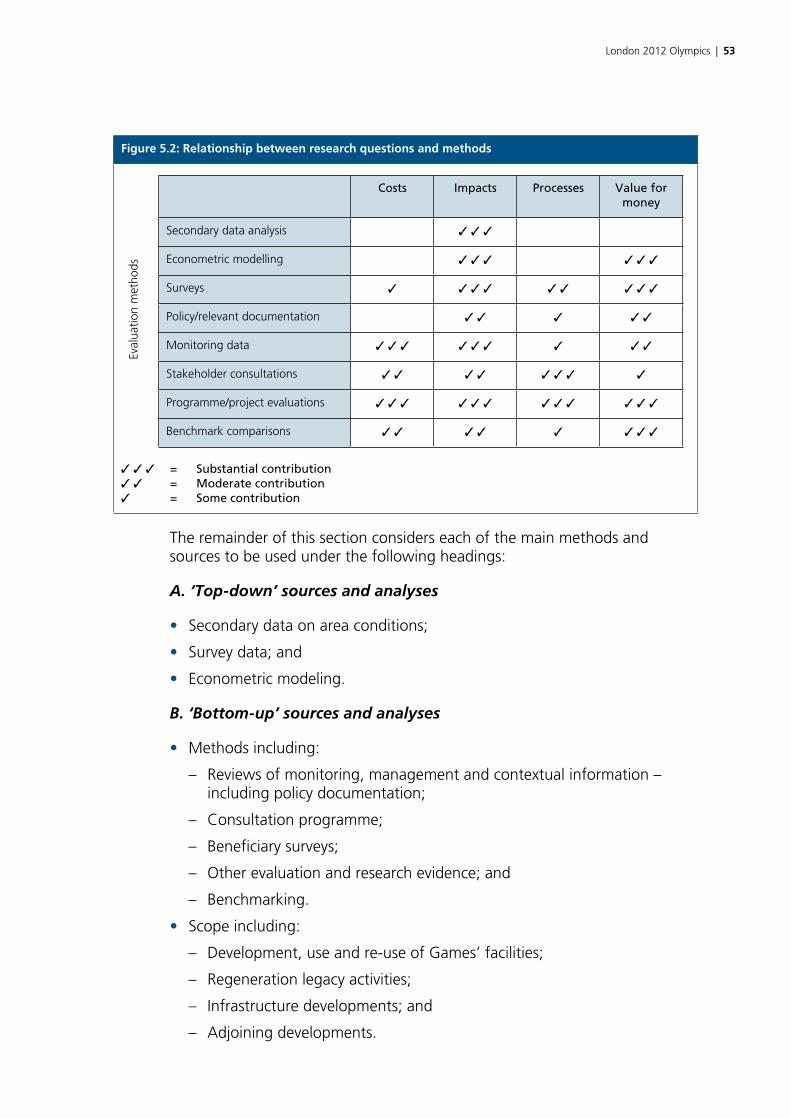
London 2012 Olympics | 53
Figure 5.2: Relationship between research questions and methodsEv
alua
tion
met
hods
Costs Impacts Processes Value for money
Secondary data analysis 3 3 3
Econometric modelling 3 3 3 3 3 3
Surveys 3 3 3 3 3 3 3 3 3
Policy/relevant documentation 3 3 3 3 3
Monitoring data 3 3 3 3 3 3 3 3 3
Stakeholder consultations 3 3 3 3 3 3 3 3
Programme/project evaluations 3 3 3 3 3 3 3 3 3 3 3 3
Benchmark comparisons 3 3 3 3 3 3 3 3
3 3 3 = Substantial contribution3 3 = Moderate contribution3 = Some contribution
The remainder of this section considers each of the main methods and sources to be used under the following headings:
A. ‘Top-down’ sources and analyses
• Secondary data on area conditions;
• Survey data; and
• Econometric modeling.
B. ‘Bottom-up’ sources and analyses
• Methods including:
– Reviews of monitoring, management and contextual information – including policy documentation;
– Consultation programme;
– Beneficiary surveys;
– Other evaluation and research evidence; and
– Benchmarking.
• Scope including:
– Development, use and re-use of Games’ facilities;
– Regeneration legacy activities;
– Infrastructure developments; and
– Adjoining developments.

54 | London 2012 Olympics
C. Valuing the impacts
• Revealed preference;
• Stated preference; and
• Benefit transfer.
5.2 ‘Top-down’ sources and analyses
5.2.1 Secondary data
Secondary sources of area-based socio-economic and economic change data will be a crucial source for the analysis of changing conditions in areas of interest to the evaluation and relevant comparator areas. This data will also enable counterfactual scenarios to be developed using econometric and other techniques. A detailed review has been undertaken of available sources and headline datasets have been identified that reflect the logic chains for the four key evaluation thematic areas (as described in Section 3).
The above datasets have been assembled into a baseline and trend analysis database that is held online (http://amion.infonomics.ltd.uk). The baseline year for the analysis has been selected as 2003 (the year in which London’s Olympic Games bid was submitted). The database is supported by an application which gathers, processes and presents information on a range of subjects relevant to the potential legacy of London 2012. This has also been used to compile a dynamic baseline assessment – also including data on trends to date – a summary of which is presented at Appendix B.
The application connects to a variety of UK Government data sites to ensure that the data is always up-to-date. The separate sources have been reconciled where their coverage overlaps.
The database currently stores 198 datasets and 3,158 indicators. From this collection, 56 indicators have been chosen as part of a headline ‘basket’ of indicators, covering a range of topics (e.g. employment status, local incomes and participation in sport), and stages in the logic chain (i.e. outputs, outcomes, and impacts).
For each of the headline indicators data has been extracted to cover the maximum range and highest frequency of time periods at the highest level of geographic precision. These values have then been aggregated into customised geographic boundaries describing the primary area of influence, the London 2012 Host Boroughs, the Thames Gateway, London and England.
The data is assembled into a number of core analyses including:
• comparison of current values in the primary area of influence, the London 2012 Host Boroughs and the Thames Gateway with London and England;
• comparison of changes to date within the various areas;
London 2012 Olympics | 55
• tracking indexed rates of change in the areas;
• assessing the extent of divergence in conditions within the London 2012 Host Boroughs;
• assessing the divergence in growth rates between areas within the London 2012 Host Boroughs;
• tracking the trend in the gap between the London 2012 Host Boroughs and London; and
• comparing the compound annual growth rate before and after the baseline (bid) year.
Inevitably a number of gaps in the data have been identified, which will need to be addressed during the Olympic Regeneration Legacy Evaluation. These gaps vary but relate, in particular, to:
• the availability of data at a sufficiently fine grained geographic level;
• the timeframe over which data is available. For example, a lack of data to enable comparison of pre and post bid trends and conditions;
• survey and other data on ‘softer’ areas of impact, such as the distribution of legacy benefits, and levels of resident satisfaction and perceptions; and
• the lack of a comprehensive land use dataset available at the time of writing, although discussions are ongoing about assembling this information.
By necessity, the Evaluation Framework is primarily structured around those indicators which were available for 2003, many of which were absorbed into the 198 national indicators dataset. Given the subsequent changes in approaches to local government and regeneration policy, it should be recognised that not all indicators will still be available in the same form (i.e. they may have been discontinued, or the arrangements for collecting the data may have been changed). As such, a key task for evaluators for subsequent stages of the evaluation will be to identify whether it is feasible to collect data for the whole baseline indicator set, and if so, how this should be undertaken.
5.2.2 Surveys
As referred to above, there are a number of gaps and deficiencies in the existing secondary evidence base concerning conditions in the principal areas of likely impact. An example is the issue of the distribution of benefits, in particular for existing residents of the London 2012 Host Boroughs. A key legacy promise was to transform the heart of East London, and DCMS’s December 2010 plan for the legacy of the Games re-affirms the commitment to community engagement, regeneration of East London, and support for the Mayor and London 2012 Host Borough leaders to close the deprivation gap. There is, however, a lack of available data to assess whether local people and businesses have benefited from the Games through increased opportunities for employment, trade, education and skills, volunteering and community engagement, and if so to what extent.

56 | London 2012 Olympics
To address this issue, a particular requirement will be for some form of household and business survey particularly in the area immediately adjacent to the Olympic Park. This could potentially ‘piggy back’ on existing mechanisms such as the Newham Household Panel Survey.
The household surveys should cover the following topics that have been identified as headline indicators within the evaluation methodology but for which data collection is no longer being undertaken (through sources as the Place or Citizenship Surveys):
• residents’ satisfaction with the area
Specimen questions:
– Overall, how satisfied or dissatisfied are you with your local area as a place to live?
– Has your local area got better or worse for each of the following (shopping facilities, pollution, traffic congestion, facilities for children, etc) over the past [three years]/during the period of the Games/since the Games?
• levels of community cohesion
Specimen questions:
– How strongly do you feel you belong to your immediate neighbourhood?
– To what extent do you agree or disagree that your local area is a place where people from different backgrounds get on well together?
• self reported levels of health and well-being
Specimen questions:
– How is your health in general? Would you say it is very good/good/fair/bad/very bad?
– How frequently do you undertake physical exercise?
• perceptions of anti-social behaviour and fear of crime
Specimen questions:
– How safe or unsafe do you feel when outside in your local area during the day/after dark?
– How much of a problem do you think each of the following are (noisy neighbours, abandoned cars, teenagers on street corners, etc)?
Household surveys should also be used to supplement the evidence where existing data and other sources are inadequate. Research areas could include income levels, migration patterns, community involvement and engagement and views on the impacts of the 2012 Olympics.
London 2012 Olympics | 57
It would be particularly useful if any household survey could incorporate a longitudinal element to track changes in circumstances affecting individual households. This would also enable shadow pricing techniques (see Section 5.4 (ii) below) to be used to attach a value to changing conditions.17 However, this option would incur significant costs.
In addition, business surveys should be conducted to address issues including:
• satisfaction with the area as a location to do business;
• impact of the Games on trading activity; and
• influence that the Games have had/are likely to have on investment and locational decisions.
5.2.3 Econometric models
(i) Overview
While ‘descriptive’ analysis of trends across the geographical areas of interest to the evaluation will be an important element in ascertaining the extent to which conditions within the areas of interest have changed, it will not identify the degree to which the Games and associated investments have contributed to those changes. Econometric modelling should form an important part of the evaluation’s top-down analysis in order to enable identification of the ‘counterfactual’ and to isolate the extent of the Games’ impact. This can then be used as a core input into the VfM analysis. A range of different but complementary techniques can be applied at different geographic scales of analysis. The choice of particular techniques for inclusion in the final methodology will depend on the resources available for the evaluation. The options are discussed below and are grouped according to their primary spatial level of analysis.
(ii) Sub-national modelling
There are a number of potential frameworks within which to assess both the prospective and retrospective impacts of the Games at sub-national levels. Most involve the use of established or emerging econometric models. These include:
Structural Models
This subset of models attempt to summarise the underlying structural relationships that, together, determine the performance of national and sub-national economies. They seek to model the relationships between economic agents (consumers, firms, government) through analysis of historic data and to predict the path of key economic aggregates (for example GVA, employment and unemployment) in specified areas over time. Oxford Economics has, for example, recently prepared economic forecasts for the London 2012 Host Boroughs using their structural model.
17 A similar approach was used in the national evaluation of New Deal for Communities.
58 | London 2012 Olympics
Different models are constructed in different ways. Some are driven by equations that represent the historic time-series path of economic aggregates in the context of broader national performance. Others focus on the nature of the input-output relationship – the way in which economic agents spend their resources and how that spend feeds through the rest of the economy – in the context of broader national performance. The models can be used to create counterfactual and impact scenarios.
Computable Generalised Equilibrium (CGE) Models
A more complex and detailed approach would be to use CGE models. A key difference between these and the structural models is that they are more dynamic. For example, they assume that prices are sufficiently flexible for all markets in the economy to clear at any given point in time. Due to the nature of the models, data requirements are very substantial and doubts have been expressed about their robustness.
A benefit of such models however is that, once constructed, they can be used as a more sophisticated simulation tool to model the overall economic impacts of the Olympics. In particular:
• they can be used prospectively to assess anticipated trends in the absence of an ‘event’ or policy intervention and then to assess trends taking into account the event or intervention. The former provides the counterfactual ‘case’ against which impacts can be assessed; and
• they can be used retrospectively to assess what might have happened if an ‘event’ or policy intervention had not taken place. The latter would in this instance provide the counterfactual case.
Both sets of models will require data on contextual conditions and forecast outputs, whilst the CGE models would also require expenditure information. Given the resource requirements and uncertainties about CGE modeling, it is envisaged that the existing structural model will be the most appropriate source of evidence.
(iii) Thames Gateway, East London and London 2012 Host Borough modelling
There are other analytical tools that can be used to explain the importance of different contextual factors in influencing area changes. Due to data availability, such models are most appropriately applied at a sub-regional or local authority level.
Place Analysis
Recent research has started to examine the relationships between performance characteristics of places and their underlying economic attributes.18 The basis of the work lies in recognising that all places are a mix
18 These techniques have, for example, recently been successfully applied for the Homes and Communities Agency in order to assess the link between the attributes or assets that places possess and their economic and worklessness performance.
London 2012 Olympics | 59
of different economic ‘assets’ and that the nature of the mix may operate to enhance or hinder underlying performance.
It has traditionally proved difficult to place a diverse set of ‘local’ economic assets against each other on a common and consistent basis and in the context of a wider performance measure. The primary problem relates to collinearity between asset variables which makes the application of standard statistical techniques problematic.
However, the use of data reduction techniques – such as principal components – provides a way of addressing the issue of collinearity and thereby the basis for weighting the relative importance of underlying assets. The latter can be determined through techniques such as discriminant analysis that imply association rather than causation.
In the context of the 2012 Olympics, the approach could be used to establish a set of baseline ‘asset weights’ at local authority level. The change in scores across asset groups over a time period that extends from pre-announcement to end-point, relative to a weighted average of scores for a wider reference geography such as Greater London, would then be calculated. A difference-in-difference calculation might then be applied to examine the extent to which differential score patterns might be attributed to announcement and development of the Games. Much of the data required to construct these models has already been assembled as part of the baseline and trend analysis database.
Decomposition Analysis
Decomposition analysis provides a complementary approach to the place analysis framework outlined above. Traditional forms of the approach seek to explain differences in labour market status (activity, employment, unemployment, inactivity) across areas via analysis of variation in the characteristics of people between those areas. The latter are normally defined through reference to large-scale surveys such as the Annual Population Survey (APS). Recent research for the Homes and Community Agency (HCA) has extended the approach to control for differences in the asset mix of areas as well as individuals.
In the context of the 2012 Olympics, the approach could be used to establish a set of baseline ‘weights’ for both individuals and place assets that can then be used to measure change in both the composition of people and asset attributes over a time period that extends from pre-announcement to end-point relative to a weighted average of scores for a wider reference geography such as Greater London.
It is considered that both approaches have a role to play in the evaluation and can be used, in particular, to identify the extent to which the underlying characteristics of areas have changed. This will enable informed evidenced-based judgments to be made on the durability of changes.
60 | London 2012 Olympics
(iv) Local Impact Area and Neighbourhood Modelling
A particular requirement of the evaluation is to examine the extent to which there has been convergence within the London 2012 Host Boroughs. The relative performance of small areas therefore needs to be analysed. A number of approaches are available to examine neighbourhood-level effects of the Games.
Transition Analysis
Transition analyses focus on the extent to which the ‘position’ of areas of interest alters relative to some defined reference point. Position status can be assessed in terms of whatever variable set is available at the neighbourhood level, and for which a time-series extends across the period of concern.
One approach might be to construct a formal econometric model that seeks to explain the probability of neighbourhood transition from one relative position to another. For example, a neighbourhood may have a workless rate X times lower/higher than its local area at one point in time and Y times higher/lower at a later stage. If the time-points coincide with pre/post Olympics stages then it would be feasible to construct an econometric model that:
• assesses the ‘observed’ probability of transition across all neighbourhoods in an area (e.g. Greater London) over the time period of interest;
• controls for the varying socio-economic characteristics of those neighbourhoods; and
• uses specific identifiers for the Olympic neighbourhoods’ areas.
The objective would be to assess whether the Olympic neighbourhoods are defined as having a statistically significant transition (i.e. improvement) probability once other features of the areas are taken into account (by comparing their respective net changes).
Performance Analysis
A variant of the transition approach would be to undertake a more extensive longitudinal analysis wherein year-on-year change in a status variable is used as the basis for analysis of neighbourhood effects. A typical approach here would be a difference-in-difference analysis whereby:
• Olympic neighbourhoods are ‘matched’ against other neighbourhoods on the basis of a set of socio-economic characteristics (using techniques such as propensity score matching);
• differential performance prior to announcement is taken into account; and
• performance across the two sets of areas is examined post announcement.
Using controls for socio-economic characteristics and using fixed-effects methods to control for unobserved heterogeneity, the objective would again be to examine whether the Olympic neighbourhoods are defined as having
London 2012 Olympics | 61
a statistically significant differential performance path once other features of the areas are taken into account.
The transition and performance analyses have been applied as part of both the DCLG NSNR and LEGI evaluations in order to isolate programme impacts. They will be of particular relevance to the assessment of change due to the Olympics particularly in the areas immediately adjoining the Olympic Park. By enabling the quantification of attributable net change, they will provide an important input into VfM calculations.
5.3 ‘Bottom-up’ sources, analyses and scope
5.3.1 Introduction
Analysis of the various activities and interventions contributing to regeneration legacy impacts will be required in order to complement (and corroborate) the ‘top down’ assessments of change in the areas. The following sections briefly summarise the main sources of evidence and the scope of activities that will require consideration as part of the DCLG evaluation. An important consideration will be to avoid double counting of impacts between interventions and to consider the extent to which two-way causality arises (i.e. mutually self-reinforcing impacts). An example might be the major Stratford City retail-led development and the Olympics.
5.3.2 Sources and analyses
(i) Project reviews, monitoring and management information
Detailed reviews will need to be undertaken for each project/activity. The scope will vary according to the project status at the time of review and will include assessment of the following:
• Rationale for intervention;
• Objectives;
• Current and future context, including market conditions;
• Delivery arrangements;
• Costs/funding (profile and sources);
• Output, outcomes and impacts (including comparison with forecast); and
• Risks.
Important sources of information will be existing monitoring data and management information produced by organisations such as the LDA and ODA.
(ii) Consultations
A programme of consultations will need to be undertaken to ensure a comprehensive view of the efficiency and effectiveness of the design, delivery
62 | London 2012 Olympics
and impact of the project/activity. The consultations would be particularly important for developing an understanding of some of the processes involved in delivering the London 2012 legacy, and also some of the softer legacy aspects, such as design, placemaking and architectural qualities – all of which will need, at least in part, qualitative dimensions to their assessment. The proposed consultees would include:
(a) Delivery organisation(s);
(b) DCLG/DCMS;
(c) OPLC/2012 MDC;
(d) GLA;
(e) Representatives on Governance boards/structures; and
(f) Other relevant organisations including the London 2012 Host Boroughs and residents’ organisations.
These consultations should be based on semi-structured interview topic guides that will seek to identify key aspects of the project/activity concept, design and delivery. The interviews should be undertaken via a mix of face-to-face and telephone consultations. Information should be collected on:
• Project details;
• Project rationale;
• Funding;
• Project performance (expected and actual);
• Impact – direct and indirect;
• Additionality – what would have happened anyway (the counterfactual);
• Appropriateness and continued relevance of the project;
• Linkages;
• Effectiveness of partner involvement, capacity, expertise, shared vision, roles and responsibilities;
• Effectiveness of project administration, partner co-ordination/co-operation, including SAV; and
• Project issues in concept, design and development and delivery.
(iii) Beneficiary surveys
Independently collected direct beneficiary information is a critical element in informing ‘bottom up’ judgments on the additionality, effectiveness and efficiency of an intervention. Detailed surveys, which are capable of producing statistically robust findings, will need to be designed and implemented for those major regeneration projects that are not being evaluated elsewhere. Close liaison will be required with the OPLC/2012 MDC and other organisations (such as LTGDC) to determine respective responsibilities and ensure a co-ordinated and streamlined approach.
London 2012 Olympics | 63
(iv) Other evaluations and research
Given the range of activities that potentially fall within the remit of this Evaluation Framework and the number of agencies involved, it will clearly be important to ensure a co-ordinated approach to evaluation activity. This will be especially important with regard to establishing complementary methodologies for the assessment of ‘technical’ issues such as additionality and value for money. The DCMS meta-evaluation will have a clear responsibility in this regard and such evidence will be an important input to this DCLG evaluation. Currently, identified relevant existing and proposed evaluation activity includes:
• Olympic Games Impact Study (IOC);
• LDA Evaluation;
• CompeteFor Evaluation; and
• Host2Host Evaluation.
In addition a wide range of reports have been produced or are planned concerning specific aspects of legacy. These will be accessible through a ‘learning legacy’ website which is due to be launched by the ODA.
(v) Benchmarking
The results of previous evaluations and research will need to be reviewed in order to identify appropriate cost effectiveness and BCR benchmark ratios. This will include evidence from previous major events (such as the Commonwealth Games), project evaluations (for example, those undertaken of the Regional Development Agency activities and reported in the PriceWaterhouseCoopers (PwC) report on RDA impacts)19 and research (including the recent DCLG Valuing the Benefits of Regeneration study). 20
5.3.3 Scope
Evidence on expenditures, outputs and impacts will need to be collected concerning specific Olympic activities related to DCLG policy areas. These fall into four broad groups as follows:
• development, use and re-use of Games’ facilities;
• activities specifically designed to secure and maximise the regeneration legacy;
• infrastructure developments; and
• adjoining developments.
Examples of the type of activities involved in each and which are relevant to the regeneration legacy of the Games are considered in turn below.
19 BIS 2009, ‘Impact of RDA spending – National report – Volume 1 – Main Report’.20 DCLG 2010, ‘Valuing the Benefits of Regeneration’, Economics paper 7.

64 | London 2012 Olympics
(i) Development, use and re-use of Games’ facilities
Key facilities proposed for the Olympic Park at Stratford include the sport venues, athlete accommodation, the media centre and a high quality public realm environment. The proposed arrangements for the development, use and re-use of these facilities are currently as follows:
Olympic village
• The Olympic Village will provide 2,818 new homes, including 1,379 affordable homes. The communities that develop in the area after the Games will be supported by new parks, open space, transport links, and community facilities. Facilities will include the Chobham Academy, a new education campus with 1,800 places for students aged 3-19.
Olympic Park – North and South
• Much of the 2.5 sq km site will be transformed into parkland, with new green spaces created upon what was previously contaminated industrial land. The southern part of the Park will include riverside gardens, markets, events, cafes and bars. The northern area will use the latest green techniques to manage flood and rain water and provide quieter public space and wildlife habitats. Some 4,000 trees, predominantly native species, will be planted, alongside 300,000 wetland plants. An area of gardens will also be created, stretching between the Aquatics Centre and the Olympic Stadium.
Stadium
• The new, 80,000 capacity all-seater stadium has been built on an island site on the south side of the Olympic Park. Following on from 2012, it will continue to be a focus for sport within East London. At the time of writing, West Ham United and the London Borough of Newham had been selected as the preferred bidder as lessee of the stadium.
Aquatic and multi-use Sports Centre
• It is anticipated that the Aquatics Centre will become London’s leading facility for aquatic sports, as well as providing an important facility for local communities, clubs and schools. The handball arena will be adapted to become a multi-use sports centre for community use, athlete training and small to medium sized functions and a venue for activities ranging from international competition to community sports.
Velodrome
• Under proposed legacy arrangements the Velodrome will be incorporated into a wider VeloPark, with a new mountain bike course, BMX circuit and cycle speedway track delivered alongside a mile long road cycle circuit. It is envisaged that this facility will be made available for both elite riders and for members of the community.
London 2012 Olympics | 65
International Broadcast Centre and Main Press Centre (IBC/MPC)
• The IBC/MPC will be transformed to create more than 80,000 sq m of flexible business space, with the potential to accommodate thousands of new jobs. The centre has an innovative design which will allow the building to be reconfigured for use by either a single or multiple tenants. High quality infrastructure will remain in place to benefit this new floorspace.
(ii) Regeneration legacy activities
Place and Environment
The main impacts of the Games on the physical fabric will be felt within East London. Relevant activities are primarily being delivered through the ODA, the OPLC, the London 2012 Host Boroughs, LTGDC, Lee Valley Regional Park Authority and Transport for London (TfL). In addition to the proposals for re-use of the Olympic Park as summarised above, they include public realm improvements in the London 2012 Host Boroughs (including Stratford High Street).
As well as its impacts on ‘place’ within East London, the Games could have potentially far-reaching impacts in terms of wider environmental sustainability. One of the key 2012 legacy promises is “to make the Olympic Park a blueprint for sustainable living”. A planning application is shortly to be submitted for the Legacy Masterplan Framework. Activities designed to fulfill this ambition will take place before, during and after the Games. They include:
• adoption of sustainable construction practices during the construction of the Olympic venues and Olympic Park;
• ODA investment in, and promotion of, walking and cycling infrastructure and public transport and other infrastructure designed to encourage a modal shift;
• sustainable management of the events themselves and the provision of guidance and new standards for sustainable event management; and
• a Department for Environment, Food and Rural Affairs (DEFRA) fund (‘Inspiring Sustainable living’) of £1m in 2010/11 to fund interventions by third sector organisations that use the inspirational power of the Games to encourage communities to adopt greener behaviours.
A key issue will be the changing pattern of land uses and intensity of activity within the area.
Economy and skills
The Games and its legacy have the potential to generate substantial economic benefits for individuals, businesses, local communities and the UK as a whole. This evaluation’s interest in these benefits is particularly focused on the degree to which they contribute to the sustainable regeneration of

66 | London 2012 Olympics
East London. The public sector is undertaking a number of programmes that are designed to maximise these benefits. Examples include:
• CompeteFor – an electronic brokerage service led by the LDA that enables companies to access opportunities in London 2012’s supply chains and links businesses to existing business support services;
• the London 2012 Business Network – a programme of business events supporting CompeteFor;
• the Host2Host programme – a UK Trade and Investment (UKTI) programme designed to develop trade with other host and bid cities of Olympic and other Games;
• ODA’s Employment and Skills Strategy (‘Jobs, Skills, Futures’) which aims to promote sustainable employment opportunities and to boost skill levels through, in particular, helping local people and the unemployed into training and work on the Olympic site and other construction projects;
• LDA’s London 2012 Employment and Skills Taskforce (LEST) comprising £75 million for programmes to support Londoners into jobs by addressing structural employment issues, long- term worklessness, supporting businesses and tackling youth unemployment through apprenticeships and training;
• the London 2012 Host Boroughs’ Local Employment Training Framework (LETF), which provides skills development, employment brokerage and business support to assist residents and businesses in the London 2012 Host Boroughs;
• various Sector Skills Councils’ initiatives – to support skills development in key sectors, for example hospitality, sports and leisure, travel and tourism, construction, creative industries and retail;
• Visit Britain marketing campaigns – to build the destination potential of London;
• Relay London – a London-wide network of job brokerage and employment support organisations and a part of the recruitment procedure for job vacancies and training courses around the construction of the Olympic Park; and
• Connect to London – to use the Games as a catalyst to increase the levels of foreign direct investment into London.
Social and community
The Games will potentially generate a diverse range of social and community impacts particularly within the London 2012 Host Boroughs. These might vary from, for example, new facilities through a stronger community infrastructure to a greater sense of community cohesion and belonging. Examples of publicly-funded activities include:
• a number of initiatives designed to increase volunteering activity;

London 2012 Olympics | 67
• the Cultural Olympiad – an £80 million four-year event running up to 2012 to showcase the UK’s arts and culture to the rest of the world;
• Legacy Trust UK – comprising regional and national activities designed to promote involvement and awareness of the Games and to leave a lasting legacy in communities throughout the United Kingdom; and
• Get Set – developed by LOCOG and the Department for Education (DfE) to increase the engagement of schools and colleges with the Games.
Sport and health
There are plans for five major sports venues within East London to be retained after the Games – including a cluster of sports venues in the Lower Lea Valley (the Stadium, Aquatics Centre, Velopark, Hockey Centre and Indoor Sport Centre) together with facilities in Hackney and Waltham Forest and science and sports medicine facilities. In addition there are a range of initiatives designed to capitalise on the Games in order to promote greater participation in sport and exercise and as a consequence improve health. It is these aspects of the Games’ impacts that are the major focus for this evaluation – rather than the benefits for sporting excellence. Relevant initiatives include:
• the Physical Education and Sport Strategy for Young People (PESSYP) – led by DCMS and DfE. Strands that aim to increase participation include:
– Sport Unlimited – offering young people the chance to attend ‘taster’ sessions of sport totalling 5 hours over 10 weeks (led by Sport England);
– Recruit into Coaching – a programme that aims to get 10,000 volunteer coaches working in 70 deprived areas of England; and
– Infrastructure – including funding for 450 School Sport Partnerships, 225 Competition Managers, FE Co-ordinators, 3,200 School Sports Coordinators and 18,000 Primary Link Teachers.
• various school sports events including: an Olympic-style school sports event; a local league structure for primary and secondary schools; 2010 UK School Games; National School Sports Week;
• Walking for Health – a joint Department for Health (DH)/defra initiative;
• Change4life – a DH healthy living marketing campaign; and
• Playsport London – a Mayoral initiative that aims to increase participation in sports across the capital. It includes a Sports Participation Fund, a Facility Fund and a Skills Investment Programme to develop training and skills across those working and volunteering in the Games.
(iii) Infrastructure developments
The successful delivery of the Games is dependent upon effective infrastructure to provide efficient access and reliable power.
London 2012 is aiming for 100% of spectators to get to the Games by public transport, or by walking or cycling. In line with this ambition, there has been
68 | London 2012 Olympics
significant investment to improve transport provision, including rail, bus, pedestrian and cycling infrastructure.
• Rail infrastructure – Improvements have been made to both overground and underground rail services, with investment focused around four primary interventions:
– Investment at Stratford Regional Station to boost capacity and enhance accessibility, including new lifts, improved platforms, a new westbound Central Line platform and a re-opened subway. It is anticipated that as a result of these improvements the number of people using the station each morning will more than double to 83,000. Improvements will deliver significant improvements for residents in the years preceding and following on from the Olympics;
– Investment in the Docklands Light Railway system will ensure high quality access to key venues including the Olympic Park. Enhancements include line extensions providing a second crossing under the Thames, links between Canning Town and Stratford International, new stations and 22 new railcars. This investment will continue to benefit residents of East London after the Olympics, significantly improving access to parts of the area that have previously suffered from poor transport links;
– Stratford International Station has been created to provide a link for London 2012 spectators travelling to the Olympic Park from central London and from the Ebbsfleet transport hub in Kent. During the Games, a high-speed rail service called the Javelin will run from St. Pancras International Station in central London to Stratford International in just seven minutes; and
– improvements to West Ham station, creating a new greenway that will take spectators directly from the station to the Olympic site to ensure that disruption for regular commuters and residents resulting from additional journeys is minimised.
• Bus routes – During the Games additional services will operate to take spectators to Olympic venues including the Olympic Park. Around 500 buses and coaches will be used for shuttle services between venues and park-and-ride sites. A further 90 vehicles will connect park-and-ride sites on the edge of the M25 with the Olympic Park and Ebbsfleet, from where spectators will be able to take the high-speed Javelin train service to the Park.
• Walking and cycling – Investment will significantly improve and add to the existing network of routes within the Lower Lea Valley that cater exclusively for cyclists and pedestrians. Over 50 km of cycling routes and 30 km of pedestrian routes will be created or upgraded. These routes will provide easy, high quality and attractive access to the Olympic Park. They will help to open up access to, through and within the Lower Lea Valley, and create a valuable community resource for use following on from the Games.
London 2012 Olympics | 69
Alongside improved transport and access, there has been investment in infrastructure to guarantee heat and power across the Olympic Park site. The Energy Centre has been constructed in the west of the Olympic Park to provide an efficient power, heating and cooling system across Olympic Park site for the Games and for the new buildings and communities that will develop after 2012, with capacity to power up to 10,000 new homes.
The Energy Centre includes biomass fired boilers, using sustainable biomass fuels to generate heat, and a Combined Cooling Heat & Power (CCHP) plant to capture the heat generated by electricity production. This contributes significantly to the overall target to reduce carbon emissions by 50% across the Olympic Park. The site wide heat network will generate domestic hot water and heat the Aquatics Centre swimming pools and other venues and buildings. The Energy Centre design is flexible to allow future technologies to be incorporated as they are developed in years to come.
(iv) Adjoining developments
A range of masterplans and proposals have been developed for a series of Olympic Arc or fringe areas. The evaluation will need to assess change in these areas and the impact that the Games has had on their performance.
A number of key developments and sites will need specific consideration, including:
• Stratford City – Westfield is developing a £1.5 billion retail-led development. The scheme is anticipated to accommodate some 18,000 permanent jobs once complete;
• Sugar House Lane – a mixed-use scheme is proposed with around 1,500 new homes on a 5 hectare (13 acre) site. The developer for the scheme is owned by Inter Ikea. In addition, it is understood that a potential comprehensive scheme including the Three Mills site is also under consideration;
• Bromley-by-Bow – a mixed-use scheme is being progressed for the southern part of this area, led by Tesco. The scheme has been noted as one of the first Olympic Regeneration Legacy developments. The north of the Bromley-by-Bow area is part owned by Southern Housing Group and part East Thames Group, along with the LTGDC and other private owners. Again various comprehensive redevelopment plans are proposed; and
• Hackney Wick – a new masterplan for the Hackney Wick area is currently being finalised. This envisages a mixed-use area with studios and workshops.
Other major development schemes are being progressed in the wider area, for example, in Canning Town, at Blackwall Reach and on the Leamouth Peninsula. However, these are more remote from the Olympic Park and may be less directly affected.
70 | London 2012 Olympics
Cisco and the OPLC recently announced their commitment to explore opportunities for the Olympic Park to become the UK’s first Smart+ Connected Community. In addition, Cisco also intends to establish an Innovation Centre on the Park creating a centre for technical excellence and development, as well as a showcase for new technologies.
5.4 Valuation of impacts
As noted in Section 4.3.5 above, there are essentially three ways in which the value of benefits can be assessed:
• revealed preference techniques – either the market value of a benefit or, where this does not exist, this method relates the value of a non-marketed good to that of a marketed good (such as land and property values);
• stated preference techniques – this is a survey method whereby preference information is collected by asking individuals/households how much they are willing to pay (WTP) or willing to accept (WTA) in compensation for some change in the provision of a good or service. Thus, for example, using interviews to ascertain the monetary value that individuals or households would attach to a facility such as the Olympic Park; and
• benefits transfer – this involves taking available information from valuation studies already completed in one location and/or context and applying them to the current context. For example, value per hectare figures from previous studies of urban parks could be used to assess the value of the Olympic Park.
The choice of approach depends upon the type of benefit being assessed. For example, revealed preference techniques and stated preference techniques can both be used to estimate use values. However, only stated preference techniques can be used to estimate non-use values as shown in Figure 5.3.
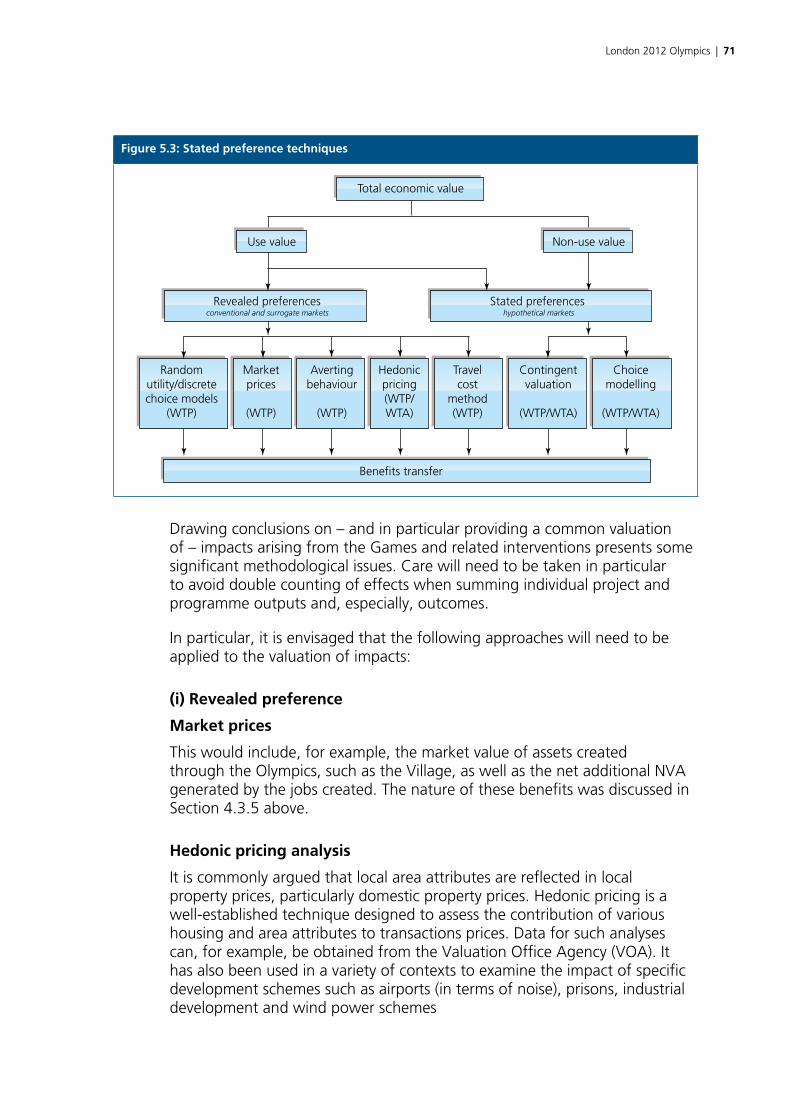
London 2012 Olympics | 71
Figure 5.3: Stated preference techniques
Total economic value
Use value Non-use value
Revealed preferencesconventional and surrogate markets
Stated preferenceshypothetical markets
Randomutility/discretechoice models
(WTP)
Marketprices
(WTP)
Avertingbehaviour
(WTP)
Hedonicpricing(WTP/WTA)
Travelcost
method(WTP)
Contingentvaluation
(WTP/WTA)
Choicemodelling
(WTP/WTA)
Benefits transfer
Drawing conclusions on – and in particular providing a common valuation of – impacts arising from the Games and related interventions presents some significant methodological issues. Care will need to be taken in particular to avoid double counting of effects when summing individual project and programme outputs and, especially, outcomes.
In particular, it is envisaged that the following approaches will need to be applied to the valuation of impacts:
(i) Revealed preference
Market prices
This would include, for example, the market value of assets created through the Olympics, such as the Village, as well as the net additional NVA generated by the jobs created. The nature of these benefits was discussed in Section 4.3.5 above.
Hedonic pricing analysis
It is commonly argued that local area attributes are reflected in local property prices, particularly domestic property prices. Hedonic pricing is a well-established technique designed to assess the contribution of various housing and area attributes to transactions prices. Data for such analyses can, for example, be obtained from the Valuation Office Agency (VOA). It has also been used in a variety of contexts to examine the impact of specific development schemes such as airports (in terms of noise), prisons, industrial development and wind power schemes
72 | London 2012 Olympics
Robust use of hedonic pricing methods in the Games context will require (as a minimum) a longitudinal database of housing characteristics and transactions prices that covers the Olympic area, along with a wider geography for comparative purposes, prior to the announcement, through the development period and after the Games.
Housing characteristics (bedrooms, gardens, heating, bathrooms and so on) are important since they help to differentiate between properties on the market and are necessary to facilitate an appropriate control within hedonic regressions. Other variables such as area characteristics are required to control for local area effects and the objective of any such analysis would be to assess whether Olympic areas have experienced any statistically significant trends in transactions prices following the announcement of the Games, allowing for housing and area attributes.
(ii) Stated preference
Contingent valuation and choice modelling
Contingent valuation (and choice modelling) are techniques sometimes used to assess the tangible and/or intangible or non-market value of specified events. The essence of the approach is to define the willingness to pay (WTP) of individuals for an event or facility and thereby establish a value for the total benefits that can be compared to delivery costs. This type of approach will be particularly important in relation to, for example, the Olympic Park.
By their very nature, the contingent valuation and choice modelling approaches require use of sample surveys to elicit WTP values. The design of such surveys requires significant expertise. The information collected, in addition to WTP questions, will often include other details of the individuals so that an econometric WTP ‘function’ can be estimated. This can then be used to examine the differential impact of individual characteristics on WTP.
Shadow pricing
Shadow pricing techniques are a variant of the contingent valuation and choice modelling approaches and provide an alternative basis on which to assess the value of intangible or non-market goods and services. The essence of the approach lies in relating an individual’s views of a ‘change in circumstance’ to a set of individual characteristics, including income. Econometric modelling can then be used to assess the statistical relationship between the two and the statistical relationship with income can be used to provide a basis for valuing change. As with contingent valuation and choice modelling approaches, the approach requires sample surveys to gather data on, for example, individual income and perceptions of improvements in the area. An example of this approach can be found in the New Deal for Communities report.21
This approach has potential for use in the case of the Olympics – enquiring about the state of the local area prior to and post the Olympics event for
21 DCLG 2010, ‘The New Deal for Communities Programme: Assessing Impact and Value for Money’, Volume 6.
London 2012 Olympics | 73
example. Its application, however, would require a survey exercise to be set in place almost immediately and to be replicated at the end of the process. In addition, minimising the effects of unobservable heterogeneity would suggest that some form of panel survey base would be preferable.
The overall valuation of the impacts of the Games will comprise two mutually exclusive approaches:
A. Aggregate top-down analysis
This could combine, for example, the results of the hedonic pricing, the top-down modeling-based market price impacts (such as increased jobs) and satisfaction (shadow pricing).
B. Aggregate bottom-up analysis
This would aggregate the values associated with specific activities (see Section 5.3). These benefits would be valued using either market prices (where they exist) or contingent valuation/choice modeling for activities such as the Park.
In both of the above care will need to be taken to avoid double counting. However, by undertaking two alternative approaches a robust estimate of value can be derived.
74 | London 2012 Olympics
6 Conclusion and Recommendations
This document has set out a Framework for DCLG to measure the regeneration impacts and legacy of the 2012 Olympics. It has described the scope of the evaluation in terms of the activities to be assessed and the impacts to be measured as well as their attendant geographies and timescales. The methodology presented comprises both ‘top-down’ and ‘bottom-up’ approaches and is HM Treasury Green Book compliant. It represents a comprehensive and robust approach to the task.
The Framework identifies the following key research questions that the evaluation will need to address:
• What are the costs of the Olympics?
• What are the impacts of the Olympics, i.e.:
– How have things changed?
– How additional are the effects?
– How durable are the effects?
– Have residents of the London 2012 Host Boroughs benefited from the Games (i.e. how fairly have the benefits been distributed?)
– What is the value of the benefits generated?
• What processes have been involved, i.e.:
– How well have legacy benefits been planned for, administered and delivered?
– What have been the wider partnership and process impacts?
• Do the Olympics regeneration legacy benefits represent value for money?
In answering these questions, the evaluation will need to utilise a range of primary and secondary sources of evidence and deploy a variety of analytical techniques. The relationship between these is summarised in Figure 6.1 which is reproduced from Section 5. As well as the importance of ‘secondary’ information from the monitoring and evaluation of individual programmes/projects and Games-related activities, the table highlights the important role that survey-based information will play in addressing each of the main research questions. A co-ordinated, cost effective approach to commissioning and undertaking surveys will be required. Currently there is limited beneficiary data available and baseline data is also deficient with regard to some of the more qualitative aspects of potential impacts (such as place-making, design and architectural quality).
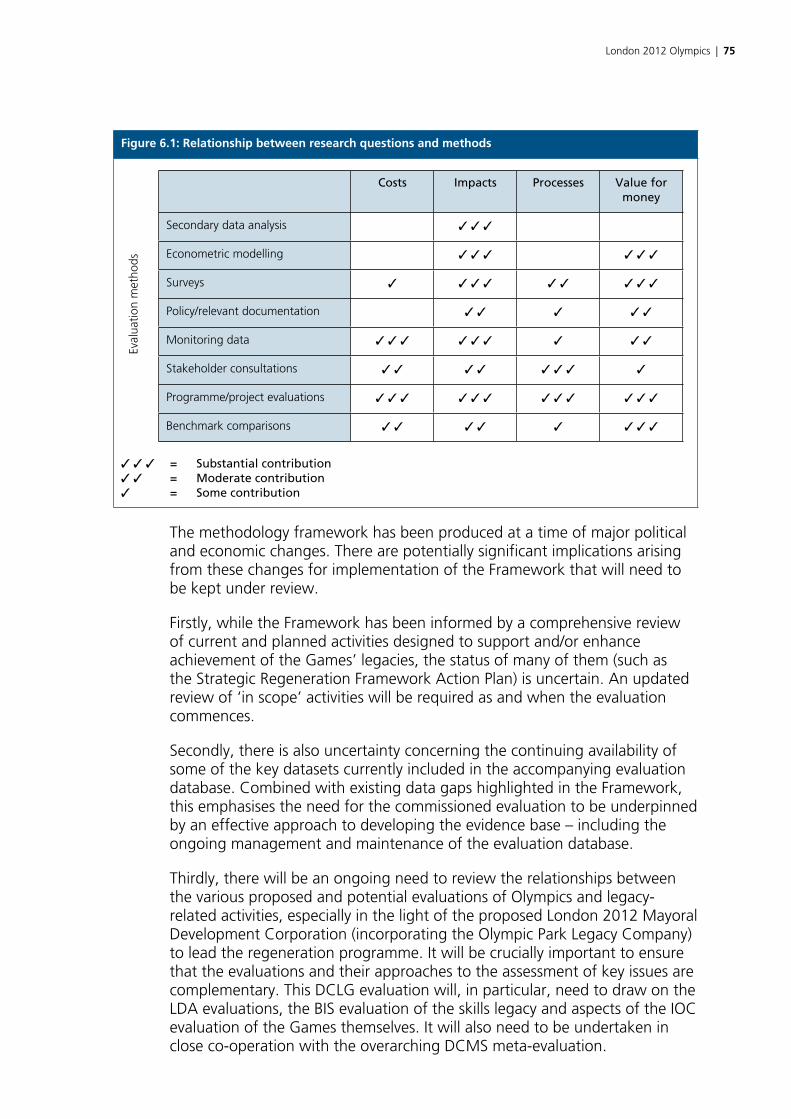
London 2012 Olympics | 75
Figure 6.1: Relationship between research questions and methodsEv
alua
tion
met
hods
Costs Impacts Processes Value for money
Secondary data analysis 3 3 3
Econometric modelling 3 3 3 3 3 3
Surveys 3 3 3 3 3 3 3 3 3
Policy/relevant documentation 3 3 3 3 3
Monitoring data 3 3 3 3 3 3 3 3 3
Stakeholder consultations 3 3 3 3 3 3 3 3
Programme/project evaluations 3 3 3 3 3 3 3 3 3 3 3 3
Benchmark comparisons 3 3 3 3 3 3 3 3
3 3 3 = Substantial contribution3 3 = Moderate contribution3 = Some contribution
The methodology framework has been produced at a time of major political and economic changes. There are potentially significant implications arising from these changes for implementation of the Framework that will need to be kept under review.
Firstly, while the Framework has been informed by a comprehensive review of current and planned activities designed to support and/or enhance achievement of the Games’ legacies, the status of many of them (such as the Strategic Regeneration Framework Action Plan) is uncertain. An updated review of ‘in scope’ activities will be required as and when the evaluation commences.
Secondly, there is also uncertainty concerning the continuing availability of some of the key datasets currently included in the accompanying evaluation database. Combined with existing data gaps highlighted in the Framework, this emphasises the need for the commissioned evaluation to be underpinned by an effective approach to developing the evidence base – including the ongoing management and maintenance of the evaluation database.
Thirdly, there will be an ongoing need to review the relationships between the various proposed and potential evaluations of Olympics and legacy-related activities, especially in the light of the proposed London 2012 Mayoral Development Corporation (incorporating the Olympic Park Legacy Company) to lead the regeneration programme. It will be crucially important to ensure that the evaluations and their approaches to the assessment of key issues are complementary. This DCLG evaluation will, in particular, need to draw on the LDA evaluations, the BIS evaluation of the skills legacy and aspects of the IOC evaluation of the Games themselves. It will also need to be undertaken in close co-operation with the overarching DCMS meta-evaluation.
76 | London 2012 Olympics
A detailed timetable for the evaluation will need to be developed by DCLG. However, it is envisaged that the following milestones should form the basis for a detailed programme:
• 2013 Report on Games Preparation and the Games;
• 2016 Interim Regeneration Legacy Report; and
• 2024 Final Regeneration Report (this will allow sufficient time to incorporate 2021 Census data).
It is recommended that:
(i) surveys (of residents, businesses and beneficiaries) be designed and undertaken to ensure that there is a complete baseline which can provide the basis for assessing the extent to which local people (from varying backgrounds) and businesses have benefited from the Games;
(ii) future stages of the regeneration legacy evaluation are commissioned in line with the proposals set out in this Framework (using the dates provided above as guidance);
(iii) arrangements should be made to ensure that this evaluation continues to be co-ordinated with other government departments’ and other organisations’ London 2012 evaluations in order to avoid duplication. This will be particularly important in the light of proposed changes to the governance of London 2012 with the formation of the London 2012 Mayoral Development Corporation. The evaluation should also be co-ordinated with the monitoring and evaluation plans of the London 2012 Host Boroughs; and
(iv) the AMION baseline and trend database is maintained and updated to provide London 2012 partners with monitoring information on key socio-economic and other indicators.
London 2012 Olympics | 77
List of AcronymsABI Annual Business Inquiry
ADF Area Development Framework
APS Annual Population Survey
BCR Benefit: cost ratio
BERR Department of Business, Enterprise and Regulatory Reform
BMX Bicycle Motocross
CBA Cost-benefit analysis
CCHP Combined Cooling Heat & Power
CGE Computable Generalised Equilibrium
CPC Cambridge Policy Consultants
CSR Comprehensive Spending Review
DCLG Department for Communities and Local Government
DCMS Department for Culture, Media and Sports
DCSF Department for Children Schools & Families
DEFRA Department for Environment, Food and Rural Affairs
DfE Department for Education
DH Department of Health
DSO Departmental Strategic Objective
DTI Department of Trade and Industry
EEDA East of England Development Agency
ESA Employment Support Allowance
ESRC Economic and Social Research Centre
FCO Foreign and Commonwealth Office
FDI Foreign Direct Investment
GCSE General Certificate of Secondary Education
GLA Greater London Authority
GLUD Generalised Land Use Database
GOE Government Olympic Executive
GVA Gross Value Added
IB Incapacity Benefit
IBC International Broadcast Centre
IMD Index of Multiple Deprivation

78 | London 2012 Olympics
IOC International Olympic Committee
JC+ JobCentre Plus
JSA Job Seekers Allowance
LA Local Authority
LAP Legacy Action Plan
LDA London Development Agency
LEED Local Economic and Employment Development
LEGI Local Enterprise Growth Initiative
LEST London Employment and Skills Taskforce
LETF Local Employment & Training Framework
LLV Lower Lea Valley
LMF Legacy Masterplan Framework
LOCOG London Organising Committee of the Olympic Games
LSC Learning and Skills Council
LSOA Lower Super Output Area
LTGDC London Thames Gateway Development Corporation
MAA Multi area agreement
2012 MDC 2012 Mayoral Development Corporation
MPC Main Press Centre
NDC New Deal for Communities
NEET Not in Education, Employment or Training
NI National Indicator
NLUD National Land Use Database
NPV Net present value
NRG Nations and Regions Group
NVA Net Value Added
ODA Olympic Delivery Authority
OECD Organisation for Economic Co-operation and Development
OGI Olympic Games Impact
OPLC Olympic Park Legacy Company
PDZ Planning Delivery Zone
PESSYP Physical Education and Sport Strategy for Young People
PSA Public Service Agreement
PSFP Public Sector Funding Package
PV Present value
London 2012 Olympics | 79
QUALYs Quality Adjusted Life Years
RDA Regional Development Agency
RSL Registered Social Landlord
SAV Strategic Added Value
SMEs Medium-sized enterprises
SRF Strategic Regeneration Framework
STPR Social time preference rate
TfL Transport for London
UEL University of East London
VAT Value Added Tax
VfM Value for money
VOA Valuation Office Agency
WNF Working Neighbourhood Fund
WTA Willing to accept
WTP Willing (ness) to pay
80 | London 2012 Olympics
BibliographyAMION Consulting 2010, ‘Evaluation of the National Strategy for Neighbourhood Renewal’, ISBN 978-1-4098-2269-1.
AMION Consulting 2010, ‘National Evaluation of the Local Enterprise Growth Initiative Programme’, ISBN 978-1-4098-2644-6.
Andranovich, G., Burbank, M. and Heying, C. 2001, ‘Olympic Cities: Lessons Learned from Mega-Event Politics’, Journal of Urban Affairs, 23(2): 113-131.
Arthur Anderson 1999, ‘Economic Impact Study of the Sydney 2000 Olympic Games’, Centre for Regional Economic Research, University of Tasmania.
Balfousia-Savva S., Athanassiou L., Zaragas L. and Milonas A. 2001, ‘The Economic Effects of the Athens Olympic Games’, Centre of Planning and Economic Research: Athens.
BIS 2009, ‘Impact of RDA spending – National report – Volume 1 – Main Report’.
BIS 2009, ‘RDA Evaluation: Practical Guidance on Implementing the Impact Evaluation Framework’.
Blake, A. 2005, ‘The Economic Impact of the London 2012 Olympics’.
Blundell, R., Dearden, L. and Sianesi, B. 1999 ‘Human capital investment: the returns of education and training to the individual, the firm and the economy’, Fiscal Studies, 20: 1–23.
Brunet, F. 1995, ‘An economic analysis of the Barcelona ’92 Olympic Games: resources, financing and impacts’.
Chalkley, B. and Essex, S. 1998 ‘Olympic Games: catalyst of urban change’, Leisure Studies, 17(3): 187-206.
China Business Review 2008, ‘The 2008 Olympics’ Impact on China’, Special Commentary: Olympics, CBR July-August 2008.
DCLG 2010, ‘The New Deal for Communities Programme: Assessing Impact and Value For Money’, Volume 6.
DCLG 2010, ‘Valuing the Benefits of Regeneration’, Economics Paper 7.
DCMS 2008, ‘Before, during and after: making the most of the London 2012 Games’, Legacy Action Plan.
DCMS 2010, ‘Plans for the Legacy from the 2012 Olympic and Paralympic Games’.
DCMS 2011, ‘London 2012 Olympic and Paralympic Games’, Quarterly Report July 2011
London 2012 Olympics | 81
DCMS 2011, ‘Report 1: Scope, research questions and data strategy’, Meta-Evaluation of the Impacts and Legacy of the London 2012 Olympic Games and Paralympic Games.
DCMS 2011, ‘Report 2: Methods’, Meta-Evaluation of the Impacts and Legacy of the London 2012 Olympic Games and Paralympic Games.
DTI 2006, ‘Evaluating the Impact of England’s Regional Development Agencies: Developing a Methodology and Evaluation Framework’, DTI Occasional Paper No.2.
ESRC 2010, ‘Olympic Games Impact Study – London 2012: Pre-Games Report’.
Fujiwara, D. 2010, ‘Methodologies for estimating and incorporating the wider social and economic impacts of work in Cost-Benefit Analysis of employment programmes’, The Department of Work and Pensions Social Cost-Benefit Analysis framework, Working Paper No 86.
HM Government 2010, ‘Local growth: realising every place’s potential
HM Treasury 2003, ‘The Green Book – Appraisal and Evaluation in Central Government’.
Host Boroughs 2009, ‘An Olympic legacy for the host boroughs’, Strategic Regeneration Framework.
Jones Lang LaSalle 2001, ‘Reaching Beyond the Gold: The Impact of the Olympic Games on Real Estate Markets’, Global Insights, Issue 1.
KPMG Peat Marwick 1993, ‘Sydney Olympics 2000 Economic Impact Study’, KPMG Sydney.
Locate in Kent 2009, ‘Economic Impacts of Olympic Games’.
LOCOG 2009, ‘Towards a one planet 2012’, London 2012 Sustainabilty Plan
MacRury, I. and Poynter, G. 2009, ‘London’s Olympic Legacy’, A “Thinkpiece” report prepared for the OECD and DCLG.
New South Wales Treasury 1997, ‘The Economic Impact of the Sydney Olympic Games’, Office of Financial Management, Research & Information Paper.
Newman, H. 1999, ‘Neighbourhood impacts of Atlanta’s Olympic Games’, Community Development Journal, 34(2): 151-159.
OECD 2008, ‘Local Development Benefits from Staging Global Events, ISBN 9264042075.
OECD 2010, ‘Local Development Benefits from Staging Global Events: Achieving the Local Development Legacy from London 2012’, A peer review of the Olympic and Paralympic legacy for East London proposed by the Department of Communities and Local Government, United Kingdom.
82 | London 2012 Olympics
Papanikos, G. 1999, ‘The Tourism impact of the 2004 Olympic Games, Tourism Research Institute:Athens, Study Series 5.
Porter, L., Jaconelli, M., Cheyne J., Eby, D. and Wagenaar, H. 2009 ‘Planning Displacement: The Real Legacy of Major Sporting Events’, Planning Theory & Practice, 10 (3): 395-418.
PriceWaterhouseCoopers 2001, ‘Business and Economic Benefits of the Sydney 2000 Games’
PriceWaterhouseCoopers 2005, ‘Olympic Games Impact Study’ Final Report for DCMS.
Scottish Heritage 2007, ‘Volunteering in the Natural Heritage: An Audit and Review of Natural Heritage in Scotland’.
UBS Limited 2006, ‘Winning by Taking Part: East London’s Economy and the Olympics’, UBS Investment Research
University of East London and London East Research 2009, ‘London’s Olympic Legacy’, A “Thinkpiece” report prepared for the OECD and Department for Communities and Local Government.
London 2012 Olympics | 83
Appendix A: Evidence from previous Olympic Games
Introduction
This Appendix provides a brief overview of evidence on the benefits derived from previous Olympic Games. A fuller description of benefits is available in a report prepared for the OECD Local Economic and Employment Development (LEED) Programme entitled ‘Local Development Benefits from Staging Global Events: Achieving the Local Development Legacy from 2012’ (January 2011, www.oecd-ilibrary.org).
Previous Games and their impacts
Overview
At the outset it should be emphasised that, in reviewing previous Games’ impacts and associated legacy and regeneration activities, their widely varying contexts need to be taken into account. This is particularly the case in terms of:
• the different challenges and opportunities facing each Olympic city – for example Athens had very different problems when it became a candidate city (e.g. pollution and a decaying transport infrastructure) to those that east London now faces;
• the level of focus on regeneration and deprived areas – Sydney in 2000 for example, was less focused on regeneration than the 2012 London Games are and more on establishing an international profile for the city; and
• geographical focus – the London Games are focused on regenerating an area within a city, whereas others – such as Barcelona – have focused on city-wide regeneration.
Table A1 has been drawn from the OECD report to provide an overview of how previous Olympic Games have supported development in host cities. It covers each Games since 1992 (with the exception of Athens in 2004) and identifies seven ‘headline’ areas of economic impact. It is evident that the London Games’ aim of addressing regeneration and deprivation within a relatively small geographical area appears to have been neither as explicit an aim in earlier Games nor a specifically identified impact. The seven headline areas of economic impact that are identified are:

84 | London 2012 Olympics
Tab
le A
1: O
verv
iew
of
chan
ges
in p
revi
ou
s G
ames
ho
st c
itie
s
Even
tFD
IEn
terp
rise
&
Kn
ow
led
ge
Bas
ed
Ind
ust
ries
Trad
eC
on
stru
ctio
nIn
fras
tru
ctu
reB
ran
din
gTo
uri
sm
Bar
celo
na
Oly
mp
ics,
19
92
11th
(199
0) in
ran
king
of
FDI i
n Eu
rope
an c
entr
es,
risin
g to
6th
(200
1).
Rank
ed a
s th
e 4th
mos
t at
trac
tive
EU c
ity f
or
corp
orat
e in
vest
men
t in
20
10.
New
Oly
mpi
c le
gacy
bea
ch f
ront
en
able
d gr
owth
of
dig
ital d
istr
ict:
22
@Ba
rcel
ona.
Th
is h
as e
nabl
ed
esta
blis
hmen
t of
1,
441
new
firm
s an
d in
stitu
tions
, in
clud
ing
univ
ersi
ty
cam
puse
s an
d hi
-te
ch f
irms.
Maj
or
expa
nsio
n of
hig
her
educ
atio
n se
ctor
in
clud
ing
grow
th
in in
tern
atio
nal
stud
ents
.
Ope
ning
up
the
Port
and
impr
ovin
g El
Pra
t A
irpor
t he
lped
incr
ease
in
tern
atio
nal
trad
e –
Barc
elon
a be
cam
e a
gate
way
to
the
Spa
nish
m
arke
t. In
200
9,
its s
tatu
s as
ca
pita
l of
the
Med
iterr
anea
n U
nion
was
co
nfer
red.
Maj
or b
each
fro
nt
rede
velo
pmen
t.
Cul
tura
l rej
uven
at-io
n pr
ojec
ts, i
mpr
ovem
ent
of t
own
squa
res.
Po
blen
ou c
onve
rted
in
to h
igh
qual
ity
resi
dent
ial a
rea.
Re
gene
ratio
n of
se
afro
nt in
198
7.
1989
to
1992
–
num
ber
of
road
s in
crea
sed
by 1
5%. P
ort
open
ed u
p ci
ty
to t
he s
ea. E
l Pra
t A
irpor
t ex
pand
ed.
Railw
ay n
etw
ork
reor
gani
sed.
C
ontin
uous
cyc
les
of im
prov
emen
t si
nce
then
with
fu
rthe
r Po
rt,
Airp
ort,
and
fas
t Tr
ain
expa
nsio
n.
Oly
mpi
cs
prov
ided
Ba
rcel
ona
Bran
d w
ith g
loba
l ap
peal
and
re
ach.
Beca
me
know
n as
an
inno
vativ
e an
d cr
eativ
e ci
ty.
City
bec
ame
syno
nym
ous
with
hig
h te
ch
indu
stry
.
Oly
mpi
cs
expa
nded
the
vi
sito
r ec
onom
y ra
pidl
y.
By 2
000,
the
nu
mbe
r of
for
eign
vi
sito
rs t
o ci
ty h
ad
doub
led
from
19
92 t
o 3.
5 m
illio
n pe
r ye
ar.
Tour
ism
pla
ys
a ke
y ro
le in
br
ing
tale
nt t
o Ba
rcel
ona.
Atl
anta
O
lym
pic
s,
1996
New
rol
e fo
r A
tlant
a as
a
sout
hern
bus
ines
s hu
b.
Pre-
Oly
mpi
cs, m
etro
A
tlant
a ha
d le
ss t
han
1,00
0 in
tern
atio
nally
ba
sed
com
pani
es. I
n 20
10 it
had
2,4
00.
Ope
ratio
n Le
gacy
, sp
onso
red
by p
rivat
e in
vest
men
t, e
xpos
ed 4
00
exec
utiv
es t
o A
tlant
a,
resu
lting
in U
SD 4
00
mill
ion
in in
vest
men
t.
Geo
rgia
Uni
vers
ities
ra
pidl
y ex
pand
ed
thei
r sc
ient
ific
and
busi
ness
-rel
ated
fie
lds
of r
esea
rch
and
stud
y.
Inte
rnat
iona
l st
uden
t re
crui
tmen
t in
crea
sed.
Pre-
Oly
mpi
cs,
met
ro A
tlant
a ha
d on
ly 1
0 in
tern
atio
nal
fligh
ts. N
ow
Har
tsfi
eld
-Ja
ckso
n A
tlan
ta
Inte
rnat
ion
al
Air
po
rt is
the
se
cond
bes
t in
tern
atio
nally
co
nnec
ted
airp
ort
in t
he U
.S.
USD
75
mill
ion
inve
sted
in r
ejuv
enat
ion
of d
ownt
own
Atla
nta.
The
C
ente
nnia
l Oly
mpi
c Pa
rk d
evel
opm
ent
tran
sfor
med
der
elic
t br
ownf
ield
land
in
to a
vib
rant
new
co
mm
unity
.
Oly
mpi
cs
cata
lyse
d th
e re
deve
lopm
ent
of
Har
tsfie
ld A
tlant
a In
tern
atio
nal
Airp
ort.
It g
aine
d a
USD
300
mill
ion
inte
rnat
iona
l ai
r te
rmin
al, a
U
SD 2
4 m
illio
n at
rium
and
ove
rall
impr
ovem
ents
ex
ceed
ing
USD
25
0 m
illio
n.
Wor
ldw
ide
Lou
Har
ris
Poll
– po
sitiv
e pe
rcep
tions
of
Atla
nta
amon
g co
rpor
ate
deci
sion
mak
ers
near
ly d
oubl
ed
afte
r th
e O
lym
pic
Gam
es.
Gam
es p
ut
Atla
nta
on t
he
inte
rnat
iona
l map
, at
trac
ting
mor
e vi
sito
rs t
han
any
othe
r O
lym
pic
Gam
es. V
isito
rs
spen
t a
reco
rd
USD
14.
7 bi
llion
in
Geo
rgia
in 1
996,
m
ostly
out
side
th
e O
lym
pic
time
perio
d.
cont
inue
d
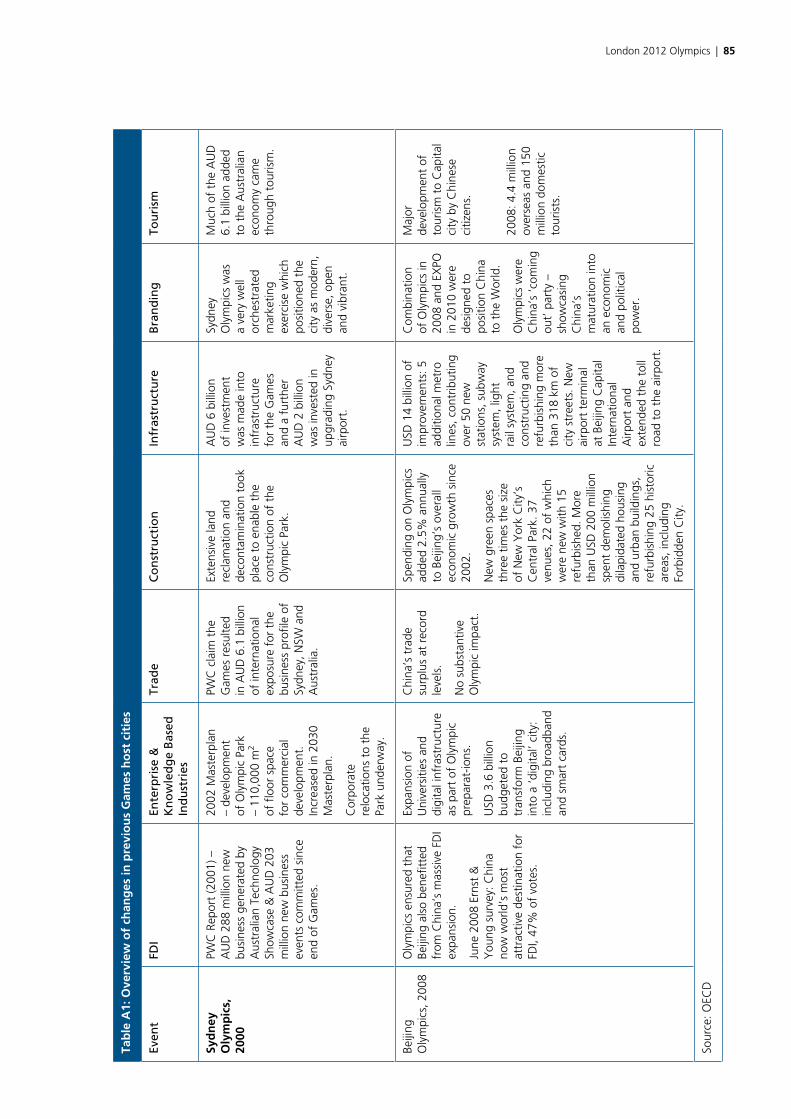
London 2012 Olympics | 85
Tab
le A
1: O
verv
iew
of
chan
ges
in p
revi
ou
s G
ames
ho
st c
itie
s
Even
tFD
IEn
terp
rise
&
Kn
ow
led
ge
Bas
ed
Ind
ust
ries
Trad
eC
on
stru
ctio
nIn
fras
tru
ctu
reB
ran
din
gTo
uri
sm
Syd
ney
O
lym
pic
s,
2000
PWC
Rep
ort
(200
1) –
A
UD
288
mill
ion
new
bu
sine
ss g
ener
ated
by
Aus
tral
ian
Tech
nolo
gy
Show
case
& A
UD
203
m
illio
n ne
w b
usin
ess
even
ts c
omm
itted
sin
ce
end
of G
ames
.
2002
Mas
terp
lan
– de
velo
pmen
t of
Oly
mpi
c Pa
rk
– 11
0,00
0 m
2
of f
loor
spa
ce
for
com
mer
cial
de
velo
pmen
t.
Incr
ease
d in
203
0 M
aste
rpla
n.
Cor
pora
te
relo
catio
ns t
o th
e Pa
rk u
nder
way
.
PWC
cla
im t
he
Gam
es r
esul
ted
in A
UD
6.1
bill
ion
of in
tern
atio
nal
expo
sure
for
the
bu
sine
ss p
rofil
e of
Sy
dney
, NSW
and
A
ustr
alia
.
Exte
nsiv
e la
nd
recl
amat
ion
and
deco
ntam
inat
ion
took
pl
ace
to e
nabl
e th
e co
nstr
uctio
n of
the
O
lym
pic
Park
.
AU
D 6
bill
ion
of in
vest
men
t w
as m
ade
into
in
fras
truc
ture
fo
r th
e G
ames
an
d a
furt
her
AU
D 2
bill
ion
was
inve
sted
in
upgr
adin
g Sy
dney
ai
rpor
t.
Sydn
ey
Oly
mpi
cs w
as
a ve
ry w
ell
orch
estr
ated
m
arke
ting
exer
cise
whi
ch
posi
tione
d th
e ci
ty a
s m
oder
n,
dive
rse,
ope
n an
d vi
bran
t.
Muc
h of
the
AU
D
6.1
billi
on a
dded
to
the
Aus
tral
ian
econ
omy
cam
e th
roug
h to
uris
m.
Beiji
ng
Oly
mpi
cs, 2
008
Oly
mpi
cs e
nsur
ed t
hat
Beiji
ng a
lso
bene
fitte
d fr
om C
hina
’s m
assi
ve F
DI
expa
nsio
n.
June
200
8 Er
nst
&
You
ng s
urve
y: C
hina
no
w w
orld
’s m
ost
attr
activ
e de
stin
atio
n fo
r FD
I, 47
% o
f vo
tes.
Expa
nsio
n of
U
nive
rsiti
es a
nd
digi
tal i
nfra
stru
ctur
e as
par
t of
Oly
mpi
c pr
epar
at-io
ns.
USD
3.6
bill
ion
budg
eted
to
tran
sfor
m B
eijin
g in
to a
‘dig
ital’
city
: in
clud
ing
broa
dban
d an
d sm
art
card
s.
Chi
na’s
tra
de
surp
lus
at r
ecor
d le
vels
.
No
subs
tant
ive
Oly
mpi
c im
pact
.
Spen
ding
on
Oly
mpi
cs
adde
d 2.
5% a
nnua
lly
to B
eijin
g’s
over
all
econ
omic
gro
wth
sin
ce
2002
.
New
gre
en s
pace
s th
ree
times
the
siz
e of
New
Yor
k C
ity’s
C
entr
al P
ark.
37
venu
es, 2
2 of
whi
ch
wer
e ne
w w
ith 1
5 re
furb
ishe
d. M
ore
than
USD
200
mill
ion
spen
t de
mol
ishi
ng
dila
pida
ted
hous
ing
and
urba
n bu
ildin
gs,
refu
rbis
hing
25
hist
oric
ar
eas,
incl
udin
g Fo
rbid
den
City
.
USD
14
billi
on o
f im
prov
emen
ts: 5
ad
ditio
nal m
etro
lin
es, c
ontr
ibut
ing
over
50
new
st
atio
ns, s
ubw
ay
syst
em, l
ight
ra
il sy
stem
, and
co
nstr
uctin
g an
d re
furb
ishi
ng m
ore
than
318
km
of
city
str
eets
. New
ai
rpor
t te
rmin
al
at B
eijin
g C
apita
l In
tern
atio
nal
Airp
ort
and
exte
nded
the
tol
l ro
ad t
o th
e ai
rpor
t.
Com
bina
tion
of O
lym
pics
in
2008
and
EX
PO
in 2
010
wer
e de
sign
ed t
o po
sitio
n C
hina
to
the
Wor
ld.
Oly
mpi
cs w
ere
Chi
na’s
‘com
ing
out’
par
ty –
sh
owca
sing
C
hina
’s
mat
urat
ion
into
an
eco
nom
ic
and
polit
ical
po
wer
.
Maj
or
deve
lopm
ent
of
tour
ism
to
Cap
ital
city
by
Chi
nese
ci
tizen
s.
2008
: 4.4
mill
ion
over
seas
and
150
m
illio
n do
mes
tic
tour
ists
.
Sour
ce: O
ECD

86 | London 2012 Olympics
• foreign direct investment and corporate locations;
• enterprise and job creation in small businesses and the knowledge economy;
• trade development and internationalisation of the business base;
• construction jobs and supply chains;
• infrastructure development that supports economic development and job creation;
• international positioning and branding that supports the growth of markets for the host region and its business base; and
• tourism, entertainment, and hospitality.
Impacts of previous Games
Los Angeles 1984
A study of the Los Angeles Games22 found that the Games had an impact in Southern California of US$2.3 billion in 1984 values and that this supported 73,375 jobs.
The legacy effects of the Los Angeles Games were23:
• $9.6 billion of tourism expenditure;
• a $225 million surplus;
• airport construction speeded up; and
• upgraded sports facilities.
Seoul 1988
A study of the Seoul Games found that the Games had an impact of $1.6 billion. Employment increased by 336,000.24
The most significant legacy effects were felt in the housing market which grew rapidly in terms of prices and rental values during the Olympic year. The most significant impact on the residential market in Seoul was the development of the Olympic Village, which became a new district within the Olympic Corridor.25
Barcelona 1992
Barcelona is often cited as a key example of the potential to use major events to drive regeneration. In the 1980s, Barcelona was seen as a declining city that was suffering from the impacts of de-industrialisation. In 1986, when the city was successful
22 Economic Research Associates, 1984, Community Economic Impact of the 1984 Olympic Games in Los Angeles and Southern California, Los Angeles Olympic Organising Committee (quoted in The Economic Impact of the Olympics, Adam Blake, 2005).
23 Andranovich, G., Burbank, M. and Heying, C. 2001, ‘Olympic Cities: Lessons Learned from Mega-Event Politics’, Journal of Urban Affairs, 23(2): 113-131.
24 Kim, J. et al 1989, ‘Impact of the Seoul Olympic Games on National Development’, Korea Development Institute (quoted in Blake 2005).
25 Jones Lang LaSalle 2001, ‘Reaching Beyond the Gold: The Impact of the Olympic Games on Real Estate Markets’, Global Insights, Issue 1.
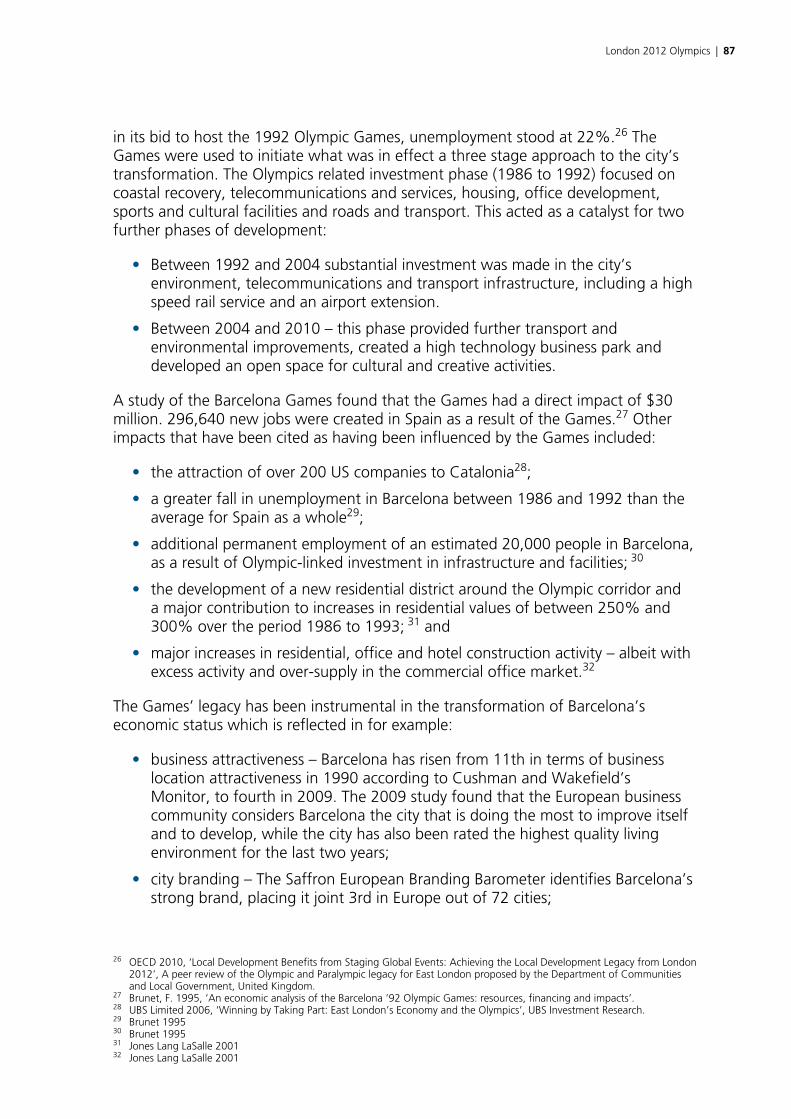
London 2012 Olympics | 87
in its bid to host the 1992 Olympic Games, unemployment stood at 22%.26 The Games were used to initiate what was in effect a three stage approach to the city’s transformation. The Olympics related investment phase (1986 to 1992) focused on coastal recovery, telecommunications and services, housing, office development, sports and cultural facilities and roads and transport. This acted as a catalyst for two further phases of development:
• Between 1992 and 2004 substantial investment was made in the city’s environment, telecommunications and transport infrastructure, including a high speed rail service and an airport extension.
• Between 2004 and 2010 – this phase provided further transport and environmental improvements, created a high technology business park and developed an open space for cultural and creative activities.
A study of the Barcelona Games found that the Games had a direct impact of $30 million. 296,640 new jobs were created in Spain as a result of the Games.27 Other impacts that have been cited as having been influenced by the Games included:
• the attraction of over 200 US companies to Catalonia28;
• a greater fall in unemployment in Barcelona between 1986 and 1992 than the average for Spain as a whole29;
• additional permanent employment of an estimated 20,000 people in Barcelona, as a result of Olympic-linked investment in infrastructure and facilities; 30
• the development of a new residential district around the Olympic corridor and a major contribution to increases in residential values of between 250% and 300% over the period 1986 to 1993; 31 and
• major increases in residential, office and hotel construction activity – albeit with excess activity and over-supply in the commercial office market.32
The Games’ legacy has been instrumental in the transformation of Barcelona’s economic status which is reflected in for example:
• business attractiveness – Barcelona has risen from 11th in terms of business location attractiveness in 1990 according to Cushman and Wakefield’s Monitor, to fourth in 2009. The 2009 study found that the European business community considers Barcelona the city that is doing the most to improve itself and to develop, while the city has also been rated the highest quality living environment for the last two years;
• city branding – The Saffron European Branding Barometer identifies Barcelona’s strong brand, placing it joint 3rd in Europe out of 72 cities;
26 OECD 2010, ‘Local Development Benefits from Staging Global Events: Achieving the Local Development Legacy from London 2012’, A peer review of the Olympic and Paralympic legacy for East London proposed by the Department of Communities and Local Government, United Kingdom.
27 Brunet, F. 1995, ‘An economic analysis of the Barcelona ’92 Olympic Games: resources, financing and impacts’.28 UBS Limited 2006, ‘Winning by Taking Part: East London’s Economy and the Olympics’, UBS Investment Research. 29 Brunet 199530 Brunet 199531 Jones Lang LaSalle 2001 32 Jones Lang LaSalle 2001
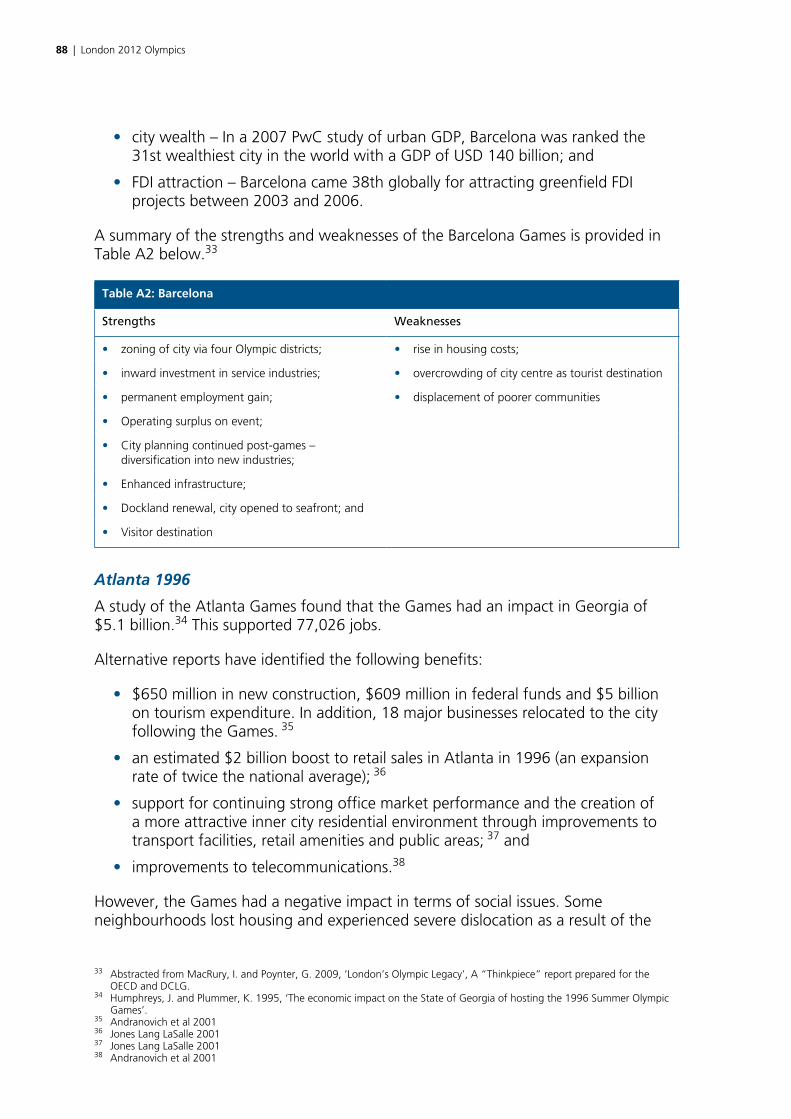
88 | London 2012 Olympics
• city wealth – In a 2007 PwC study of urban GDP, Barcelona was ranked the 31st wealthiest city in the world with a GDP of USD 140 billion; and
• FDI attraction – Barcelona came 38th globally for attracting greenfield FDI projects between 2003 and 2006.
A summary of the strengths and weaknesses of the Barcelona Games is provided in Table A2 below.33
Table A2: Barcelona
Strengths Weaknesses
• zoning of city via four Olympic districts; • rise in housing costs;
• inward investment in service industries; • overcrowding of city centre as tourist destination
• permanent employment gain; • displacement of poorer communities
• Operating surplus on event;
• City planning continued post-games – diversification into new industries;
• Enhanced infrastructure;
• Dockland renewal, city opened to seafront; and
• Visitor destination
Atlanta 1996
A study of the Atlanta Games found that the Games had an impact in Georgia of $5.1 billion.34 This supported 77,026 jobs.
Alternative reports have identified the following benefits:
• $650 million in new construction, $609 million in federal funds and $5 billion on tourism expenditure. In addition, 18 major businesses relocated to the city following the Games. 35
• an estimated $2 billion boost to retail sales in Atlanta in 1996 (an expansion rate of twice the national average); 36
• support for continuing strong office market performance and the creation of a more attractive inner city residential environment through improvements to transport facilities, retail amenities and public areas; 37 and
• improvements to telecommunications.38
However, the Games had a negative impact in terms of social issues. Some neighbourhoods lost housing and experienced severe dislocation as a result of the
33 Abstracted from MacRury, I. and Poynter, G. 2009, ‘London’s Olympic Legacy’, A “Thinkpiece” report prepared for the OECD and DCLG.
34 Humphreys, J. and Plummer, K. 1995, ‘The economic impact on the State of Georgia of hosting the 1996 Summer Olympic Games’.
35 Andranovich et al 200136 Jones Lang LaSalle 200137 Jones Lang LaSalle 200138 Andranovich et al 2001
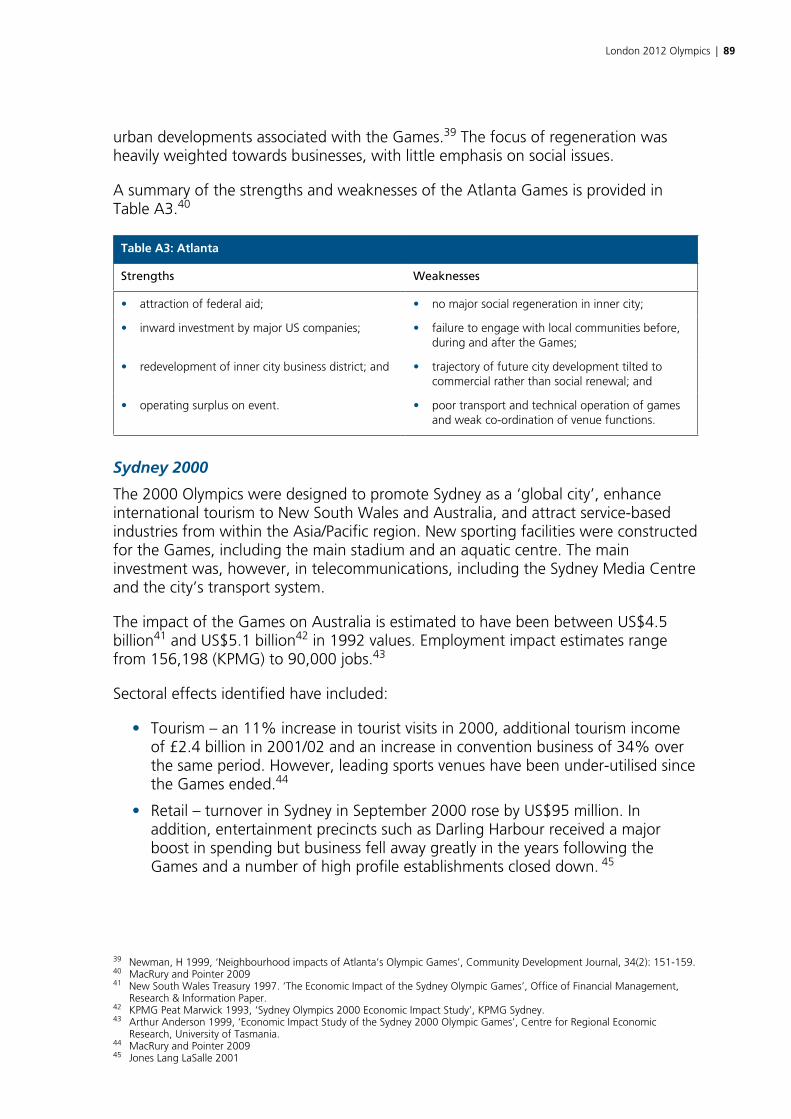
London 2012 Olympics | 89
urban developments associated with the Games.39 The focus of regeneration was heavily weighted towards businesses, with little emphasis on social issues.
A summary of the strengths and weaknesses of the Atlanta Games is provided in Table A3.40
Table A3: Atlanta
Strengths Weaknesses
• attraction of federal aid; • no major social regeneration in inner city;
• inward investment by major US companies; • failure to engage with local communities before, during and after the Games;
• redevelopment of inner city business district; and • trajectory of future city development tilted to commercial rather than social renewal; and
• operating surplus on event. • poor transport and technical operation of games and weak co-ordination of venue functions.
Sydney 2000
The 2000 Olympics were designed to promote Sydney as a ‘global city’, enhance international tourism to New South Wales and Australia, and attract service-based industries from within the Asia/Pacific region. New sporting facilities were constructed for the Games, including the main stadium and an aquatic centre. The main investment was, however, in telecommunications, including the Sydney Media Centre and the city’s transport system.
The impact of the Games on Australia is estimated to have been between US$4.5 billion41 and US$5.1 billion42 in 1992 values. Employment impact estimates range from 156,198 (KPMG) to 90,000 jobs.43
Sectoral effects identified have included:
• Tourism – an 11% increase in tourist visits in 2000, additional tourism income of £2.4 billion in 2001/02 and an increase in convention business of 34% over the same period. However, leading sports venues have been under-utilised since the Games ended.44
• Retail – turnover in Sydney in September 2000 rose by US$95 million. In addition, entertainment precincts such as Darling Harbour received a major boost in spending but business fell away greatly in the years following the Games and a number of high profile establishments closed down. 45
39 Newman, H 1999, ‘Neighbourhood impacts of Atlanta’s Olympic Games’, Community Development Journal, 34(2): 151-159.40 MacRury and Pointer 200941 New South Wales Treasury 1997. ‘The Economic Impact of the Sydney Olympic Games’, Office of Financial Management,
Research & Information Paper.42 KPMG Peat Marwick 1993, ‘Sydney Olympics 2000 Economic Impact Study’, KPMG Sydney.43 Arthur Anderson 1999, ‘Economic Impact Study of the Sydney 2000 Olympic Games’, Centre for Regional Economic
Research, University of Tasmania.44 MacRury and Pointer 200945 Jones Lang LaSalle 2001
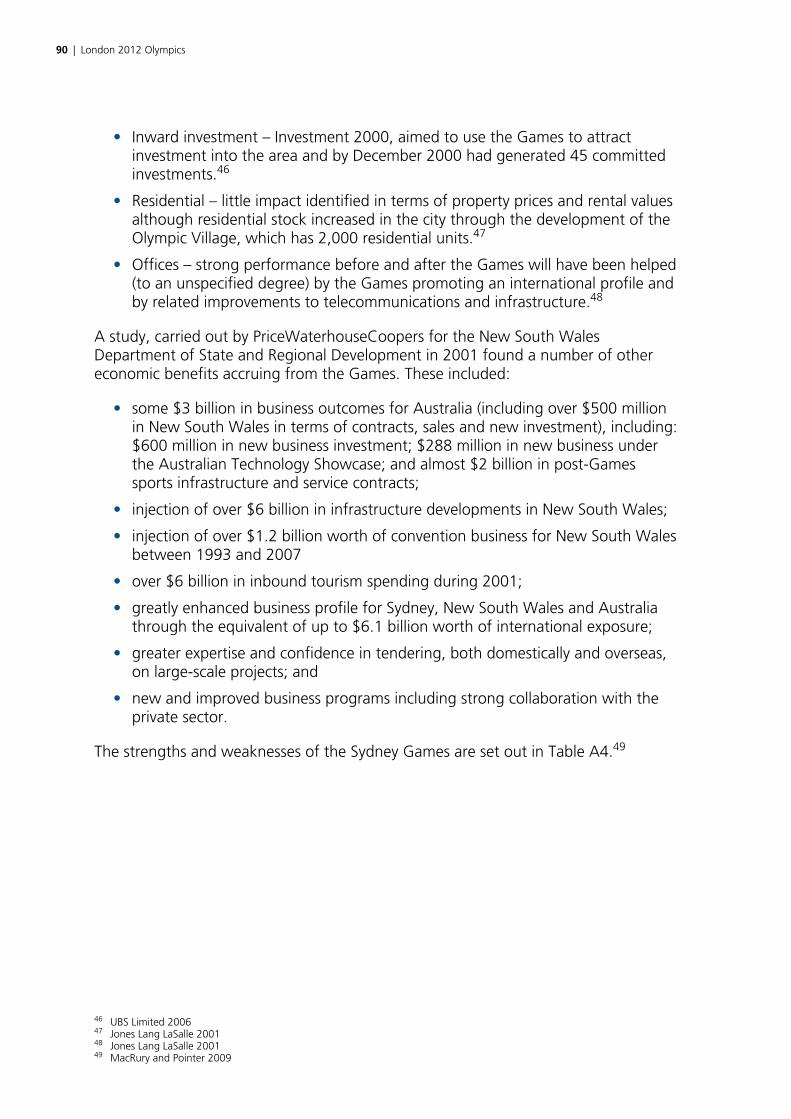
90 | London 2012 Olympics
• Inward investment – Investment 2000, aimed to use the Games to attract investment into the area and by December 2000 had generated 45 committed investments.46
• Residential – little impact identified in terms of property prices and rental values although residential stock increased in the city through the development of the Olympic Village, which has 2,000 residential units.47
• Offices – strong performance before and after the Games will have been helped (to an unspecified degree) by the Games promoting an international profile and by related improvements to telecommunications and infrastructure.48
A study, carried out by PriceWaterhouseCoopers for the New South Wales Department of State and Regional Development in 2001 found a number of other economic benefits accruing from the Games. These included:
• some $3 billion in business outcomes for Australia (including over $500 million in New South Wales in terms of contracts, sales and new investment), including: $600 million in new business investment; $288 million in new business under the Australian Technology Showcase; and almost $2 billion in post-Games sports infrastructure and service contracts;
• injection of over $6 billion in infrastructure developments in New South Wales;
• injection of over $1.2 billion worth of convention business for New South Wales between 1993 and 2007
• over $6 billion in inbound tourism spending during 2001;
• greatly enhanced business profile for Sydney, New South Wales and Australia through the equivalent of up to $6.1 billion worth of international exposure;
• greater expertise and confidence in tendering, both domestically and overseas, on large-scale projects; and
• new and improved business programs including strong collaboration with the private sector.
The strengths and weaknesses of the Sydney Games are set out in Table A4.49
46 UBS Limited 200647 Jones Lang LaSalle 200148 Jones Lang LaSalle 200149 MacRury and Pointer 2009
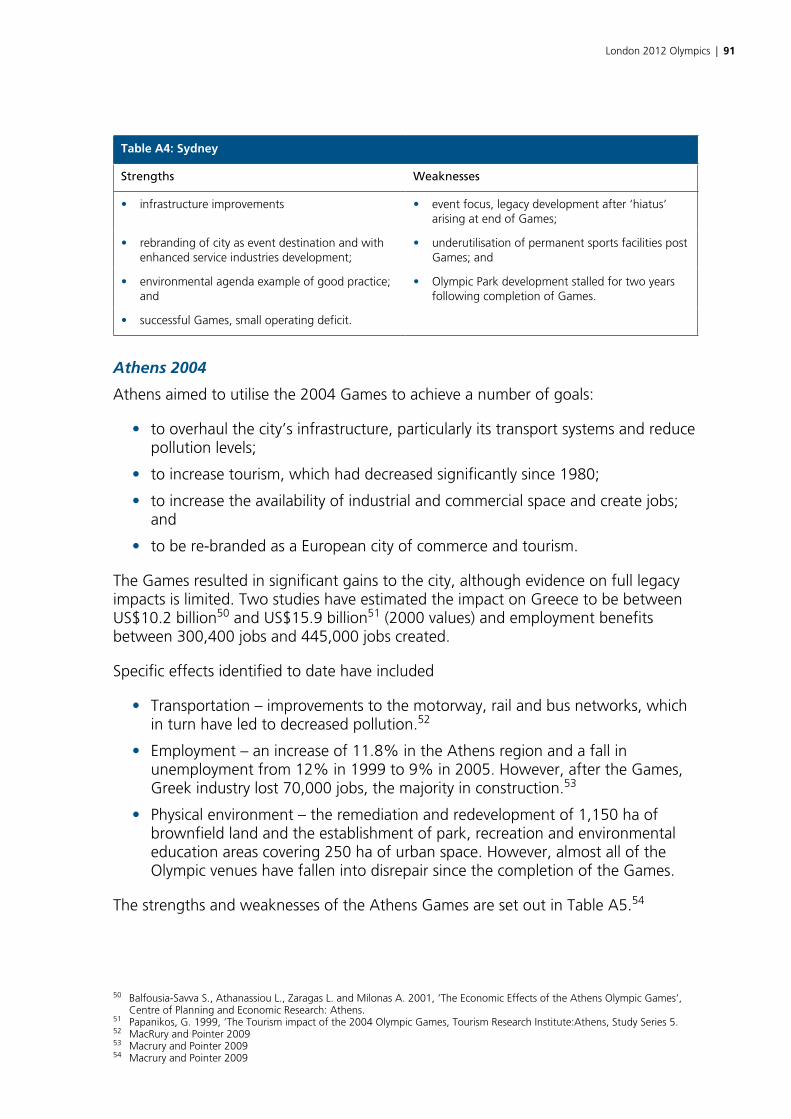
London 2012 Olympics | 91
Table A4: Sydney
Strengths Weaknesses
• infrastructure improvements • event focus, legacy development after ‘hiatus’ arising at end of Games;
• rebranding of city as event destination and with enhanced service industries development;
• underutilisation of permanent sports facilities post Games; and
• environmental agenda example of good practice; and
• Olympic Park development stalled for two years following completion of Games.
• successful Games, small operating deficit.
Athens 2004
Athens aimed to utilise the 2004 Games to achieve a number of goals:
• to overhaul the city’s infrastructure, particularly its transport systems and reduce pollution levels;
• to increase tourism, which had decreased significantly since 1980;
• to increase the availability of industrial and commercial space and create jobs; and
• to be re-branded as a European city of commerce and tourism.
The Games resulted in significant gains to the city, although evidence on full legacy impacts is limited. Two studies have estimated the impact on Greece to be between US$10.2 billion50 and US$15.9 billion51 (2000 values) and employment benefits between 300,400 jobs and 445,000 jobs created.
Specific effects identified to date have included
• Transportation – improvements to the motorway, rail and bus networks, which in turn have led to decreased pollution.52
• Employment – an increase of 11.8% in the Athens region and a fall in unemployment from 12% in 1999 to 9% in 2005. However, after the Games, Greek industry lost 70,000 jobs, the majority in construction.53
• Physical environment – the remediation and redevelopment of 1,150 ha of brownfield land and the establishment of park, recreation and environmental education areas covering 250 ha of urban space. However, almost all of the Olympic venues have fallen into disrepair since the completion of the Games.
The strengths and weaknesses of the Athens Games are set out in Table A5.54
50 Balfousia-Savva S., Athanassiou L., Zaragas L. and Milonas A. 2001, ‘The Economic Effects of the Athens Olympic Games’, Centre of Planning and Economic Research: Athens.
51 Papanikos, G. 1999, ‘The Tourism impact of the 2004 Olympic Games, Tourism Research Institute:Athens, Study Series 5.52 MacRury and Pointer 200953 Macrury and Pointer 200954 Macrury and Pointer 2009
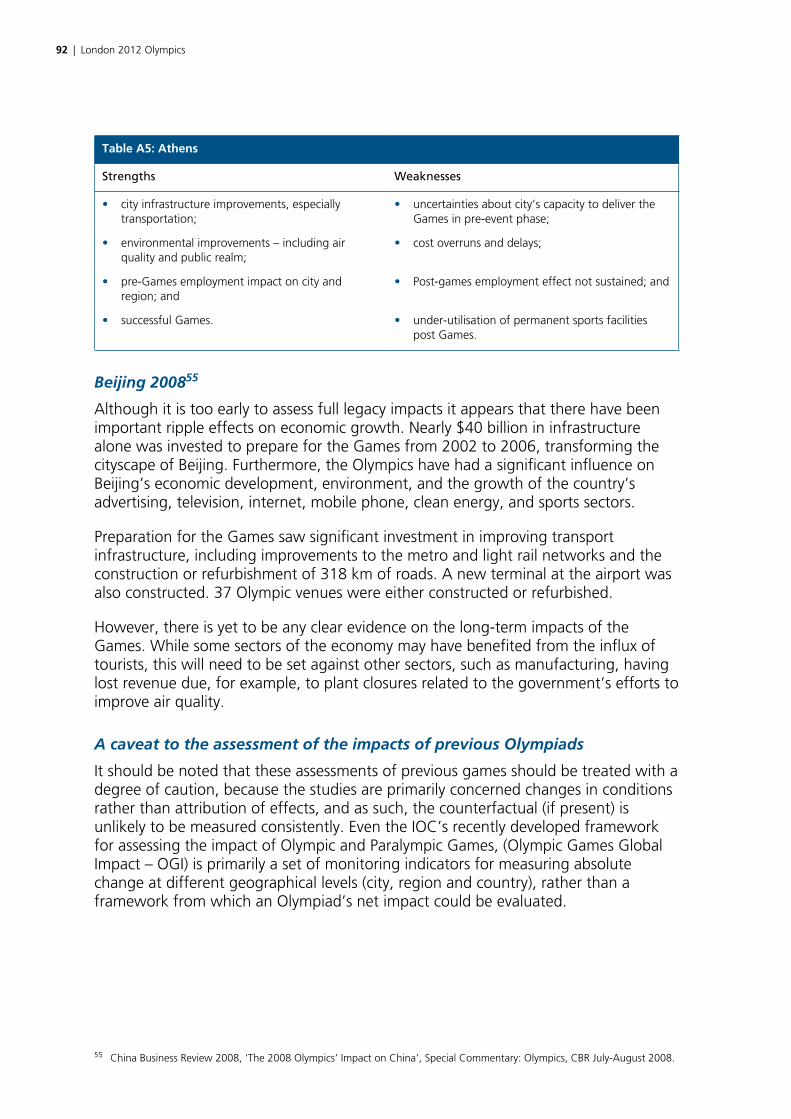
92 | London 2012 Olympics
Table A5: Athens
Strengths Weaknesses
• city infrastructure improvements, especially transportation;
• uncertainties about city’s capacity to deliver the Games in pre-event phase;
• environmental improvements – including air quality and public realm;
• cost overruns and delays;
• pre-Games employment impact on city and region; and
• Post-games employment effect not sustained; and
• successful Games. • under-utilisation of permanent sports facilities post Games.
Beijing 200855
Although it is too early to assess full legacy impacts it appears that there have been important ripple effects on economic growth. Nearly $40 billion in infrastructure alone was invested to prepare for the Games from 2002 to 2006, transforming the cityscape of Beijing. Furthermore, the Olympics have had a significant influence on Beijing’s economic development, environment, and the growth of the country’s advertising, television, internet, mobile phone, clean energy, and sports sectors.
Preparation for the Games saw significant investment in improving transport infrastructure, including improvements to the metro and light rail networks and the construction or refurbishment of 318 km of roads. A new terminal at the airport was also constructed. 37 Olympic venues were either constructed or refurbished.
However, there is yet to be any clear evidence on the long-term impacts of the Games. While some sectors of the economy may have benefited from the influx of tourists, this will need to be set against other sectors, such as manufacturing, having lost revenue due, for example, to plant closures related to the government’s efforts to improve air quality.
A caveat to the assessment of the impacts of previous Olympiads
It should be noted that these assessments of previous games should be treated with a degree of caution, because the studies are primarily concerned changes in conditions rather than attribution of effects, and as such, the counterfactual (if present) is unlikely to be measured consistently. Even the IOC’s recently developed framework for assessing the impact of Olympic and Paralympic Games, (Olympic Games Global Impact – OGI) is primarily a set of monitoring indicators for measuring absolute change at different geographical levels (city, region and country), rather than a framework from which an Olympiad’s net impact could be evaluated.
55 China Business Review 2008, ‘The 2008 Olympics’ Impact on China’, Special Commentary: Olympics, CBR July-August 2008.

London 2012 Olympics | 93
Appendix B: Baseline and trend analysis
1. Introduction
This Appendix sets out baseline information and data on changes to date in conditions that may be influenced by the Games. It has been structured according to the four main areas of potential impact as follows:
• Place and environment;
• Economy and skills;
• Social and community; and
• Sport and health.
In each case, data is presented for the main areas of outcome and impact that are identified in the logic chains (see Section 3 of the main Evaluation Framework report). The baseline year for the analysis has been selected as 2003 (the year in which London’s Olympic Games bid was submitted). It should be noted that the indicator set is not an exhaustive list of potential 2012 impacts, but reflects the Department’s policy remit, and feeds into DCMS’s London 2012 meta evaluation. The IOC also requires the host city to collect data on its global impact indicators.
Inevitably a number of gaps in the data have been identified, which will need to be addressed during the Olympic Regeneration Legacy Evaluation. These gaps relate in particular to:
• the availability of data at a sufficiently fine-grained geographic level;
• the timeframe over which data is available, for example, a lack of data to enable comparison of pre- and post-bid trends and conditions; and, especially
• survey and other data on ‘softer’ areas of impact, such as levels of resident satisfaction and perceptions.
The data is analysed at several geographic levels, primarily focused on the major areas of regeneration legacy impact within East London, but using wider areas (London and England) as benchmark comparators.
As part of this assignment, a website-based application and resource has been developed to provide a database and analytical tool for assessing impact. This currently comprises a number of core analyses, which provide the basis for the remainder of this Appendix. They include the following:
• comparing current values in the area of impact, the London 2012 Host Boroughs and the Thames Gateway with London and England;

94 | London 2012 Olympics
• comparison of changes to date within the various areas;
• tracking indexed rates of change in the areas;
• assessing the extent of divergence in conditions within the London 2012 Host Boroughs;
• assessing the divergence in growth rates between areas within the London 2012 Host Boroughs
• tracking the trend in the gap between the London 2012 Host Boroughs and London; and
• comparing the compound annual growth rate before and after the baseline (bid) year.
It needs to be stressed that the data describes change within the areas and should not necessarily be taken in isolation as an indicator of the impact of the Games. The main Evaluation Framework report identifies a range of econometric and other techniques that will need to be applied to identify the specific impact of the Games.
2. Place and Environment
2.1 Overview
The logic chain in Figure B2.1 identifies the principal measures of outcomes and impacts for which data is currently available related to ‘place and environment’ that have been analysed as part of this Appendix. Further, more detailed information is available within the database.
Figure B2.1: Logic chain identifying the principal measures of outcomes and impacts
• Lack of a coherent and uniform high quality environment• Excellent eternal connectivity but limited internal connectivity within the 5 boroughs area.• Need for affordable quality housing• High levels of area deprivation and spatial inequality
Contextualconditions
Policycontext
Inputs Activities
• Legacy Action Plan• SRF for Olympic Park and Lower Lea• Local Developoment Frameworks• 2012 Sustainability Plan• London Plan
• Financial resources – public and private• Human resources – promoters and other partners• Co-ordination – of public and private inputs• Partnerships and engagement
• Deprivation levels• Population• Population density• Neighbourhood role• House prices• House affordability• Commercial property values
• Vacant/derelict previously developed land• Average PTAL• Total dwellings (by tenure)• Vacant dwellings• Greenspace per resident• Accessibility• Quality of place
• Staging of the Games• Related community events• Post-Games use of facilities• Site preparation and servicing• Public realm improvements• Transportation improvements
• Additional homes provided (by tenure)• New/improved transport infrastructure• Land developed• Industrial/commercial property improved• Industrial/commercial property let/ sold• Environemntal impacts of new developments• Amenities and facilities
Area conditions in terms of:• Waste produced and recycled• Air quality• Water quality• Biodiversity• Light and noise levels• CO2 and greenhouse gas• Energy efficiency
Outputs
Outcomes
Impacts
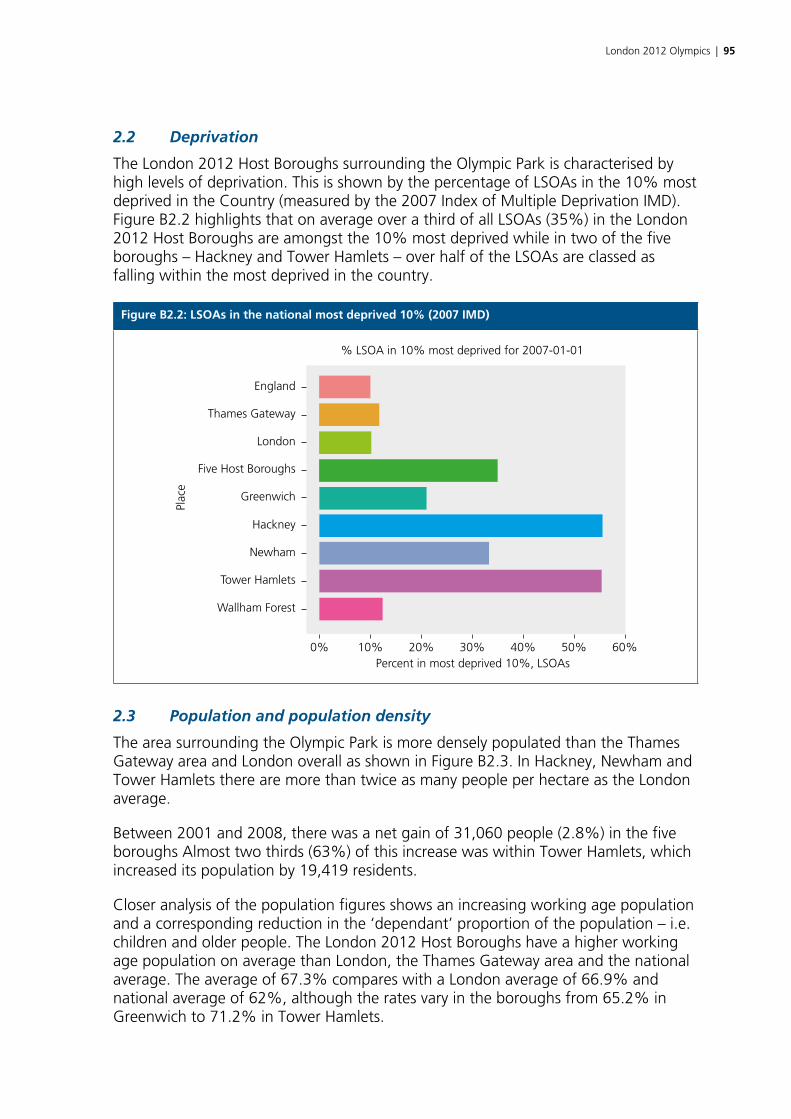
London 2012 Olympics | 95
2.2 Deprivation
The London 2012 Host Boroughs surrounding the Olympic Park is characterised by high levels of deprivation. This is shown by the percentage of LSOAs in the 10% most deprived in the Country (measured by the 2007 Index of Multiple Deprivation IMD). Figure B2.2 highlights that on average over a third of all LSOAs (35%) in the London 2012 Host Boroughs are amongst the 10% most deprived while in two of the five boroughs – Hackney and Tower Hamlets – over half of the LSOAs are classed as falling within the most deprived in the country.
Figure B2.2: LSOAs in the national most deprived 10% (2007 IMD)
England
Thames Gateway
London
Five Host Boroughs
Greenwich
Hackney
Newham
Tower Hamlets
Wallham Forest
0% 10% 20% 30% 40% 50% 60%Percent in most deprived 10%, LSOAs
Plac
e
% LSOA in 10% most deprived for 2007-01-01
2.3 Population and population density
The area surrounding the Olympic Park is more densely populated than the Thames Gateway area and London overall as shown in Figure B2.3. In Hackney, Newham and Tower Hamlets there are more than twice as many people per hectare as the London average.
Between 2001 and 2008, there was a net gain of 31,060 people (2.8%) in the five boroughs Almost two thirds (63%) of this increase was within Tower Hamlets, which increased its population by 19,419 residents.
Closer analysis of the population figures shows an increasing working age population and a corresponding reduction in the ‘dependant’ proportion of the population – i.e. children and older people. The London 2012 Host Boroughs have a higher working age population on average than London, the Thames Gateway area and the national average. The average of 67.3% compares with a London average of 66.9% and national average of 62%, although the rates vary in the boroughs from 65.2% in Greenwich to 71.2% in Tower Hamlets.
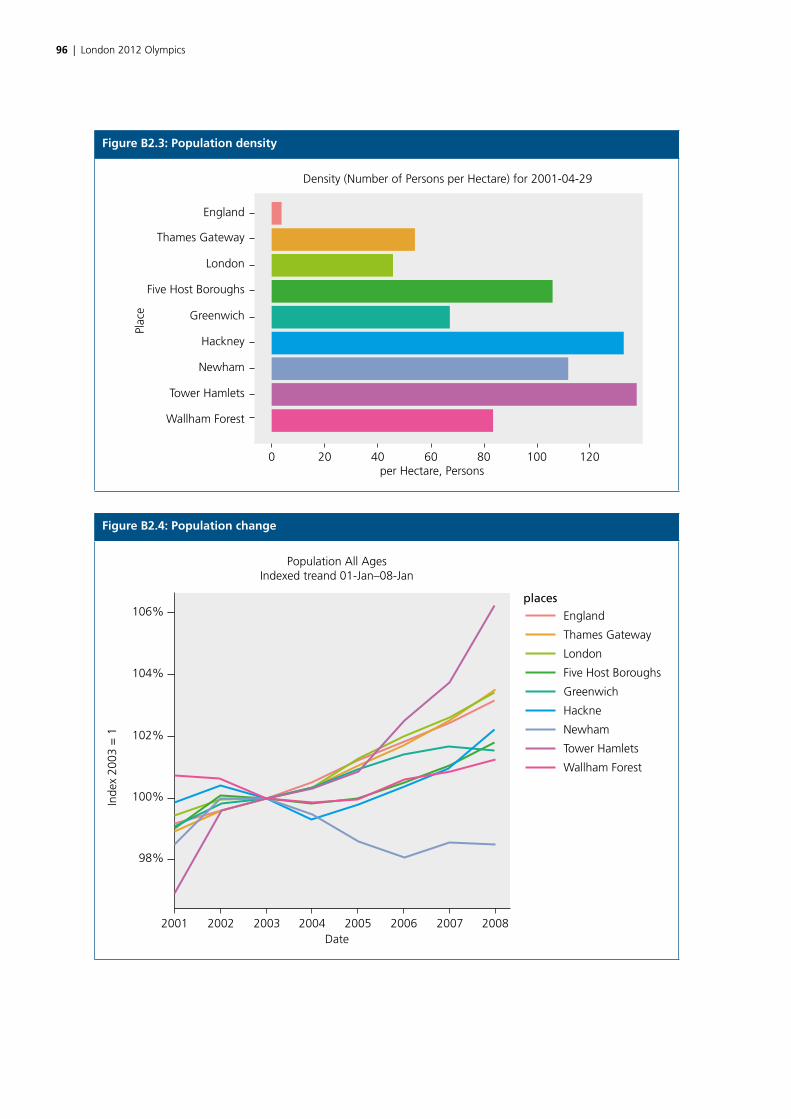
96 | London 2012 Olympics
Figure B2.3: Population density
England
Thames Gateway
London
Five Host Boroughs
Greenwich
Hackney
Newham
Tower Hamlets
Wallham Forest
0 20 40 60 80 100 120
Plac
e
Density (Number of Persons per Hectare) for 2001-04-29
per Hectare, Persons
Figure B2.4: Population change
106%
104%
102%
100%
98%
Inde
x 20
03 =
1
2001 2002 2003 2004Date
2005 2006 2007 2008
Population All AgesIndexed treand 01-Jan–08-Jan
placesEngland
Thames Gateway
London
Five Host Boroughs
Greenwich
Hackne
Newham
Tower Hamlets
Wallham Forest
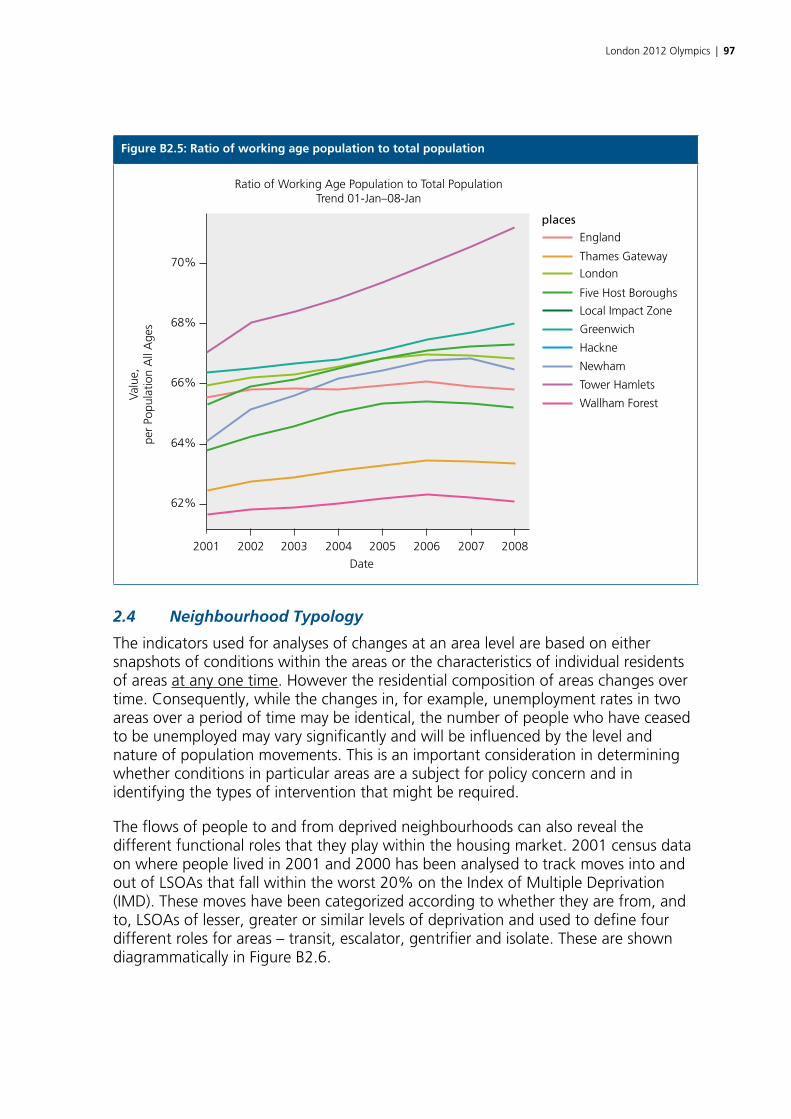
London 2012 Olympics | 97
Figure B2.5: Ratio of working age population to total population
placesEngland
Thames GatewayLondon
Local Impact Zone
Five Host Boroughs
Greenwich
Hackne
Newham
Tower Hamlets
Wallham Forest
70%
Ratio of Working Age Population to Total PopulationTrend 01-Jan–08-Jan
68%
66%
64%
62%
2001 2002 2003 2004
Date
2005 2006 2007 2008
Valu
e,pe
r Po
pula
tion
All
Age
s
2.4 Neighbourhood Typology
The indicators used for analyses of changes at an area level are based on either snapshots of conditions within the areas or the characteristics of individual residents of areas at any one time. However the residential composition of areas changes over time. Consequently, while the changes in, for example, unemployment rates in two areas over a period of time may be identical, the number of people who have ceased to be unemployed may vary significantly and will be influenced by the level and nature of population movements. This is an important consideration in determining whether conditions in particular areas are a subject for policy concern and in identifying the types of intervention that might be required.
The flows of people to and from deprived neighbourhoods can also reveal the different functional roles that they play within the housing market. 2001 census data on where people lived in 2001 and 2000 has been analysed to track moves into and out of LSOAs that fall within the worst 20% on the Index of Multiple Deprivation (IMD). These moves have been categorized according to whether they are from, and to, LSOAs of lesser, greater or similar levels of deprivation and used to define four different roles for areas – transit, escalator, gentrifier and isolate. These are shown diagrammatically in Figure B2.6.
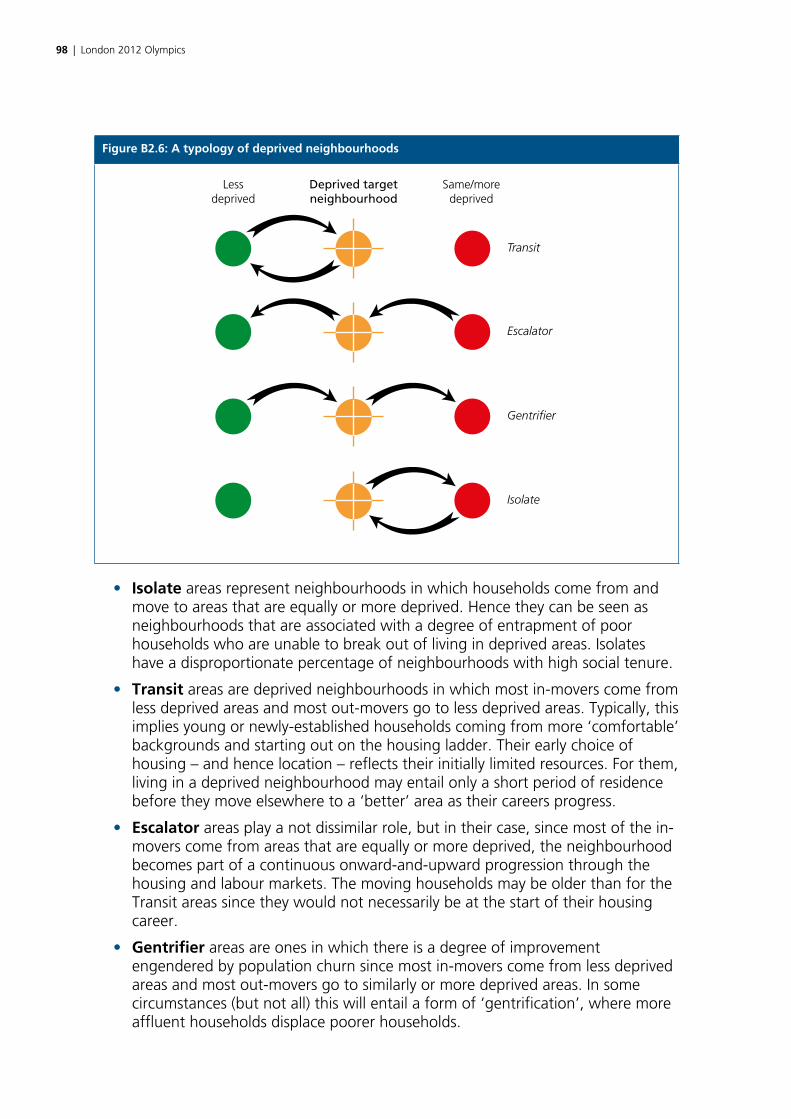
98 | London 2012 Olympics
Figure B2.6: A typology of deprived neighbourhoods
Gentrifier
Escalator
Transit
Isolate
Lessdeprived
Same/moredeprived
Deprived targetneighbourhood
• Isolate areas represent neighbourhoods in which households come from and move to areas that are equally or more deprived. Hence they can be seen as neighbourhoods that are associated with a degree of entrapment of poor households who are unable to break out of living in deprived areas. Isolates have a disproportionate percentage of neighbourhoods with high social tenure.
• Transit areas are deprived neighbourhoods in which most in-movers come from less deprived areas and most out-movers go to less deprived areas. Typically, this implies young or newly-established households coming from more ‘comfortable’ backgrounds and starting out on the housing ladder. Their early choice of housing – and hence location – reflects their initially limited resources. For them, living in a deprived neighbourhood may entail only a short period of residence before they move elsewhere to a ‘better’ area as their careers progress.
• Escalator areas play a not dissimilar role, but in their case, since most of the in-movers come from areas that are equally or more deprived, the neighbourhood becomes part of a continuous onward-and-upward progression through the housing and labour markets. The moving households may be older than for the Transit areas since they would not necessarily be at the start of their housing career.
• Gentrifier areas are ones in which there is a degree of improvement engendered by population churn since most in-movers come from less deprived areas and most out-movers go to similarly or more deprived areas. In some circumstances (but not all) this will entail a form of ‘gentrification’, where more affluent households displace poorer households.
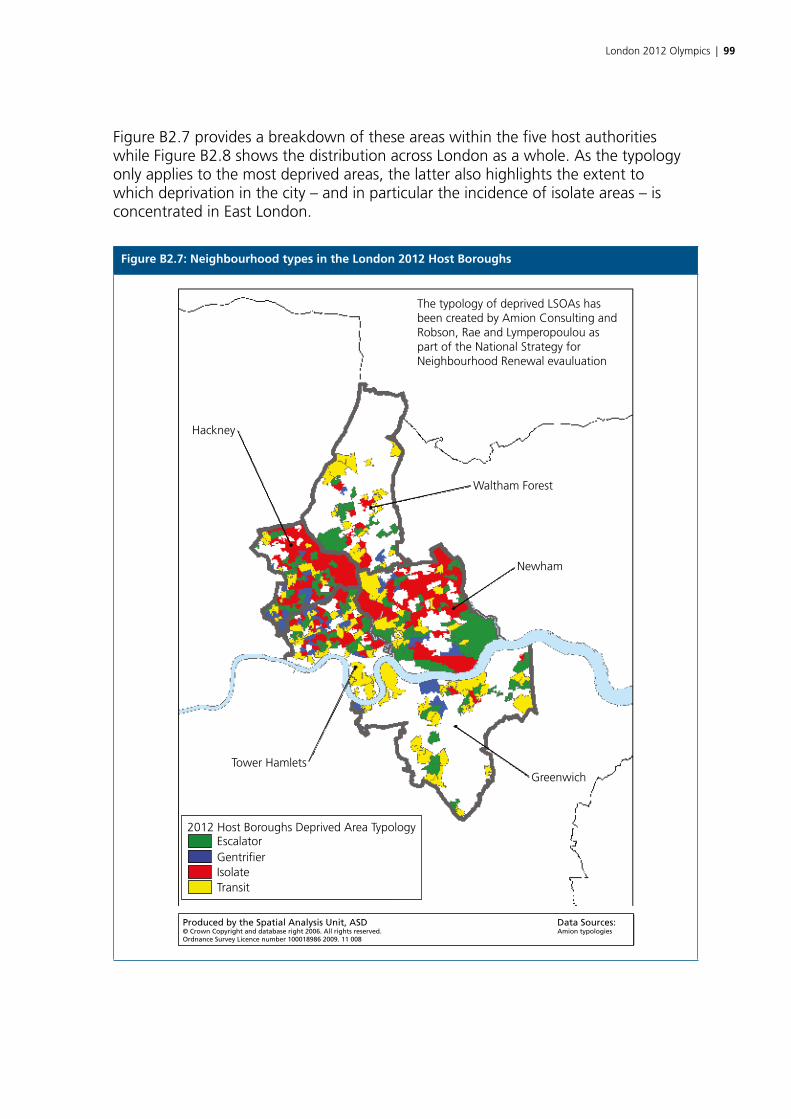
London 2012 Olympics | 99
Figure B2.7 provides a breakdown of these areas within the five host authorities while Figure B2.8 shows the distribution across London as a whole. As the typology only applies to the most deprived areas, the latter also highlights the extent to which deprivation in the city – and in particular the incidence of isolate areas – is concentrated in East London.
Figure B2.7: Neighbourhood types in the London 2012 Host Boroughs
Escalator2012 Host Boroughs Deprived Area Typology
GentrifierIsolateTransit
Hackney
Waltham Forest
Newham
GreenwichTower Hamlets
Produced by the Spatial Analysis Unit, ASD© Crown Copyright and database right 2006. All rights reserved.Ordnance Survey Licence number 100018986 2009. 11 008
Data Sources:Amion typologies
The typology of deprived LSOAs hasbeen created by Amion Consulting andRobson, Rae and Lymperopoulou aspart of the National Strategy for Neighbourhood Renewal evauluation
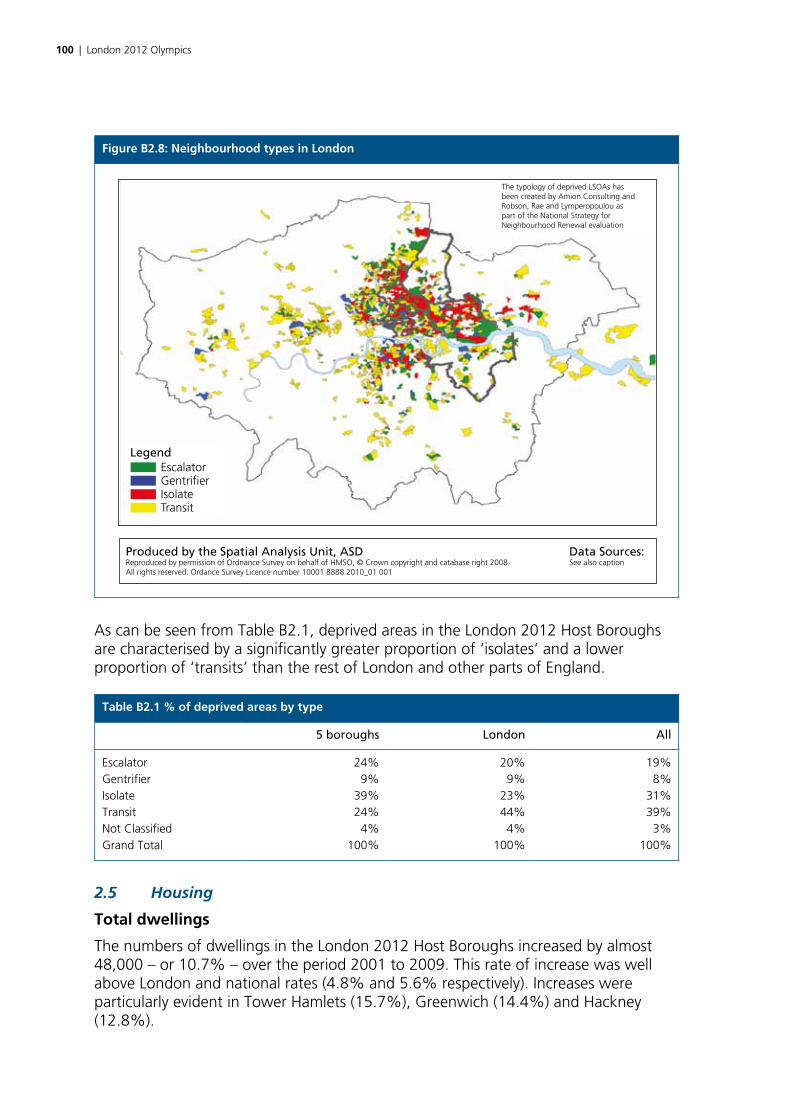
100 | London 2012 Olympics
Figure B2.8: Neighbourhood types in London
EscalatorLegend
GentrifierIsolateTransit
The typology of deprived LSOAs hasbeen created by Amion Consulting andRobson, Rae and Lymperopoulou aspart of the National Strategy forNeighbourhood Renewal evaluation
Produced by the Spatial Analysis Unit, ASDReproduced by permission of Ordnance Survey on behalf of HMSO, © Crown copyright and catabase right 2008.All rights reserved. Ordance Survey Licence number 10001 8888 2010_01 001
Data Sources:See also caption
As can be seen from Table B2.1, deprived areas in the London 2012 Host Boroughs are characterised by a significantly greater proportion of ‘isolates’ and a lower proportion of ‘transits’ than the rest of London and other parts of England.
Table B2.1 % of deprived areas by type
5 boroughs London All
Escalator 24% 20% 19%Gentrifier 9% 9% 8%Isolate 39% 23% 31%Transit 24% 44% 39%Not Classified 4% 4% 3%Grand Total 100% 100% 100%
2.5 Housing
Total dwellings
The numbers of dwellings in the London 2012 Host Boroughs increased by almost 48,000 – or 10.7% – over the period 2001 to 2009. This rate of increase was well above London and national rates (4.8% and 5.6% respectively). Increases were particularly evident in Tower Hamlets (15.7%), Greenwich (14.4%) and Hackney (12.8%).
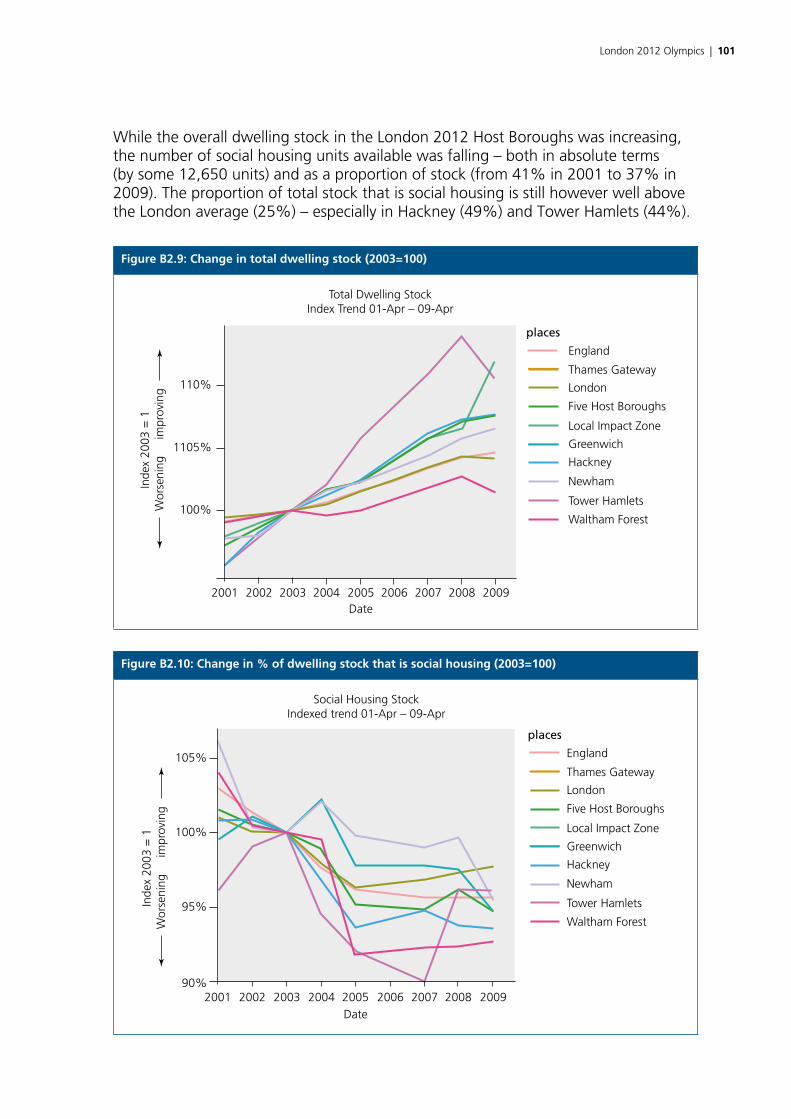
London 2012 Olympics | 101
While the overall dwelling stock in the London 2012 Host Boroughs was increasing, the number of social housing units available was falling – both in absolute terms (by some 12,650 units) and as a proportion of stock (from 41% in 2001 to 37% in 2009). The proportion of total stock that is social housing is still however well above the London average (25%) – especially in Hackney (49%) and Tower Hamlets (44%).
Figure B2.9: Change in total dwelling stock (2003=100)
places
England
Thames Gateway
London
Five Host Boroughs
Local Impact Zone
Greenwich
Hackney
Newham
Tower Hamlets
Waltham Forest
110%
1105%
100%
Inde
x 20
03 =
1W
orse
ning
i
mpr
ovin
g
2001 2002 2003 2004 2005Date
2006 2007 2008 2009
Total Dwelling StockIndex Trend 01-Apr – 09-Apr
Figure B2.10: Change in % of dwelling stock that is social housing (2003=100)
places
England
Thames Gateway
London
Five Host Boroughs
Local Impact Zone
Greenwich
Hackney
Newham
Tower Hamlets
Waltham Forest
105%
100%
95%
90%2001
Inde
x 20
03 =
1W
orse
ning
i
mpr
ovin
g
2002 2003 2004 2005Date
2006 2007 2008 2009
Social Housing StockIndexed trend 01-Apr – 09-Apr
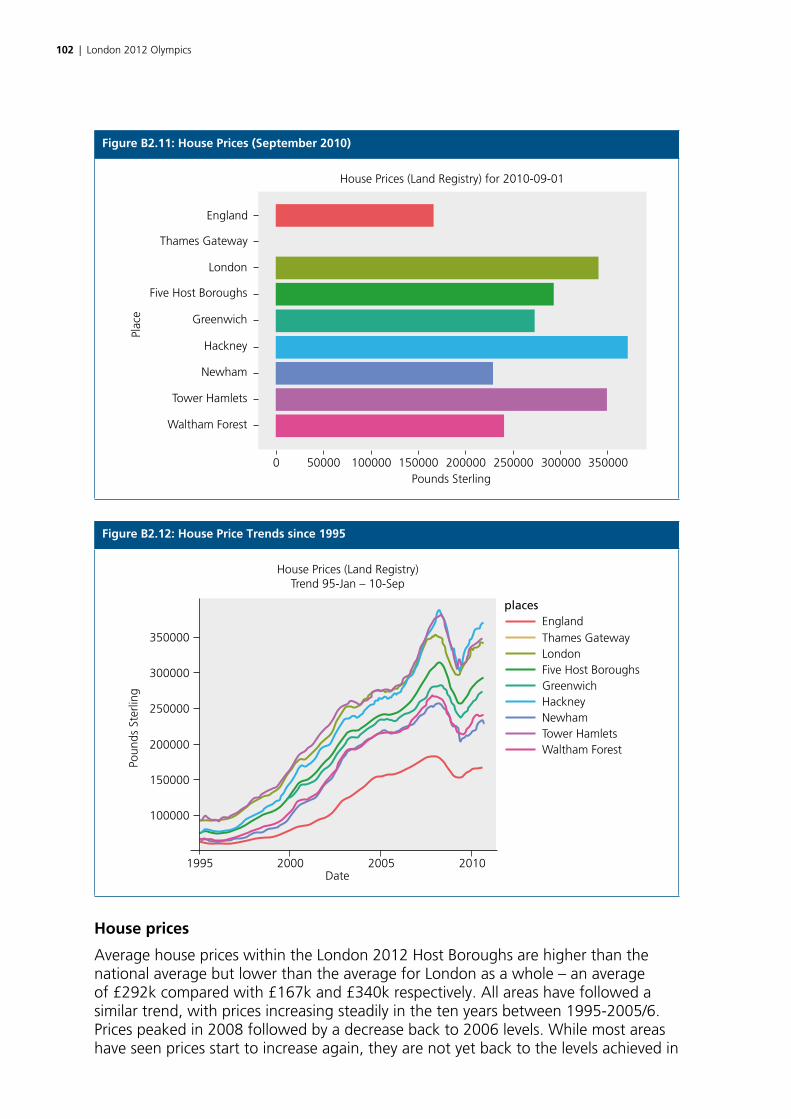
102 | London 2012 Olympics
Figure B2.11: House Prices (September 2010)
Waltham Forest
0
Tower Hamlets
Newham
Hackney
Greenwich
Five Host Boroughs
London
Thames Gateway
England
Plac
e
50000 100000 150000 200000 250000 300000 350000Pounds Sterling
House Prices (Land Registry) for 2010-09-01
Figure B2.12: House Price Trends since 1995
Englandplaces
Thames GatewayLondonFive Host BoroughsGreenwichHackneyNewhamTower HamletsWaltham Forest
350000
300000
250000
200000
150000
100000
1995 2000Date
2005 2010
Poun
ds S
terli
ng
House Prices (Land Registry)Trend 95-Jan – 10-Sep
House prices
Average house prices within the London 2012 Host Boroughs are higher than the national average but lower than the average for London as a whole – an average of £292k compared with £167k and £340k respectively. All areas have followed a similar trend, with prices increasing steadily in the ten years between 1995-2005/6. Prices peaked in 2008 followed by a decrease back to 2006 levels. While most areas have seen prices start to increase again, they are not yet back to the levels achieved in
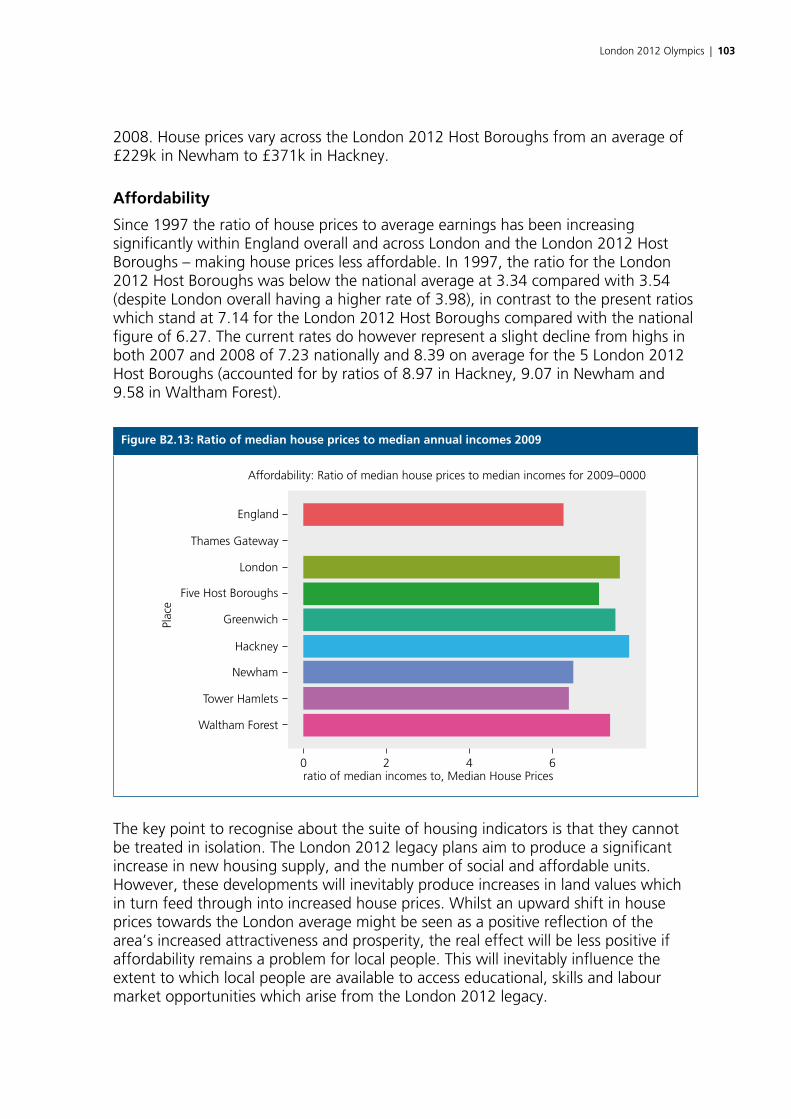
London 2012 Olympics | 103
2008. House prices vary across the London 2012 Host Boroughs from an average of £229k in Newham to £371k in Hackney.
Affordability
Since 1997 the ratio of house prices to average earnings has been increasing significantly within England overall and across London and the London 2012 Host Boroughs – making house prices less affordable. In 1997, the ratio for the London 2012 Host Boroughs was below the national average at 3.34 compared with 3.54 (despite London overall having a higher rate of 3.98), in contrast to the present ratios which stand at 7.14 for the London 2012 Host Boroughs compared with the national figure of 6.27. The current rates do however represent a slight decline from highs in both 2007 and 2008 of 7.23 nationally and 8.39 on average for the 5 London 2012 Host Boroughs (accounted for by ratios of 8.97 in Hackney, 9.07 in Newham and 9.58 in Waltham Forest).
Figure B2.13: Ratio of median house prices to median annual incomes 2009
Waltham Forest
Tower Hamlets
Newham
Hackney
Greenwich
Five Host Boroughs
London
Thames Gateway
England
Plac
e
0 2 4 6ratio of median incomes to, Median House Prices
Affordability: Ratio of median house prices to median incomes for 2009–0000
The key point to recognise about the suite of housing indicators is that they cannot be treated in isolation. The London 2012 legacy plans aim to produce a significant increase in new housing supply, and the number of social and affordable units. However, these developments will inevitably produce increases in land values which in turn feed through into increased house prices. Whilst an upward shift in house prices towards the London average might be seen as a positive reflection of the area’s increased attractiveness and prosperity, the real effect will be less positive if affordability remains a problem for local people. This will inevitably influence the extent to which local people are available to access educational, skills and labour market opportunities which arise from the London 2012 legacy.
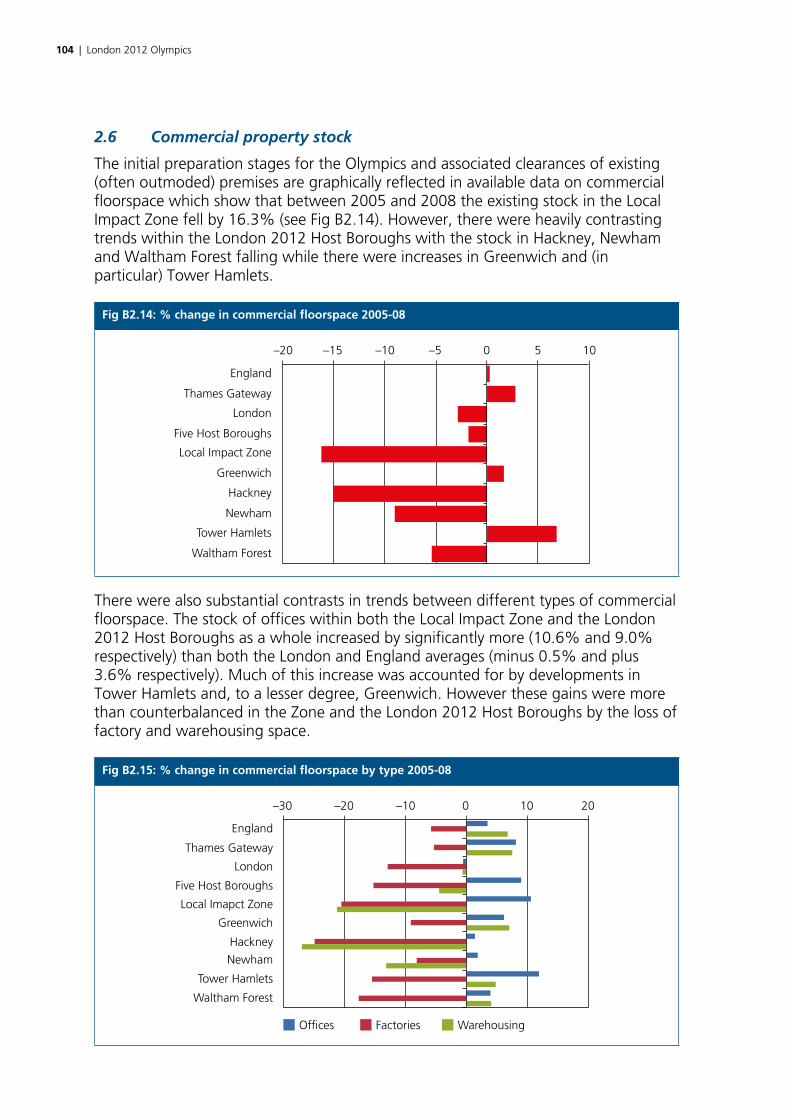
104 | London 2012 Olympics
2.6 Commercial property stock
The initial preparation stages for the Olympics and associated clearances of existing (often outmoded) premises are graphically reflected in available data on commercial floorspace which show that between 2005 and 2008 the existing stock in the Local Impact Zone fell by 16.3% (see Fig B2.14). However, there were heavily contrasting trends within the London 2012 Host Boroughs with the stock in Hackney, Newham and Waltham Forest falling while there were increases in Greenwich and (in particular) Tower Hamlets.
Fig B2.14: % change in commercial floorspace 2005-08
Five Host Boroughs
Local Impact Zone
Greenwich
Hackney
Newham
Tower Hamlets
Waltham Forest
England
–20 –15 –10 –5 0 5 10
Thames Gateway
London
There were also substantial contrasts in trends between different types of commercial floorspace. The stock of offices within both the Local Impact Zone and the London 2012 Host Boroughs as a whole increased by significantly more (10.6% and 9.0% respectively) than both the London and England averages (minus 0.5% and plus 3.6% respectively). Much of this increase was accounted for by developments in Tower Hamlets and, to a lesser degree, Greenwich. However these gains were more than counterbalanced in the Zone and the London 2012 Host Boroughs by the loss of factory and warehousing space.
Fig B2.15: % change in commercial floorspace by type 2005-08
Tower Hamlets
Waltham Forest
Newham
Offices
Hackney
Greenwich
Local Imapct Zone
Five Host Boroughs
London
Thames Gateway
England
Factories Warehousing
–30 –20 –10 0 10 20
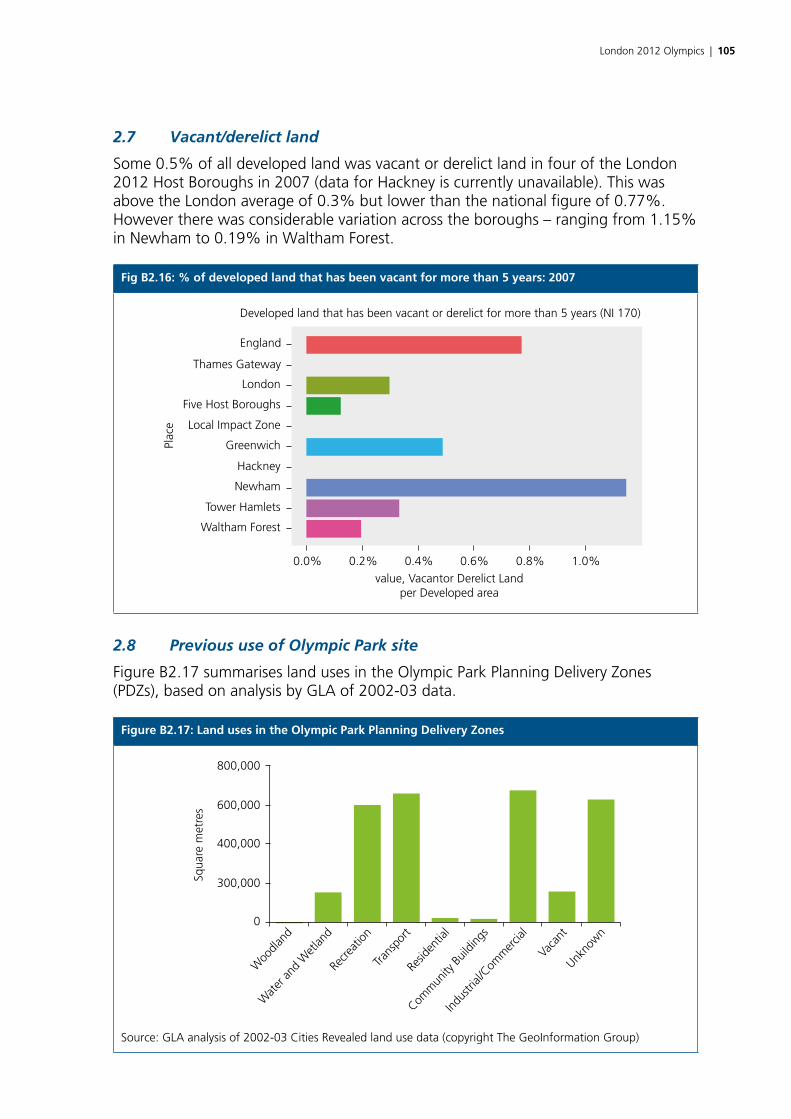
London 2012 Olympics | 105
2.7 Vacant/derelict land
Some 0.5% of all developed land was vacant or derelict land in four of the London 2012 Host Boroughs in 2007 (data for Hackney is currently unavailable). This was above the London average of 0.3% but lower than the national figure of 0.77%. However there was considerable variation across the boroughs – ranging from 1.15% in Newham to 0.19% in Waltham Forest.
Fig B2.16: % of developed land that has been vacant for more than 5 years: 2007
Waltham Forest
Tower Hamlets
Newham
Hackney
Greenwich
Local Impact Zone
Five Host Boroughs
London
Thames Gateway
England
Developed land that has been vacant or derelict for more than 5 years (NI 170)
Plac
e
0.0% 0.2% 0.4%value, Vacantor Derelict Land
per Developed area
0.6% 0.8% 1.0%
2.8 Previous use of Olympic Park site
Figure B2.17 summarises land uses in the Olympic Park Planning Delivery Zones (PDZs), based on analysis by GLA of 2002-03 data.
Figure B2.17: Land uses in the Olympic Park Planning Delivery Zones
800,000
600,000
400,000
300,000
0
Squa
re m
etre
s
Woo
dland
Wat
er an
d W
etlan
dRe
creat
ionTra
nspo
rtRe
siden
tial
Comm
unity
Buil
dings
Indus
trial/
Comm
ercia
l
Vaca
ntUnk
nown
Source: GLA analysis of 2002-03 Cities Revealed land use data (copyright The GeoInformation Group)
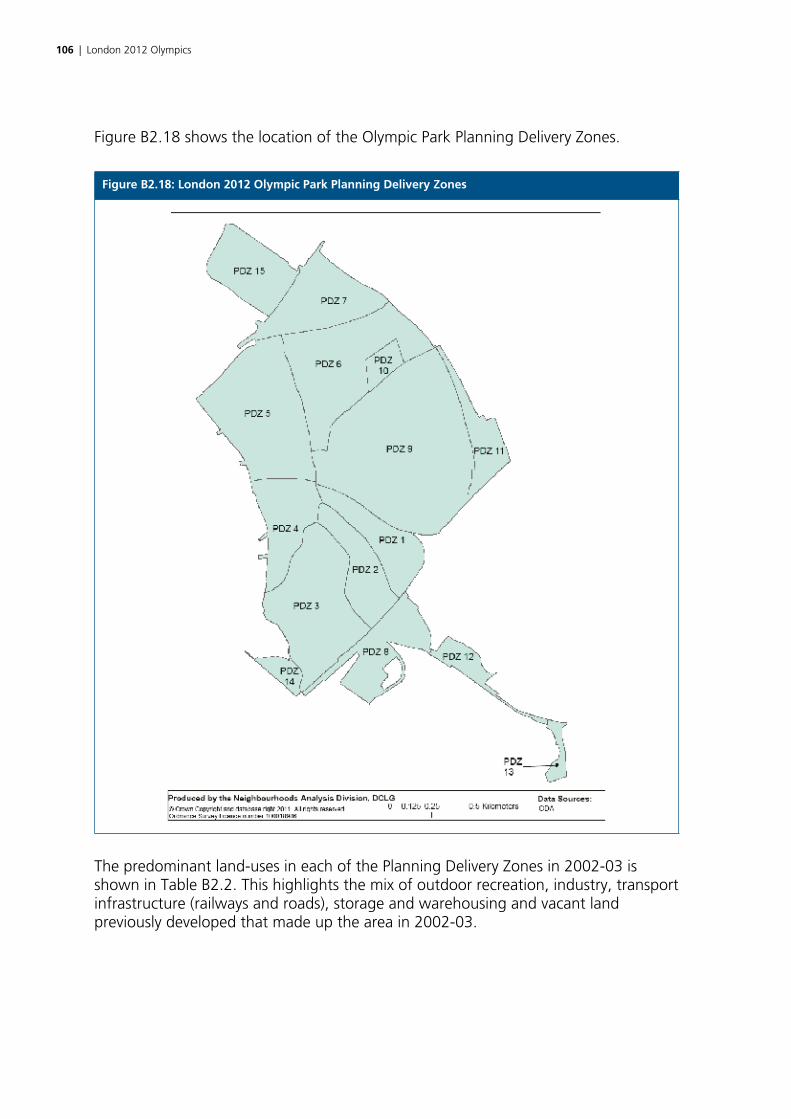
106 | London 2012 Olympics
Figure B2.18 shows the location of the Olympic Park Planning Delivery Zones.
Figure B2.18: London 2012 Olympic Park Planning Delivery Zones
The predominant land-uses in each of the Planning Delivery Zones in 2002-03 is shown in Table B2.2. This highlights the mix of outdoor recreation, industry, transport infrastructure (railways and roads), storage and warehousing and vacant land previously developed that made up the area in 2002-03.
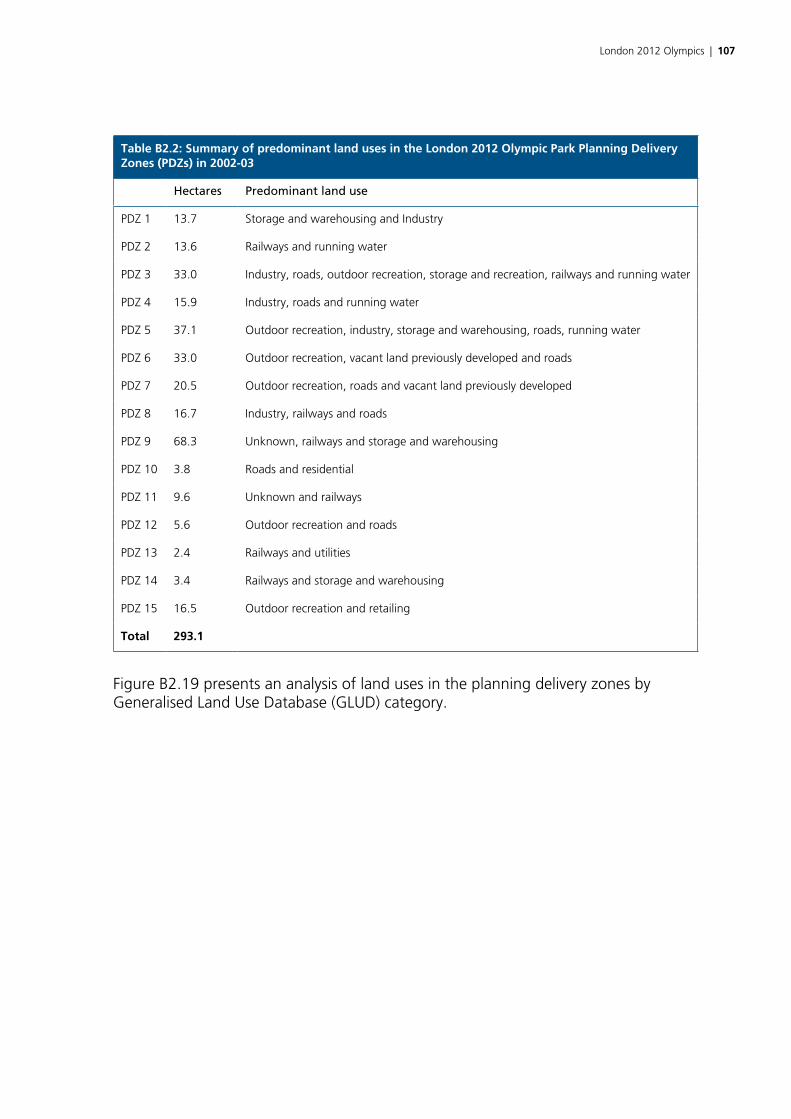
London 2012 Olympics | 107
Table B2.2: Summary of predominant land uses in the London 2012 Olympic Park Planning Delivery Zones (PDZs) in 2002-03
Hectares Predominant land use
PDZ 1 13.7 Storage and warehousing and Industry
PDZ 2 13.6 Railways and running water
PDZ 3 33.0 Industry, roads, outdoor recreation, storage and recreation, railways and running water
PDZ 4 15.9 Industry, roads and running water
PDZ 5 37.1 Outdoor recreation, industry, storage and warehousing, roads, running water
PDZ 6 33.0 Outdoor recreation, vacant land previously developed and roads
PDZ 7 20.5 Outdoor recreation, roads and vacant land previously developed
PDZ 8 16.7 Industry, railways and roads
PDZ 9 68.3 Unknown, railways and storage and warehousing
PDZ 10 3.8 Roads and residential
PDZ 11 9.6 Unknown and railways
PDZ 12 5.6 Outdoor recreation and roads
PDZ 13 2.4 Railways and utilities
PDZ 14 3.4 Railways and storage and warehousing
PDZ 15 16.5 Outdoor recreation and retailing
Total 293.1
Figure B2.19 presents an analysis of land uses in the planning delivery zones by Generalised Land Use Database (GLUD) category.
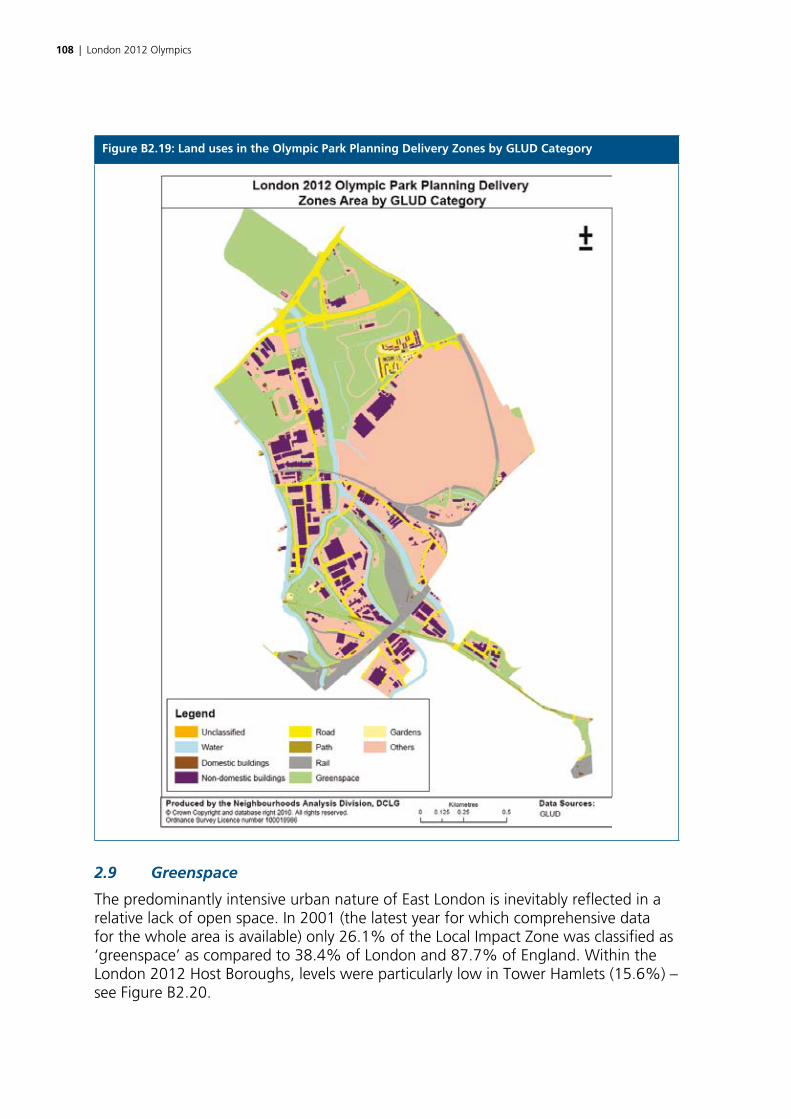
108 | London 2012 Olympics
Figure B2.19: Land uses in the Olympic Park Planning Delivery Zones by GLUD Category
2.9 Greenspace
The predominantly intensive urban nature of East London is inevitably reflected in a relative lack of open space. In 2001 (the latest year for which comprehensive data for the whole area is available) only 26.1% of the Local Impact Zone was classified as ‘greenspace’ as compared to 38.4% of London and 87.7% of England. Within the London 2012 Host Boroughs, levels were particularly low in Tower Hamlets (15.6%) – see Figure B2.20.

London 2012 Olympics | 109
Fig B2.20: Percentage of land area that was Greenspace: 2001
England
Thames Gateway
London
Five Host Boroughs
Greenwich
Hackney
Newham
Tower Hamlets
Wallham Forest
Plac
e
Area of Greenspace for 2011-11-01
0% 20% 40% 60% 80%
Square metres (m2) (thousdands), Areas per Total Area of All Land Types;Square metres; (Enhanced Basemap)
3. Employment and skills
3.1 Overview
Figure B3.1 shows the logic chain for employment and skills. Baseline performance and trends for the principal outcome and impact measures are summarised below.
Figure B3.1: Logic chain for employment and skills
Within East London:• Low levels of educational attainment• Low employment rate• Child poverty• Diverse population often facing a range of barriers to work
Contextualconditions
Policycontext
Inputs Activities
• Legacy Action Plan• SRF for Olympic Park and Lower Lea• 2012 Sustainability Plan• Mayor’s Economic Development Strategy 2010• London Tourism Action Plan 2009–13• LDA Investment Strategy 2010–13• 5 Boroughs MAA
• Financial resources – public and private• Human resources – promoters and other partners• Co-ordination – of public and private inputs• Partnerships and engagement
• Workless rate• JSA rate• Employment rate• Lone parents on benefits• Child in poverty• Income levels• Net additional GVA
• Business units• business turnover• Business start-ups• Employment (in local businesses)• Persons with degree level qualifications• Persons with no qualifications• Key Stage 4 average points scores• Key Stage 2 average points scores
• Staging of the Games• Related events e.g. Cultural Olympiad• Compete For• East London Business Place• Personal Best• London Employer Accord• Relay London Jobs• 5 Borough Skills and Employment Project• Construction Employer Accord• 2012 Employment Legacy• Business relocations
• Investment (£)• Visitor numbers• Visitor spend• New and improved business floorspace• Volunteers• Games-related qualifications
Outputs
Outcomes
Impacts
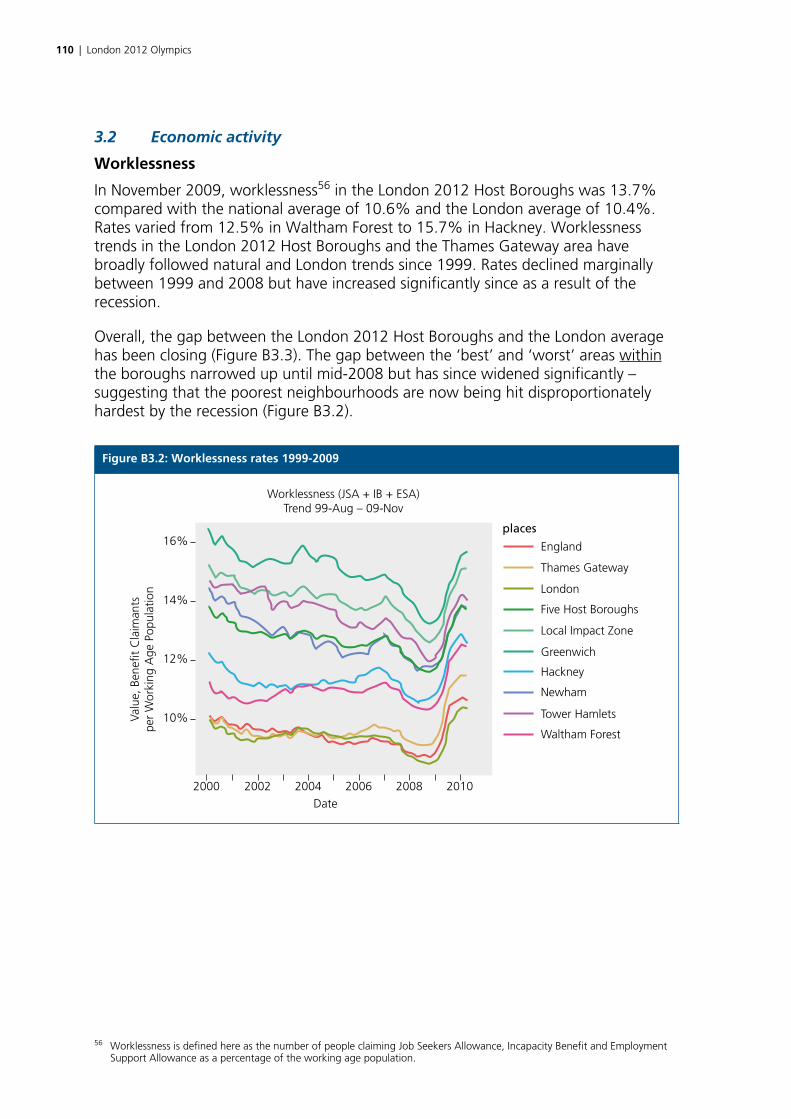
110 | London 2012 Olympics
3.2 Economic activity
Worklessness
In November 2009, worklessness56 in the London 2012 Host Boroughs was 13.7% compared with the national average of 10.6% and the London average of 10.4%. Rates varied from 12.5% in Waltham Forest to 15.7% in Hackney. Worklessness trends in the London 2012 Host Boroughs and the Thames Gateway area have broadly followed natural and London trends since 1999. Rates declined marginally between 1999 and 2008 but have increased significantly since as a result of the recession.
Overall, the gap between the London 2012 Host Boroughs and the London average has been closing (Figure B3.3). The gap between the ‘best’ and ‘worst’ areas within the boroughs narrowed up until mid-2008 but has since widened significantly – suggesting that the poorest neighbourhoods are now being hit disproportionately hardest by the recession (Figure B3.2).
Figure B3.2: Worklessness rates 1999-2009
England
places
Thames Gateway
London
Five Host Boroughs
Local Impact Zone
Greenwich
Hackney
Newham
Tower Hamlets
Waltham Forest
2000
10%
12%
14%
16%
2002 2004Date
2006 2008 2010
Valu
e, B
enefi
t C
laim
ants
per
Wor
king
Age
Pop
ulat
ion
Worklessness (JSA + IB + ESA)Trend 99-Aug – 09-Nov
56 Worklessness is defined here as the number of people claiming Job Seekers Allowance, Incapacity Benefit and Employment Support Allowance as a percentage of the working age population.

London 2012 Olympics | 111
Figure B3.3: Worklessness gap 1999-2009
2000 2001 2002 2003 2004
Date
2005 2006 2007 2008 2009 2010
133%
134%
135%
136%
137%
138%
139%
140%
Valu
e, B
enefi
t C
laim
ants
per
Wor
king
Age
pop
ulat
io10
0% =
Fiv
e H
ost
Boro
ughs
is t
he s
ame
as L
ondo
n
Worklessness (JSA + IB + ESA)Index of Five Host Boroughs relative to London
1999-08-01 – 2009-11-01
Figure B3.4: Worklessness variance within London 2012 Host Boroughs
19990.0000
2000 2001 2002 2003 2004 2005 2006 2007 2008 2009 2010
0.0005
0.0010
0.0015
0.0020
Varia
nce
betw
een
Geo
grap
hic
Uni
ts
Variance across Five Host Boroughs ofWorklessness (JSA + IB + ESA) over time
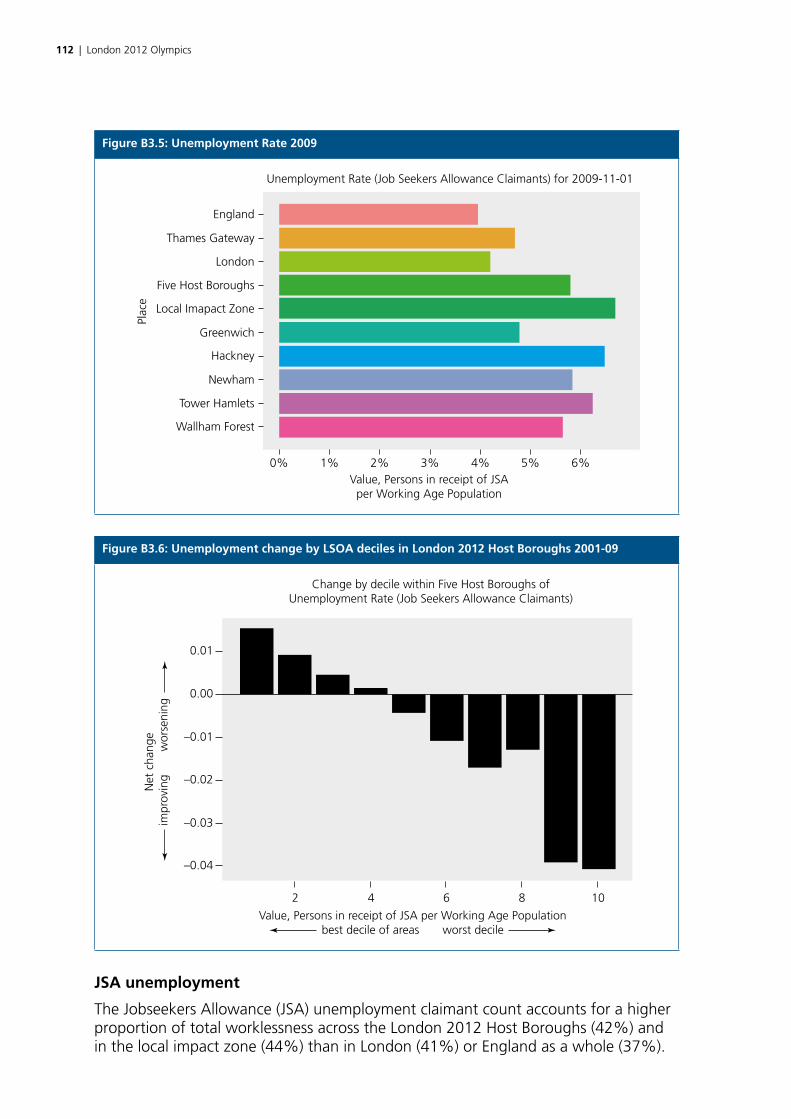
112 | London 2012 Olympics
Figure B3.5: Unemployment Rate 2009
England
Thames Gateway
London
Five Host Boroughs
Greenwich
Local Imapact Zone
Hackney
Newham
Tower Hamlets
Wallham Forest
Plac
e
0% 1% 2% 3% 4% 5% 6%Value, Persons in receipt of JSAper Working Age Population
Unemployment Rate (Job Seekers Allowance Claimants) for 2009-11-01
Figure B3.6: Unemployment change by LSOA deciles in London 2012 Host Boroughs 2001-09
0.01
0.00
–0.01
–0.02
–0.03
–0.04
2
Net
cha
nge
impr
ovin
g
w
orse
ning
4 6 8 10
Value, Persons in receipt of JSA per Working Age Populationbest decile of areas worst decile
Change by decile within Five Host Boroughs ofUnemployment Rate (Job Seekers Allowance Claimants)
JSA unemployment
The Jobseekers Allowance (JSA) unemployment claimant count accounts for a higher proportion of total worklessness across the London 2012 Host Boroughs (42%) and in the local impact zone (44%) than in London (41%) or England as a whole (37%).
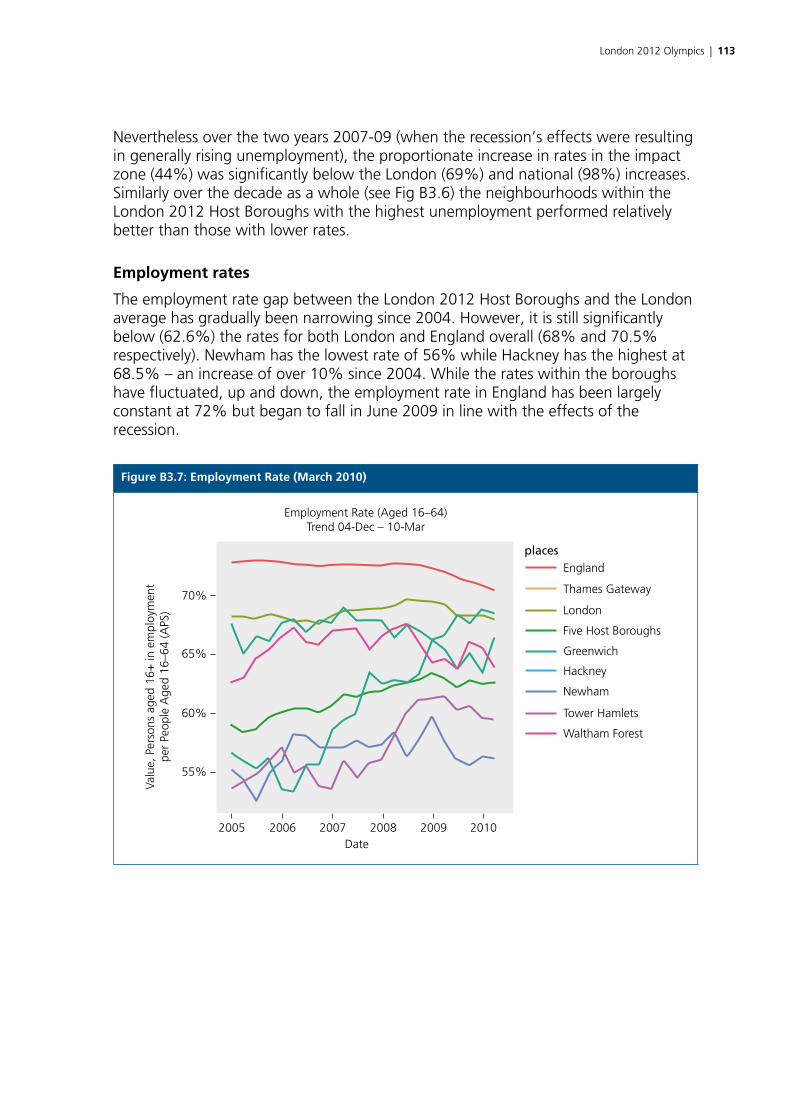
London 2012 Olympics | 113
Nevertheless over the two years 2007-09 (when the recession’s effects were resulting in generally rising unemployment), the proportionate increase in rates in the impact zone (44%) was significantly below the London (69%) and national (98%) increases. Similarly over the decade as a whole (see Fig B3.6) the neighbourhoods within the London 2012 Host Boroughs with the highest unemployment performed relatively better than those with lower rates.
Employment rates
The employment rate gap between the London 2012 Host Boroughs and the London average has gradually been narrowing since 2004. However, it is still significantly below (62.6%) the rates for both London and England overall (68% and 70.5% respectively). Newham has the lowest rate of 56% while Hackney has the highest at 68.5% – an increase of over 10% since 2004. While the rates within the boroughs have fluctuated, up and down, the employment rate in England has been largely constant at 72% but began to fall in June 2009 in line with the effects of the recession.
Figure B3.7: Employment Rate (March 2010)
England
places
Thames Gateway
London
Five Host Boroughs
Greenwich
Hackney
Newham
Tower Hamlets
Waltham Forest
2005
55%
60%
65%
70%
2006 2007Date
2008 2009 2010
Valu
e, P
erso
ns a
ged
16+
in e
mpl
oym
ent
per
Peop
le A
ged
16–6
4 (A
PS)
Employment Rate (Aged 16–64)Trend 04-Dec – 10-Mar
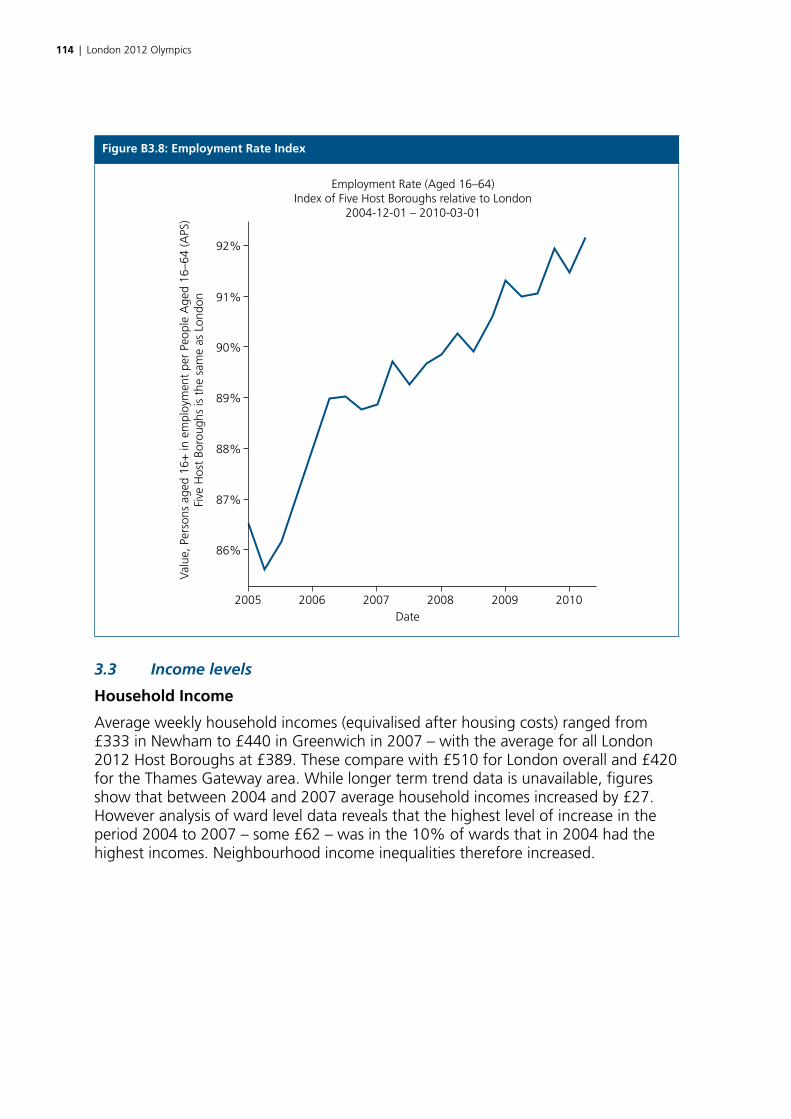
114 | London 2012 Olympics
Figure B3.8: Employment Rate Index
91%
92%
90%
89%
88%
87%
86%
Valu
e, P
erso
ns a
ged
16+
in e
mpl
oym
ent
per
Peop
le A
ged
16–6
4 (A
PS)
Five
Hos
t Bo
roug
hs is
the
sam
e as
Lon
don
2005 2006 2007Date
2008 2009 2010
Employment Rate (Aged 16–64)Index of Five Host Boroughs relative to London
2004-12-01 – 2010-03-01
3.3 Income levels
Household Income
Average weekly household incomes (equivalised after housing costs) ranged from £333 in Newham to £440 in Greenwich in 2007 – with the average for all London 2012 Host Boroughs at £389. These compare with £510 for London overall and £420 for the Thames Gateway area. While longer term trend data is unavailable, figures show that between 2004 and 2007 average household incomes increased by £27. However analysis of ward level data reveals that the highest level of increase in the period 2004 to 2007 – some £62 – was in the 10% of wards that in 2004 had the highest incomes. Neighbourhood income inequalities therefore increased.
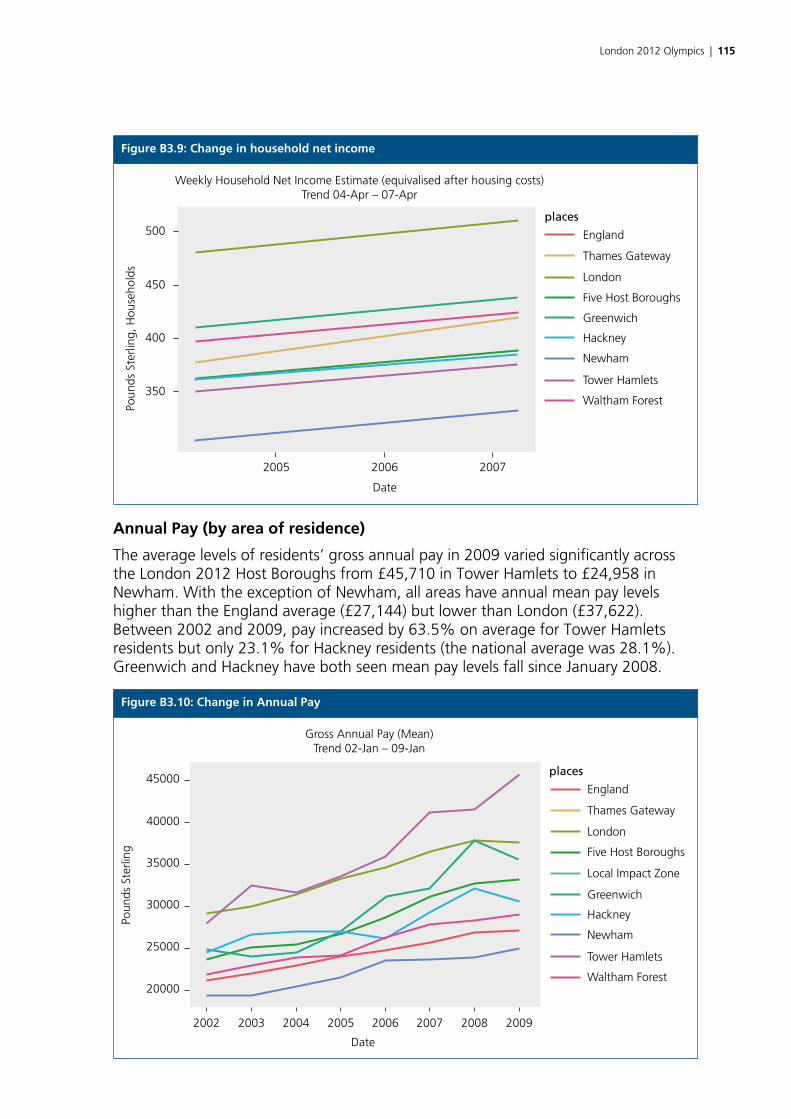
London 2012 Olympics | 115
Figure B3.9: Change in household net income
England
places
Thames Gateway
London
Five Host Boroughs
Greenwich
Hackney
Newham
Tower Hamlets
Waltham Forest
500
450
400
350
2005 2006
Date
2007
Poun
ds S
terli
ng, H
ouse
hold
s
Weekly Household Net Income Estimate (equivalised after housing costs)Trend 04-Apr – 07-Apr
Annual Pay (by area of residence)
The average levels of residents’ gross annual pay in 2009 varied significantly across the London 2012 Host Boroughs from £45,710 in Tower Hamlets to £24,958 in Newham. With the exception of Newham, all areas have annual mean pay levels higher than the England average (£27,144) but lower than London (£37,622). Between 2002 and 2009, pay increased by 63.5% on average for Tower Hamlets residents but only 23.1% for Hackney residents (the national average was 28.1%). Greenwich and Hackney have both seen mean pay levels fall since January 2008.
Figure B3.10: Change in Annual Pay
England
places
Thames Gateway
London
Five Host Boroughs
Local Impact Zone
Greenwich
Hackney
Newham
Tower Hamlets
Waltham Forest
45000
40000
35000
30000
25000
20000
2002 2003 2004 2005
Date
2006 2007 2008 2009
Poun
ds S
terli
ng
Gross Annual Pay (Mean)Trend 02-Jan – 09-Jan
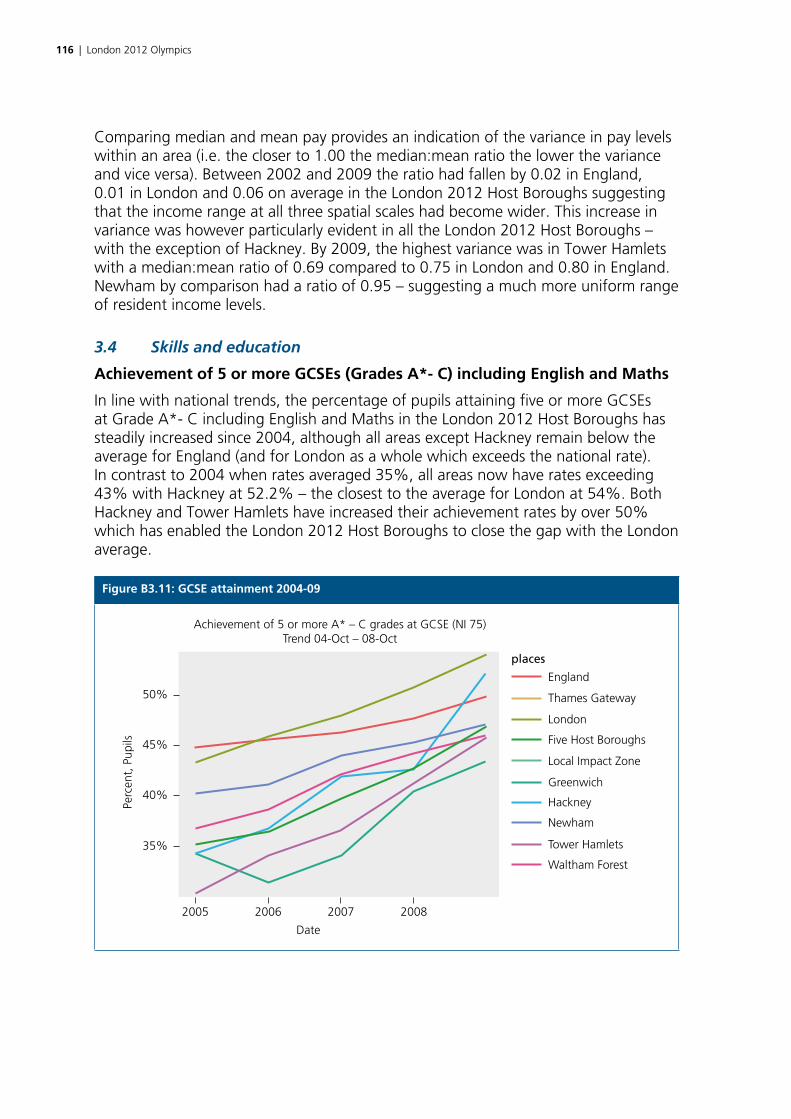
116 | London 2012 Olympics
Comparing median and mean pay provides an indication of the variance in pay levels within an area (i.e. the closer to 1.00 the median:mean ratio the lower the variance and vice versa). Between 2002 and 2009 the ratio had fallen by 0.02 in England, 0.01 in London and 0.06 on average in the London 2012 Host Boroughs suggesting that the income range at all three spatial scales had become wider. This increase in variance was however particularly evident in all the London 2012 Host Boroughs – with the exception of Hackney. By 2009, the highest variance was in Tower Hamlets with a median:mean ratio of 0.69 compared to 0.75 in London and 0.80 in England. Newham by comparison had a ratio of 0.95 – suggesting a much more uniform range of resident income levels.
3.4 Skills and education
Achievement of 5 or more GCSEs (Grades A*- C) including English and Maths
In line with national trends, the percentage of pupils attaining five or more GCSEs at Grade A*- C including English and Maths in the London 2012 Host Boroughs has steadily increased since 2004, although all areas except Hackney remain below the average for England (and for London as a whole which exceeds the national rate). In contrast to 2004 when rates averaged 35%, all areas now have rates exceeding 43% with Hackney at 52.2% – the closest to the average for London at 54%. Both Hackney and Tower Hamlets have increased their achievement rates by over 50% which has enabled the London 2012 Host Boroughs to close the gap with the London average.
Figure B3.11: GCSE attainment 2004-09
England
places
Thames Gateway
London
Five Host Boroughs
Local Impact Zone
Greenwich
Hackney
Newham
Tower Hamlets
Waltham Forest
2005
35%
40%
45%
50%
2006
Date
2007 2008
Perc
ent,
Pup
ils
Achievement of 5 or more A* – C grades at GCSE (NI 75)Trend 04-Oct – 08-Oct
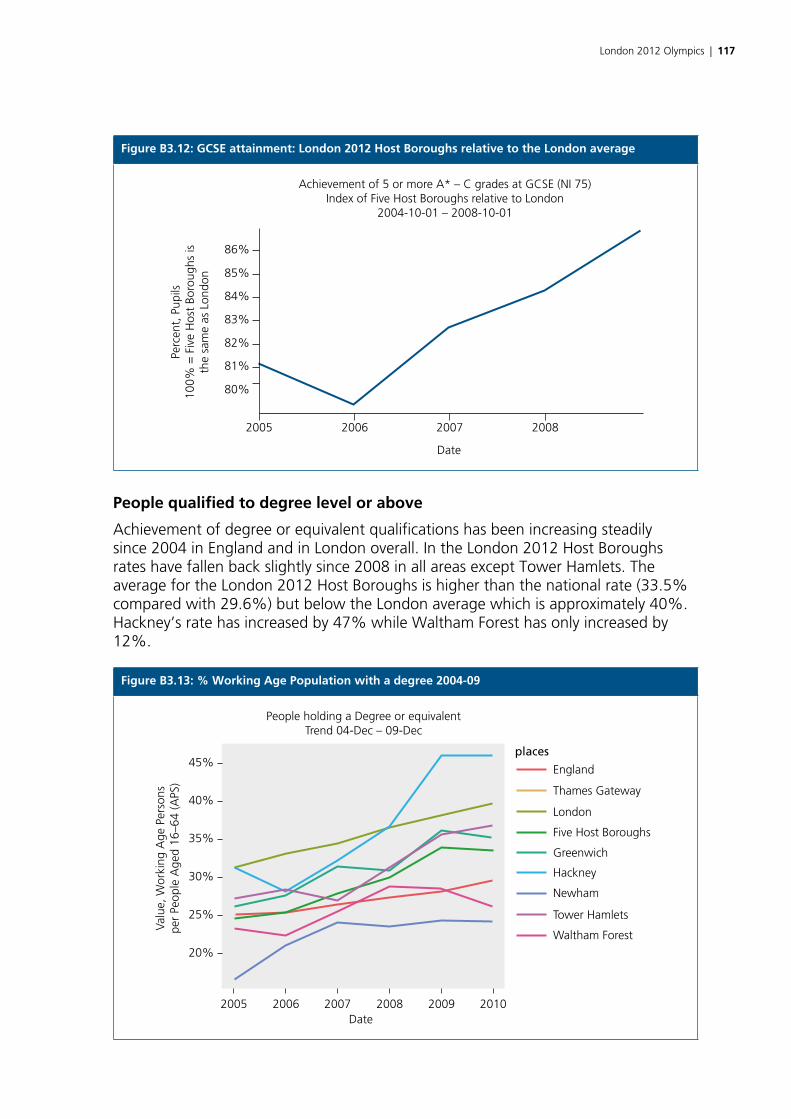
London 2012 Olympics | 117
Figure B3.12: GCSE attainment: London 2012 Host Boroughs relative to the London average
86%
85%
84%
83%
82%
81%
80%
2005 2006
Date
2007 2008
Perc
ent,
Pup
ils10
0% =
Fiv
e H
ost
Boro
ughs
isth
e sa
me
as L
ondo
n
Achievement of 5 or more A* – C grades at GCSE (NI 75)Index of Five Host Boroughs relative to London
2004-10-01 – 2008-10-01
People qualified to degree level or above
Achievement of degree or equivalent qualifications has been increasing steadily since 2004 in England and in London overall. In the London 2012 Host Boroughs rates have fallen back slightly since 2008 in all areas except Tower Hamlets. The average for the London 2012 Host Boroughs is higher than the national rate (33.5% compared with 29.6%) but below the London average which is approximately 40%. Hackney’s rate has increased by 47% while Waltham Forest has only increased by 12%.
Figure B3.13: % Working Age Population with a degree 2004-09
England
places
Thames Gateway
London
Five Host Boroughs
Greenwich
Hackney
Newham
Tower Hamlets
Waltham Forest
2005
20%
25%
30%
35%
40%
45%
2006 2007Date
2008 2009 2010
Valu
e, W
orki
ng A
ge P
erso
nspe
r Pe
ople
Age
d 16
–64
(APS
)
People holding a Degree or equivalentTrend 04-Dec – 09-Dec

118 | London 2012 Olympics
No qualifications
In line with higher worklessness rates, the percentage of the working age population with no qualifications is higher in the London 2012 Host Boroughs compared with London and the national average. The boroughs’ average has however been decreasing since 2004 and closing the gap with the London average. In 2009, 16.9% of the working age population in the London 2012 Host Boroughs had no qualifications compared with 11.8% in London and 12.1% nationally. The rate for Waltham Forest has increased from 18.8% to 21.5% compared with decreases of over a third in both Hackney and Tower Hamlets to rates of 14.2% and 15.2% respectively.
NEET – Not in education, employment or training
The average percentage of 16-18 year olds not in education, employment or training across the London 2012 Host Boroughs decreased from 10.6% in January 2006 to 6.4% in January 2009. This decrease took the London 2012 Host Boroughs rate marginally below the national average although still above the average for London as a whole. The areas varied from 4.5% in Waltham Forest to 7.4% in Hackney and all areas experienced a decrease which has enabled the gap with London to be closed.
Figure B3.14: % of working age population with no qualifications (December 2009)
Waltham Forest
0% 5% 10% 15% 20%
Tower Hamlets
Newham
Hackney
Greenwich
Five Host Boroughs
London
Thames Gateway
England
People with No Qualifications for 2009-12-01
Plac
e
Value, Working Age Personsper People Aged 16–64 (APS)
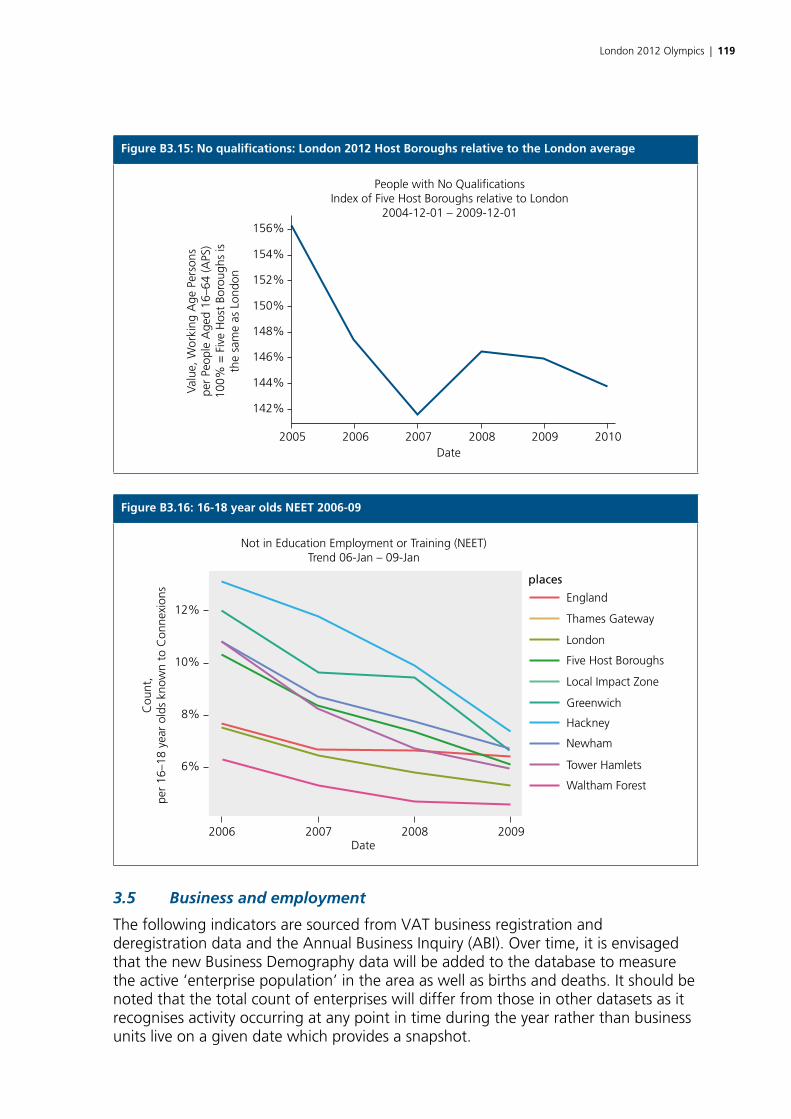
London 2012 Olympics | 119
Figure B3.15: No qualifications: London 2012 Host Boroughs relative to the London average
156%
154%
152%
150%
148%
146%
144%
142%
2005 2006 2007Date
2008 2009 2010
Valu
e, W
orki
ng A
ge P
erso
nspe
r Pe
ople
Age
d 16
–64
(APS
)10
0% =
Fiv
e H
ost
Boro
ughs
isth
e sa
me
as L
ondo
n
People with No QualificationsIndex of Five Host Boroughs relative to London
2004-12-01 – 2009-12-01
Figure B3.16: 16-18 year olds NEET 2006-09
England
places
Thames Gateway
London
Five Host Boroughs
Local Impact Zone
Greenwich
Hackney
Newham
Tower Hamlets
Waltham Forest
12%
10%
8%
6%
2006 2007Date
2008 2009
Cou
nt,
per
16–1
8 ye
ar o
lds
know
n to
Con
nexi
ons
Not in Education Employment or Training (NEET)Trend 06-Jan – 09-Jan
3.5 Business and employment
The following indicators are sourced from VAT business registration and deregistration data and the Annual Business Inquiry (ABI). Over time, it is envisaged that the new Business Demography data will be added to the database to measure the active ‘enterprise population’ in the area as well as births and deaths. It should be noted that the total count of enterprises will differ from those in other datasets as it recognises activity occurring at any point in time during the year rather than business units live on a given date which provides a snapshot.
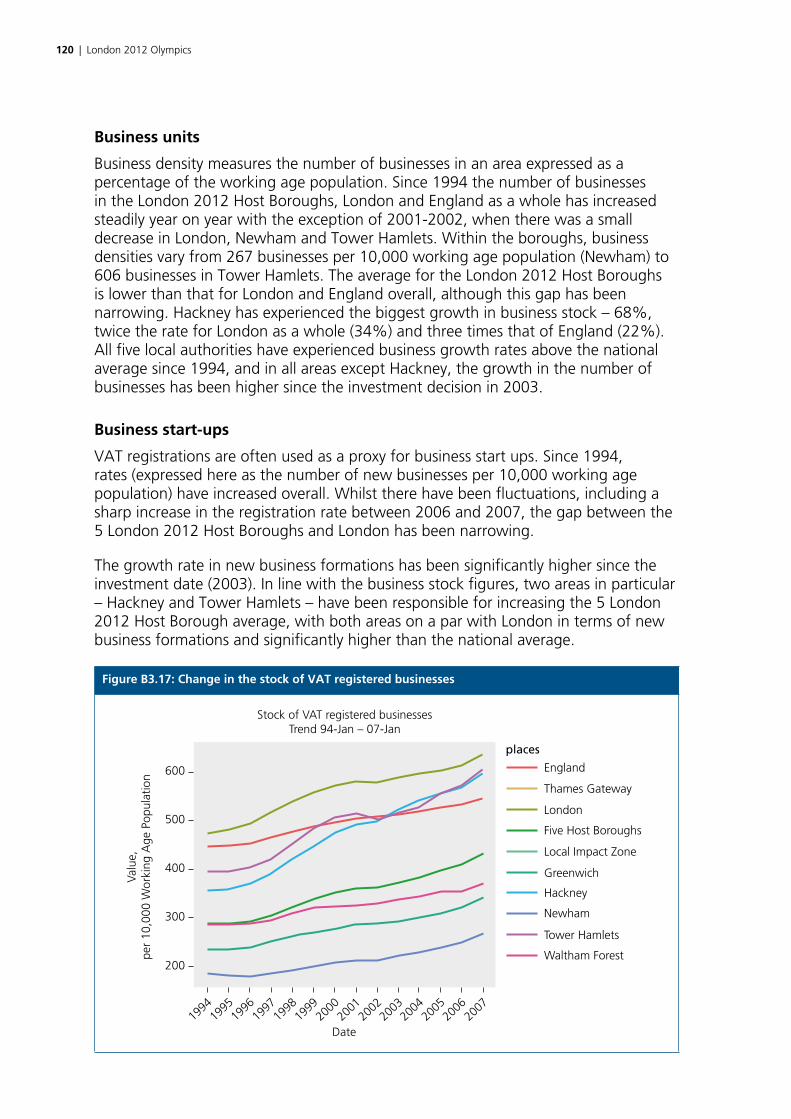
120 | London 2012 Olympics
Business units
Business density measures the number of businesses in an area expressed as a percentage of the working age population. Since 1994 the number of businesses in the London 2012 Host Boroughs, London and England as a whole has increased steadily year on year with the exception of 2001-2002, when there was a small decrease in London, Newham and Tower Hamlets. Within the boroughs, business densities vary from 267 businesses per 10,000 working age population (Newham) to 606 businesses in Tower Hamlets. The average for the London 2012 Host Boroughs is lower than that for London and England overall, although this gap has been narrowing. Hackney has experienced the biggest growth in business stock – 68%, twice the rate for London as a whole (34%) and three times that of England (22%). All five local authorities have experienced business growth rates above the national average since 1994, and in all areas except Hackney, the growth in the number of businesses has been higher since the investment decision in 2003.
Business start-ups
VAT registrations are often used as a proxy for business start ups. Since 1994, rates (expressed here as the number of new businesses per 10,000 working age population) have increased overall. Whilst there have been fluctuations, including a sharp increase in the registration rate between 2006 and 2007, the gap between the 5 London 2012 Host Boroughs and London has been narrowing.
The growth rate in new business formations has been significantly higher since the investment date (2003). In line with the business stock figures, two areas in particular – Hackney and Tower Hamlets – have been responsible for increasing the 5 London 2012 Host Borough average, with both areas on a par with London in terms of new business formations and significantly higher than the national average.
Figure B3.17: Change in the stock of VAT registered businesses
England
places
Thames Gateway
London
Five Host Boroughs
Local Impact Zone
Greenwich
Hackney
Newham
Tower Hamlets
Waltham Forest
1994
1995
1996
1997
1998
1999
2000
2001
2002
2003
2004
2005
2006
2007
Date
200
300
400
500
600
Valu
e,pe
r 10
,000
Wor
king
Age
Pop
ulat
ion
Stock of VAT registered businessesTrend 94-Jan – 07-Jan
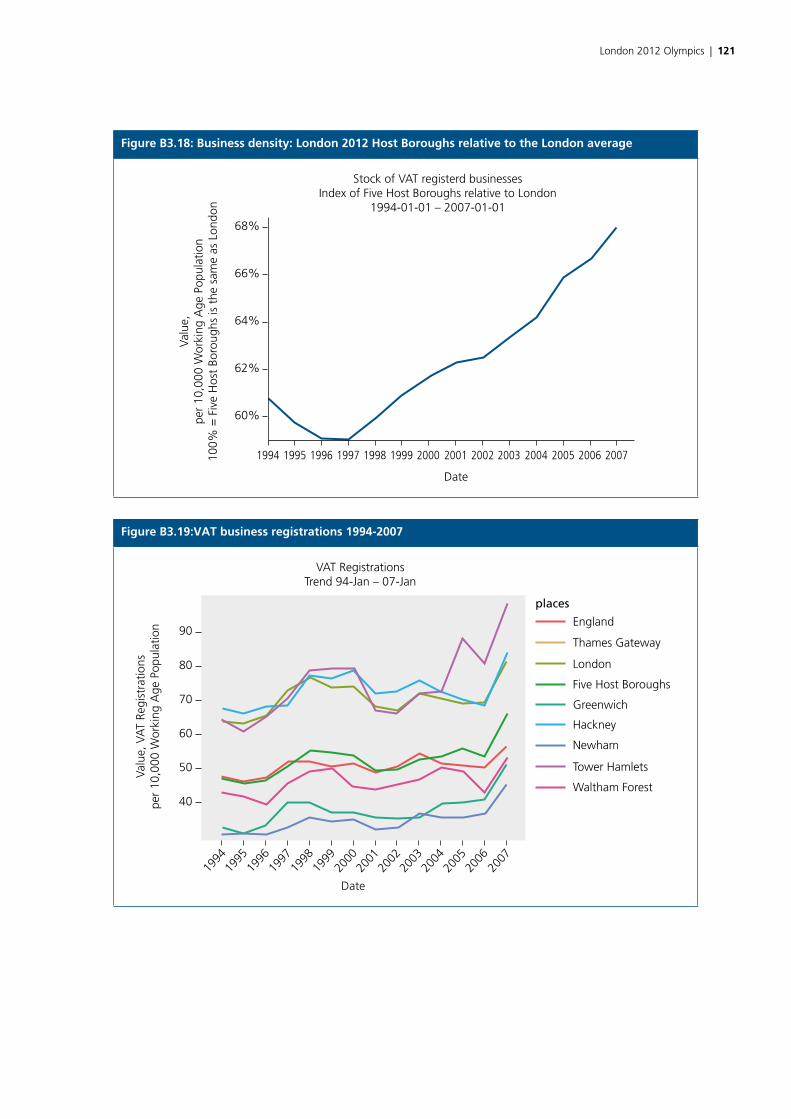
London 2012 Olympics | 121
Figure B3.18: Business density: London 2012 Host Boroughs relative to the London average
68%
66%
64%
62%
60%
Valu
e,pe
r 10
,000
Wor
king
Age
Pop
ulat
ion
100%
= F
ive
Hos
t Bo
roug
hs is
the
sam
e as
Lon
don
1994 1995 1996 1997 1998 1999 2000
Date
2001 2002 2003 2004 2005 2006 2007
Stock of VAT registerd businessesIndex of Five Host Boroughs relative to London
1994-01-01 – 2007-01-01
Figure B3.19:VAT business registrations 1994-2007
England
places
Thames Gateway
London
Five Host Boroughs
Greenwich
Hackney
Newham
Tower Hamlets
Waltham Forest
1994
1995
1996
1997
1998
1999
2000
2001
2002
2003
2004
2005
2006
2007
Date
40
50
60
70
80
90
Valu
e, V
AT
Regi
stra
tions
per
10,0
00 W
orki
ng A
ge P
opul
atio
n
VAT RegistrationsTrend 94-Jan – 07-Jan
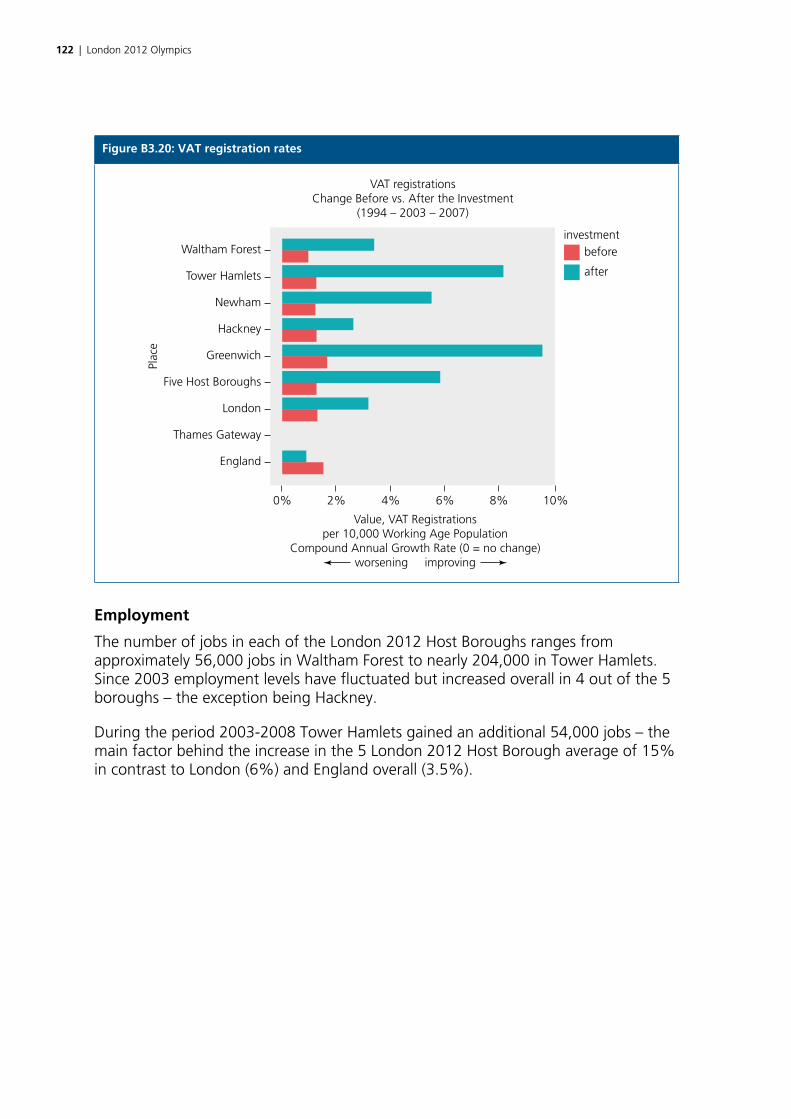
122 | London 2012 Olympics
Figure B3.20: VAT registration rates
Waltham Forest
Tower Hamlets
Newham
Hackney
Greenwich
Five Host Boroughs
London
Thames Gateway
England
0% 2% 4% 6% 8% 10%
Value, VAT Registrationsper 10,000 Working Age Population
Compound Annual Growth Rate (0 = no change)worsening improving
Plac
e
VAT registrationsChange Before vs. After the Investment
(1994 – 2003 – 2007)
investmentbefore
after
Employment
The number of jobs in each of the London 2012 Host Boroughs ranges from approximately 56,000 jobs in Waltham Forest to nearly 204,000 in Tower Hamlets. Since 2003 employment levels have fluctuated but increased overall in 4 out of the 5 boroughs – the exception being Hackney.
During the period 2003-2008 Tower Hamlets gained an additional 54,000 jobs – the main factor behind the increase in the 5 London 2012 Host Borough average of 15% in contrast to London (6%) and England overall (3.5%).
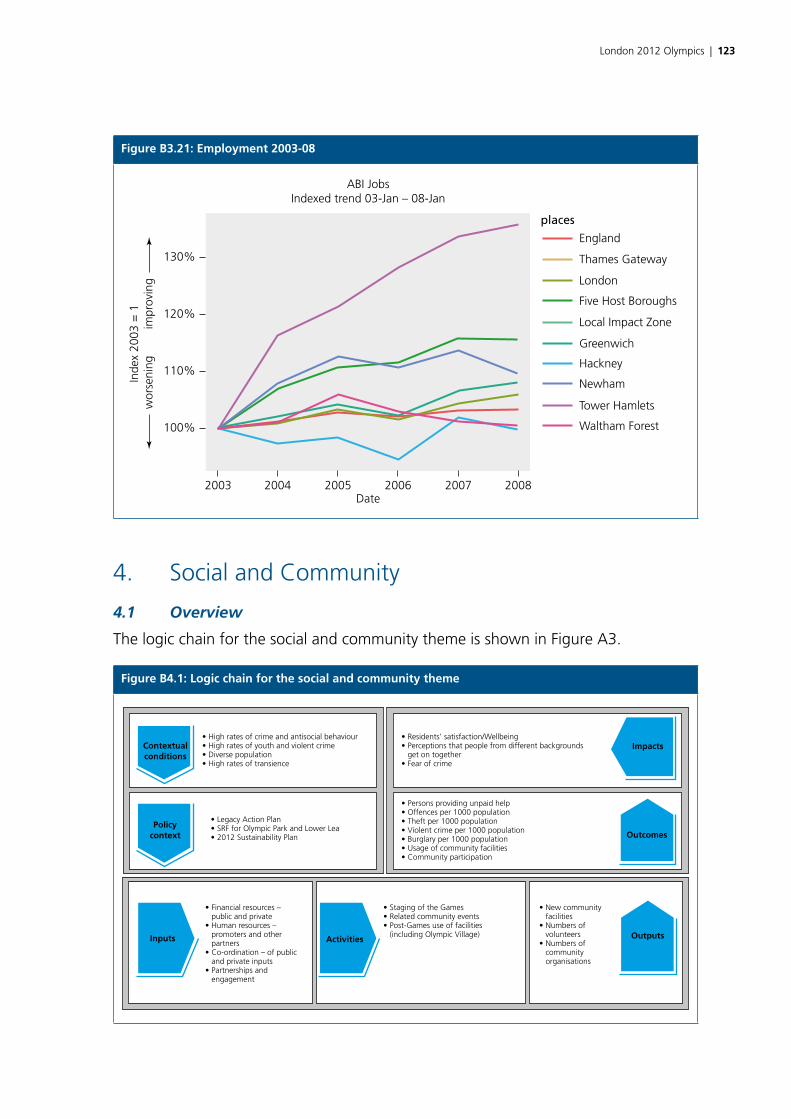
London 2012 Olympics | 123
Figure B3.21: Employment 2003-08
England
places
Thames Gateway
London
Five Host Boroughs
Local Impact Zone
Greenwich
Hackney
Newham
Tower Hamlets
Waltham Forest100%
110%
120%
130%
Inde
x 20
03 =
1w
orse
ning
im
prov
ing
2003 2004 2005Date
2006 2007 2008
ABI JobsIndexed trend 03-Jan – 08-Jan
4. Social and Community
4.1 Overview
The logic chain for the social and community theme is shown in Figure A3.
Figure B4.1: Logic chain for the social and community theme
• High rates of crime and antisocial behaviour• High rates of youth and violent crime• Diverse population• High rates of transience
Contextualconditions
Policycontext
Inputs Activities
• Legacy Action Plan• SRF for Olympic Park and Lower Lea• 2012 Sustainability Plan
• Financial resources – public and private• Human resources – promoters and other partners• Co-ordination – of public and private inputs• Partnerships and engagement
• Residents’ satisfaction/Wellbeing• Perceptions that people from different backgrounds get on together• Fear of crime
• Persons providing unpaid help• Offences per 1000 population• Theft per 1000 population• Violent crime per 1000 population• Burglary per 1000 population• Usage of community facilities• Community participation
• Staging of the Games• Related community events• Post-Games use of facilities (including Olympic Village)
• New community facilities• Numbers of volunteers• Numbers of community organisations
Outputs
Outcomes
Impacts
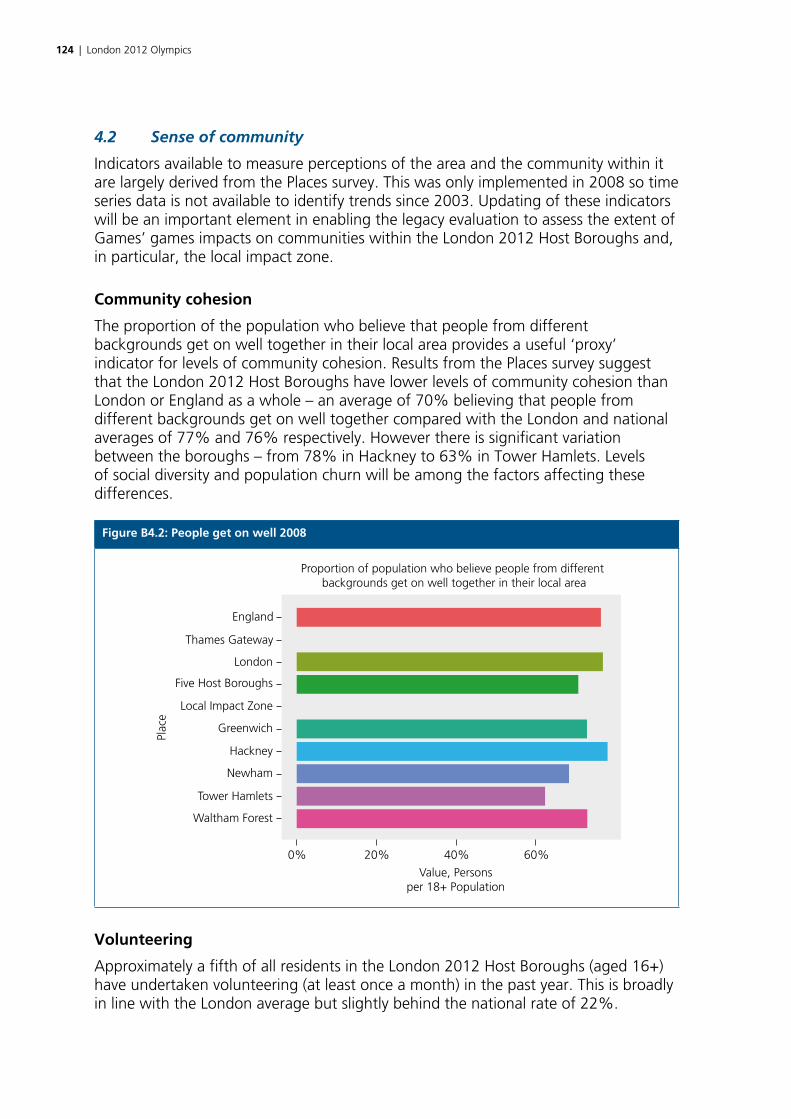
124 | London 2012 Olympics
4.2 Sense of community
Indicators available to measure perceptions of the area and the community within it are largely derived from the Places survey. This was only implemented in 2008 so time series data is not available to identify trends since 2003. Updating of these indicators will be an important element in enabling the legacy evaluation to assess the extent of Games’ games impacts on communities within the London 2012 Host Boroughs and, in particular, the local impact zone.
Community cohesion
The proportion of the population who believe that people from different backgrounds get on well together in their local area provides a useful ‘proxy’ indicator for levels of community cohesion. Results from the Places survey suggest that the London 2012 Host Boroughs have lower levels of community cohesion than London or England as a whole – an average of 70% believing that people from different backgrounds get on well together compared with the London and national averages of 77% and 76% respectively. However there is significant variation between the boroughs – from 78% in Hackney to 63% in Tower Hamlets. Levels of social diversity and population churn will be among the factors affecting these differences.
Figure B4.2: People get on well 2008
Waltham Forest
0%
Tower Hamlets
Newham
Hackney
Greenwich
Local Impact Zone
Five Host Boroughs
London
Thames Gateway
England
Proportion of population who believe people from different backgrounds get on well together in their local area
Plac
e
20%
Value, Personsper 18+ Population
40% 60%
Volunteering
Approximately a fifth of all residents in the London 2012 Host Boroughs (aged 16+) have undertaken volunteering (at least once a month) in the past year. This is broadly in line with the London average but slightly behind the national rate of 22%.
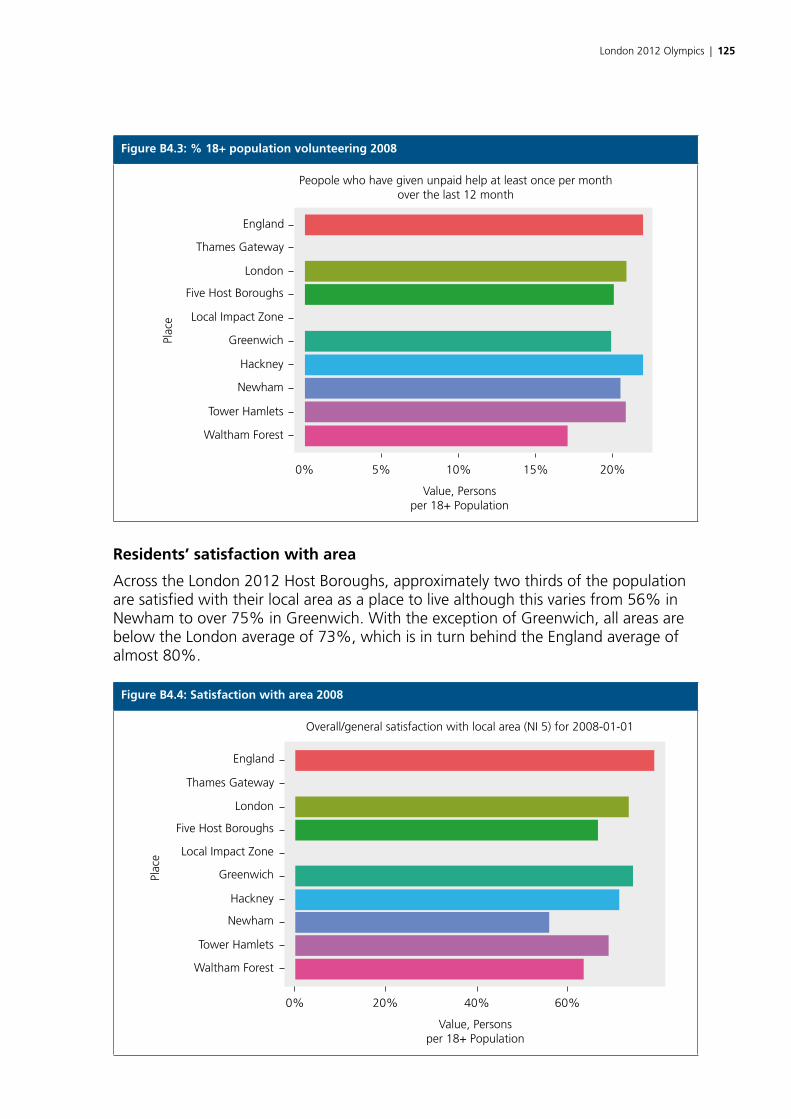
London 2012 Olympics | 125
Figure B4.3: % 18+ population volunteering 2008
Waltham Forest
0%
Tower Hamlets
Newham
Hackney
Greenwich
Local Impact Zone
Plac
e
Five Host Boroughs
London
Thames Gateway
England
5% 10%
Value, Personsper 18+ Population
15% 20%
Peopole who have given unpaid help at least once per monthover the last 12 month
Residents’ satisfaction with area
Across the London 2012 Host Boroughs, approximately two thirds of the population are satisfied with their local area as a place to live although this varies from 56% in Newham to over 75% in Greenwich. With the exception of Greenwich, all areas are below the London average of 73%, which is in turn behind the England average of almost 80%.
Figure B4.4: Satisfaction with area 2008
Waltham Forest
0%
Tower Hamlets
Newham
Hackney
Greenwich
Local Impact Zone
Plac
e
Five Host Boroughs
London
Thames Gateway
England
20% 40%
Value, Personsper 18+ Population
60%
Overall/general satisfaction with local area (NI 5) for 2008-01-01
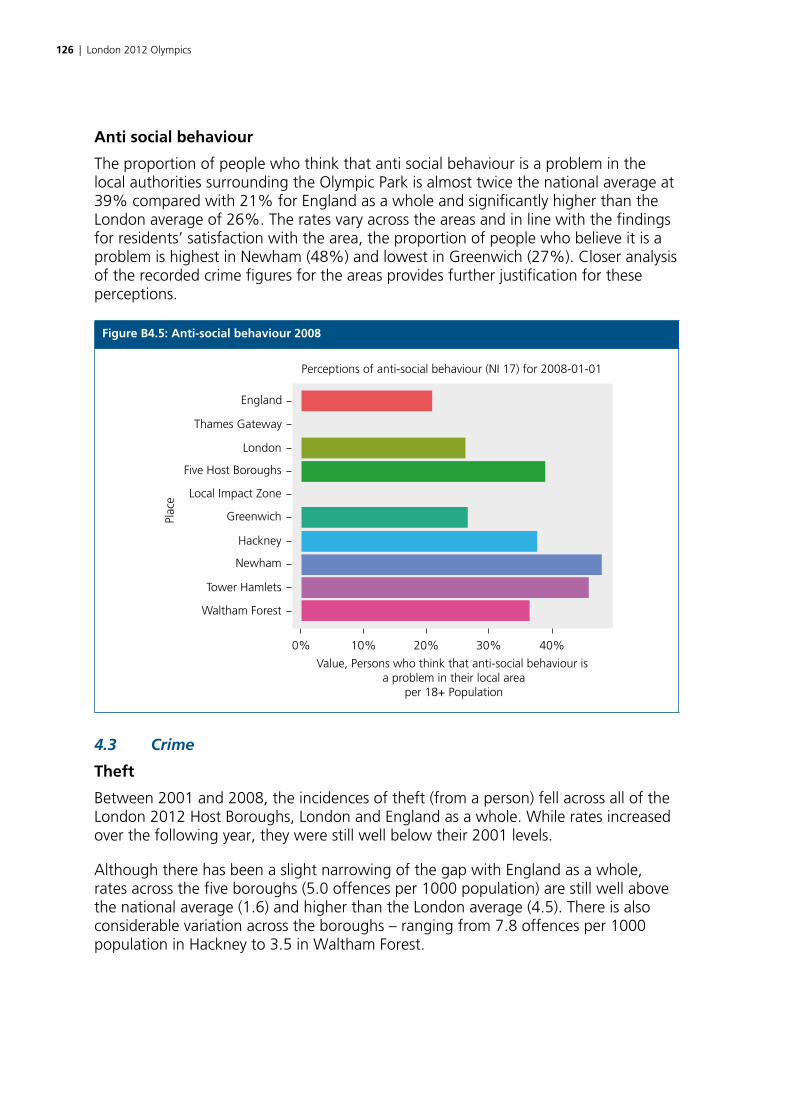
126 | London 2012 Olympics
Anti social behaviour
The proportion of people who think that anti social behaviour is a problem in the local authorities surrounding the Olympic Park is almost twice the national average at 39% compared with 21% for England as a whole and significantly higher than the London average of 26%. The rates vary across the areas and in line with the findings for residents’ satisfaction with the area, the proportion of people who believe it is a problem is highest in Newham (48%) and lowest in Greenwich (27%). Closer analysis of the recorded crime figures for the areas provides further justification for these perceptions.
Figure B4.5: Anti-social behaviour 2008
Waltham Forest
0%
Tower Hamlets
Newham
Hackney
Greenwich
Local Impact Zone
Five Host Boroughs
Plac
e
London
Thames Gateway
England
10% 20%
Value, Persons who think that anti-social behaviour is a problem in their local area
per 18+ Population
30% 40%
Perceptions of anti-social behaviour (NI 17) for 2008-01-01
4.3 Crime
Theft
Between 2001 and 2008, the incidences of theft (from a person) fell across all of the London 2012 Host Boroughs, London and England as a whole. While rates increased over the following year, they were still well below their 2001 levels.
Although there has been a slight narrowing of the gap with England as a whole, rates across the five boroughs (5.0 offences per 1000 population) are still well above the national average (1.6) and higher than the London average (4.5). There is also considerable variation across the boroughs – ranging from 7.8 offences per 1000 population in Hackney to 3.5 in Waltham Forest.
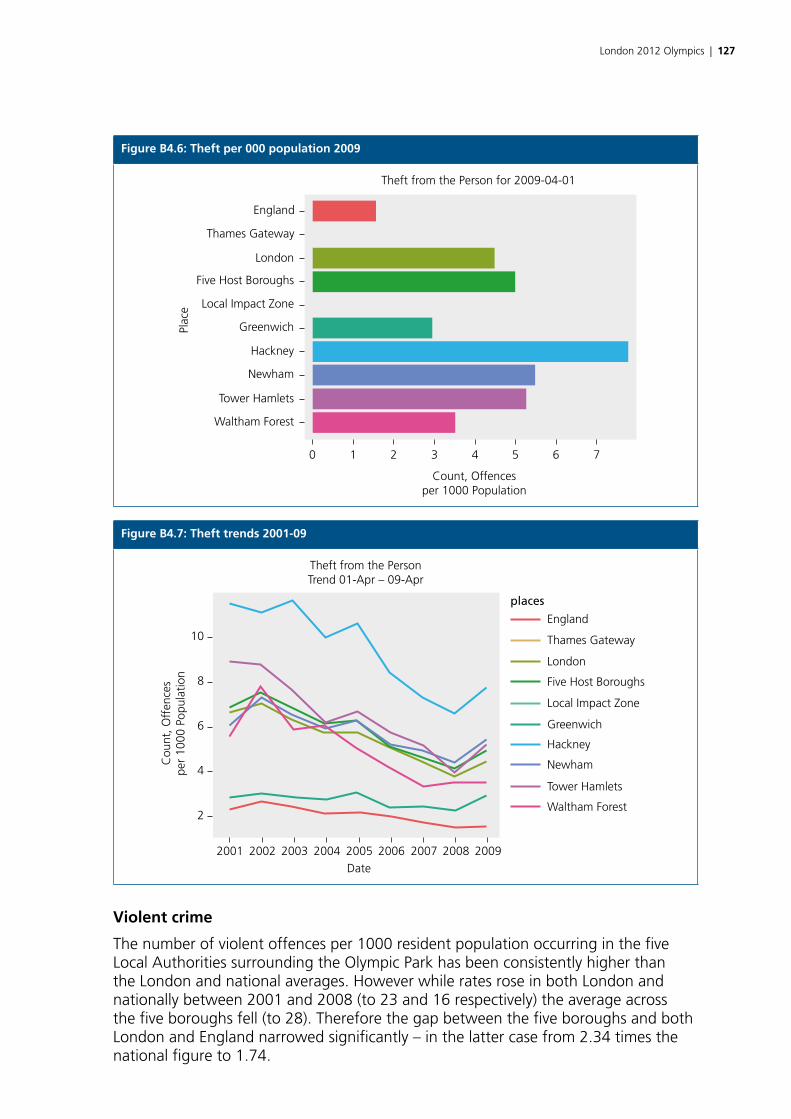
London 2012 Olympics | 127
Figure B4.6: Theft per 000 population 2009
Waltham Forest
0
Tower Hamlets
Newham
Hackney
GreenwichPlac
e Local Impact Zone
Five Host Boroughs
London
Thames Gateway
England
1 2 3 4
Count, Offencesper 1000 Population
5 6 7
Theft from the Person for 2009-04-01
Figure B4.7: Theft trends 2001-09
England
places
Thames Gateway
London
Five Host Boroughs
Local Impact Zone
Greenwich
Hackney
Newham
Tower Hamlets
Waltham Forest
10
8
6
4
2
2001 2002 2003 2004 2005Date
Theft from the PersonTrend 01-Apr – 09-Apr
2006 2007 2008 2009
Cou
nt, O
ffen
ces
per
1000
Pop
ulat
ion
Violent crime
The number of violent offences per 1000 resident population occurring in the five Local Authorities surrounding the Olympic Park has been consistently higher than the London and national averages. However while rates rose in both London and nationally between 2001 and 2008 (to 23 and 16 respectively) the average across the five boroughs fell (to 28). Therefore the gap between the five boroughs and both London and England narrowed significantly – in the latter case from 2.34 times the national figure to 1.74.
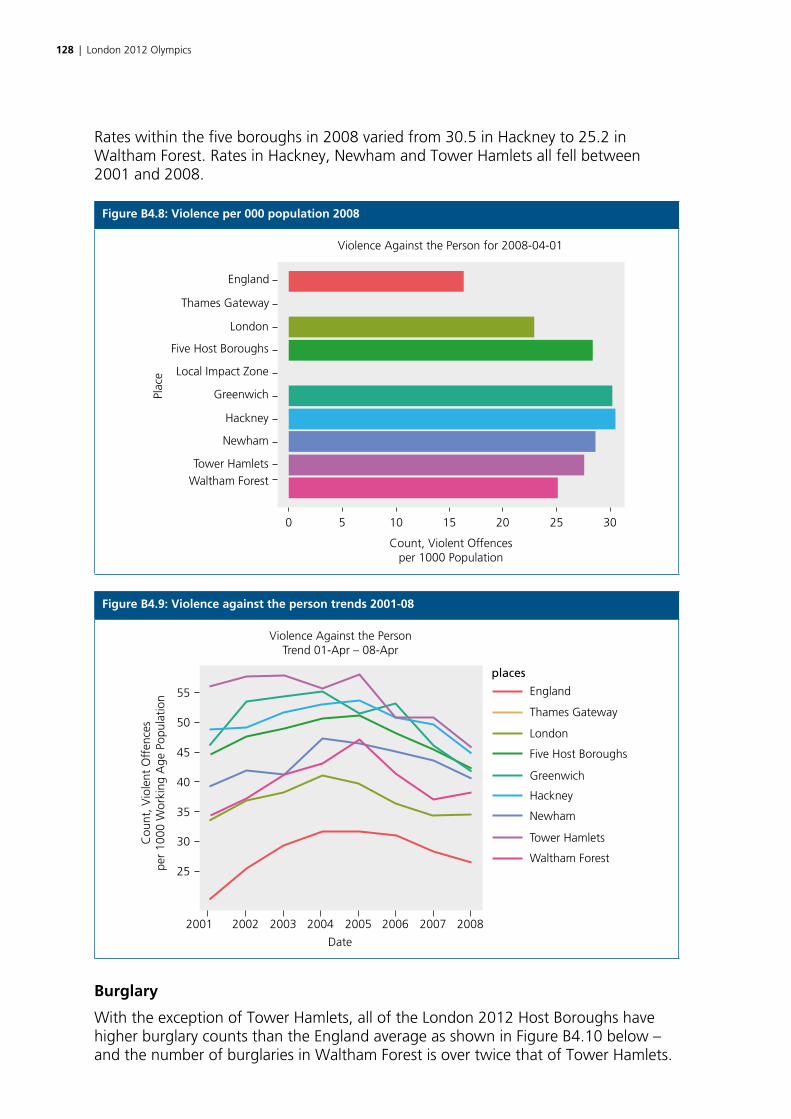
128 | London 2012 Olympics
Rates within the five boroughs in 2008 varied from 30.5 in Hackney to 25.2 in Waltham Forest. Rates in Hackney, Newham and Tower Hamlets all fell between 2001 and 2008.
Figure B4.8: Violence per 000 population 2008
Waltham Forest
0
Tower Hamlets
Newham
Hackney
GreenwichPlac
e Local Impact Zone
Five Host Boroughs
London
Thames Gateway
England
5 10 15
Count, Violent Offencesper 1000 Population
20 25 30
Violence Against the Person for 2008-04-01
Figure B4.9: Violence against the person trends 2001-08
England
places
Thames Gateway
London
Five Host Boroughs
Greenwich
Hackney
Newham
Tower Hamlets
Waltham Forest
55
50
45
40
35
30
25
2001 2002 2003 2004
Date
Violence Against the PersonTrend 01-Apr – 08-Apr
2005 2006 2007 2008
Cou
nt, V
iole
nt O
ffen
ces
per
1000
Wor
king
Age
Pop
ulat
ion
Burglary
With the exception of Tower Hamlets, all of the London 2012 Host Boroughs have higher burglary counts than the England average as shown in Figure B4.10 below – and the number of burglaries in Waltham Forest is over twice that of Tower Hamlets.
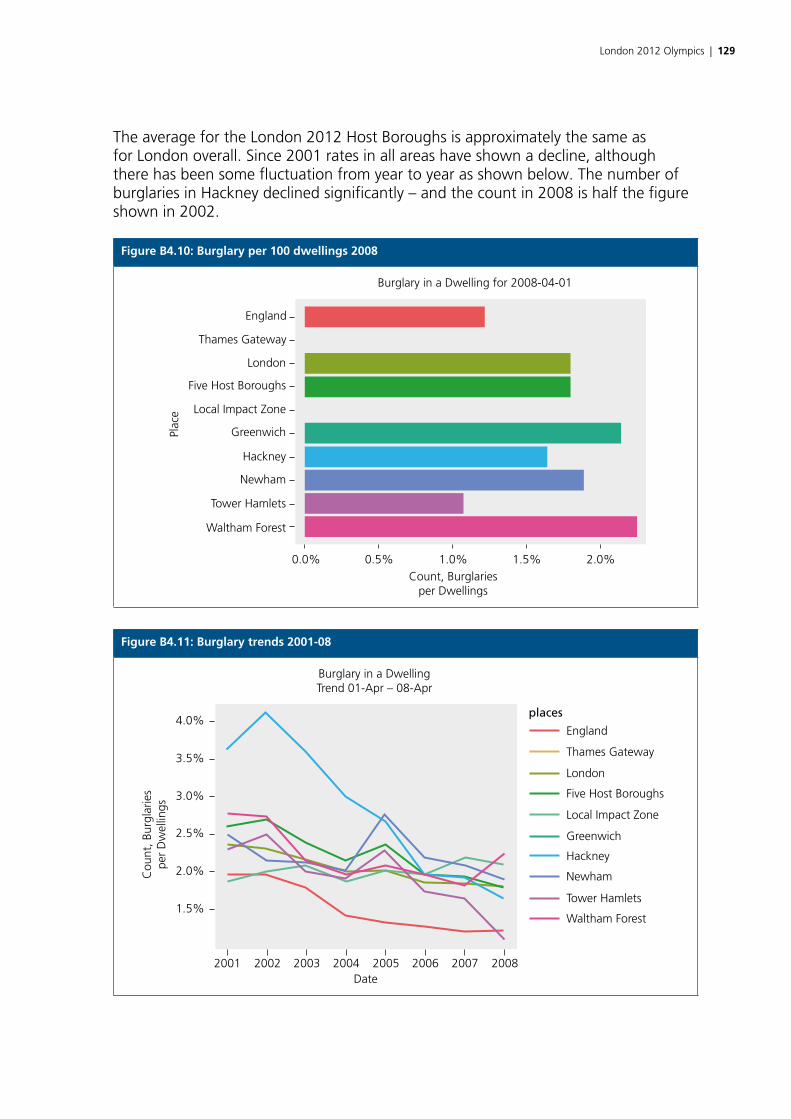
London 2012 Olympics | 129
The average for the London 2012 Host Boroughs is approximately the same as for London overall. Since 2001 rates in all areas have shown a decline, although there has been some fluctuation from year to year as shown below. The number of burglaries in Hackney declined significantly – and the count in 2008 is half the figure shown in 2002.
Figure B4.10: Burglary per 100 dwellings 2008
Waltham Forest
0.0%
Tower Hamlets
Newham
Hackney
GreenwichPlac
e Local Impact Zone
Five Host Boroughs
London
Thames Gateway
England
0.5% 1.0%Count, Burglaries
per Dwellings
1.5% 2.0%
Burglary in a Dwelling for 2008-04-01
Figure B4.11: Burglary trends 2001-08
England
places
Thames Gateway
London
Five Host Boroughs
Local Impact Zone
Greenwich
Hackney
Newham
Tower Hamlets
Waltham Forest1.5%
2001 2002 2003 2004Date
2005 2006 2007 2008
2.0%
2.5%
3.0%
3.5%
4.0%
Cou
nt, B
urgl
arie
spe
r D
wel
lings
Burglary in a DwellingTrend 01-Apr – 08-Apr
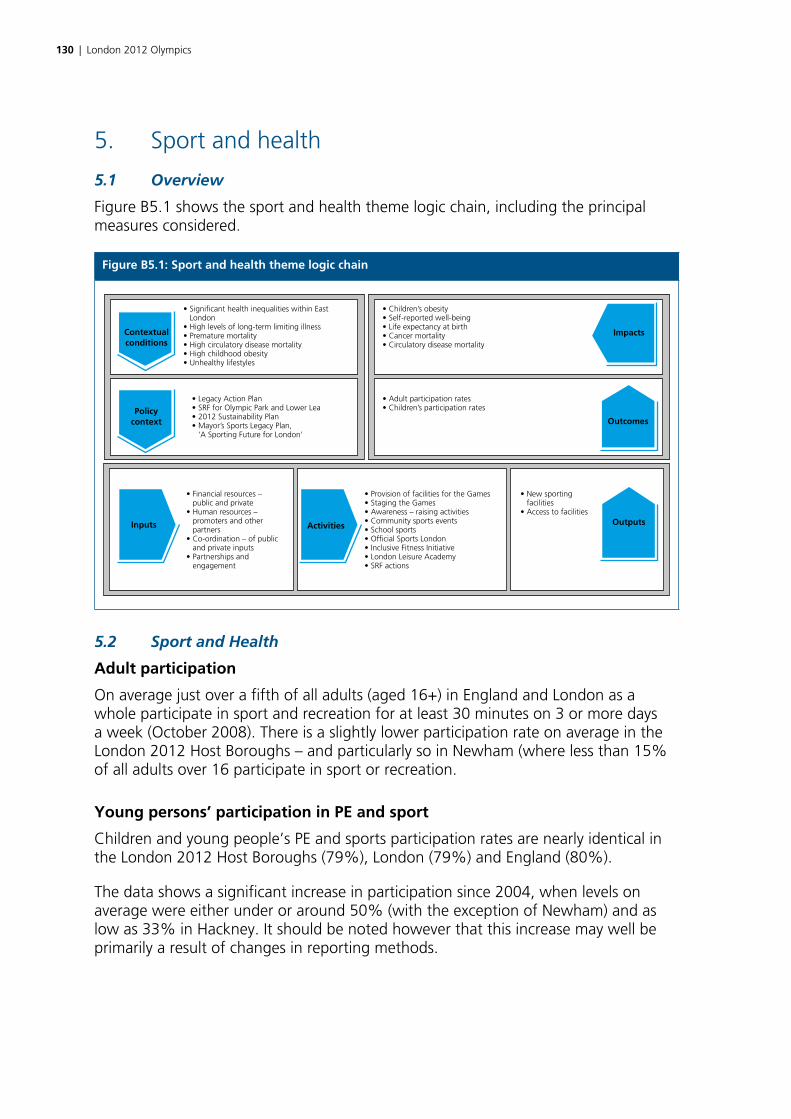
130 | London 2012 Olympics
5. Sport and health
5.1 Overview
Figure B5.1 shows the sport and health theme logic chain, including the principal measures considered.
Figure B5.1: Sport and health theme logic chain
• Significant health inequalities within East London• High levels of long-term limiting illness• Premature mortality• High circulatory disease mortality• High childhood obesity• Unhealthy lifestyles
Contextualconditions
Policycontext
Inputs Activities
• Legacy Action Plan• SRF for Olympic Park and Lower Lea• 2012 Sustainability Plan• Mayor’s Sports Legacy Plan, ‘A Sporting Future for London’
• Financial resources – public and private• Human resources – promoters and other partners• Co-ordination – of public and private inputs• Partnerships and engagement
• Children’s obesity• Self-reported well-being• Life expectancy at birth• Cancer mortality• Circulatory disease mortality
• Adult participation rates• Children’s participation rates
• Provision of facilities for the Games• Staging the Games• Awareness – raising activities• Community sports events• School sports• Official Sports London• Inclusive Fitness Initiative• London Leisure Academy• SRF actions
• New sporting facilities• Access to facilities
Outputs
Outcomes
Impacts
5.2 Sport and Health
Adult participation
On average just over a fifth of all adults (aged 16+) in England and London as a whole participate in sport and recreation for at least 30 minutes on 3 or more days a week (October 2008). There is a slightly lower participation rate on average in the London 2012 Host Boroughs – and particularly so in Newham (where less than 15% of all adults over 16 participate in sport or recreation.
Young persons’ participation in PE and sport
Children and young people’s PE and sports participation rates are nearly identical in the London 2012 Host Boroughs (79%), London (79%) and England (80%).
The data shows a significant increase in participation since 2004, when levels on average were either under or around 50% (with the exception of Newham) and as low as 33% in Hackney. It should be noted however that this increase may well be primarily a result of changes in reporting methods.
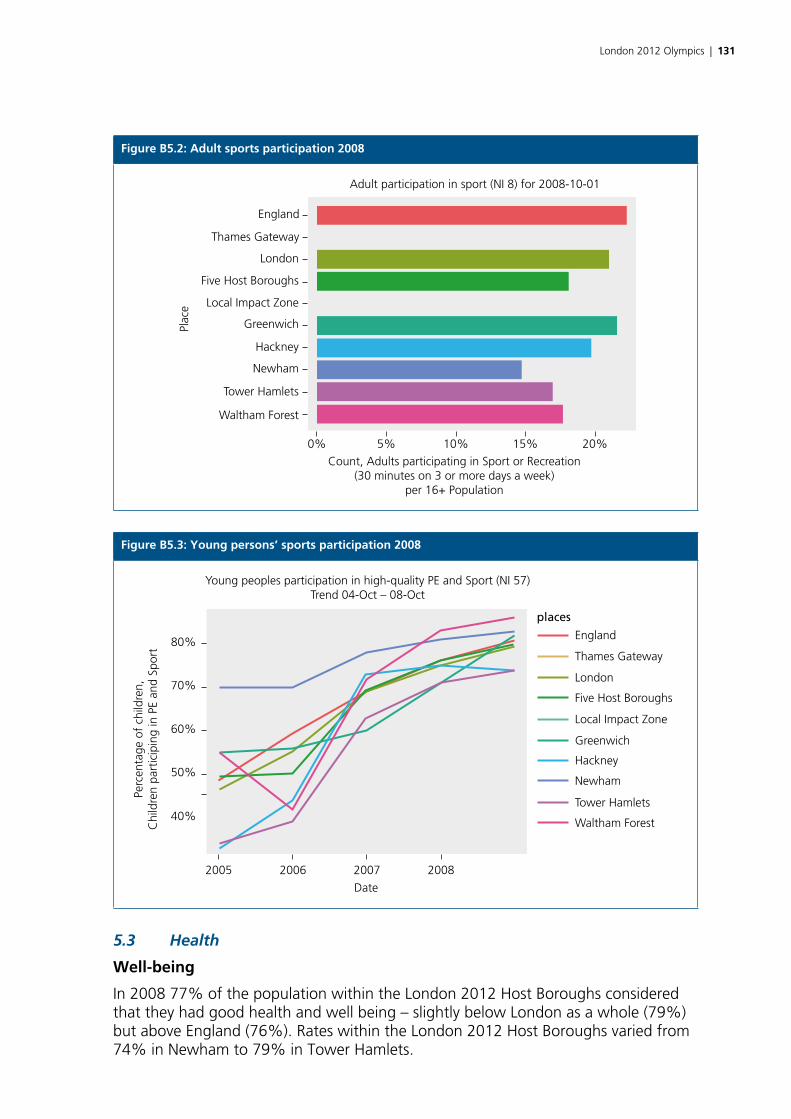
London 2012 Olympics | 131
Figure B5.2: Adult sports participation 2008
Waltham Forest
0% 5% 10% 15% 20%
Tower Hamlets
Newham
Hackney
Local Impact Zone
Greenwich
Five Host Boroughs
London
Thames Gateway
England
Adult participation in sport (NI 8) for 2008-10-01Pl
ace
Count, Adults participating in Sport or Recreation(30 minutes on 3 or more days a week)
per 16+ Population
Figure B5.3: Young persons’ sports participation 2008
England
places
Young peoples participation in high-quality PE and Sport (NI 57)Trend 04-Oct – 08-Oct
Thames Gateway
London
Five Host Boroughs
Local Impact Zone
Greenwich
Hackney
Newham
Tower Hamlets
Waltham Forest
80%
70%
Perc
enta
ge o
f ch
ildre
n,C
hild
ren
part
icip
ing
in P
E an
d Sp
ort
60%
50%
40%
200820072006
Date
2005
5.3 Health
Well-being
In 2008 77% of the population within the London 2012 Host Boroughs considered that they had good health and well being – slightly below London as a whole (79%) but above England (76%). Rates within the London 2012 Host Boroughs varied from 74% in Newham to 79% in Tower Hamlets.
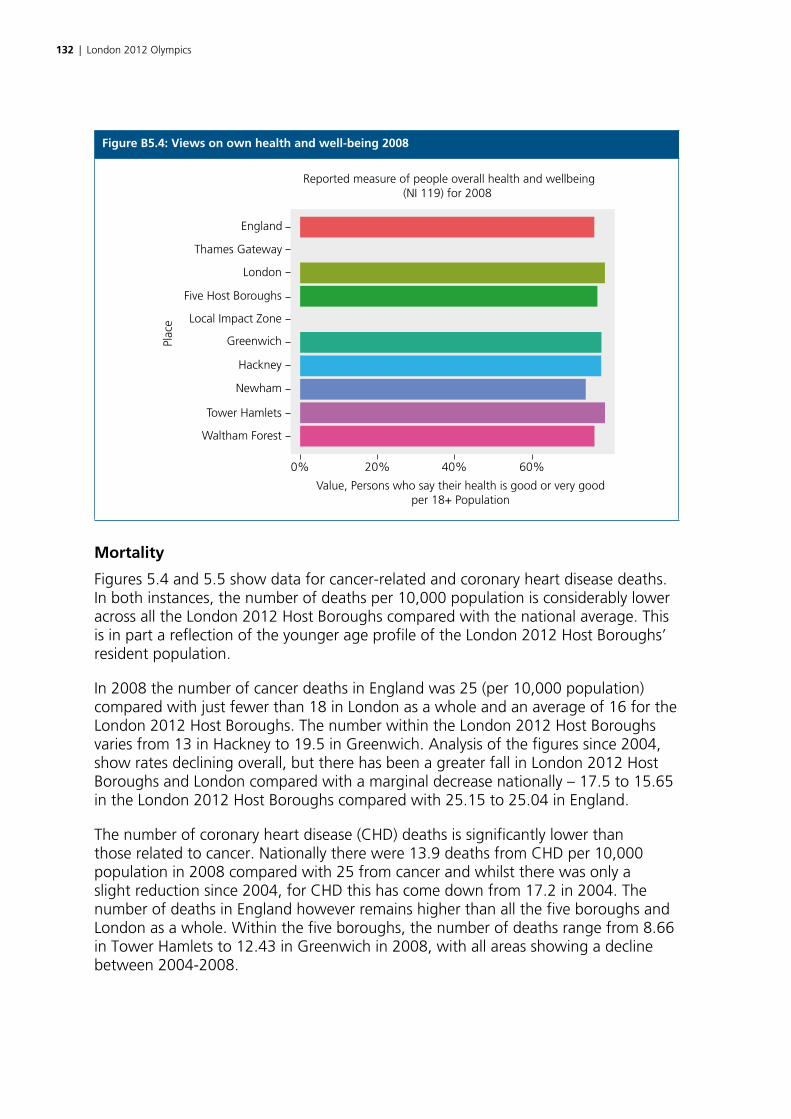
132 | London 2012 Olympics
Figure B5.4: Views on own health and well-being 2008
Waltham Forest
0% 20% 40% 60%
Tower Hamlets
Newham
Hackney
Local Impact Zone
Greenwich
Five Host Boroughs
London
Thames Gateway
England
Plac
e
Value, Persons who say their health is good or very goodper 18+ Population
Reported measure of people overall health and wellbeing(NI 119) for 2008
Mortality
Figures 5.4 and 5.5 show data for cancer-related and coronary heart disease deaths. In both instances, the number of deaths per 10,000 population is considerably lower across all the London 2012 Host Boroughs compared with the national average. This is in part a reflection of the younger age profile of the London 2012 Host Boroughs’ resident population.
In 2008 the number of cancer deaths in England was 25 (per 10,000 population) compared with just fewer than 18 in London as a whole and an average of 16 for the London 2012 Host Boroughs. The number within the London 2012 Host Boroughs varies from 13 in Hackney to 19.5 in Greenwich. Analysis of the figures since 2004, show rates declining overall, but there has been a greater fall in London 2012 Host Boroughs and London compared with a marginal decrease nationally – 17.5 to 15.65 in the London 2012 Host Boroughs compared with 25.15 to 25.04 in England.
The number of coronary heart disease (CHD) deaths is significantly lower than those related to cancer. Nationally there were 13.9 deaths from CHD per 10,000 population in 2008 compared with 25 from cancer and whilst there was only a slight reduction since 2004, for CHD this has come down from 17.2 in 2004. The number of deaths in England however remains higher than all the five boroughs and London as a whole. Within the five boroughs, the number of deaths range from 8.66 in Tower Hamlets to 12.43 in Greenwich in 2008, with all areas showing a decline between 2004-2008.
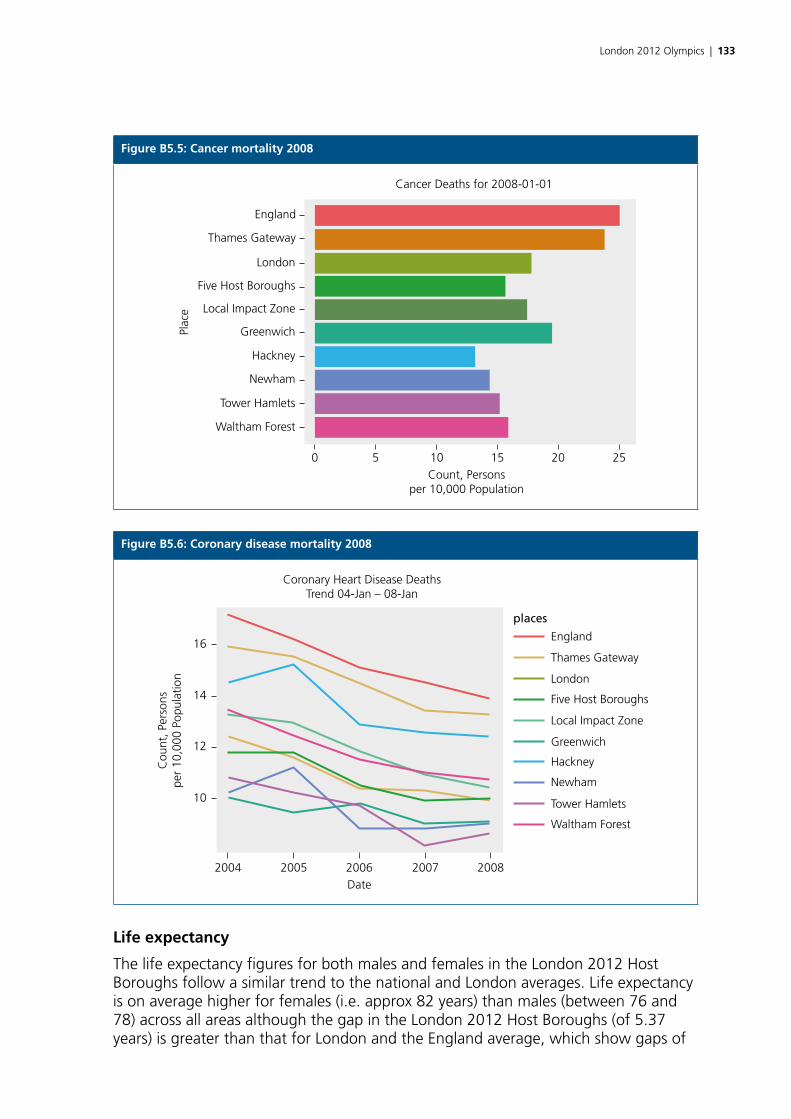
London 2012 Olympics | 133
Figure B5.5: Cancer mortality 2008
Waltham Forest
0 105 15 20 25
Tower Hamlets
Newham
Hackney
Local Impact Zone
Greenwich
Five Host Boroughs
London
Thames Gateway
England
Plac
e
Count, Personsper 10,000 Population
Cancer Deaths for 2008-01-01
Figure B5.6: Coronary disease mortality 2008
England
places
Thames Gateway
London
Five Host Boroughs
Local Impact Zone
Greenwich
Hackney
Newham
Tower Hamlets
Waltham Forest
2004
10
Cou
nt, P
erso
nspe
r 10
,000
Pop
ulat
ion
12
14
16
2005 2006Date
Coronary Heart Disease DeathsTrend 04-Jan – 08-Jan
2007 2008
Life expectancy
The life expectancy figures for both males and females in the London 2012 Host Boroughs follow a similar trend to the national and London averages. Life expectancy is on average higher for females (i.e. approx 82 years) than males (between 76 and 78) across all areas although the gap in the London 2012 Host Boroughs (of 5.37 years) is greater than that for London and the England average, which show gaps of
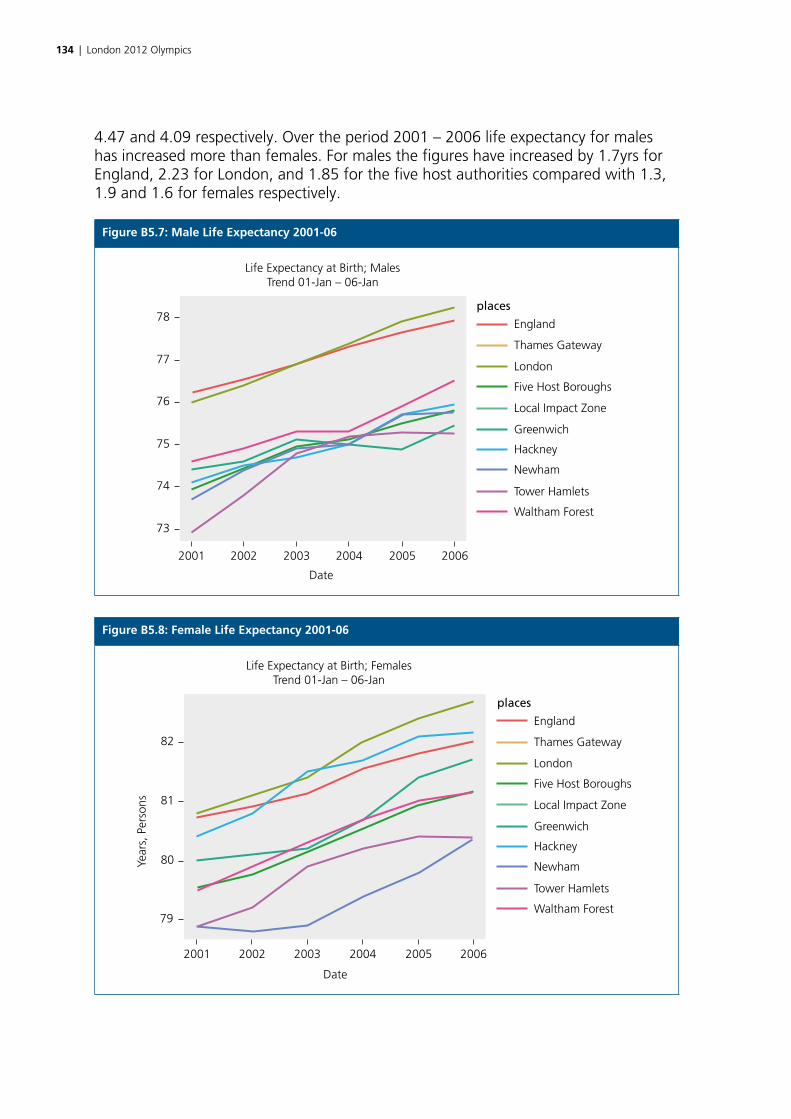
134 | London 2012 Olympics
4.47 and 4.09 respectively. Over the period 2001 – 2006 life expectancy for males has increased more than females. For males the figures have increased by 1.7yrs for England, 2.23 for London, and 1.85 for the five host authorities compared with 1.3, 1.9 and 1.6 for females respectively.
Figure B5.7: Male Life Expectancy 2001-06
England
places
Thames Gateway
London
Five Host Boroughs
Local Impact Zone
Greenwich
Hackney
Newham
Tower Hamlets
Waltham Forest
2001 2002 2003
Date
Life Expectancy at Birth; MalesTrend 01-Jan – 06-Jan
2004 2005 2006
78
77
76
75
74
73
Figure B5.8: Female Life Expectancy 2001-06
England
places
Thames Gateway
London
Five Host Boroughs
Local Impact Zone
Greenwich
Hackney
Newham
Tower Hamlets
Waltham Forest
82
81
80
79
2001 2002 2003
Date
Life Expectancy at Birth; FemalesTrend 01-Jan – 06-Jan
2004 2005 2006
Year
s, P
erso
ns

London 2012 Olympics | 135
Children’s obesity
The percentage of primary school children (in Year 6) classed as obese is higher in the London 2012 Host Boroughs compared with England and the figure provided in 2008 for London as a whole. On average just under a quarter of Year 6 children in the London 2012 Host Boroughs (24%) were categorized as obese – which is 6% higher than the national average of 18%.
Figure B5.9: Obesity: % of Year 6 children 2008
Waltham Forest
0% 5% 10% 15% 20% 25%
Tower Hamlets
Newham
Hackney
Local Impact Zone
Plac
e
Greenwich
Five Host Boroughs
London
Thames Gateway
England
Percent, Proportion of Year 6 children who are obese
Obesity in primary school age children in Year 6 (NI 56) for 2008-10-01
6. Conclusion
To conclude the baseline analysis section of the study, it is necessary to note a number of significant points, including:
• Firstly, the interaction between some of the indicators will be quite complex, particularly concerning housing and labour markets, so care needs to be taken in the interpretation of changes and their causal inter-relationships.
• The policy context has changed significantly since the 2003 baseline position, and the availability of some indicators will reflect these changes. For example, there have been changes to the way in which government collects data on educational attainment, volunteering and community cohesion indicators, so future updates to some of the indicators mentioned in this baseline assessment may require new data collection exercises.
• This baseline assessment does not address the question as to who benefits from the Games and to what extent, partly due to the absence of beneficiary survey data available. It also does not include a baseline for some of the impacts that will require a more qualitative assessment. This second point is less of a concern, because it can be assessed retrospectively, and because the starting point for place-making, design and architectural quality was virtually zero because much of the Park was a brownfield site or occupied by low-intensity uses.

ISBN 978-1-4098-3168-6 9 7 8 1 4 0 9 8 3 1 6 8 6
ISBN 978-1-4098-3168-6
Related Documents