LOGISTICS-PRODUCTION, LOGISTICS-MARKETING AND EXTERNAL INTEGRATION: THEIR IMPACT ON PERFORMANCE CRISTINA GIMÉNEZ † EVA VENTURA † GREL-IET; Universitat Pompeu Fabra * Abstract Highly competitive environments are leading companies to implement Supply Chain Management (SCM) to improve performance and gain a competitive advantage. SCM involves integration, co-ordination and collaboration across organisations and throughout the supply chain. It means that SCM requires internal (intraorganisational) and external (interorganisational) integration. This paper examines the Logistics-Production and Logistics-Marketing interfaces and their relation with the external integration process. The study also investigates the causal impact of these internal and external relationships on the company’s logistical service performance. To analyse this, an empirical study was conducted in the Spanish Fast Moving Consumer Goods (FMCG) sector. Keywords Logistics integration processes; Internal and external integration; Logistics performance JEL codes: L290,L660,C120,C490 † The authors thank the members of GREL-IET for their comments and suggestions. Eva Ventura acknowledges financial support from research grants SEC2001-0769 and BEC2000-0983. * Address for corresponding author: Cristina Giménez Thomsen. Departament d’Economia I Empresa. UPF. Ramon Trias Fargas, 25-27, 08005 Barcelona, Spain. Phone: 34-935422901. Fax: 34-935421746. E-mail: [email protected] .

Welcome message from author
This document is posted to help you gain knowledge. Please leave a comment to let me know what you think about it! Share it to your friends and learn new things together.
Transcript
LOGISTICS-PRODUCTION, LOGISTICS-MARKETING AND
EXTERNAL INTEGRATION: THEIR IMPACT ON PERFORMANCE
CRISTINA GIMÉNEZ†
EVA VENTURA†
GREL-IET; Universitat Pompeu Fabra*
Abstract
Highly competitive environments are leading companies to implement SupplyChain Management (SCM) to improve performance and gain a competitiveadvantage. SCM involves integration, co-ordination and collaboration acrossorganisations and throughout the supply chain. It means that SCM requiresinternal (intraorganisational) and external (interorganisational) integration.
This paper examines the Logistics-Production and Logistics-Marketing interfacesand their relation with the external integration process. The study also investigatesthe causal impact of these internal and external relationships on the company’slogistical service performance.
To analyse this, an empirical study was conducted in the Spanish Fast MovingConsumer Goods (FMCG) sector.
KeywordsLogistics integration processes; Internal and external integration; Logistics performance
JEL codes: L290,L660,C120,C490
† The authors thank the members of GREL-IET for their comments and suggestions. Eva Ventura acknowledges financial
support from research grants SEC2001-0769 and BEC2000-0983.
* Address for corresponding author: Cristina Giménez Thomsen. Departament d’Economia I Empresa. UPF. Ramon Trias
Fargas, 25-27, 08005 Barcelona, Spain. Phone: 34-935422901. Fax: 34-935421746. E-mail: [email protected].
2
1 Introduction
Interest in Supply Chain Management (SCM) has steadily increased since the 1980’s, when
firms saw the benefits that could be derived from its implementation. In the literature, we can
find many authors who acknowledge that SCM can improve performance (See Shapiro, 1984;
Ellram & Cooper, 1990; Cooper, 1993; Gustin, Stank & Daugherty, 1994; The Global Research
Team at Michigan State University, 1995; Clark & Hammond, 1997; Christopher, 1998; and
more recently Stank, Keller & Daugherty, 2001; and Gimenez & Ventura, 2002), but very few
studies analyse it empirically (Stank, Keller & Daugherty, 2001; and Gimenez & Ventura, 2002).
SCM is “the integration of key business processes from end user through original suppliers that
provides products, services, and information that add value for customers and other
stakeholders” (Lambert, Cooper & Pagh, 1998). It follows that SCM involves integration, co-
ordination and collaboration across organisations and throughout the supply chain. It means
that SCM requires internal (intraorganisational) and external (interorganisational) integration.
Internal integration has to be studied within the firm’s boundaries. It seeks to eliminate the
traditional functional “silo approaches” and emphasize better coordination among functional
areas. We follow Stock, Greis & Kasarda (1998) and measure the level of internal integration as
the extent to which logistics activities interact with other functional areas. External integration,
on the other hand, has to be studied along the supply chain: It is the integration of the logistics
activities across firm boundaries (Stock, Greis & Kasarda, 1998).
How are firms approaching these integration processes? Stevens (1989) suggests that firms
first integrate internally (coordinating Supply, Production and Distribution) and then, extend the
integration to its supply chain members. We can find companies in different stages of this
integration process: Some companies may have not initiated the integration process yet, others
may have achieved internal integration by coordinating their logistics function with other
functional areas; and, finally, there might be others that have extended the integration process
to their supply chain members.
In this paper we analyse the integration process and the contribution of both levels of integration
(internal and external) to improving firms’ performance. We analyse the impact of internal
integration by considering the interaction among three distinct but related areas: Logistics,
Production and Marketing. We consider these areas for two reasons: first, the coordination
between them is vital to produce and serve what customers demand, how and when they want.
And, second, Logistics is an organizational function which shares responsibilities with Marketing
and Production. Companies were traditionally organised according to two main areas:
Production and Marketing, considering the rest as auxiliary or support functions. Before the
existence of the integrated logistics concept (Supply-Production-Distribution), some of today’s
logistics responsibilities were under the Production or Marketing control. But, when Logistics
3
appeared as an organizational function, some of the Marketing and Production’s responsibilities
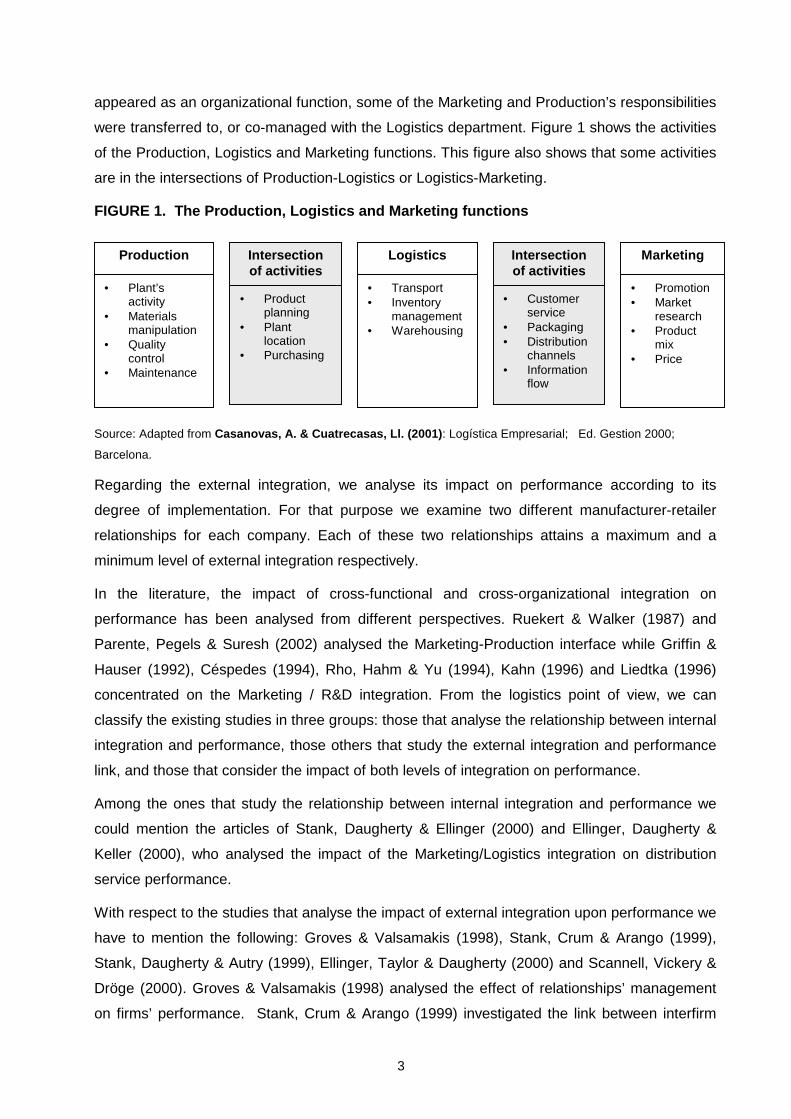
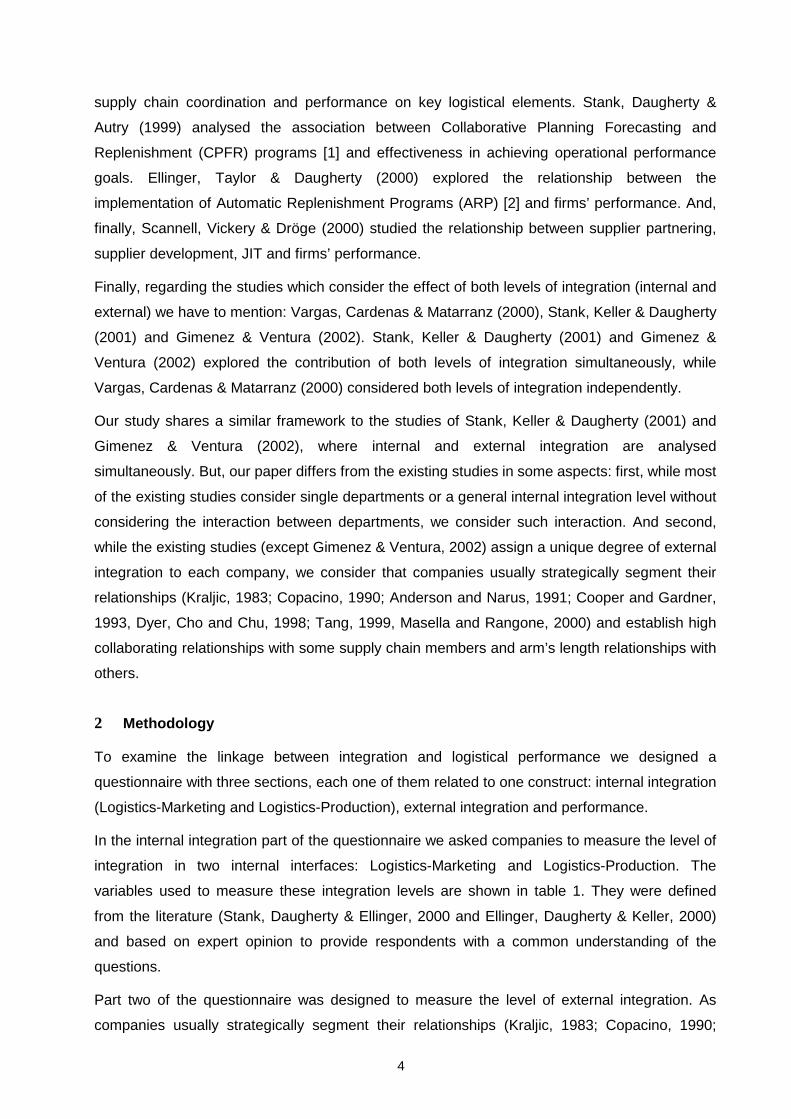
were transferred to, or co-managed with the Logistics department. Figure 1 shows the activities
of the Production, Logistics and Marketing functions. This figure also shows that some activities
are in the intersections of Production-Logistics or Logistics-Marketing.
FIGURE 1. The Production, Logistics and Marketing functions
Source: Adapted from Casanovas, A. & Cuatrecasas, Ll. (2001): Logística Empresarial; Ed. Gestion 2000;
Barcelona.
Regarding the external integration, we analyse its impact on performance according to its
degree of implementation. For that purpose we examine two different manufacturer-retailer
relationships for each company. Each of these two relationships attains a maximum and a
minimum level of external integration respectively.
In the literature, the impact of cross-functional and cross-organizational integration on
performance has been analysed from different perspectives. Ruekert & Walker (1987) and
Parente, Pegels & Suresh (2002) analysed the Marketing-Production interface while Griffin &
Hauser (1992), Céspedes (1994), Rho, Hahm & Yu (1994), Kahn (1996) and Liedtka (1996)
concentrated on the Marketing / R&D integration. From the logistics point of view, we can
classify the existing studies in three groups: those that analyse the relationship between internal
integration and performance, those others that study the external integration and performance
link, and those that consider the impact of both levels of integration on performance.
Among the ones that study the relationship between internal integration and performance we
could mention the articles of Stank, Daugherty & Ellinger (2000) and Ellinger, Daugherty &
Keller (2000), who analysed the impact of the Marketing/Logistics integration on distribution
service performance.
With respect to the studies that analyse the impact of external integration upon performance we
have to mention the following: Groves & Valsamakis (1998), Stank, Crum & Arango (1999),
Stank, Daugherty & Autry (1999), Ellinger, Taylor & Daugherty (2000) and Scannell, Vickery &
Dröge (2000). Groves & Valsamakis (1998) analysed the effect of relationships’ management
on firms’ performance. Stank, Crum & Arango (1999) investigated the link between interfirm
Production
• Plant’sactivity
• Materialsmanipulation
• Qualitycontrol
• Maintenance
Logistics
• Transport• Inventory
management• Warehousing
Marketing
• Promotion• Market
research• Product
mix• Price
Intersectionof activities
• Productplanning
• Plantlocation
• Purchasing
Intersectionof activities
• Customerservice
• Packaging• Distribution
channels• Information
flow
4
supply chain coordination and performance on key logistical elements. Stank, Daugherty &
Autry (1999) analysed the association between Collaborative Planning Forecasting and
Replenishment (CPFR) programs [1] and effectiveness in achieving operational performance
goals. Ellinger, Taylor & Daugherty (2000) explored the relationship between the
implementation of Automatic Replenishment Programs (ARP) [2] and firms’ performance. And,
finally, Scannell, Vickery & Dröge (2000) studied the relationship between supplier partnering,
supplier development, JIT and firms’ performance.
Finally, regarding the studies which consider the effect of both levels of integration (internal and
external) we have to mention: Vargas, Cardenas & Matarranz (2000), Stank, Keller & Daugherty
(2001) and Gimenez & Ventura (2002). Stank, Keller & Daugherty (2001) and Gimenez &
Ventura (2002) explored the contribution of both levels of integration simultaneously, while
Vargas, Cardenas & Matarranz (2000) considered both levels of integration independently.
Our study shares a similar framework to the studies of Stank, Keller & Daugherty (2001) and
Gimenez & Ventura (2002), where internal and external integration are analysed
simultaneously. But, our paper differs from the existing studies in some aspects: first, while most
of the existing studies consider single departments or a general internal integration level without
considering the interaction between departments, we consider such interaction. And second,
while the existing studies (except Gimenez & Ventura, 2002) assign a unique degree of external
integration to each company, we consider that companies usually strategically segment their
relationships (Kraljic, 1983; Copacino, 1990; Anderson and Narus, 1991; Cooper and Gardner,
1993, Dyer, Cho and Chu, 1998; Tang, 1999, Masella and Rangone, 2000) and establish high
collaborating relationships with some supply chain members and arm’s length relationships with
others.
2 Methodology
To examine the linkage between integration and logistical performance we designed a
questionnaire with three sections, each one of them related to one construct: internal integration
(Logistics-Marketing and Logistics-Production), external integration and performance.
In the internal integration part of the questionnaire we asked companies to measure the level of
integration in two internal interfaces: Logistics-Marketing and Logistics-Production. The
variables used to measure these integration levels are shown in table 1. They were defined
from the literature (Stank, Daugherty & Ellinger, 2000 and Ellinger, Daugherty & Keller, 2000)
and based on expert opinion to provide respondents with a common understanding of the
questions.
Part two of the questionnaire was designed to measure the level of external integration. As
companies usually strategically segment their relationships (Kraljic, 1983; Copacino, 1990;
5
Anderson and Narus, 1991; Cooper and Gardner, 1993, Dyer, Cho and Chu, 1998; Tang, 1999,
Masella and Rangone, 2000), we decided to measure the level of integration in two
manufacturer-retailer relationships: the most collaborating relationship and the least
collaborating one. The variables used to measure these external integration levels are also
shown in table 1. These variables were designed adapting the internal integration variables
used by Stank, Daugherty & Ellinger (2000) and Ellinger, Daugherty & Keller (2000) to a supply
chain relationship.
TABLE 1. Variables in the questionnaire
VARIABLES
Internal Integration (scale of 1 to 10)
II1 (IILP1 or IILM1): Informal teamwork
II2 (IILP2 or IILM2): Shared ideas, information and other resources
II3 (IILP3 or IILM3): Established teamwork
II4 (IILP4 or IILM4): Joint planning to anticipate and resolve operative problems
II5 (IILP5 or IILM5): Joint establishment of objectives
II6 (IILP6 or IILM6): Joint development of the responsibilities’ understanding
II7 (IILP7 or IILM7): Joint decisions about ways to improve cost efficiencies
External Integration (scale of 1 to 10)
EI1: Informal teamwork
EI2: Shared information about sales forecasts, sales and stock levels
EI3: Joint development of logistics processes
EI4: Established work team for the implementation and development of continuous replenishmentprogram (CRP) or other ECR practice
EI5: Joint planning to anticipate and resolve operative problems
EI6: Joint establishment of objectives
EI7: Joint development of the responsibilities’ understanding
EI8: Joint decisions about ways to improve cost efficiencies
Absolute Performance (scale of 1 to 10)
AP1: My company has achieved a reduction in the cost-to-serve this customer
AP2: My company has achieved cost reductions in the transport to this customer
AP3: My company has achieved cost reductions in the order process of this customer
AP4: My company has achieved stock-out reductions in the products this customer buys
AP5: My company has achieved a lead time reduction for this customer
Performance variables are also shown in table 1. These variables were designed according to
the literature and the results of an exploratory study (Gimenez, 2000), which showed that the
benefits associated to Efficient Consumer Response (ECR) [3] were service improvements and
costs and stock-outs reductions. As performance data was difficult to obtain because of the
reticence of participants to give confidential data, performance in this study was operationalised
by using senior management’s perceptions of performance improvements. In order to analyse
the integration-performance link, performance had to be related to the external integration level
achieved in each relationship.
6
Questions were designed using a ten point Likert scale. The survey instrument was pre-tested
at meetings with several experts, and, suggestions for rewording and repositioning were
incorporated into the final survey instrument.
Potential participants were identified from a Spanish companies’ database (Fomento de la
Producción 25.000 database). Manufacturers from the food and perfumery-detergent sectors
with a sales figure higher than 30 million euros were selected to make up the sample (199
companies).
As prenotification increases the response rate (Fox, Crask & Kim, 1988), all the companies in
the sample were telephoned before mailing the questionnaire. We informed each company’s
Logistics or Supply Chain Director about the study, and only one company refused to participate
in the survey. The 64 questionnaires received represent a 32,3% (64/198) response rate, which
is considered very satisfactory, as potential participants were asked to provide sensitive and
confidential data about their performance. Other similar studies have worked with a lower
response rate; for example, Groves & Valsamakis (1998) achieved a response rate of 15%;
Stank, Daugherty & Autry (1999) a 20,2%, and Stank, Keller & Daugherty (2001) a 11,5%.
We conducted an analysis of non-response bias based on the procedure described by
Armstrong & Overton (1977) and Lambert & Harrington (1990). We numbered the responses
sequentially in the order they were received and compared late responses with early responses
to all model variables using T-tests. We did not find any noticeable pattern among the variables
that could indicate the existence of a non-response bias.
3 Model specification
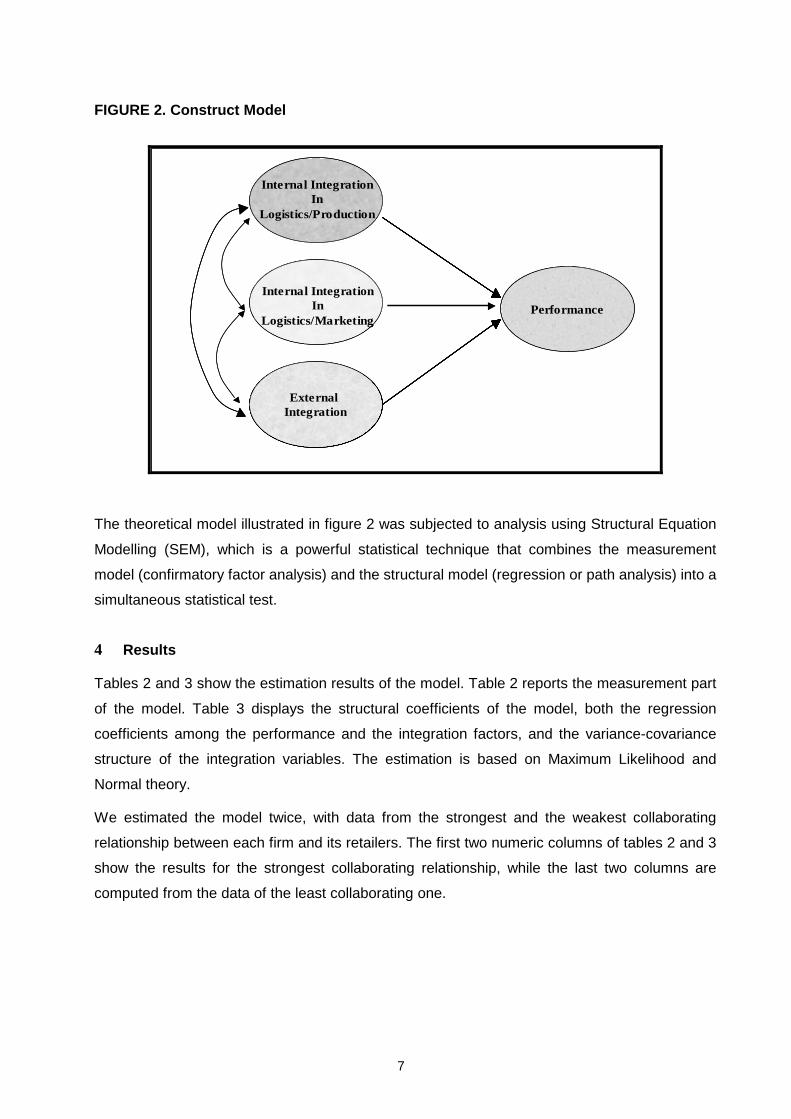
The proposed structural model is shown in figure 2. There are four latent variables or factors:
internal integration in the Logistics-Production interface, internal integration in the
Logistics-Marketing interface, external integration, and firm’s performance. Both internal
integration and external integration affect firm’s performance. Also, internal integration (in the
Logistics-Production and Logistics-Marketing interfaces) is thought to be correlated among each
other and with external integration.
These factors are not observed directly. Instead, we use several measurement variables as
shown in Table 1. The complete model combines a construct part and a measurement part. It is
a simple factor analysis model that can be easily estimated with a program such as EQS [4]
(see Bentler, 1995).
7
FIGURE 2. Construct Model
External Integration
Internal IntegrationIn
Logistics/Production
PerformanceInternal Integration
InLogistics/Marketing
External Integration
Internal IntegrationIn
Logistics/Production
PerformanceInternal Integration
InLogistics/Marketing
The theoretical model illustrated in figure 2 was subjected to analysis using Structural Equation
Modelling (SEM), which is a powerful statistical technique that combines the measurement
model (confirmatory factor analysis) and the structural model (regression or path analysis) into a
simultaneous statistical test.
4 Results
Tables 2 and 3 show the estimation results of the model. Table 2 reports the measurement part
of the model. Table 3 displays the structural coefficients of the model, both the regression
coefficients among the performance and the integration factors, and the variance-covariance
structure of the integration variables. The estimation is based on Maximum Likelihood and
Normal theory.
We estimated the model twice, with data from the strongest and the weakest collaborating
relationship between each firm and its retailers. The first two numeric columns of tables 2 and 3
show the results for the strongest collaborating relationship, while the last two columns are
computed from the data of the least collaborating one.
8
4.1 Measurement part of the model
In the logistics discipline, researchers are calling for future research to have a stronger
theoretical foundation and to focus on theory testing research (Mentzer & Kahn, 1995; Mentzer
& Flint, 1997 and Garver & Mentzer, 1999). To increase rigor in testing for construct validity,
Garver & Mentzer (1999) pointed out that SEM is a very useful statistical instrument. Garver &
Mentzer (1999) also advised performing and reporting all kinds of construct validity tests “to give
the reader a greater level of confidence in the research findings”. Following them, we
performed some exploratory and confirmatory factor analysis before attempting the estimation
of the complete model. Such analysis advised discarding the first proposed measure of internal
integration in the Logistics-Production interface, since we detected two different factors
associated with it. The rest of the measures were judged appropriate in the light of the results of
most of the tests suggested by Garver and Mentzer. Those are reported in table A2, in the
appendix.
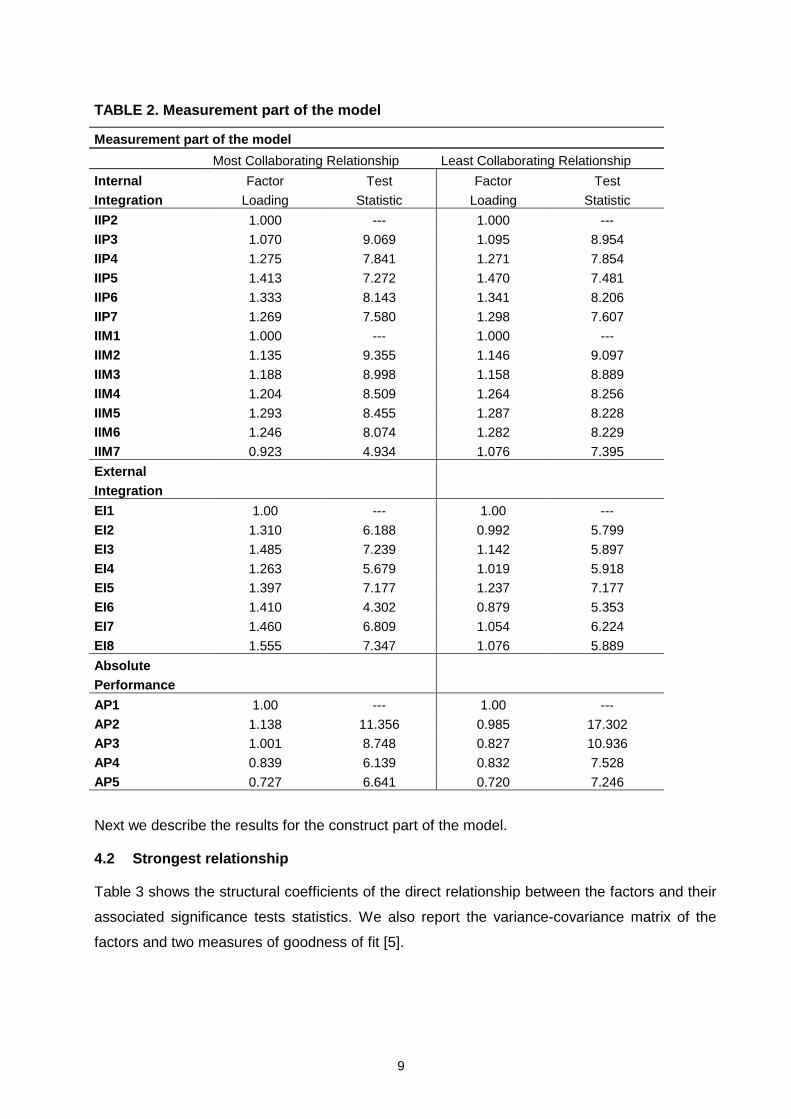
Table 2 shows the loading coefficients between the factors and their respective measurement
variables. To fix the scale, the loading of the first measure for each factor is set to one. The rest
of the loading coefficients are always close to unity, and all of them are highly significant. Their
values are very similar regardless of the fact that they have been estimated with data from the
strongest or the weakest collaborating relationship.
9
TABLE 2. Measurement part of the model
Measurement part of the model
Most Collaborating Relationship Least Collaborating Relationship
InternalIntegration
Factor
Loading
Test
Statistic
Factor
Loading
Test
Statistic
IIP2 1.000 --- 1.000 ---
IIP3 1.070 9.069 1.095 8.954
IIP4 1.275 7.841 1.271 7.854
IIP5 1.413 7.272 1.470 7.481
IIP6 1.333 8.143 1.341 8.206
IIP7 1.269 7.580 1.298 7.607IIM1 1.000 --- 1.000 ---
IIM2 1.135 9.355 1.146 9.097
IIM3 1.188 8.998 1.158 8.889
IIM4 1.204 8.509 1.264 8.256
IIM5 1.293 8.455 1.287 8.228IIM6 1.246 8.074 1.282 8.229
IIM7 0.923 4.934 1.076 7.395
ExternalIntegration
EI1 1.00 --- 1.00 ---
EI2 1.310 6.188 0.992 5.799
EI3 1.485 7.239 1.142 5.897
EI4 1.263 5.679 1.019 5.918EI5 1.397 7.177 1.237 7.177
EI6 1.410 4.302 0.879 5.353
EI7 1.460 6.809 1.054 6.224
EI8 1.555 7.347 1.076 5.889
AbsolutePerformance
AP1 1.00 --- 1.00 ---
AP2 1.138 11.356 0.985 17.302AP3 1.001 8.748 0.827 10.936
AP4 0.839 6.139 0.832 7.528
AP5 0.727 6.641 0.720 7.246 Next we describe the results for the construct part of the model.
4.2 Strongest relationship
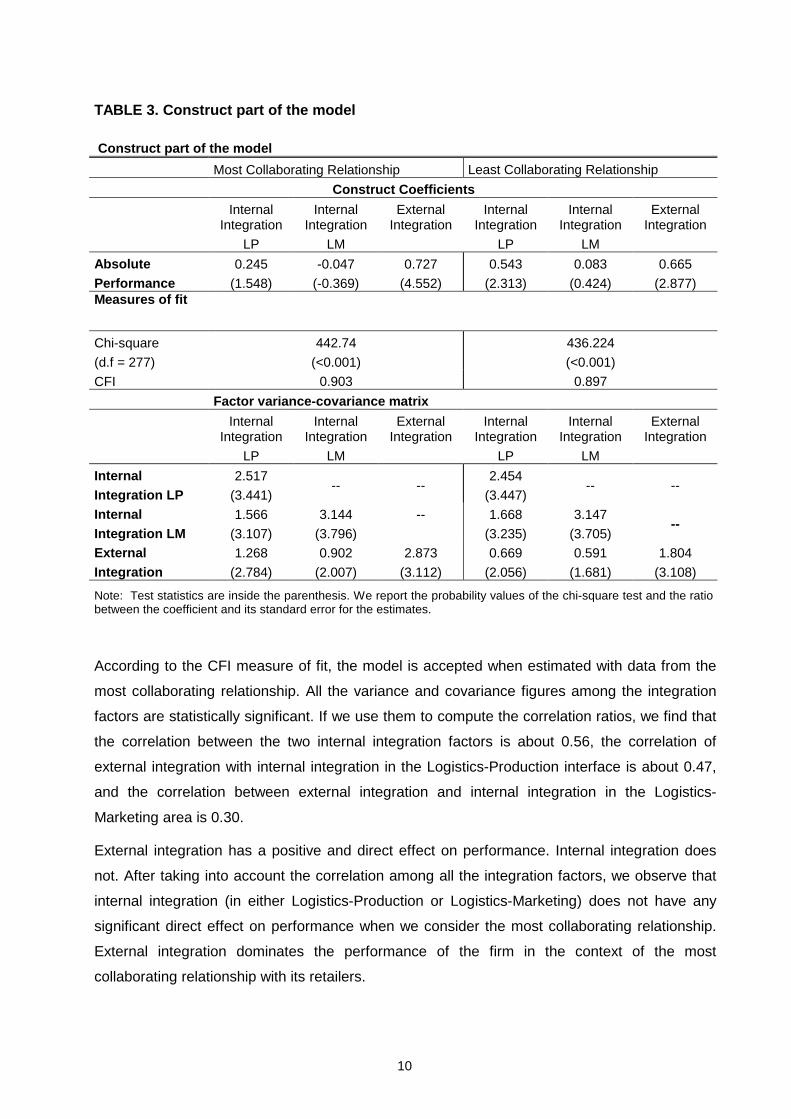
Table 3 shows the structural coefficients of the direct relationship between the factors and their
associated significance tests statistics. We also report the variance-covariance matrix of the
factors and two measures of goodness of fit [5].
10
TABLE 3. Construct part of the model Construct part of the model
Most Collaborating Relationship Least Collaborating Relationship
Construct Coefficients
InternalIntegration
LP
InternalIntegration
LM
ExternalIntegration
InternalIntegration
LP
InternalIntegration
LM
ExternalIntegration
AbsolutePerformance
0.245
(1.548)
-0.047
(-0.369)
0.727
(4.552)
0.543
(2.313)
0.083
(0.424)
0.665
(2.877)Measures of fit
Chi-square
(d.f = 277)
CFI
442.74
(<0.001)
0.903
436.224
(<0.001)
0.897
Factor variance-covariance matrix
InternalIntegration
LP
InternalIntegration
LM
ExternalIntegration
InternalIntegration
LP
InternalIntegration
LM
ExternalIntegration
InternalIntegration LP
2.517
(3.441)-- --
2.454
(3.447)-- --
InternalIntegration LM
1.566
(3.107)
3.144
(3.796)
-- 1.668
(3.235)
3.147
(3.705)--
ExternalIntegration
1.268
(2.784)
0.902
(2.007)
2.873
(3.112)
0.669
(2.056)
0.591
(1.681)
1.804
(3.108)
Note: Test statistics are inside the parenthesis. We report the probability values of the chi-square test and the ratiobetween the coefficient and its standard error for the estimates.
According to the CFI measure of fit, the model is accepted when estimated with data from the
most collaborating relationship. All the variance and covariance figures among the integration
factors are statistically significant. If we use them to compute the correlation ratios, we find that
the correlation between the two internal integration factors is about 0.56, the correlation of
external integration with internal integration in the Logistics-Production interface is about 0.47,
and the correlation between external integration and internal integration in the Logistics-
Marketing area is 0.30.
External integration has a positive and direct effect on performance. Internal integration does
not. After taking into account the correlation among all the integration factors, we observe that
internal integration (in either Logistics-Production or Logistics-Marketing) does not have any
significant direct effect on performance when we consider the most collaborating relationship.
External integration dominates the performance of the firm in the context of the most
collaborating relationship with its retailers.
11
4.3 Weakest relationship
The results are different when we estimate the model with the data from the least collaborating
relationship.
The fit of the model is a little worse, but very close to the acceptance boundary of 0.9. We
observe now that the covariance between external integration and internal integration in the
Logistics-Marketing interface is not statistically significant. The correlation among the two
factors is 0.248, lower than before. Also, the covariance between internal integration in the
Logistics-Production area and external integration is lower than in the case of the strongest
relationship previously discussed, with a correlation estimate of 0.318. The variance of the
external integration factor is also lower, indicating that all the companies in the data share a low
and similar degree of external integration in their least collaborating relationships with their
retailers. We also observe an interesting difference in the estimated structural regression
coefficients. Now, internal integration in the Logistics-Production interface has a positive and
significant effect on firm’s performance. External integration still has a direct positive effect on
performance, but such effect is weaker than before.
5 Conclusions
There are some generic results that can be derived from this analysis:
• There is a positive relationship between the Logistics-Production integration and external
integration, being higher in the “most collaborating relationship” model. There is also a
positive relationship between the level of integration in the Logistics-Marketing interface
and the level of external integration, but it is marginally significant only for the “most
collaborating relationship” model (it is not statistically significant for the “least
collaborating” model). Despite the existence of these internal-external integration
relationships, we cannot establish a causal relationship. These relationships have to be
understood in the following way: internal integration is necessary for external integration,
but internal integration does not imply external integration. In other words, firms follow
the integration process proposed by Stevens (1989): firms first integrate internally and,
then, extend the integration process to their supply chain members. However, this
integration process is undertaken at different speeds: there are companies which are still
not integrated, others that have only achieved internal integration, and some that have
achieved internal and external integration.
• For the most collaborating relationships (in other words, externally integrated
relationships), there is a higher correlation between Logistics-Production and external
integration than between Logistics-Marketing and external integration. Also, a cluster
analysis showed that there was not any externally integrated relationship in a company
12
not integrated in the Logistics-Production interface. However, this cluster analysis
showed that there were externally integrated relationships in companies not integrated in
the Logistics-Marketing interface. This shows that to achieve external integration
companies need to be integrated in the Logistics-Production interface, while,
interestingly, the integration between Logistics and Marketing is not a prerequisite.
• With respect to the impact of internal integration on performance, we have to distinguish
between the Logistics-Marketing and Logistics-Production interfaces. When companies
achieve a high level of internal integration in the Logistics-Marketing interface, this level
of internal integration does not lead to a better absolute performance. A high level of
collaboration among Logistics and Marketing processes does not contribute to achieving
cost, stock-outs or lead time reductions. This is true for the most and the least
collaborating models. However, when a firm achieves a high level of internal integration
in the Logistics-Production interface, its effect on performance depends on whether
there is, or is not, external integration. The level of Logistics-Production integration leads
to a better absolute performance, in other words, it contributes to achieving cost, stock-
outs and lead time reductions, when there is not external integration. However, when
firms are externally integrated (for the most collaborating relationships), the level of
external integration has such an important effect on performance that it annuls (or
reduces) the effect of the Logistics-Production integration.
• External collaboration among supply chain members contributes to achieving costs,
stock-outs and lead-time reductions. This is true for both models, the most and the least
collaborating.
• The greatest influence on firms’ logistical service performance is for external integration.
However, for the least collaborating relationships, the internal Logistics-Production
integration has also a high impact on distribution performance.
SCM is not easy to set-up: there can be internal barriers to change processes, and there can
also be difficulties to shifting from traditional arms-length or even adversarial attitudes to a
partnership perspective. However, support has been found for a relationship between firms’
logistical performance and SCM.
With respect to the studies mentioned in the literature review, our results confirm that internal
and external integration are correlated and that external integration leads to a better logistical
performance. We add some contributions: we have shown that the impact on performance of
internal integration depends on the functional areas that are being integrated and the level of
external integration. When companies are not externally integrated, we have demonstrated that
the Logistics-Production integration leads to a better absolute performance, while the Logistics-
Marketing integration, interestingly, does not. However, when companies are externally
13
integrated, the level of internal integration in any of the two internal interfaces does not have
any impact on performance.
Our results differ from those obtained by Stank, Daugherty and Ellinger (2000), who found that
companies with high levels of integration between Logistics and Marketing showed higher levels
of logistical service performance (response to customer needs, response to special
requirements and collaboration in new product launches). Further research on the Logistics-
Marketing impact on performance should be carried out and other logistical service measures
should be included in the performance construct. It would also be interesting to compare the
impact of both internal integration levels (Logistics-Production and Logistics-Marketing) on
performance in other industries, as the Logistics-Marketing interface may be more crucial in
other sectors.
Finally, we have to mention that despite our findings, our study has some limitations. One of
them is that we have not considered other important members of the grocery supply chain such
as grocery retailers, Third Party Logistics, manufacturers’ suppliers, etc. We have focused only
on the manufacturer-retailer relationship from the manufacturer point of view. We have only
considered the effect of inter-firm co-ordination from the perspective of the provider (as most
studies do), while satisfaction with service performance should also be assessed from the
customer perspective. To alleviate the concern about the biased performance assessment by
providers, future research should collect data from both sides of the relationship.
14
References
Anderson, J. & Narus, J. (1991) “Partnering as a focused market strategy”, California
Management Review, Spring, pp. 95-113.
Arbuckle, J. (1997), AMOS User’s Guide Version 3.6, Smallwaters Corp., Chicago.
Armstrong, J.S. & Overton, T.S. (1977) “Estimating non-response bias in mail surveys”,
Journal of Marketing Research, Vol 14 No 3, pp. 396- 402.
Bentler, P. M. (1995), EQS Structural Equations Program Manual, Multivariate Software Inc.,
Encino, CA.
Casanovas, A. & Cuatrecasas, Ll. (2001), Logística Empresarial, Ed. Gestion 2000,
Barcelona.
Cespedes, F.V. (1994) “Industrial Marketing: Managing new requirements”, Sloan Management
Review, Vol 52 No 3, pp. 45-60.
Christopher, M. (1998), Logistics and Supply Chain Management: Strategies for reducing cost
and improving service, Financial Times Pitman Publishing, London.
Clark, T.H. & Hammond, J.H. (1997) “Re-engineering channel re-ordering processes to
improve total supply chain performance”, Production and Operations Management, Vol 6 No 3,
pp. 248-265.
Cooper, M.C. & Gardner, J. (1993) “Building good business relationships – More than just
partnering or strategic alliances”, International Journal of Physical Distribution and Logistics
Management, Vol 23 No 6, pp. 14-26.
Cooper, M.C. (1993) “International Supply Chain Management: Implications for the bottom line”,
Proceedings of the Society of Logistics Engineers, Hyattsville, MD.
Copacino, W.C. (1990) “Purchasing strategy for the 90’s”, Traffic Management, Vol 29 No 10,
pp. 67.
Dyer, J.; Cho, D. & Chu, W. (1998) “Strategic supplier segmentation: The next best practice in
supply chain management”, California Management Review, Vol 40 No 2, pp. 57-78.
Ellinger, A.; Daugherty, P. & Keller, S. (2000) “The relationship between marketing/ logistics
interdepartmental integration and performance in U.S. manufacturing firms: An empirical study”,
Journal of Business Logistics, Vol 21 No 1, pp. 1-22.
Ellinger, A.; Taylor, J.C. & Daugherty, P.J. (2000) “Programas de reposición automática y
niveles de involucramiento: Su impacto en la performance”, The International Journal of
Logistics Management, Vol 10 No 1, pp. 29-40.
15
Ellram, L.M. & Cooper, M.C. (1990) “Supply Chain Management, partnerships, and the
shipper-third party relationship”, International Journal of Logistics Management, Vol. 1 No. 2,
pp. 1-10.
Fomento de la Producción (2000), España 25.000 (DataBase), Edition 2000.
Fox, R.; Crask, M. & Kim, J. (1988) “Mail survey response rate: A Metaanalysis of selected
techniques for inducing response”, Public Opinion Quarterly 52, No 1, pp. 467-491.
Garver, M.S. & Mentzer, J.T. (1999) “Logistics Research Methods: Employing Structural
Equation Modelling to test for construct validity”, Journal of Business Logistics, Vol. 20 No. 1,
pp. 33-57.
Gimenez, C. & Ventura, E. (2002) “Supply Chain Management as a competitive advantage in
the Spanish grocery sector”, Working paper No. 641, Universitat Pompeu Fabra. Forthcoming in
the International Journal of Logistics Management.
Gimenez, C. (2000) “Supply Chain Management in the Spanish Grocery Sector”, First World
Conference on Production and Operations Management, POM Sevilla 2000, Sevilla (Spain).
Griffin, A. & Hauser, J.R. (1992) “Patterns of communication among marketing, engineering
and manufacturing – A comparison between two product teams”, Management Science, Vol. 38
No 3, pp. 360-373.
Groves, G. & Valsamakis, V. (1998) “Supplier-customer relationships and company
performance”, The International Journal of Logistics Management, Vol. 9 No 2, pp. 51-63.
Gustin, C.M.; Stank, T.P. & Daugherty, P.J. (1994) “Computerization: Supporting integration”,
The International Journal of Physical Distribution and Logistics Management, Vol. 24 No 1, pp.
11-16.
Jöreskog, K. G. & Sörbom D. (1993), LISREL 8 User’s Reference Guide, Scientific Software
International Inc., Chicago.
Kraljic, P. (1983) “Purchasing must become supply management”, Harvard Business Review,
Vol. 61, pp. 109-117.
Lambert, D.M. & Harrington, T.C. (1990) “Measuring nonresponse in customer service mail
surveys”, Journal of Business Logistics, Vol. 11 No 2, pp. 5-25.
Lambert, D.M.; Cooper, M.C. & Pagh, J.D. (1998) “Supply Chain Management:
Implementation issues and research opportunities”, The International Journal of Logistics
Management, Vol. 9 No 2, pp. 1-19.
Liedtka, J.M. (1996) “Collaborating across lines of business for competitive advantage”,
Academy of Marketing Executive, Vol. 10 No 2, pp. 20-37.
16
Masella, C. & Rangone, A. (2000) “A contingent approach to the design of vendor selection
systems for different types of cooperative customer/supplier”, International Journal of
Operations and Production Management, Vol. 20 No 1, pp. 70-84.
Mentzer, J.T. & Flint, D.J. (1997) “Validity in Logistics Research”, Journal of Business
Logistics, Vol. 18 No 2, pp. 199-216.
Mentzer, J.T. & Kahn, K. (1995) “A framework for Logistics Research”, Journal of Business
Logistics, Vol. 16 No 1, pp. 231-250.
Parente, D.H.; Pegels, C.C. & Suresh, N. (2002) “An exploratory study of the sales-production
relationship and customer satisfaction”, International Journal of Operations & Production
Management, Vol. 22 No 9, pp. 997-1013.
Rho, B.; Hahm, Y. & Yu, Y. (1994) “Improving interface congruence between manufacturing
and marketing in industrial-product manufacturers”, International Journal of Production
Economics, Vol. 37 No 1, pp. 27-40.
Ruekert, R.W. & Walker, O.C. (1987) “Marketing’s interaction with other functional units: A
conceptual framework and empirical evidence”, Journal or Marketing, Vol. 51 No 1, pp. 1-19.
SAS Institute Inc. (1990), SAS Technical Report P-200: CALIS and LOGISTIC Procedures
Release 6.04, SAS Institute Inc., Cary NC.
Scannell, T.V.; Vickery, S.K. & Dröge, C.L. (2000) “Upstream supply chain management and
competitive performance in the automotive supply industry”, Journal of Business Logistics, Vol.
21 No 1, pp. 23-48.
Shapiro, R.D. (1984) “Get leverage from logistics”, Harvard Business Review, Vol. 62 No 3, pp.
119-126.
Stank, T.P.; Crum, M. & Arango, M. (1999) “Benefits of inter-firm coordination in food industry
supply chains”, Journal of Business Logistics, Vol. 20 No 2, pp. 21-41.
Stank, T.P.; Daugherty, P.J. & Autry, C. (1999) “Collaborative planning: Supporting automatic
replenishment programs”, Supply Chain Management, Vol. 4 No 2, pp. 75-85.
Stank, T.P.; Daugherty, P.J. & Ellinger A. (2000) “Integración Marketing/Logística y
performance de la empresa”, The International Journal of Logistics Management, Vol. 10 No 1,
pp. 13-27.
Stank, T.P.; Keller, S. & Daugherty, P. (2001) “Supply chain collaboration & logistical service
performance”, Journal of Business Logistics, Vol. 22 No 1, pp. 29-48.
Stevens, G.C. (1989) “Integrating the supply chain”, International Journal of Physical
Distribution and Materials Management, Vol. 19 No 8, pp. 3-8.
17
Stock, G.N.; Greis, N.P. & Kasarda, J.D. (1998) “Logistics, strategy and structure: A
conceptual framework”, International Journal of Operations and Production Management, Vol.
18 No 1, pp. 37-52.
Tang, C.S. (1999) “Supplier relationship map”, International Journal of Logistics: Research and
Applications, Vol. 2 No 1, pp. 39-56.
The Global Logistics Team at Michigan State University (1995), World Class Logistics: The
challenge of managing continuous change, Council of Logistics Management, Oak Brook,
Illinois.
Vargas, G.; Cardenas, L. & Matarranz, L. (2000) “Internal and external integration of assembly
manufacturing activities”, International Journal of Operations and Production Management, Vol.
20 No 7, pp. 809-822.
18
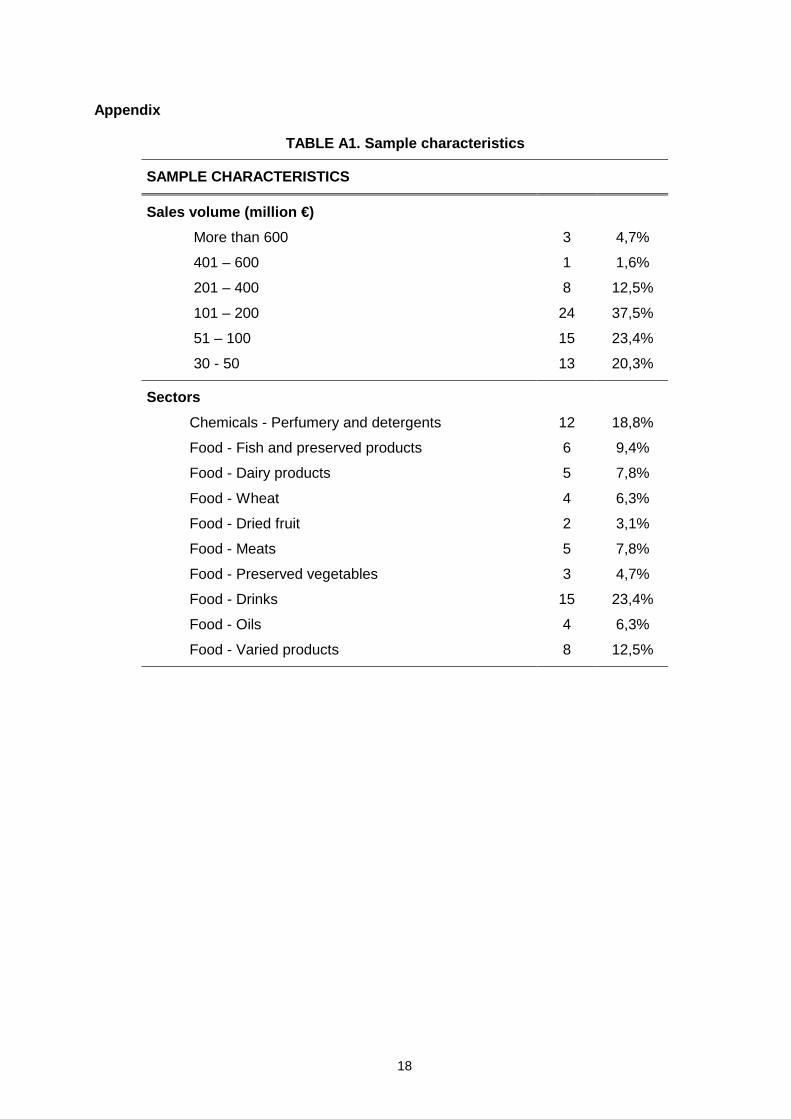
Appendix
TABLE A1. Sample characteristics
SAMPLE CHARACTERISTICS
Sales volume (million €)
More than 600 3 4,7%
401 – 600 1 1,6%
201 – 400 8 12,5%
101 – 200 24 37,5%
51 – 100 15 23,4%
30 - 50 13 20,3%
Sectors
Chemicals - Perfumery and detergents 12 18,8%
Food - Fish and preserved products 6 9,4%
Food - Dairy products 5 7,8%
Food - Wheat 4 6,3%
Food - Dried fruit 2 3,1%
Food - Meats 5 7,8%
Food - Preserved vegetables 3 4,7%
Food - Drinks 15 23,4%
Food - Oils 4 6,3%
Food - Varied products 8 12,5%
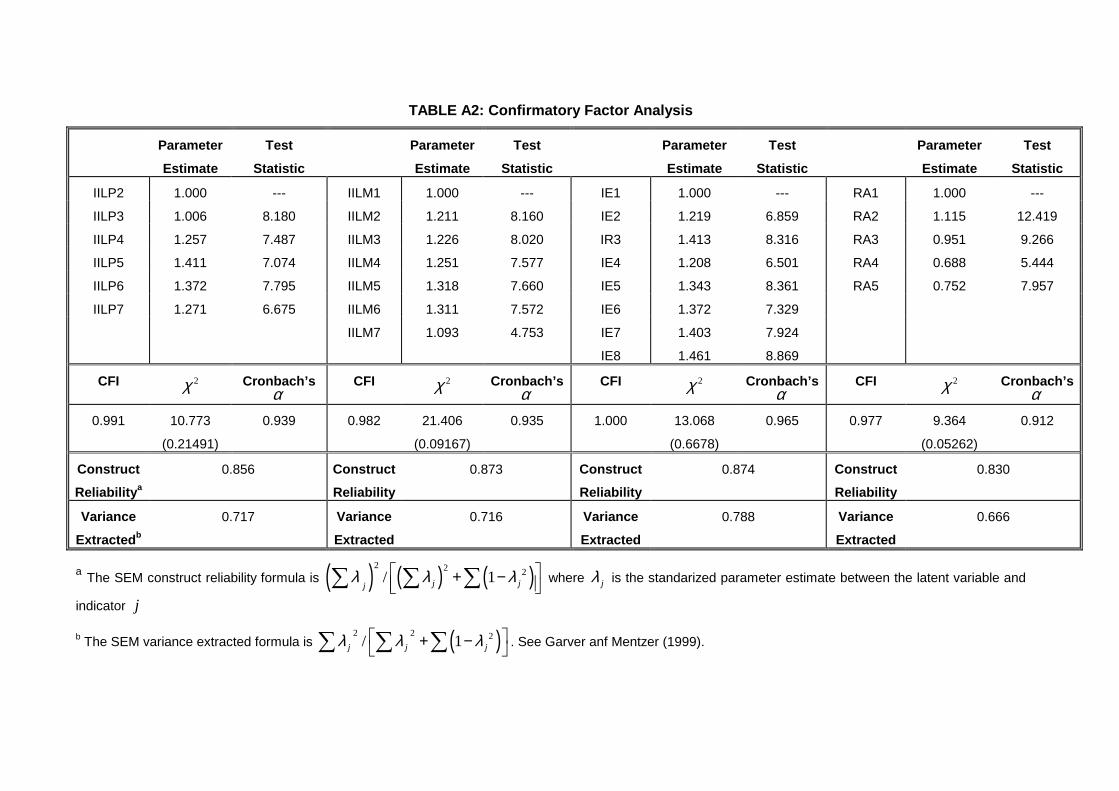
TABLE A2: Confirmatory Factor Analysis
Parameter
Estimate
Test
Statistic
Parameter
Estimate
Test
Statistic
Parameter
Estimate
Test
Statistic
Parameter
Estimate
Test
Statistic
IILP2 1.000 --- IILM1 1.000 --- IE1 1.000 --- RA1 1.000 ---
IILP3 1.006 8.180 IILM2 1.211 8.160 IE2 1.219 6.859 RA2 1.115 12.419
IILP4 1.257 7.487 IILM3 1.226 8.020 IR3 1.413 8.316 RA3 0.951 9.266
IILP5 1.411 7.074 IILM4 1.251 7.577 IE4 1.208 6.501 RA4 0.688 5.444
IILP6 1.372 7.795 IILM5 1.318 7.660 IE5 1.343 8.361 RA5 0.752 7.957
IILP7 1.271 6.675 IILM6 1.311 7.572 IE6 1.372 7.329
IILM7 1.093 4.753 IE7 1.403 7.924
IE8 1.461 8.869
CFI 2χ Cronbach’sα
CFI 2χ Cronbach’sα
CFI 2χ Cronbach’sα
CFI 2χ Cronbach’sα
0.991 10.773
(0.21491)
0.939 0.982 21.406
(0.09167)
0.935 1.000 13.068
(0.6678)
0.965 0.977 9.364
(0.05262)
0.912
Construct
Reliabilitya
0.856 Construct
Reliability
0.873 Construct
Reliability
0.874 Construct
Reliability
0.830
Variance
Extractedb
0.717 Variance
Extracted
0.716 Variance
Extracted
0.788 Variance
Extracted
0.666
a The SEM construct reliability formula is ( ) ( ) ( )2 2 2/ 1j jjλ λ λ + − ∑ ∑ ∑ where jλ is the standarized parameter estimate between the latent variable and
indicator j
b The SEM variance extracted formula is ( )2 2 2/ 1j j jλ λ λ + − ∑ ∑ ∑ . See Garver anf Mentzer (1999).
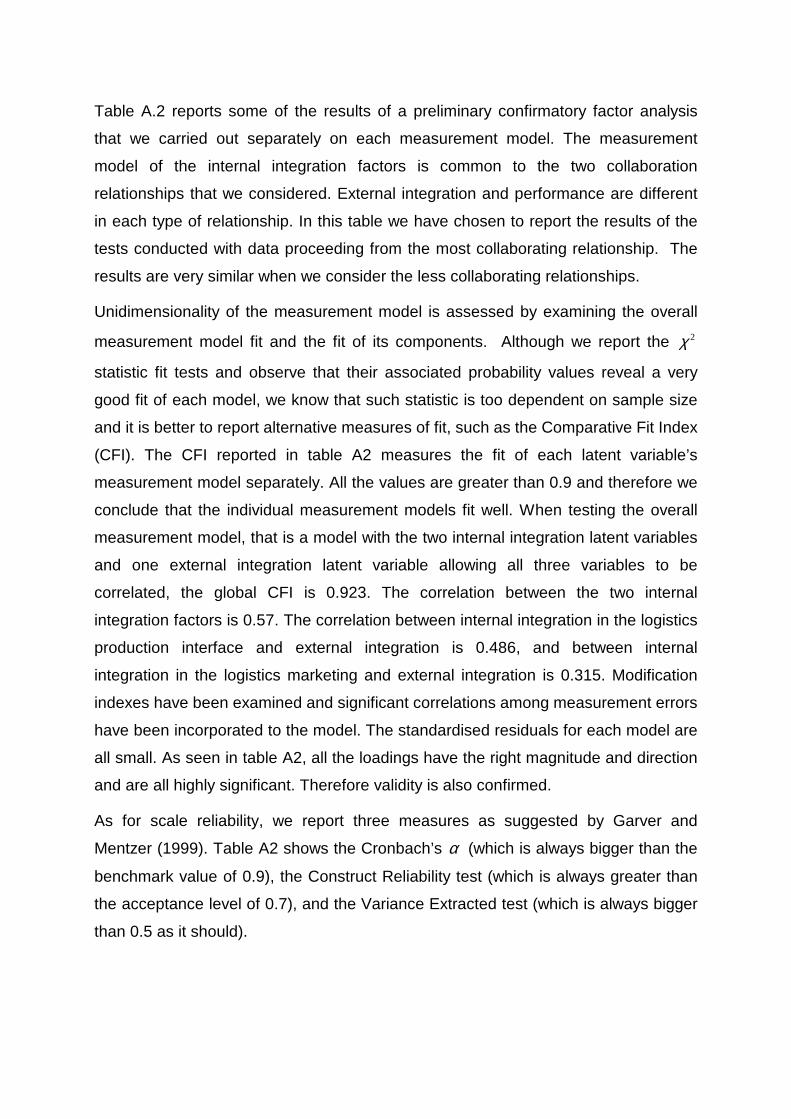
Table A.2 reports some of the results of a preliminary confirmatory factor analysis
that we carried out separately on each measurement model. The measurement
model of the internal integration factors is common to the two collaboration
relationships that we considered. External integration and performance are different
in each type of relationship. In this table we have chosen to report the results of the
tests conducted with data proceeding from the most collaborating relationship. The
results are very similar when we consider the less collaborating relationships.
Unidimensionality of the measurement model is assessed by examining the overall
measurement model fit and the fit of its components. Although we report the 2χ
statistic fit tests and observe that their associated probability values reveal a very
good fit of each model, we know that such statistic is too dependent on sample size
and it is better to report alternative measures of fit, such as the Comparative Fit Index
(CFI). The CFI reported in table A2 measures the fit of each latent variable’s
measurement model separately. All the values are greater than 0.9 and therefore we
conclude that the individual measurement models fit well. When testing the overall
measurement model, that is a model with the two internal integration latent variables
and one external integration latent variable allowing all three variables to be
correlated, the global CFI is 0.923. The correlation between the two internal
integration factors is 0.57. The correlation between internal integration in the logistics
production interface and external integration is 0.486, and between internal
integration in the logistics marketing and external integration is 0.315. Modification
indexes have been examined and significant correlations among measurement errors
have been incorporated to the model. The standardised residuals for each model are
all small. As seen in table A2, all the loadings have the right magnitude and direction
and are all highly significant. Therefore validity is also confirmed.
As for scale reliability, we report three measures as suggested by Garver and
Mentzer (1999). Table A2 shows the Cronbach’s α (which is always bigger than the
benchmark value of 0.9), the Construct Reliability test (which is always greater than
the acceptance level of 0.7), and the Variance Extracted test (which is always bigger
than 0.5 as it should).
21
End Notes:
[1]“CPFR involves collaborating and jointly planning to make long term projections which areconstantly up-dated based on actual demand and market changes” (Stank, Daugherty & Autry, 1999).
[2] ARP can be identified as an external integration program. They have been implemented by manycompanies within the ECR philosophy. These programs provide a day-to-day guidance forreplenishment. ARP is different from CPFR: because CPFR is based on long term planning. CPFRhas been described as a step beyond efficient consumer response, i.e. automatic replenishmentprograms, because of the high level of co-operation and collaboration.
[3] ECR can be considered to be the sectorial implementation of SCM.
[4] There is plenty of other very good software in Structural Equations Modeling. See for exampleLISREL (Jöreskog & Sörbom, 1993), AMOS (Arbuckle, 1997), or CALIS (SAS Institute, 1990) amongothers.
[5] It is well know that the chi-square statistic is too dependent on sample size, and might be prone torejection in many cases. Instead, the Comparative Fit Index (CFI) measure is a well-acceptedalternative to ascertain the goodness of fit of the model.
Related Documents