U.S. Department of Commerce Economics and Statistics Administration U.S. CENSUS BUREAU Living Arrangements of Children: 2009 Household Economic Studies Issued June 2011 P70-126 Current Population Reports By Rose M. Kreider and Renee Ellis INTRODUCTION This report examines the diversity of chil- dren’s living arrangements in households in the United States. The data are from the household relationship module of the Survey of Income and Program Partici- pation (SIPP) collected in early 2009. 1 This is an update of an earlier report based on data from the 2004 SIPP Panel. 2 Detailed information was obtained on each person’s relationship to every other person in the household at the time of interview, permitting the identification of various types of relatives and parent- child and sibling relationships. This report includes descriptions of extended family households with relatives and non- relatives, whose presence may influence a child’s development and contribute to the household’s economic well-being. It also examines the degree to which chil- dren are living in single-parent families or with stepparents, adoptive parents, or no parents while in the care of another rela- tive or a guardian. Various factors influence the diversity of children’s living arrangements, including 1 The data in this report were collected from January through April 2009 in the second wave (interview) of the 2008 SIPP Panel. The population represented (the population universe) is the civilian noninstitutionalized population living in households with children under 18 years old in the United States. Detailed tables for this report can be accessed on the U.S. Census Bureau’s Web site at <www.census.gov /population/www/socdemo/child/la-child.html>. The items asked in the household relationship topical module, which include detailed relationships of all household members to all others, are also available on the Census Bureau’s Web site at <www.census.gov /sipp/core_content/2008/questswave2 /2008w2core.pdf>. 2 Kreider, Rose M., “Living Arrangements of Children: 2004,” Current Population Reports, P70-114, U.S. Census Bureau, Washington, DC, 2008, available at <www.census.gov/prod/2008pubs/p70-114.pdf>. Children are defined in this report as all individuals under 18 years old. The survey asks respondents to identify the child’s mother and/or father if they are present in the household. A separate question asks respondents to identify the type of relationship between each child and parent, whether biological, step, or adoptive. All living arrangements are as of the time of the interview. Stepchildren are identified by the sur- vey respondent, and their stepparent may not be currently married to the child’s other coresidential parent. Stepsiblings share a parent, but that parent is the biological parent of one child and the stepparent of the other child. Half siblings share one biological parent. Foster children are only identified in the relationship to householder item and not via the edited variables that identify if the child’s mother/father is present in the household and whether the mother/father is the child’s bio- logical, step-, or adoptive parent. Grandchildren are identified either by the respondent reporting the child as the grandchild of the householder, or because the child’s mother or father reports that their mother or father is present in the household. Blended families are formed when remarriages occur or when children living in a household share only one or no biological parents. The presence of a stepparent, stepsibling, or half sibling designates a family as blended. –Continued on page 2.

Welcome message from author
This document is posted to help you gain knowledge. Please leave a comment to let me know what you think about it! Share it to your friends and learn new things together.
Transcript
U.S. Department of CommerceEconomics and Statistics Administration
U.S. CENSUS BUREAU
Living Arrangements of Children: 2009Household Economic Studies
Issued June 2011
P70-126
CurrentPopulation Reports
By Rose M. Kreider andRenee Ellis
INTRODUCTION
This report examines the diversity of chil-dren’s living arrangements in households in the United States. The data are from the household relationship module of the Survey of Income and Program Partici- pation (SIPP) collected in early 2009.1 This is an update of an earlier report based on data from the 2004 SIPP Panel.2
Detailed information was obtained on each person’s relationship to every other person in the household at the time of interview, permitting the identification of various types of relatives and parent-child and sibling relationships. This report includes descriptions of extended family households with relatives and non-relatives, whose presence may influence a child’s development and contribute to the household’s economic well-being. It also examines the degree to which chil-dren are living in single-parent families or with stepparents, adoptive parents, or no parents while in the care of another rela-tive or a guardian.
Various factors influence the diversity of children’s living arrangements, including
1 The data in this report were collected from January through April 2009 in the second wave (interview) of the 2008 SIPP Panel. The population represented (the population universe) is the civilian noninstitutionalized population living in households with children under 18 years old in the United States. Detailed tables for this report can be accessed on the U.S. Census Bureau’s Web site at <www.census.gov /population/www/socdemo/child/la-child.html>. The items asked in the household relationship topical module, which include detailed relationships of all household members to all others, are also available on the Census Bureau’s Web site at <www.census.gov /sipp/core_content/2008/questswave2 /2008w2core.pdf>.
2 Kreider, Rose M., “Living Arrangements of Children: 2004,” Current Population Reports, P70-114, U.S. Census Bureau, Washington, DC, 2008, available at <www.census.gov/prod/2008pubs/p70-114.pdf>.
Children are defined in this reportas all individuals under 18 years old. The survey asks respondents to identify the child’s mother and/or father if they are present in the household. A separate question asks respondents to identify the type of relationship between each child and parent, whether biological, step, or adoptive. All living arrangements are as of the time of the interview.
Stepchildren are identified by the sur-vey respondent, and their stepparent may not be currently married to the child’s other coresidential parent.
Stepsiblings share a parent, but thatparent is the biological parent of one child and the stepparent of the other child.
Half siblings share one biological parent.
Foster children are only identified in the relationship to householder item and not via the edited variables that identify if the child’s mother/father is present in the household and whether the mother/father is the child’s bio- logical, step-, or adoptive parent.
Grandchildren are identified either by the respondent reporting the child as the grandchild of the householder, or because the child’s mother or father reports that their mother or father is present in the household.
Blended families are formed when remarriages occur or when children living in a household share only one or no biological parents. The presence of a stepparent, stepsibling, or half sibling designates a family as blended.
–Continued on page 2.
2 U.S. Census Bureau
parental death, divorce, remar-riage, births to unmarried women, cohabitation of unmarried parents, and multigenerational families. Forty percent of births today are to unmarried mothers, and these children may grow up in single-parent families or spend significant portions of their lives with other
Continued from page 1.
Extended households are those that contain a child under 18 years old who has a relative present who is not his or her parent or sibling, or who has a nonrelative present.
Unmarried partners are people who are at least 15 years old, who are not currently living with a spouse, and who are sharing a close personal relationship with another adult in the household. (This term and its definition were first developed by Arthur J. Norton of the Census Bureau for use in the 1990 Census of Population). The partner may or may not be the parent of any children in the household.
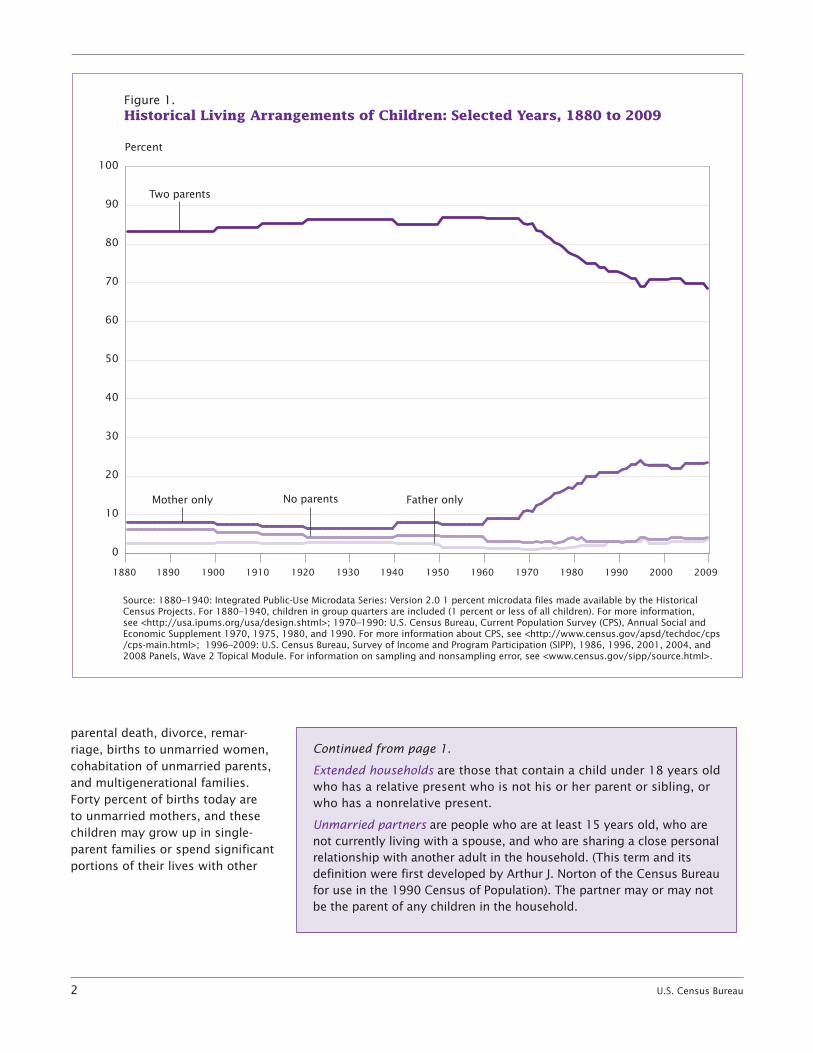
Figure 1.Historical Living Arrangements of Children: Selected Years, 1880 to 2009
Source: 1880–1940: Integrated Public-Use Microdata Series: Version 2.0 1 percent microdata files made available by the Historical Census Projects. For 1880–1940, children in group quarters are included (1 percent or less of all children). For more information, see <http://usa.ipums.org/usa/design.shtml>; 1970–1990: U.S. Census Bureau, Current Population Survey (CPS), Annual Social and Economic Supplement 1970, 1975, 1980, and 1990. For more information about CPS, see <http://www.census.gov/apsd/techdoc/cps/cps-main.html>; 1996–2009: U.S. Census Bureau, Survey of Income and Program Participation (SIPP), 1986, 1996, 2001, 2004, and 2008 Panels, Wave 2 Topical Module. For information on sampling and nonsampling error, see <www.census.gov/sipp/source.html>.
Father onlyMother only No parents
Two parents
Percent
1880 1890 1900 1910 1920 19401930 1950 1960 1970 1980 1990 2000 2009
0
10
20
30
40
50
60
70
80
90
100
U.S. Census Bureau 3
relatives or stepparents.3 Immigra-tion may also influence the type of household and family in which children grow up, when families provide housing for their immigrant relatives and friends. Hispanics con-stitute a large component of new immigrants to the United States, and this factor is evident in these children’s living situations.4
HISTORICAL LIVING ARRANGEMENTS OF CHILDREN
Today’s family and household struc-tures may be placed in historical context by comparing them with family and household structures since the late nineteenth century. Based on decennial censuses for 1880, 1910, and 1940 using data from the Integrated Public-Use Microdata Series, the 1970, 1980 through 1995 Current Population Survey (CPS), and the 1996, 2001, 2004, and 2008 SIPP panels, Figure
3 Martin, Joyce A., M.P.H.; Brady E. Hamilton, Ph.D.; Paul D. Sutton, Ph.D.; Stephanie J. Ventura, M.A.; T.J. Mathews, M.S.; Sharon Kirmeyer, Ph.D.; and Michelle J.K. Osterman, M.H.S.; “Births: Final Data 2007,” National Vital Statistics Reports, National Center for Health Statistics, Hyattsville, MD, 2010, Vol. 58, No. 24.
Kennedy, Sheela and Larry Bumpass, “Cohabitation and Children’s Living Arrangements: New Estimates From the United States,” Demographic Research, 2008. Vol. 19, pp. 1663–1692.
4 Because Hispanics may be any race, data in this report for Hispanics overlap with data for the White, Black, and Asian populations. Based on the population under 18 years old in the 2008 SIPP panel, Wave 2, 26 percent of the White-alone population, 9 percent of the Black-alone population, and 2 percent of the Asian-alone population were also Hispanic.
Grieco, Liz, “Race and Hispanic Origin of the Foreign-Born Population in the United States: 2007,” American Community Survey Reports, ACS-11, U.S. Census Bureau, Washington, DC, 2010, available at <www.census.gov/prod/2010pubs /acs-11.pdf>.
1 presents long-term trends in increased from 8 percent to 11 parent-child living arrangements.5 percent.7 Eighty-three percent of
children lived with two parents in The data from 1880 to 1970 at
1880 and 85 percent lived with two 30-year intervals (the approximate
parents from 1910 to 1970. length of a generation most closely conforming to census years) show Major shifts in living arrangements small but important changes in occurred between 1970 and 1990, the distribution of children’s living when the proportion of children arrangements.6 The proportion of living with their mother without children who lived without parents their father present doubled from declined from 6 percent in 1880 to 11 percent to 22 percent (an 11 about 3 percent in 1970. During percent increase). This period corre-this same period, the proportion sponds to sharp increases in births of children who lived with their to unmarried women, from 11 mother without their father present percent of all births in 1970 to 28
percent in 1990.8 The percentage 5 Sources: 1880–1940: Integrated of children living with two parents Public-Use Microdata Series: Version 2.0 one
percent microdata files made available by the declined from 85 percent in 1970 Historical Census Projects. For 1880–1940, to 73 percent in 1990 (a 12 percent children in group quarters are included (1 percent or less of all children). For more decrease).9
information, see <http://usa.ipums.org/usa /design.shtml>; 1970–1990: U.S. Census Since 1990, the changes in chil-Bureau, Current Population Survey, Annual Social and Economic Supplement 1970, 1975, dren’s living arrangements have 1980, 1990. For more information about the continued, but at much slower CPS, see <www.census.gov/apsd/techdoc /cps/cps-main.html>; 1996–2009: U.S. rates than the period between Census Bureau, Survey of Income and 1970 and 1990. The SIPP allows Program Participation, 1986, 1996, 2001, us to look at detailed changes in 2004, and 2008 Panels, Wave 2 Topical Module. For information on sampling and living arrangements since 1990. nonsampling error, see <www.census.gov Table 1 shows changes in children’s /sipp/source.html>; Ruggles, Steven and Matthew Sobek et al., Integrated Public-Use living arrangements from 1991 to Microdata Series: Version 2.0, Minneapolis: 2009. The percentage of children Historical Census Projects, University of Minnesota, 1997. For more information, see living with two parents declined <www.ipums.umn.edu>. See Internet Table 2, less between 1990 and 2009 than <www.census.gov/hhes/socdemo/children /data/sipp/living2009/tab02.xls>. it had between 1970 and 1990; 73
Race and Hispanic origin were collected percent of children lived in two-differently in earlier years compared with 2004 and 2009. In 2004 and later, parent households in 1991 com-respondents could mark all race groups they pared to 69 percent in 2009 (a 4 chose, while in earlier years they had to choose just one group. In 1986, 1996, and percent decline compared to a 13 2001, Asian includes Pacific Islanders, while percent decline between 1970 and in 2004 and 2009 it does not. In 2004 and 2009, Black, White, and Asian include those 1990). Children living with their who marked only the category indicated. mother without their father present
6 The estimates in this report (which may be shown in text, figures, and tables) are based on responses of a sample of the 7 Living with mother only refers to population and may differ from the actual households with no father present, other values because of sampling variability relatives or nonrelatives may be present.or other factors. As a result, apparent 8 “Health, United States: 2009,” National differences between the estimates for two Center for Health Statistics, Hyattsville,or more groups may not be statistically MD, 2010.significant. All comparative statements 9 See detailed Table 2 on the Web site, have undergone statistical testing and are available at: <www.census.gov/hhes significant at the 90 percent confidence level /socdemo/children/data/sipp/living2009 unless otherwise noted. /tab02.xls>.
4 U.S. Census Bureau
increased from 21 percent to 24 percent (a 2 percent increase com-pared to the 11 percent increase between 1970 and 1990).
Living arrangements of children vary by race and Hispanic origin.10
10 Federal surveys now give respondents the option of reporting more than one race. Therefore, two basic ways of defining a race group are possible. A group such as Asian may be defined as those who reported Asian and no other race (the race-alone or single-race concept) or as those who reported Asian regardless of whether they also reported another race (the race-alone-or-in-combination concept). The body of this report (text, figures, and text tables) shows data for people who reported they were the single race White and not Hispanic, those who reported the single race White, those who reported the single race Black, and those who reported the single race Asian. Use of the single-race populations does not imply that it is the preferred method of presenting or analyzing data. The Census Bureau uses a variety of approaches.
For further information, see the Census 2000 brief “Overview of Race and Hispanic Origin: 2000” (C2KBR/01-1) at <www.census .gov/population/www/cen2000/briefs.html>. Hispanics may be any race. Data for the American Indian and Alaska Native population are not shown in this report because of their small sample size in the SIPP.
This report will refer to the White-alone population as White, the Black-alone population as Black, the Asian-alone population as Asian, and the White-alone non-Hispanic population as White, non-Hispanic.
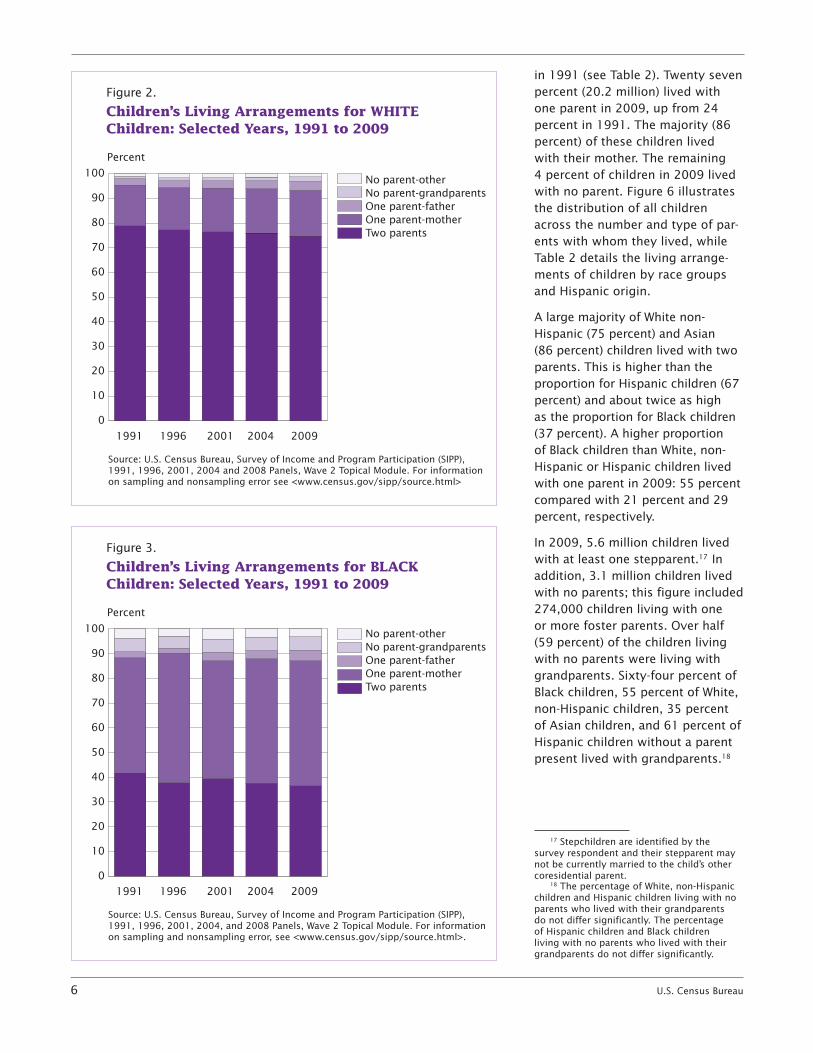
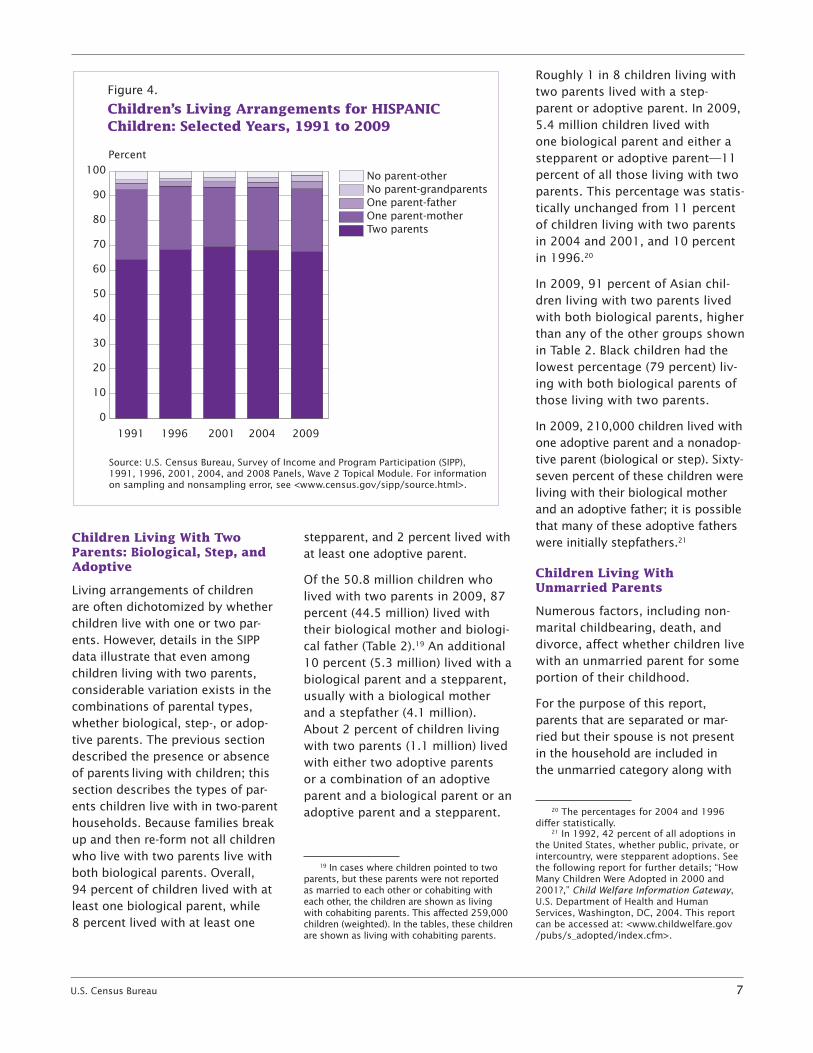
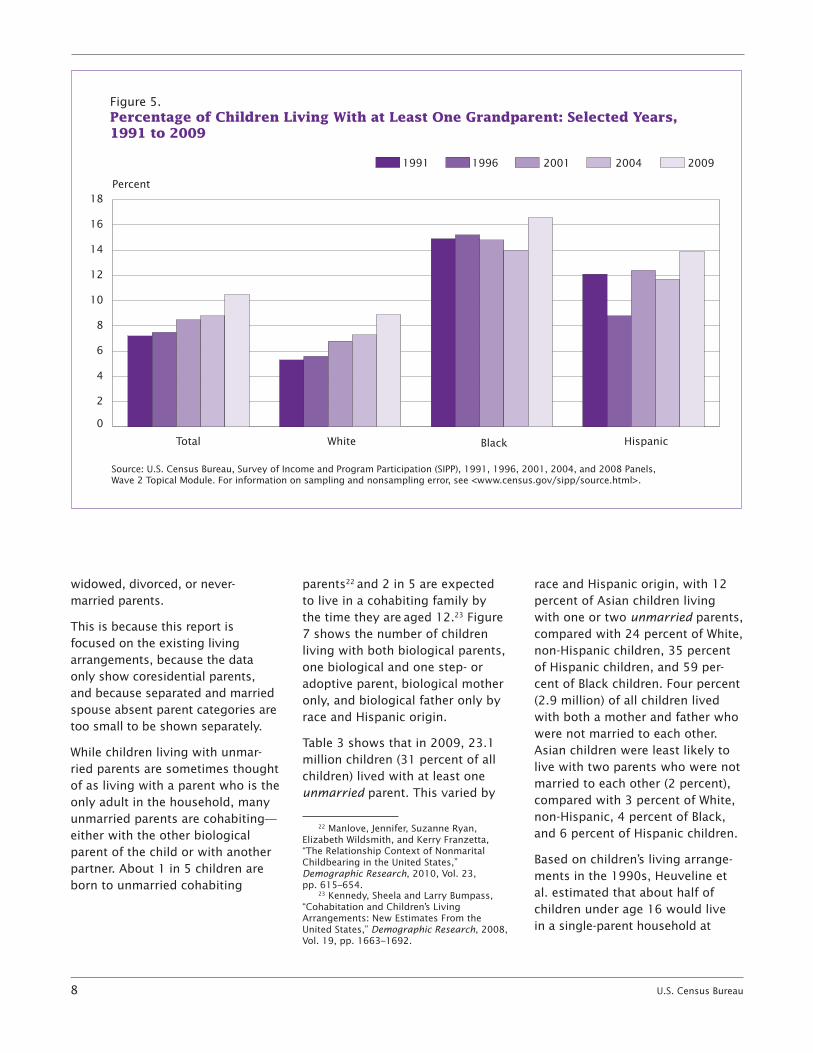
Figures 2 through 4 show children’s living arrangements for White, Black, and Hispanic children. The percentage of children living with two parents declined 4 percentage points for White children and 5 percentage points for Black chil-dren between 1991 and 2009, and increased by 3 percentage points for Hispanic children.11
What is most striking during this time period is the persistent dif-ferences in the patterns of living arrangements by race and origin. While the percentage of White children living with their mother without their father present ranged from 16 percent in 1991 to 19 percent in 2009, the corresponding percentage for Hispanic children ranged from 29 percent in 1991 to 26 percent in 2009. However, 47 percent of Black children lived with only their mother in 1991 and about half lived with only their mother in 2009.
11 The proportions of White childrenand Black children living with two parents are not significantly different between 1991 and 2009.
In 1991, 79 percent of White children lived with two parents compared to 64 percent of His-panic children and 42 percent of Black children. By 2009, 75 percent of White children lived with two parents compared to 67 percent of Hispanic children and 37 percent of Black children.
Figure 5 shows the percentage of children who lived in a house-hold that contained grandparents between 1991 and 2009 by race and origin. In 1991, 5 percent of White, 15 percent of Black, and 12 percent of Hispanic children lived with at least one grandparent. By 2009, 9 percent of White, 17 percent of Black, and 14 percent of Hispanic children lived with at least one grandparent.12 Most of these children also lived with at least one parent.
Some children who do not live with a parent live with a grandparent. In 1991, about 1 percent of White and Hispanic children lived with a
12 The percentages for Black and Hispanic children for 1991 and 2009 do not differ significantly.
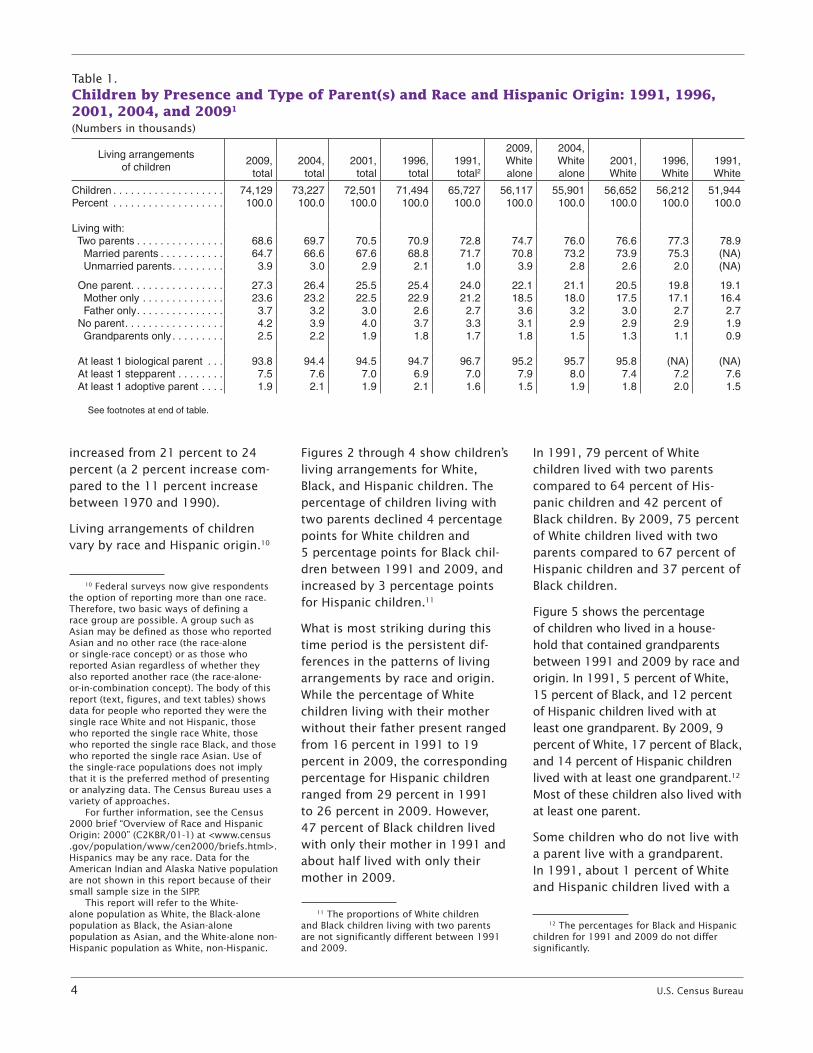
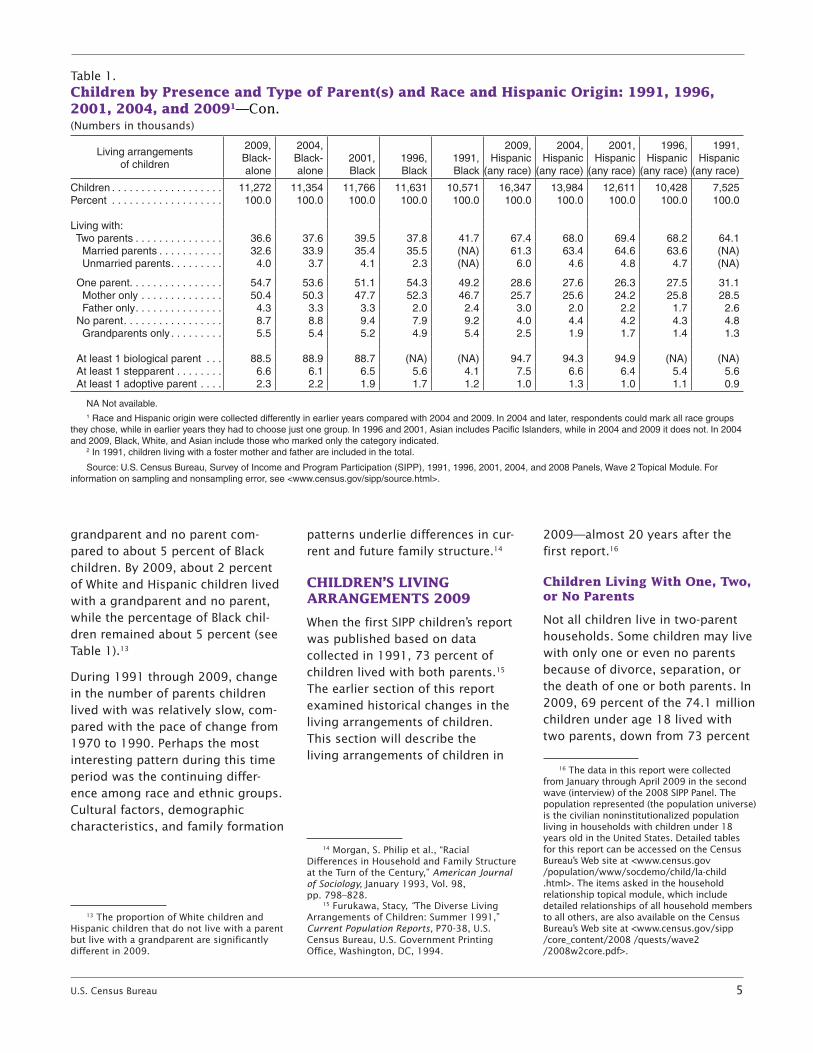
Table 1.Children by Presence and Type of Parent(s) and Race and Hispanic Origin: 1991, 1996, 2001, 2004, and 20091
(Numbers in thousands)
Living arrangements of children
2009, total
2004, total
2001, total
1996, total
1991, total2
2009, White alone
2004, White alone
2001, White
1996, White
1991, White
Children . . . . . . . . . . . . . . . . . . . 74,129 73,227 72,501 71,494 65,727 56,117 55,901 56,652 56,212 51,944 Percent . . . . . . . . . . . . . . . . . . . 100 .0 100 .0 100 .0 100 .0 100 .0 100 .0 100 .0 100 .0 100 .0 100 .0
Living with: Two parents . . . . . . . . . . . . . . . 68 .6 69 .7 70 .5 70 .9 72 .8 74 .7 76 .0 76 .6 77 .3 78 .9 Married parents . . . . . . . . . . . 64 .7 66 .6 67 .6 68 .8 71 .7 70 .8 73 .2 73 .9 75 .3 (NA) Unmarried parents . . . . . . . . . 3 .9 3 .0 2 .9 2 .1 1 .0 3 .9 2 .8 2 .6 2 .0 (NA)
One parent . . . . . . . . . . . . . . . . 27 .3 26 .4 25 .5 25 .4 24 .0 22 .1 21 .1 20 .5 19 .8 19 .1 Mother only . . . . . . . . . . . . . . 23 .6 23 .2 22 .5 22 .9 21 .2 18 .5 18 .0 17 .5 17 .1 16 .4 Father only . . . . . . . . . . . . . . . 3 .7 3 .2 3 .0 2 .6 2 .7 3 .6 3 .2 3 .0 2 .7 2 .7 No parent . . . . . . . . . . . . . . . . . 4 .2 3 .9 4 .0 3 .7 3 .3 3 .1 2 .9 2 .9 2 .9 1 .9 Grandparents only . . . . . . . . . 2 .5 2 .2 1 .9 1 .8 1 .7 1 .8 1 .5 1 .3 1 .1 0 .9
At least 1 biological parent . . . 93 .8 94 .4 94 .5 94 .7 96 .7 95 .2 95 .7 95 .8 (NA) (NA) At least 1 stepparent . . . . . . . . 7 .5 7 .6 7 .0 6 .9 7 .0 7 .9 8 .0 7 .4 7 .2 7 .6 At least 1 adoptive parent . . . . 1 .9 2 .1 1 .9 2 .1 1 .6 1 .5 1 .9 1 .8 2 .0 1 .5
See footnotes at end of table .
U.S. Census Bureau 5
grandparent and no parent com-pared to about 5 percent of Black children. By 2009, about 2 percent of White and Hispanic children lived with a grandparent and no parent, while the percentage of Black chil-dren remained about 5 percent (see Table 1).13
During 1991 through 2009, change in the number of parents children lived with was relatively slow, com-pared with the pace of change from 1970 to 1990. Perhaps the most interesting pattern during this time period was the continuing differ-ence among race and ethnic groups. Cultural factors, demographic characteristics, and family formation
13 The proportion of White children and Hispanic children that do not live with a parent but live with a grandparent are significantly different in 2009.
patterns underlie differences in cur-rent and future family structure.14
CHILDREN’S LIVING ARRANGEMENTS 2009
When the first SIPP children’s report was published based on data collected in 1991, 73 percent of children lived with both parents.15
The earlier section of this report examined historical changes in the living arrangements of children. This section will describe the living arrangements of children in
14 Morgan, S. Philip et al., “Racial Differences in Household and Family Structure at the Turn of the Century,” American Journal of Sociology, January 1993, Vol. 98,pp. 798–828.
15 Furukawa, Stacy, “The Diverse Living Arrangements of Children: Summer 1991,” Current Population Reports, P70-38, U.S. Census Bureau, U.S. Government Printing Office, Washington, DC, 1994.
2009—almost 20 years after the first report.16
Children Living With One, Two, or No Parents
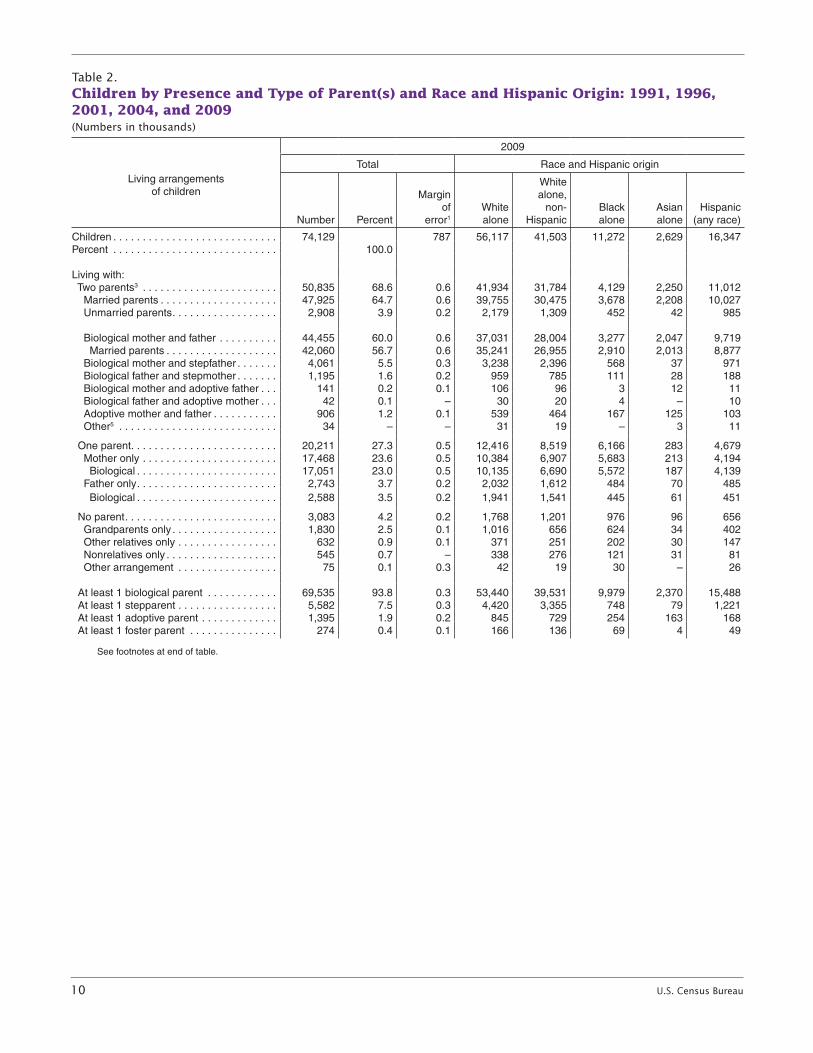
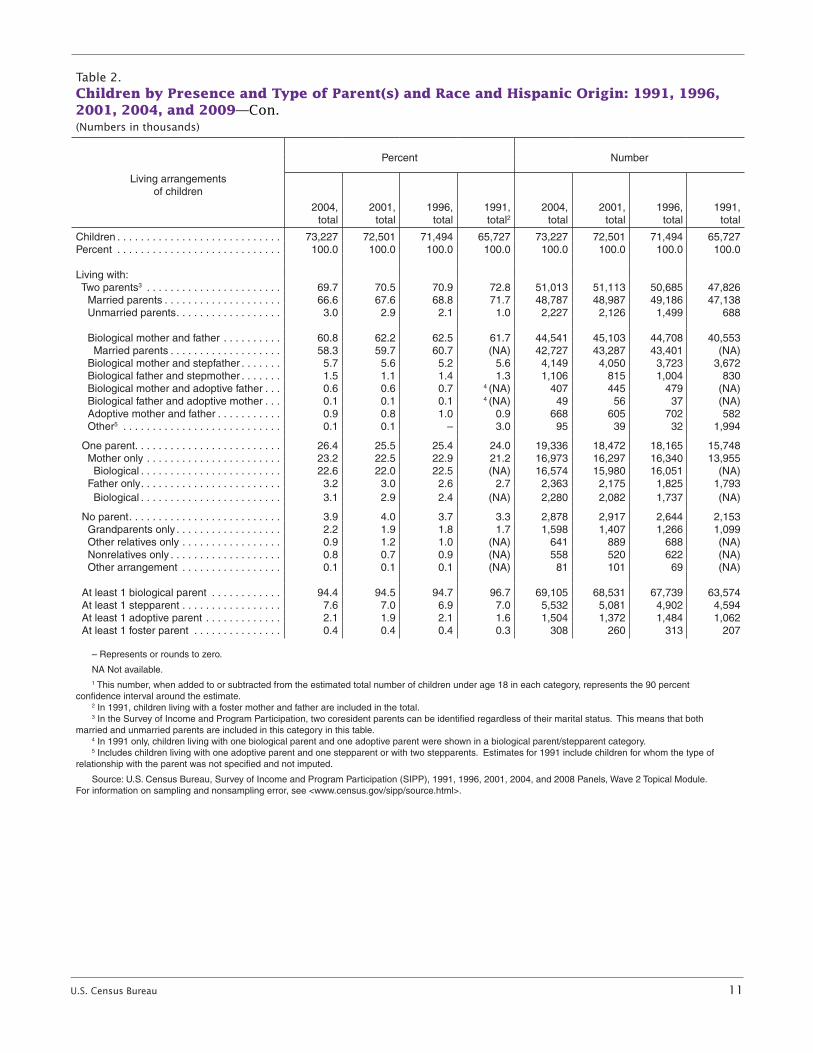
Not all children live in two-parent households. Some children may live with only one or even no parents because of divorce, separation, or the death of one or both parents. In 2009, 69 percent of the 74.1 million children under age 18 lived with two parents, down from 73 percent
16 The data in this report were collected from January through April 2009 in the second wave (interview) of the 2008 SIPP Panel. The population represented (the population universe) is the civilian noninstitutionalized population living in households with children under 18 years old in the United States. Detailed tables for this report can be accessed on the Census Bureau’s Web site at <www.census.gov /population/www/socdemo/child/la-child .html>. The items asked in the household relationship topical module, which include detailed relationships of all household members to all others, are also available on the Census Bureau’s Web site at <www.census.gov/sipp /core_content/2008 /quests/wave2 /2008w2core.pdf>.
Table 1.Children by Presence and Type of Parent(s) and Race and Hispanic Origin: 1991, 1996, 2001, 2004, and 20091—Con.(Numbers in thousands)
Living arrangements of children
2009, Black-alone
2004, Black-alone
2001, Black
1996, Black
1991, Black
2009, Hispanic
(any race)
2004, Hispanic
(any race)
2001, Hispanic
(any race)
1996, Hispanic
(any race)
1991, Hispanic
(any race)
Children . . . . . . . . . . . . . . . . . . . 11,272 11,354 11,766 11,631 10,571 16,347 13,984 12,611 10,428 7,525 Percent . . . . . . . . . . . . . . . . . . . 100 .0 100 .0 100 .0 100 .0 100 .0 100 .0 100 .0 100 .0 100 .0 100 .0
Living with: Two parents . . . . . . . . . . . . . . . 36 .6 37 .6 39 .5 37 .8 41 .7 67 .4 68 .0 69 .4 68 .2 64 .1 Married parents . . . . . . . . . . . 32 .6 33 .9 35 .4 35 .5 (NA) 61 .3 63 .4 64 .6 63 .6 (NA) Unmarried parents . . . . . . . . . 4 .0 3 .7 4 .1 2 .3 (NA) 6 .0 4 .6 4 .8 4 .7 (NA)
One parent . . . . . . . . . . . . . . . . 54 .7 53 .6 51 .1 54 .3 49 .2 28 .6 27 .6 26 .3 27 .5 31 .1 Mother only . . . . . . . . . . . . . . 50 .4 50 .3 47 .7 52 .3 46 .7 25 .7 25 .6 24 .2 25 .8 28 .5 Father only . . . . . . . . . . . . . . . 4 .3 3 .3 3 .3 2 .0 2 .4 3 .0 2 .0 2 .2 1 .7 2 .6 No parent . . . . . . . . . . . . . . . . . 8 .7 8 .8 9 .4 7 .9 9 .2 4 .0 4 .4 4 .2 4 .3 4 .8 Grandparents only . . . . . . . . . 5 .5 5 .4 5 .2 4 .9 5 .4 2 .5 1 .9 1 .7 1 .4 1 .3
At least 1 biological parent . . . 88 .5 88 .9 88 .7 (NA) (NA) 94 .7 94 .3 94 .9 (NA) (NA) At least 1 stepparent . . . . . . . . 6 .6 6 .1 6 .5 5 .6 4 .1 7 .5 6 .6 6 .4 5 .4 5 .6 At least 1 adoptive parent . . . . 2 .3 2 .2 1 .9 1 .7 1 .2 1 .0 1 .3 1 .0 1 .1 0 .9
NA Not available .1 Race and Hispanic origin were collected differently in earlier years compared with 2004 and 2009 . In 2004 and later, respondents could mark all race groups
they chose, while in earlier years they had to choose just one group . In 1996 and 2001, Asian includes Pacific Islanders, while in 2004 and 2009 it does not . In 2004 and 2009, Black, White, and Asian include those who marked only the category indicated .
2 In 1991, children living with a foster mother and father are included in the total .
Source: U .S . Census Bureau, Survey of Income and Program Participation (SIPP), 1991, 1996, 2001, 2004, and 2008 Panels, Wave 2 Topical Module . For information on sampling and nonsampling error, see <www .census .gov/sipp/source .html> .
6 U.S. Census Bureau
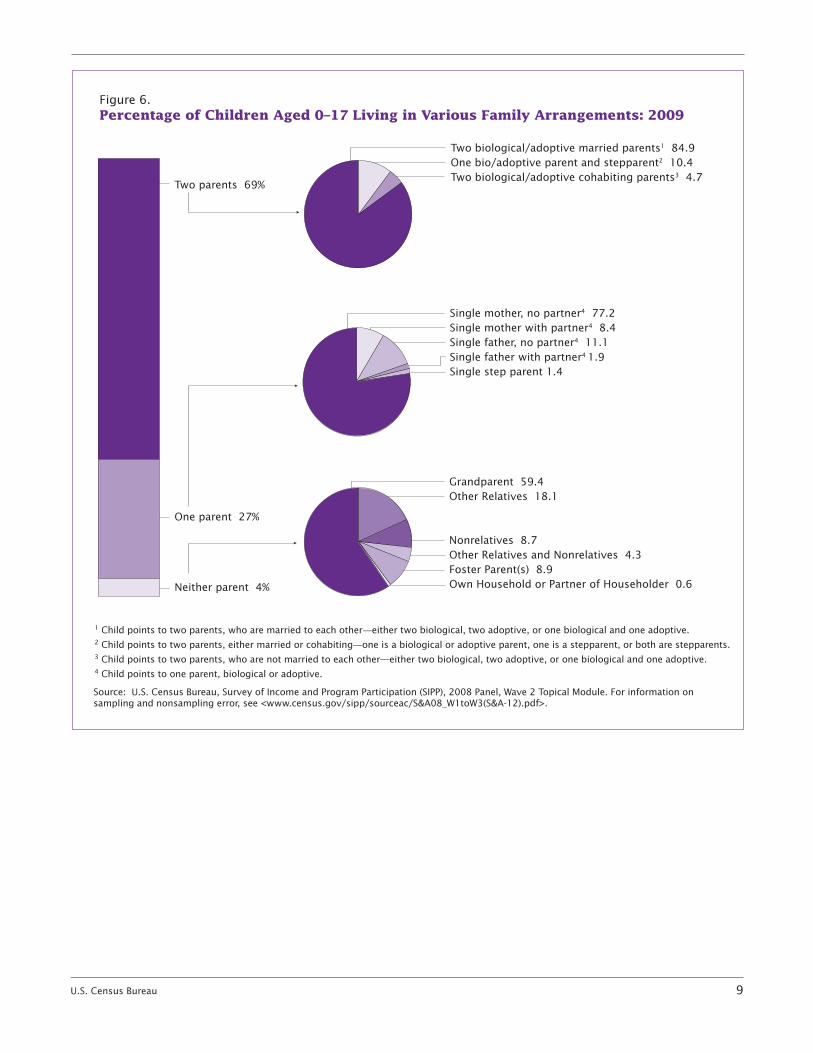
in 1991 (see Table 2). Twenty seven percent (20.2 million) lived with one parent in 2009, up from 24 percent in 1991. The majority (86 percent) of these children lived with their mother. The remaining 4 percent of children in 2009 lived with no parent. Figure 6 illustrates the distribution of all children across the number and type of par-ents with whom they lived, while Table 2 details the living arrange-ments of children by race groups and Hispanic origin.
A large majority of White non-Hispanic (75 percent) and Asian (86 percent) children lived with two parents. This is higher than the proportion for Hispanic children (67 percent) and about twice as high as the proportion for Black children (37 percent). A higher proportion of Black children than White, non-Hispanic or Hispanic children lived with one parent in 2009: 55 percent compared with 21 percent and 29 percent, respectively.
In 2009, 5.6 million children lived with at least one stepparent.17 In addition, 3.1 million children lived with no parents; this figure included 274,000 children living with one or more foster parents. Over half (59 percent) of the children living with no parents were living with grandparents. Sixty-four percent of Black children, 55 percent of White, non-Hispanic children, 35 percent of Asian children, and 61 percent of Hispanic children without a parent present lived with grandparents.18
17 Stepchildren are identified by the survey respondent and their stepparent may not be currently married to the child’s other coresidential parent.
18 The percentage of White, non-Hispanic children and Hispanic children living with no parents who lived with their grandparents do not differ significantly. The percentage of Hispanic children and Black children living with no parents who lived with their grandparents do not differ significantly.
No parent-otherNo parent-grandparentsOne parent-fatherOne parent-motherTwo parents
Percent
0
10
20
30
40
50
60
70
80
90
100
1991 1996 2001 2004 2009
Children’s Living Arrangements for WHITEChildren: Selected Years, 1991 to 2009
Figure 2.
Source: U.S. Census Bureau, Survey of Income and Program Participation (SIPP), 1991, 1996, 2001, 2004 and 2008 Panels, Wave 2 Topical Module. For information on sampling and nonsampling error see <www.census.gov/sipp/source.html>
Percent
0
10
20
30
40
50
60
70
80
90
100
1991 1996 2001 2004 2009
Children’s Living Arrangements for BLACKChildren: Selected Years, 1991 to 2009
Figure 3.
Source: U.S. Census Bureau, Survey of Income and Program Participation (SIPP), 1991, 1996, 2001, 2004, and 2008 Panels, Wave 2 Topical Module. For information on sampling and nonsampling error, see <www.census.gov/sipp/source.html>.
No parent-otherNo parent-grandparentsOne parent-fatherOne parent-motherTwo parents
U.S. Census Bureau 7
Children Living With Two Parents: Biological, Step, and Adoptive
Living arrangements of children are often dichotomized by whether children live with one or two par-ents. However, details in the SIPP data illustrate that even among children living with two parents, considerable variation exists in the combinations of parental types, whether biological, step-, or adop-tive parents. The previous section described the presence or absence of parents living with children; this section describes the types of par-ents children live with in two-parent households. Because families break up and then re-form not all children who live with two parents live with both biological parents. Overall, 94 percent of children lived with at least one biological parent, while 8 percent lived with at least one
stepparent, and 2 percent lived with at least one adoptive parent.
Of the 50.8 million children who lived with two parents in 2009, 87 percent (44.5 million) lived with their biological mother and biologi-cal father (Table 2).19 An additional 10 percent (5.3 million) lived with a biological parent and a stepparent, usually with a biological mother and a stepfather (4.1 million). About 2 percent of children living with two parents (1.1 million) lived with either two adoptive parents or a combination of an adoptive parent and a biological parent or an adoptive parent and a stepparent.
19 In cases where children pointed to two parents, but these parents were not reported as married to each other or cohabiting with each other, the children are shown as living with cohabiting parents. This affected 259,000 children (weighted). In the tables, these children are shown as living with cohabiting parents.
Roughly 1 in 8 children living with two parents lived with a step-parent or adoptive parent. In 2009, 5.4 million children lived with one biological parent and either a stepparent or adoptive parent—11 percent of all those living with two parents. This percentage was statis-tically unchanged from 11 percent of children living with two parents in 2004 and 2001, and 10 percent in 1996.20
In 2009, 91 percent of Asian chil-dren living with two parents lived with both biological parents, higher than any of the other groups shown in Table 2. Black children had the lowest percentage (79 percent) liv-ing with both biological parents of those living with two parents.
In 2009, 210,000 children lived with one adoptive parent and a nonadop-tive parent (biological or step). Sixty-seven percent of these children were living with their biological mother and an adoptive father; it is possible that many of these adoptive fathers were initially stepfathers.21
Children Living With Unmarried Parents
Numerous factors, including non-marital childbearing, death, and divorce, affect whether children live with an unmarried parent for some portion of their childhood.
For the purpose of this report, parents that are separated or mar-ried but their spouse is not present in the household are included in the unmarried category along with
20 The percentages for 2004 and 1996 differ statistically.
21 In 1992, 42 percent of all adoptions in the United States, whether public, private, or intercountry, were stepparent adoptions. See the following report for further details; “How Many Children Were Adopted in 2000 and 2001?,” Child Welfare Information Gateway, U.S. Department of Health and Human Services, Washington, DC, 2004. This report can be accessed at: <www.childwelfare.gov /pubs/s_adopted/index.cfm>.
Percent
0
10
20
30
40
50
60
70
80
90
100
1991 1996 2001 2004 2009
Children’s Living Arrangements for HISPANICChildren: Selected Years, 1991 to 2009
Figure 4.
Source: U.S. Census Bureau, Survey of Income and Program Participation (SIPP), 1991, 1996, 2001, 2004, and 2008 Panels, Wave 2 Topical Module. For information on sampling and nonsampling error, see <www.census.gov/sipp/source.html>.
No parent-otherNo parent-grandparentsOne parent-fatherOne parent-motherTwo parents
8 U.S. Census Bureau
widowed, divorced, or never- married parents.
This is because this report is focused on the existing living arrangements, because the data only show coresidential parents, and because separated and married spouse absent parent categories are too small to be shown separately.
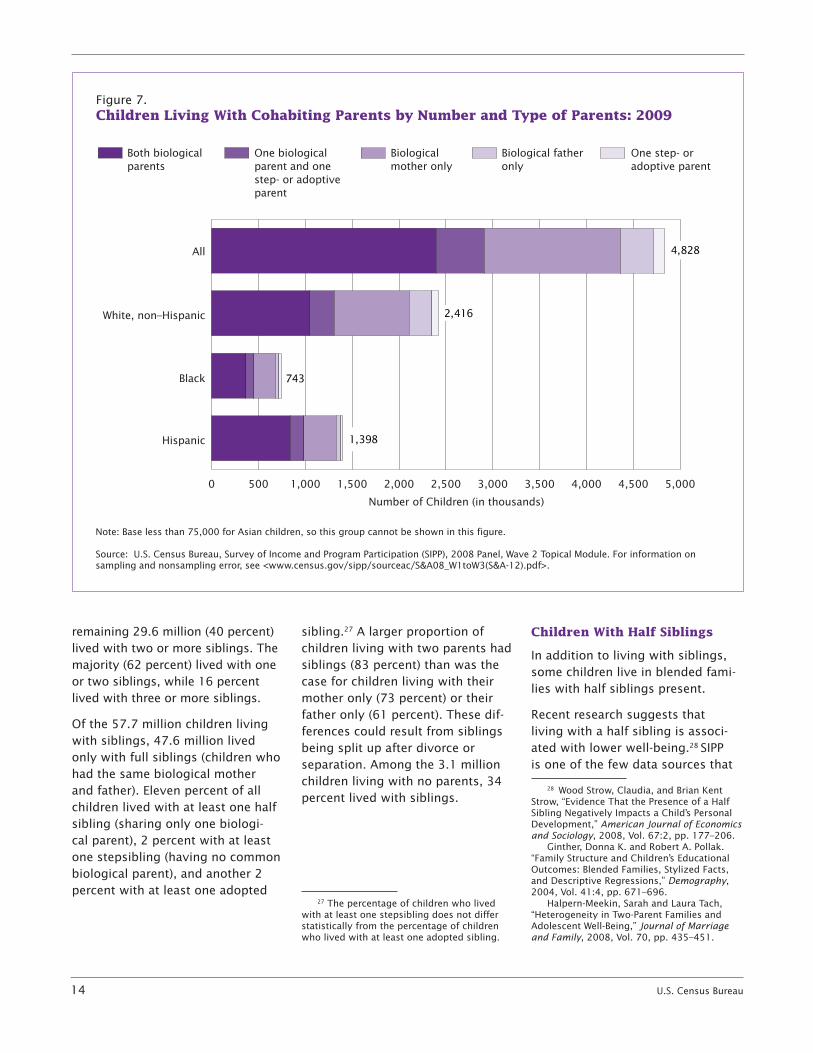
While children living with unmar-ried parents are sometimes thought of as living with a parent who is the only adult in the household, many unmarried parents are cohabiting—either with the other biological parent of the child or with another partner. About 1 in 5 children are born to unmarried cohabiting
parents22 and 2 in 5 are expected to live in a cohabiting family by the time they are aged 12.23 Figure 7 shows the number of children living with both biological parents, one biological and one step- or adoptive parent, biological mother only, and biological father only by race and Hispanic origin.
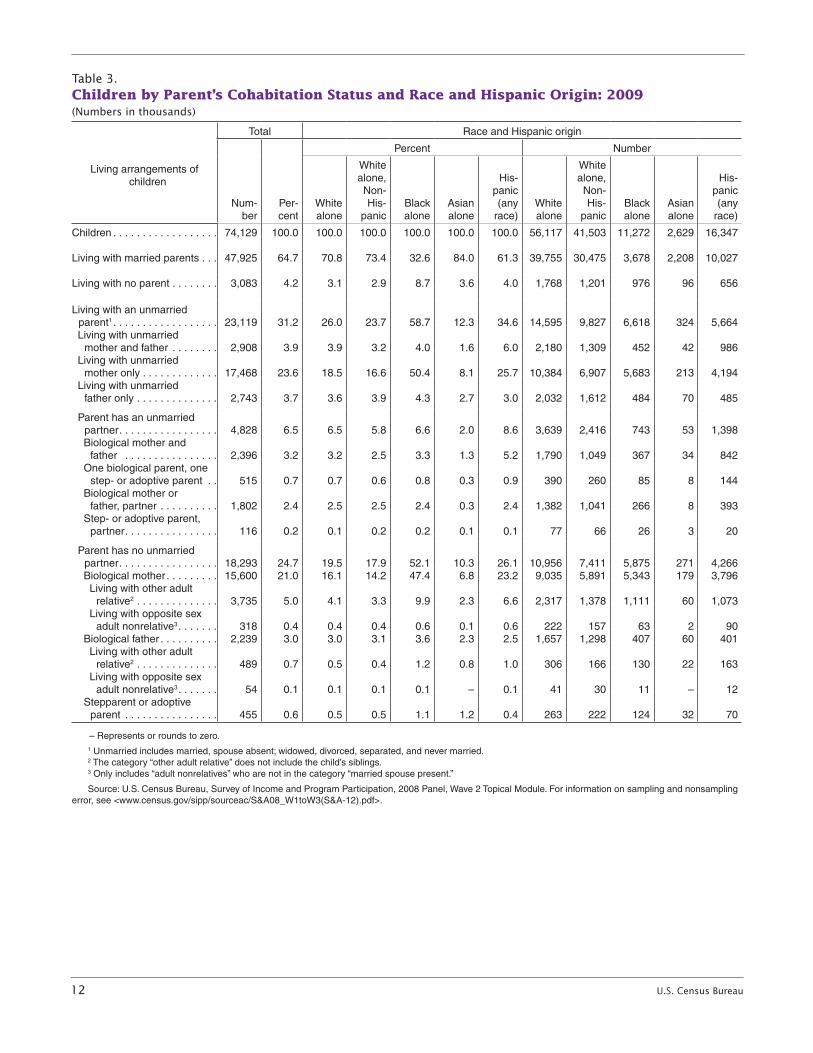
Table 3 shows that in 2009, 23.1 million children (31 percent of all children) lived with at least one unmarried parent. This varied by
22 Manlove, Jennifer, Suzanne Ryan, Elizabeth Wildsmith, and Kerry Franzetta, “The Relationship Context of Nonmarital Childbearing in the United States,” Demographic Research, 2010, Vol. 23,pp. 615–654.
23 Kennedy, Sheela and Larry Bumpass, “Cohabitation and Children’s Living Arrangements: New Estimates From the United States,” Demographic Research, 2008, Vol. 19, pp. 1663–1692.
race and Hispanic origin, with 12 percent of Asian children living with one or two unmarried parents, compared with 24 percent of White, non-Hispanic children, 35 percent of Hispanic children, and 59 per-cent of Black children. Four percent (2.9 million) of all children lived with both a mother and father who were not married to each other. Asian children were least likely to live with two parents who were not married to each other (2 percent), compared with 3 percent of White, non-Hispanic, 4 percent of Black, and 6 percent of Hispanic children.
Based on children’s living arrange-ments in the 1990s, Heuveline et al. estimated that about half of children under age 16 would live in a single-parent household at
Figure 5.Percentage of Children Living With at Least One Grandparent: Selected Years, 1991 to 2009
Source: U.S. Census Bureau, Survey of Income and Program Participation (SIPP), 1991, 1996, 2001, 2004, and 2008 Panels, Wave 2 Topical Module. For information on sampling and nonsampling error, see <www.census.gov/sipp/source.html>.
Percent
Total BlackWhite Hispanic
0
2
4
6
8
10
12
14
16
18
1991 1996 2001 2004 2009
U.S. Census Bureau 9
Figure 6.Percentage of Children Aged 0–17 Living in Various Family Arrangements: 2009
Two biological/adoptive married parents1 84.9One bio/adoptive parent and stepparent2 10.4Two biological/adoptive cohabiting parents3 4.7
Two parents 69%
One parent 27%
Neither parent 4%
Single mother, no partner4 77.2Single mother with partner4 8.4Single father, no partner4 11.1Single father with partner4 1.9Single step parent 1.4
Grandparent 59.4Other Relatives 18.1
Nonrelatives 8.7Other Relatives and Nonrelatives 4.3Foster Parent(s) 8.9Own Household or Partner of Householder 0.6
1 Child points to two parents, who are married to each other—either two biological, two adoptive, or one biological and one adoptive.2 Child points to two parents, either married or cohabiting—one is a biological or adoptive parent, one is a stepparent, or both are stepparents. 3 Child points to two parents, who are not married to each other—either two biological, two adoptive, or one biological and one adoptive.4 Child points to one parent, biological or adoptive.
Source: U.S. Census Bureau, Survey of Income and Program Participation (SIPP), 2008 Panel, Wave 2 Topical Module. For information on sampling and nonsampling error, see <www.census.gov/sipp/sourceac/S&A08_W1toW3(S&A-12).pdf>.
10 U.S. Census Bureau
Table 2.Children by Presence and Type of Parent(s) and Race and Hispanic Origin: 1991, 1996, 2001, 2004, and 2009(Numbers in thousands)
Table 2.Children by Presence and Type of Parent(s) and Race and Hispanic Origin: 1991, 1996, 2001, 2004, and 2009—Con.(Numbers in thousands)
Living arrangements of children
2009
Living arrangements of children
Percent NumberTotal Race and Hispanic origin
Number Percent
Margin of
error1
White alone
White alone,
non- Hispanic
Black alone
Asian alone
Hispanic (any race)
2004, total
2001, total
1996, total
1991, total2
2004, total
2001, total
1996, total
1991, total
Children . . . . . . . . . . . . . . . . . . . . . . . . . . . . 74,129 787 56,117 41,503 11,272 2,629 16,347 Children . . . . . . . . . . . . . . . . . . . . . . . . . . . . 73,227 72,501 71,494 65,727 73,227 72,501 71,494 65,727Percent . . . . . . . . . . . . . . . . . . . . . . . . . . . . 100 .0 Percent . . . . . . . . . . . . . . . . . . . . . . . . . . . . 100 .0 100 .0 100 .0 100 .0 100 .0 100 .0 100 .0 100 .0
Living with: Living with: Two parents3 . . . . . . . . . . . . . . . . . . . . . . . 50,835 68 .6 0 .6 41,934 31,784 4,129 2,250 11,012 Two parents3 . . . . . . . . . . . . . . . . . . . . . . . 69 .7 70 .5 70 .9 72 .8 51,013 51,113 50,685 47,826 Married parents . . . . . . . . . . . . . . . . . . . . 47,925 64 .7 0 .6 39,755 30,475 3,678 2,208 10,027 Married parents . . . . . . . . . . . . . . . . . . . . 66 .6 67 .6 68 .8 71 .7 48,787 48,987 49,186 47,138 Unmarried parents . . . . . . . . . . . . . . . . . . 2,908 3 .9 0 .2 2,179 1,309 452 42 985 Unmarried parents . . . . . . . . . . . . . . . . . . 3 .0 2 .9 2 .1 1 .0 2,227 2,126 1,499 688
Biological mother and father . . . . . . . . . . 44,455 60 .0 0 .6 37,031 28,004 3,277 2,047 9,719 Biological mother and father . . . . . . . . . . 60 .8 62 .2 62 .5 61 .7 44,541 45,103 44,708 40,553 Married parents . . . . . . . . . . . . . . . . . . . 42,060 56 .7 0 .6 35,241 26,955 2,910 2,013 8,877 Married parents . . . . . . . . . . . . . . . . . . . 58 .3 59 .7 60 .7 (NA) 42,727 43,287 43,401 (NA) Biological mother and stepfather . . . . . . . 4,061 5 .5 0 .3 3,238 2,396 568 37 971 Biological mother and stepfather . . . . . . . 5 .7 5 .6 5 .2 5 .6 4,149 4,050 3,723 3,672 Biological father and stepmother . . . . . . . 1,195 1 .6 0 .2 959 785 111 28 188 Biological father and stepmother . . . . . . . 1 .5 1 .1 1 .4 1 .3 1,106 815 1,004 830 Biological mother and adoptive father . . . 141 0 .2 0 .1 106 96 3 12 11 Biological mother and adoptive father . . . 0 .6 0 .6 0 .7 4 (NA) 407 445 479 (NA) Biological father and adoptive mother . . . 42 0 .1 – 30 20 4 – 10 Biological father and adoptive mother . . . 0 .1 0 .1 0 .1 4 (NA) 49 56 37 (NA) Adoptive mother and father . . . . . . . . . . . 906 1 .2 0 .1 539 464 167 125 103 Adoptive mother and father . . . . . . . . . . . 0 .9 0 .8 1 .0 0 .9 668 605 702 582 Other5 . . . . . . . . . . . . . . . . . . . . . . . . . . . 34 – – 31 19 – 3 11 Other5 . . . . . . . . . . . . . . . . . . . . . . . . . . . 0 .1 0 .1 – 3 .0 95 39 32 1,994
One parent . . . . . . . . . . . . . . . . . . . . . . . . . 20,211 27 .3 0 .5 12,416 8,519 6,166 283 4,679 One parent . . . . . . . . . . . . . . . . . . . . . . . . . 26 .4 25 .5 25 .4 24 .0 19,336 18,472 18,165 15,748 Mother only . . . . . . . . . . . . . . . . . . . . . . . 17,468 23 .6 0 .5 10,384 6,907 5,683 213 4,194 Mother only . . . . . . . . . . . . . . . . . . . . . . . 23 .2 22 .5 22 .9 21 .2 16,973 16,297 16,340 13,955 Biological . . . . . . . . . . . . . . . . . . . . . . . . 17,051 23 .0 0 .5 10,135 6,690 5,572 187 4,139 Biological . . . . . . . . . . . . . . . . . . . . . . . . 22 .6 22 .0 22 .5 (NA) 16,574 15,980 16,051 (NA) Father only . . . . . . . . . . . . . . . . . . . . . . . . 2,743 3 .7 0 .2 2,032 1,612 484 70 485 Father only . . . . . . . . . . . . . . . . . . . . . . . . 3 .2 3 .0 2 .6 2 .7 2,363 2,175 1,825 1,793 Biological . . . . . . . . . . . . . . . . . . . . . . . . 2,588 3 .5 0 .2 1,941 1,541 445 61 451 Biological . . . . . . . . . . . . . . . . . . . . . . . . 3 .1 2 .9 2 .4 (NA) 2,280 2,082 1,737 (NA)
No parent . . . . . . . . . . . . . . . . . . . . . . . . . . 3,083 4 .2 0 .2 1,768 1,201 976 96 656 No parent . . . . . . . . . . . . . . . . . . . . . . . . . . 3 .9 4 .0 3 .7 3 .3 2,878 2,917 2,644 2,153 Grandparents only . . . . . . . . . . . . . . . . . . 1,830 2 .5 0 .1 1,016 656 624 34 402 Grandparents only . . . . . . . . . . . . . . . . . . 2 .2 1 .9 1 .8 1 .7 1,598 1,407 1,266 1,099 Other relatives only . . . . . . . . . . . . . . . . . 632 0 .9 0 .1 371 251 202 30 147 Other relatives only . . . . . . . . . . . . . . . . . 0 .9 1 .2 1 .0 (NA) 641 889 688 (NA) Nonrelatives only . . . . . . . . . . . . . . . . . . . 545 0 .7 – 338 276 121 31 81 Nonrelatives only . . . . . . . . . . . . . . . . . . . 0 .8 0 .7 0 .9 (NA) 558 520 622 (NA) Other arrangement . . . . . . . . . . . . . . . . . 75 0 .1 0 .3 42 19 30 – 26 Other arrangement . . . . . . . . . . . . . . . . . 0 .1 0 .1 0 .1 (NA) 81 101 69 (NA)
At least 1 biological parent . . . . . . . . . . . . 69,535 93 .8 0 .3 53,440 39,531 9,979 2,370 15,488 At least 1 biological parent . . . . . . . . . . . . 94 .4 94 .5 94 .7 96 .7 69,105 68,531 67,739 63,574 At least 1 stepparent . . . . . . . . . . . . . . . . . 5,582 7 .5 0 .3 4,420 3,355 748 79 1,221 At least 1 stepparent . . . . . . . . . . . . . . . . . 7 .6 7 .0 6 .9 7 .0 5,532 5,081 4,902 4,594 At least 1 adoptive parent . . . . . . . . . . . . . 1,395 1 .9 0 .2 845 729 254 163 168 At least 1 adoptive parent . . . . . . . . . . . . . 2 .1 1 .9 2 .1 1 .6 1,504 1,372 1,484 1,062 At least 1 foster parent . . . . . . . . . . . . . . . 274 0 .4 0 .1 166 136 69 4 49 At least 1 foster parent . . . . . . . . . . . . . . . 0 .4 0 .4 0 .4 0 .3 308 260 313 207
See footnotes at end of table . – Represents or rounds to zero .
NA Not available .1 This number, when added to or subtracted from the estimated total number of children under age 18 in each category, represents the 90 percent
confidence interval around the estimate .2 In 1991, children living with a foster mother and father are included in the total .3 In the Survey of Income and Program Participation, two coresident parents can be identified regardless of their marital status . This means that both
married and unmarried parents are included in this category in this table . 4 In 1991 only, children living with one biological parent and one adoptive parent were shown in a biological parent/stepparent category .5 Includes children living with one adoptive parent and one stepparent or with two stepparents . Estimates for 1991 include children for whom the type of
relationship with the parent was not specified and not imputed .
Source: U .S . Census Bureau, Survey of Income and Program Participation (SIPP), 1991, 1996, 2001, 2004, and 2008 Panels, Wave 2 Topical Module . For information on sampling and nonsampling error, see <www .census .gov/sipp/source .html> .
U.S. Census Bureau 11
Table 2.Children by Presence and Type of Parent(s) and Race and Hispanic Origin: 1991, 1996, 2001, 2004, and 2009(Numbers in thousands)
Table 2.Children by Presence and Type of Parent(s) and Race and Hispanic Origin: 1991, 1996, 2001, 2004, and 2009—Con.(Numbers in thousands)
Percent Number
Living arrangements of children
2004, 2001, 1996, 1991, 2004, 2001, 1996, 199total total total total2 total total total tot
Children . . . . . . . . . . . . . . . . . . . . . . . . . . . . 73,227 72,501 71,494 65,727 73,227 72,501 71,494 65,7Percent . . . . . . . . . . . . . . . . . . . . . . . . . . . . 100 .0 100 .0 100 .0 100 .0 100 .0 100 .0 100 .0 100
Living with: Two parents3 . . . . . . . . . . . . . . . . . . . . . . . 69 .7 70 .5 70 .9 72 .8 51,013 51,113 50,685 47,8 Married parents . . . . . . . . . . . . . . . . . . . . 66 .6 67 .6 68 .8 71 .7 48,787 48,987 49,186 47,1 Unmarried parents . . . . . . . . . . . . . . . . . . 3 .0 2 .9 2 .1 1 .0 2,227 2,126 1,499 6
Biological mother and father . . . . . . . . . . 60 .8 62 .2 62 .5 61 .7 44,541 45,103 44,708 40,5 Married parents . . . . . . . . . . . . . . . . . . . 58 .3 59 .7 60 .7 (NA) 42,727 43,287 43,401 (N Biological mother and stepfather . . . . . . . 5 .7 5 .6 5 .2 5 .6 4,149 4,050 3,723 3,6 Biological father and stepmother . . . . . . . 1 .5 1 .1 1 .4 1 .3 1,106 815 1,004 8 Biological mother and adoptive father . . . 0 .6 0 .6 0 .7 4 (NA) 407 445 479 (N Biological father and adoptive mother . . . 0 .1 0 .1 0 .1 4 (NA) 49 56 37 (N Adoptive mother and father . . . . . . . . . . . 0 .9 0 .8 1 .0 0 .9 668 605 702 5 Other5 . . . . . . . . . . . . . . . . . . . . . . . . . . . 0 .1 0 .1 – 3 .0 95 39 32 1,9
One parent . . . . . . . . . . . . . . . . . . . . . . . . . 26 .4 25 .5 25 .4 24 .0 19,336 18,472 18,165 15,7 Mother only . . . . . . . . . . . . . . . . . . . . . . . 23 .2 22 .5 22 .9 21 .2 16,973 16,297 16,340 13,9 Biological . . . . . . . . . . . . . . . . . . . . . . . . 22 .6 22 .0 22 .5 (NA) 16,574 15,980 16,051 (N Father only . . . . . . . . . . . . . . . . . . . . . . . . 3 .2 3 .0 2 .6 2 .7 2,363 2,175 1,825 1,7 Biological . . . . . . . . . . . . . . . . . . . . . . . . 3 .1 2 .9 2 .4 (NA) 2,280 2,082 1,737 (N
No parent . . . . . . . . . . . . . . . . . . . . . . . . . . 3 .9 4 .0 3 .7 3 .3 2,878 2,917 2,644 2,1 Grandparents only . . . . . . . . . . . . . . . . . . 2 .2 1 .9 1 .8 1 .7 1,598 1,407 1,266 1,0 Other relatives only . . . . . . . . . . . . . . . . . 0 .9 1 .2 1 .0 (NA) 641 889 688 (N Nonrelatives only . . . . . . . . . . . . . . . . . . . 0 .8 0 .7 0 .9 (NA) 558 520 622 (N Other arrangement . . . . . . . . . . . . . . . . . 0 .1 0 .1 0 .1 (NA) 81 101 69 (N
At least 1 biological parent . . . . . . . . . . . . 94 .4 94 .5 94 .7 96 .7 69,105 68,531 67,739 63,5 At least 1 stepparent . . . . . . . . . . . . . . . . . 7 .6 7 .0 6 .9 7 .0 5,532 5,081 4,902 4,5 At least 1 adoptive parent . . . . . . . . . . . . . 2 .1 1 .9 2 .1 1 .6 1,504 1,372 1,484 1,0 At least 1 foster parent . . . . . . . . . . . . . . . 0 .4 0 .4 0 .4 0 .3 308 260 313 2
– Represents or rounds to zero .
NA Not available .1 This number, when added to or subtracted from the estimated total number of children under age 18 in each category, represents the 90 percent
confidence interval around the estimate .2 In 1991, children living with a foster mother and father are included in the total .3 In the Survey of Income and Program Participation, two coresident parents can be identified regardless of their marital status . This means that both
married and unmarried parents are included in this category in this table . 4 In 1991 only, children living with one biological parent and one adoptive parent were shown in a biological parent/stepparent category .5 Includes children living with one adoptive parent and one stepparent or with two stepparents . Estimates for 1991 include children for whom the type of
relationship with the parent was not specified and not imputed .
Source: U .S . Census Bureau, Survey of Income and Program Participation (SIPP), 1991, 1996, 2001, 2004, and 2008 Panels, Wave 2 Topical Module . For information on sampling and nonsampling error, see <www .census .gov/sipp/source .html> .
Living arrangements of children
2009
Total Race and Hispanic origin
Number Percent
Margin of
error1
White alone
White alone,
non- Hispanic
Black alone
Asian alone
Hispanic (any race)
1, al
Children . . . . . . . . . . . . . . . . . . . . . . . . . . . . 74,129 787 56,117 41,503 11,272 2,629 16,347 27Percent . . . . . . . . . . . . . . . . . . . . . . . . . . . . 100 .0 .0
Living with: Two parents3 . . . . . . . . . . . . . . . . . . . . . . . 50,835 68 .6 0 .6 41,934 31,784 4,129 2,250 11,012 26 Married parents . . . . . . . . . . . . . . . . . . . . 47,925 64 .7 0 .6 39,755 30,475 3,678 2,208 10,027 38 Unmarried parents . . . . . . . . . . . . . . . . . . 2,908 3 .9 0 .2 2,179 1,309 452 42 985 88
Biological mother and father . . . . . . . . . . 44,455 60 .0 0 .6 37,031 28,004 3,277 2,047 9,719 53 Married parents . . . . . . . . . . . . . . . . . . . 42,060 56 .7 0 .6 35,241 26,955 2,910 2,013 8,877 A) Biological mother and stepfather . . . . . . . 4,061 5 .5 0 .3 3,238 2,396 568 37 971 72 Biological father and stepmother . . . . . . . 1,195 1 .6 0 .2 959 785 111 28 188 30 Biological mother and adoptive father . . . 141 0 .2 0 .1 106 96 3 12 11 A) Biological father and adoptive mother . . . 42 0 .1 – 30 20 4 – 10 A) Adoptive mother and father . . . . . . . . . . . 906 1 .2 0 .1 539 464 167 125 103 82 Other5 . . . . . . . . . . . . . . . . . . . . . . . . . . . 34 – – 31 19 – 3 11 94
One parent . . . . . . . . . . . . . . . . . . . . . . . . . 20,211 27 .3 0 .5 12,416 8,519 6,166 283 4,679 48 Mother only . . . . . . . . . . . . . . . . . . . . . . . 17,468 23 .6 0 .5 10,384 6,907 5,683 213 4,194 55 Biological . . . . . . . . . . . . . . . . . . . . . . . . 17,051 23 .0 0 .5 10,135 6,690 5,572 187 4,139 A) Father only . . . . . . . . . . . . . . . . . . . . . . . . 2,743 3 .7 0 .2 2,032 1,612 484 70 485 93 Biological . . . . . . . . . . . . . . . . . . . . . . . . 2,588 3 .5 0 .2 1,941 1,541 445 61 451 A)
No parent . . . . . . . . . . . . . . . . . . . . . . . . . . 3,083 4 .2 0 .2 1,768 1,201 976 96 656 53 Grandparents only . . . . . . . . . . . . . . . . . . 1,830 2 .5 0 .1 1,016 656 624 34 402 99 Other relatives only . . . . . . . . . . . . . . . . . 632 0 .9 0 .1 371 251 202 30 147 A) Nonrelatives only . . . . . . . . . . . . . . . . . . . 545 0 .7 – 338 276 121 31 81 A) Other arrangement . . . . . . . . . . . . . . . . . 75 0 .1 0 .3 42 19 30 – 26 A)
At least 1 biological parent . . . . . . . . . . . . 69,535 93 .8 0 .3 53,440 39,531 9,979 2,370 15,488 74 At least 1 stepparent . . . . . . . . . . . . . . . . . 5,582 7 .5 0 .3 4,420 3,355 748 79 1,221 94 At least 1 adoptive parent . . . . . . . . . . . . . 1,395 1 .9 0 .2 845 729 254 163 168 62 At least 1 foster parent . . . . . . . . . . . . . . . 274 0 .4 0 .1 166 136 69 4 49 07
See footnotes at end of table .
12 U.S. Census Bureau
Table 3.Children by Parent’s Cohabitation Status and Race and Hispanic Origin: 2009(Numbers in thousands)
Living arrangements of children
Total Race and Hispanic origin
Num-ber
Per-cent
Percent Number
White alone
White alone, Non- His-
panicBlack alone
Asian alone
His-panic (any
race)White alone
White alone, Non-His-
panicBlack alone
Asian alone
His-panic (any
race)
Children . . . . . . . . . . . . . . . . . . 74,129 100 .0 100 .0 100 .0 100 .0 100 .0 100 .0 56,117 41,503 11,272 2,629 16,347
Living with married parents . . . 47,925 64 .7 70 .8 73 .4 32 .6 84 .0 61 .3 39,755 30,475 3,678 2,208 10,027
Living with no parent . . . . . . . . 3,083 4 .2 3 .1 2 .9 8 .7 3 .6 4 .0 1,768 1,201 976 96 656
Living with an unmarried parent1 . . . . . . . . . . . . . . . . . . 23,119 31 .2 26 .0 23 .7 58 .7 12 .3 34 .6 14,595 9,827 6,618 324 5,664
Living with unmarried mother and father . . . . . . . . 2,908 3 .9 3 .9 3 .2 4 .0 1 .6 6 .0 2,180 1,309 452 42 986
Living with unmarried mother only . . . . . . . . . . . . . 17,468 23 .6 18 .5 16 .6 50 .4 8 .1 25 .7 10,384 6,907 5,683 213 4,194
Living with unmarried father only . . . . . . . . . . . . . . 2,743 3 .7 3 .6 3 .9 4 .3 2 .7 3 .0 2,032 1,612 484 70 485
Parent has an unmarried partner . . . . . . . . . . . . . . . . . 4,828 6 .5 6 .5 5 .8 6 .6 2 .0 8 .6 3,639 2,416 743 53 1,398
Biological mother and father . . . . . . . . . . . . . . . . 2,396 3 .2 3 .2 2 .5 3 .3 1 .3 5 .2 1,790 1,049 367 34 842
One biological parent, one step- or adoptive parent . . 515 0 .7 0 .7 0 .6 0 .8 0 .3 0 .9 390 260 85 8 144
Biological mother or father, partner . . . . . . . . . . 1,802 2 .4 2 .5 2 .5 2 .4 0 .3 2 .4 1,382 1,041 266 8 393
Step- or adoptive parent, partner . . . . . . . . . . . . . . . . 116 0 .2 0 .1 0 .2 0 .2 0 .1 0 .1 77 66 26 3 20
Parent has no unmarried partner . . . . . . . . . . . . . . . . . 18,293 24 .7 19 .5 17 .9 52 .1 10 .3 26 .1 10,956 7,411 5,875 271 4,266
Biological mother . . . . . . . . . 15,600 21 .0 16 .1 14 .2 47 .4 6 .8 23 .2 9,035 5,891 5,343 179 3,796 Living with other adult
relative2 . . . . . . . . . . . . . . 3,735 5 .0 4 .1 3 .3 9 .9 2 .3 6 .6 2,317 1,378 1,111 60 1,073 Living with opposite sex
adult nonrelative3 . . . . . . . 318 0 .4 0 .4 0 .4 0 .6 0 .1 0 .6 222 157 63 2 90 Biological father . . . . . . . . . . 2,239 3 .0 3 .0 3 .1 3 .6 2 .3 2 .5 1,657 1,298 407 60 401 Living with other adult
relative2 . . . . . . . . . . . . . . 489 0 .7 0 .5 0 .4 1 .2 0 .8 1 .0 306 166 130 22 163 Living with opposite sex
adult nonrelative3 . . . . . . . 54 0 .1 0 .1 0 .1 0 .1 – 0 .1 41 30 11 – 12 Stepparent or adoptive
parent . . . . . . . . . . . . . . . . 455 0 .6 0 .5 0 .5 1 .1 1 .2 0 .4 263 222 124 32 70
– Represents or rounds to zero .1 Unmarried includes married, spouse absent; widowed, divorced, separated, and never married .2 The category “other adult relative” does not include the child’s siblings .3 Only includes “adult nonrelatives” who are not in the category “married spouse present .”
Source: U .S . Census Bureau, Survey of Income and Program Participation, 2008 Panel, Wave 2 Topical Module . For information on sampling and nonsampling error, see <www .census .gov/sipp/sourceac/S&A08_W1toW3(S&A-12) .pdf> .
U.S. Census Bureau 13
some time before reaching age 16.24 Twenty-four percent of all children lived with their unmarried mother without their father present (17.5 million), while 4 percent (2.7 million) lived with their unmarried father without their mother present. The percentage of children living with their unmarried mother without their father present varied widely among race and origin groups, from 8 per-cent for Asian children to 50 percent for Black children. Seventeen percent of White, non-Hispanic children and 26 percent of Hispanic children also lived with their unmarried mother without their father present.
The overall pattern of living arrange-ments of children with unmarried parents clearly indicates that women are the primary custodial parents of these children, and that these children usually have unmarried mothers living without a partner
24 Heuveline, Patrick, Jeffrey M. Timberlake and Frank F. Furstenberg, Jr., “Shifting Childbearing to Single Mothers: Results From 17 Western Countries,” Population and Development Review, 2003, Vol. 29:1,pp. 47–71.
present. Of the 19.9 million children living with their unmarried biologi-cal mothers, 4.3 million (21 percent) had mothers who were living with unmarried partners. In comparison, of the 5.1 million children living with their unmarried biological fathers, 2.7 million (54 percent) were living with fathers who were living with an unmarried partner, of whom 2.4 million were also the child’s biological mother. Indeed, 94 percent of all fathers who lived with their children under age 18 also lived with the child’s mother.25
Seven percent of all children under age 18 lived with an unmarried par-ent that was cohabiting. The percent-age of all children who lived with a cohabiting parent ranged from 2 per-cent for Asian children to 9 percent for Hispanic children. Six percent of White, non-Hispanic children and 7 percent of Black children lived with a
25 Kreider, Rose M. and Diana B. Elliott, “America’s Families and Living Arrangements: 2007,” Current Population Reports, P20-561, U.S. Census Bureau, Washington, DC, 2009.
cohabiting parent.26 The proportion of children living with cohabiting par-ents who lived with both biological parents varied across race and origin. About half of White, non-Hispanic children and Black children living with cohabiting parents lived with both biological parents. A majority of Hispanic children (60 percent) living with cohabiting parents were living with both biological parents.
Children With Siblings
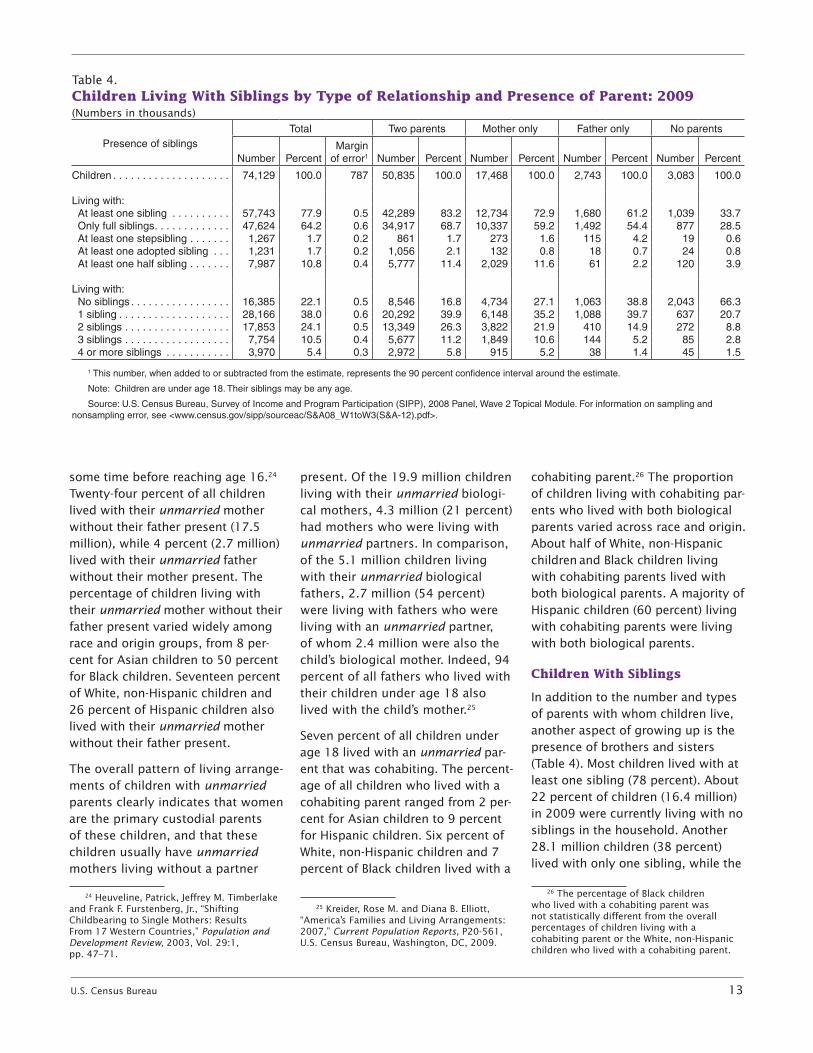
In addition to the number and types of parents with whom children live, another aspect of growing up is the presence of brothers and sisters (Table 4). Most children lived with at least one sibling (78 percent). About 22 percent of children (16.4 million) in 2009 were currently living with no siblings in the household. Another 28.1 million children (38 percent) lived with only one sibling, while the
26 The percentage of Black children who lived with a cohabiting parent was not statistically different from the overall percentages of children living with a cohabiting parent or the White, non-Hispanic children who lived with a cohabiting parent.
Table 4.Children Living With Siblings by Type of Relationship and Presence of Parent: 2009(Numbers in thousands)
Presence of siblingsTotal Two parents Mother only Father only No parents
Number PercentMargin
of error1 Number Percent Number Percent Number Percent Number Percent
Children . . . . . . . . . . . . . . . . . . . . 74,129 100 .0 787 50,835 100 .0 17,468 100 .0 2,743 100 .0 3,083 100 .0
Living with: At least one sibling . . . . . . . . . . 57,743 77 .9 0 .5 42,289 83 .2 12,734 72 .9 1,680 61 .2 1,039 33 .7 Only full siblings . . . . . . . . . . . . . 47,624 64 .2 0 .6 34,917 68 .7 10,337 59 .2 1,492 54 .4 877 28 .5 At least one stepsibling . . . . . . . 1,267 1 .7 0 .2 861 1 .7 273 1 .6 115 4 .2 19 0 .6 At least one adopted sibling . . . 1,231 1 .7 0 .2 1,056 2 .1 132 0 .8 18 0 .7 24 0 .8 At least one half sibling . . . . . . . 7,987 10 .8 0 .4 5,777 11 .4 2,029 11 .6 61 2 .2 120 3 .9
Living with: No siblings . . . . . . . . . . . . . . . . . 16,385 22 .1 0 .5 8,546 16 .8 4,734 27 .1 1,063 38 .8 2,043 66 .3 1 sibling . . . . . . . . . . . . . . . . . . . 28,166 38 .0 0 .6 20,292 39 .9 6,148 35 .2 1,088 39 .7 637 20 .7 2 siblings . . . . . . . . . . . . . . . . . . 17,853 24 .1 0 .5 13,349 26 .3 3,822 21 .9 410 14 .9 272 8 .8 3 siblings . . . . . . . . . . . . . . . . . . 7,754 10 .5 0 .4 5,677 11 .2 1,849 10 .6 144 5 .2 85 2 .8 4 or more siblings . . . . . . . . . . . 3,970 5 .4 0 .3 2,972 5 .8 915 5 .2 38 1 .4 45 1 .5
1 This number, when added to or subtracted from the estimate, represents the 90 percent confidence interval around the estimate .
Note: Children are under age 18 . Their siblings may be any age .
Source: U .S . Census Bureau, Survey of Income and Program Participation (SIPP), 2008 Panel, Wave 2 Topical Module . For information on sampling and nonsampling error, see <www .census .gov/sipp/sourceac/S&A08_W1toW3(S&A-12) .pdf> .
14 U.S. Census Bureau
remaining 29.6 million (40 percent) lived with two or more siblings. The majority (62 percent) lived with one or two siblings, while 16 percent lived with three or more siblings.
Of the 57.7 million children living with siblings, 47.6 million lived only with full siblings (children who had the same biological mother and father). Eleven percent of all children lived with at least one half sibling (sharing only one biologi-cal parent), 2 percent with at least one stepsibling (having no common biological parent), and another 2 percent with at least one adopted
sibling.27 A larger proportion of children living with two parents had siblings (83 percent) than was the case for children living with their mother only (73 percent) or their father only (61 percent). These dif-ferences could result from siblings being split up after divorce or separation. Among the 3.1 million children living with no parents, 34 percent lived with siblings.
27 The percentage of children who lived with at least one stepsibling does not differ statistically from the percentage of children who lived with at least one adopted sibling.
Children With Half Siblings
In addition to living with siblings, some children live in blended fami-lies with half siblings present.
Recent research suggests that living with a half sibling is associ-ated with lower well-being.28 SIPP is one of the few data sources that
28 Wood Strow, Claudia, and Brian Kent Strow, “Evidence That the Presence of a Half Sibling Negatively Impacts a Child’s Personal Development,” American Journal of Economics and Sociology, 2008, Vol. 67:2, pp. 177–206.
Ginther, Donna K. and Robert A. Pollak. “Family Structure and Children’s Educational Outcomes: Blended Families, Stylized Facts, and Descriptive Regressions,” Demography, 2004, Vol. 41:4, pp. 671–696.
Halpern-Meekin, Sarah and Laura Tach, “Heterogeneity in Two-Parent Families and Adolescent Well-Being,” Journal of Marriage and Family, 2008, Vol. 70, pp. 435–451.
Figure 7.Children Living With Cohabiting Parents by Number and Type of Parents: 2009
Note: Base less than 75,000 for Asian children, so this group cannot be shown in this figure.
Source: U.S. Census Bureau, Survey of Income and Program Participation (SIPP), 2008 Panel, Wave 2 Topical Module. For information on sampling and nonsampling error, see <www.census.gov/sipp/sourceac/S&A08_W1toW3(S&A-12).pdf>.
Both biologicalparents
One biologicalparent and onestep- or adoptiveparent
Biological mother only
Biological father only
Number of Children (in thousands)
One step- or adoptive parent
All
Black
Hispanic
White, non–Hispanic
0 500 1,000 1,500 2,000 2,500 3,000 3,500 4,000 4,500 5,000
743
4,828
2,416
1,398
U.S. Census Bureau 15
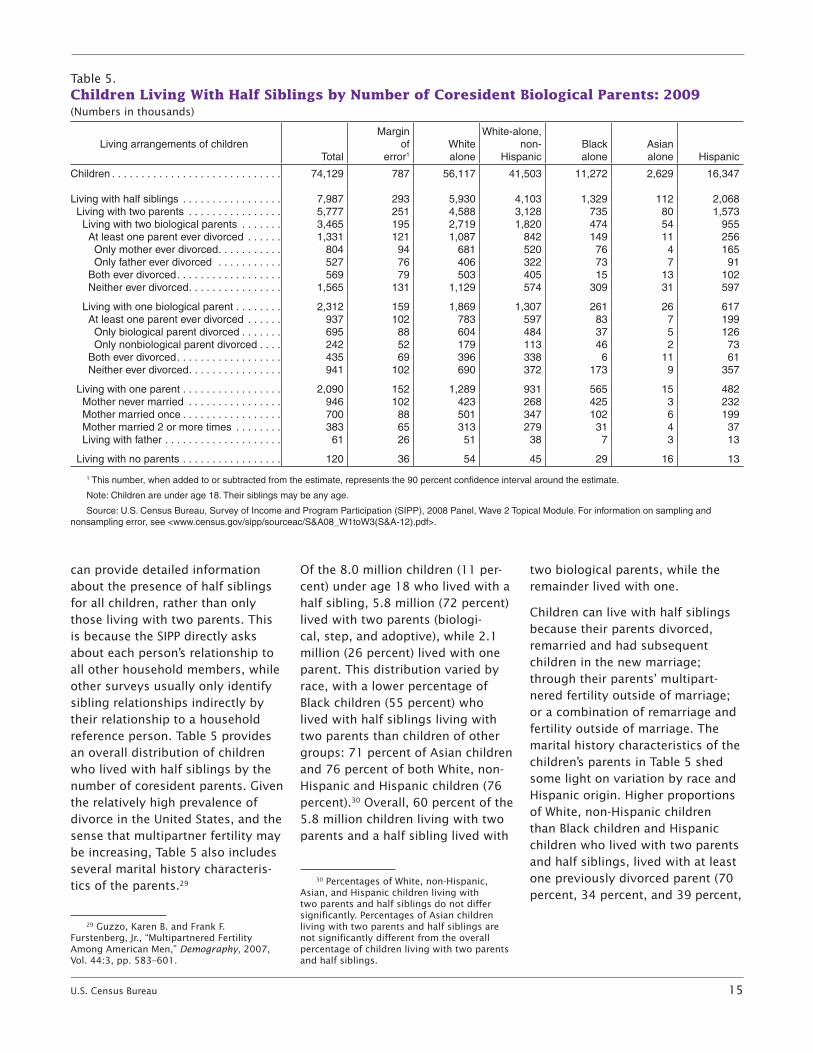
can provide detailed information about the presence of half siblings for all children, rather than only those living with two parents. This is because the SIPP directly asks about each person’s relationship to all other household members, while other surveys usually only identify sibling relationships indirectly by their relationship to a household reference person. Table 5 provides an overall distribution of children who lived with half siblings by the number of coresident parents. Given the relatively high prevalence of divorce in the United States, and the sense that multipartner fertility may be increasing, Table 5 also includes several marital history characteris-tics of the parents.29
29 Guzzo, Karen B. and Frank F. Furstenberg, Jr., “Multipartnered Fertility Among American Men,” Demography, 2007, Vol. 44:3, pp. 583–601.
Of the 8.0 million children (11 per-cent) under age 18 who lived with a half sibling, 5.8 million (72 percent) lived with two parents (biologi-cal, step, and adoptive), while 2.1 million (26 percent) lived with one parent. This distribution varied by race, with a lower percentage of Black children (55 percent) who lived with half siblings living with two parents than children of other groups: 71 percent of Asian children and 76 percent of both White, non-Hispanic and Hispanic children (76 percent).30 Overall, 60 percent of the 5.8 million children living with two parents and a half sibling lived with
30 Percentages of White, non-Hispanic, Asian, and Hispanic children living with two parents and half siblings do not differ significantly. Percentages of Asian children living with two parents and half siblings are not significantly different from the overall percentage of children living with two parents and half siblings.
two biological parents, while the remainder lived with one.
Children can live with half siblings because their parents divorced, remarried and had subsequent children in the new marriage; through their parents’ multipart-nered fertility outside of marriage; or a combination of remarriage and fertility outside of marriage. The marital history characteristics of the children’s parents in Table 5 shed some light on variation by race and Hispanic origin. Higher proportions of White, non-Hispanic children than Black children and Hispanic children who lived with two parents and half siblings, lived with at least one previously divorced parent (70 percent, 34 percent, and 39 percent,
Table 5.Children Living With Half Siblings by Number of Coresident Biological Parents: 2009(Numbers in thousands)
Living arrangements of childrenTotal
Margin of
error1
White alone
White-alone, non-
HispanicBlack alone
Asian alone Hispanic
Children . . . . . . . . . . . . . . . . . . . . . . . . . . . . . 74,129 787 56,117 41,503 11,272 2,629 16,347
Living with half siblings . . . . . . . . . . . . . . . . . 7,987 293 5,930 4,103 1,329 112 2,068 Living with two parents . . . . . . . . . . . . . . . . 5,777 251 4,588 3,128 735 80 1,573 Living with two biological parents . . . . . . . 3,465 195 2,719 1,820 474 54 955 At least one parent ever divorced . . . . . . 1,331 121 1,087 842 149 11 256 Only mother ever divorced . . . . . . . . . . . 804 94 681 520 76 4 165 Only father ever divorced . . . . . . . . . . . 527 76 406 322 73 7 91 Both ever divorced . . . . . . . . . . . . . . . . . . 569 79 503 405 15 13 102 Neither ever divorced . . . . . . . . . . . . . . . . 1,565 131 1,129 574 309 31 597
Living with one biological parent . . . . . . . . 2,312 159 1,869 1,307 261 26 617 At least one parent ever divorced . . . . . . 937 102 783 597 83 7 199 Only biological parent divorced . . . . . . . 695 88 604 484 37 5 126 Only nonbiological parent divorced . . . . 242 52 179 113 46 2 73 Both ever divorced . . . . . . . . . . . . . . . . . . 435 69 396 338 6 11 61 Neither ever divorced . . . . . . . . . . . . . . . . 941 102 690 372 173 9 357
Living with one parent . . . . . . . . . . . . . . . . . 2,090 152 1,289 931 565 15 482 Mother never married . . . . . . . . . . . . . . . . 946 102 423 268 425 3 232 Mother married once . . . . . . . . . . . . . . . . . 700 88 501 347 102 6 199 Mother married 2 or more times . . . . . . . . 383 65 313 279 31 4 37 Living with father . . . . . . . . . . . . . . . . . . . . 61 26 51 38 7 3 13
Living with no parents . . . . . . . . . . . . . . . . . 120 36 54 45 29 16 13
1 This number, when added to or subtracted from the estimate, represents the 90 percent confidence interval around the estimate .
Note: Children are under age 18 . Their siblings may be any age .
Source: U .S . Census Bureau, Survey of Income and Program Participation (SIPP), 2008 Panel, Wave 2 Topical Module . For information on sampling and nonsampling error, see <www .census .gov/sipp/sourceac/S&A08_W1toW3(S&A-12) .pdf> .
16 U.S. Census Bureau
Table 6.Children Living in Blended Families by Composition of Family and Child’s Race and Hispanic Origin: 20091
(Numbers in thousands)
Relationships in householdAll races White alone
Black alone
Asian alone
Hispanic (any race)Estimate
Margin of error2 Total
Non- Hispanic
Children . . . . . . . . . . . . . . . . . . . . . . . . . . . . . . . 74,129 787 56,117 41,503 11,272 2,629 16,347 Children living in a blended family . . . . . . . . . . 11,687 353 8,774 6,372 1,898 186 2,743 Percentage of all children . . . . . . . . . . . . . . . 15 .8 0 .4 15 .6 15 .4 16 .8 7 .1 16 .8 Percentage of children living in a blended
family, of those living with 2 parents . . . . . . . 17 .6 0 .6 16 .9 16 .2 28 .1 6 .3 19 .4 Percentage of children living in a blended
family, of those living with 1 parent . . . . . . . . 12 .9 0 .8 13 .2 14 .0 11 .2 9 .9 12 .6
TYPE OF BLENDED FAMILY Stepparent only . . . . . . . . . . . . . . . . . . . . . . . 2,715 173 2,064 1,627 411 56 528 Stepsibling only . . . . . . . . . . . . . . . . . . . . . . . 277 55 178 122 74 14 56 Half sibling only . . . . . . . . . . . . . . . . . . . . . . . 5,624 247 4,020 2,760 1,063 83 1,441 Stepparent and stepsibling . . . . . . . . . . . . . . 682 87 582 503 81 5 88 Stepparent and half sibling . . . . . . . . . . . . . . 1,924 146 1,559 1,065 241 19 541 Stepsibling and half sibling . . . . . . . . . . . . . . 42 22 36 31 5 – 9 Stepparent, stepsibling, and
half sibling . . . . . . . . . . . . . . . . . . . . . . . . . . 261 54 216 160 15 – 64 One biological parent and one
adoptive parent, and step-, adopted, or half siblings . . . . . . . . . . . . . . . . . . . . . . 162 42 120 104 7 10 16
Total living with a stepparent . . . . . . . . . . . . . 5,582 246 4,421 3,355 748 80 1,221
Percentage of children living in a blended family . . . . . . . . . . . . . . . . . . . . . . . 100 .0 (X) 100 .0 100 .0 100 .0 100 .0 100 .0
Stepparent only . . . . . . . . . . . . . . . . . . . . . . . 23 .2 1 .3 23 .5 25 .5 21 .7 30 .1 19 .2 Stepsibling only . . . . . . . . . . . . . . . . . . . . . . . 2 .4 0 .5 2 .0 1 .9 3 .9 7 .5 2 .0 Half sibling only . . . . . . . . . . . . . . . . . . . . . . . 48 .1 1 .5 45 .8 43 .3 56 .0 44 .6 52 .5 Stepparent and stepsibling . . . . . . . . . . . . . . 5 .8 0 .7 6 .6 7 .9 4 .3 2 .7 3 .2 Stepparent and half sibling . . . . . . . . . . . . . . 16 .5 1 .1 17 .8 16 .7 12 .7 10 .2 19 .7 Stepsibling and half sibling . . . . . . . . . . . . . . 0 .4 0 .2 0 .4 0 .5 0 .3 – 0 .3 Stepparent, stepsibling, and half sibling . . . . 2 .2 0 .5 2 .5 2 .5 0 .8 – 2 .3 One biological parent and one
adoptive parent, and step-, adopted, or half siblings . . . . . . . . . . . . . . . . . . . . . . . 1 .4 0 .4 1 .4 1 .6 0 .4 5 .4 0 .6
Percentage living with a stepparent . . . . . . . . . 47 .8 1 .5 50 .4 52 .7 39 .4 43 .0 44 .5
– Represent or rounds to zero .
X Not applicable . 1 Blended families are formed when remarriages occur or when children living in a household share only one or no biological parents . The presence of a
stepparent, stepsibling, or half sibling designates a family as blended .2 This number, when added to or subtracted from the estimate, represents the 90 percent confidence interval around the estimate .
Source: U .S . Census Bureau, Survey of Income and Program Participation (SIPP), 2008 Panel, Wave 2 Topical Module . For information on sampling and nonsampling error, see <www .census .gov/sipp/sourceac/S&A08_W1toW3(S&A-12) .pdf> .
U.S. Census Bureau 17
respectively).31 Higher percentages of White, non-Hispanic children living with two parents and half siblings, also had both parents who had expe-rienced a divorce (24 percent) than either Black children (3 percent) or Hispanic children (10 percent).
The majority of Black and Hispanic children, 66 percent and 61 percent, respectively, had neither parent divorced (including couples where neither had ever married) among those living with two parents and half siblings.32
For children living with one parent and half siblings, Table 5 shows only the number of times their
31 Percentages of White, non-Hispanic children and Black children that lived with two parents that had not divorced and had a half sibling were not significantly different.
32 Percentages of Black children living with two parents, at least one previously divorced, and half siblings are not significantly different from percentages of Hispanic children living with two parents, at least one previously divorced, and half siblings.
mother had married, since few of these children lived with their father (3 percent). Seventy percent of White, non-Hispanic children who lived with a half sibling and just their mother lived with an ever-married mother, compared to 24 percent of Black children and 50 percent of Hispanic children. Higher proportions of Black children (75 percent) and Hispanic children (48 percent) lived with a never- married mother than White, non-Hispanic children (29 percent). Thirty percent of White, non-Hispanic children lived with a mother who had been mar-ried two or more times, compared with 5 percent of Black children, and 8 percent of Hispanic children.33 These differences highlight the fact that marriage and remarriage are
33 Percentages of Black children livingwith a mother who had been married two or more times are not significantly different from percentages of Hispanic children living with a mother who had been married two or more times.
more important factors in creat-ing living situations where children coreside with a half sibling for White, non-Hispanic children than for Black or Hispanic children.
Children in Blended Families
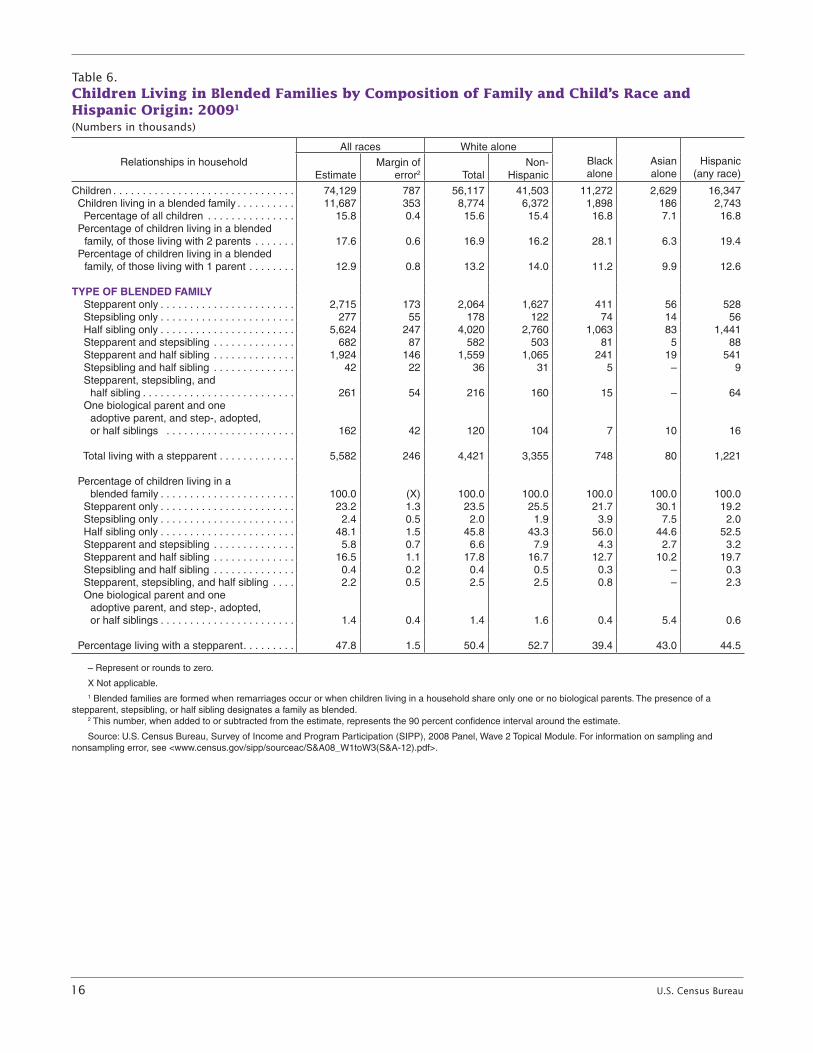
In addition to living with half sib-lings, children live in other types of blended families. Blended families include those that contain step-children and their stepparents, half siblings, or stepsiblings. Blended families can be formed when couples remarry or live with new partners who bring children from previous unions, or who combine children from previous and current unions. The complexity of family arrangements is illustrated in Table 6. Overall, 16 percent (11.7 million) of all children lived in blended families. In 2009, 8.0 million children lived with at least one half sibling (Table 5), representing 11 percent of all children and 68 percent of children in blended families.
Table 6 shows the proportion of children who were in blended fami-lies in 2009 by the child’s race and Hispanic origin.34 Seven percent of Asian children lived in blended fami-lies, lower than for any of the other race or Hispanic groups. Lower rates of births to unmarried women and divorce may contribute to lower
34 Table 5 differs in several ways from Table 4 in the report on “Living Arrangements of Children: 1996” that it updates. In 2001, 2004, and 2009, adopted siblings were not included with stepsiblings as they were in 1996 and 1991, but were coded separately. An additional category for children living with one biological and one adoptive parent and siblings who are the child’s step-, adopted, or half sibling is included. Many of these adopted children were first the stepchildren of their adoptive parent, and the adoption took place following the remarriage of the biological parent with whom they live.
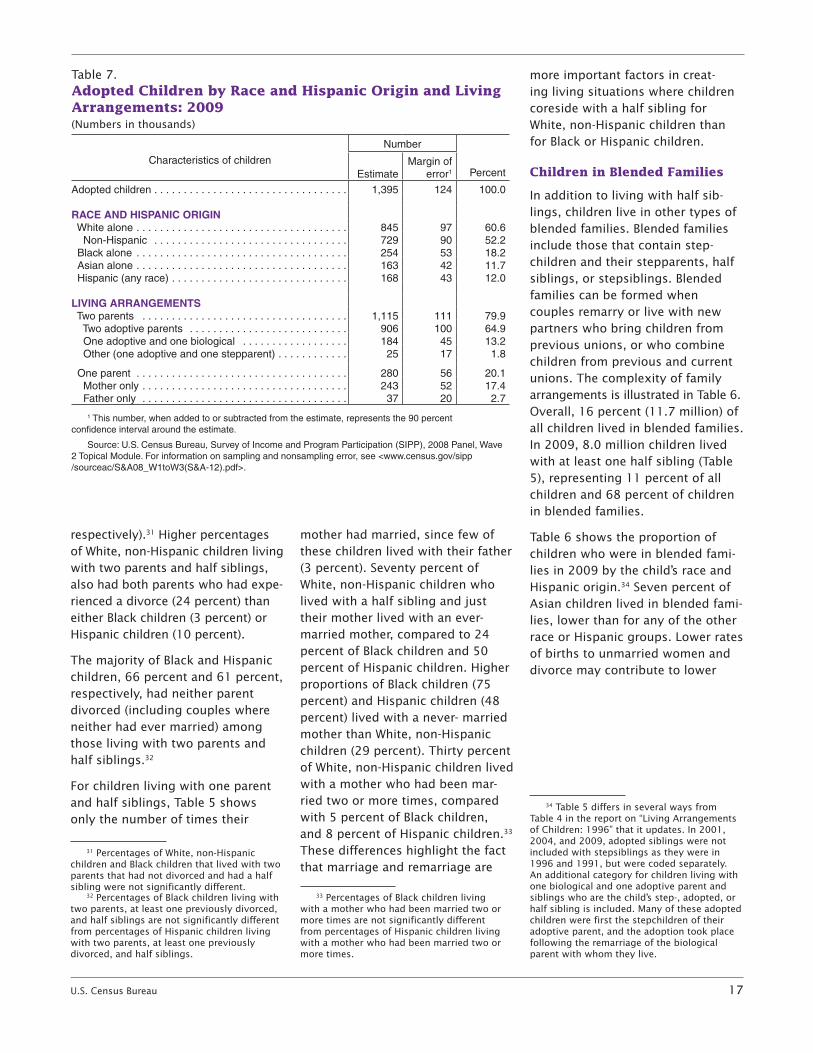
Table 7.Adopted Children by Race and Hispanic Origin and Living Arrangements: 2009(Numbers in thousands)
Characteristics of children
Number
PercentEstimateMargin of
error1
Adopted children . . . . . . . . . . . . . . . . . . . . . . . . . . . . . . . . . 1,395 124 100 .0
RACE AND HISPANIC ORIGIN White alone . . . . . . . . . . . . . . . . . . . . . . . . . . . . . . . . . . . . 845 97 60 .6 Non-Hispanic . . . . . . . . . . . . . . . . . . . . . . . . . . . . . . . . . 729 90 52 .2 Black alone . . . . . . . . . . . . . . . . . . . . . . . . . . . . . . . . . . . . 254 53 18 .2 Asian alone . . . . . . . . . . . . . . . . . . . . . . . . . . . . . . . . . . . . 163 42 11 .7 Hispanic (any race) . . . . . . . . . . . . . . . . . . . . . . . . . . . . . . 168 43 12 .0
LIVING ARRANGEMENTS Two parents . . . . . . . . . . . . . . . . . . . . . . . . . . . . . . . . . . . 1,115 111 79 .9 Two adoptive parents . . . . . . . . . . . . . . . . . . . . . . . . . . . 906 100 64 .9 One adoptive and one biological . . . . . . . . . . . . . . . . . . 184 45 13 .2 Other (one adoptive and one stepparent) . . . . . . . . . . . . 25 17 1 .8
One parent . . . . . . . . . . . . . . . . . . . . . . . . . . . . . . . . . . . . 280 56 20 .1 Mother only . . . . . . . . . . . . . . . . . . . . . . . . . . . . . . . . . . . 243 52 17 .4 Father only . . . . . . . . . . . . . . . . . . . . . . . . . . . . . . . . . . . 37 20 2 .7
1 This number, when added to or subtracted from the estimate, represents the 90 percent confidence interval around the estimate .
Source: U .S . Census Bureau, Survey of Income and Program Participation (SIPP), 2008 Panel, Wave 2 Topical Module . For information on sampling and nonsampling error, see <www .census .gov/sipp /sourceac/S&A08_W1toW3(S&A-12) .pdf> .
18 U.S. Census Bureau
rates of Asian children living in blended families.35
After living with half siblings, living with a stepparent is the next-largest living arrangement that contributes to children living in a blended fam-ily—8 percent of all children and 48 percent of children in blended families lived with a stepparent. In
35 See the National Vital Statistics Reports for data on births and trends in childbearing among unmarried women, teenagers, and the general population. For example, see Table A in Martin, Joyce A. et al., “Births: Preliminary Data for 2007,” National Vital Statistics Reports, National Center for Health Statistics, Hyattsville, MD, 2010, Vol. 58, No. 24.
For data on divorce by race, see Figure 5 in the following report: Kreider, Rose M. and Renee Ellis, “Number, Timing, and Duration of Marriages and Divorces: 2009,” Current Population Reports, P70-125, U.S. Census Bureau, Washington, DC, 2011.
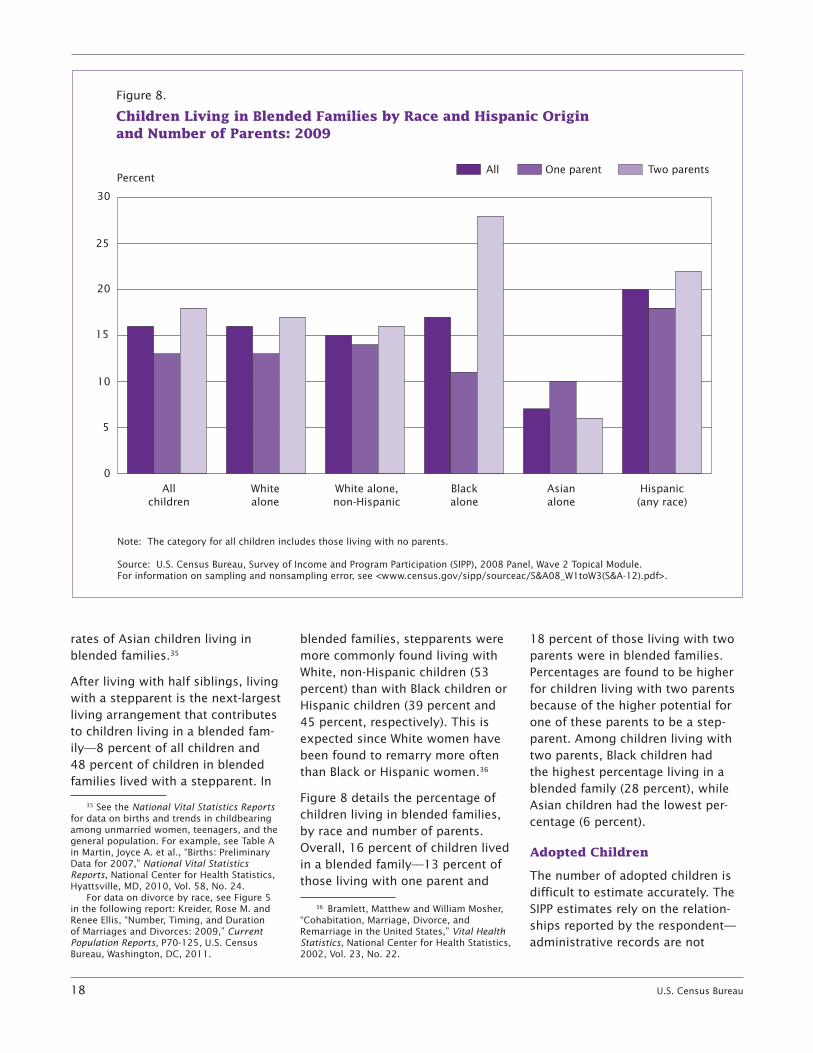
blended families, stepparents were more commonly found living with White, non-Hispanic children (53 percent) than with Black children or Hispanic children (39 percent and 45 percent, respectively). This is expected since White women have been found to remarry more often than Black or Hispanic women.36
Figure 8 details the percentage of children living in blended families, by race and number of parents. Overall, 16 percent of children lived in a blended family—13 percent of those living with one parent and
36 Bramlett, Matthew and William Mosher, “Cohabitation, Marriage, Divorce, and Remarriage in the United States,” Vital Health Statistics, National Center for Health Statistics, 2002, Vol. 23, No. 22.
18 percent of those living with two parents were in blended families. Percentages are found to be higher for children living with two parents because of the higher potential for one of these parents to be a step-parent. Among children living with two parents, Black children had the highest percentage living in a blended family (28 percent), while Asian children had the lowest per-centage (6 percent).
Adopted Children
The number of adopted children is difficult to estimate accurately. The SIPP estimates rely on the relation-ships reported by the respondent—administrative records are not
0
5
10
15
20
25
30
Two parentsOne parentAll
Hispanic(any race)
Blackalone
Asianalone
White alone,non-Hispanic
Whitealone
Allchildren
Percent
Children Living in Blended Families by Race and Hispanic Origin and Number of Parents: 2009
Figure 8.
Note: The category for all children includes those living with no parents.
Source: U.S. Census Bureau, Survey of Income and Program Participation (SIPP), 2008 Panel, Wave 2 Topical Module. For information on sampling and nonsampling error, see <www.census.gov/sipp/sourceac/S&A08_W1toW3(S&A-12).pdf>.
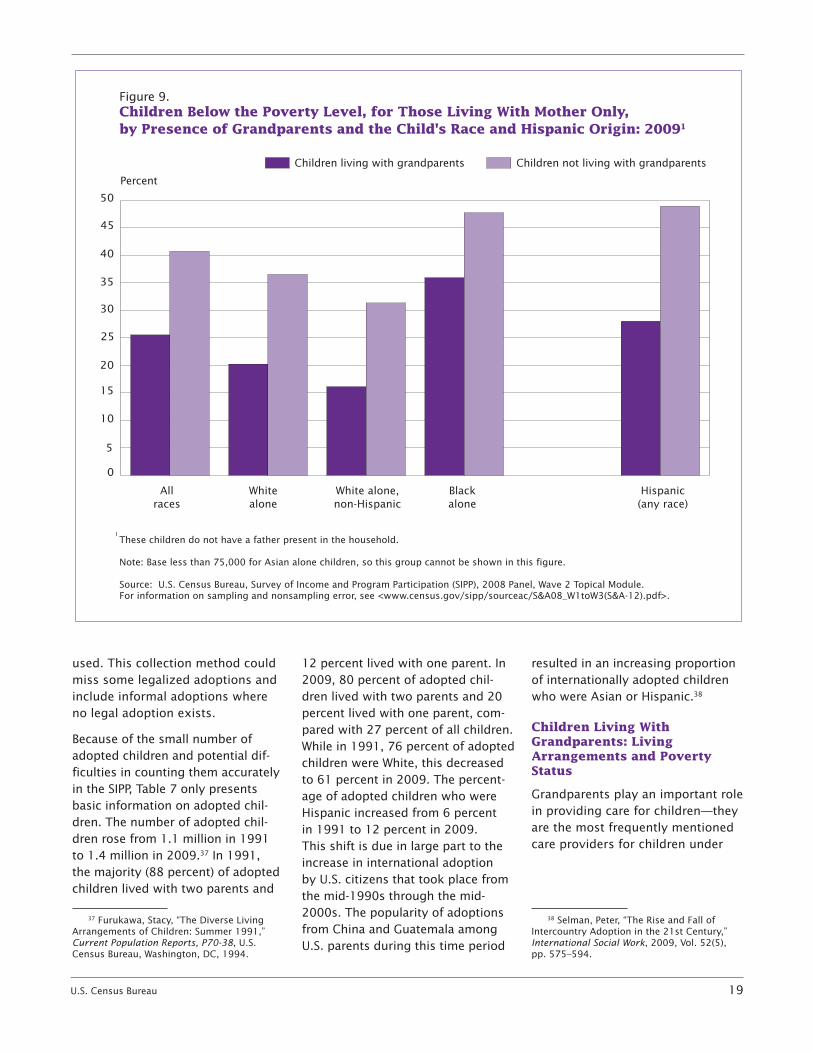
U.S. Census Bureau 19
used. This collection method could miss some legalized adoptions and include informal adoptions where no legal adoption exists.
Because of the small number of adopted children and potential dif-ficulties in counting them accurately in the SIPP, Table 7 only presents basic information on adopted chil-dren. The number of adopted chil-dren rose from 1.1 million in 1991 to 1.4 million in 2009.37 In 1991, the majority (88 percent) of adopted children lived with two parents and
37 Furukawa, Stacy, “The Diverse Living Arrangements of Children: Summer 1991,” Current Population Reports, P70-38, U.S. Census Bureau, Washington, DC, 1994.
12 percent lived with one parent. In 2009, 80 percent of adopted chil-dren lived with two parents and 20 percent lived with one parent, com-pared with 27 percent of all children. While in 1991, 76 percent of adopted children were White, this decreased to 61 percent in 2009. The percent-age of adopted children who were Hispanic increased from 6 percent in 1991 to 12 percent in 2009. This shift is due in large part to the increase in international adoption by U.S. citizens that took place from the mid-1990s through the mid-2000s. The popularity of adoptions from China and Guatemala among U.S. parents during this time period
resulted in an increasing proportion of internationally adopted children who were Asian or Hispanic.38
Children Living With Grandparents: Living Arrangements and Poverty Status
Grandparents play an important role in providing care for children—they are the most frequently mentioned care providers for children under
38 Selman, Peter, “The Rise and Fall of Intercountry Adoption in the 21st Century,” International Social Work, 2009, Vol. 52(5),pp. 575–594.
0
5
10
15
20
25
30
35
40
45
50
Children not living with grandparentsChildren living with grandparents
Percent
Hispanic(any race)
Blackalone
White alone,non-Hispanic
Whitealone
Allraces
These children do not have a father present in the household.
Note: Base less than 75,000 for Asian alone children, so this group cannot be shown in this figure. Source: U.S. Census Bureau, Survey of Income and Program Participation (SIPP), 2008 Panel, Wave 2 Topical Module. For information on sampling and nonsampling error, see <www.census.gov/sipp/sourceac/S&A08_W1toW3(S&A-12).pdf>.
1
Children Below the Poverty Level, for Those Living With Mother Only, by Presence of Grandparents and the Child's Race and Hispanic Origin: 20091
Figure 9.
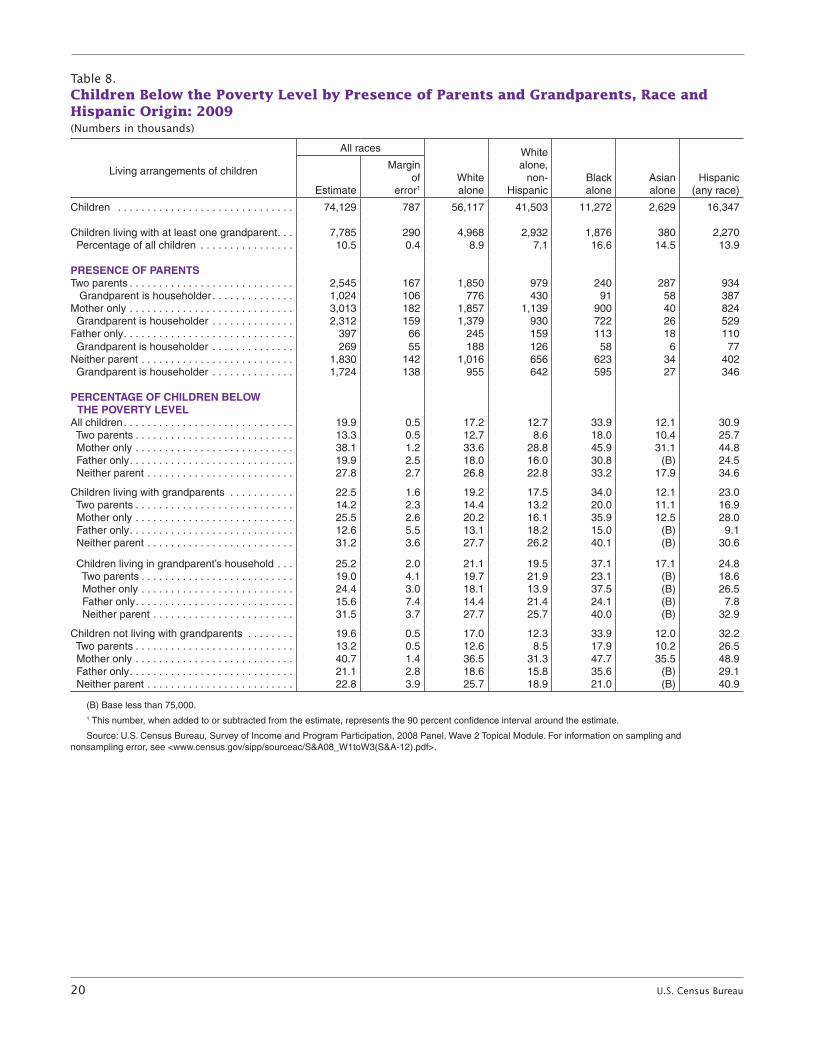
20 U.S. Census Bureau
Table 8.Children Below the Poverty Level by Presence of Parents and Grandparents, Race and Hispanic Origin: 2009(Numbers in thousands)
Living arrangements of children
All races
White alone
White alone,
non- Hispanic
Black alone
Asian alone
Hispanic (any race)Estimate
Margin of
error1
Children . . . . . . . . . . . . . . . . . . . . . . . . . . . . . . 74,129 787 56,117 41,503 11,272 2,629 16,347
Children living with at least one grandparent . . . 7,785 290 4,968 2,932 1,876 380 2,270 Percentage of all children . . . . . . . . . . . . . . . . 10 .5 0 .4 8 .9 7 .1 16 .6 14 .5 13 .9
PRESENCE OF PARENTSTwo parents . . . . . . . . . . . . . . . . . . . . . . . . . . . . 2,545 167 1,850 979 240 287 934 Grandparent is householder . . . . . . . . . . . . . . 1,024 106 776 430 91 58 387 Mother only . . . . . . . . . . . . . . . . . . . . . . . . . . . . 3,013 182 1,857 1,139 900 40 824 Grandparent is householder . . . . . . . . . . . . . . 2,312 159 1,379 930 722 26 529 Father only . . . . . . . . . . . . . . . . . . . . . . . . . . . . . 397 66 245 159 113 18 110 Grandparent is householder . . . . . . . . . . . . . . 269 55 188 126 58 6 77 Neither parent . . . . . . . . . . . . . . . . . . . . . . . . . . 1,830 142 1,016 656 623 34 402 Grandparent is householder . . . . . . . . . . . . . . 1,724 138 955 642 595 27 346
PERCENTAGE OF CHILDREN BELOW THE POVERTY LEVEL
All children . . . . . . . . . . . . . . . . . . . . . . . . . . . . . 19 .9 0 .5 17 .2 12 .7 33 .9 12 .1 30 .9 Two parents . . . . . . . . . . . . . . . . . . . . . . . . . . . 13 .3 0 .5 12 .7 8 .6 18 .0 10 .4 25 .7 Mother only . . . . . . . . . . . . . . . . . . . . . . . . . . . 38 .1 1 .2 33 .6 28 .8 45 .9 31 .1 44 .8 Father only . . . . . . . . . . . . . . . . . . . . . . . . . . . . 19 .9 2 .5 18 .0 16 .0 30 .8 (B) 24 .5 Neither parent . . . . . . . . . . . . . . . . . . . . . . . . . 27 .8 2 .7 26 .8 22 .8 33 .2 17 .9 34 .6
Children living with grandparents . . . . . . . . . . . 22 .5 1 .6 19 .2 17 .5 34 .0 12 .1 23 .0 Two parents . . . . . . . . . . . . . . . . . . . . . . . . . . . 14 .2 2 .3 14 .4 13 .2 20 .0 11 .1 16 .9 Mother only . . . . . . . . . . . . . . . . . . . . . . . . . . . 25 .5 2 .6 20 .2 16 .1 35 .9 12 .5 28 .0 Father only . . . . . . . . . . . . . . . . . . . . . . . . . . . . 12 .6 5 .5 13 .1 18 .2 15 .0 (B) 9 .1 Neither parent . . . . . . . . . . . . . . . . . . . . . . . . . 31 .2 3 .6 27 .7 26 .2 40 .1 (B) 30 .6
Children living in grandparent’s household . . . 25 .2 2 .0 21 .1 19 .5 37 .1 17 .1 24 .8 Two parents . . . . . . . . . . . . . . . . . . . . . . . . . . 19 .0 4 .1 19 .7 21 .9 23 .1 (B) 18 .6 Mother only . . . . . . . . . . . . . . . . . . . . . . . . . . 24 .4 3 .0 18 .1 13 .9 37 .5 (B) 26 .5 Father only . . . . . . . . . . . . . . . . . . . . . . . . . . . 15 .6 7 .4 14 .4 21 .4 24 .1 (B) 7 .8 Neither parent . . . . . . . . . . . . . . . . . . . . . . . . 31 .5 3 .7 27 .7 25 .7 40 .0 (B) 32 .9
Children not living with grandparents . . . . . . . . 19 .6 0 .5 17 .0 12 .3 33 .9 12 .0 32 .2 Two parents . . . . . . . . . . . . . . . . . . . . . . . . . . . 13 .2 0 .5 12 .6 8 .5 17 .9 10 .2 26 .5 Mother only . . . . . . . . . . . . . . . . . . . . . . . . . . . 40 .7 1 .4 36 .5 31 .3 47 .7 35 .5 48 .9 Father only . . . . . . . . . . . . . . . . . . . . . . . . . . . . 21 .1 2 .8 18 .6 15 .8 35 .6 (B) 29 .1 Neither parent . . . . . . . . . . . . . . . . . . . . . . . . . 22 .8 3 .9 25 .7 18 .9 21 .0 (B) 40 .9
(B) Base less than 75,000 . 1 This number, when added to or subtracted from the estimate, represents the 90 percent confidence interval around the estimate .
Source: U .S . Census Bureau, Survey of Income and Program Participation, 2008 Panel, Wave 2 Topical Module . For information on sampling and nonsampling error, see <www .census .gov/sipp/sourceac/S&A08_W1toW3(S&A-12) .pdf> .
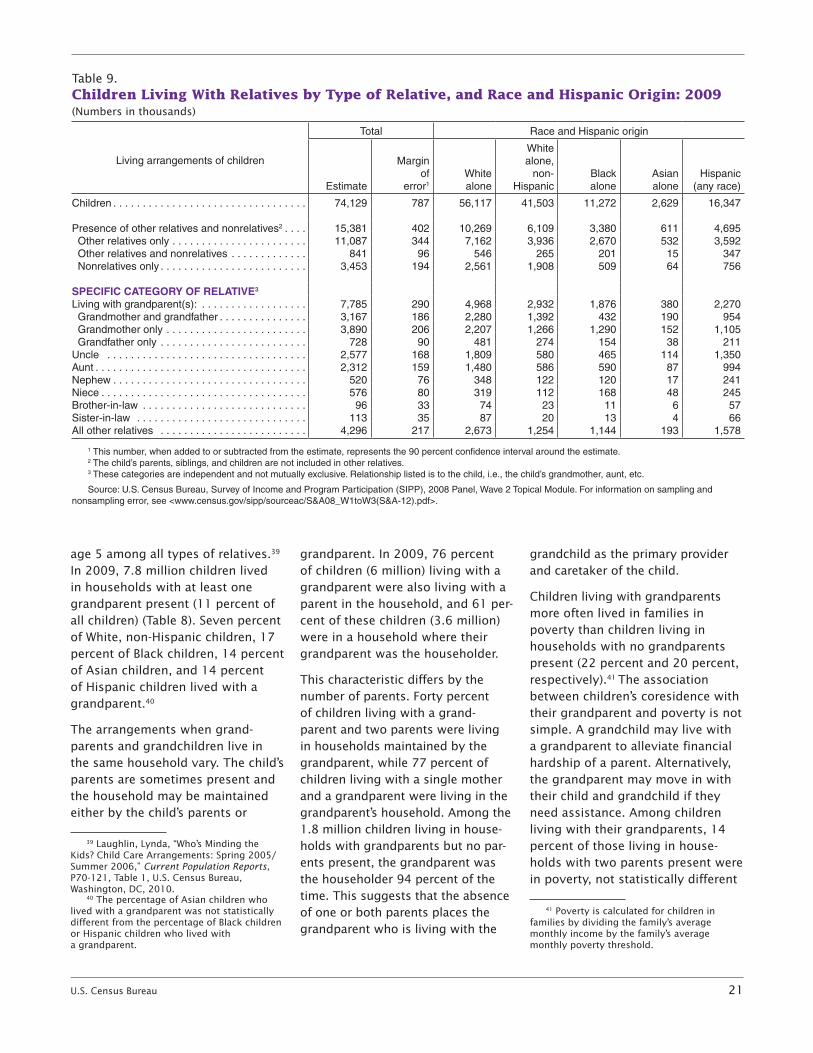
U.S. Census Bureau 21
age 5 among all types of relatives.39 In 2009, 7.8 million children lived in households with at least one grandparent present (11 percent of all children) (Table 8). Seven percent of White, non-Hispanic children, 17 percent of Black children, 14 percent of Asian children, and 14 percent of Hispanic children lived with a grandparent.40
The arrangements when grand-parents and grandchildren live in the same household vary. The child’s parents are sometimes present and the household may be maintained either by the child’s parents or
39 Laughlin, Lynda, “Who’s Minding the Kids? Child Care Arrangements: Spring 2005/Summer 2006,” Current Population Reports, P70-121, Table 1, U.S. Census Bureau, Washington, DC, 2010.
40 The percentage of Asian children who lived with a grandparent was not statistically different from the percentage of Black children or Hispanic children who lived with a grandparent.
grandparent. In 2009, 76 percent of children (6 million) living with a grandparent were also living with a parent in the household, and 61 per-cent of these children (3.6 million) were in a household where their grandparent was the householder.
This characteristic differs by the number of parents. Forty percent of children living with a grand-parent and two parents were living in households maintained by the grandparent, while 77 percent of children living with a single mother and a grandparent were living in the grandparent’s household. Among the 1.8 million children living in house-holds with grandparents but no par-ents present, the grandparent was the householder 94 percent of the time. This suggests that the absence of one or both parents places the grandparent who is living with the
grandchild as the primary provider and caretaker of the child.
Children living with grandparents more often lived in families in poverty than children living in households with no grandparents present (22 percent and 20 percent, respectively).41 The association between children’s coresidence with their grandparent and poverty is not simple. A grandchild may live with a grandparent to alleviate financial hardship of a parent. Alternatively, the grandparent may move in with their child and grandchild if they need assistance. Among children living with their grandparents, 14 percent of those living in house-holds with two parents present were in poverty, not statistically different
41 Poverty is calculated for children in families by dividing the family’s average monthly income by the family’s average monthly poverty threshold.
Table 9.Children Living With Relatives by Type of Relative, and Race and Hispanic Origin: 2009(Numbers in thousands)
Living arrangements of children
Total Race and Hispanic origin
Estimate
Margin of
error1
White alone
White alone,
non- Hispanic
Black alone
Asian alone
Hispanic (any race)
Children . . . . . . . . . . . . . . . . . . . . . . . . . . . . . . . . . 74,129 787 56,117 41,503 11,272 2,629 16,347
Presence of other relatives and nonrelatives2 . . . . 15,381 402 10,269 6,109 3,380 611 4,695 Other relatives only . . . . . . . . . . . . . . . . . . . . . . . 11,087 344 7,162 3,936 2,670 532 3,592 Other relatives and nonrelatives . . . . . . . . . . . . . 841 96 546 265 201 15 347 Nonrelatives only . . . . . . . . . . . . . . . . . . . . . . . . . 3,453 194 2,561 1,908 509 64 756
SPECIFIC CATEGORY OF RELATIVE3
Living with grandparent(s): . . . . . . . . . . . . . . . . . . 7,785 290 4,968 2,932 1,876 380 2,270 Grandmother and grandfather . . . . . . . . . . . . . . . 3,167 186 2,280 1,392 432 190 954 Grandmother only . . . . . . . . . . . . . . . . . . . . . . . . 3,890 206 2,207 1,266 1,290 152 1,105 Grandfather only . . . . . . . . . . . . . . . . . . . . . . . . . 728 90 481 274 154 38 211Uncle . . . . . . . . . . . . . . . . . . . . . . . . . . . . . . . . . . 2,577 168 1,809 580 465 114 1,350Aunt . . . . . . . . . . . . . . . . . . . . . . . . . . . . . . . . . . . . 2,312 159 1,480 586 590 87 994Nephew . . . . . . . . . . . . . . . . . . . . . . . . . . . . . . . . . 520 76 348 122 120 17 241Niece . . . . . . . . . . . . . . . . . . . . . . . . . . . . . . . . . . . 576 80 319 112 168 48 245Brother-in-law . . . . . . . . . . . . . . . . . . . . . . . . . . . . 96 33 74 23 11 6 57Sister-in-law . . . . . . . . . . . . . . . . . . . . . . . . . . . . . 113 35 87 20 13 4 66All other relatives . . . . . . . . . . . . . . . . . . . . . . . . . 4,296 217 2,673 1,254 1,144 193 1,578
1 This number, when added to or subtracted from the estimate, represents the 90 percent confidence interval around the estimate .2 The child’s parents, siblings, and children are not included in other relatives .3 These categories are independent and not mutually exclusive . Relationship listed is to the child, i .e ., the child’s grandmother, aunt, etc .
Source: U .S . Census Bureau, Survey of Income and Program Participation (SIPP), 2008 Panel, Wave 2 Topical Module . For information on sampling and nonsampling error, see <www .census .gov/sipp/sourceac/S&A08_W1toW3(S&A-12) .pdf> .
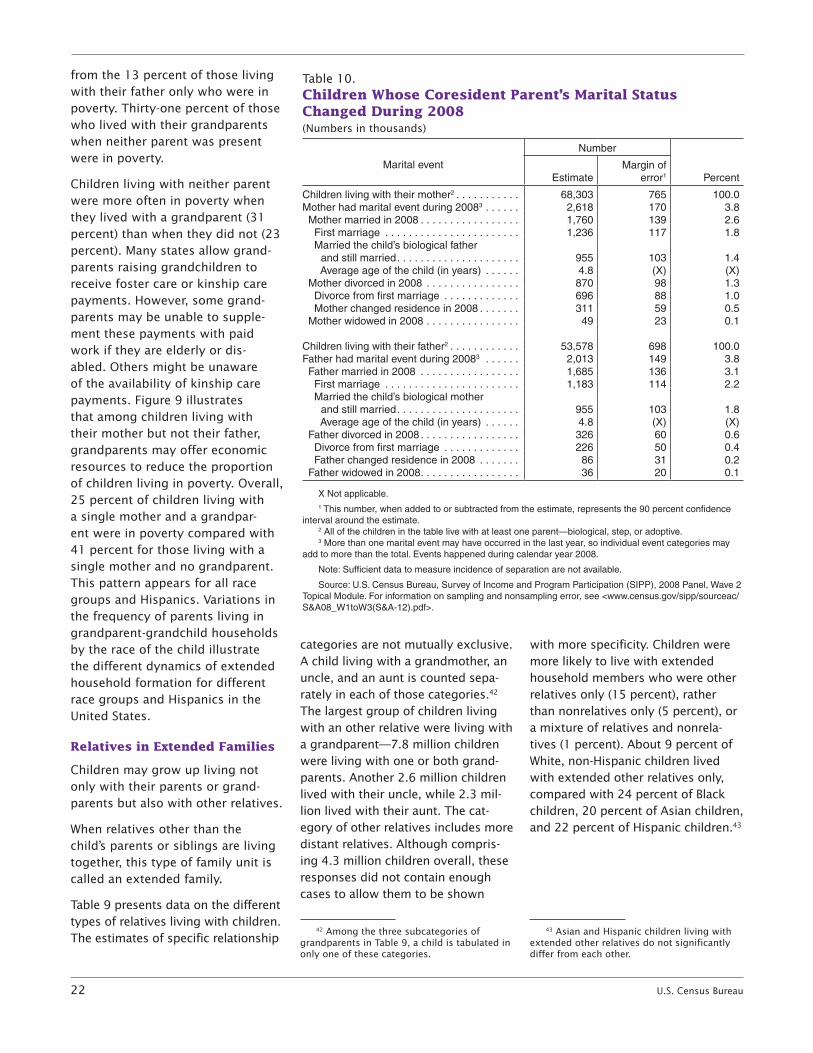
22 U.S. Census Bureau
from the 13 percent of those living with their father only who were in poverty. Thirty-one percent of those who lived with their grandparents when neither parent was present were in poverty.
Children living with neither parent were more often in poverty when they lived with a grandparent (31 percent) than when they did not (23 percent). Many states allow grand-parents raising grandchildren to receive foster care or kinship care payments. However, some grand- parents may be unable to supple-ment these payments with paid work if they are elderly or dis-abled. Others might be unaware of the availability of kinship care payments. Figure 9 illustrates that among children living with their mother but not their father, grandparents may offer economic resources to reduce the proportion of children living in poverty. Overall, 25 percent of children living with a single mother and a grandpar-ent were in poverty compared with 41 percent for those living with a single mother and no grandparent. This pattern appears for all race groups and Hispanics. Variations in the frequency of parents living in grandparent-grandchild households by the race of the child illustrate the different dynamics of extended household formation for different race groups and Hispanics in the United States.
Relatives in Extended Families
Children may grow up living not only with their parents or grand- parents but also with other relatives.
When relatives other than the child’s parents or siblings are living together, this type of family unit is called an extended family.
Table 9 presents data on the different types of relatives living with children. The estimates of specific relationship
categories are not mutually exclusive. A child living with a grandmother, an uncle, and an aunt is counted sepa-rately in each of those categories.42 The largest group of children living with an other relative were living with a grandparent—7.8 million children were living with one or both grand-parents. Another 2.6 million children lived with their uncle, while 2.3 mil-lion lived with their aunt. The cat-egory of other relatives includes more distant relatives. Although compris-ing 4.3 million children overall, these responses did not contain enough cases to allow them to be shown
42 Among the three subcategories of grandparents in Table 9, a child is tabulated in only one of these categories.
with more specificity. Children were more likely to live with extended household members who were other relatives only (15 percent), rather than nonrelatives only (5 percent), or a mixture of relatives and nonrela-tives (1 percent). About 9 percent of White, non-Hispanic children lived with extended other relatives only, compared with 24 percent of Black children, 20 percent of Asian children, and 22 percent of Hispanic children.43
43 Asian and Hispanic children living with extended other relatives do not significantly differ from each other.
Table 10.Children Whose Coresident Parent’s Marital Status Changed During 2008(Numbers in thousands)
Marital event
Number
PercentEstimateMargin of
error1
Children living with their mother2 . . . . . . . . . . . 68,303 765 100 .0Mother had marital event during 20083 . . . . . . 2,618 170 3 .8 Mother married in 2008 . . . . . . . . . . . . . . . . . 1,760 139 2 .6 First marriage . . . . . . . . . . . . . . . . . . . . . . . 1,236 117 1 .8 Married the child’s biological father
and still married . . . . . . . . . . . . . . . . . . . . . 955 103 1 .4 Average age of the child (in years) . . . . . . 4 .8 (X) (X) Mother divorced in 2008 . . . . . . . . . . . . . . . . 870 98 1 .3 Divorce from first marriage . . . . . . . . . . . . . 696 88 1 .0 Mother changed residence in 2008 . . . . . . . 311 59 0 .5 Mother widowed in 2008 . . . . . . . . . . . . . . . . 49 23 0 .1
Children living with their father2 . . . . . . . . . . . . 53,578 698 100 .0Father had marital event during 20083 . . . . . . 2,013 149 3 .8 Father married in 2008 . . . . . . . . . . . . . . . . . 1,685 136 3 .1 First marriage . . . . . . . . . . . . . . . . . . . . . . . 1,183 114 2 .2 Married the child’s biological mother
and still married . . . . . . . . . . . . . . . . . . . . . 955 103 1 .8 Average age of the child (in years) . . . . . . 4 .8 (X) (X) Father divorced in 2008 . . . . . . . . . . . . . . . . . 326 60 0 .6 Divorce from first marriage . . . . . . . . . . . . . 226 50 0 .4 Father changed residence in 2008 . . . . . . . 86 31 0 .2 Father widowed in 2008 . . . . . . . . . . . . . . . . . 36 20 0 .1
X Not applicable .1 This number, when added to or subtracted from the estimate, represents the 90 percent confidence
interval around the estimate .2 All of the children in the table live with at least one parent—biological, step, or adoptive .3 More than one marital event may have occurred in the last year, so individual event categories may
add to more than the total . Events happened during calendar year 2008 .
Note: Sufficient data to measure incidence of separation are not available .
Source: U .S . Census Bureau, Survey of Income and Program Participation (SIPP), 2008 Panel, Wave 2 Topical Module . For information on sampling and nonsampling error, see <www .census .gov/sipp/sourceac/S&A08_W1toW3(S&A-12) .pdf> .
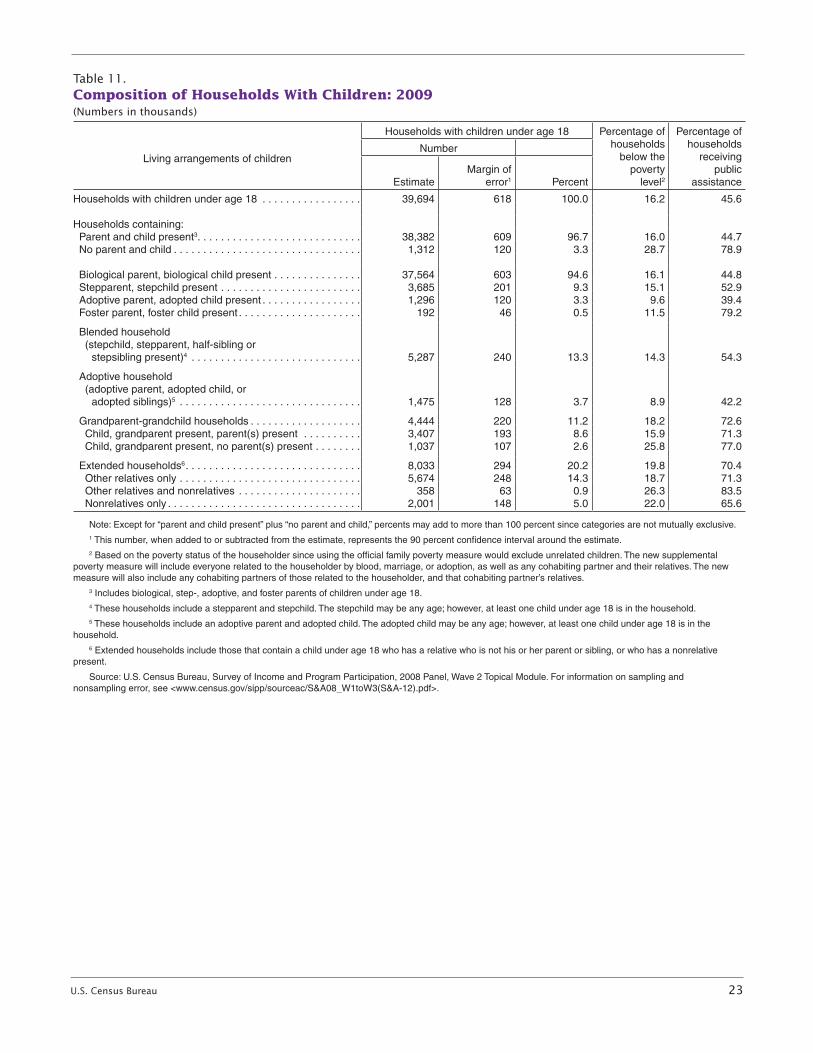
U.S. Census Bureau 23
Table 11.Composition of Households With Children: 2009(Numbers in thousands)
Living arrangements of children
Households with children under age 18 Percentage of households
below thepoverty
level2
Percentage of households
receivingpublic
assistance
Number
EstimateMargin of
error1 Percent
Households with children under age 18 . . . . . . . . . . . . . . . . . 39,694 618 100 .0 16 .2 45 .6
Households containing: Parent and child present3 . . . . . . . . . . . . . . . . . . . . . . . . . . . . 38,382 609 96 .7 16 .0 44 .7 No parent and child . . . . . . . . . . . . . . . . . . . . . . . . . . . . . . . . 1,312 120 3 .3 28 .7 78 .9
Biological parent, biological child present . . . . . . . . . . . . . . . 37,564 603 94 .6 16 .1 44 .8 Stepparent, stepchild present . . . . . . . . . . . . . . . . . . . . . . . . 3,685 201 9 .3 15 .1 52 .9 Adoptive parent, adopted child present . . . . . . . . . . . . . . . . . 1,296 120 3 .3 9 .6 39 .4 Foster parent, foster child present . . . . . . . . . . . . . . . . . . . . . 192 46 0 .5 11 .5 79 .2
Blended household (stepchild, stepparent, half-sibling or
stepsibling present)4 . . . . . . . . . . . . . . . . . . . . . . . . . . . . . 5,287 240 13 .3 14 .3 54 .3
Adoptive household (adoptive parent, adopted child, or
adopted siblings)5 . . . . . . . . . . . . . . . . . . . . . . . . . . . . . . . 1,475 128 3 .7 8 .9 42 .2
Grandparent-grandchild households . . . . . . . . . . . . . . . . . . . 4,444 220 11 .2 18 .2 72 .6 Child, grandparent present, parent(s) present . . . . . . . . . . 3,407 193 8 .6 15 .9 71 .3 Child, grandparent present, no parent(s) present . . . . . . . . 1,037 107 2 .6 25 .8 77 .0
Extended households6 . . . . . . . . . . . . . . . . . . . . . . . . . . . . . . 8,033 294 20 .2 19 .8 70 .4 Other relatives only . . . . . . . . . . . . . . . . . . . . . . . . . . . . . . . 5,674 248 14 .3 18 .7 71 .3 Other relatives and nonrelatives . . . . . . . . . . . . . . . . . . . . . 358 63 0 .9 26 .3 83 .5 Nonrelatives only . . . . . . . . . . . . . . . . . . . . . . . . . . . . . . . . . 2,001 148 5 .0 22 .0 65 .6
Note: Except for “parent and child present” plus “no parent and child,” percents may add to more than 100 percent since categories are not mutually exclusive .1 This number, when added to or subtracted from the estimate, represents the 90 percent confidence interval around the estimate .2 Based on the poverty status of the householder since using the official family poverty measure would exclude unrelated children . The new supplemental
poverty measure will include everyone related to the householder by blood, marriage, or adoption, as well as any cohabiting partner and their relatives . The new measure will also include any cohabiting partners of those related to the householder, and that cohabiting partner’s relatives .
3 Includes biological, step-, adoptive, and foster parents of children under age 18 .4 These households include a stepparent and stepchild . The stepchild may be any age; however, at least one child under age 18 is in the household . 5 These households include an adoptive parent and adopted child . The adopted child may be any age; however, at least one child under age 18 is in the
household . 6 Extended households include those that contain a child under age 18 who has a relative who is not his or her parent or sibling, or who has a nonrelative
present .
Source: U .S . Census Bureau, Survey of Income and Program Participation, 2008 Panel, Wave 2 Topical Module . For information on sampling and nonsampling error, see <www .census .gov/sipp/sourceac/S&A08_W1toW3(S&A-12) .pdf> .
24 U.S. Census Bureau
Children Whose Coresident Parent’s Marital Status Changed in the Last Year
Because the marital history of a child’s coresident parents is collected in the SIPP, it is possible to estimate the number of children who lived with a parent who married, divorced, or was widowed in the last year. Table 10 shows that about 2.6 mil-lion children lived with a mother who experienced a marital event in the last year.44 Of these children, 1.8 mil-lion lived with mothers who married in the last year, and for 955,000 of these children, their biological father and mother married each other, and both were still living with the child at the time of the survey.
Estimates of the number of children whose parents divorced during a year were previously tracked by the National Center for Health Statistics (NCHS) as part of its vital statistics program. For years, NCHS has not received information from enough states to make these estimates. Previous NCHS data estimated that the number of children affected by divorce had grown since 1950. Divorce rates increased in the late 1970s and into the 1980s and subse-quently leveled off in the late 1980s and into the 1990s.45 An estimated 299,000 children were involved in the divorces finalized in 1950, or a rate of 6.3 per 1,000 children. This number increased to a little over 1 million children by 1972 (at a rate of
44 The number of children experiencing their mother’s or father’s marriage in the last year is not exactly equal due to the fact that if the couple had separated by the time of the interview and the child is not currently living with both their mother and father, they will not appear in both estimates. Marital events happened during calendar year 2008.
45 London, Kathryn A., “Children of Divorce,” Vital Health Statistics, National Center for Health Statistics, Washington, DC, U.S. Government Printing Office, 1989, Series 21, No. 46, DHHS Pub. No. (PHS) 89-1924.
Goldstein, Joshua R., “The Leveling of Divorce in the United States,” Demography, 1999, Vol. 36, pp. 409–414.
14.7 per 1,000 children) and stayed just over one million through 1984, when the rate was a bit higher, at 17.2 per 1,000 children.
Table 10 shows an estimated 1.2 mil-lion children were living with either their mother or father who divorced in calendar year 2008, or a rate of 15 per 1,000 children. Seventy-three percent of these children lived with their mother (870,000).
COMPOSITION OF HOUSEHOLDS CONTAINING CHILDREN: 2009
While most of the tables in this report are shown from the child’s point of view, Table 11 shows the living arrangements of children at the household level. In 2009, 39.7 million households included chil-dren under age 18: 95 percent had at least one child and his or her biological parent, 9 percent had at least one child and his or her step-parent, and 3 percent had at least one child and his or her adoptive parent. These categories are not mutually exclusive. For example, households can have children with both a biological parent and a stepparent. There were 5.3 million households with blended families and 1.5 million households with adoptive families. Eleven percent of households with children under age 18 (4.4 million) had grandparents and grandchildren present, with 77 percent of these composed of a child, his or her parent(s), and the child’s grandparent(s). An additional 23 percent, or 1.0 million, included a child and at least one grandparent but not the child’s parents. About 1 in 5 households with children included nonrelatives or relatives of the child other than his or her parents or siblings.
While 16 percent of all households with a child under age 18 were
below the poverty level, the per-centage for blended households was lower, at 14 percent. This difference likely reflects the fact that step-families are often formed by remar-riage, so these households are more likely to have two parents and two earners than households with chil-dren and biological parents, which include single parents.
Overall, 46 percent of households with children received some type of public assistance.46 A higher per-centage of grandparent-grandchild households and extended family households received public assis-tance (about 7 in 10).47 Among fam-ily extended households, 84 percent of those that included children living with both other relatives and nonrelatives received public assis-tance compared to households with other relatives only (71 percent) or nonrelatives only (66 percent).48
SOURCE OF THE DATA
The population represented (the population universe) in the 2008 SIPP is the civilian noninstitutional-ized population living in the United States. The SIPP is a longitudinal sur-vey conducted at 4-month intervals. The data in this report were collected from January through April 2009 in the second wave (interview) of the 2008 SIPP. The data come primarily from the main survey and the house-hold relationship topical module. The
46 Cash and noncash public assistance are included. Noncash benefits include food stamps; the Special Supplemental Nutrition Program for Women, Infants, and Children; Medicaid; rent for public housing; lower rent due to government subsidy; energy assistance; and free or reduced-price lunches or breakfasts.
47 Extended households include those that contain a child under 18 years old who has a relative present who is not his or her parent or sibling, or who has a nonrelative present.
48 The overall percentage of extended households receiving public assistance was not significantly different than the percentage of extended households with other relatives only receiving public assistance.
U.S. Census Bureau 25
institutionalized population, which is excluded from the population universe, is composed primarily of the population in correctional institu-tions and nursing homes (91 percent of the 4.1 million institutionalized people in Census 2000).
Although the main focus of the SIPP is information on labor force partici-pation, jobs, income, and participa-tion in federal assistance programs, information on other topics is also collected in topical modules on a rotating basis.
The population represented (the population universe) in the Annual Social and Economic Supplement (ASEC) is the civilian noninstitutional-ized population living in the United States. Members of the Armed Forces living off-post or with their families on-post are included if at least one civilian adult lives in the household. The institutionalized population, which is excluded from the popula-tion universe, is composed primar-ily of the population in correctional institutions and nursing homes (91 percent of the 4.1 million institu-tionalized people in Census 2000). Most of the data from the ASEC were collected in March (with some data collected in February and April).
The Census data 1880–1940: Inte-grated Public-Use Microdata Series: Version 2.0 one percent microdata files were made available by the Historical Census Projects. For further information on the Census data, see <http://usa.ipums.org/usa/design.shtml>.
ACCURACY OF THE DATA
Statistics from surveys are subject to sampling and nonsampling error. All comparisons presented in this report have taken sampling error into account and are significant at the 90 percent confidence level unless otherwise noted. This means the 90 percent confidence interval for the difference between the estimates being compared does not include zero. Nonsampling errors in surveys may be attributed to a variety of sources, such as how the survey was designed, how respondents inter-pret questions, how able and willing respondents are to provide correct answers, and how accurately the answers are coded and classified. The Census Bureau employs quality control procedures throughout the production process, including the overall design of surveys, the word-ing of questions, the review of the work of interviewers and coders, and the statistical review of reports to minimize these errors.
The CPS and SIPP weighting proce-dures use ratio estimation, whereby sample estimates are adjusted to independent estimates of the national population by age, race, sex, and Hispanic origin. This weighting partially corrects for bias due to undercoverage, but biases may still be present when people who are missed by the survey differ from those interviewed in ways other than age, race, sex, and Hispanic origin. How this weighting procedure affects other variables in the survey is not precisely known. All of these considerations affect comparisons across different surveys or data sources.
For further information on statistical standards and the computation and use of standard errors, go to <www.census.gov/apsd/techdoc/cps /cps-main.html> for CPS; for SIPP, go to <www.census.gov/sipp /sourceac/S&A08_W1toW3(S&A-12) .pdf>; or e-mail Stephen Mack of the Census Bureau’s Demographic Statistical Methods Division at <[email protected]>.
Additional information on the SIPP can be found at the following Web sites: <www.census.gov/sipp/> (main SIPP Web site), <www.census .gov/sipp/workpapr/wp230.pdf> (SIPP Quality Profile), and <www.census.gov/sipp/usrguide .html> (SIPP User’s Guide).
MORE INFORMATION
A copy of this report, along with additional tables, is available on the Census Bureau’s Web site at <www.census.gov>. Data about children can be accessed by click-ing on the “C” in the “Subjects A–Z” index and selecting “Children.” The previous reports based on 2004, 2001, 1996, and 1991 data are also available at this site.
CONTACTS
Contact the Census Bureau’s Customer Services Center at 800-923-8282 (toll-free) or visit <ask.census.gov> for further information.
SUGGESTED CITATION
Kreider, Rose M. and Renee Ellis, “Living Arrangements of Children: 2009,” Current Population Reports, P70-126, U.S. Census Bureau,Washington, DC, 2011.


U.S. Department of CommerceEconomics and Statistics Administration U.S. CENSUS BUREAU
Washington, DC 20233
OFFICIAL BUSINESS
Penalty for Private Use $300
FIRST-CLASS MAIL POSTAGE & FEES PAID U.S. Census Bureau
Permit No. G-58
ContentsIntroduction 1Historical Living Arrangements of Children 3Children by Presence and Type of Parent(s) and Race and Hispanic Origin: 1991, 1996, 2001, 2004, and 20091 4
Children’s Living Arrangements 2009 5Children Living With One, Two, or No Parents 5Children by Presence and Type of Parent(s) and Race and Hispanic Origin: 1991, 1996, 2001, 2004, and 20091—Con. 5Children Living With Two Parents: Biological, Step, and Adoptive 7Children Living With Unmarried Parents 7Children by Presence and Type of Parent(s) and Race and Hispanic Origin: 1991, 1996, 2001, 2004, and 2009 11Children by Presence and Type of Parent(s) and Race and Hispanic Origin: 1991, 1996, 2001, 2004, and 2009—Con. 11Children by Parent’s Cohabitation Status and Race and Hispanic Origin: 2009 12Children With Siblings 13Children Living With Siblings by Type of Relationship and Presence of Parent: 2009 13Children With Half Siblings 14Children Living With Half Siblings by Number of Coresident Biological Parents: 2009 15Children Living in Blended Families by Composition of Family and Child’s Race and Hispanic Origin: 20091 16
Children in Blended Families 17Adopted Children by Race and Hispanic Origin and Living Arrangements: 2009 17Adopted Children 18Children Living With Grandparents: Living Arrangements and Poverty Status 19Children Below the Poverty Level by Presence of Parents and Grandparents, Race and Hispanic Origin: 2009 20Children Living With Relatives by Type of Relative, and Race and Hispanic Origin: 2009 21Relatives in Extended Families 22Children Whose Coresident Parent’s Marital Status Changed During 2008 22Composition of Households With Children: 2009 23Children Whose Coresident Parent’s Marital Status Changed in the Last Year 24Composition of Households Containing Children: 2009 24Source of the Data 24Accuracy of the Data 25More Information 25Contacts 25
Related Documents