Welcome message from author
This document is posted to help you gain knowledge. Please leave a comment to let me know what you think about it! Share it to your friends and learn new things together.
Transcript

Light Rail In Australia
3
Light rail in Australia
This document sketches a vision for the future of Australian cities as we move into an era where climate change, petrol prices and traffic congestion demand that we rethink the way our cities works.
We can prosper in a carbon-light future if we make decisions now to shock-proof ourselves against the challenges of the 21st century, and a rapid, electrified mass transit system must be a part of this vision.
Light rail is a form of urban rail public transport, essentially a modern tram system, using electric railcars large enough to accommodate up to 60 people as well as wheelchairs and bicycles. Light rail infrastructure has a low impact on the urban environment, with rails unobtrusively laid along existing roadways or road reserves and stops along median strips.
1 Light rail – the time has come!
Dublin, Ireland
Light Rail in Australia
Australia has a mixed record with electrified transport systems, with many extensive pre-war systems torn out in the early post-war years. Only Melbourne’s system remains at scale, with dramatically reduced services in Adelaide and Sydney, while Perth, Hobart and Brisbane no longer operate services at all. Regional centres including Kalgoorlie, Bendigo, Ballarat and Leonora boasted systems dating back to the gold rush years.
With peak oil, climate change and traffic congestion all calling into question post-war transport planning, it is time to reinvent the age of electrified mass transit.
Melbourne
Melbourne was the only Australian city to retain its pre-war tram network. Today it is the largest network in the world, with 501 vehicles on 249 kilometres of double track. 158.3 million trips were taken on trams in Melbourne in 2007/20081.
Even in Melbourme, network expansions have failed to keep pace with the growth of the city. Sydney
Sydney once had the largest tram system in Australia, which ceased operating in 1961. A single privately owned line, Metro Light Rail, stretches 7km from Central Station to Lilyfield. Numerous proposals for line extensions have failed to come to fruition. Adelaide
Adelaide today operates a single tram line between the CBD and Glenelg, which was once part of a much larger metro-wide system which closed in 1958. Gold Coast
The Gold Coast Rapid Tansit project is a 13km dedicated line linking Griffith University’s Southport campus with Broadbeach, currently under construction. It is Australia’s first new light rail project in a regional centre, jointly funded by the Commonwealth, State Government and Gold Coast city council.
1. http://www.yarratrams.com.au/ ‘Facts and Figures’.

Light Rail In Australia
5
Much of the debate around sustainability focuses on threats: rising sea levels, climate change, wars over depleting resources such as oil and significant population increases.
In truth, sustainability is also about opportunity and hope, and ways of making our communities better places to live.
Planning world-class public transport for our communities will have important payoffs for greenhouse targets and reducing our dependence on imported oil.
But the more immediate payoff will come in improvements to quality of life: less time stuck in traffic, more liveable neighbourhoods and stronger local economies.
It has been argued that public transport works best in high population centres where a critical mass of people are an easy walk or cycle from transfer stations. It helps create more vibrant local communities with areas of medium to high density dwellings, diverse and affordable housing opportunities and more public open space and parks.
Creating bustling neighbourhoods that combine residential, commercial and retail uses will generate local employment, services and social and economic opportunities for residents. Pedestrian-friendly streetscapes with safe bicycle infrastructure and a reduced emphasis on cars will improve safety and social interaction and compliment clean, frequent, safe and fast public transport links between districts.
Planners are now revisiting the idea of urban village archipelagos, networks of medium and high density human-scale settlements linked with safe, fast, frequent public transport.
Australia has a few examples of these kinds of development, but without further action, we still risk stranding tens of thousands of families on the urban fringe far from centres of employment and services. As we consider rolling out public transport infrastructure such as the combined light rail / bus transit model outlined in this report, we urgently need to reform our planning priorities as well.
Post war sub-urban development have left our cities with many square kilometres of housing with average densities between 12 - 20 dwellings per hectare, far from services and employment centres. In areas such as this where ‘urban village’ densification schemes are likely to be unpopular, impractical or would come far too late, we need to rethink the way bus services are routed and timetabled.
Experience in low densitiy cities in North America and Europe show that huge increases in public transport patronage are possible with more frequent, direct bus services and well coordinated network planning allowing easier ‘anywhere to anywhere’ access. Improving feeder networks in this way can dramatically improve the economics of trunk light rail or heavy rail routes and allows them to cross-subsidise less profitable bus services.
Around the world, public transport is making a comeback: on drawing boards, in government planning authorities, and in our neighbourhoods.
With light rail projects expanding in Melbourne, the Gold Coast, Sydney and Adelaide, and the proposition of substantial Commonwealth Government public transport funding for the first time in a decade, we are on the edge of an urban tipping point.
As you consider this document, be mindful that this is more than an infrastructure proposal: it is an invitation to take the next step toward a more liveable, socially inclusive and sustainable communty.
Sustainable cities

Light Rail In Australia
7
Decades of North-American style urban planning has left Australian cities among the most car-dependent in the world. While cheap oil prices have masked the greater health, pollution, carbon and community costs of private automobile dependence, all of this is set to change. With planning and foresight, we can build on existing transport assets to create world class integrated systems.
In 2009, the Australian Senate’s Rural and Regional Affairs and Transport Committee undertook an inquiry into pubic transport. This provided an important snapshot of the current state of service provision and the surge in patronage that has occurred over the past few years:
“In total in the eight capital cities public transport trips increased by 14.7 percent from 2004 to 2008, and the public transport mode share increased from 9.3 percent to 10.6 per cent. These growth rates have been well above population growth.”1
Health benefits of public transport
Every public transport journey begins and ends with a walk or a cycle,leading to a more physically active and healthy society. A reduction in pollution will also benefit community health: the Bureau of Transport and Regional Economics estimates the cost of the health effects of motor vehicle pollution was $2.6 billion in the year 20002. The cost of road traffic injury and death in 2003 was estimated at $17 billion.
Reduced traffic congestion
Public transport takes a portion of private vehicles off the road. The cost of traffic congestion in Australian cities has been estimated by the Bureau of Transport and Regional Economics to be $12.8 billion per year3. These estimates calculate the value of lost time spent in traffic and give some idea of how economically inefficient car dependence has become.
Reduction in greenhouse gas emissions
Travel for work, shopping, personal business and recreation is estimated to be responsible for 34% of household greenhouse gas emissions4 and therefore increased public transport use can make a significant cut to an individual’s carbon footprint. On average 210 grams of carbon are emitted per passenger kilometre using a private vehicle, while only 60 grams of carbon are emitted from each passenger kilometre using rail transport5.
Improved public transport network planning can raise patronage on all routes, improving the economics and greenhouse footprint of public transport modes.
1 “Rural and Regional Affairs and Transport References Committee: “Investment of Commonwealth and State funds in public passenger transport infrastructure and services” August 20092 BTRE Working Paper 63: http://www.bitre.gov.au/publications/94/Files/wp63.pdf3 Australia’s Future Oil Supply and Alternative Transport Fuels, 20074 Australian Greenhouse Office, 2007, Global Warming: Cool It, Department of the Environment, Water, Heritage and the Arts,5 The Ecologist July/August 2008
Tourism
Many tourists use public transport as their preferred way of exploring a city. A good public transport system can itself become an attraction, such as Melbourne’s tram network.
Enhancing social inclusion
Public transport is most important to those people who have no alternative means of transport; this is particularly the case among youth, the elderly and people with a disability. Access to public transport is also particularly important to those in outlying areas who have to drive further and therefore pay a greater proportion of their income on fuel. This is addressed further in Section Three.
Oil vulnerability
Perth is facing two fossil fuel crises: coming oil price shocks as world markets finally acknowledge the reality of peak oil, and the unthinkable possibility of runaway climate change.
Both these challenges will impact heavily on how we travel to work, to school, and social activity. The extraordinary spike in petrol prices in 2008 will inevitably return, but almost nothing has been done at a State or Federal level to shockproof the community against oil vulnerability. Public transport systems – particularly if electrified – can play an integral role in protecting people from oil price shocks.
2 Why should we invest in public transport?
...the cost of traffic congestion in Australian cities has been estimated to be $12.8 billion per year...7
Light Rail In Australia
9
Light Rail In Australia
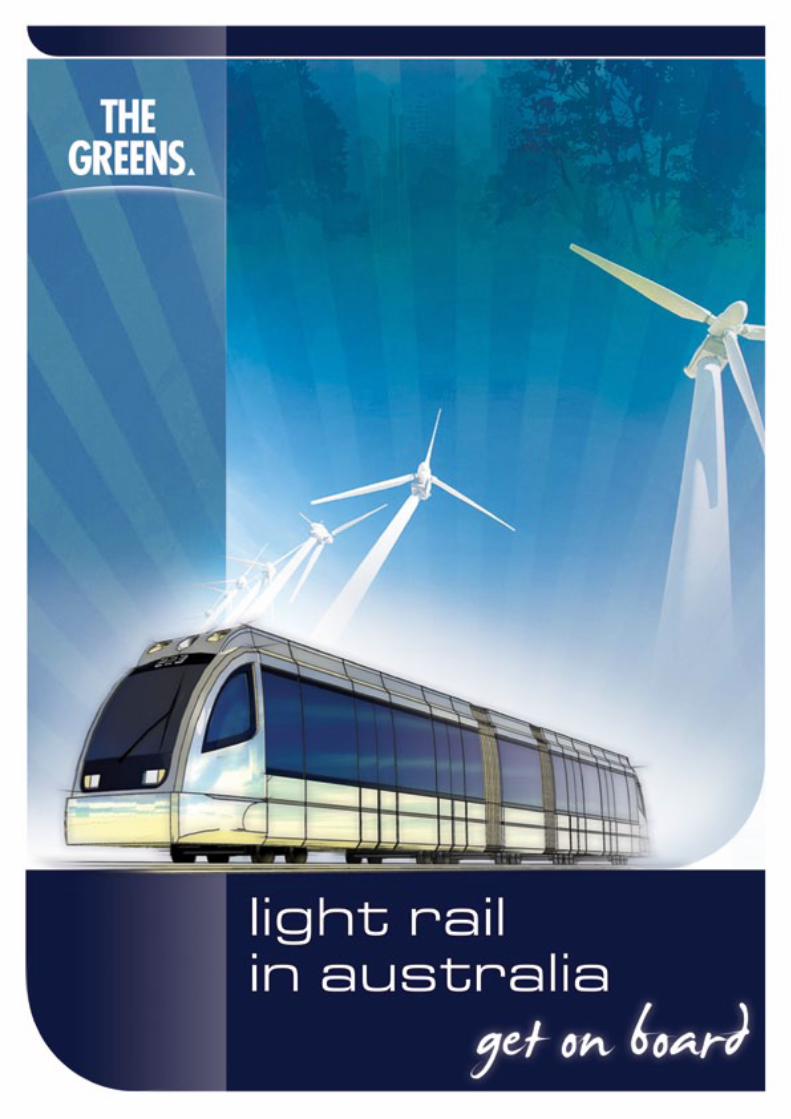
The impact of rising transport costs varies according to where people live, with both petrol prices and public transport availability varying widely across the country. A strong case can be made for prioritising public transport funding in regional and outer metropolitan areas to combat public transport shortcomings in these areas.
In their 2008 study “Unsettling Suburbia: The New Landscape of Oil and Mortgage Vulnerability in Australian Cities”, Jago Dodson and Neil Sipe map the changing patterns of transport and mortgage vulnerability in major Australian cities between the census periods 2001 - 2006.
The maps at right and overleaf clearly demonstrate regional patterns of vulnerability, with outer metropolitan areas in the ‘growth corridors’ suffering a high degree of vulnerability both to rising oil prices and interest rates.
It is no coincidence that higher income groups tend to be located in the inner urban areas with the highest provision of public transport. At the fringes of our cities, lower income residents are more likely to be located in areas with poor public transport and a deficit of employment prospects and other services.
In Sydney for example, people living in the inner eastern suburbs use a car for approximately 48.7% of all trips and travel on average 10.1km per day, while those living in outer western suburbs use private transport for 79.7% of all trips, travelling on average 33.3km each day.1
3 Petrol price vulnerability: it depends where you live
1 http://www.transport.nsw.gov.au/tdc/documents/kti-sydney-2003.pdf
VAMPIRE (Vulnerability Assessment for Mortgage, Petroleum and Inflation Risks and Expenses) Griffith University 2008
Perth Train Station

Light Rail In Australia
11
Light Rail In Australia
4 Making it sustainable: Land use planning and density
Density and land use planning are vital in the success of any public transport system, particularly light rail.
The conventional wisdom is that low-density sprawl cities such as Perth and Canberra are not well suited to light rail systems – the housing densities are so low that even with an extensive system, most people will still not be within an easy walk of a station. Yet light rail works well when it connects medium and high density mixed use urban villages, which are starting to take shape around some Australian cities.
While current population growth targets for Australian cities are contested and a variety of factors may see them unrealised, there is little doubt that the city is set for growth in the medium term. How we plan for this will shape our cities and will need to include public transport infrastructure.
As the future costs of car-based urban planning become increasingly apparent, there is a growing move towards re-orienting Perth as a ‘transit city’ with medium and high-density ‘transit-oriented developments’ (TODs) clustered around public transport nodes. The logic of a post fossil-fuel society favours the re-establishment of Perth’s light rail network to meet the needs of the city’s burgeoning population.
Australian settlements are still at an early stage in their evolution toward transit cities: European and Asian cities with a head-start of several decades provide striking examples of how rail recoups its costs over time while moving people more efficiently than buses or private automobiles.
Stockholm is one example of a city designed around a combination of heavy and light rail, whereby semi-self contained communities cluster around transit stations, tapering from high density to low with increasing distance from the stations. The benefits of increased land values around stations, improved community values and neighbourhood amenity, decreased reliance on imported oil, improved health benefits and lower air pollution, are well-documented and substantial.
As noted previously, density arguments should not be used to deflect the wisdom of improved network planning and increased service frequency into suburban areas which can not be realistically recast as medium density urban villages.
VAMPIRE (Vulnerability Assessment for Mortgage, Petroleum and Inflation Risks and Expenses) Griffith University 2008
Light Rail In Australia
13
5 Light rail in modern cities
Light rail is a form of urban rail public transport, essentially a modern tram system using electric railcars large enough to accommodate up to 60 people as well as wheelchairs and bicycles. Light rail infrastructure generally has less impact on the urban environment than traditional heavy rail systems, with rails unobtrusively laid along existing roadways or road reserves, and stops along median strips.
Globally, light rail has been introduced to more than 100 international cities in the past decade, making a spectacular comeback in the United States, East Asia and Europe.
• Citiesthatuselightrailhave1:
• 41%lowerenergyuseperpassenger/kmthanbuscities;
• 18%lowerautomobilepassengerkilometrespercapita;
• 23%lowertransportemissionspercapita;
• 38%fewertransportdeaths;.
• Lightrailcandrawonanyelectricalenergysourceincludingrenewable energy and regenerative energy from braking, transferring a large fraction of the transport task away from liquid fuels;
• Evidencehasshownthatrail,includinglightrail,attractsgreater patronage than buses (including bus rapid transit)2;
• Althoughtheinitialfinancialoutlayishigherforlightrail,theoperating costs are lower than for a bus network;
• Theintroductionoflightrailhasbeenusedaspartofurbanrenewal schemes, improving property values and stimulating economic activity to create new urban hubs;
• Lightrailismorecomfortableandhashigherpassengercapacitythanbuses;
• People,includinginfrequentpublictransportusers,feelconfidentabout the service when they can see where it goes and feel confident that something will come;
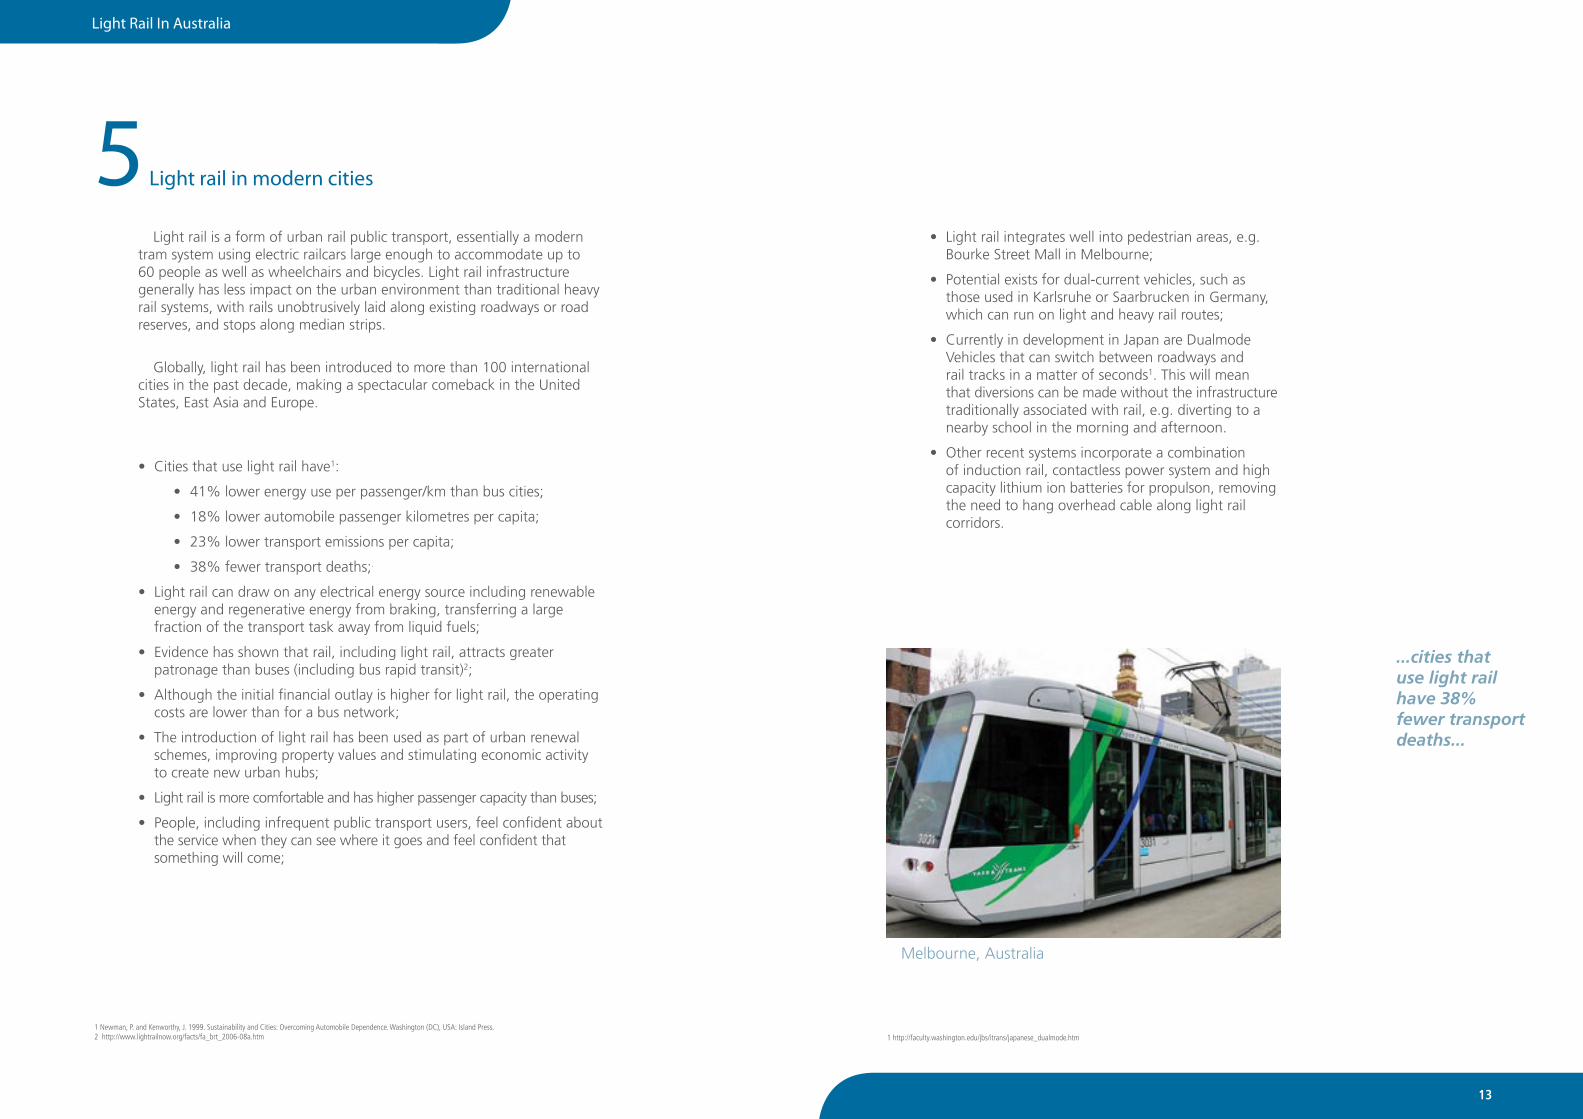
• Lightrailintegrateswellintopedestrianareas,e.g. Bourke Street Mall in Melbourne;
• Potentialexistsfordual-currentvehicles,suchas those used in Karlsruhe or Saarbrucken in Germany, which can run on light and heavy rail routes;
• CurrentlyindevelopmentinJapanareDualmode Vehicles that can switch between roadways and rail tracks in a matter of seconds1. This will mean that diversions can be made without the infrastructure traditionally associated with rail, e.g. diverting to a nearby school in the morning and afternoon.
• Otherrecentsystemsincorporateacombination of induction rail, contactless power system and high capacity lithium ion batteries for propulson, removing the need to hang overhead cable along light rail corridors.
1 Newman, P. and Kenworthy, J. 1999. Sustainability and Cities: Overcoming Automobile Dependence. Washington (DC), USA: Island Press.2 http://www.lightrailnow.org/facts/fa_brt_2006-08a.htm 1 http://faculty.washington.edu/jbs/itrans/japanese_dualmode.htm
...cities that use light rail have 38% fewer transport deaths...
Melbourne, Australia
Light Rail In Australia
15
Integrated light rail networks need to be incorporated into the existing network of public transport services, providing services on major feeder routes where the level of demand sits between the capacities of heavy rail and bus routes.
“Li-Ion battery-based light rail (LRT) has a Contactless Power Supply (CPS) in the ground at each station that powers it up. These stations can
be green icons with renewable energy powering the CPS directly. It is inherently cheaper than the Bordeaux LRT (no catenary) which has CPS
all along its track but is very successful as it brought light rail to an historic area without the overhead wires. It can travel at over 70kph and
carry 120 people so it’s much better than a bus and can be renewably powered. It combines all the smartness of plug-in electric vehicles and
the sustainability of public transport,” Professor Peter Newman, Curtin University.
Ultra Light Rail
Ultra Light Rail (ULR) claims many of the benefits of light rail at a lower cost and represents another option for flexibly meeting the wide range of needs in an expanded integrated public transport network.
ULR focuses on improved vehicle efficiency and features greatly reduced energy consumption and appropriately sized cabins to economically meet a range of ridership demands1.
ULR lowers infrastructure costs, can run on clean fuels, is easily upgradeable and provides the option to remove light rail electrification infrastructure completely, as it can be powered by an onboard energy supply, via contact rail at stops or by a traditional wired system2.
1 Plisner, P. 2008. Railcar Revolution. Rail Professional, 24-25. 2 http:/www.ultralightrail.com
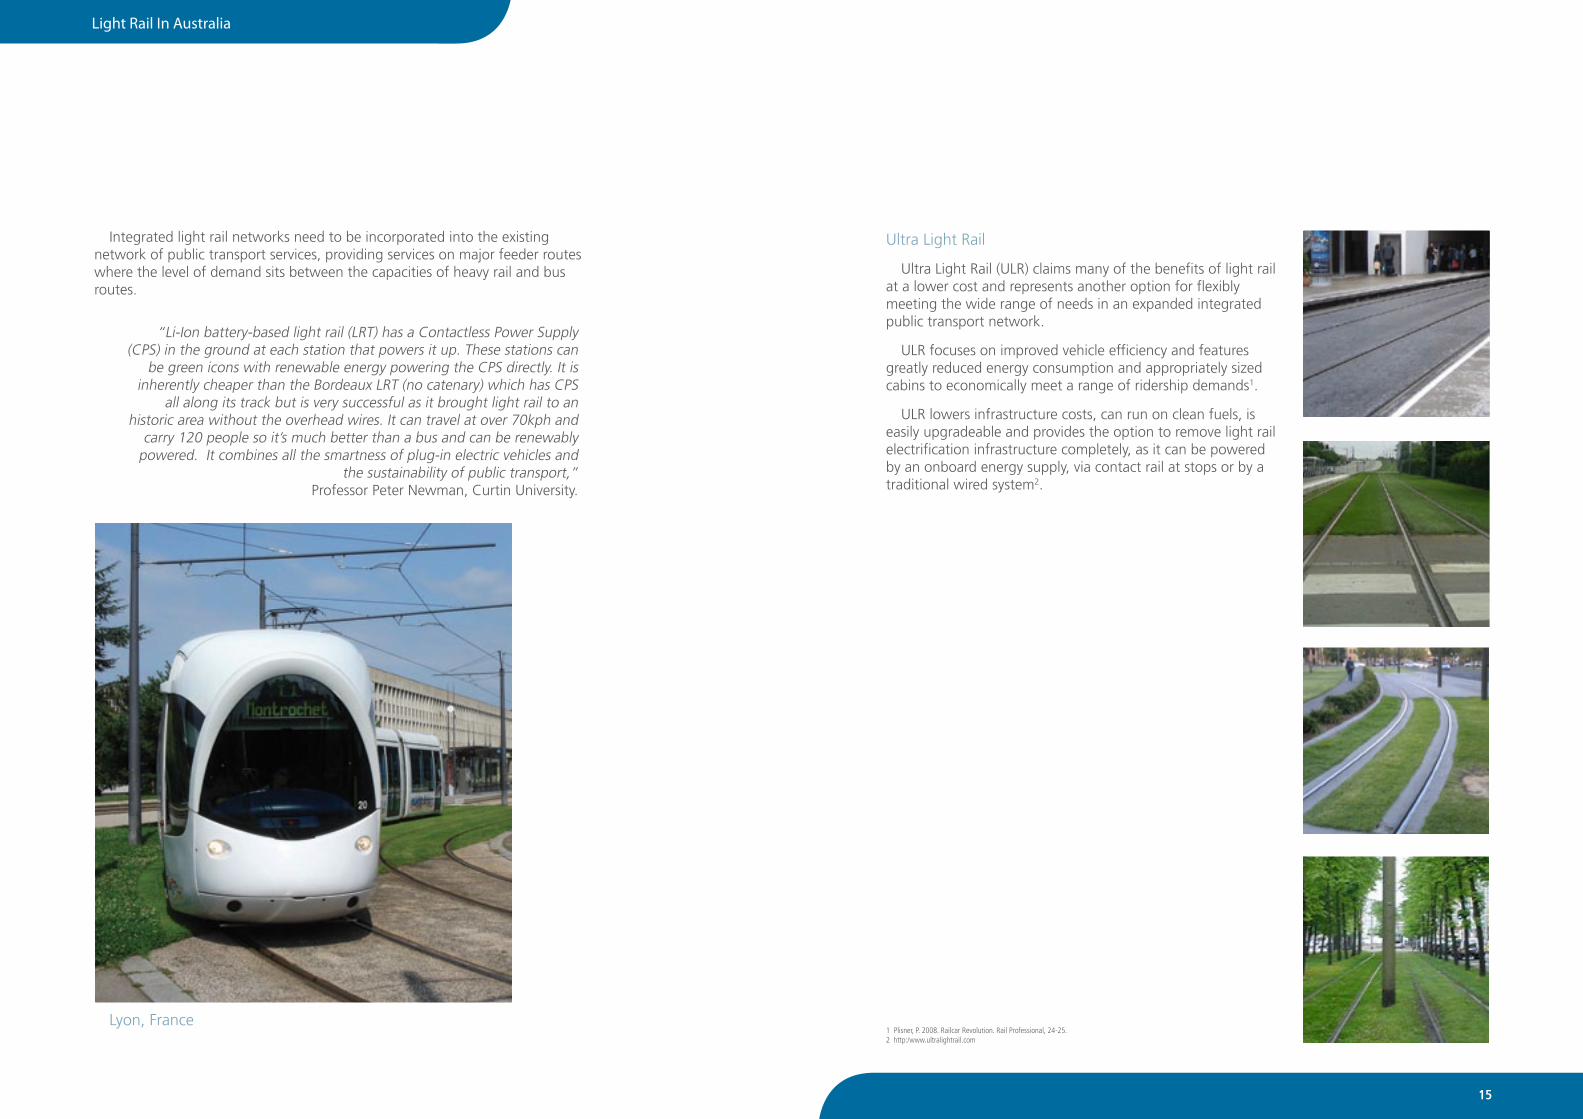
Lyon, France
Light Rail In Australia
17
6 Getting the transport mix right: Light rail in context
Despite extensive bus and rail networks in most Australian cities, it is still virtually impossible to live in the outer metropolitan suburbs without a car, as the oil vulnerability maps show. Even when proposed light rail systems becomes a reality, they will still be beyond walking distance of many people. There will be a need to integrate them carefully with existing heavy rail services, cycling and pedestrian initiatives, and to take a new look at how our bus systems operate.
Ultimately, the aim is to create a completely integrated system with coordinated network planning and timetabling, seamless ticketing between modes and an emphasis on pedestrianised, human-scale land use planning and to eliminate the necessity for many trips altogether.
Average passenger capacity ranges:
Freeway = 1,800 - 9,000 people per hour
Bus Rapid Transit = 8,000 - 25,000 people p/hr1
Light Rail = 10,000 - 28,000 people p/hr2
Heavy Rail = 18,000 - 54,000 people p/hr3
Redesigning bus networks
While there is evidence that people prefer high quality electric rail services to buses, there is still a threefold role for buses:
• Tofulfiltheline-haulfunctionofaraillinepriorto the line being built, and to assist in designing future rail links by trialling different routes and timetables prior to the construction of the rail.
• Toworkinconcertwithrailtimetablestodistribute people to and from rail hubs, particularly in a low density city such as Perth.
• Asalocalserviceinareasoflowerdemandorwhere there seems little likelihood of a light rail service. In this instance we would include a frequent low cost service linking areas such as Ellenbrook, Kalamunda, Roleystone, Mundaring and other peri- urban suburbs.
Expanding bus capacity can also occur much more rapidly than the deployment of a light rail network. It is important that in the short term, State and territory Governments prioritise enhanced bus services and cycleways to outer metropolitan areas to offset oil vulnerability while light rail proposala move toward implementation.
As Paul Mees notes in ‘Transport for Suburbia - Beyond the Automobile Age (2010), low density should not be used as an excuse for neglecting public transport provision in outer metropolitan or peri-urban areas. Overseas examples including Toronto, Zurich and Vancouver vividly demonstrate the power of public transport network planning, incorporating more direct bus routes and greatly increased frequency or pulse timetabling to dramatically increase public transport patronage.
Light rail has been introduced to more than 100 international cities in the past decade, making a spectacular comeback in the United States, East Asia and Europe.
1 Transit Cooperative Research Program Report 13: Rail Transit Capacity, 1996
2 Transit Cooperative Research Program Report 90: Bus Rapid Transit, Volume 1: Case Studies in Bus Rapid Transit, 2003.
3 Transit Cooperative Research Program Report 13: Rail Transit Capacity, 1996
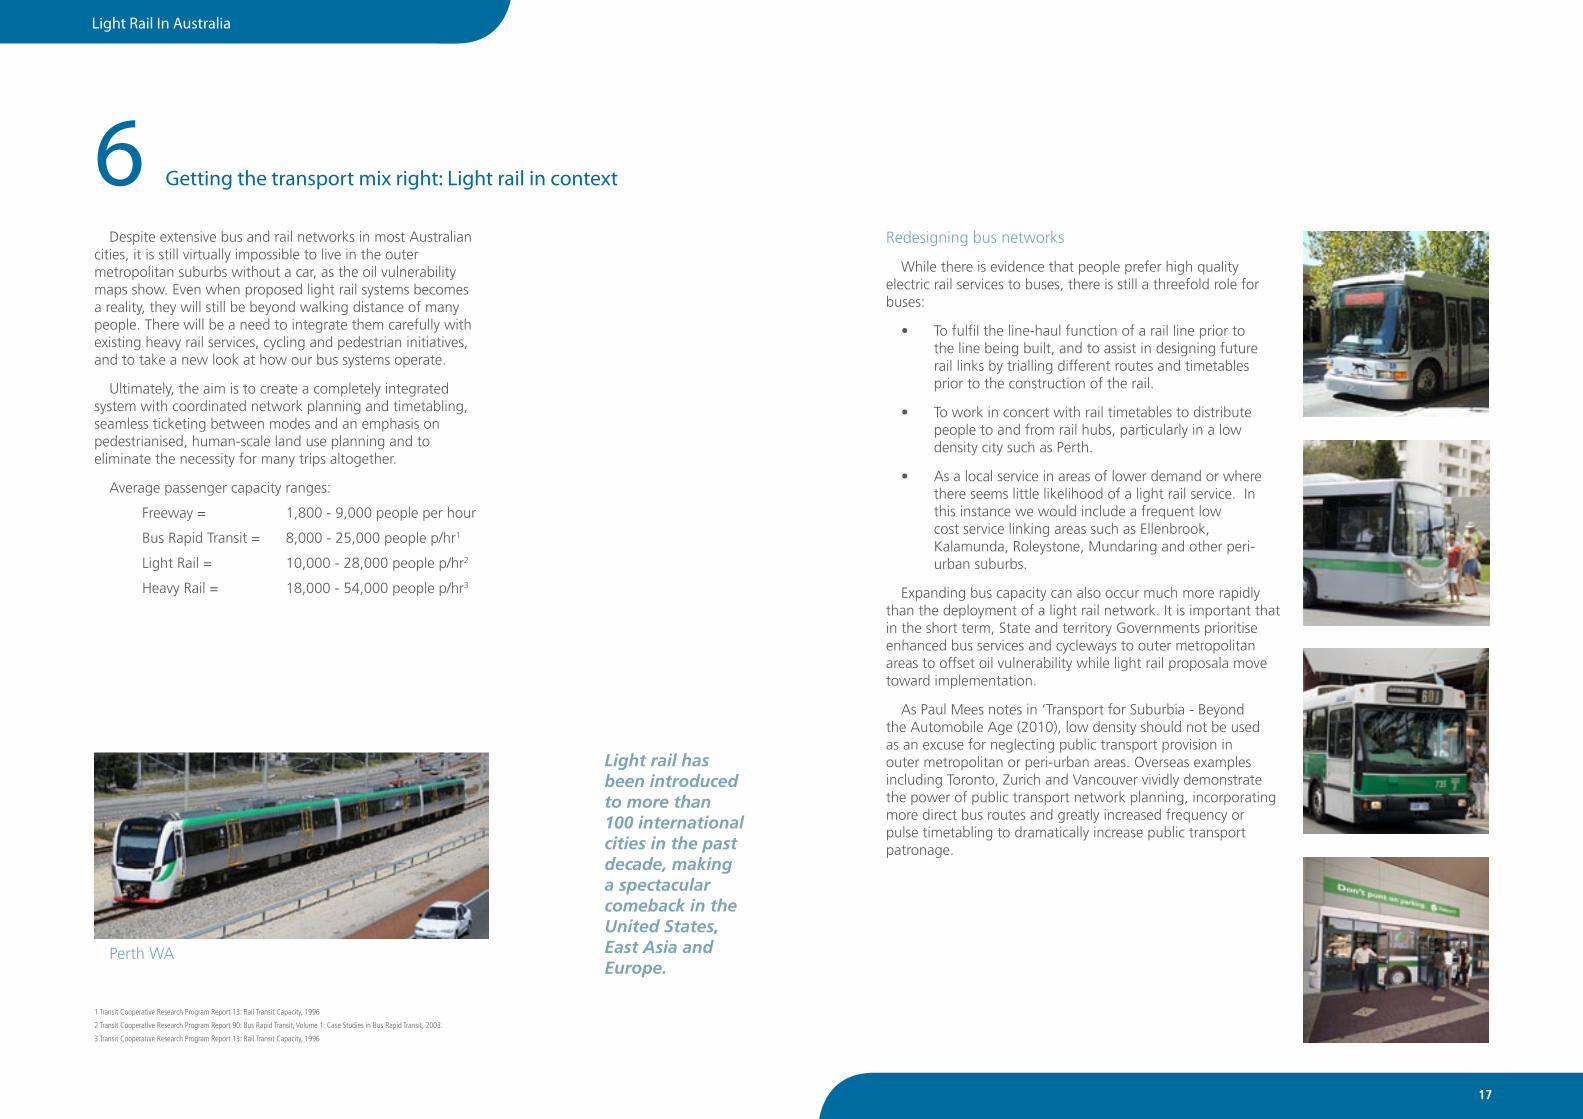
Perth WA
Light Rail In Australia
19
Bus Rapid Transit (BRT)
BRT can play an important role in expanded integrated public transport networks. BRT is a roadway based rapid transit system that offers a high capacity transport service in dedicated right of way lanes using sleek modern vehicles, very similar to light rail vehicles1. BRT can also be used to trial a potential light rail route as the BRT infrastructure can be converted to a permanent light rail infrastructure in due course, as may the intention in Brisbane BRT network2.
Rapid or high frequency bus services are already operating down dedicated lanes in some Australian cities, particularly Brisbane and Adelaide, providing a useful transition model for identifying future light rail corridors.
CAT bus services
The highly successful Perth CAT (Central Area Transit) initiative came about through the Commonwealth ‘Better Cities’ programme that ran from 1991-1997 - the last time the Australian Government played an active role in funding urban public transport. Services consist of high frequency shuttle buses serving the commercial centres. Expanded CAT services operating around major transit oriented development nodes will help people get to rail stations and provide an easy alternative to driving to park and ride stations.
Walking and cycling
In Australia it is estimated that 50% of all car trips made are less than 5km3. This is a distance that could easily be taken by a bicycle. Cycling is the fourth most popular physical activity in Australia and participation grew every year from 2001 to 2006. It is essential that more emphasis be put on investment in cycleways and bike shelters at bus and train stations.
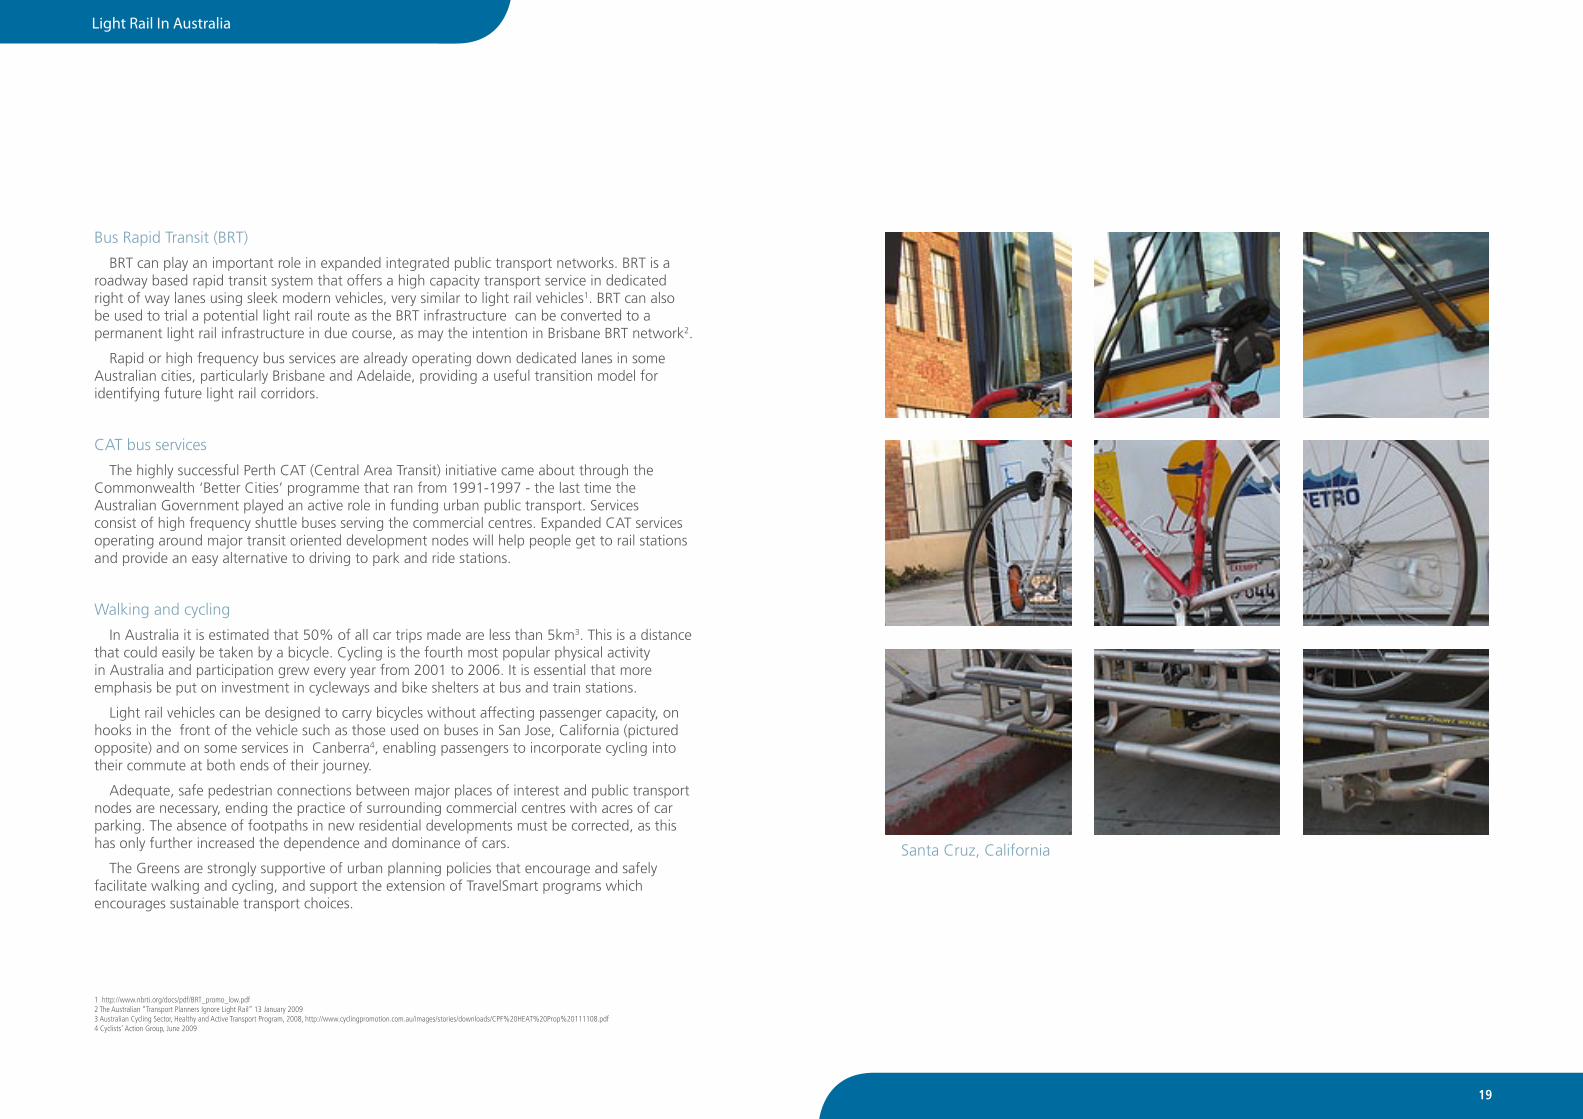
Light rail vehicles can be designed to carry bicycles without affecting passenger capacity, on hooks in the front of the vehicle such as those used on buses in San Jose, California (pictured opposite) and on some services in Canberra4, enabling passengers to incorporate cycling into their commute at both ends of their journey.
Adequate, safe pedestrian connections between major places of interest and public transport nodes are necessary, ending the practice of surrounding commercial centres with acres of car parking. The absence of footpaths in new residential developments must be corrected, as this has only further increased the dependence and dominance of cars.
The Greens are strongly supportive of urban planning policies that encourage and safely facilitate walking and cycling, and support the extension of TravelSmart programs which encourages sustainable transport choices.
1 http://www.nbrti.org/docs/pdf/BRT_promo_low.pdf 2 The Australian “Transport Planners Ignore Light Rail” 13 January 20093 Australian Cycling Sector, Healthy and Active Transport Program, 2008, http://www.cyclingpromotion.com.au/images/stories/downloads/CPF%20HEAT%20Prop%20111108.pdf4 Cyclists’ Action Group, June 2009
Santa Cruz, California

Light Rail In Australia
21
7 Costs and economics
The costs of building light rail are highly sensitive to the degree of tunnelling, elevated sections, shared rights-of-way and so on. The figure below shows the variability in capital costs (including both infrastructure and rolling stock), measured as AU$ million per kilometre of track, for 37 completed light rail projects in the US, Canada and UK. Projects with extensive tunnelling, such as the London Docklands extensions and Buffalo’s Metro Rail, run to the high end of the spectrum. A large rolling stock is also a factor in busy cities such as London.
The outer suburbs of Australain cities are well suited to light rail systems that share roadways, with wide avenues and extensive median strips available. Therefore in these areas it is reasonable to expect that costs would run to the low end of the spectrum, below the average of AU$29 million per kilometre.
The DPI study for Perth of 20071 estimated an infrastructure cost of $17 million per track kilometre for the 14.3km line between Subiaco and East Perth, including two maintenance depots, 25 stops and two small electricity substations, running through some of Perth’s most expensive medium and high density real estate.
Transport infrastructure company Bombardier have backed this calculation, estimating that the cost of building light rail infrastructure in Perth would be between AU$12- $17 million per km (or up to $20 million in complicated situations), based on their work in Melbourne and Queensland. Rolling stock (31 carriages at $4.5 million each) takes the total capital cost for the DPI proposal to about $27 million per km.
In June 2009, the City of Stirling was provided with advice that light rail options along the proposed Stephenson Boulevard alignment would have capital costs in the order of $15-20 million per km2. Most of this cost is for rolling stock (estimated at $4 million per tram), due to the short length of the proposed route. However, these figures are only “concept level” with an accuracy of +/- 50%.
0
10
20
30
40
50
60
70
80
90
100
Otta
wa
New
Orle
ans
Sacr
amen
to –
Orig
inal
Mem
phis
Tyne
& W
ear –
Sund
erla
nd
Oce
ansi
de
Lond
on D
ockla
nds –
Orig
inal
Sacr
amen
to –
Folso
m
Portl
and
Wes
t Mid
land
s
Cro
ydon
Balti
mor
e
Pitts
burg
h
Man
ches
ter
Shef
field
Den
ver
Cam
den
San
Die
go
Edm
onto
n
San
Jose
-G
uada
lupe
Sacr
amen
to –
Sunr
ise
San
Jose
Tas
man
-Cap
itol
Sacr
amen
to –
Sout
h Li
ne 1
Not
tingh
am
Los
Ange
les
–Bl
ue L
ine
Cha
rlotte
Hou
ston
Dal
las
Cha
rlotte
Salt
Lake
City
San
Jose
-Vas
ona
Min
neap
olis
Los
Ange
les
–G
old
Line
Lond
on D
ockla
nds –
Beck
ton
Jers
ey C
ity
Lond
on D
ockla
nds –
Lew
isha
m
Buffa
lo
A$m
illio
n pe
r kilo
met
re
Light Rail Capital CostsComparison of Cities in the US, Canada and UK
Data Sources:
• The Urban Transportation Monitor, May 16, 2008
• Rapid Transit Monitor 2006, Volume 1: UK Light Rail Systems, TAS Publications
• Light Rail Central, http://www.lightrail.com/LRTSystems.htm (Updated February 22, 2009)
Conversion to Australian Dollars was based on exchanges rates of 0.9, 0.8 and 0.5 for Canadian, $US and £UK respectively.
Operating costs
The operating costs for 22 light rail systems, across cities in the US, Canada and UK, are shown in the figure below. London, with its exceptionally high usage and labour costs3, is understandably expensive to run. Buffalo is an outlier probably due to outdated technology and its subway nature4. Australian cities could expect to have operating costs closer to, if not below, the average of AU$1.1 million per kilometre per year. This concurs with the DPI study and the 2004 draft feasibility study for the Gold Coast Light Rail5, which both estimated operating costs at $0.7 million per kilometre per year.
0
0.5
1
1.5
2
2.5
3
Pitts
burg
h
Mem
phis
New
Orle
ans
Shef
field
Phila
delp
hia
Den
ver
Wes
t Mid
land
s
Cal
gary
Otta
wa
San
Die
go
Man
ches
ter
Cha
rlotte
Tyne
and
Wea
r
Not
tingh
am
Cro
ydon
Edm
onto
n
Dal
las
Bost
on
Hou
ston
Min
neap
olis
Buffa
lo
Lond
on D
ockla
nds
A$m
illio
n pe
r kilo
met
re p
er y
ear
Light Rail Operating CostsComparison of Cities in the US, Canada and UK
1 http://www.dpi.wa.gov.au/cityregionalplanning/15642.asp 2 http://www.bombardier.com/en/transportation
3 Rapid Transit Monitor 2006, Volume 1: UK Light Rail Systems, TAS Publications
4 http://hamiltonlightrail.com/article/light_rail_lessons_from_buffalo/
5 http://www.pb.com.au/gclightrail/GCLR_Report/PDF%27s/Draft_Summary_Report.pdf
Data Sources:
• The Urban Transportation Monitor, May 16, 2008
• Rapid Transit Monitor 2006, Volume 1: UK Light Rail Systems, TAS Publications.
Conversion to Australian Dollars was based on exchanges rates of 0.9, 0.8 and 0.5 for $Canadian, $US and £UK respectively.

Light Rail In Australia
23
8 Funding the projects
It is reasonable to project that a metropolitan light rail project could be funded within a 15 year timeframe, with concerted action by State and Federal governments, noting that there will also be significant funding demands for regional rail and other regional transport priorities.
It has been noted many times that the up-front costs of light rail should be set against the context of huge and largely unaccounted costs of road-dependence, including pollution, traffic accidents, congestion, degraded community amenity, and the costs of maintaining a military presence in oil-rich areas.
One funding option explored in greater depth in Professor Peter Newman’s ‘Knowledge Arc’ light rail proposal for Perth is that of improved land value capture and developer concessions based on the windfall gains reaped by landowners and developers as a result of the arrival of light rail. While modelling the potential of such a mechanism to fund the project is outside the scope of this study, experience overseas demonstrates the enormous potential to fund public transport systems by capturing a fraction of the improved land values surrounding light rail stops.
1 Media Release from Anthony Albanese MP, Minister for Infrastructure, Transport, Regional Development and Local Government (21 January 2008)
...establishing a public transport vehicle manufacturing industry in Australia could go some way towards alleviating overcrowding while also providing employment...
Commonwealth public transport funding
There is a strong need for major investment in public transport by the Federal Government. Several new funding opportunities exist for Federal investment in public passenger transport. This includes, but is not limited to:
Economic stimulus packages
Major investment in public passenger transport through State or Federal economic stimulus plans brought on by the global financial crisis and subsequent economic slow down could provide employment, enhance economic activity and go some way to shielding the community from further oil shocks while meeting our goals to mitigate climate change.
Overcrowding on public transport is one of the most significant problems in the sector. Establishing a public transport vehicle manufacturing industry in Australia could go some way towards alleviating that difficulty while also providing employment (perhaps by retooling the car manufacturing plants that are currently facing closure).
In February 2009, the Federal Government announced an unprecedented $42 billion government spending package, however public transport was entirely absent from the package.
Infrastructure Australia / Building Australia Fund
The Building Australia Fund was established by the Labor Government in 2008 in order to direct $20 billion investment into the nation’s infrastructure through Infrastructure Australia. Infrastructure Australia had identified specific goals, including “saving time for commuters battling traffic congestion in our major cities” and “meeting the challenge of climate change”1. Public transport clearly meets these criteria and should be a major component of the projects that receive funds.

Light Rail In Australia
25
Revenue from future emissions trading scheme or carbon tax
Any future Emissions Trading Scheme (ETS) or carbon tax will provide a new annual Federal revenue stream as a quantity of carbon credits are sold each year or from a flat tax imposed per tonne of carbon emissions. This new revenue should be put towards projects that will assist in the mitigation of climate change.
Commonwealth transport funding
The Greens propose to allocate at least 25% of Commonwealth transport funding (previously through AusLink) for 2009-10 to 2013-14 to major infrastructure projects that shift people or freight off roads and onto more efficient alternatives. Beyond 2013-14, the Greens propose that at least half of future transport funding be dedicated to public transport.
The Federal Government has not funded metropolitan public transport infrastructure since the early 1990s, leaving this vital but costly responsibility entirely to the states.
The current lack of Federal public transport funding is a major deficit in the Commonwealth’s vision for Australia’s transport future. This was confirmed by the recent Senate Committee Inquiry which found that in the 30 years to 2004, the Federal Government spent $58 billion on roads, but only $2.2 billion on rail, and $1.5 billion on public transport1.
State Government and local authorities can offset some of the costs of light rail against improved land values in areas where new services run.
Governance: keep it public
Long experience in Australia and elsewhere has demonstrated that well coordinated public authorities are essential to well functioning public transport systems. Privatisation of systems in Sydney and Melbourne has led to highly dysfunctional outcomes where busses, trains and trams compete against each other rather than against private cars.
If anything has been learned from post-war transport planning globally, it is the importance of well resourced, centralised planning authorities to develop coordinated public transport networks where different modes support and enhance each other.
1 http://www.aph.gov.au/Senate/committee/rrat_ctte/public_transport/report/report.pdf

Light Rail In Australia
27
9 How to make transport clean?
Making transport clean requires a three part effort in Australia: shaping personal transportation choice through a combination of expanded high quality options, equitable distribution, economic incentives, effective leadership, and well crafted policy; supporting innovation and increased efficiencies in current and emerging transportation technologies; and undertaking a fundamental clean shift in the way personal mobility is thought about and powered.
An efficient light rail network supported by the community and powered by a combination of renewable energy sources combines the required efforts into a single substantial step towards making transport clean in Australian cities.
A 100% clean light rail system is not purely a vision of the future. The City of Calgary in Alberta, Canada, runs its entire light rail system on 7.2MW of installed wind power sourced through a local renewable energy provider. Calgary’s light rail network, called the CTrain, is by no means minor. It covers 44 kilometres of rail, stops at 37 stations, carries 280,000 passengers a weekday, saves 26,000 tonnes of carbon emissions annually1, and makes over 70,000 station stops a week2.
Electricity consumption is very sensitive to the weight of the vehicle – the 22 tonne “City Class” tram in the UK uses only 1kwh/km, while the 46 tonne “Manchester Metrolink” uses 4.1 kwh/km3.
In Melbourne, Yarra trams purchased 100MWh of GreenPower to run one tram for eight months in a demonstration project4.
1 Calgary Transit. CTrain Overview [cited 6 April 2009]. Available from http://www.calgarytransit.com/html/ctrain_overview.html.2 Calculated from CTrain schedules at http://www.calgarytransit.com/index.html3 http://www.london-trams.co.uk/reducingcosts.htm4 http://www.pacifichydro.com.au/OurEnergy/PacificHydroGreenPower/VictoriasFirstWindPoweredTram/tabid/238/Default.aspx
“Electrified public transportation… provides an exceptionally clean, energy efficient form of mobility. The electrification of public transport
is a natural and highly efficient response to the problem of “Peak Oil” and climate change.”
CRC for Rail Innovation, 2009, Transforming Rail: A Key Element in Australia’s Low Pollution Future
Amsterdam, Holland
Light Rail In Australia
29
The Melbourne tram system has 501 vehicles that travel a total of 24.8 million kilometres each year1. The energy consumption of that network was calculated by Sustainable Energy Now to be approximately 75,150MWh per year2.
This could be provided by a 30MW wind farm (presuming average generation capacity of 35%); equivalent to roughly one third of Alinta’s ‘Walkaway’ windfarm east of Geraldton.
The additional operating costs associated with using renewable energy would be the cost of purchasing the Renewable Energy Certificates (RECs) to match the amount of energy used. Current estimates put RECs for wind farms at $40 - $50 to reflect the actual cost3.
Based on REC’s costing $45 per MWh, the additional cost for using renewable energy would be $3.4 million annually.
A light rail network does not have to be tied to one source of renewable energy but can create a system powered by renewable energy systems on the roofs of businesses and houses as well as from large centralized systems.
1 http://www.yarratrams.com.au/desktopdefault.aspx/tabid-47//74_read-117/2 Sustainable Energy Now -www.sen.asn.au3 WA Office of Energy

Light Rail In Australia
Scott Ludlam – Australian Greens Senator for Western Australia
8 Cantonment Street Fremantle 6160 Tel: (08) 9335 7477 – Fax: (08) 93357499
S1.36 Parliament House Canberra ACT 2600 Tel: (02) 6277 3467 – Fax: (02) 6277 5821
[email protected] scottludlam.org.au
Related Documents