Organizational Results Research Report March 2011 OR11.015 Life Expectancy Evaluation and Development of a Replacement Schedule for LED Traffic Signals Prepared by Missouri S&T, HDR Engineering and Missouri Department of Transportation

Welcome message from author
This document is posted to help you gain knowledge. Please leave a comment to let me know what you think about it! Share it to your friends and learn new things together.
Transcript
Organ izational Results Research Report March 2011
OR11.015
Life Expectancy Evaluation and Development of a Replacement Schedule for LED Traffic Signals
Prepared by
Missouri S&T, HDR Engineering
and Missouri Department of
Transportation
ii
by
Suzanna Long, PhD Ruwen Qin, PhD
Abhijit Gosavi, PhD C.H. Wu, PhD Tom Ryan, PE
Casey Noll
Engineering Management and Systems Engineering Department Missouri University of Science and Technology
600 W. 14th Street 215 Engineering Management Building
Rolla, MO 65409 Email: [email protected], Telephone: 573-341-7621, Fax: 573-341-6567
March 2011
The opinions, findings, and conclusions expressed in this publication are those of the principal investigators. They are not necessarily those of the Missouri Department of Transportation, the U.S. Department of Transportation or the Federal Highway Administration. This report does not constitute a standard or regulation.
iii
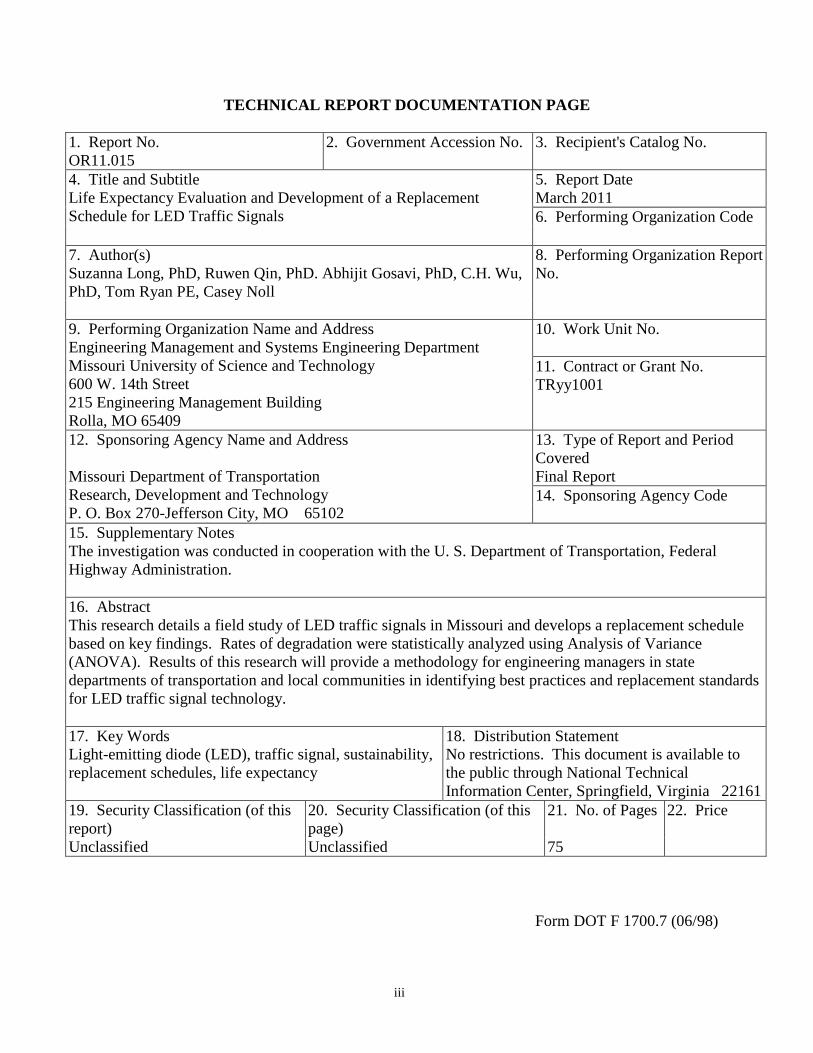
TECHNICAL REPORT DOCUMENTATION PAGE
1. Report No. OR11.015
2. Government Accession No.
3. Recipient's Catalog No.
4. Title and Subtitle Life Expectancy Evaluation and Development of a Replacement Schedule for LED Traffic Signals
5. Report Date March 2011 6. Performing Organization Code
7. Author(s) Suzanna Long, PhD, Ruwen Qin, PhD. Abhijit Gosavi, PhD, C.H. Wu, PhD, Tom Ryan PE, Casey Noll
8. Performing Organization Report No.
9. Performing Organization Name and Address Engineering Management and Systems Engineering Department Missouri University of Science and Technology 600 W. 14th Street 215 Engineering Management Building Rolla, MO 65409
10. Work Unit No. 11. Contract or Grant No. TRyy1001
12. Sponsoring Agency Name and Address
Missouri Department of Transportation Research, Development and Technology P. O. Box 270-Jefferson City, MO 65102
13. Type of Report and Period Covered Final Report 14. Sponsoring Agency Code
15. Supplementary Notes The investigation was conducted in cooperation with the U. S. Department of Transportation, Federal Highway Administration. 16. Abstract This research details a field study of LED traffic signals in Missouri and develops a replacement schedule based on key findings. Rates of degradation were statistically analyzed using Analysis of Variance (ANOVA). Results of this research will provide a methodology for engineering managers in state departments of transportation and local communities in identifying best practices and replacement standards for LED traffic signal technology. 17. Key Words Light-emitting diode (LED), traffic signal, sustainability, replacement schedules, life expectancy
18. Distribution Statement No restrictions. This document is available to the public through National Technical Information Center, Springfield, Virginia 22161
19. Security Classification (of this report) Unclassified
20. Security Classification (of this page) Unclassified
21. No. of Pages
75
22. Price
Form DOT F 1700.7 (06/98)
iv
Executive Summary The goal of this study is to provide a repeatable methodology that can be used by the Missouri Department of Transportation (MoDOT) and other DOTs to evaluate the life expectancy of LEDs based on real traffic flow, intersection geometrics in Missouri and the basic science of LED components, as well as provide guidelines for cost-effective replacement plans based on these findings. The study uses a combination of field testing and statistical analysis. Specifically, the project includes:
1. An evaluation of the impact of the following variables: manufacturer, indicator type, color and directional view on the degradation of LED traffic signals, and
2. The development of a comprehensive replacement plan for the LEDs based on the data collected.
Previous studies have measured intensity readings for individual signal heads only by color, rather than color, age, and manufacturer. In addition, these studies took readings either in a laboratory setting or at the signal head. The results from previous studies failed to determine detailed replacement guidelines that include recommendations based on:
1. Signal head intensity and ITE threshold compliance from the driver’s perspective, 2. Differences by color, indicator type, and manufacturer, and 3. Economic cost-benefit analysis of replacement of individual signal sections versus entire
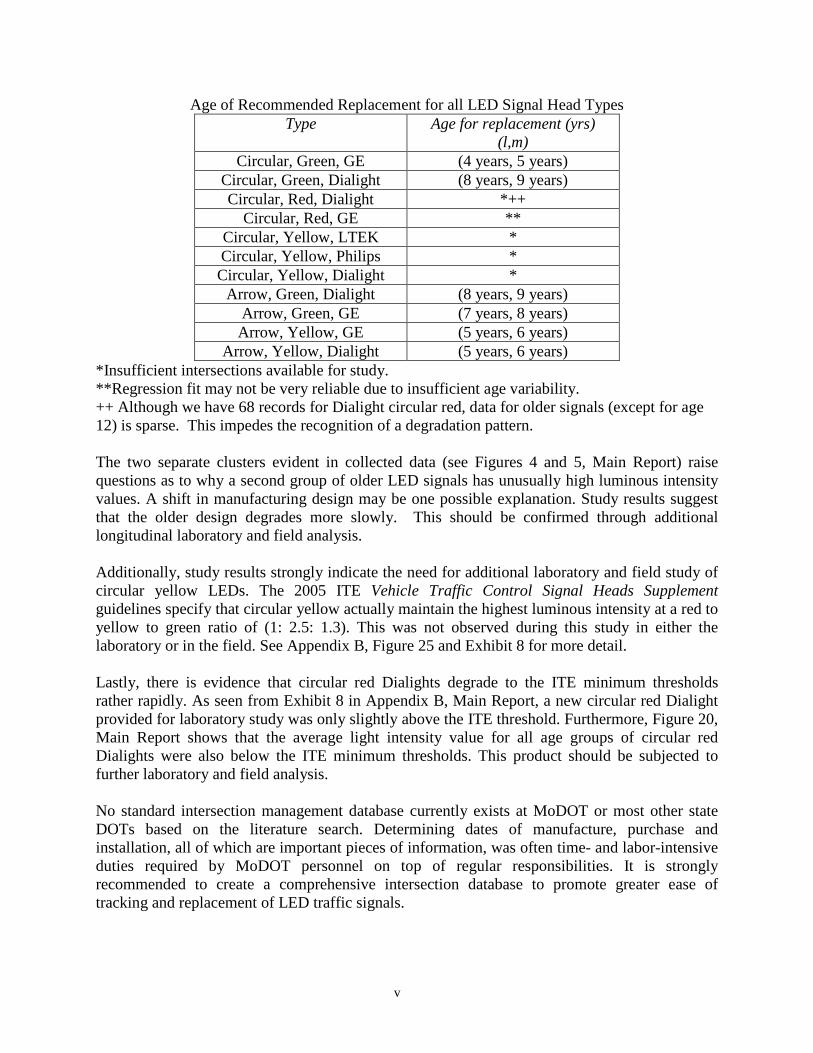
heads. These studies recommended generic replacement schedules based largely on manufacturer warranty, typically five years plus one. Study findings support the economic value of LED traffic signals (over traditional incandescent bulbs) and suggest that LED lighting should be evaluated for other applications. These include roadway luminaires, parking area lighting, and facilities lighting. Although the findings do not recommend any one manufacturer over another, cross-sectional results suggest that useful life of LED traffic signals meets or exceeds useful life warranty expectations for most indicator types and manufacturers. Pending longitudinal evaluation, it is recommended an implementation strategy that replaces circular green and green arrow indicators at approximately eight years. Preliminary results suggest that circular red indicators hover below the ITE threshold for a lengthy period following a rapid drop-off after installation. Based on limited observed degradation patterns, it is suggested that circular red signal indicators should be evaluated when circular green and green arrow indicators are replaced. If the luminous intensity continues to hover near threshold, replacement is suggested at the ten-year mark. If the intensity reading is significantly below ITE threshold, it should be replaced with circular green and green arrow signal indicators. No recommendations were made for circular yellow indicators due to concerns over their intensity. However, our findings support a replacement plan of six years for yellow arrow indicators. A summary of findings by manufacturer is presented in Table 1.
v
Age of Recommended Replacement for all LED Signal Head Types Type Age for replacement (yrs)
(l,m) Circular, Green, GE (4 years, 5 years)
Circular, Green, Dialight (8 years, 9 years) Circular, Red, Dialight *++
Circular, Red, GE ** Circular, Yellow, LTEK * Circular, Yellow, Philips * Circular, Yellow, Dialight *
Arrow, Green, Dialight (8 years, 9 years) Arrow, Green, GE (7 years, 8 years) Arrow, Yellow, GE (5 years, 6 years)
Arrow, Yellow, Dialight (5 years, 6 years) *Insufficient intersections available for study. **Regression fit may not be very reliable due to insufficient age variability. ++ Although we have 68 records for Dialight circular red, data for older signals (except for age 12) is sparse. This impedes the recognition of a degradation pattern. The two separate clusters evident in collected data (see Figures 4 and 5, Main Report) raise questions as to why a second group of older LED signals has unusually high luminous intensity values. A shift in manufacturing design may be one possible explanation. Study results suggest that the older design degrades more slowly. This should be confirmed through additional longitudinal laboratory and field analysis. Additionally, study results strongly indicate the need for additional laboratory and field study of circular yellow LEDs. The 2005 ITE Vehicle Traffic Control Signal Heads Supplement guidelines specify that circular yellow actually maintain the highest luminous intensity at a red to yellow to green ratio of (1: 2.5: 1.3). This was not observed during this study in either the laboratory or in the field. See Appendix B, Figure 25 and Exhibit 8 for more detail. Lastly, there is evidence that circular red Dialights degrade to the ITE minimum thresholds rather rapidly. As seen from Exhibit 8 in Appendix B, Main Report, a new circular red Dialight provided for laboratory study was only slightly above the ITE threshold. Furthermore, Figure 20, Main Report shows that the average light intensity value for all age groups of circular red Dialights were also below the ITE minimum thresholds. This product should be subjected to further laboratory and field analysis. No standard intersection management database currently exists at MoDOT or most other state DOTs based on the literature search. Determining dates of manufacture, purchase and installation, all of which are important pieces of information, was often time- and labor-intensive duties required by MoDOT personnel on top of regular responsibilities. It is strongly recommended to create a comprehensive intersection database to promote greater ease of tracking and replacement of LED traffic signals.
vi
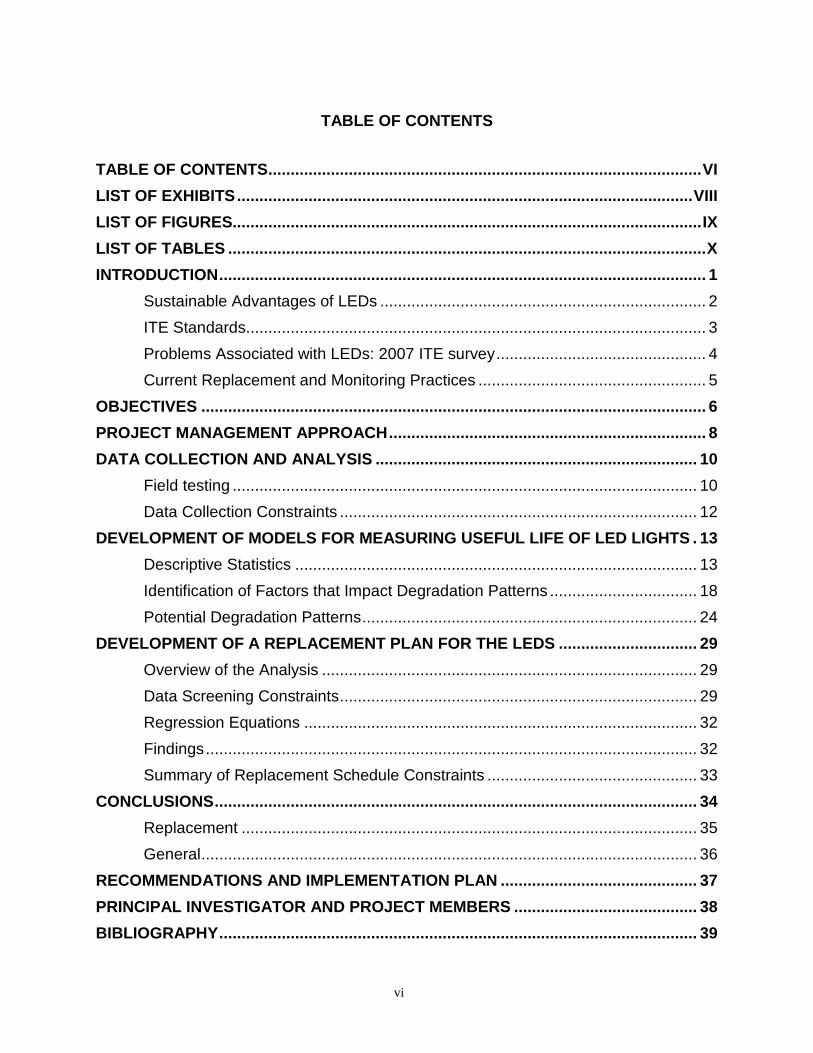
TABLE OF CONTENTS TABLE OF CONTENTS ................................................................................................. VI LIST OF EXHIBITS ...................................................................................................... VIII LIST OF FIGURES......................................................................................................... IX
LIST OF TABLES ........................................................................................................... X
INTRODUCTION ............................................................................................................. 1
Sustainable Advantages of LEDs ......................................................................... 2
ITE Standards ....................................................................................................... 3
Problems Associated with LEDs: 2007 ITE survey ............................................... 4
Current Replacement and Monitoring Practices ................................................... 5
OBJECTIVES ................................................................................................................. 6
PROJECT MANAGEMENT APPROACH ....................................................................... 8
DATA COLLECTION AND ANALYSIS ........................................................................ 10
Field testing ........................................................................................................ 10
Data Collection Constraints ................................................................................ 12
DEVELOPMENT OF MODELS FOR MEASURING USEFUL LIFE OF LED LIGHTS . 13
Descriptive Statistics .......................................................................................... 13
Identification of Factors that Impact Degradation Patterns ................................. 18
Potential Degradation Patterns ........................................................................... 24
DEVELOPMENT OF A REPLACEMENT PLAN FOR THE LEDS ............................... 29
Overview of the Analysis .................................................................................... 29
Data Screening Constraints ................................................................................ 29
Regression Equations ........................................................................................ 32
Findings .............................................................................................................. 32
Summary of Replacement Schedule Constraints ............................................... 33
CONCLUSIONS ............................................................................................................ 34
Replacement ...................................................................................................... 35
General ............................................................................................................... 36
RECOMMENDATIONS AND IMPLEMENTATION PLAN ............................................ 37
PRINCIPAL INVESTIGATOR AND PROJECT MEMBERS ......................................... 38
BIBLIOGRAPHY ........................................................................................................... 39

vii
APPENDIX A ................................................................................................................ 42
APPENDIX B ................................................................................................................ 43
APPENDIX C ................................................................................................................ 51
APPENDIX D ................................................................................................................ 54
APPENDIX E ................................................................................................................ 57
viii
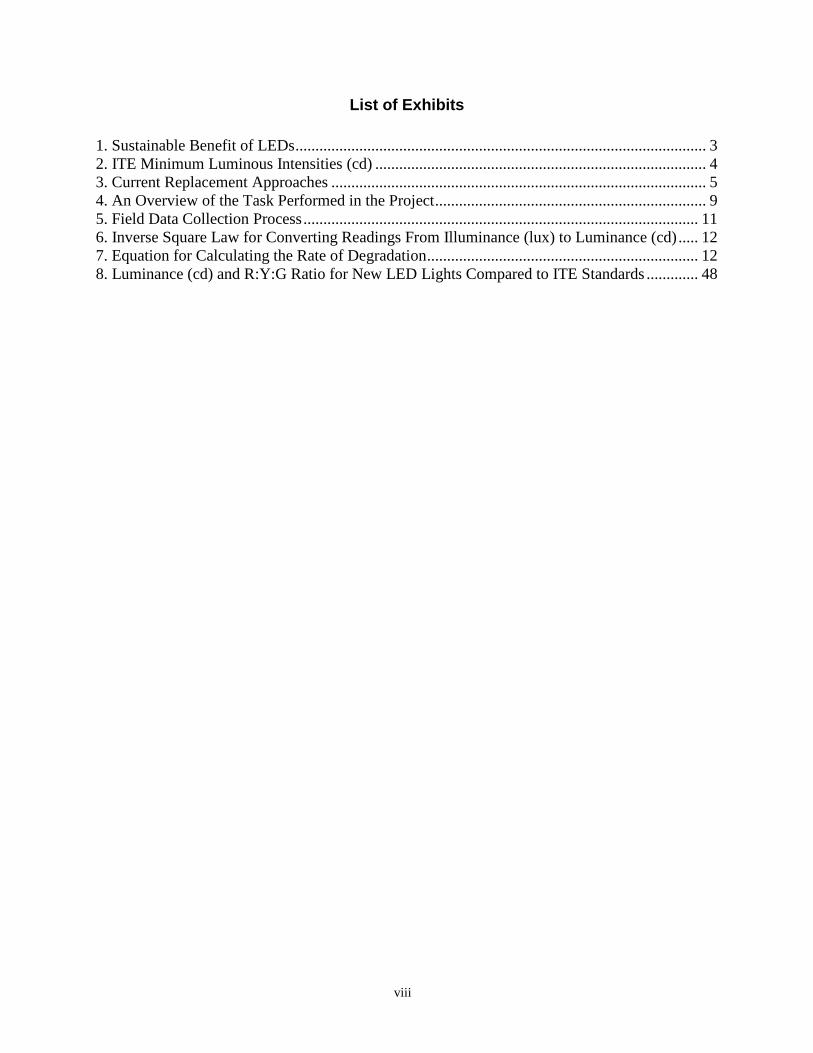
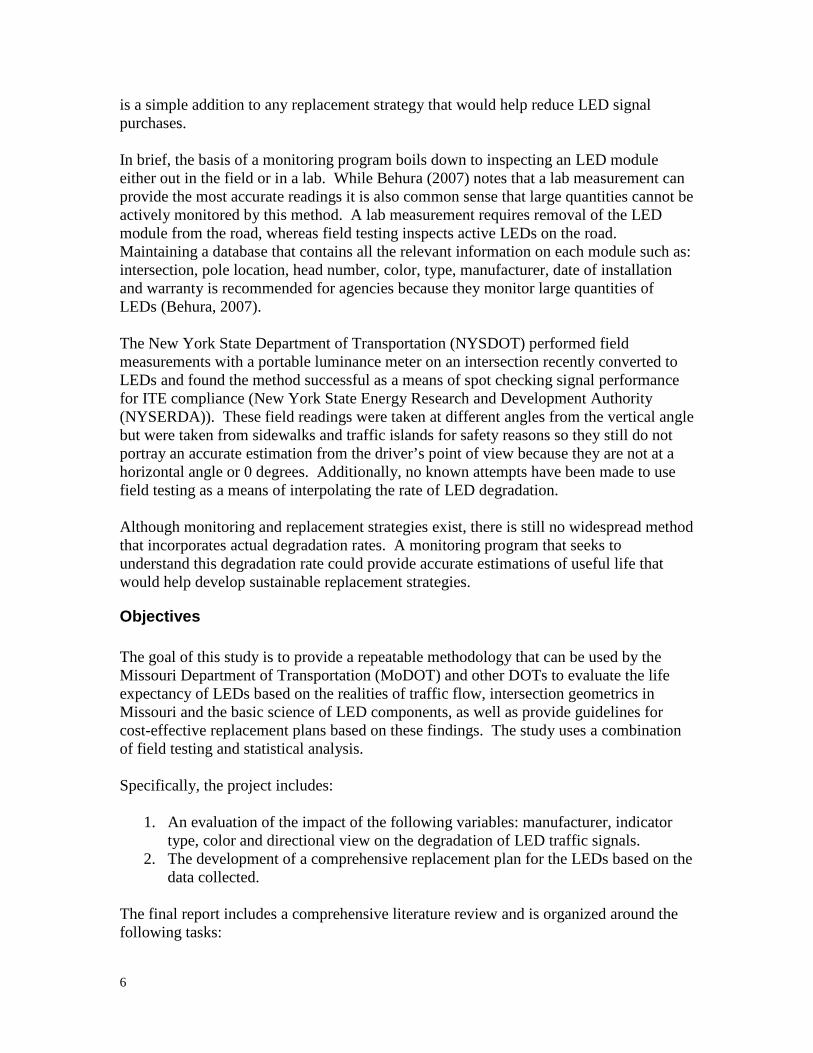
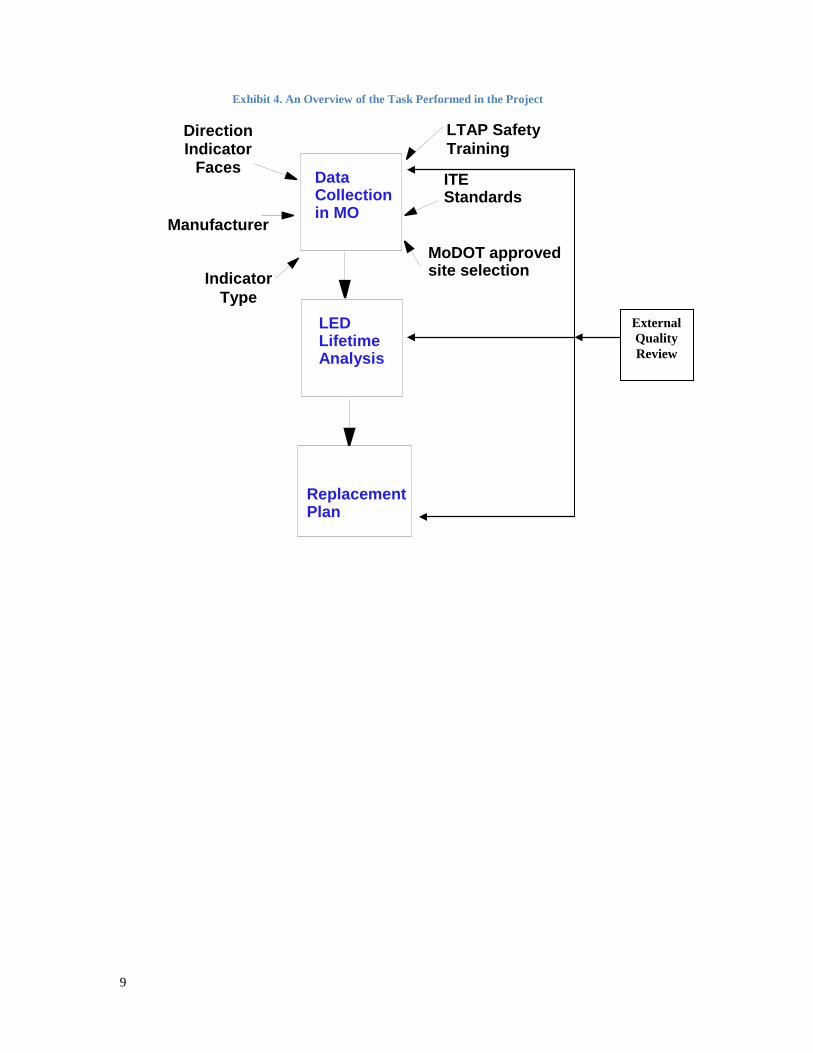
List of Exhibits 1. Sustainable Benefit of LEDs ....................................................................................................... 3 2. ITE Minimum Luminous Intensities (cd) ................................................................................... 4 3. Current Replacement Approaches .............................................................................................. 5 4. An Overview of the Task Performed in the Project .................................................................... 9 5. Field Data Collection Process ................................................................................................... 11 6. Inverse Square Law for Converting Readings From Illuminance (lux) to Luminance (cd) ..... 12 7. Equation for Calculating the Rate of Degradation .................................................................... 12 8. Luminance (cd) and R:Y:G Ratio for New LED Lights Compared to ITE Standards ............. 48
ix
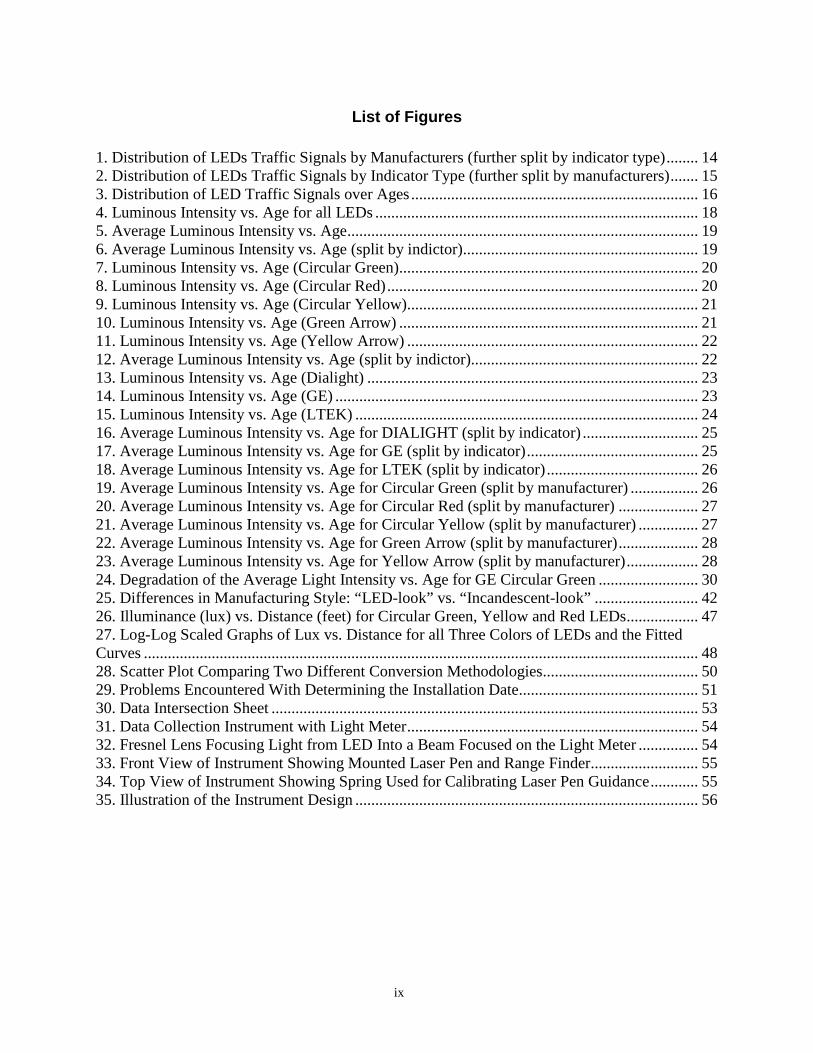
List of Figures
1. Distribution of LEDs Traffic Signals by Manufacturers (further split by indicator type) ........ 14 2. Distribution of LEDs Traffic Signals by Indicator Type (further split by manufacturers) ....... 15 3. Distribution of LED Traffic Signals over Ages ........................................................................ 16 4. Luminous Intensity vs. Age for all LEDs ................................................................................. 18 5. Average Luminous Intensity vs. Age ........................................................................................ 19 6. Average Luminous Intensity vs. Age (split by indictor)........................................................... 19 7. Luminous Intensity vs. Age (Circular Green)........................................................................... 20 8. Luminous Intensity vs. Age (Circular Red) .............................................................................. 20 9. Luminous Intensity vs. Age (Circular Yellow)......................................................................... 21 10. Luminous Intensity vs. Age (Green Arrow) ........................................................................... 21 11. Luminous Intensity vs. Age (Yellow Arrow) ......................................................................... 22 12. Average Luminous Intensity vs. Age (split by indictor)......................................................... 22 13. Luminous Intensity vs. Age (Dialight) ................................................................................... 23 14. Luminous Intensity vs. Age (GE) ........................................................................................... 23 15. Luminous Intensity vs. Age (LTEK) ...................................................................................... 24 16. Average Luminous Intensity vs. Age for DIALIGHT (split by indicator) ............................. 25 17. Average Luminous Intensity vs. Age for GE (split by indicator) ........................................... 25 18. Average Luminous Intensity vs. Age for LTEK (split by indicator) ...................................... 26 19. Average Luminous Intensity vs. Age for Circular Green (split by manufacturer) ................. 26 20. Average Luminous Intensity vs. Age for Circular Red (split by manufacturer) .................... 27 21. Average Luminous Intensity vs. Age for Circular Yellow (split by manufacturer) ............... 27 22. Average Luminous Intensity vs. Age for Green Arrow (split by manufacturer) .................... 28 23. Average Luminous Intensity vs. Age for Yellow Arrow (split by manufacturer) .................. 28 24. Degradation of the Average Light Intensity vs. Age for GE Circular Green ......................... 30 25. Differences in Manufacturing Style: “LED-look” vs. “Incandescent-look” .......................... 42 26. Illuminance (lux) vs. Distance (feet) for Circular Green, Yellow and Red LEDs .................. 47 27. Log-Log Scaled Graphs of Lux vs. Distance for all Three Colors of LEDs and the Fitted Curves ........................................................................................................................................... 48 28. Scatter Plot Comparing Two Different Conversion Methodologies....................................... 50 29. Problems Encountered With Determining the Installation Date ............................................. 51 30. Data Intersection Sheet ........................................................................................................... 53 31. Data Collection Instrument with Light Meter ......................................................................... 54 32. Fresnel Lens Focusing Light from LED Into a Beam Focused on the Light Meter ............... 54 33. Front View of Instrument Showing Mounted Laser Pen and Range Finder........................... 55 34. Top View of Instrument Showing Spring Used for Calibrating Laser Pen Guidance ............ 55 35. Illustration of the Instrument Design ...................................................................................... 56

x
List of Tables
1. A Sample Data Collection Table For Luminous Intensity of a Given Type of LED ............... 11 2. Distribution of LED Traffic Signals Over Manufacturers and Indicators ................................ 13 3. Distribution of LED Indicators Over Manufacturers, Indicators, and Ages ............................. 17 4. Age of Recommended Replacement For all LED Signal Head Types ..................................... 32 5. Replacement Schedule for GE .................................................................................................. 33 6. Replacement Schedule for Dialight .......................................................................................... 33 7. Ambient Light Values Subtracted From Measured Illuminance .............................................. 43 8. Measured Illuminance and Luminance Values With and Without Fresnel Lens and Corresponding Magnification Factor For 12” Green Circular Dialight........................................ 44 9. Measured Illuminance and Luminance Values With and Without Fresnel Lens and Corresponding Magnification Factor for 12” Red Circular Dialight ............................................ 45 10. Measured Illuminance and Luminance Values With and Without Fresnel Lens and Corresponding Magnification Factor For 12” Yellow Circular Leotek........................................ 46
1
Introduction Over the last two decades light-emitting diodes (LEDs) have replaced incandescent bulbs in traffic signals because of their energy savings and much longer service life (Urbanik, 2008). Departments of transportation (DOTs) have gained sufficient experience with converting traffic signal indication, however, much of the initial phasing out of incandescent bulbs is complete and many of the first installments of LEDs now need replacement. The standard practices of maintaining and replacing incandescent lamps cannot be simply transferred and applied to LED signals. Engineering managers have to deal with the differences in long term performance between the two technologies and develop new practices that reflect these differences. There is still much uncertainty related to the monitoring, maintenance and replacement of LEDs over the course of their useful life (Urbanik, 2008). DOTs have a need for sustainable replacement strategies, but lack a comprehensive understanding of LEDs from an economic, performance and safety perspective. The problem is severe enough that in 2006 the Institute of Transportation Engineers (ITE) International Board of Direction decided that the lack of knowledge revolving around maintenance and replacement of LEDs warranted the creation of a special task force to address the issue (Behura, 2007). To ensure that LEDs aren’t left in the field with light output below the recommended values, DOTs are still searching for a reliable method to monitor the light output of LEDs which degrade over time. Determining when an LED signal has reached the end of its useful life is not as clear-cut as it was in the past with incandescent bulbs and new evaluation methods must be created. Whereas incandescent bulbs simply burned out instantly upon failure, LED light output slowly degrades over their five to ten year life cycle. By definition, they reach their end of life when they output an insufficient amount of light as detected by a driver. The ITE provides standards on minimum light output and light distribution and measures this minimum threshold in candelas (cd). Agencies use the ITE specifications as standards; however they still experience difficulty effectively monitoring the vast amount of LED signals under their control. With the absence of national standards regarding maintenance for LEDs, transportation agencies are on their own in evaluating the useful life of the LEDs in their traffic signals and determining when they need replacement. This is a costly process that can have large effects on their budgets (Bullough, 2009). Many agencies already have scarce funding for citywide replacement or maintenance programs (Behura, 2007) and the recent economic downturn only worsens the budget situation. The large differences between the two signal light technologies, the money concerns and the safety risk clearly show a need for a sustainable, systematic replacement schedule. With current practices, LEDs are often left in use beyond their end of life. When this happens they are functioning, but emit light output levels lower than established standards. Engineering managers need a reliable method of monitoring light output levels to better predict failed light output levels.
2
In the 1990’s LEDs showed the ability to provide huge energy savings for agencies because they consumed a lot less power (watts). As a result, agencies began replacing indicators containing older bulb technology (Urbanik, 2008). Early LEDs cost several hundred dollars versus only a few dollars for an incandescent bulb, but their longer expected life and proven energy saving capabilities suggested that they could still yield lower total life cycle costs. Agencies began evaluation programs where intersections were outfitted with LEDs and studied. Early life cycle analyses showed that, despite the huge upfront equipment costs of LEDs, their benefits still led to lower life cycle costs. MoDOT conducted their own Life Cycle Cost Analysis (LCAA) when they first experimented with installing LED signals at a state intersection and had similar findings. They experienced a 75% energy reduction and 90% maintenance cost reduction which led to a lower total life cycle cost, despite the high costs of LEDs in 1999. MoDOT noted that the life cycle costs of LEDs would continue to decrease as LED prices are reduced (Careaga & Allen, 2000). Over the last decade, prices have indeed decreased significantly making LEDs an even clearer choice. Further speeding the transition was the Energy Policy Act of 2005. Title I, Subtitle C, Section 135 mandates that any traffic signal module or pedestrian module manufactured after January 1, 2006 meet the ENERGY STAR energy-efficiency specifications (U.S. Congress, 2005). The U.S. Environmental Protection Agency’s ENERGY STAR program sets caps on the maximum amount of wattage a module can consume (ENERGY STAR, 2003). This combination of legislation effectively mandated the use of LEDs in all new installations. Sustainable advantages of LEDs Today, LEDs are clearly the superior choice. They use less energy, have longer life expectancies, require less maintenance and have an overall cheaper life-cycle cost. From an energy conservation perspective, LEDs consume far less power. The national average for energy savings is about 85%. Life expectancies are a little less clear because there is a difference between rated life and actual life. Manufacturers rate the average life of LED at 100,000 hours, however this is for a single LED under laboratory conditions, whereas traffic signals contain several hundred LEDs in a system and operate outdoors in harsher environments (Hong & Narendran, 2004). These two differences are why the actual life of a LED is actually lower than its rated life. Despite this reduction when compared to the mere 8,000 hours that incandescent bulbs are rated at (Urbanik, 2008), the advantage in useful life is still clear. In practice, LEDs last anywhere from 5-10 years, whereas in the past, MoDOT replaced incandescent bulbs typically every 1 to 1.5 years (Careaga & Allen, 2000). The benefit of such a longer life expectancy is that maintenance crews have to visit intersections less frequently to replace the indicators. Each time a bulb has to be replaced; a two-man maintenance crew must travel to the intersection, set up temporary traffic control and get on a lift to physically change the bulb. The labor cost from frequent visits notably increases the overall lifecycle costs while simultaneously endangering workers, wasting time and fuel for both maintenance
3
workers and the traveling public (additional discussion of operations and maintenance cost-benefit analysis can be found in Appendix E).
Exhibit 1. Sustainable Benefit of LEDs
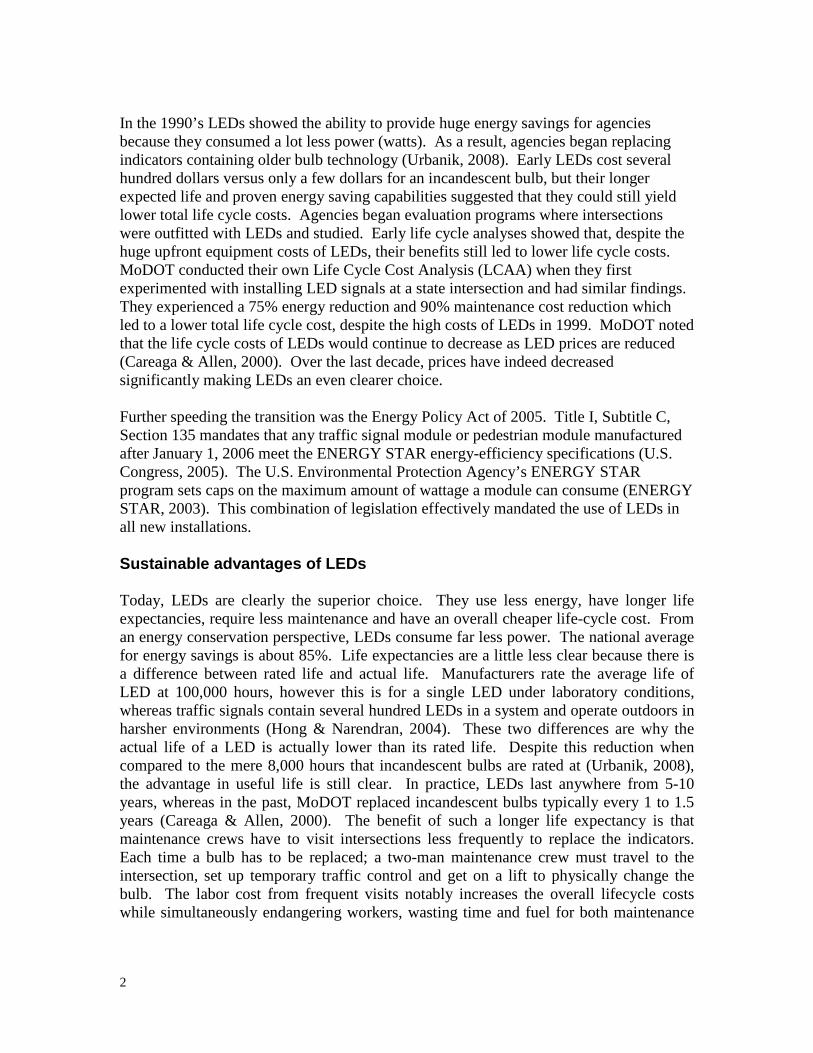
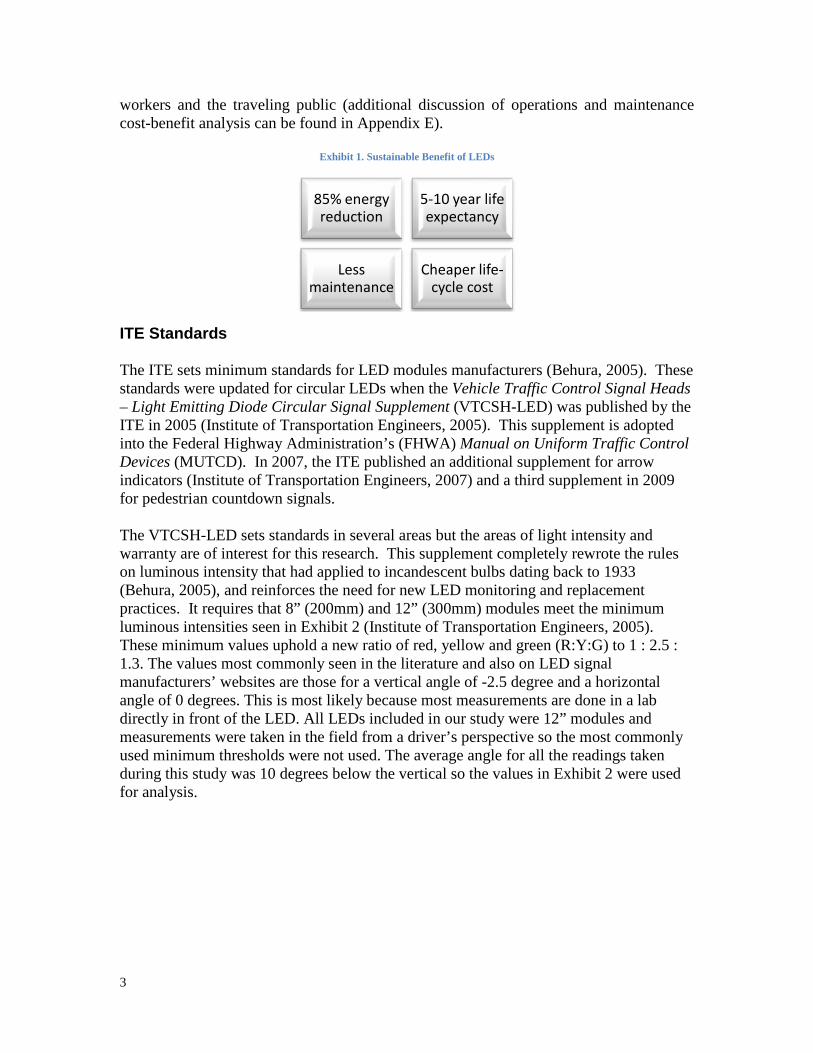
ITE Standards The ITE sets minimum standards for LED modules manufacturers (Behura, 2005). These standards were updated for circular LEDs when the Vehicle Traffic Control Signal Heads – Light Emitting Diode Circular Signal Supplement (VTCSH-LED) was published by the ITE in 2005 (Institute of Transportation Engineers, 2005). This supplement is adopted into the Federal Highway Administration’s (FHWA) Manual on Uniform Traffic Control Devices (MUTCD). In 2007, the ITE published an additional supplement for arrow indicators (Institute of Transportation Engineers, 2007) and a third supplement in 2009 for pedestrian countdown signals. The VTCSH-LED sets standards in several areas but the areas of light intensity and warranty are of interest for this research. This supplement completely rewrote the rules on luminous intensity that had applied to incandescent bulbs dating back to 1933 (Behura, 2005), and reinforces the need for new LED monitoring and replacement practices. It requires that 8” (200mm) and 12” (300mm) modules meet the minimum luminous intensities seen in Exhibit 2 (Institute of Transportation Engineers, 2005). These minimum values uphold a new ratio of red, yellow and green (R:Y:G) to 1 : 2.5 : 1.3. The values most commonly seen in the literature and also on LED signal manufacturers’ websites are those for a vertical angle of -2.5 degree and a horizontal angle of 0 degrees. This is most likely because most measurements are done in a lab directly in front of the LED. All LEDs included in our study were 12” modules and measurements were taken in the field from a driver’s perspective so the most commonly used minimum thresholds were not used. The average angle for all the readings taken during this study was 10 degrees below the vertical so the values in Exhibit 2 were used for analysis.
85% energy reduction
5-10 year life expectancy
Less maintenance
Cheaper life-cycle cost
4
Exhibit 2. ITE Minimum Luminous Intensities (cd)
Vertical Angle: Horizontal Angle:
-2.5 degrees 0 degrees
-10 degrees
0 degrees
Signal Size: 8"
(200mm) 12"
(300mm) 12"
(300mm) Circular Red 165 365 197 Circular Yellow 410 910 491 Circular Green 215 475 257 Yellow Arrow - 146 79 Green Arrow - 76 41
As mentioned, the new ITE supplements also set standards requiring manufacturers warrant their modules for at least 5 years, meaning they must repair or replace any indicators whose minimum luminous output levels fall below the ITE threshold (Institute of Transportation Engineers, 2005). Problems associated with LEDs: 2007 ITE survey After the ITE International Board of Direction created the task force to address the issue of maintenance and replacement of LEDs, the ITE developed a 2007 survey for those involved with the manufacture, sales, use and maintenance of LEDs (Behura, 2007). In total, 76 traffic agencies and 6 traffic signal vendors/manufacturers responded. The results showed the following about agencies, manufacturers and vendors:
• 60% have no monitoring/replacement procedure • Half use the ITE specification and half use no specification for minimum light
output at all • Replacement approach
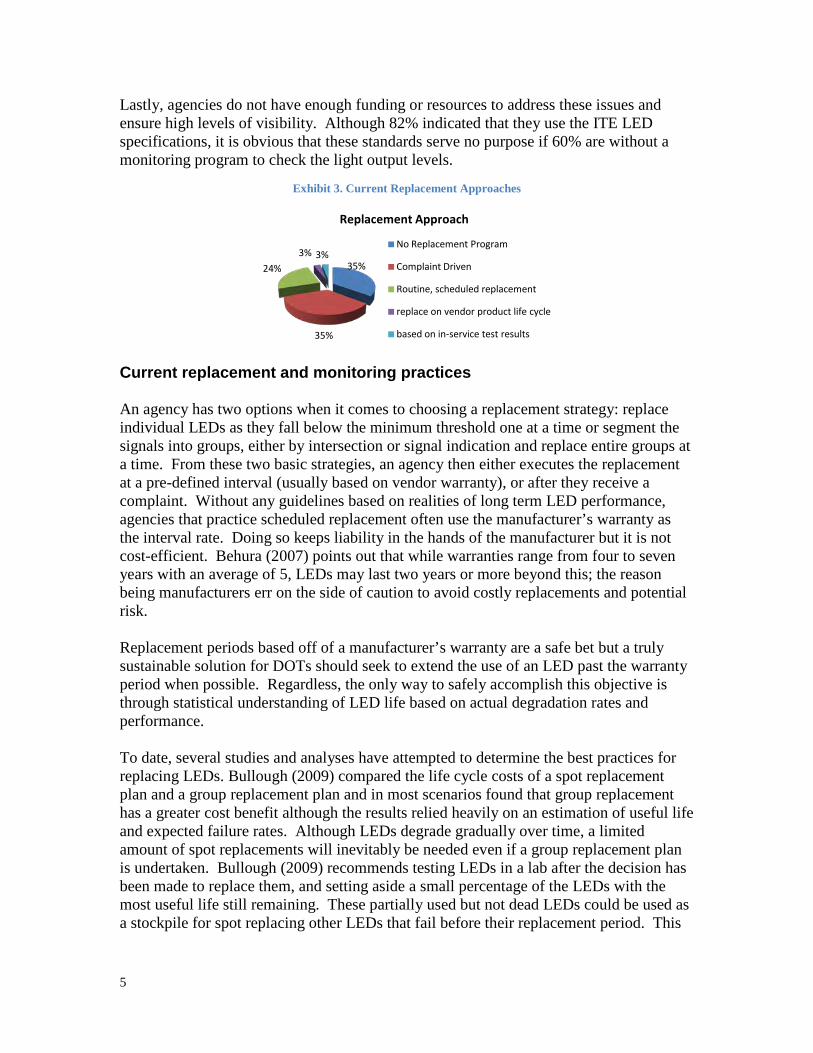
35 % : no replacement approach 35 %: complaint drive 24 %: routine, scheduled replacement 3 %: replace on vendor product life cycle 3 %: based on in-service test results
• Of those that use a scheduled replacement approach: 38% - 5 years 10% - 6 years 52% - Greater than 6 years 73% use a 5-year warranty period (Behura, 2007)
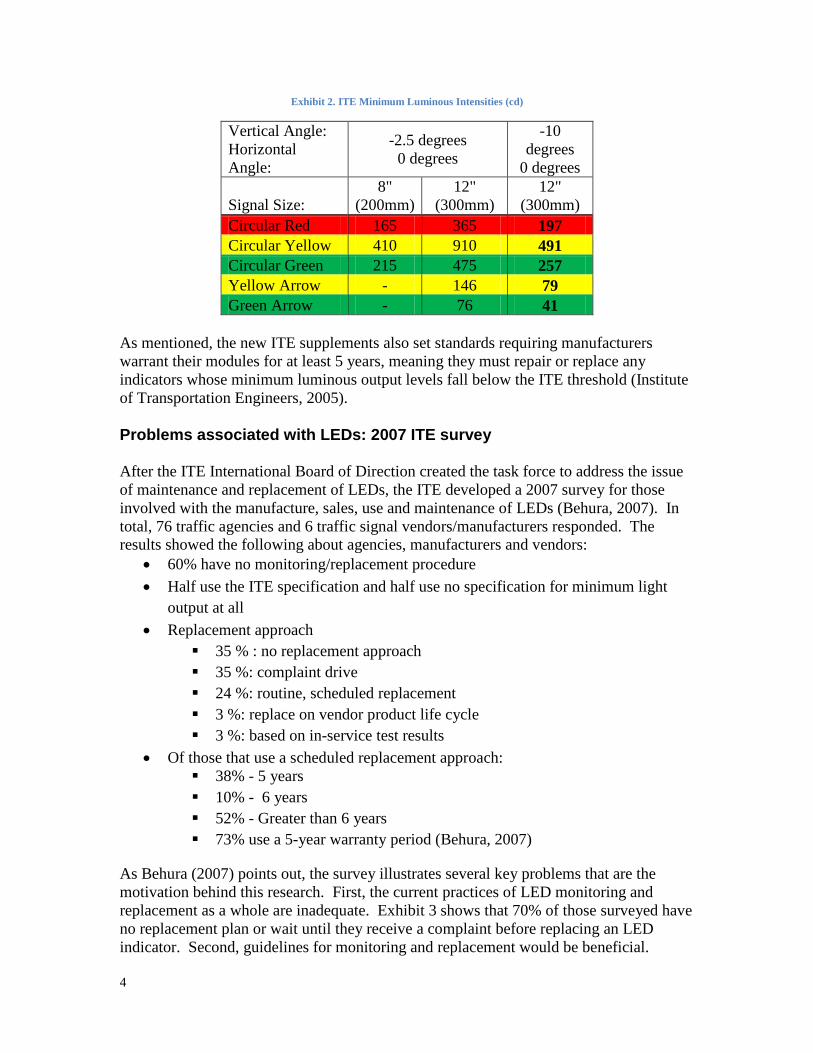
As Behura (2007) points out, the survey illustrates several key problems that are the motivation behind this research. First, the current practices of LED monitoring and replacement as a whole are inadequate. Exhibit 3 shows that 70% of those surveyed have no replacement plan or wait until they receive a complaint before replacing an LED indicator. Second, guidelines for monitoring and replacement would be beneficial.
5
Lastly, agencies do not have enough funding or resources to address these issues and ensure high levels of visibility. Although 82% indicated that they use the ITE LED specifications, it is obvious that these standards serve no purpose if 60% are without a monitoring program to check the light output levels.
Exhibit 3. Current Replacement Approaches
35%
35%
24%3% 3%
Replacement Approach
No Replacement Program
Complaint Driven
Routine, scheduled replacement
replace on vendor product life cycle
based on in-service test results
Current replacement and monitoring practices An agency has two options when it comes to choosing a replacement strategy: replace individual LEDs as they fall below the minimum threshold one at a time or segment the signals into groups, either by intersection or signal indication and replace entire groups at a time. From these two basic strategies, an agency then either executes the replacement at a pre-defined interval (usually based on vendor warranty), or after they receive a complaint. Without any guidelines based on realities of long term LED performance, agencies that practice scheduled replacement often use the manufacturer’s warranty as the interval rate. Doing so keeps liability in the hands of the manufacturer but it is not cost-efficient. Behura (2007) points out that while warranties range from four to seven years with an average of 5, LEDs may last two years or more beyond this; the reason being manufacturers err on the side of caution to avoid costly replacements and potential risk. Replacement periods based off of a manufacturer’s warranty are a safe bet but a truly sustainable solution for DOTs should seek to extend the use of an LED past the warranty period when possible. Regardless, the only way to safely accomplish this objective is through statistical understanding of LED life based on actual degradation rates and performance. To date, several studies and analyses have attempted to determine the best practices for replacing LEDs. Bullough (2009) compared the life cycle costs of a spot replacement plan and a group replacement plan and in most scenarios found that group replacement has a greater cost benefit although the results relied heavily on an estimation of useful life and expected failure rates. Although LEDs degrade gradually over time, a limited amount of spot replacements will inevitably be needed even if a group replacement plan is undertaken. Bullough (2009) recommends testing LEDs in a lab after the decision has been made to replace them, and setting aside a small percentage of the LEDs with the most useful life still remaining. These partially used but not dead LEDs could be used as a stockpile for spot replacing other LEDs that fail before their replacement period. This
6
is a simple addition to any replacement strategy that would help reduce LED signal purchases. In brief, the basis of a monitoring program boils down to inspecting an LED module either out in the field or in a lab. While Behura (2007) notes that a lab measurement can provide the most accurate readings it is also common sense that large quantities cannot be actively monitored by this method. A lab measurement requires removal of the LED module from the road, whereas field testing inspects active LEDs on the road. Maintaining a database that contains all the relevant information on each module such as: intersection, pole location, head number, color, type, manufacturer, date of installation and warranty is recommended for agencies because they monitor large quantities of LEDs (Behura, 2007). The New York State Department of Transportation (NYSDOT) performed field measurements with a portable luminance meter on an intersection recently converted to LEDs and found the method successful as a means of spot checking signal performance for ITE compliance (New York State Energy Research and Development Authority (NYSERDA)). These field readings were taken at different angles from the vertical angle but were taken from sidewalks and traffic islands for safety reasons so they still do not portray an accurate estimation from the driver’s point of view because they are not at a horizontal angle or 0 degrees. Additionally, no known attempts have been made to use field testing as a means of interpolating the rate of LED degradation. Although monitoring and replacement strategies exist, there is still no widespread method that incorporates actual degradation rates. A monitoring program that seeks to understand this degradation rate could provide accurate estimations of useful life that would help develop sustainable replacement strategies.
Objectives The goal of this study is to provide a repeatable methodology that can be used by the Missouri Department of Transportation (MoDOT) and other DOTs to evaluate the life expectancy of LEDs based on the realities of traffic flow, intersection geometrics in Missouri and the basic science of LED components, as well as provide guidelines for cost-effective replacement plans based on these findings. The study uses a combination of field testing and statistical analysis. Specifically, the project includes:
1. An evaluation of the impact of the following variables: manufacturer, indicator type, color and directional view on the degradation of LED traffic signals.
2. The development of a comprehensive replacement plan for the LEDs based on the data collected.
The final report includes a comprehensive literature review and is organized around the following tasks:

7
Task 1: Collecting and analyzing data for measuring the light emission capability of circular and arrow indicators. Task 2: Development of models for measuring the useful life of LED lights. Task 3: Development of a replacement plan for the LEDs. Task 4: Plans for dissemination through the Local Technical Assistance Program (LTAP).

8
Project Management Approach Our study included a detailed work schedule, complete with external review processes, and includes the following deliverables.
1. A review of the literature. In particular, we will provide details of the models needed for data collection and the analysis along with references (textbooks) that contain additional information that MoDOT may need in the future.
2. A detailed documentation of the field data. In particular, we will provide the raw data collected, and also the processed data with a description of the software used for the analysis.
3. An evaluation of the output degradation. We will provide a detailed report that quantifies the output degradation, its rate, and the useful life of the LEDs by all the factors specified above (e.g., make, model, color, etc.). We describe the statistical analysis performed to determine which factors are responsible for degradation and which factors are not. In addition, we will provide information by manufacturer on the basis of the model, circular/arrow indication, warrantee date, and compliance with the current ITE standard.
4. A replacement plan (schedule) developed from robust statistical analysis. 5. Information developed and implemented through this research project will be
shared with local agencies through the LTAP program. We also plan to share the results regionally through the Mid-America Transportation Center (MATC) that will extend the value of the research beyond Missouri to other states in the Midwest.
9
Exhibit 4. An Overview of the Task Performed in the Project
Data Collection in MO
Manufacturer
ITE Standards
LED Lifetime Analysis
Replacement Plan
LTAP Safety Training
Indicator Type
MoDOT approved site selection
Direction Indicator
Faces
External Quality Review
10
Data Collection and Analysis Field testing To date, most LED monitoring programs involve removing the indicator and testing it in a laboratory or using an expensive luminance meter to take readings of the LED from the side of the road. These methods have their benefits, but they also have problems that prevent them from becoming a total solution. Although accurate, laboratory testing requires too much work and with budgets already strained, large scale use of this method is not feasible. On the other hand, field testing is a cheaper, less intrusive method but current practices use expensive equipment, do not take measurements from the driver’s perspective and do nothing to measure the rate of degradation. The ability to take a sample of readings from a vehicle without disturbing the traffic flow or putting workers in danger is essential. Another critical point is calculating the rate of degradation and performing a robust statistical analysis to make predictions about entire cities’ or states’ LED signals. Safety is a very important factor in LED monitoring collection period. In addition to being able to stay inside the vehicle, data collectors recorded readings at night when traffic was minimal. Data collectors were also required to participate in the Missouri Local Technical Assistance Program (LTAP) Work Zone training program beforehand. Readings of the light emission capability of circular and arrow indicators were collected from the chosen intersections over an 11 week period of time. An original field testing instrument was developed by our research team for collecting illuminance readings from the intersections across the state of Missouri. Illuminance has a unit of lux and is a measurement for the density of light falling into an area (lumens/m2), or in this case into the vehicle where the driver would be looking at the light. The basic components of the instrument included a commercial light meter, a range finder, a laser pen and a custom manufactured Fresnel lens. Pictures of the instrument can be found in the appendix. The Fresnel lens was mounted inside a cylindrical casing that blocked out any ambient light. The instrument worked by filtering in light output emitted from the LED where it was then focused by the Fresnel lens into a concentrated beam. The light meter was placed behind the Fresnel lens at its focal length so that it effectively captured all the light emitted into the opening of the cylindrical casing. The light meter by itself would be incapable of measuring the illuminance of a LED from far out distances because the ambient light would drown out the light output from the LED. This is why the Fresnel lens was essential to the design. Mounted on top of the casing was the range finder. The range finder measured the distance from the instrument to the LED in feet which was later converted into meters. The light meter was connected to a laptop via a USB cable and the range finder was connected via a serial port. Both measuring devices fed information into an interface application created to collect and download the field data into a database program. The application could be run for a set period of time to capture the entire cycle of the signal. The laser pen was also mounted on top of the casing to help aim the instrument at the center of the LED light. By combining these components, our research team was able to effectively design an affordable measuring
11
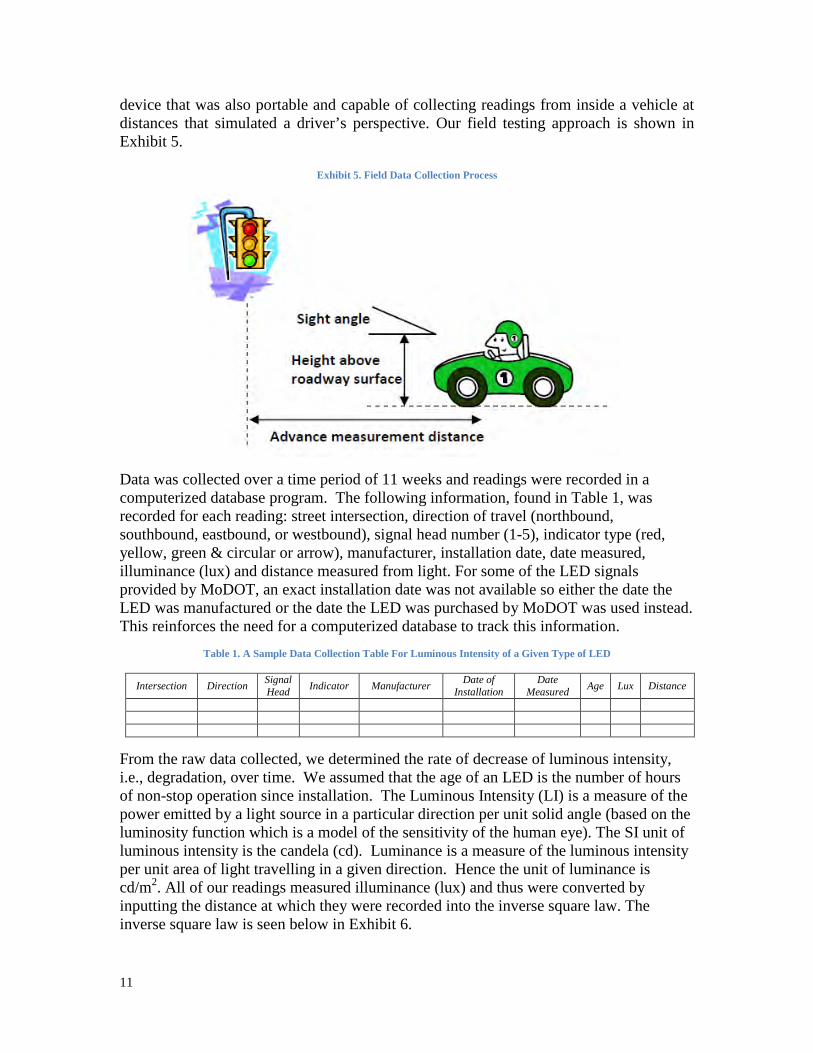
device that was also portable and capable of collecting readings from inside a vehicle at distances that simulated a driver’s perspective. Our field testing approach is shown in Exhibit 5.
Exhibit 5. Field Data Collection Process
Data was collected over a time period of 11 weeks and readings were recorded in a computerized database program. The following information, found in Table 1, was recorded for each reading: street intersection, direction of travel (northbound, southbound, eastbound, or westbound), signal head number (1-5), indicator type (red, yellow, green & circular or arrow), manufacturer, installation date, date measured, illuminance (lux) and distance measured from light. For some of the LED signals provided by MoDOT, an exact installation date was not available so either the date the LED was manufactured or the date the LED was purchased by MoDOT was used instead. This reinforces the need for a computerized database to track this information.
Table 1. A Sample Data Collection Table For Luminous Intensity of a Given Type of LED
Intersection Direction Signal Head Indicator Manufacturer Date of
Installation Date
Measured Age Lux Distance
From the raw data collected, we determined the rate of decrease of luminous intensity, i.e., degradation, over time. We assumed that the age of an LED is the number of hours of non-stop operation since installation. The Luminous Intensity (LI) is a measure of the power emitted by a light source in a particular direction per unit solid angle (based on the luminosity function which is a model of the sensitivity of the human eye). The SI unit of luminous intensity is the candela (cd). Luminance is a measure of the luminous intensity per unit area of light travelling in a given direction. Hence the unit of luminance is cd/m2. All of our readings measured illuminance (lux) and thus were converted by inputting the distance at which they were recorded into the inverse square law. The inverse square law is seen below in Exhibit 6.

12
Exhibit 6. Inverse Square Law for Converting Readings from Illuminance (lux) to Luminance (cd)
The rate of degradation was then determined by letting LI(t) denote the luminous intensity in cd from a given LED when the age of the LED is t hours as seen in Exhibit 7. The numerator measures the difference in luminous intensity at time t and the same at the time of installation, and the denominator measures the number of hours of operation. The below will capture the overall rate of degradation over time.
Exhibit 7. Equation for Calculating the Rate of Degradation
The overall rate of degradation, while useful, does not tell us the whole story. In fact for the analysis to be useful, the distribution for the lifetime of the LED had to be determined. The distribution fit directly addresses MoDOT’s needs for a replacement schedule for the LEDs. The distribution fit provided the information related to the probability of failure of an LED at a given point of time in its lifetime (Lewis, 1994). These probabilities were critical for developing a cost-effective replacement plan for the LEDs that ensures safety of the traffic. It is important to note that the LED becomes less visible to drivers once its luminous intensity falls below a pre-specified threshold. We will refer to this threshold as M. Data for M was gathered from the ITE supplements. Data Collection Constraints No comprehensive database of LED indicators currently exists at MoDOT. This is not atypical and is consistent with standard practices followed by most state DOTs. Individual districts do maintain data sheets that contain some information regarding the traffic signal and the individual signal heads, but this typically does not include full details on manufacturer, age, and model. Obtaining this information was a time- and labor-intensive process for MoDOT employees and had to be completed on top of regular duties. Significant inclement weather at the beginning of the study period understandably delayed the compilation of signal head information. In addition, signal heads were installed to meet traffic control needs rather as part of a controlled performance study which further increased the random placement of signal heads by manufacturer and age. These complexities created challenges for creating an optimal sampling strategy. The study duration allowed only a 3 month data collection phase and prevented repeat sampling of studied intersections beyond the initial collection efforts. Recommendations for the construction of a comprehensive database appear as part of the overall study recommendations.
𝑅𝑅𝑅𝑅𝑅𝑅𝑅𝑅 𝑜𝑜𝑜𝑜 𝑑𝑑𝑅𝑅𝑑𝑑𝑑𝑑𝑅𝑅𝑑𝑑𝑅𝑅𝑅𝑅𝑑𝑑𝑜𝑜𝑑𝑑 =𝐿𝐿𝐿𝐿(𝑅𝑅) − 𝐿𝐿𝐿𝐿(0)
𝑅𝑅 (𝑐𝑐𝑑𝑑 𝑝𝑝𝑅𝑅𝑑𝑑 ℎ𝑜𝑜𝑜𝑜𝑑𝑑).
Luminous Intensity (cd) = Illuminance (lux) x Distance2 (m)
13
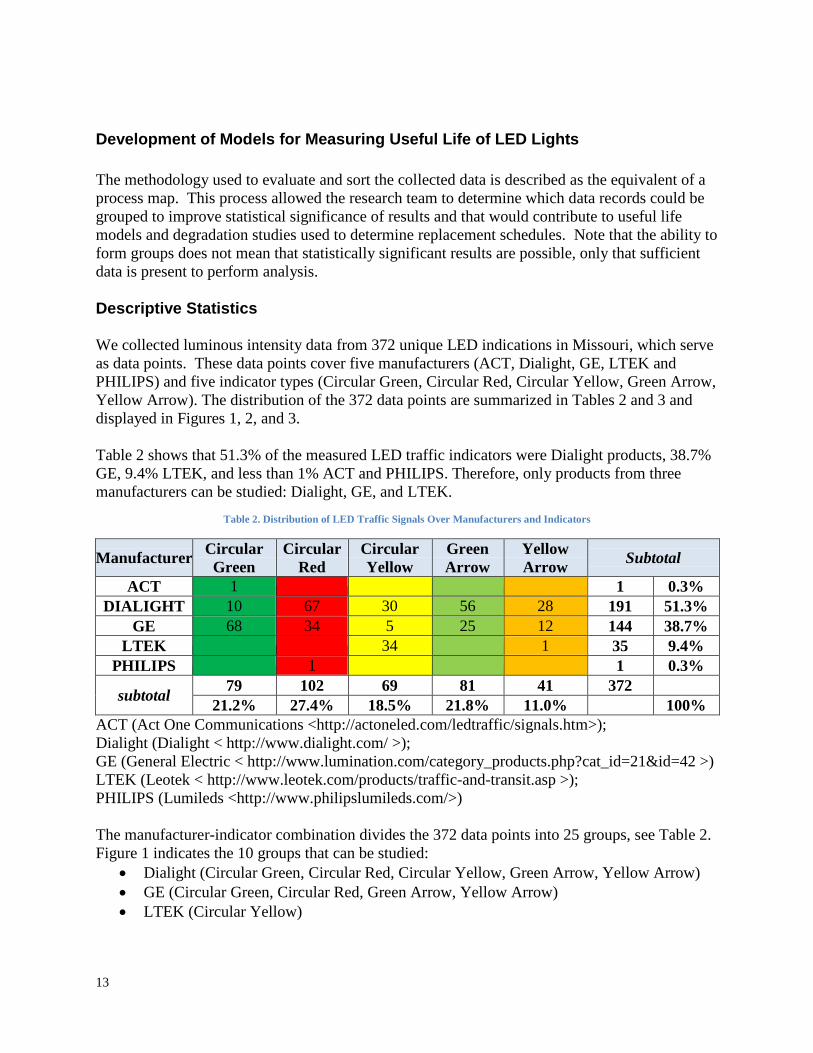
Development of Models for Measuring Useful Life of LED Lights The methodology used to evaluate and sort the collected data is described as the equivalent of a process map. This process allowed the research team to determine which data records could be grouped to improve statistical significance of results and that would contribute to useful life models and degradation studies used to determine replacement schedules. Note that the ability to form groups does not mean that statistically significant results are possible, only that sufficient data is present to perform analysis. Descriptive Statistics We collected luminous intensity data from 372 unique LED indications in Missouri, which serve as data points. These data points cover five manufacturers (ACT, Dialight, GE, LTEK and PHILIPS) and five indicator types (Circular Green, Circular Red, Circular Yellow, Green Arrow, Yellow Arrow). The distribution of the 372 data points are summarized in Tables 2 and 3 and displayed in Figures 1, 2, and 3. Table 2 shows that 51.3% of the measured LED traffic indicators were Dialight products, 38.7% GE, 9.4% LTEK, and less than 1% ACT and PHILIPS. Therefore, only products from three manufacturers can be studied: Dialight, GE, and LTEK.
Table 2. Distribution of LED Traffic Signals Over Manufacturers and Indicators
Manufacturer Circular Green
Circular Red
Circular Yellow
Green Arrow
Yellow Arrow Subtotal
ACT 1 1 0.3% DIALIGHT 10 67 30 56 28 191 51.3%
GE 68 34 5 25 12 144 38.7% LTEK 34 1 35 9.4%
PHILIPS 1 1 0.3%
subtotal 79 102 69 81 41 372 21.2% 27.4% 18.5% 21.8% 11.0% 100% ACT (Act One Communications <http://actoneled.com/ledtraffic/signals.htm>); Dialight (Dialight < http://www.dialight.com/ >); GE (General Electric < http://www.lumination.com/category_products.php?cat_id=21&id=42 >) LTEK (Leotek < http://www.leotek.com/products/traffic-and-transit.asp >); PHILIPS (Lumileds <http://www.philipslumileds.com/>) The manufacturer-indicator combination divides the 372 data points into 25 groups, see Table 2. Figure 1 indicates the 10 groups that can be studied:
• Dialight (Circular Green, Circular Red, Circular Yellow, Green Arrow, Yellow Arrow) • GE (Circular Green, Circular Red, Green Arrow, Yellow Arrow) • LTEK (Circular Yellow)
14
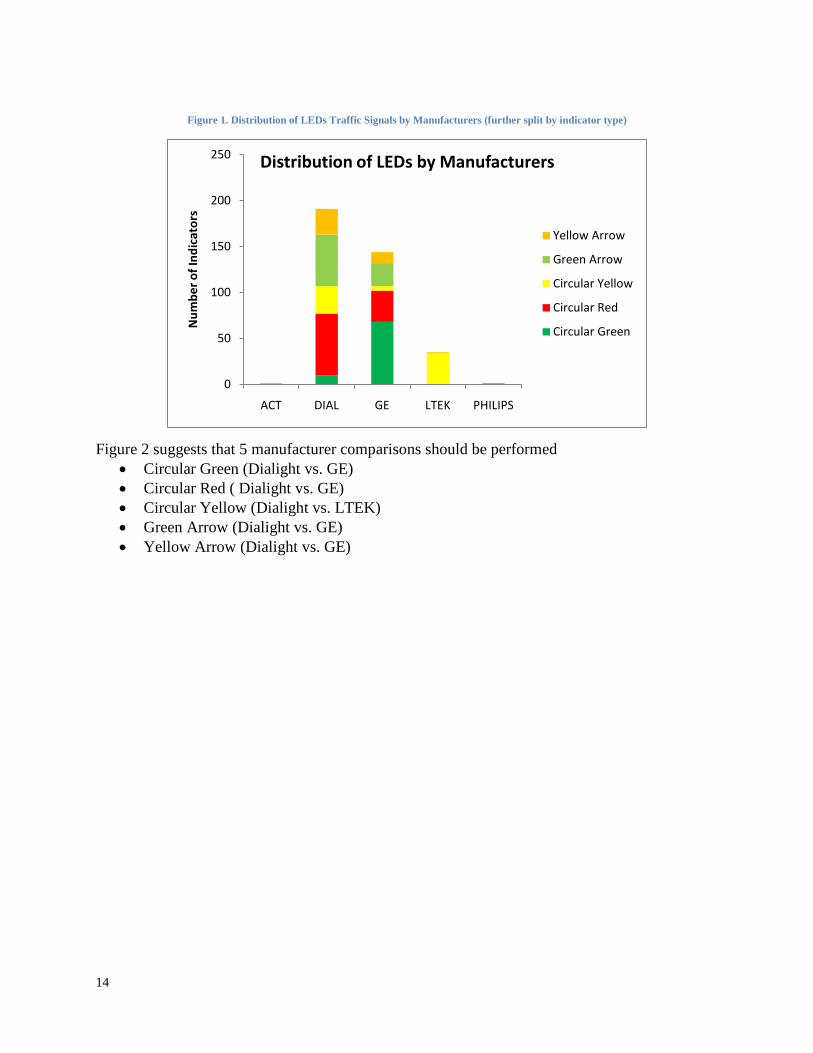
Figure 1. Distribution of LEDs Traffic Signals by Manufacturers (further split by indicator type)
0
50
100
150
200
250
ACT DIAL GE LTEK PHILIPS
Num
ber o
f Ind
icat
ors
Distribution of LEDs by Manufacturers
Yellow Arrow
Green Arrow
Circular Yellow
Circular Red
Circular Green
Figure 2 suggests that 5 manufacturer comparisons should be performed • Circular Green (Dialight vs. GE) • Circular Red ( Dialight vs. GE) • Circular Yellow (Dialight vs. LTEK) • Green Arrow (Dialight vs. GE) • Yellow Arrow (Dialight vs. GE)
15
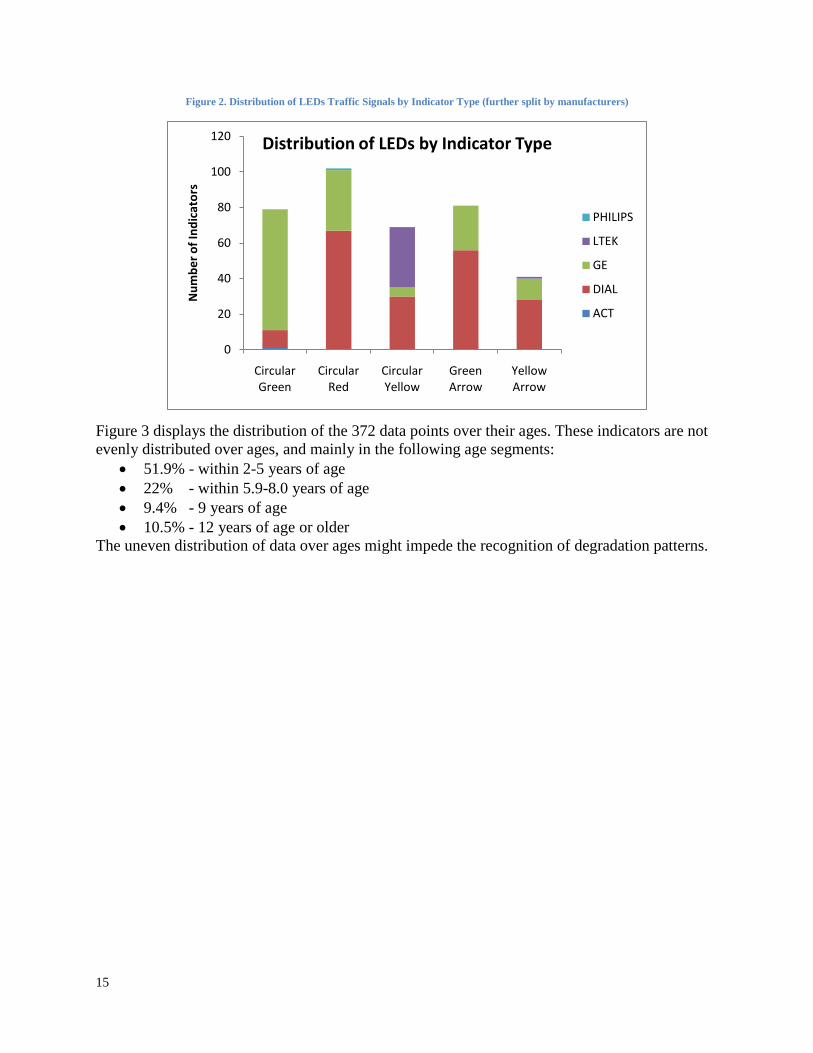
Figure 2. Distribution of LEDs Traffic Signals by Indicator Type (further split by manufacturers)
0
20
40
60
80
100
120
Circular Green
Circular Red
Circular Yellow
Green Arrow
Yellow Arrow
Num
ber o
f Ind
icat
ors
Distribution of LEDs by Indicator Type
PHILIPS
LTEK
GE
DIAL
ACT
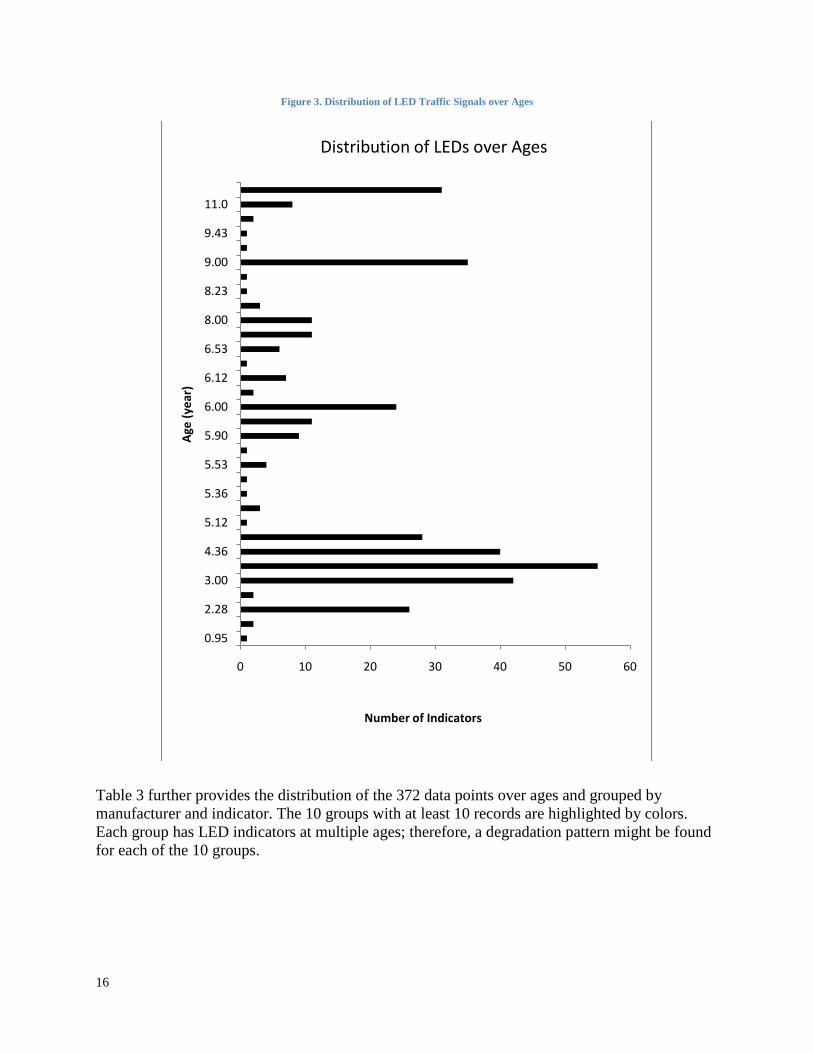
Figure 3 displays the distribution of the 372 data points over their ages. These indicators are not evenly distributed over ages, and mainly in the following age segments:
• 51.9% - within 2-5 years of age • 22% - within 5.9-8.0 years of age • 9.4% - 9 years of age • 10.5% - 12 years of age or older
The uneven distribution of data over ages might impede the recognition of degradation patterns.
16
Figure 3. Distribution of LED Traffic Signals over Ages
0 10 20 30 40 50 60
0.95
2.28
3.00
4.36
5.12
5.36
5.53
5.90
6.00
6.12
6.53
8.00
8.23
9.00
9.43
11.0
Number of Indicators
Age
(yea
r)
Distribution of LEDs over Ages
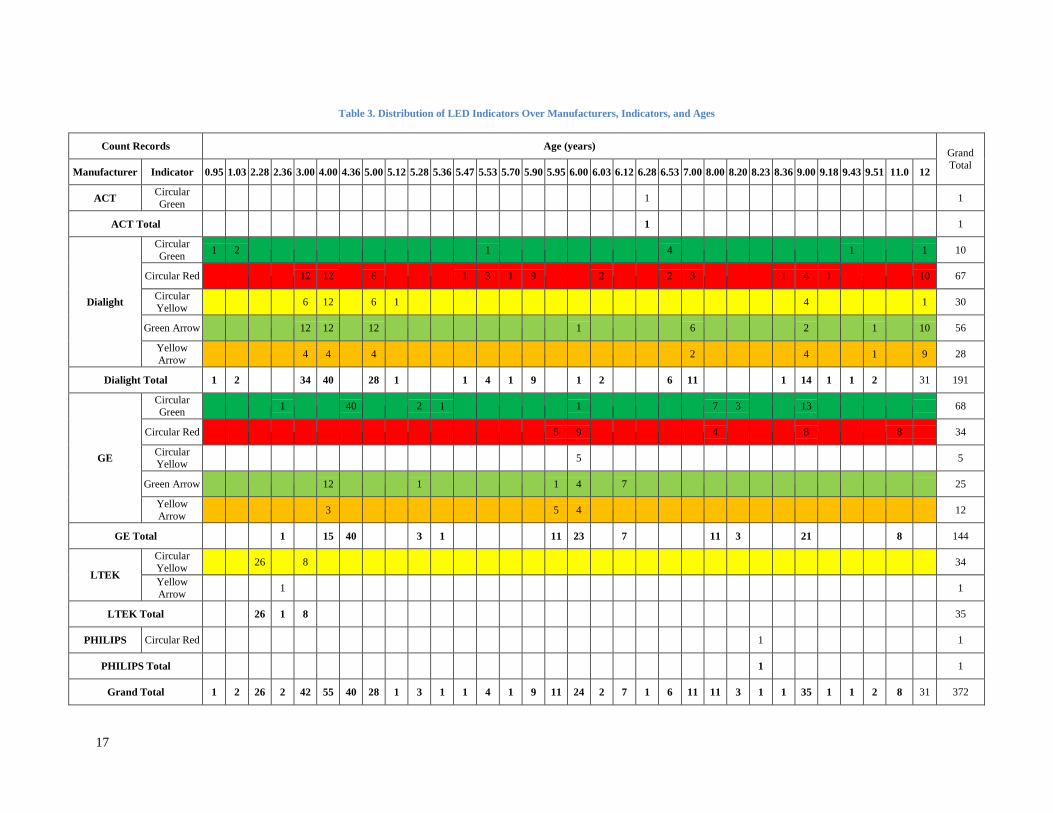
Table 3 further provides the distribution of the 372 data points over ages and grouped by manufacturer and indicator. The 10 groups with at least 10 records are highlighted by colors. Each group has LED indicators at multiple ages; therefore, a degradation pattern might be found for each of the 10 groups.
17
Table 3. Distribution of LED Indicators Over Manufacturers, Indicators, and Ages
Count Records Age (years) Grand Total Manufacturer Indicator 0.95 1.03 2.28 2.36 3.00 4.00 4.36 5.00 5.12 5.28 5.36 5.47 5.53 5.70 5.90 5.95 6.00 6.03 6.12 6.28 6.53 7.00 8.00 8.20 8.23 8.36 9.00 9.18 9.43 9.51 11.0 12
ACT Circular Green 1 1
ACT Total 1 1
Dialight
Circular Green 1 2 1 4 1 1 10
Circular Red 12 12 6 1 3 1 9 2 2 3 1 4 1 10 67
Circular Yellow 6 12 6 1 4 1 30
Green Arrow 12 12 12 1 6 2 1 10 56
Yellow Arrow 4 4 4 2 4 1 9 28
Dialight Total 1 2 34 40 28 1 1 4 1 9 1 2 6 11 1 14 1 1 2 31 191
GE
Circular Green 1 40 2 1 1 7 3 13 68
Circular Red 5 9 4 8 8 34
Circular Yellow 5 5
Green Arrow 12 1 1 4 7 25
Yellow Arrow 3 5 4 12
GE Total 1 15 40 3 1 11 23 7 11 3 21 8 144
LTEK
Circular Yellow 26 8 34
Yellow Arrow 1 1
LTEK Total 26 1 8 35
PHILIPS Circular Red 1 1
PHILIPS Total 1 1
Grand Total 1 2 26 2 42 55 40 28 1 3 1 1 4 1 9 11 24 2 7 1 6 11 11 3 1 1 35 1 1 2 8 31 372

18
Identification of Factors that Impact Degradation Patterns The 372 data points were placed on the space of Luminous Intensity against Age, shown in Figure 4.4. They seem to belong to two clusters. Cluster one contains all data points between 0 and 7 years of age while cluster two contains all data points 8 years of age and older. This second cluster seems to perform better than expected.
Figure 4. Luminous Intensity vs. Age for all LEDs
0
200
400
600
800
1000
1200
1400
0 2 4 6 8 10 12 14
Lum
inou
s Int
ensi
ty (c
d)
Age (year)
Luminous Intensity vs. Age for all LEDs
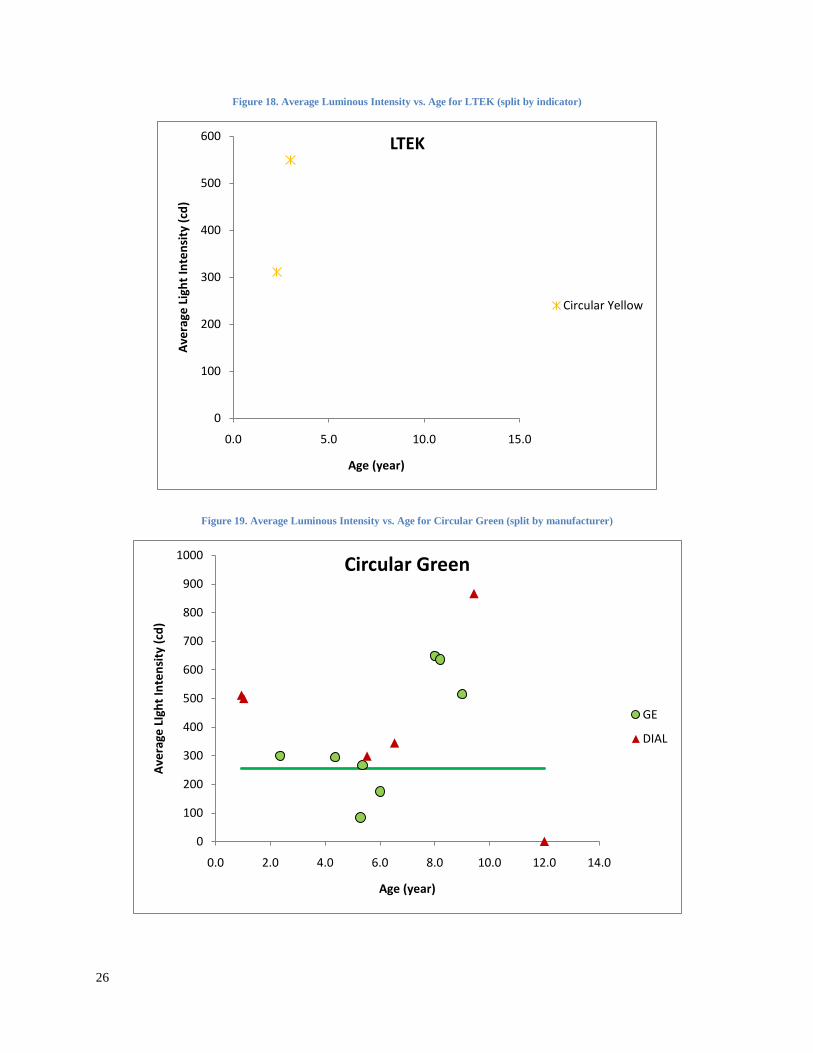
We further plotted the average luminous intensity at each year of age, shown in Figure 5. Two clusters of average value are clearly separated, which confirms the observation from Figure 4. The cluster circled by the dashed curve includes 50 LED indicators: 15 are Dialight products and 35 are GE products. They are located at the following intersections: 47&V, 50&Prairie Dell, 61&Forder, 61&Keller, 61&Mehl, 63&MO, 763&BigBear, 763&Paris, 763&University, and Rte63&Lowes. There are many possible reasons that we observe the separated two clusters, which may be worth further investigation. This cluster of 50 LEDs also all happened to be 8 years old are older. It is possible that manufacturers changed the way they designed LEDs and this is why there is a second group of older LEDs that all have unusually high luminous intensity values. The understanding is that manufacturers are moving away from the older LED design where the signal can clearly be identified as using LED technology as opposed to an incandescent bulb. In this style of manufacture, all of the individual LEDs are positioned on a circuit board in a circular or arrow shape and are clearly visible. MoDOT provided newer Dialight LEDs to us and we observed that the design is now drastically different; only 6 LEDs are present in the signal and are behind a tinted diffuser and a plastic Fresnel lens. This new manufacturing style is also evident on GE’s and other manufacturers’ websites where they list their latest models as an “incandescent look.” This is one possible explanation for why there appears to be two separate clusters of LEDs in Figure 4 and 5. See Appendix A for pictures depicting the two different manufacturing styles as well as additional discussion.

19
Figure 5. Average Luminous Intensity vs. Age
0.00100.00200.00300.00400.00500.00600.00700.00800.00900.00
1000.00
0.00 2.00 4.00 6.00 8.00 10.00
Aver
age
Lum
nous
Inte
nsity
(cd)
Age (year)
Average Luminous Intensity vs. Age
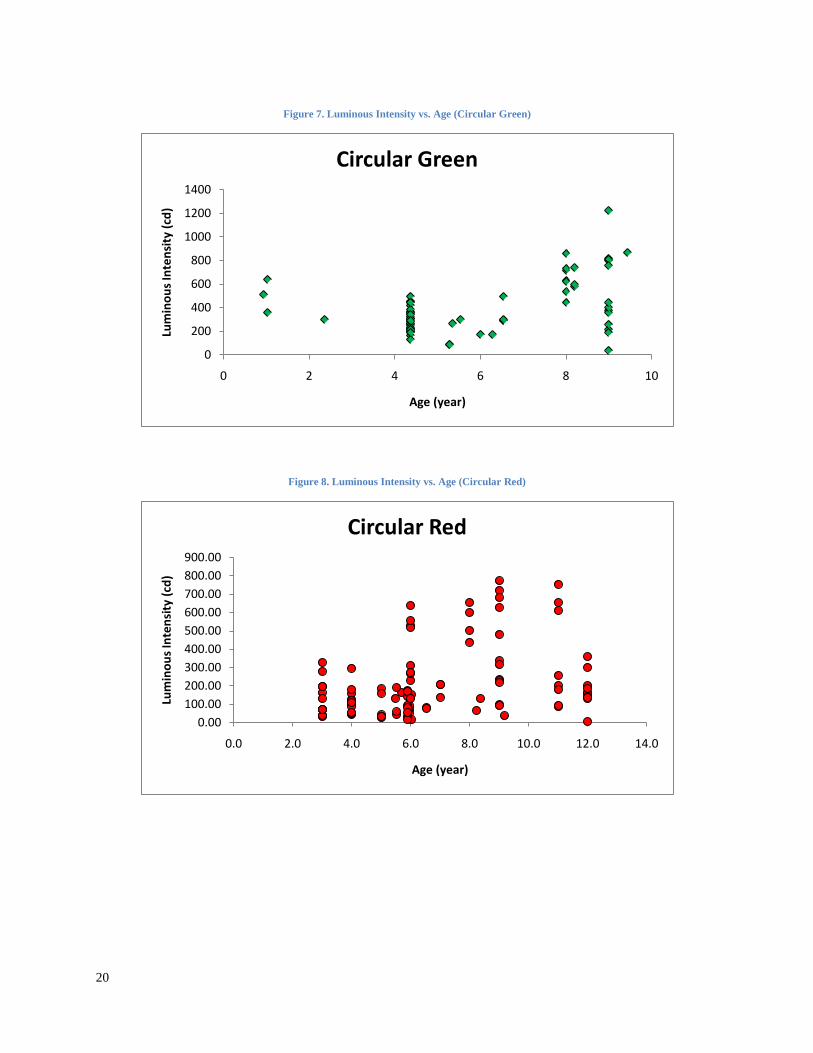
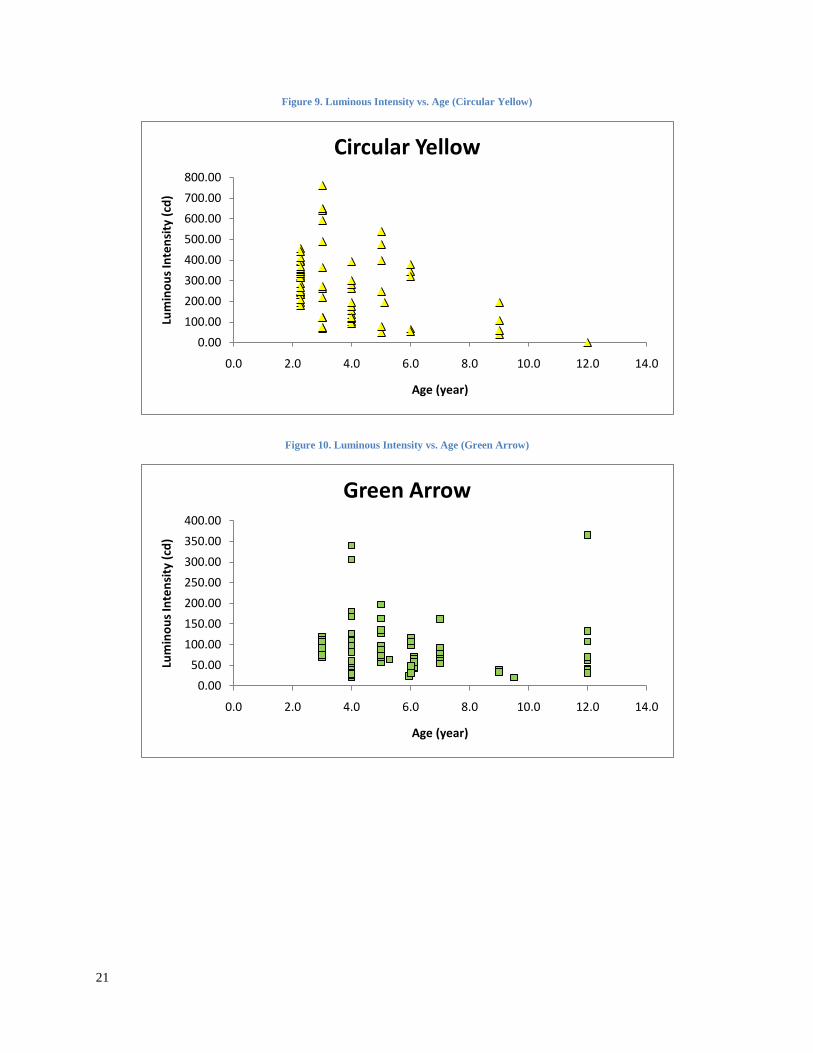
To find if each indicator has a unique degradation pattern, for every indicator we plot the average luminous intensity at each year of age in Figure 6. Figure 6 indicates between-indicator differences. For example, arrow indicators may have different degradation patterns than circular ones. Therefore, for each indicator type we further study the plots of luminous intensity over ages, which are Figures 7 through11. A degradation pattern is not observed for circular green, circular red, and yellow arrow. Circular yellow shows a clear pattern, and green arrow has a weak pattern. Removal of the older clusters does allow observance of degradation patterns; however, these may not be statistically significant due to limited available data.
Figure 6. Average Luminous Intensity vs. Age (split by indictor)
0.00100.00200.00300.00400.00500.00600.00700.00800.00900.00
1000.00
0.00 5.00 10.00 15.00
Aver
age
Lum
inou
s Int
ensi
ty (c
d)
Age (year)
Average Luminous Intensity vs. Age(grouped by indicators)
Circular GreenCircular RedCircular YellowGreen ArrowYellow ArrowCircular Green ThresholdCircular Red ThresholdCircular Yellow ThredsholdGreen Arrow ThresholdYellow Arrow Threshold
20
Figure 7. Luminous Intensity vs. Age (Circular Green)
0
200
400
600
800
1000
1200
1400
0 2 4 6 8 10
Lum
inou
s Int
ensi
ty (c
d)
Age (year)
Circular Green
Figure 8. Luminous Intensity vs. Age (Circular Red)
0.00100.00200.00300.00400.00500.00600.00700.00800.00900.00
0.0 2.0 4.0 6.0 8.0 10.0 12.0 14.0
Lum
inou
s Int
ensi
ty (c
d)
Age (year)
Circular Red
21
Figure 9. Luminous Intensity vs. Age (Circular Yellow)
0.00100.00200.00300.00400.00500.00600.00700.00800.00
0.0 2.0 4.0 6.0 8.0 10.0 12.0 14.0
Lum
inou
s Int
ensi
ty (c
d)
Age (year)
Circular Yellow
Figure 10. Luminous Intensity vs. Age (Green Arrow)
0.0050.00
100.00150.00200.00250.00300.00350.00400.00
0.0 2.0 4.0 6.0 8.0 10.0 12.0 14.0
Lum
inou
s Int
ensi
ty (c
d)
Age (year)
Green Arrow
22
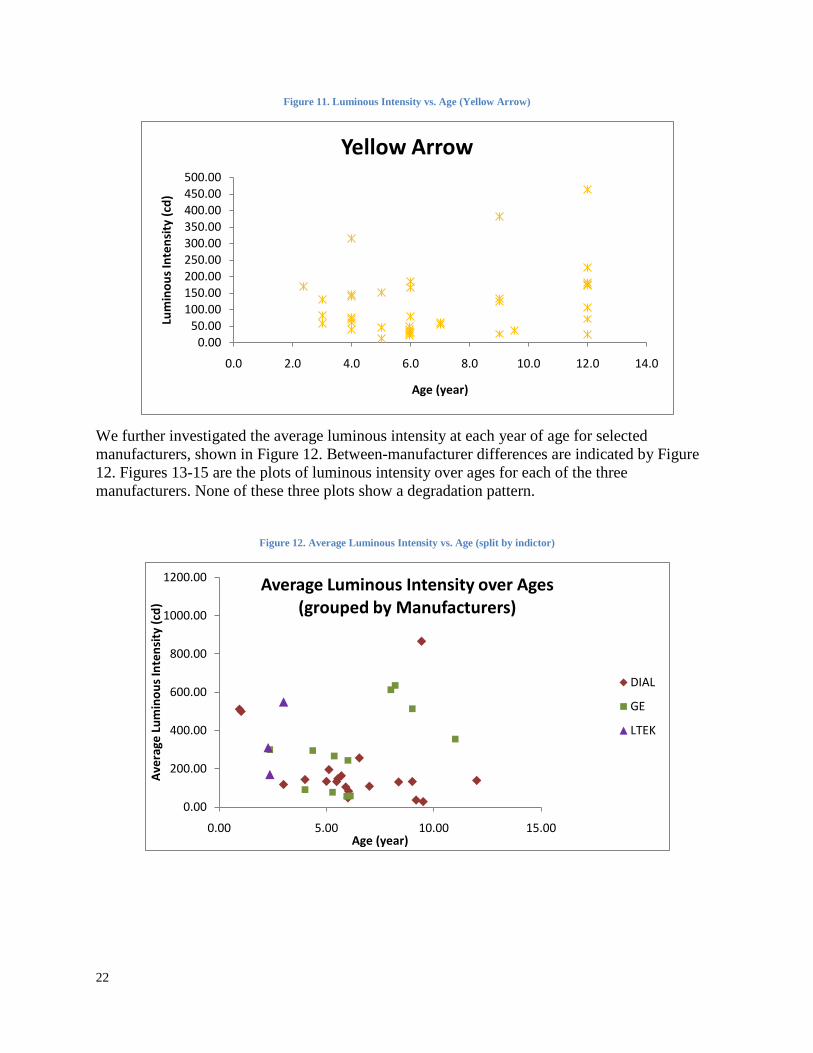
Figure 11. Luminous Intensity vs. Age (Yellow Arrow)
0.0050.00
100.00150.00200.00250.00300.00350.00400.00450.00500.00
0.0 2.0 4.0 6.0 8.0 10.0 12.0 14.0
Lum
inou
s Int
ensi
ty (c
d)
Age (year)
Yellow Arrow
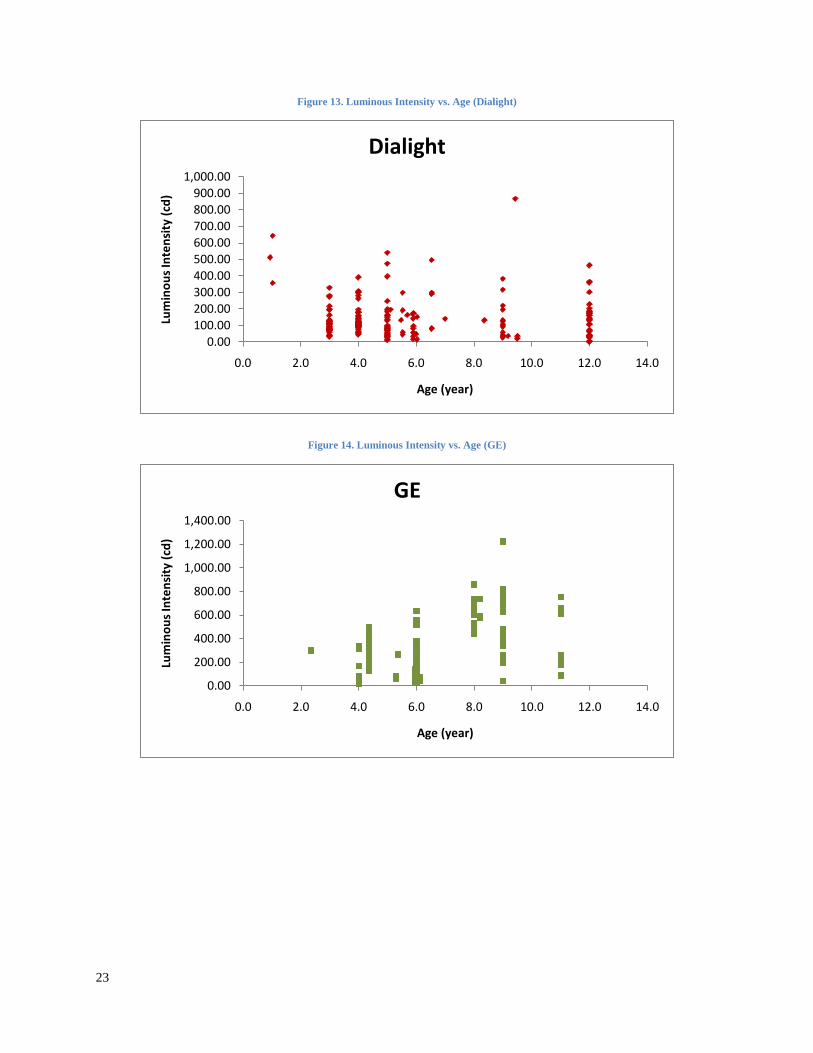
We further investigated the average luminous intensity at each year of age for selected manufacturers, shown in Figure 12. Between-manufacturer differences are indicated by Figure 12. Figures 13-15 are the plots of luminous intensity over ages for each of the three manufacturers. None of these three plots show a degradation pattern.
Figure 12. Average Luminous Intensity vs. Age (split by indictor)
0.00
200.00
400.00
600.00
800.00
1000.00
1200.00
0.00 5.00 10.00 15.00
Aver
age
Lum
inou
s Int
ensi
ty (c
d)
Age (year)
Average Luminous Intensity over Ages(grouped by Manufacturers)
DIAL
GE
LTEK
23
Figure 13. Luminous Intensity vs. Age (Dialight)
0.00100.00200.00300.00400.00500.00600.00700.00800.00900.00
1,000.00
0.0 2.0 4.0 6.0 8.0 10.0 12.0 14.0
Lum
inou
s Int
ensi
ty (c
d)
Age (year)
Dialight
Figure 14. Luminous Intensity vs. Age (GE)
0.00
200.00
400.00
600.00
800.00
1,000.00
1,200.00
1,400.00
0.0 2.0 4.0 6.0 8.0 10.0 12.0 14.0
Lum
inou
s Int
ensi
ty (c
d)
Age (year)
GE
24
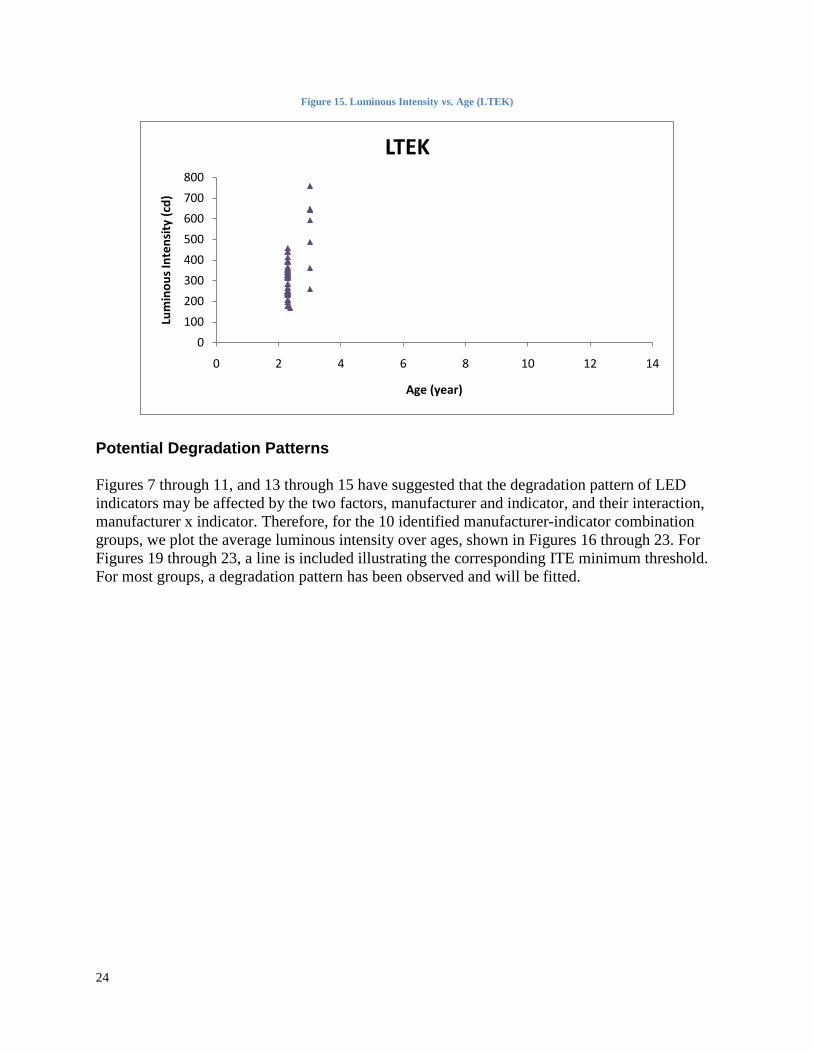
Figure 15. Luminous Intensity vs. Age (LTEK)
0100200300400500600700800
0 2 4 6 8 10 12 14
Lum
inou
s Int
ensi
ty (c
d)
Age (year)
LTEK
Potential Degradation Patterns
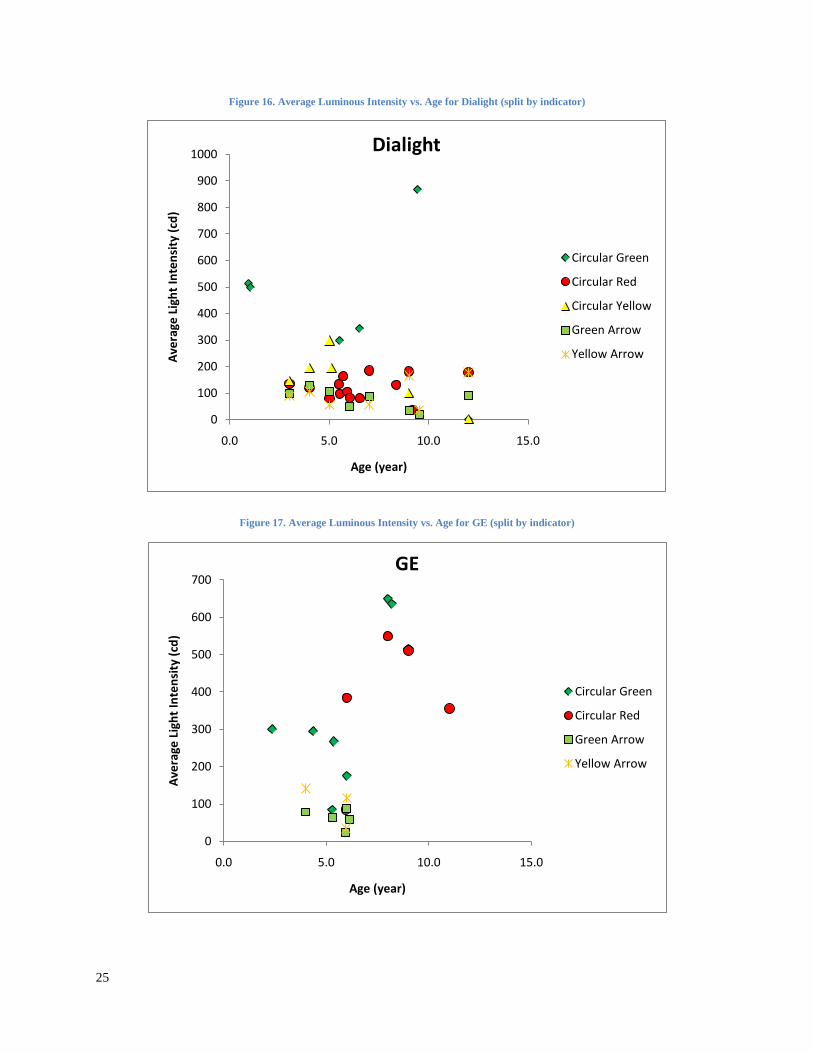
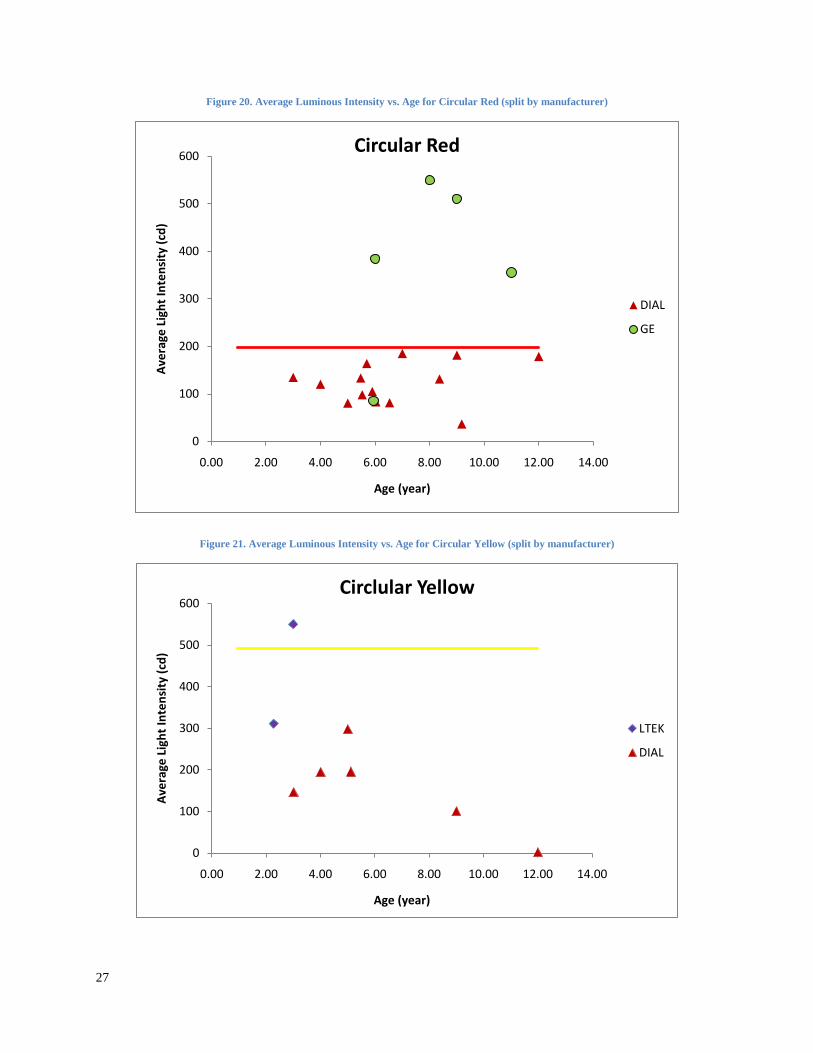
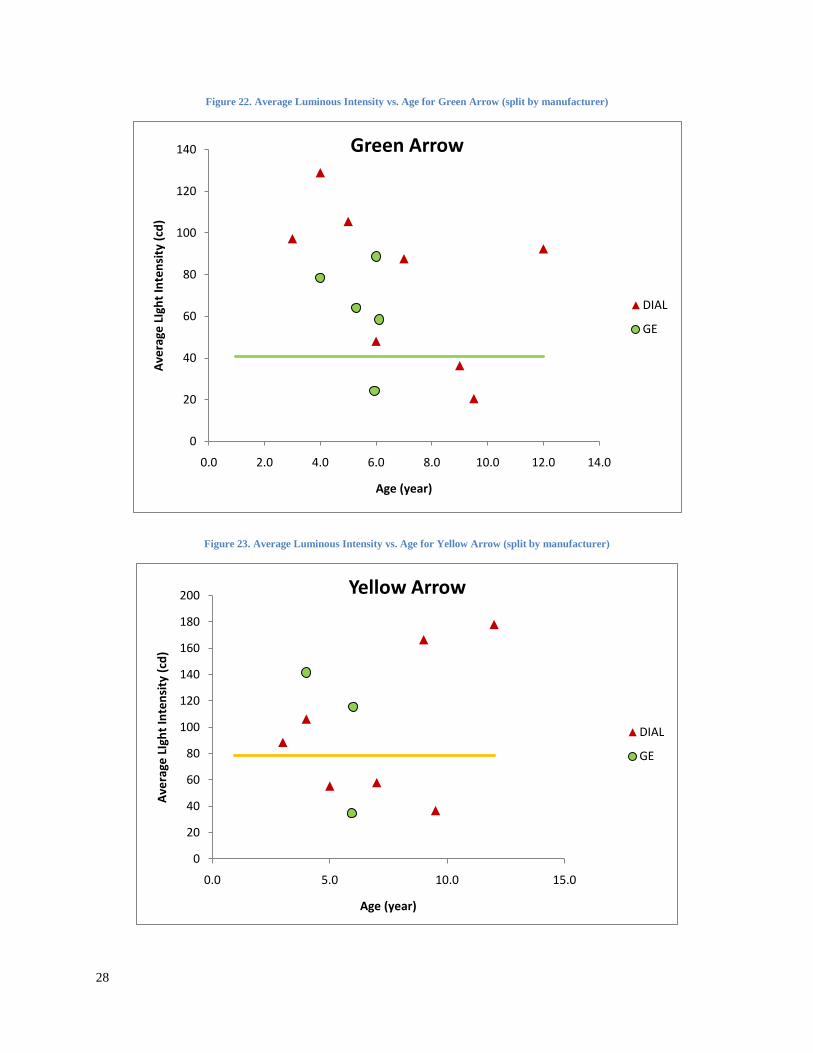
Figures 7 through 11, and 13 through 15 have suggested that the degradation pattern of LED indicators may be affected by the two factors, manufacturer and indicator, and their interaction, manufacturer x indicator. Therefore, for the 10 identified manufacturer-indicator combination groups, we plot the average luminous intensity over ages, shown in Figures 16 through 23. For Figures 19 through 23, a line is included illustrating the corresponding ITE minimum threshold. For most groups, a degradation pattern has been observed and will be fitted.
25
Figure 16. Average Luminous Intensity vs. Age for Dialight (split by indicator)
0
100
200
300
400
500
600
700
800
900
1000
0.0 5.0 10.0 15.0
Aver
age
Ligh
t Int
ensi
ty (c
d)
Age (year)
Dialight
Circular Green
Circular Red
Circular Yellow
Green Arrow
Yellow Arrow
Figure 17. Average Luminous Intensity vs. Age for GE (split by indicator)
0
100
200
300
400
500
600
700
0.0 5.0 10.0 15.0
Aver
age
Ligh
t Int
ensi
ty (c
d)
Age (year)
GE
Circular Green
Circular Red
Green Arrow
Yellow Arrow
26
Figure 18. Average Luminous Intensity vs. Age for LTEK (split by indicator)
0
100
200
300
400
500
600
0.0 5.0 10.0 15.0
Aver
age
Ligh
t Int
ensi
ty (c
d)
Age (year)
LTEK
Circular Yellow
Figure 19. Average Luminous Intensity vs. Age for Circular Green (split by manufacturer)
0
100
200
300
400
500
600
700
800
900
1000
0.0 2.0 4.0 6.0 8.0 10.0 12.0 14.0
Aver
age
LIgh
t Int
ensi
ty (c
d)
Age (year)
Circular Green
GE
DIAL
27
Figure 20. Average Luminous Intensity vs. Age for Circular Red (split by manufacturer)
0
100
200
300
400
500
600
0.00 2.00 4.00 6.00 8.00 10.00 12.00 14.00
Aver
age
Ligh
t Int
ensi
ty (c
d)
Age (year)
Circular Red
DIAL
GE
Figure 21. Average Luminous Intensity vs. Age for Circular Yellow (split by manufacturer)
0
100
200
300
400
500
600
0.00 2.00 4.00 6.00 8.00 10.00 12.00 14.00
Aver
age
Ligh
t Int
ensi
ty (c
d)
Age (year)
Circlular Yellow
LTEK
DIAL
28
Figure 22. Average Luminous Intensity vs. Age for Green Arrow (split by manufacturer)
0
20
40
60
80
100
120
140
0.0 2.0 4.0 6.0 8.0 10.0 12.0 14.0
Aver
age
LIgh
t Int
ensi
ty (c
d)
Age (year)
Green Arrow
DIAL
GE
Figure 23. Average Luminous Intensity vs. Age for Yellow Arrow (split by manufacturer)
0
20
40
60
80
100
120
140
160
180
200
0.0 5.0 10.0 15.0
Aver
age
LIgh
t Int
ensi
ty (c
d)
Age (year)
Yellow Arrow
DIAL
GE
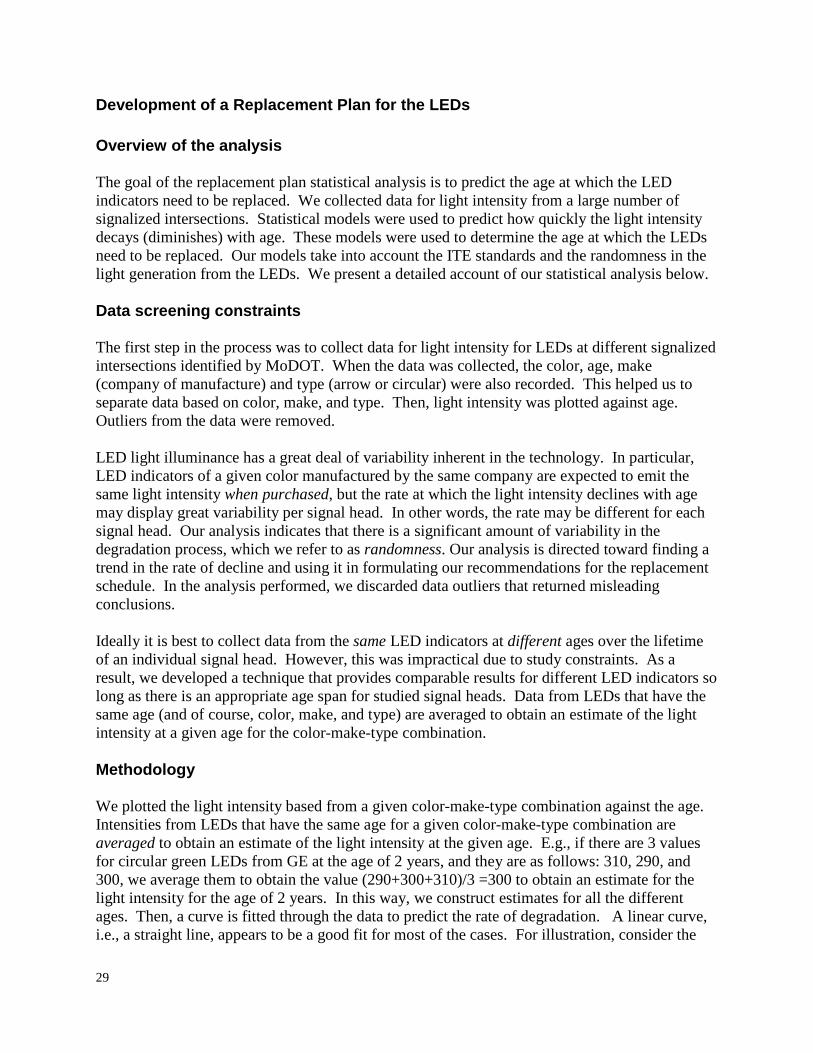
29
Development of a Replacement Plan for the LEDs Overview of the analysis The goal of the replacement plan statistical analysis is to predict the age at which the LED indicators need to be replaced. We collected data for light intensity from a large number of signalized intersections. Statistical models were used to predict how quickly the light intensity decays (diminishes) with age. These models were used to determine the age at which the LEDs need to be replaced. Our models take into account the ITE standards and the randomness in the light generation from the LEDs. We present a detailed account of our statistical analysis below. Data screening constraints The first step in the process was to collect data for light intensity for LEDs at different signalized intersections identified by MoDOT. When the data was collected, the color, age, make (company of manufacture) and type (arrow or circular) were also recorded. This helped us to separate data based on color, make, and type. Then, light intensity was plotted against age. Outliers from the data were removed. LED light illuminance has a great deal of variability inherent in the technology. In particular, LED indicators of a given color manufactured by the same company are expected to emit the same light intensity when purchased, but the rate at which the light intensity declines with age may display great variability per signal head. In other words, the rate may be different for each signal head. Our analysis indicates that there is a significant amount of variability in the degradation process, which we refer to as randomness. Our analysis is directed toward finding a trend in the rate of decline and using it in formulating our recommendations for the replacement schedule. In the analysis performed, we discarded data outliers that returned misleading conclusions. Ideally it is best to collect data from the same LED indicators at different ages over the lifetime of an individual signal head. However, this was impractical due to study constraints. As a result, we developed a technique that provides comparable results for different LED indicators so long as there is an appropriate age span for studied signal heads. Data from LEDs that have the same age (and of course, color, make, and type) are averaged to obtain an estimate of the light intensity at a given age for the color-make-type combination. Methodology We plotted the light intensity based from a given color-make-type combination against the age. Intensities from LEDs that have the same age for a given color-make-type combination are averaged to obtain an estimate of the light intensity at the given age. E.g., if there are 3 values for circular green LEDs from GE at the age of 2 years, and they are as follows: 310, 290, and 300, we average them to obtain the value (290+300+310)/3 =300 to obtain an estimate for the light intensity for the age of 2 years. In this way, we construct estimates for all the different ages. Then, a curve is fitted through the data to predict the rate of degradation. A linear curve, i.e., a straight line, appears to be a good fit for most of the cases. For illustration, consider the

30
graph (see Figure 24) plotted below. It shows the age on the x-axis and the light intensity on the y-axis for circular green LEDs made by GE. The linear fit obtained is as follows: Y = 386.6-28.139 X, where Y = light intensity and X = age. The value of Y is set to the ITE threshold to determine the age at which LED should be replaced. For instance, in this case, the ITE threshold is 257. Setting Y= 257 in the equation above yields: 257 = 386.6-28.139 X, i.e., X = 4.65 years. This implies that on the average the threshold will be reached in 4.65 years. We use 5 years as an optimistic estimate for the optimal age of replacing the LED and 4 years as the pessimistic estimate. As stated above, since we have data gathered from different ages, we noticed that in many cases, we had data which showed that after some degradation, the light intensity actually increased. This is due to the fact that different LEDs of the same color-make-type actually degrade at different rates. Such data was dealt with through an outlier approach in our analysis, since a naïve application of statistical analysis would lead to erroneous conclusions in such cases. The outlier approach smoothes the data and predicts the most conservative estimate for the age replacement schedule. Figure 24 presents an example of degradation patterns. Full degradation analysis is available through MoDOT on a CD.
Figure 24. Degradation of the Average Light Intensity vs. Age for GE Circular Green
y = -28.139x + 386.6
0
50
100
150
200
250
300
350
400
0.0 2.0 4.0 6.0 8.0 10.0 12.0 14.0
Aver
age
LIgh
t Int
ensi
ty (c
d)
Age (year)
Circular Green
GE
Linear (GE)

31
We used a deterministic regression model with which only the average value of the LED’s average intensity can be predicted. It is not possible to predict the variability in the intensity based on the regression analysis performed above (see Figure 24). Regression equations used for our analysis are presented below.
32
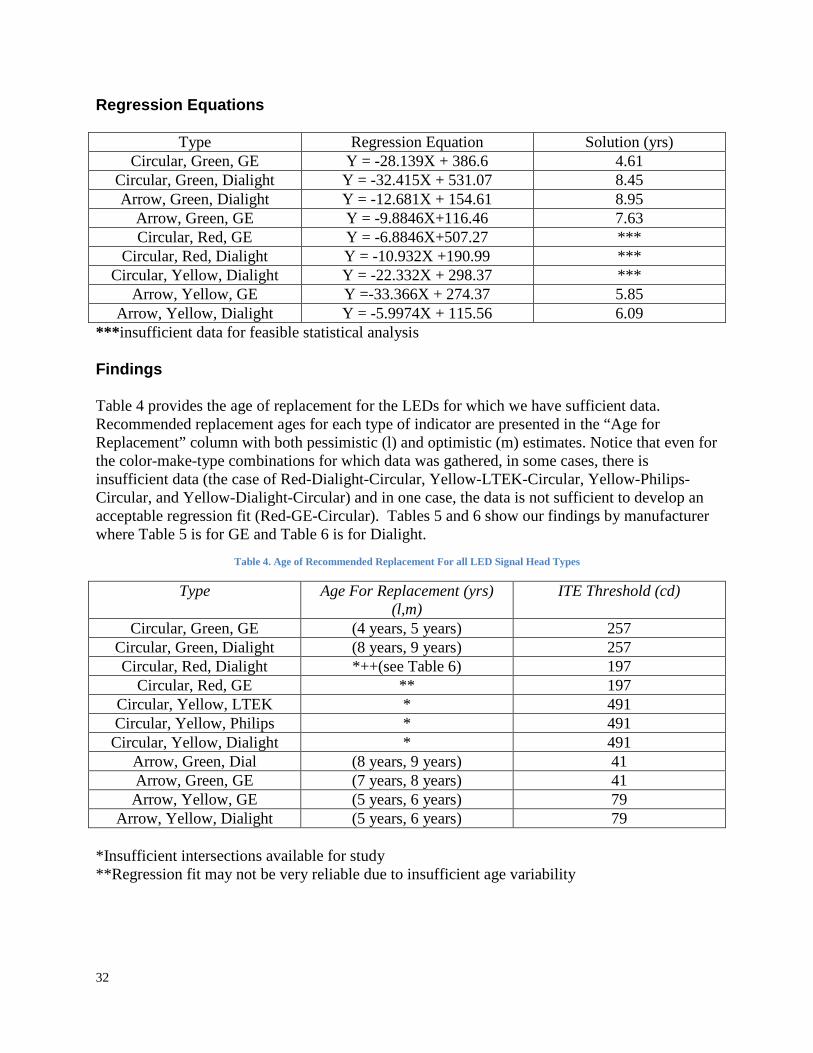
Regression Equations
Type Regression Equation Solution (yrs) Circular, Green, GE Y = -28.139X + 386.6 4.61
Circular, Green, Dialight Y = -32.415X + 531.07 8.45 Arrow, Green, Dialight Y = -12.681X + 154.61 8.95
Arrow, Green, GE Y = -9.8846X+116.46 7.63 Circular, Red, GE Y = -6.8846X+507.27 ***
Circular, Red, Dialight Y = -10.932X +190.99 *** Circular, Yellow, Dialight Y = -22.332X + 298.37 ***
Arrow, Yellow, GE Y =-33.366X + 274.37 5.85 Arrow, Yellow, Dialight Y = -5.9974X + 115.56 6.09
***insufficient data for feasible statistical analysis Findings Table 4 provides the age of replacement for the LEDs for which we have sufficient data. Recommended replacement ages for each type of indicator are presented in the “Age for Replacement” column with both pessimistic (l) and optimistic (m) estimates. Notice that even for the color-make-type combinations for which data was gathered, in some cases, there is insufficient data (the case of Red-Dialight-Circular, Yellow-LTEK-Circular, Yellow-Philips-Circular, and Yellow-Dialight-Circular) and in one case, the data is not sufficient to develop an acceptable regression fit (Red-GE-Circular). Tables 5 and 6 show our findings by manufacturer where Table 5 is for GE and Table 6 is for Dialight.
Table 4. Age of Recommended Replacement For all LED Signal Head Types
Type Age For Replacement (yrs) ITE Threshold (cd) (l,m)
Circular, Green, GE (4 years, 5 years) 257 Circular, Green, Dialight (8 years, 9 years) 257 Circular, Red, Dialight *++(see Table 6) 197
Circular, Red, GE ** 197 Circular, Yellow, LTEK * 491 Circular, Yellow, Philips * 491 Circular, Yellow, Dialight * 491
Arrow, Green, Dial (8 years, 9 years) 41 Arrow, Green, GE (7 years, 8 years) 41 Arrow, Yellow, GE (5 years, 6 years) 79
Arrow, Yellow, Dialight (5 years, 6 years) 79 *Insufficient intersections available for study **Regression fit may not be very reliable due to insufficient age variability
33
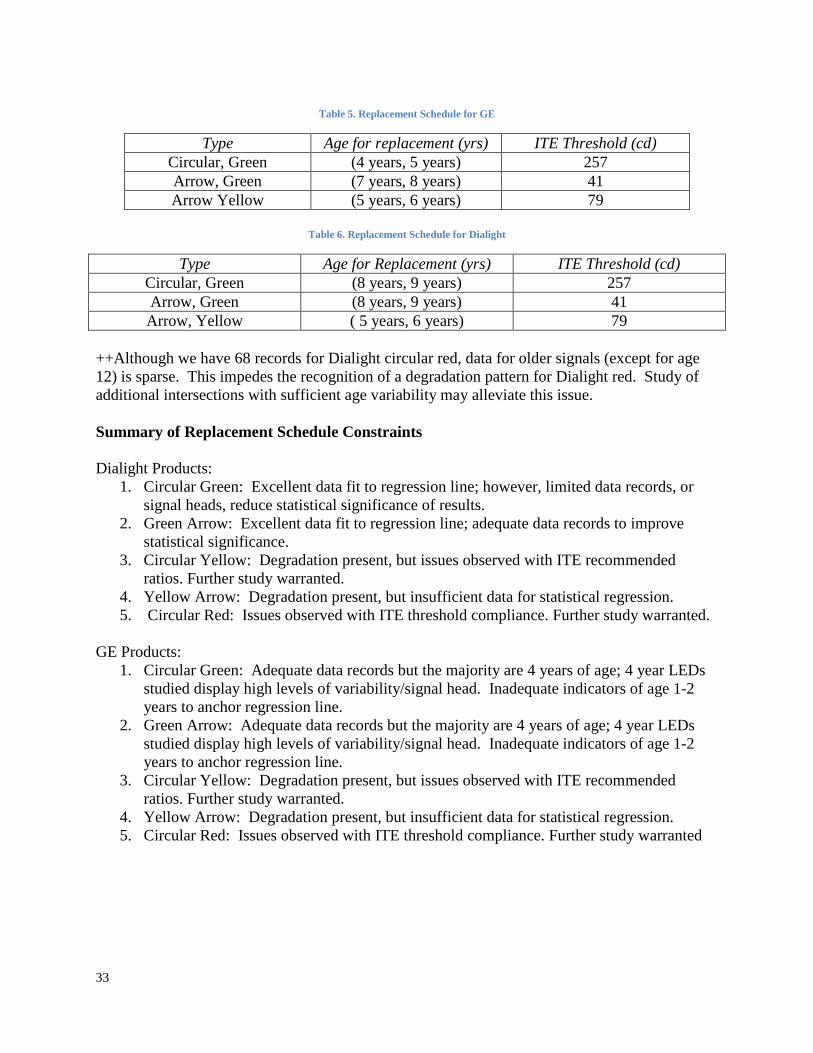
Table 5. Replacement Schedule for GE
Type Age for replacement (yrs) ITE Threshold (cd) Circular, Green (4 years, 5 years) 257 Arrow, Green (7 years, 8 years) 41 Arrow Yellow (5 years, 6 years) 79
Table 6. Replacement Schedule for Dialight
Type Age for Replacement (yrs) ITE Threshold (cd) Circular, Green (8 years, 9 years) 257 Arrow, Green (8 years, 9 years) 41 Arrow, Yellow ( 5 years, 6 years) 79
++Although we have 68 records for Dialight circular red, data for older signals (except for age 12) is sparse. This impedes the recognition of a degradation pattern for Dialight red. Study of additional intersections with sufficient age variability may alleviate this issue. Summary of Replacement Schedule Constraints Dialight Products:
1. Circular Green: Excellent data fit to regression line; however, limited data records, or signal heads, reduce statistical significance of results.
2. Green Arrow: Excellent data fit to regression line; adequate data records to improve statistical significance.
3. Circular Yellow: Degradation present, but issues observed with ITE recommended ratios. Further study warranted.
4. Yellow Arrow: Degradation present, but insufficient data for statistical regression. 5. Circular Red: Issues observed with ITE threshold compliance. Further study warranted.
GE Products:
1. Circular Green: Adequate data records but the majority are 4 years of age; 4 year LEDs studied display high levels of variability/signal head. Inadequate indicators of age 1-2 years to anchor regression line.
2. Green Arrow: Adequate data records but the majority are 4 years of age; 4 year LEDs studied display high levels of variability/signal head. Inadequate indicators of age 1-2 years to anchor regression line.
3. Circular Yellow: Degradation present, but issues observed with ITE recommended ratios. Further study warranted.
4. Yellow Arrow: Degradation present, but insufficient data for statistical regression. 5. Circular Red: Issues observed with ITE threshold compliance. Further study warranted
34
Conclusions LEDs are a superior economic choice based on our findings. They offer significant benefits in terms of operations and maintenance costs and useful life with respect to traditional incandescent bulbs. Our useful life results suggest that the replacement plan for LED signal indicators must take into account the cost of replacing an LED signal head and the cost of failure of an LED when it is in use. A failure of an LED indicator, defined as luminous intensity below the ITE threshold, could cause negative impacts to the traffic it controls. Previous studies have measured intensity readings for individual signal heads only by color, rather than color, age, and manufacturer. In addition, these studies took readings either in a laboratory setting or at the signal head. The results from previous studies failed to determine detailed replacement guidelines that include recommendations based on:
1. Signal head intensity and ITE threshold compliance from the driver’s perspective. 2. Differences by color, indicator type, and manufacturer. 3. Economic cost-benefit analysis of replacement of individual signal heads versus entire
traffic signals. These studies recommended generic replacement schedules based largely on manufacturer warranty, typically five years plus one. Our results show that generic replacement schedules provide insufficient detail to make the best decisions based on operations and maintenance replacement costs, color, and indicator type. We were able to develop detailed replacement guidelines for the majority of Dialight and GE products. Due to insufficient data and age variance, we are not able to make statistically robust decisions for red and circular yellow LEDs. Because payback period for maintenance costs (see Appendix E) is estimated at 2-3 years and green LEDs have a useful life expectancy for 2-3 additional years over yellow LEDs, we do not recommend common replacement of green and yellow indications. The two separate clusters evident in Figure 4 and 5 raise questions as to why a second group of older LEDs have unusually high luminous intensity values. A shift in manufacturing design may be one possible conclusion explaining the two different groups of LEDs signal heads. After detailed laboratory analysis of the LED indicators provided by MoDOT, a clear difference in the design of the LED was noted. The yellow and green Leoteks, seen on the left in Appendix A, Figure 25 consisted of 200 individual LEDs in a circular shape covered by a tinted plastic cover. To a driver they can be clearly distinguished as LEDs and not traditional incandescent lights. We call this the “LED-look.” The Dialights (circular red, green) revealed a different design. As seen on the right in Appendix A, Figure 25, the Dialights contained only 6 LEDs each and incorporated a prism, a Fresnel lens, and a plastic diffuser. The physical LEDs in these Dialights were not visible from the outside of the light unlike the Leoteks and look very similar to incandescent indicators. The strong resemblance to incandescent indicators was confirmed during our data collection process. We could not visually confirm whether an indicator was an LED or not.
35
Additionally, our study results strongly indicate the need for additional laboratory and field study of circular yellow LEDs. The ITE guidelines specify that circular yellow actually maintain the highest luminous intensity at a red to yellow to green ratio of (1: 2.5: 1.3). This means that the candela values for circular yellow LEDs should have been 2.5 times greater than those of circular red on average. This was not observed during our study in either the laboratory or in the field. See Appendix B, Figure 25 and Exhibit 8 for more detail. Last, there is evidence that circular red Dialights degrade to the ITE minimum thresholds rather rapidly. As seen from Exhibit 8 in Appendix B, a new circular red Dialight provided for laboratory study was only slightly above the ITE threshold. Furthermore, Figure 20 shows that the average light intensity value for all age groups of circular red Dialights were also below the ITE minimum. This product should also be subjected to further laboratory and field analysis. Replacement Circular Green: Although limited statistical inferences can be drawn by manufacturer, differences were present. Based on our results, Dialight circular green products outperform GE circular green signal heads and have several additional years of expected life. These conclusions are based on limited data. Results fall within confidence limits, however, high levels of variability per signal head suggest that these differences may not be present when comparable numbers of data records are studied for both manufacturers. Green Arrow Dialight and GE green arrow products displayed a comparable useful life and similar degradation patterns. Yellow Arrow Comparable useful life degradation patterns were calculated for yellow arrow signal indicators irrespective of manufacturer. ITE ratio discrepancies were observed and further study is needed. Circular Red: Decisions regarding circular red indicators cannot be made at this time due to insufficient intersection identification by manufacturer and age variance. Red signal indicators quickly fall below ITE threshold, but do not degrade at a significant rate after the initial reduction in intensity. This suggests that their useful life may approach 2-3 times manufacturer’s warranty. This should be confirmed with a longitudinal study. Circular Yellow: Decisions regarding circular yellow indicators cannot be made at this time due to issues with illuminance ratios suggested by ITE. Intensity readings were below the recommended brightness ratio from the literature. Further discussions with manufacturers and ITE may provide guidance on updates to the standard and allow detailed analysis.
36
General Obtaining detailed information of each traffic indicator for a given traffic intersection, such as age and manufacturer, proved to be a difficult task. MoDOT currently maintains an intersection inventory which identifies the quantity and color or LEDs in intersections but it is limited to that information. Determining dates of manufacture, purchase and installation, all of which are important pieces of information, was often difficult. See Appendix C for further documentation of difficulties experienced. We strongly recommend the creation of a comprehensive intersection database that could store information on all 2,500 signals statewide. A digital database such as this would allow MoDOT to pull every piece of information for any intersection by simply running a query. It would include all available information on traffic intersections maintained by MoDOT and include the following specifics to LEDS:
• Intersection • Direction: NB, SB, EB, WB • Signal Head: 1,2,3,4,5 • Indicator: Circular Red, Circular Green , Circular Yellow, Green Arrow, Yellow Arrow • Manufacturer • Date Manufactured • Date Purchased • Date Installed • Age • Recorded Light Intensity Values over time (cd)
37
Recommendations and Implementation Plan Our findings support the economic value of LED traffic signals (over traditional incandescent bulbs). Although our findings do not recommend any one manufacturer over another, cross-sectional results suggest that useful life of LED traffic signals meets or exceeds useful life warranty expectations for most indicator types and manufacturers. Pending longitudinal evaluation, we recommend an implementation strategy that replaces circular green and green arrow indicators at approximately eight years of age. Preliminary results suggest that circular red indicators hover below the ITE threshold for a lengthy period following a rapid drop-off after installation. Based on limited observed degradation patterns, we suggest that circular red indicators should be evaluated when circular green and green arrow indicators are replaced. If the luminous intensity continues to hover near threshold, we suggest replacement at the ten year mark. If the intensity reading is significantly below ITE threshold, it should be replaced with circular green and green arrow signal heads. Our concerns over the intensity of circular yellow indicators prevent us from making any recommendation; however, our findings support a replacement plan of 6 years for yellow arrow indicators. Based on our conclusions, we strongly recommend that MoDOT create a database system to manage their LED traffic signal replacement plan. This database would allow effective identification of traffic signals requiring LED intensity checks for ITE threshold compliance. Based on enhanced degradation information gained through future LED intensity checks, the replacement program interface application could analyze and predict future funding levels needed, check manufacture warranties for potential replacement and lead to performance-based specification for LED product inclusion into the current Approved Products List (APL). Specific implementation strategies include:
1. Incorporation of the new database module with the existing Transportation Management System (TMS) that currently records other pertinent information about traffic signals.
2. Use of undergraduate or graduate student interns to collect relevant signal head information and for data entry

38
Principal Investigator and Project Members
Principle Investigator Performance Analysis
Suzanna Long, PhD
(S&T)
Graduate Research Assistant Casey Noll
(S&T)
Technical Liaison Bill Stone, PE
Life Expectancy Analysis
Abhijit Gosavi, PhD Co-PI
(S&T)
LED Degradation Analysis
C. H. Wu, PhD
(S&T)
Statistical Analysis
Ruwen Qin, PhD
(S&T)
External Quality Control
Thomas Ryan, PE
(HDR)
39
Bibliography Act One Communications, Available from Internet: <www.actoneled.com> (cited 10-1-2010). Anonymous, 1999. Newark First City in New Jersey to Get New LED Traffic Lights. IMSA
Journal 37 (July). Anonymous, 2000. Review of Articles and Information on LED Traffic Signals (July) Anonymous, 2001. Energy Efficiency Success Story, LED Traffic Signals = Energy Savings, for
the City of Portland, Oregon, Available from website: <www.sustainableportland.org> Anonymous, 2003, Final Report: Conventional Vs LED Traffic Signals; Operational
Characteristics and Economic Feasibility. Available from website: <www.cee1.org/gov/led> Anonymous, 2004. State Energy Program Case Studies: California Says ‘Go’ to Energy-Saving
Traffic Lights. Available from website: <www.energy.ca.gov> Behura, N. (2007). A Survey of Maintenance Practices of Light-Emitting Diode Traffic Signals
and Some Recommended Guidelines. Institute of Transportation Engineers (77), 18-22.
Behura, N. (2005, November). The New ITE Light-Emitting Diode Traffic Signal Specifications - A Guide for Purchasers. ITE Journal , 38-40.
Briggs, B., 2000. City Lights Get Brighter: New LED Bulbs Figure to Save Denver Millions. (8 February)
Bullough, J. D. (2009). Replacment Processes for Light Emitting Diode (LED) Traffic Signals.
Contractor's Final Report, NCHRP Web-Only Document 146, Transportation Research Board.
Careaga, A., & Allen, T. (2000). Light Emitting Diode (LED) Signal Installation. Final Report, Missouri Department of Transportation, Jefferson City, MO.
Crawford, G.L., 1999. Roadway Safety Improvements: Using Liability to Evaluate. Enhancing Transportation Safety in the 21st Century. Kissmmee, FL, Institute of Traffic Engineers (March)
D. Montgomery. Design and Analysis of Experiments, Seventh Edition, Wiley, 2009.
Das, S., 1999. High-Technology Traffic Signals Given Green Light. Australasian Business
Intelligence (July) E. E. Lewis. Introduction to Reliability Engineering, Second edition, John Wiley, NY, 1994.
40
ENERGY STAR. (2003). ENERGY STAR Program Requirements for Traffic Signals: Eligibility
Criteria. Retrieved May 2010, from http://www.energystar.gov.
Hong, E., & Narendran, N. (2004). A Method for projecting useful life of LED lighting systems. Third International Conference on Solid State Lighting, Proceedings of SPIE, (pp. 93-99).
Institute of Transportation Engineers. (2005, June 27). Vehicle Traffic Control Signal Heads: Light Emitting Diode (LED) Circular Signal Supplement. Washington, D.C.
Institute of Transportation Engineers. (2007, July 1). Vehicle Traffic Control Signal Heads: Light Emitting Diode (LED) Vehicle Arrow Traffic Signal Supplement. Washington, D.C.
Leotek, Available from Internet: <www.leotek.com> (cited 10-1-2010) Long, M., 1999. Anaheim Public Utilities Receives Coveted Recognition for New Traffic Signal
Lights that Save Ratepayers $214,000 Annually. Anaheim Public Utilities, Public Press (June)
New York State Energy Research and Development Authority (NYSERDA). (n.d.). Evaluation
of NYSDOT LED Traffic Installation. Retrieved May 28, 2010, from Lighting Research Center at Rensselaer Polytechnic Institute: http://www.lightingresearch.org/programs/transportation/LED/pdf/NYSDOTEval.pdf
Palmer, T.C. 1999. A Bright Idea: Red Strobes to Save Energy, Get Drivers' Attention. Boston Globe (May)
Suozzo, M. 1998. A Market Transformation Opportunity Assessment for LED Traffic
Signals. American Council for an Energy Efficient Economy, Washington, DC.
Suozzo, M., 1999. Case Studies of Successful LED Traffic Signal Installations and Documentation of a Three-Color Signal Demonstration. (Report to Boston Edison Company) Washington, DC: American Council for an Energy-Efficient Economy
U.S. Congress. (2005). Energy Policy Act of 2005. Retrieved April 2010, from
http://www.epa.gov
Urbanik, T. (2008). LED Traffic Signal Monitoring, Maintenance, and Replacement Issues. A Synthesis of Highway Practice, NCHRP Synthesis 387, Transportation Research Board, Washington, D.C
Winer, Darryl, 1998, Report of U.S. Communities Acting to Protect the Climate, by the International Council for Local Environmental Initiatives (ICLEI)
41
Wu, M.S., H.H. Huang, B.J. Huang, C.W. Tang, and C.W. Cheng, Economic Feasibility of Solar-Powered LED Roadway Lighting, ISESCO Science and Technology Vision, 4(6) November 2008, 43-47.
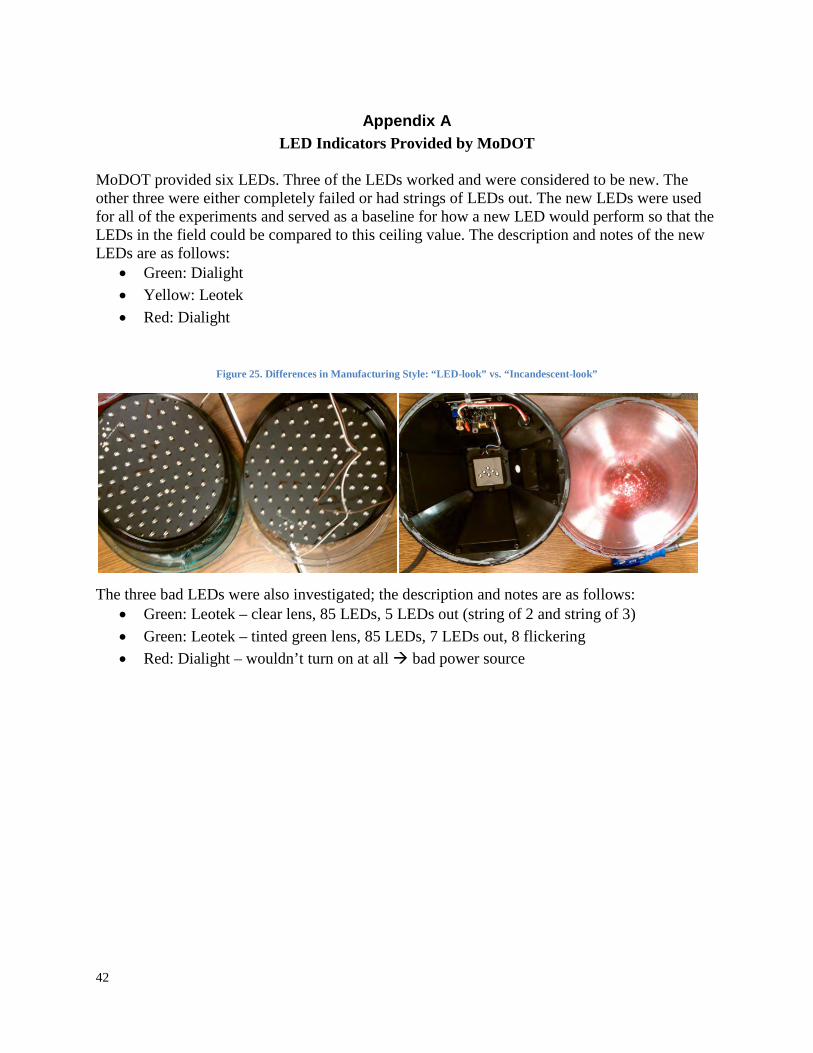
42
Appendix A LED Indicators Provided by MoDOT
MoDOT provided six LEDs. Three of the LEDs worked and were considered to be new. The other three were either completely failed or had strings of LEDs out. The new LEDs were used for all of the experiments and served as a baseline for how a new LED would perform so that the LEDs in the field could be compared to this ceiling value. The description and notes of the new LEDs are as follows:
• Green: Dialight • Yellow: Leotek • Red: Dialight
Figure 25. Differences in Manufacturing Style: “LED-look” vs. “Incandescent-look”
The three bad LEDs were also investigated; the description and notes are as follows:
• Green: Leotek – clear lens, 85 LEDs, 5 LEDs out (string of 2 and string of 3) • Green: Leotek – tinted green lens, 85 LEDs, 7 LEDs out, 8 flickering • Red: Dialight – wouldn’t turn on at all bad power source
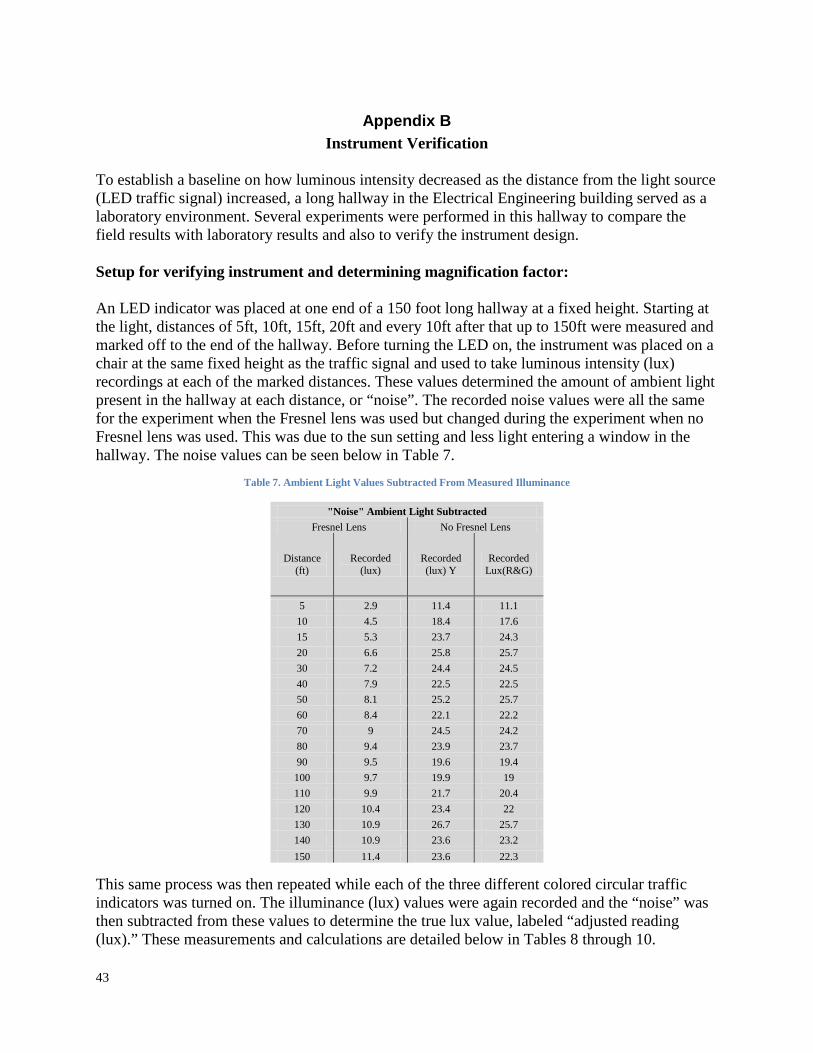
43
Appendix B Instrument Verification
To establish a baseline on how luminous intensity decreased as the distance from the light source (LED traffic signal) increased, a long hallway in the Electrical Engineering building served as a laboratory environment. Several experiments were performed in this hallway to compare the field results with laboratory results and also to verify the instrument design. Setup for verifying instrument and determining magnification factor: An LED indicator was placed at one end of a 150 foot long hallway at a fixed height. Starting at the light, distances of 5ft, 10ft, 15ft, 20ft and every 10ft after that up to 150ft were measured and marked off to the end of the hallway. Before turning the LED on, the instrument was placed on a chair at the same fixed height as the traffic signal and used to take luminous intensity (lux) recordings at each of the marked distances. These values determined the amount of ambient light present in the hallway at each distance, or “noise”. The recorded noise values were all the same for the experiment when the Fresnel lens was used but changed during the experiment when no Fresnel lens was used. This was due to the sun setting and less light entering a window in the hallway. The noise values can be seen below in Table 7.
Table 7. Ambient Light Values Subtracted From Measured Illuminance
"Noise" Ambient Light Subtracted Fresnel Lens No Fresnel Lens
Distance (ft)
Recorded (lux)
Recorded (lux) Y
Recorded Lux(R&G)
5 2.9 11.4 11.1 10 4.5 18.4 17.6 15 5.3 23.7 24.3 20 6.6 25.8 25.7 30 7.2 24.4 24.5 40 7.9 22.5 22.5 50 8.1 25.2 25.7 60 8.4 22.1 22.2 70 9 24.5 24.2 80 9.4 23.9 23.7 90 9.5 19.6 19.4 100 9.7 19.9 19 110 9.9 21.7 20.4 120 10.4 23.4 22 130 10.9 26.7 25.7 140 10.9 23.6 23.2 150 11.4 23.6 22.3
This same process was then repeated while each of the three different colored circular traffic indicators was turned on. The illuminance (lux) values were again recorded and the “noise” was then subtracted from these values to determine the true lux value, labeled “adjusted reading (lux).” These measurements and calculations are detailed below in Tables 8 through 10.
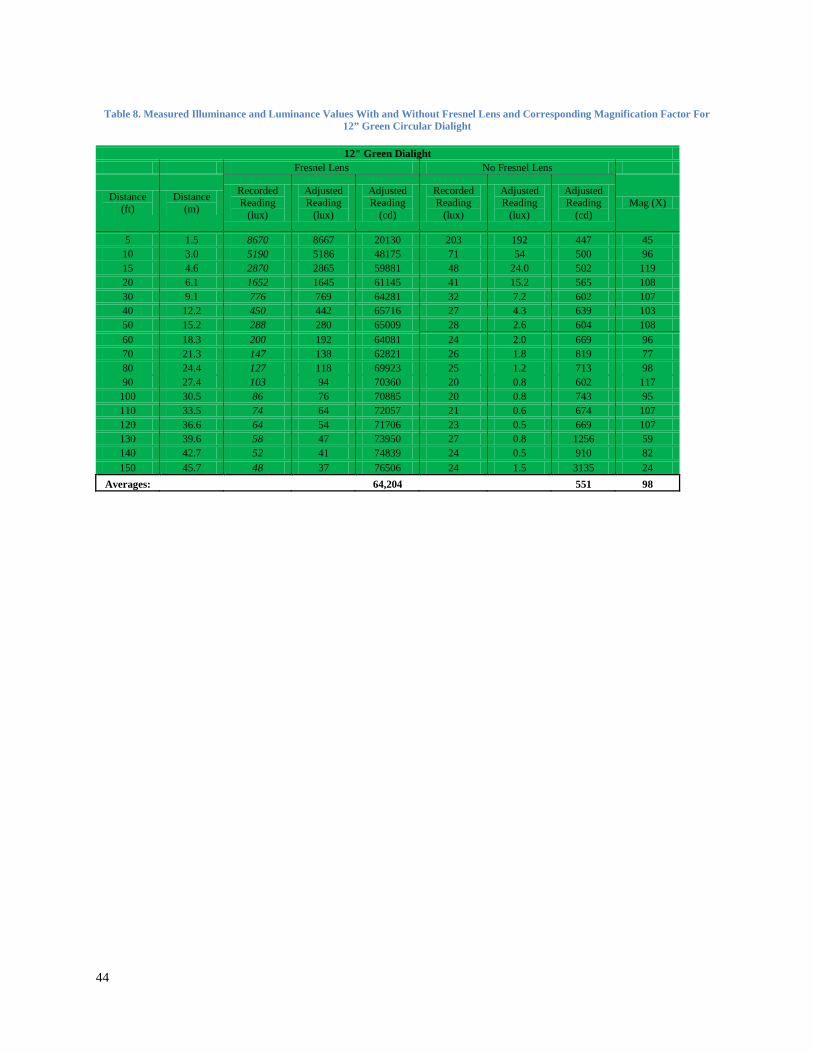
44
Table 8. Measured Illuminance and Luminance Values With and Without Fresnel Lens and Corresponding Magnification Factor For
12” Green Circular Dialight
12" Green Dialight Fresnel Lens No Fresnel Lens
Distance (ft)
Distance (m)
Recorded Reading
(lux)
Adjusted Reading
(lux)
Adjusted Reading
(cd)
Recorded Reading
(lux)
Adjusted Reading
(lux)
Adjusted Reading
(cd) Mag (X)
5 1.5 8670 8667 20130 203 192 447 45 10 3.0 5190 5186 48175 71 54 500 96 15 4.6 2870 2865 59881 48 24.0 502 119 20 6.1 1652 1645 61145 41 15.2 565 108 30 9.1 776 769 64281 32 7.2 602 107 40 12.2 450 442 65716 27 4.3 639 103 50 15.2 288 280 65009 28 2.6 604 108 60 18.3 200 192 64081 24 2.0 669 96 70 21.3 147 138 62821 26 1.8 819 77 80 24.4 127 118 69923 25 1.2 713 98 90 27.4 103 94 70360 20 0.8 602 117
100 30.5 86 76 70885 20 0.8 743 95 110 33.5 74 64 72057 21 0.6 674 107 120 36.6 64 54 71706 23 0.5 669 107 130 39.6 58 47 73950 27 0.8 1256 59 140 42.7 52 41 74839 24 0.5 910 82 150 45.7 48 37 76506 24 1.5 3135 24
Averages: 64,204 551 98
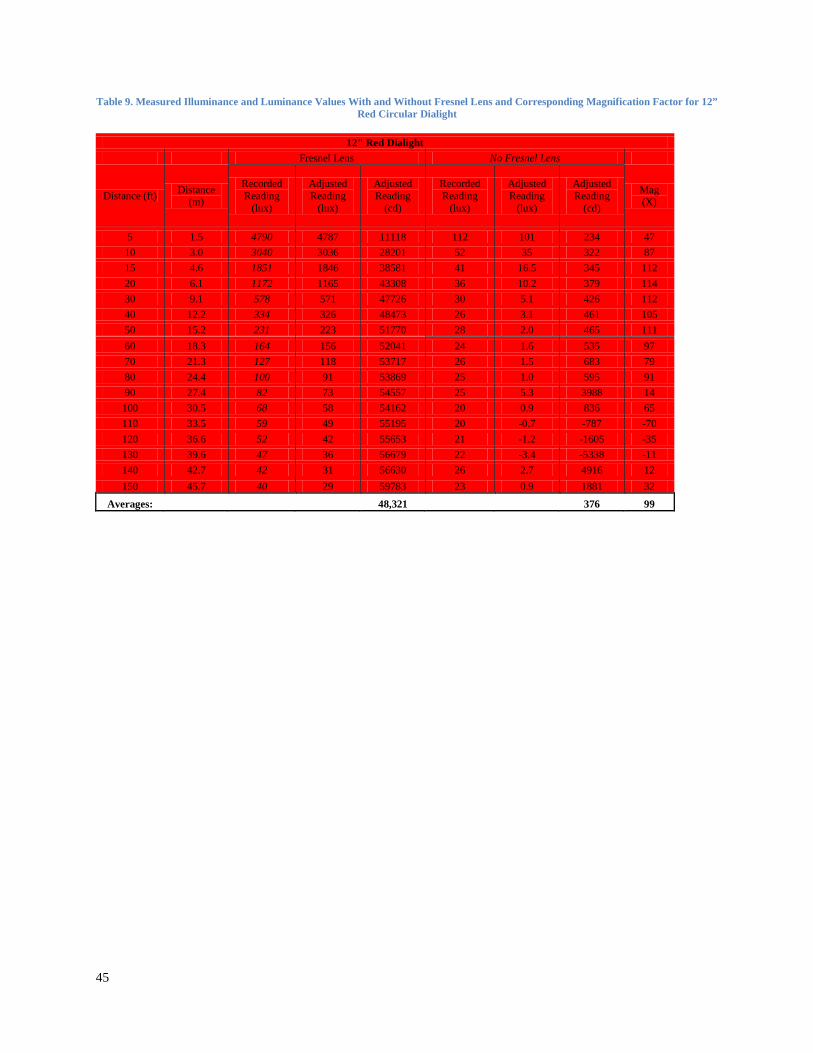
45
Table 9. Measured Illuminance and Luminance Values With and Without Fresnel Lens and Corresponding Magnification Factor for 12” Red Circular Dialight
12" Red Dialight Fresnel Lens No Fresnel Lens
Distance (ft) Distance (m)
Recorded Reading
(lux)
Adjusted Reading
(lux)
Adjusted Reading
(cd)
Recorded Reading
(lux)
Adjusted Reading
(lux)
Adjusted Reading
(cd)
Mag (X)
5 1.5 4790 4787 11118 112 101 234 47 10 3.0 3040 3036 28201 52 35 322 87 15 4.6 1851 1846 38581 41 16.5 345 112 20 6.1 1172 1165 43308 36 10.2 379 114 30 9.1 578 571 47726 30 5.1 426 112 40 12.2 334 326 48473 26 3.1 461 105 50 15.2 231 223 51770 28 2.0 465 111 60 18.3 164 156 52041 24 1.6 535 97 70 21.3 127 118 53717 26 1.5 683 79 80 24.4 100 91 53869 25 1.0 595 91 90 27.4 82 73 54557 25 5.3 3988 14 100 30.5 68 58 54162 20 0.9 836 65 110 33.5 59 49 55195 20 -0.7 -787 -70 120 36.6 52 42 55653 21 -1.2 -1605 -35 130 39.6 47 36 56679 22 -3.4 -5338 -11 140 42.7 42 31 56630 26 2.7 4916 12 150 45.7 40 29 59783 23 0.9 1881 32
Averages: 48,321 376 99

46
Table 10. Measured Illuminance and Luminance Values With and Without Fresnel Lens and Corresponding Magnification Factor For 12” Yellow Circular Leotek
12" Yellow Leotek Fresnel Lens No Fresnel Lens
Distance (ft) Distance (m)
Recorded Reading
(lux)
Adjusted Reading
(lux)
Adjusted Reading
(cd)
Recorded Reading
(lux)
Adjusted Reading
(lux)
Adjusted Reading
(cd) Mag (x)
5 1.5 7720 7717 17924 189 178 413 43 10 3.0 4500 4496 41765 65 47 437 96 15 4.6 2500 2495 52147 45 21.7 454 115 20 6.1 1580 1573 58469 38 12.3 457 128 30 9.1 670 663 55419 30 6.0 502 110 40 12.2 376 368 54716 26 3.9 580 94 50 15.2 248 240 55719 29 3.3 766 73 60 18.3 172 164 54716 24 2.0 669 82 70 21.3 129 120 54627 26 1.9 865 63 80 24.4 100 91 53869 26 1.7 1011 53 90 27.4 81 72 53805 21 1.6 1204 45 100 30.5 68 58 54162 22 1.8 1672 32 110 33.5 58 48 54070 23 1.3 1461 37 120 36.6 51 41 54315 25 1.6 2140 25 130 39.6 46 35 55109 27 0.7 1099 50 140 42.7 42 31 56630 25 1.3 2367 24 150 45.7 38 27 55602 25 1.8 3763 15
Averages: 51,945 515 94 This data was first plotted using the adjusted lux readings as the Y-axis and the distance in feet as the X axis. From the graph shown in Figure 26 below it is evident that each of the three colored LEDs follow roughly the same curve.
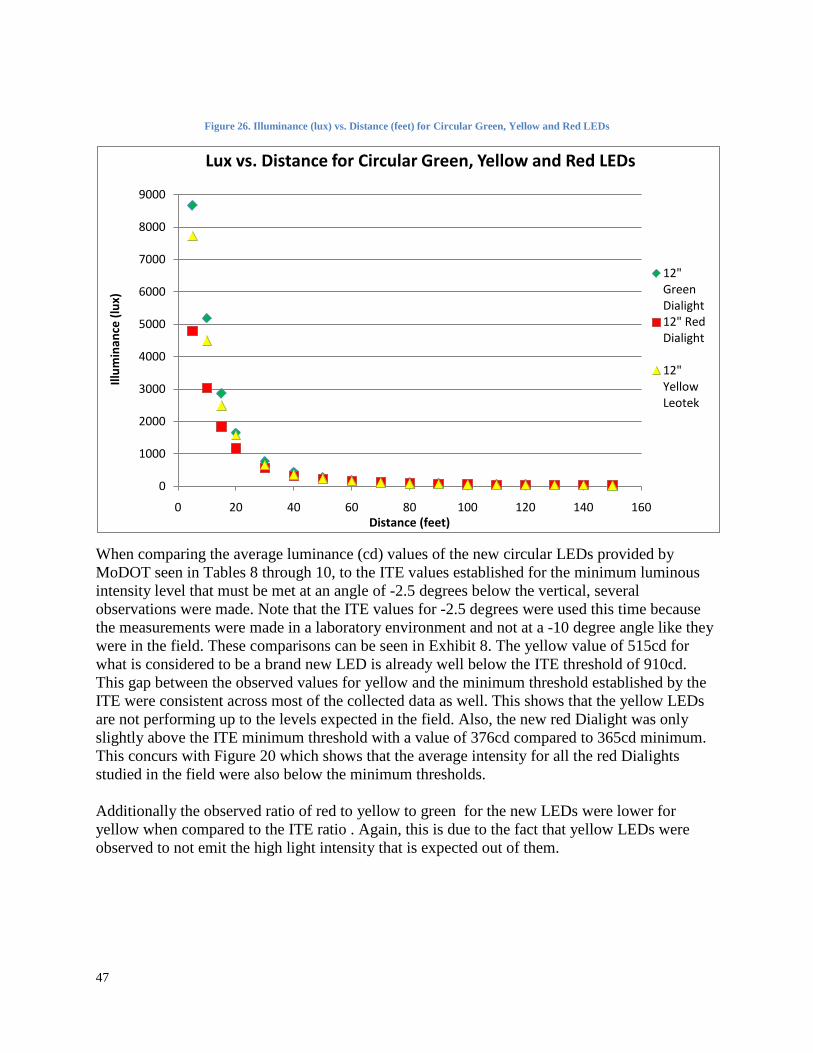
47
Figure 26. Illuminance (lux) vs. Distance (feet) for Circular Green, Yellow and Red LEDs
0
1000
2000
3000
4000
5000
6000
7000
8000
9000
0 20 40 60 80 100 120 140 160
Illum
inan
ce (l
ux)
Distance (feet)
Lux vs. Distance for Circular Green, Yellow and Red LEDs
12" Green Dialight12" Red Dialight
12" Yellow Leotek
When comparing the average luminance (cd) values of the new circular LEDs provided by MoDOT seen in Tables 8 through 10, to the ITE values established for the minimum luminous intensity level that must be met at an angle of -2.5 degrees below the vertical, several observations were made. Note that the ITE values for -2.5 degrees were used this time because the measurements were made in a laboratory environment and not at a -10 degree angle like they were in the field. These comparisons can be seen in Exhibit 8. The yellow value of 515cd for what is considered to be a brand new LED is already well below the ITE threshold of 910cd. This gap between the observed values for yellow and the minimum threshold established by the ITE were consistent across most of the collected data as well. This shows that the yellow LEDs are not performing up to the levels expected in the field. Also, the new red Dialight was only slightly above the ITE minimum threshold with a value of 376cd compared to 365cd minimum. This concurs with Figure 20 which shows that the average intensity for all the red Dialights studied in the field were also below the minimum thresholds. Additionally the observed ratio of red to yellow to green for the new LEDs were lower for yellow when compared to the ITE ratio . Again, this is due to the fact that yellow LEDs were observed to not emit the high light intensity that is expected out of them.
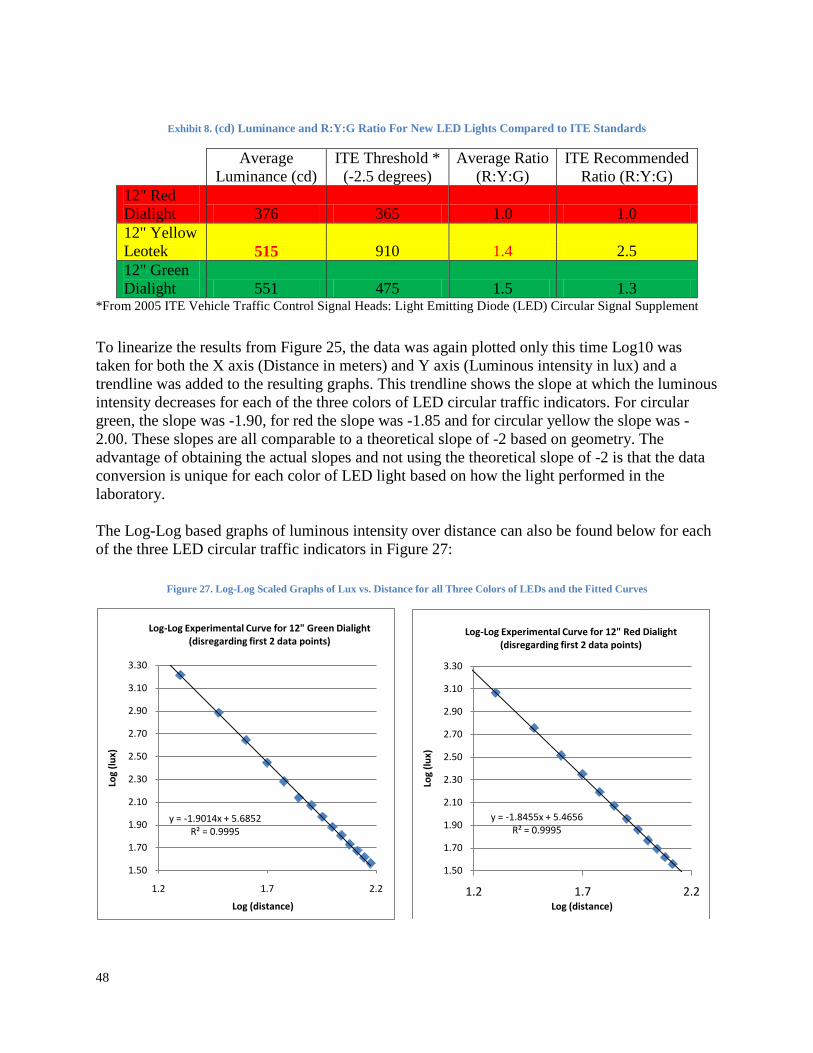
48
Exhibit 8. (cd) Luminance and R:Y:G Ratio For New LED Lights Compared to ITE Standards
Average Luminance (cd)
ITE Threshold * (-2.5 degrees)
Average Ratio (R:Y:G)
ITE Recommended Ratio (R:Y:G)
12" Red Dialight 376 365 1.0 1.0 12" Yellow Leotek 515 910 1.4 2.5 12" Green Dialight 551 475 1.5 1.3
*From 2005 ITE Vehicle Traffic Control Signal Heads: Light Emitting Diode (LED) Circular Signal Supplement To linearize the results from Figure 25, the data was again plotted only this time Log10 was taken for both the X axis (Distance in meters) and Y axis (Luminous intensity in lux) and a trendline was added to the resulting graphs. This trendline shows the slope at which the luminous intensity decreases for each of the three colors of LED circular traffic indicators. For circular green, the slope was -1.90, for red the slope was -1.85 and for circular yellow the slope was -2.00. These slopes are all comparable to a theoretical slope of -2 based on geometry. The advantage of obtaining the actual slopes and not using the theoretical slope of -2 is that the data conversion is unique for each color of LED light based on how the light performed in the laboratory. The Log-Log based graphs of luminous intensity over distance can also be found below for each of the three LED circular traffic indicators in Figure 27:
Figure 27. Log-Log Scaled Graphs of Lux vs. Distance for all Three Colors of LEDs and the Fitted Curves
y = -1.9014x + 5.6852R² = 0.9995
1.50
1.70
1.90
2.10
2.30
2.50
2.70
2.90
3.10
3.30
1.2 1.7 2.2
Log
(lux)
Log (distance)
Log-Log Experimental Curve for 12" Green Dialight (disregarding first 2 data points)
y = -1.8455x + 5.4656R² = 0.9995
1.50
1.70
1.90
2.10
2.30
2.50
2.70
2.90
3.10
3.30
1.2 1.7 2.2
Log
(lux)
Log (distance)
Log-Log Experimental Curve for 12" Red Dialight (disregarding first 2 data points)
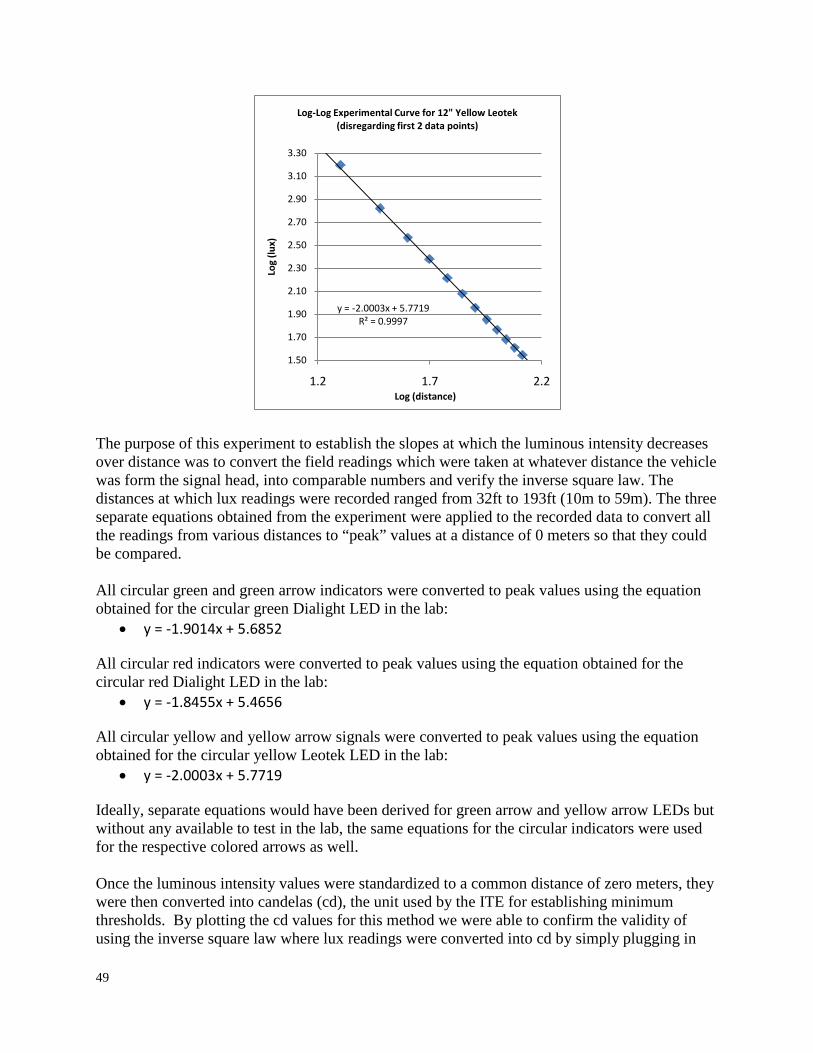
49
y = -2.0003x + 5.7719R² = 0.9997
1.50
1.70
1.90
2.10
2.30
2.50
2.70
2.90
3.10
3.30
1.2 1.7 2.2
Log
(lux)
Log (distance)
Log-Log Experimental Curve for 12" Yellow Leotek (disregarding first 2 data points)
The purpose of this experiment to establish the slopes at which the luminous intensity decreases over distance was to convert the field readings which were taken at whatever distance the vehicle was form the signal head, into comparable numbers and verify the inverse square law. The distances at which lux readings were recorded ranged from 32ft to 193ft (10m to 59m). The three separate equations obtained from the experiment were applied to the recorded data to convert all the readings from various distances to “peak” values at a distance of 0 meters so that they could be compared. All circular green and green arrow indicators were converted to peak values using the equation obtained for the circular green Dialight LED in the lab:
• y = -1.9014x + 5.6852
All circular red indicators were converted to peak values using the equation obtained for the circular red Dialight LED in the lab:
• y = -1.8455x + 5.4656
All circular yellow and yellow arrow signals were converted to peak values using the equation obtained for the circular yellow Leotek LED in the lab:
• y = -2.0003x + 5.7719
Ideally, separate equations would have been derived for green arrow and yellow arrow LEDs but without any available to test in the lab, the same equations for the circular indicators were used for the respective colored arrows as well. Once the luminous intensity values were standardized to a common distance of zero meters, they were then converted into candelas (cd), the unit used by the ITE for establishing minimum thresholds. By plotting the cd values for this method we were able to confirm the validity of using the inverse square law where lux readings were converted into cd by simply plugging in
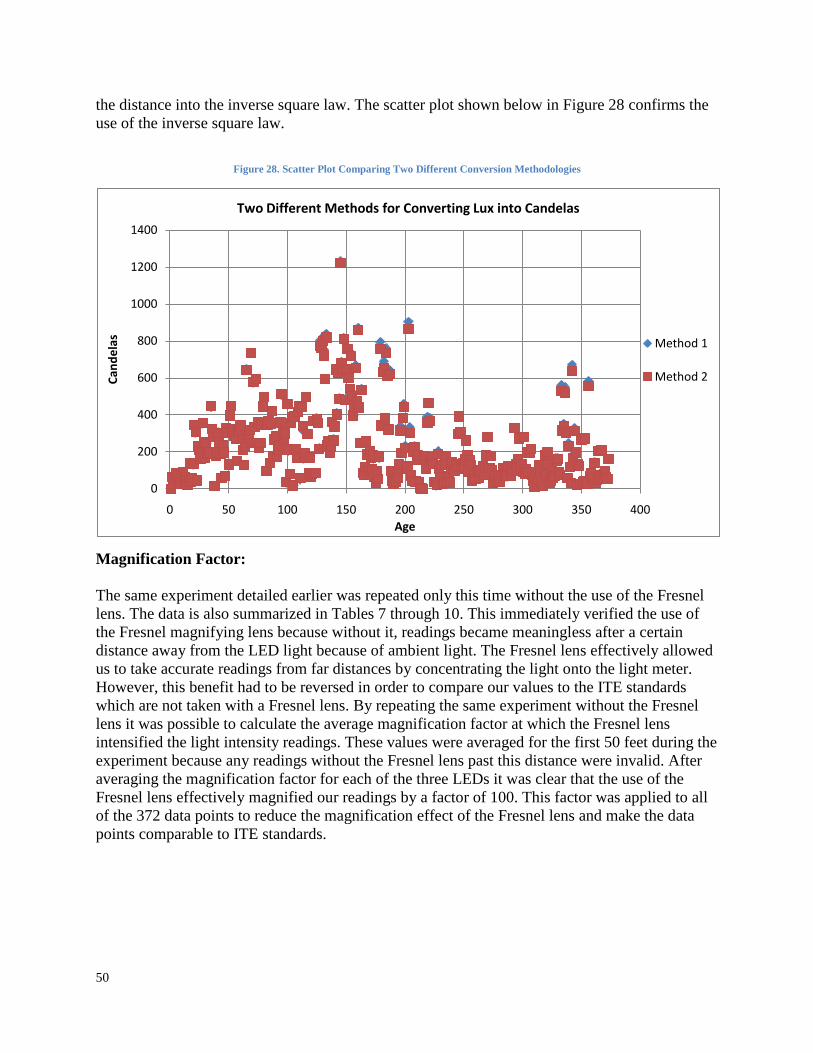
50
the distance into the inverse square law. The scatter plot shown below in Figure 28 confirms the use of the inverse square law.
Figure 28. Scatter Plot Comparing Two Different Conversion Methodologies
0
200
400
600
800
1000
1200
1400
0 50 100 150 200 250 300 350 400
Cand
elas
Age
Two Different Methods for Converting Lux into Candelas
Method 1
Method 2
Magnification Factor: The same experiment detailed earlier was repeated only this time without the use of the Fresnel lens. The data is also summarized in Tables 7 through 10. This immediately verified the use of the Fresnel magnifying lens because without it, readings became meaningless after a certain distance away from the LED light because of ambient light. The Fresnel lens effectively allowed us to take accurate readings from far distances by concentrating the light onto the light meter. However, this benefit had to be reversed in order to compare our values to the ITE standards which are not taken with a Fresnel lens. By repeating the same experiment without the Fresnel lens it was possible to calculate the average magnification factor at which the Fresnel lens intensified the light intensity readings. These values were averaged for the first 50 feet during the experiment because any readings without the Fresnel lens past this distance were invalid. After averaging the magnification factor for each of the three LEDs it was clear that the use of the Fresnel lens effectively magnified our readings by a factor of 100. This factor was applied to all of the 372 data points to reduce the magnification effect of the Fresnel lens and make the data points comparable to ITE standards.
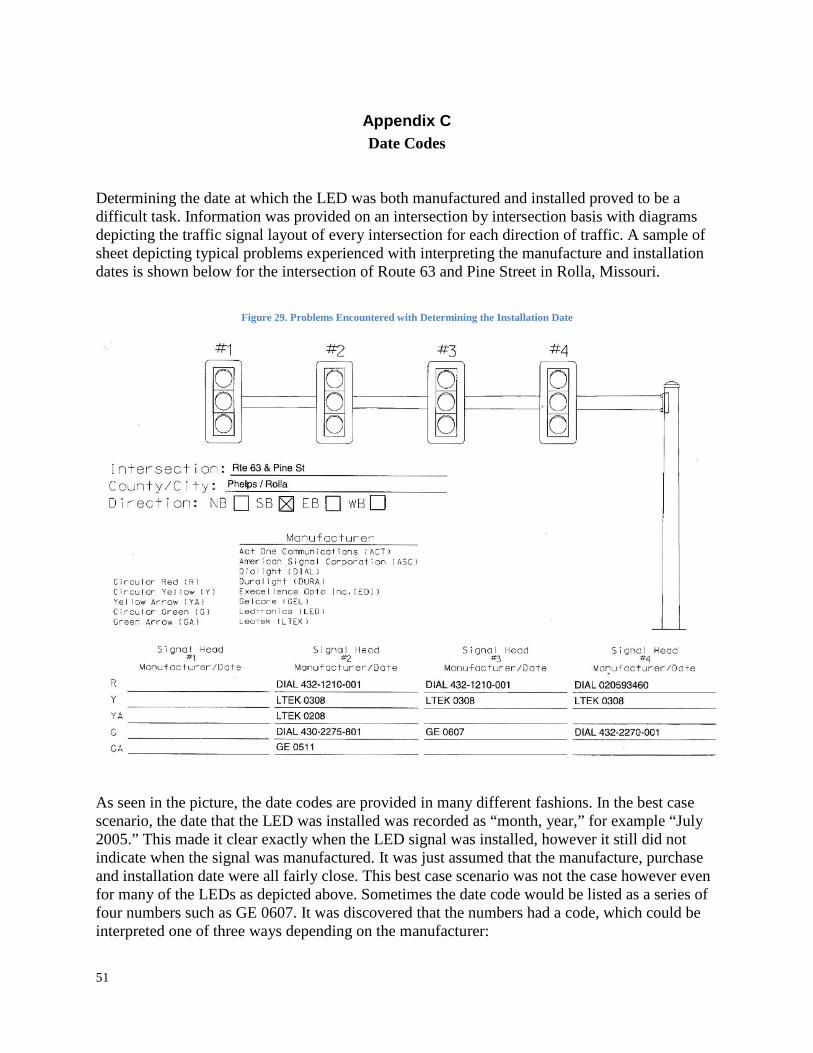
51
Appendix C Date Codes
Determining the date at which the LED was both manufactured and installed proved to be a difficult task. Information was provided on an intersection by intersection basis with diagrams depicting the traffic signal layout of every intersection for each direction of traffic. A sample of sheet depicting typical problems experienced with interpreting the manufacture and installation dates is shown below for the intersection of Route 63 and Pine Street in Rolla, Missouri.
Figure 29. Problems Encountered with Determining the Installation Date
As seen in the picture, the date codes are provided in many different fashions. In the best case scenario, the date that the LED was installed was recorded as “month, year,” for example “July 2005.” This made it clear exactly when the LED signal was installed, however it still did not indicate when the signal was manufactured. It was just assumed that the manufacture, purchase and installation date were all fairly close. This best case scenario was not the case however even for many of the LEDs as depicted above. Sometimes the date code would be listed as a series of four numbers such as GE 0607. It was discovered that the numbers had a code, which could be interpreted one of three ways depending on the manufacturer:
52
1. month, year 2. year, month 3. week of the year, year
This made interpreting the date codes very cumbersome and also very critical because of the large differences in age that were possible. Using the example of GE0607, the dates of installation could be three very different dates:
1. June, 2007 2. July, 2006 3. February, 2007
This margin of error could be even greater for codes such as 0107 as it could be interpreted as January 2007 or July 2001; a 6 year difference. Other date codes were simply never deciphered such as some of the Dialights seen above in Figure 29. This reduced the total amount of data available to analyze.
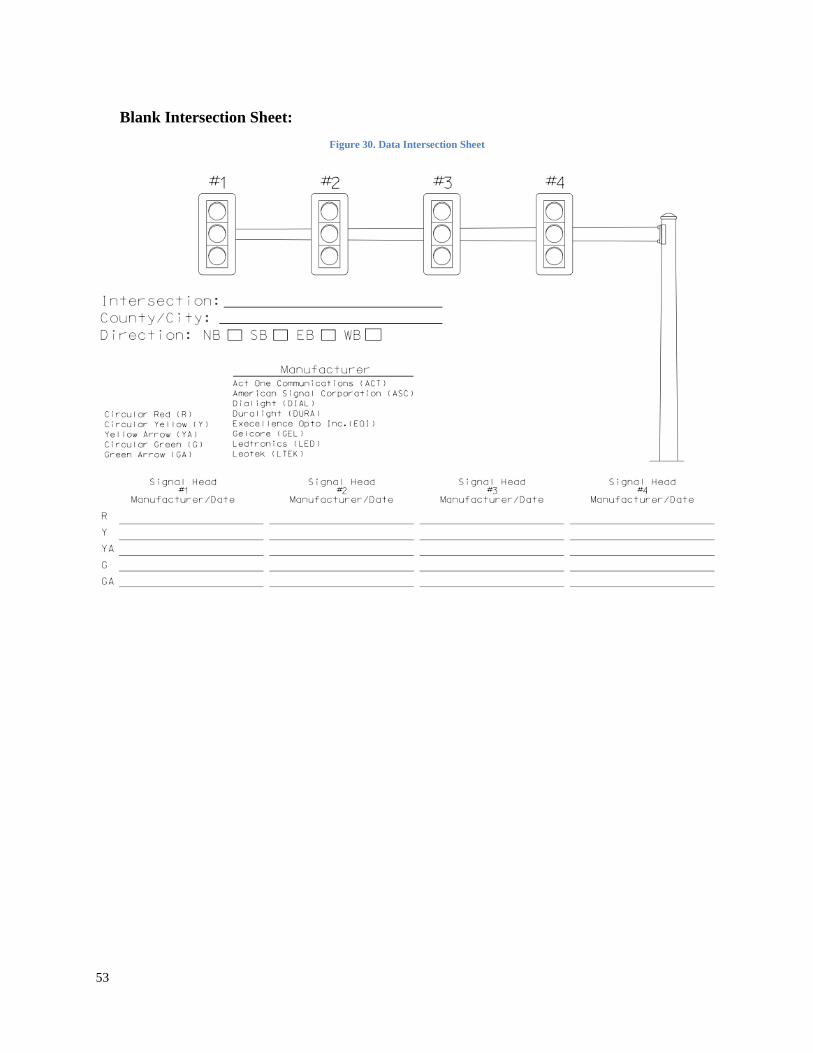
53
Blank Intersection Sheet:
Figure 30. Data Intersection Sheet
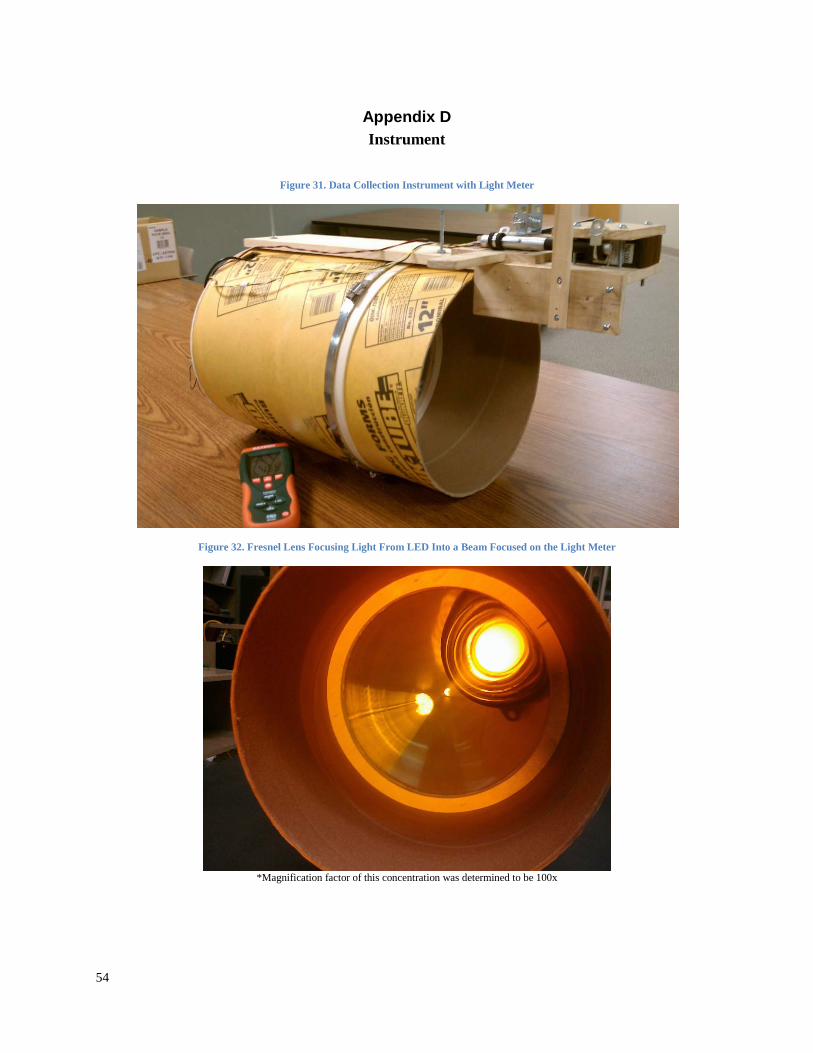
54
Appendix D Instrument
Figure 31. Data Collection Instrument with Light Meter
Figure 32. Fresnel Lens Focusing Light From LED Into a Beam Focused on the Light Meter
*Magnification factor of this concentration was determined to be 100x
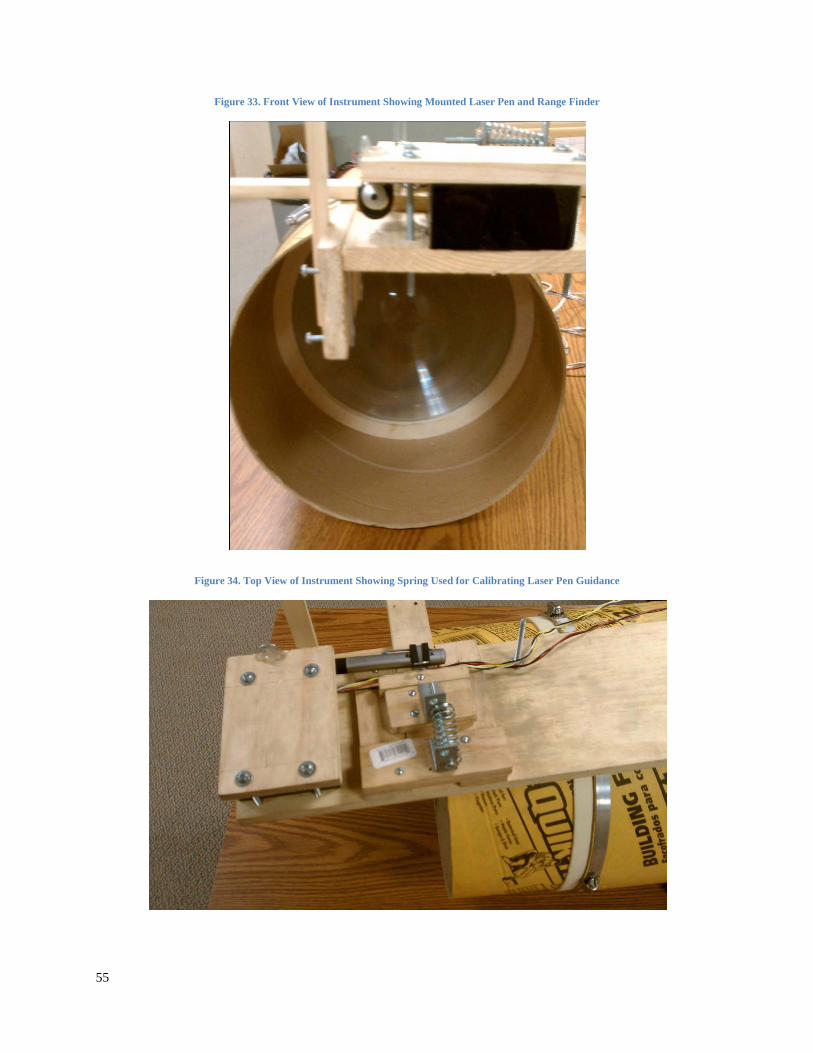
55
Figure 33. Front View of Instrument Showing Mounted Laser Pen and Range Finder
Figure 34. Top View of Instrument Showing Spring Used for Calibrating Laser Pen Guidance
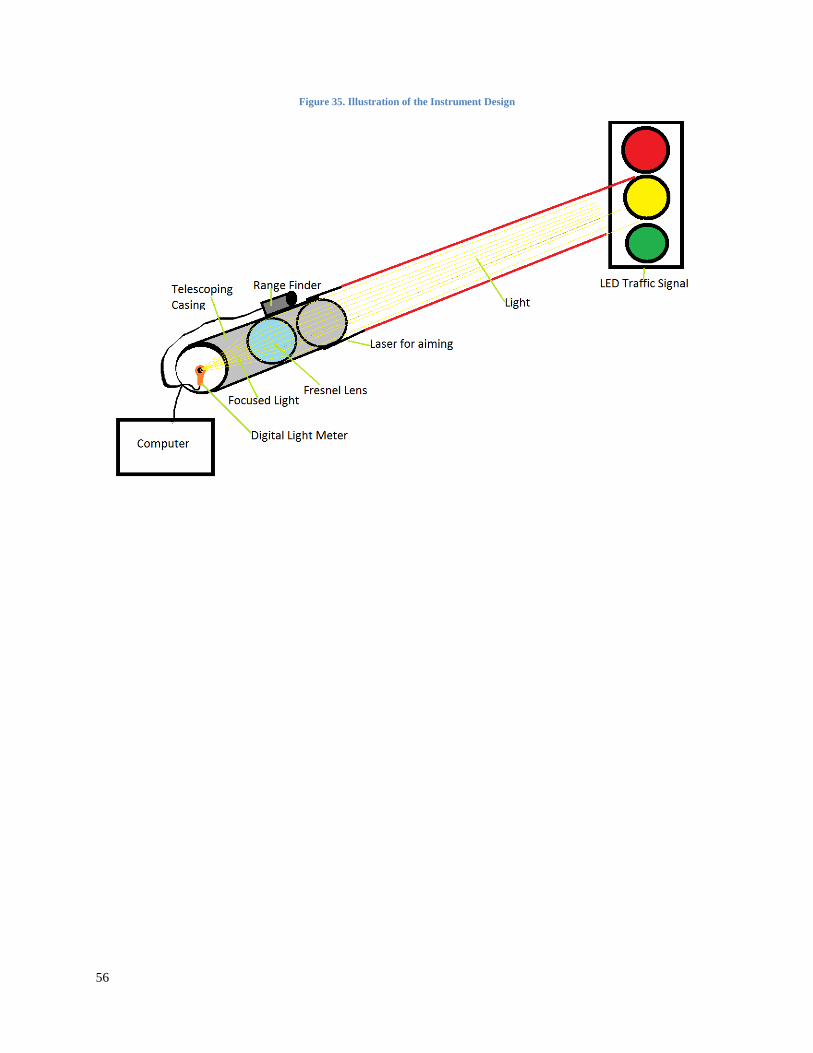
56
Figure 35. Illustration of the Instrument Design
57
Appendix E Operations and Maintenance
Objective The primary objective of this report is to provide an economic estimation to demonstrate the potential value of replacing traditional incandescent bulbs with LED indicators for MoDOT. Cost and effectiveness of applying LEDs are analyzed in this report. A suggestive summary is followed to help MoDOT make decisions. Background Since late 1990s, LEDs for traffic signals have been drawing wide attention from many cities in the US and in the world (Anonymous, 2000a). Several big replacement cases include Boston, MA (Palmer, 1999; Suozzo, 1999), Framingham, MA (Suozzo, 1999), Newton, MA (Suozzo, 1999), Denver, CO (Winer, 1998; Briggs, 2000), Lee County, FL (Crawford, 1999), Portland, Oregon (Anon., 2001), Stockholm, Sweden (Jonsson, 1999), Victoria, Australia (Das, 1999). A 2004 report from California Energy Commission listed 78 cities that installed LED traffic signal indicators (Anon., 2004). Two major advantages of using LED traffic lights include remarkable energy savings and noticeable maintenance savings. One major disadvantage is high initial cost. Our analysis shows that LED traffic lights have equal or better functionality compared to traditional incandescent bulbs (See the following effectiveness analysis), and that LED replacement has a payback period about 2 years and will save millions of dollars after that. (See the following cost analysis) Effectiveness Analysis We divided effectiveness of installing LEDs in three categories: functionality, environmental effects and economical effects. Advantages and disadvantages of LED traffic lights compared to traditional incandescent bulbs are summarized as follows: Functionality
• LEDs have a much longer life than incandescent bulb, referred number include 100,000 hours vs. 5000 hours (Anon., 1999), 6 years vs. 2 years (Anon., 2001)
• LED eliminates catastrophic failure of signal indicators thanks to the multiple LEDs in one unit.
• LED does not change color when dimming, which is a problem with incandescent bulbs. • The visibility of LEDs is in most time better than incandescent bulbs. • In dawn and dusk, when the sunlight shines directly into the signal head, there will be
uncomfortable glare reflecting from the reflection material behind incandescent bulbs. LEDs do not require such material and thus eliminate this problem (Anon., 2003).
• LEDs have more directional light beams than incandescents. This will cause some visibility problem if the signal heads are hanging freely in some intersections. This problem could be solved by securely attaching the signal head (Anon., 2003).

58
• LEDs are sometimes too bright to view in the dark. This issue could be solved by regulating the power input to the signal heads with some light sensors.
• The LEDs do not generate as much heat as incandescent ones, thus they avoid burning the lens cover. However, in heavy snow, the heat from LED is usually not enough to melt down the snow and ice accumulated on the visor (Anon., 2003).
• LEDs use low enough power to operate using battery back-up during power outage.
Environmental Effects
• LEDs save a lot of energy consumption and thus reduce green house gas emissions. Denver reported reducing 5,300 metric tons of CO2, 23.3 metric tons of SO2 and 20.8 metric tons of NOx emission each year after installing 20,500 LED traffic lights (Winer, 1998).
Economic Effects
• LED indicators have a much higher initial cost compared to incandescent bulbs, typically $100 vs. $3 per unit (Anon., 2000).
• After years of operation, LEDs save millions of dollars in relamping, emergency repairing, maintenance and energy cost. Denver replaced 20,500 traffic indicators with LEDs and reported an annual savings of $430,000 (Winer, 1998). Stockholm replaced 27,000 traffic indicators with LEDs and reported an annual savings of $479,000 (Jonsson, 1999).

59
Table 1. Effectiveness of Replacing Traditional Incandescent Bulbs with LEDs
Categories A/D Description Reference
Functionality
A Long life time Suozzo, 1998 A Elimination of catastrophic failure Anon., 2003 A Brighter Suozzo, 1998 A Elimination of reflection of sunlight Anon., 2003 A Avoid burning lens cover Anon., 2003 A Do not change color when dimming Anon., 2000 A Use battery backup during power outage Anon., 2004 D Directional visibility causes Anon., 2003 D Not enough heat to melt covering snow and ice Anon., 2003 D Too bright in night if not regulated Anon., 2000
Environmental Effects
A Lower energy consumption Wu et al., 2008 A Lower GHG emission Anon., 2003
Economic Effects
A Lower emergency fix cost Anon., 2003 A Lower relamping cost Anon., 2001 A Lower maintenance cost Wu et al., 2008 D Higher initial cost Anon., 2000
Note: A = Advantage, D = Disadvantage Most effects are reported from more than one literatures. Referenced literature was selected at the authors’ convenience.
Economic Evaluation The cost analysis was performed by using a top-down approach, which requires a host of assumptions. Data were collected from five major LED vendors (General Electric, ActOne, LeoTek, Philips and Dialight), various case studies and reliable publications. However, in the unique real conditions, reasonable adjustment of some key factors may significantly affect results. The level of customizing an investment is not considered as the goal of this analysis. Thus, this study does not consider the installation size and the specific area installed. The results are scalable when there are more inputs, such as reasonable ratios, and specific model numbers of LED indicators. The energy consumption of LEDs is calculated by multiplying the unit wattage by an average time of an indication is on in every year. Table 2 shows a comparison of estimated price and wattage between three LED indicators and incandescent bulbs. The annual energy saving is the difference in energy consumption between the LED and incandescent. The energy savings by using LED can reach 90%.
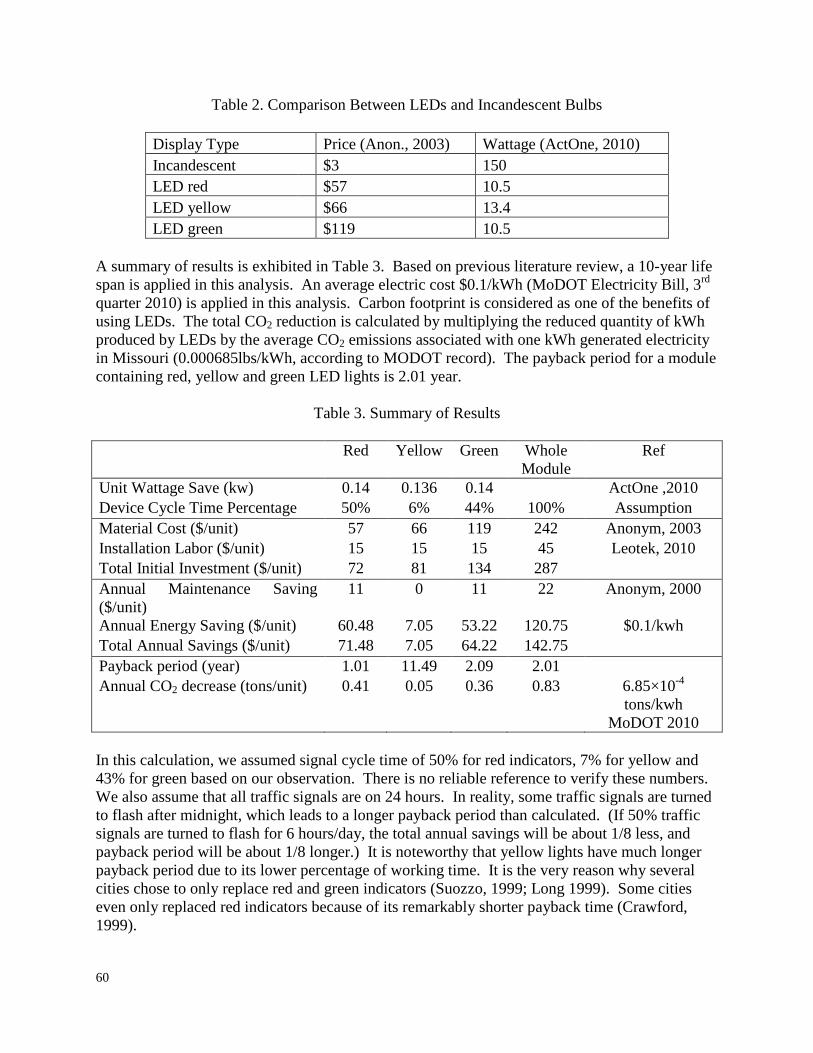
60
Table 2. Comparison Between LEDs and Incandescent Bulbs
Display Type Price (Anon., 2003) Wattage (ActOne, 2010) Incandescent $3 150 LED red
$57 10.5
LED yellow $66 13.4 LED green $119 10.5
A summary of results is exhibited in Table 3. Based on previous literature review, a 10-year life span is applied in this analysis. An average electric cost $0.1/kWh (MoDOT Electricity Bill, 3rd quarter 2010) is applied in this analysis. Carbon footprint is considered as one of the benefits of using LEDs. The total CO2 reduction is calculated by multiplying the reduced quantity of kWh produced by LEDs by the average CO2 emissions associated with one kWh generated electricity in Missouri (0.000685lbs/kWh, according to MODOT record). The payback period for a module containing red, yellow and green LED lights is 2.01 year.
Table 3. Summary of Results
Red Yellow Green Whole Module
Ref
Unit Wattage Save (kw) 0.14 0.136 0.14 ActOne ,2010 Device Cycle Time Percentage 50% 6% 44% 100% Assumption Material Cost ($/unit) 57 66 119 242 Anonym, 2003 Installation Labor ($/unit) 15 15 15 45 Leotek, 2010 Total Initial Investment ($/unit) 72 81 134 287 Annual Maintenance Saving ($/unit)
11 0 11 22 Anonym, 2000
Annual Energy Saving ($/unit) 60.48 7.05 53.22 120.75 $0.1/kwh Total Annual Savings ($/unit) 71.48 7.05 64.22 142.75 Payback period (year) 1.01 11.49 2.09 2.01 Annual CO2 decrease (tons/unit) 0.41 0.05 0.36 0.83 6.85×10⁻⁴
tons/kwh MoDOT 2010
In this calculation, we assumed signal cycle time of 50% for red indicators, 7% for yellow and 43% for green based on our observation. There is no reliable reference to verify these numbers. We also assume that all traffic signals are on 24 hours. In reality, some traffic signals are turned to flash after midnight, which leads to a longer payback period than calculated. (If 50% traffic signals are turned to flash for 6 hours/day, the total annual savings will be about 1/8 less, and payback period will be about 1/8 longer.) It is noteworthy that yellow lights have much longer payback period due to its lower percentage of working time. It is the very reason why several cities chose to only replace red and green indicators (Suozzo, 1999; Long 1999). Some cities even only replaced red indicators because of its remarkably shorter payback time (Crawford, 1999).
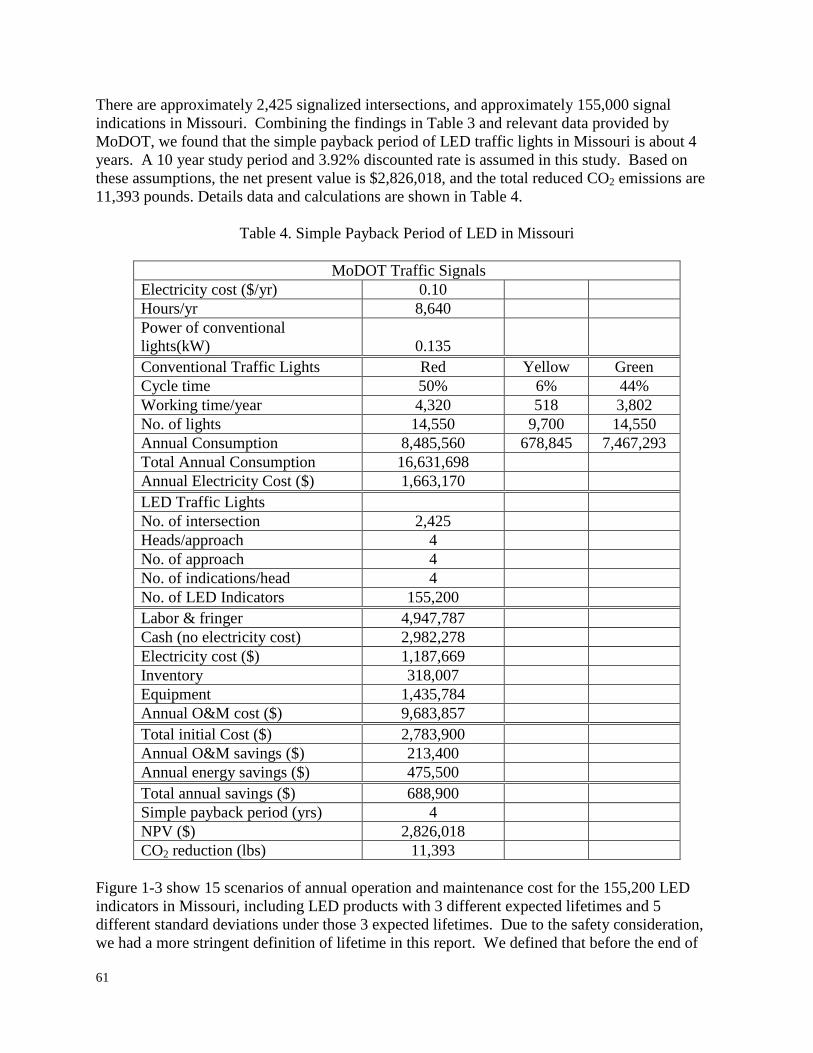
61
There are approximately 2,425 signalized intersections, and approximately 155,000 signal indications in Missouri. Combining the findings in Table 3 and relevant data provided by MoDOT, we found that the simple payback period of LED traffic lights in Missouri is about 4 years. A 10 year study period and 3.92% discounted rate is assumed in this study. Based on these assumptions, the net present value is $2,826,018, and the total reduced CO2 emissions are 11,393 pounds. Details data and calculations are shown in Table 4.
Table 4. Simple Payback Period of LED in Missouri
MoDOT Traffic Signals Electricity cost ($/yr) 0.10
Hours/yr 8,640 Power of conventional
lights(kW) 0.135 Conventional Traffic Lights Red Yellow Green
Cycle time 50% 6% 44% Working time/year 4,320 518 3,802 No. of lights 14,550 9,700 14,550 Annual Consumption 8,485,560 678,845 7,467,293 Total Annual Consumption 16,631,698
Annual Electricity Cost ($) 1,663,170 LED Traffic Lights
No. of intersection 2,425 Heads/approach 4 No. of approach 4 No. of indications/head 4 No. of LED Indicators 155,200 Labor & fringer 4,947,787 Cash (no electricity cost) 2,982,278 Electricity cost ($) 1,187,669 Inventory 318,007 Equipment 1,435,784 Annual O&M cost ($) 9,683,857 Total initial Cost ($) 2,783,900 Annual O&M savings ($) 213,400 Annual energy savings ($) 475,500 Total annual savings ($) 688,900 Simple payback period (yrs) 4 NPV ($) 2,826,018 CO2 reduction (lbs) 11,393
Figure 1-3 show 15 scenarios of annual operation and maintenance cost for the 155,200 LED indicators in Missouri, including LED products with 3 different expected lifetimes and 5 different standard deviations under those 3 expected lifetimes. Due to the safety consideration, we had a more stringent definition of lifetime in this report. We defined that before the end of
62
lifetime, the lumen output levels meet the requirement of application. Accordingly, the failure means certain LEDs cannot meet the requirement, rather than burn-out. Because LED indicators are still new in the market, there is little recorded data to analyze the real situation. Our calculation is based on following assumptions:
• The lifetime of the LED follows normal distribution. • The maintenance cost under the 5-year warranty (LeoTek) would be only labor, after the
warranty the cost consists of labor and materials. • Emergent repair labor cost = $90/head. • Emergent repair: average material cost = $88 (which is an average of the material costs
of green and red LEDs, since yellow are used much less often than the other two). • Study period of this study is 10 years. Relamping is not included in this study because
LED relamping is usually over 10 years after installation.
As shown from Figure 1 to Figure 3, LED indicators with good quality (longer mean lifetime) ensure a lower total maintenance cost. It is also shown that the maintenance cost increases with time.
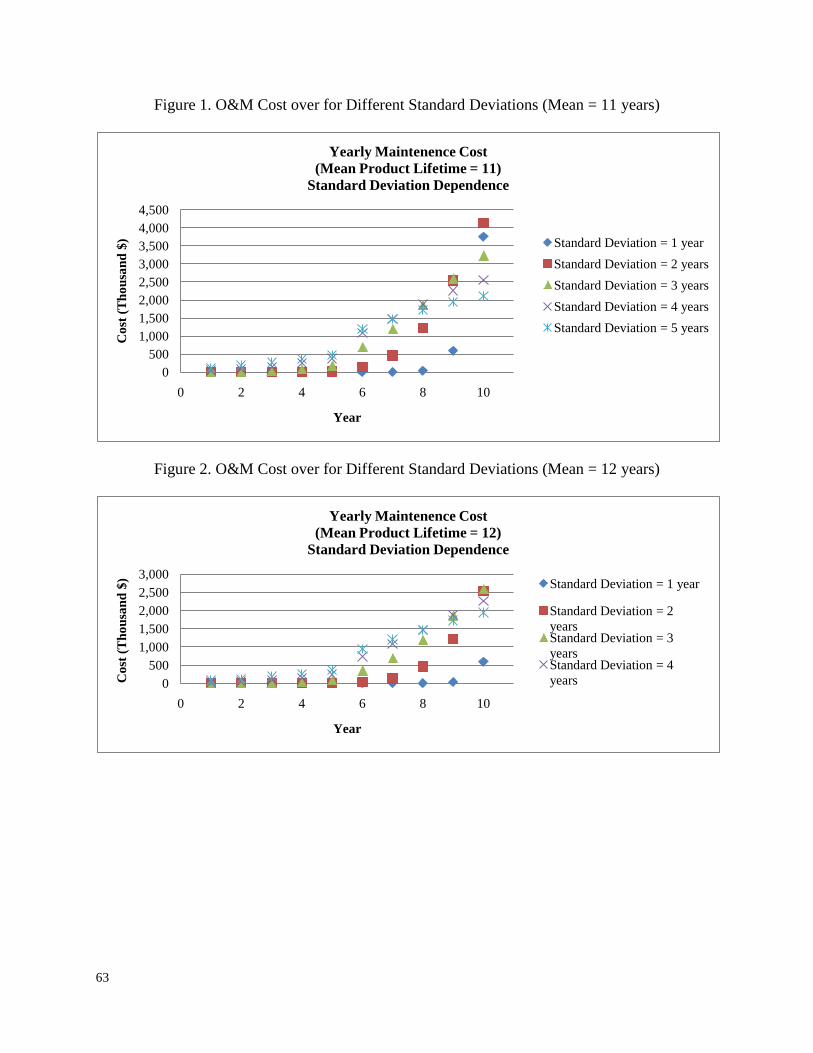
63
Figure 1. O&M Cost over for Different Standard Deviations (Mean = 11 years)
0500
1,0001,5002,0002,5003,0003,5004,0004,500
0 2 4 6 8 10
Cos
t (T
hous
and
$)
Year
Yearly Maintenence Cost (Mean Product Lifetime = 11)
Standard Deviation Dependence
Standard Deviation = 1 yearStandard Deviation = 2 yearsStandard Deviation = 3 yearsStandard Deviation = 4 yearsStandard Deviation = 5 years
Figure 2. O&M Cost over for Different Standard Deviations (Mean = 12 years)
0500
1,0001,5002,0002,5003,000
0 2 4 6 8 10
Cos
t (T
hous
and
$)
Year
Yearly Maintenence Cost (Mean Product Lifetime = 12)
Standard Deviation Dependence
Standard Deviation = 1 year
Standard Deviation = 2 yearsStandard Deviation = 3 yearsStandard Deviation = 4 years
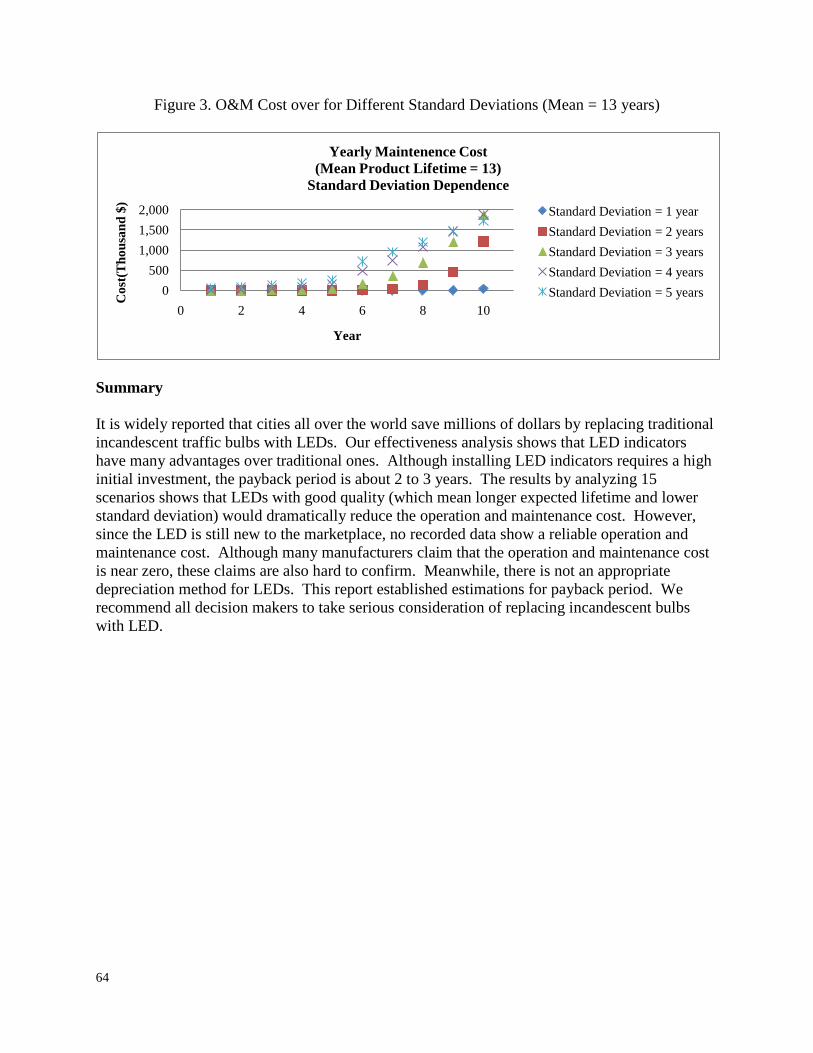
64
Figure 3. O&M Cost over for Different Standard Deviations (Mean = 13 years)
0500
1,0001,5002,000
0 2 4 6 8 10
Cos
t(T
hous
and
$)
Year
Yearly Maintenence Cost (Mean Product Lifetime = 13)
Standard Deviation Dependence
Standard Deviation = 1 yearStandard Deviation = 2 yearsStandard Deviation = 3 yearsStandard Deviation = 4 yearsStandard Deviation = 5 years
Summary It is widely reported that cities all over the world save millions of dollars by replacing traditional incandescent traffic bulbs with LEDs. Our effectiveness analysis shows that LED indicators have many advantages over traditional ones. Although installing LED indicators requires a high initial investment, the payback period is about 2 to 3 years. The results by analyzing 15 scenarios shows that LEDs with good quality (which mean longer expected lifetime and lower standard deviation) would dramatically reduce the operation and maintenance cost. However, since the LED is still new to the marketplace, no recorded data show a reliable operation and maintenance cost. Although many manufacturers claim that the operation and maintenance cost is near zero, these claims are also hard to confirm. Meanwhile, there is not an appropriate depreciation method for LEDs. This report established estimations for payback period. We recommend all decision makers to take serious consideration of replacing incandescent bulbs with LED.

Missouri Department of Transportation Organizational Results P. O. Box 270 Jefferson City, MO 65102
573.526.4335 1.888.ASK.MODOT [email protected]
Related Documents