1 Leveraging Paraguay’s Hydropower for Sustainable Economic Development Final Report 1 Director of the Earth Institute: Jeffrey Sachs Director of CCSI: Lisa Sachs Lead authors: Perrine Toledano and Nicolas Maennling With Support from: Jose Acero, Sébastien Carreau, Charlotte Gauthier and Paloma Ruiz November 2013 1 The views in this report are that of the Research Team and the Research Team alone and do not reflect the views of any supporting institution.

Welcome message from author
This document is posted to help you gain knowledge. Please leave a comment to let me know what you think about it! Share it to your friends and learn new things together.
Transcript
1
Leveraging Paraguay’s Hydropower for Sustainable Economic Development
Final Report1
Director of the Earth Institute: Jeffrey Sachs
Director of CCSI: Lisa Sachs
Lead authors: Perrine Toledano and Nicolas Maennling
With Support from: Jose Acero, Sébastien Carreau, Charlotte Gauthier and Paloma Ruiz
November 2013
1 The views in this report are that of the Research Team and the Research Team alone and do not reflect the views of any supporting institution.
2
The Columbia Center on Sustainable Investment (CCSI), a joint center of Columbia Law School and the Earth Institute at Columbia University, is the only applied research center and forum dedicated to the study, practice and discussion of sustainable international investment. Our mission is to develop and disseminate practical approaches and solutions, as well as to analyze topical policy-oriented issues, in order to maximize the impact of international investment for sustainable development. The Center undertakes its mission through interdisciplinary research, advisory projects, multi-stakeholder dialogue, educational programs, and the development of resources and tools. For more information, visit us at www.ccsi.columbia.edu. Acknowledgements We would like to thank Fabrizio Franco and Lorena Mersan for their legal contributions to the report, Jacky Mandelbaum and Sophie Thomashausen for their thorough review, and Ignacio Urrutia for his political economy insights and hospitality during our visit to Asunción.
We would also like to thank the following Institutions and Organizations that provided us with valuable information during our consultations: Administracion Nacional de Electricidad (ANDE) Banco Central del Paraguay (BCP) Banco Interamericano de Desarrollo (BID) Centro de Análisis y Difusión de la Economía Paraguaya (CADEP) Desarrollo en Democracia (DENDE) Faculty of Law – University of Oxford Grupo de Estudos do Setor Elétrico (GESEL) Grupo Técnico de Negociación (GTN) Instituto Acende Brasil Instituto de Derecho y Economía Ambiental (IDEA) Itaipú Binacional (IB) Ministerio de Hacienda (MH) Ministerio de Industria y Comercio (MIC) Ministerio de Obras Públicas y Comunicaciones (MOPC) Red de Inversiones y Exportaciones (REDIEX) Rio Tinto Alcan Secretaría Técnica de Planificación (STP) Unión Industrial Paraguaya (UIP) Finally, we are thankful for the feedback sent to us by individuals during the consultation period and we have done our utmost to include all the relevant comments provided.
3
Table of Contents
List of Acronyms and Abbreviations .................................................................................................. 6
Executive Summary .................................................................................................................................. 7
Introduction .............................................................................................................................................. 12
1. The Domestic Electricity Sector ................................................................................................ 13
1.1 Current Situation ................................................................................................................ 13
1.2 Problems Faced by the Electricity Sector .................................................................. 18
1.3 Planned Investments and Energy Strategy ............................................................... 21
1.4 Overcoming the Problems Identified Above ............................................................ 25
1.5 Summary of Findings and Recommendations ......................................................... 29
2. Industrial Development and the Domestic Electricity Sector ....................................... 31
2.1 Industrial Development ................................................................................................... 31
2.2 Energy-Intensive Industries ........................................................................................... 40
2.3. Summary of Findings and Recommendations ........................................................ 57
3. Fair Pricing of Electricity Sales .................................................................................................. 59
3.1. Past Itaipú Electricity Sales ............................................................................................ 59
3.2. Regional Demand and Tariff Negotiations ............................................................... 62
3.3. Summary of Findings and Recommendations ........................................................ 66
4. Towards a Green Economy ......................................................................................................... 68
4.1. Transport transformation .............................................................................................. 68
4.2. Replacing biomass consumption in Paraguay ........................................................ 75
4.3. Summary of Findings and Recommendations ........................................................ 80
5. Proper Management of Electricity Revenues ....................................................................... 82
5.1. Existing electricity revenue management ................................................................ 82
5.2. Non-electricity revenue collection .............................................................................. 88
5.3. A planning strategy ........................................................................................................... 90
5.4. Summary of Findings and Recommendations ........................................................ 91
ANNEX A: Paraguay’s Comparative Advantages and Barriers to Sustainable Development ............................................................................................................................................. 93
ANNEX B: Mapping of the Investment Legal Framework ..................................................... 102
ANNEX C: Itaipú Debt History ......................................................................................................... 106
ANNEX D: Salto Grande ...................................................................................................................... 108

4
List of Figures Figure 1: Electricity Consumption in Paraguay Compared to the Region ............................ 15 Figure 2: Cost of Generation: US¢2.57/ kWh in 2010 .................................................................... 15 Figure 3: Distribution of the Social Tariff by Region ...................................................................... 17 Figure 4: Annual Electricity Sales and Distribution Losses in 2005 ........................................ 20 Figure 5: Number of Power Cuts and Estimated Duration .......................................................... 21 Figure 6: ANDE’s Peak Demand Growth Projections ..................................................................... 22 Figure 7: CRU and RTA’s Annual Energy Demand Growth Projections .................................. 23 Figure 8: The Paraguayan Industrial Sector in 2008 ..................................................................... 33 Figure 9: Average Energy Use as a Percentage of Operating Costs of Energy-intensive Industries ........................................................................................................................................................ 40 Figure 10: Electricity Tariffs RTA Would be Willing to Pay if No Taxes are Imposed ...... 45 Figure 11: Resource Rent Tax ................................................................................................................. 47 Figure 12: Projected Revenues from RTA Under the Best Possible Scenario ...................... 48 Figure 13: Structure of the Global Aluminum Industry ................................................................ 51 Figure 14: Developing SMEs Through Business Linkages – The Mozlink Model ................ 56 Figure 15: Domestic Electricity Demand and Supply .................................................................... 63 Figure 16: Electricity Available for Exports With and Without the RTA Project ................ 63 Figure 17: Regional Electricity Demand/Supply Projections Until 2030 .............................. 65 Figure 18: Brazil and Southern Corn Electricity Generation Mix (2008 & 2030) ............... 65 Figure 19: Investment and Operation Comparison, Asunción (3,500 buses) ...................... 70 Figure 20: Cumulative Costs of an Electricity-based Transport System Versus a Petroleum-based Transport System in Asunción ............................................................................ 70 Figure 21: Plug-in Hybrid Electric Vehicles (PHEVs) Total Cost of Ownership (Including ARRA Tax Credit) ......................................................................................................................................... 72 Figure 22: Pure Electric Vehicles (EVs) Total Cost of Ownership (Including ARRA Tax Credit) ............................................................................................................................................................... 72 Figure 23: Additional Electricity Consumption from the Transport Sector .......................... 75 Figure 24: Sources of Energy Consumption in Paraguay and Neighboring Countries in 2010 .................................................................................................................................................................. 76 Figure 25: Biomass Consumption by Sector (2009) and Source (2011) ................................ 76 Figure 26: Forest Coverage vs. Population Growth and Associated Increase in Demand for Wood .......................................................................................................................................................... 80 Figure 27: Quality of Public Administration and GDP per Capita (PPP) for Selected Latin American and Caribbean Countries (2006) ....................................................................................... 86 Figure 28: Tax to GDP Ratio in Paraguay and Neighboring Countries .................................... 88 Figure 29: Tax Rates in Paraguay and Regional Countries .......................................................... 89 Figure 30: Primary Sector Exports 2003 – 2011 ............................................................................. 94 Figure 31: Structure of Paraguay’s Economy (2012) ..................................................................... 94 Figure 32: Regional Labor Competitiveness...................................................................................... 96 Figure 33: Investment 2000 – 2012 ..................................................................................................... 99 Figure 34: Investment, Jobs and Number of Companies 2000 – 2012 .................................... 99 Figure 35: Global Competitiveness .................................................................................................... 100 Figure 36 and 37: Transparency and Accountability Indexes for Paraguay and Regional Countries ...................................................................................................................................................... 101 Figure 38: Itaipú’s Accumulated Debt ............................................................................................... 107

5
List of Tables Table 1: Paraguay’s Power Sources ...................................................................................................... 13 Table 2: Electricity Supply ........................................................................................................................ 14 Table 3: Electricity Demand ..................................................................................................................... 14 Table 4: Cost of Electricity Sold in 2011 ............................................................................................. 16 Table 5: Tariff Structure ............................................................................................................................ 16 Table 6: Social Tariff Structure and Beneficiaries ........................................................................... 17 Table 7: Planned Electricity Generation Projects ............................................................................ 23 Table 8: Secured Donor Funding for Electricity Master Plan ..................................................... 24 Table 9: Impact of Electricity Constraints on Businesses ............................................................ 31 Table 10: Electricity Related Questions from the Business Survey 2010 .............................. 32 Table 11: Energy Sources for Production by Industry .................................................................. 41 Table 12: Potential Benefits and Risks of the Proposed RTA Project ...................................... 42 Table 13: Aluminum Smelters with a Capacity over 350,000Mtpa .......................................... 50 Table 14: Companies That Have Submitted a Letter of Interest to Invest in the Industrial Park ................................................................................................................................................................... 53 Table 15: Business Opportunities for Local Procurement ........................................................... 55 Table 16: Legal Challenges for Local Content Provisions ............................................................. 56 Table 17: Contract Price and Spot Prices for Electricity (1st semester 2012) in Paraguay’s Neighboring Countries ........................................................................................................ 64 Table 18: Overview of Paraguay’s Transport Sector ...................................................................... 68 Table 19: Federal Incentives Available to Buyers or Producers of Electric vehicles (EV) ............................................................................................................................................................................. 73 Table 20: Average Cost of Fuel Wood .................................................................................................. 77 Table 21: Yearly Rate of Gain or Loss of Forest Area During Given Period........................... 79 Table 22: Allocation of Fonacide Funds .............................................................................................. 82 Table 23: Brazil’s Fiscal Responsibility Law in 2000 ..................................................................... 87
List of Boxes Box 1: Efficiency of the Management Contract in Tanzania ........................................................ 25 Box 2: Curbing distribution losses in Bogotá, Colombia ............................................................... 26 Box 3: Direct Load Control Program in Vietnam and in the United States ............................ 28 Box 4: Dynamic Pricing in the United States ..................................................................................... 29 Box 5: Thai Agribusiness Model ............................................................................................................. 35 Box 6: Chile’s Pillars for Diversification: Innovation and Knowledge ..................................... 36 Box 7: Linkages Program for the Mozal Aluminum Smelter in Mozambique ....................... 54 Box 8: Forestry Laws/Regulations and Responsible Institutions ............................................. 77 Box 9: Canon Mineiro and Transparency in Peru ............................................................................ 84 Box 10: Brazil and Participatory Budgeting ...................................................................................... 84 Box 11: South Africa and the Municipal Infrastructure Grant .................................................... 85 Box 12: EU Regional Aid Policy Setting a Maximum Level of Subsidy for Every Region in the European Union .................................................................................................................................... 89
6
List of Acronyms and Abbreviations ANDE Administración Nacional de Electricidad ACEPAR Aceros del Paraguay
bn Billion BRT Bus Rapid Transit CAF Corporación Andina de Fomento CPI Consumer Price Index EIB European Investment Bank FAO Food and Agriculture Organization of the United Nations FONACIDE Fondo Nacional de Inversión Pública y Desarrollo GDP Gross Domestic Product GWh Gigawatt Hour IB Itaipú Binacional IDB Inter-American Development Bank INFONA Instituto Forestal Nacional IPP Independent Power Producer IRR Internal Rate of Return JICA Japan International Cooperation Agency kV Kilovolt kWh Kilowatt Hour MAG Ministério de Agricultura y Ganadería MC Management Contract MW Megawatt MWh Megawatt Hour NPV Net Present Value NSIC National Strategy of Innovation for Competitiveness PPP Purchasing Power Parity REDIEX Red de Inversiones y Exportaciones RRT Resource Rent Tax RTA Rio Tinto Alcan
SAS Social Action Secretariat
SEAM Secretaría del Ambiente SFN Servicio Forestal Nacional SIAF Sistema Integrado de Administración Financeira SIN National Interconnected System SME Small and Medium Sized Enterprises TOE Tons of Oil Equivalent TWh Terawatt Hour U.S. United States VAT Value Added Tax VMME Vice Ministry of Mines and Energy WB World Bank
7
Executive Summary While Paraguay is known internationally for being the largest hydropower exporter in the world, the domestic economy suffers from regular outages and high system losses. Furthermore, electricity only constitutes around 15 percent of final energy demand. These problems need to be addressed to unlock Paraguay’s domestic economic potential. Electricity is also one of Paraguay’s pre-eminent exports, yet Paraguay does not reap the full benefits of its great endowment of hydroelectric power because Brazil systematically underpays for Paraguay’s electricity exports. In view of these challenges, the Government of Paraguay (the “Government”) has asked the Earth Institute to support the country in leveraging its hydropower potential for sustainable economic development. This report gives recommendations on a high-level hydro-based sustainable development strategy with the following pillars: (1) institutional reform and technical improvements of the domestic electricity sector; (2) drafting an industrial-strategy based on Paraguay’s comparative advantages and reliable access to clean energy at competitive prices; (3) more favorable and fairer pricing on Itaipú’s sales to Brazil; (4) devising a plan to transition to a green economy; and (5) ensuring that revenue collection and management systems are efficient to fund this strategy. All of the recommendations deserve more in-depth study and should only be considered as general guidance on the key issues. The problems of the electricity sector in Paraguay are addressed in Chapter 1. At the institutional level there is limited regulatory supervision of the monopoly state-owned power utility company Administración Nacional de Electricidad (ANDE). As a result, the power utility company does not face sufficient incentives to cut losses in the system, improve operational efficiency, and increase its low execution rates. Lack of coordination among Government institutions has not allowed for long-term planning of energy infrastructure investments. Furthermore, the electricity tariff decision is a political process rather than a reflection of long-term investment needs and maintenance and operating costs. System losses have increased steadily over the past decade from 21 percent in 1999 to 30.9 percent in 2012. This can be traced back to the lack of 500-kv transmission lines, high voltage fluctuations, improper load management and inadequate reactive compensation in substations. As the current transmission system has reached its maximum capacity and the backbone 220 kV transmission lines are carrying loads well above capacity, the infrastructure is operating close to its technical limits, causing frequent outages and shutdowns during peak consumption periods and/or adverse weather conditions. This is estimated to cost companies between 0.8-2 percent of annual sales. Further commercial losses are caused by electricity pilferage, errors in accounting and record keeping due to defective equipment and a low bill collection rate. To address the backbone capacity constraints, the Government is planning to build two 500kV transmission lines, which will connect the electricity sources to high demand regions. To reduce distribution losses, the Master Plan foresees to adapt the distances of the 23kV feeder lines and increase the number of substations. However, further
8
emphasis should be placed to reduce distribution losses, which account for 75 percent of total electric losses in the country. The creation of a Ministry of Energy in charge of monitoring the power utility company, as well as developing and coordinating the energy policy and strategy of the country would help to address the institutional and coordination problems. A performance/management contract between the Ministry of Energy and ANDE with clear objectives and performance indicators can serve as a tool to improve ANDE’s efficiency. Municipal zoning would help facilitate the electric infrastructure planning process. The Government could also consider outsourcing technical services at the distribution level to private sector companies and regulate these with performance contracts. This will increase bill collection rates and improve the performance of the distribution system. Advanced metering systems to medium and large consumers will optimize consumption patterns. The installation of Direct Load Control programs and introduction of dynamic pricing methods will reduce consumption during peak hours. Reliable access to clean electricity at competitive prices will help to unlock the potential of the domestic economy. This is the topic of Chapter 2. To guide future investments, an industrial strategy and policy could be drafted based on the comparative advantages the country has to offer and the goals the Government aims to achieve. In the short term, the agro-processing sector could be prioritized, seeing that it adds value to agricultural goods and has the potential to provide many employment opportunities. To diversify its economy, Paraguay could use the product-space or related methodologies to prioritize sectors within its industrial policy. It could also make use of spatial development corridor planning and place industrial parks along these corridors to provide improved infrastructure access to the manufacturing firms it aims to attract. The energy-intensive industries and particularly the aluminum-smelting sector do not by themselves create many employment opportunities, and linkages to the local economy are not guaranteed. In considering the sale of electricity to energy-intensive foreign investors such as the proposed Rio Tinto Alcan (RTA) aluminum smelter, the Government should be careful to consider the opportunity cost of the electricity. Unless there are truly significant spillovers from the RTA project, the proposed project should not pay significantly less in tariffs and taxes than Paraguay would receive from selling the electricity directly to Brazil or other foreign markets. We believe that such revenue losses are unlikely to be made up by significant non-monetary benefits such as employment creation and cross-sector linkages. If Government revenues from electricity exports are higher than from the RTA project, the Government could and should use the higher revenues to build up its infrastructure and human capital, both factors that are rated highly when foreign companies decide to invest. A better-educated workforce and lower infrastructure bottlenecks will incentivize investment in the future and hence create even more employment opportunities in the long run than a capital-intensive mega-investment such as the RTA. Countries that are successfully focusing on attracting mega-investments and building linkages are already advanced in terms of their infrastructure and human capital. The return and multiplier effect on improved infrastructure and education for Paraguay will likely be higher than the return on the RTA investment. Furthermore, with additional revenues, the Government can itself create jobs in the public sector such as health and education.
9
The decision of the Government to accept an RTA investment proposal is highly dependent on the expected post-Itaipú debt negotiation and the price that Paraguay can expect to receive from future electricity exports. Under current and anticipated aluminum prices, and given the business model of the aluminum industry, it is likely that the Government would need to sell its electricity to the smelter at a lower price than if it were exporting it to neighboring countries at the market price. We express our caution over any such arrangement. If the Government moves forward with the proposal, it is recommended that: (1) it accepts the project proposal only if Government revenues from the project are not significantly lower than the revenues it would receive from electricity exports; (2) it creates the right regulatory and business environment to attract downstream industries; (3) it includes local content provisions in the contract to establish technology upgrading and backward linkages to the local economy, (4) it requires the RTA to set up a training/business incubator program to help local SMEs meet the quality standards for goods and services to the smelter, and (5) it ensures that high environmental regulations are in place and adhered to.
The pricing of Paraguay’s electricity exports to Brazil is the topic of Chapter 3. The entire basis of the Itaipú project is a fair price (un precio justo) on electricity exports. We do not believe that Paraguay has been receiving a fair price, though we are optimistic that through transparent discussion of the issue with Brazil, such a price can be achieved. Paraguay’s neighbors, including but not limited to Brazil, are experiencing rapid increases in electricity demand, and at marginal generating costs that are typically far above the US$52.7/MWh (US¢5.27/kWh)2 that Brazil is currently paying Itaipú Binacional (IB) for the guaranteed electricity it is importing from Paraguay. Finally, we note that Paraguay will most likely absorb much or all of its current electricity capacity in its own domestic use within the next 25 years, moving from a large net exporter of electricity to a situation where domestic demand is roughly balanced with supply. This is even more reason not to commit Paraguay’s electricity potential to low-return projects. Within a hydro-based industrial and economic policy, the Government could consider building a green economic development strategy that will reduce Paraguay’s environmental footprint and focus on job creation, the topic of Chapter 4. In 2010, Paraguay’s petroleum import bill was above $1.5bn with an upward tendency. This cost could be reduced or even eliminated, most likely at a significant gain in net present value, by putting an electricity-based transport system in place for at least part of Paraguay’s needs. The Government could take the first step by basing its Pya’e Porâ Bus Rapid Transit (BRT) system on electricity-run buses, an option that should be examined by the Government in detail. This could be expanded to further corridors and planned railway projects. While the initial investment cost of an electricity-run public transport system is roughly 1.7 times higher than that of a petroleum-run one, the operating costs are about 6.5 times cheaper. The Net Present Vales (NPV) of the electricity-based system should therefore be lower, though a more specific follow-up analysis will be required to confirm this hypothesis.
2 Proyecto Planta de Aluminio y Complejo Inudstrial en Paraguay (PPT, Junio 2012)

10
Over time, there may also be the possibility of moving decisively to electric passenger vehicles, especially given that technological progress will lead to an accelerated decline in the cost of lightweight passenger vehicles for urban use. Investing in infrastructure for electric buses and cars can be a public investment that will infuse money into the economy and create employment opportunities. We recommend that the Government pursue the possibility of an initial deployment of electric vehicles in Asunción and other cities, with one or more international producers of such vehicles, on a competitive basis. In this report, we provide only rough estimates of the potential national savings and electricity demand of such a transition. We suspect that some of the international firms would be interested in supporting Paraguay’s investments in the needed infrastructure and early deployment of electric passenger vehicles. Stricter deforestation regulations and better enforcement mechanisms also need to be enacted to slow deforestation rates. Almost half of Paraguay’s domestic energy consumption is made up of biomass. In turn, 70 percent of this biomass is fuel wood and charcoal, making Paraguay the largest per capita producer of fuel wood in the region. It is estimated that 50,000 hectares, of which only 12 percent are managed/reforested areas, are cut down annually to satisfy its domestic fuel wood and charcoal demand. The main reason for this situation is the availability of fuel wood at a minimal cost of around US¢1.05/kWh versus an average electricity cost of US¢7.53/kWh. More stringent forestry regulation enforcement in Paraguay will drive up the price of fuel wood and charcoal, thereby incentivizing the private sector to switch to electricity as the main source of energy. For these initiatives the Government could benefit from obtaining REDD+ and other carbon-credits. To manage increased electricity revenues efficiently, better revenue management systems need to be put in place, which is the topic of Chapter 5. These should be transparent, incentive-oriented and closely monitored. The FONACIDE and Fundo Social programs have been set up to earmark electricity sale revenues from Itaipú for infrastructure and social projects. This is forward looking and commendable. However, as the departmental and municipal budgets are not connected to the central financial administration system at a sufficiently disaggregated level, it is difficult for the central Government to monitor expenditures. The local population is also unable to hold local governments accountable, as there is a lack of participatory local development planning and little information available regarding the allocation of electricity revenues. Because these funds are distributed to departments and municipalities without taking into account tax collection and spending efficiency, there is no incentive to increase tax collection. Requiring local development plans, insisting on publishing these plans, contracts and funds online and rewarding departmental/municipal governments for improved tax collection and successful project implementation could help reduce inefficiencies at the decentralized level. At a central level, it is recommended that electricity revenues primarily be spent on public investments in health, education and infrastructure. The Government pays its public servants relatively high wages, but does not reap the benefits of quality public administration services. Designing a Fiscal Responsibility Law, as the Government is considering, will help in part with this issue and lead to more predictable and credible fiscal policies, improving governance and transparency and creating greater commitment among local governments to improve fiscal discipline.

11
Prospective increases in electricity revenues should also not deter the Government from continuing to increase the tax burden. Since the 2004 tax reform, the Government has tripled its tax collection rate by increasing its tax base (formalizing its economy). This has been achieved by reducing the corporate income tax from 30 percent to 10 percent.3 The 10 percent flat tax the Government of Paraguay currently has in place for value-added (with the exception of food and drugs), personal income and corporate income taxes, as well as the excessive fiscal incentives offered to investors, is not sufficient to provide the Government with the revenues needed for an adequate level of public investments.
There is, in short, room to increase taxes to invest in infrastructure and human capital. These investments are paramount for sustainable inclusive growth and diversification of the economy. To guide Government spending, we recommend that Paraguay adopt a 20-year strategic plan for the country, which can be developed in close cooperation with the broad public and expert communities. Targets could be set for all aspects of importance to the Paraguayan people, including education and training, health, social equity, infrastructure, the environment, and economic development. These targets could be financed by a Medium Term Expenditure Framework that would ensure improved fiscal discipline, greater budgetary predictability for line ministries, more efficient use of public resources, greater political accountability for public expenditure outcomes through more legitimate decision-making processes and greater credibility of budgetary decision-making.
3 Ministry of Finance (April 2013): Tax system analysis and outlook
12
Introduction The Government of Paraguay has embarked on a plan to leverage its currently exported electricity to unlock the potential of its domestic economy. In this context, the Ministry of Finance has approached the Earth Institute to advise on an energy strategy spurring industrial and economic development. The report is divided into five chapters. The first chapter will assess Paraguay’s electricity sector and ANDE’s 10-year Master Plan. It provides policy recommendations at both the institutional and technical level. Paraguay can only unlock its energy potential for local development once it addresses the crisis that the electricity sector is facing. The second chapter addresses how the economy and particularly the manufacturing sector will benefit from reliable access to electricity at competitive prices. It suggests a potential methodology the Government could use to draft an industrial policy in order to guide future investments. Particular focus is placed on energy intensive industries given that Paraguay received a proposal from Rio Tinto Alcan (RTA) to invest in an aluminum smelter. This investment proposal is used as an example to show the type of analysis the Government should undertake before accepting such energy intensive mega-projects. The third chapter assesses whether the price at which Paraguay exports electricity to Brazil from the Itaipú dam can be considered fair. This is done by comparing historical market prices in Brazil with the payments it made for Paraguay’s electricity during those periods. To estimate the excess electricity that Paraguay is likely to export in the future, domestic supply and demand projections are made. As the price of future exports should be determined by the regional electricity market, neighboring country power supply and demand projections are also made. This analysis will provide the Government with a framework for Itaipú tariff negotiations going forward. The fourth chapter proposes how, within a hydro-based industrial and economic policy, the Government could develop a green economic development strategy that will reduce Paraguay’s environmental footprint. The costs and benefits of transforming Paraguay’s transport sector from a fuel-based system to an electricity-based one are assessed. The importance of decreasing Paraguay’s charcoal and fuel wood consumption from an ecological and health perspective are highlighted, and the resulting electricity demand from substituting the energy sources in these two sectors are estimated. The fifth and final chapter of this Report provides recommendations on how to better manage electricity revenues going forward and suggests a planning framework that could help the country reach the ultimate goal of economic diversification and long-term sustainable development.

13
1. The Domestic Electricity Sector This chapter is divided into five sections. The first section analyzes the current electricity situation in Paraguay by providing an overview of the power sources, domestic supply and demand, generation costs, and electricity tariffs. The second section highlights the institutional constraints and technical issues the sector faces. The projected electricity demand and the electricity Master Plan are the topic of the third section. The fourth section provides recommendations on how the Government can address the problems of Paraguay’s electricity sector and fill the gaps identified in the energy strategy, before summarizing the chapter’s findings in the fifth section.
1.1 Current Situation 1.1.1 Capacity and power sources
Paraguay is a country with some of the highest hydroelectric power potential per capita in the world. It has been estimated to have the resources to produce 130 TWh/year of hydroelectric power, of which 101 TWh/year are thought to be economically exploitable.4 Nearly all of Paraguay’s electricity comes from three hydropower plants located on the Parana River. Most of its 8,816MW of nominal generation capacity comes from the Acaray dam (210 MW) and two bi-national hydropower plants, Itaipú and Yacyretá. The Itaipú dam is jointly- owned and operated with Brazil (7,000 MW for each country), while Yacyretá is a bi-national project with Argentina (1,600 MW for each country). Table 1: Paraguay’s Power Sources
Source: CRU report, 2011 1.1.2 Domestic supply
Hydropower represents 99.99 percent of the electricity supplied in the country. Most of this hydropower is purchased from the two bi-national hydroelectric entities of Itaipú and Yacyretá.
4 http://www.worldenergy.org/documents/hydro_country_notes.pdf
Nominal
(MW)
Nominal Paraguay
(MW)
Real Paraguay
(MW)
Energy available
(GWh/year)
Itaipu Hydro 14,000.0 7,000.0 6,067.5 45,179.0 82.6%
Yacyreta Hydro 3,200.0 1,600.0 1,440.0 8,578.0 15.7%
Acaray Hydro 210.0 210.0 210.0 901.0 1.6%
Others Thermal 6.1 6.1 6.1 27.0 0.0%
Total 17,416.1 8,816.1 7,723.6 54,685.0
14
Table 2: Electricity Supply
GWh (2011) % Generated Acaray 949.9 8.5 Thermal 0.9 0.0 Total generated 950.8 8.5 Bought Itaipú 8,036.0 72.0 Yacyretá 2,174.6 19.2 Total bought 10,210.6 91.5 Total supply 11,161.4 100.0 Domestic use 11.020.7 98.7 Sale to EBISA (Argentina) 140.8 1.3 Source: ANDE, Resumen Estadístico 2011
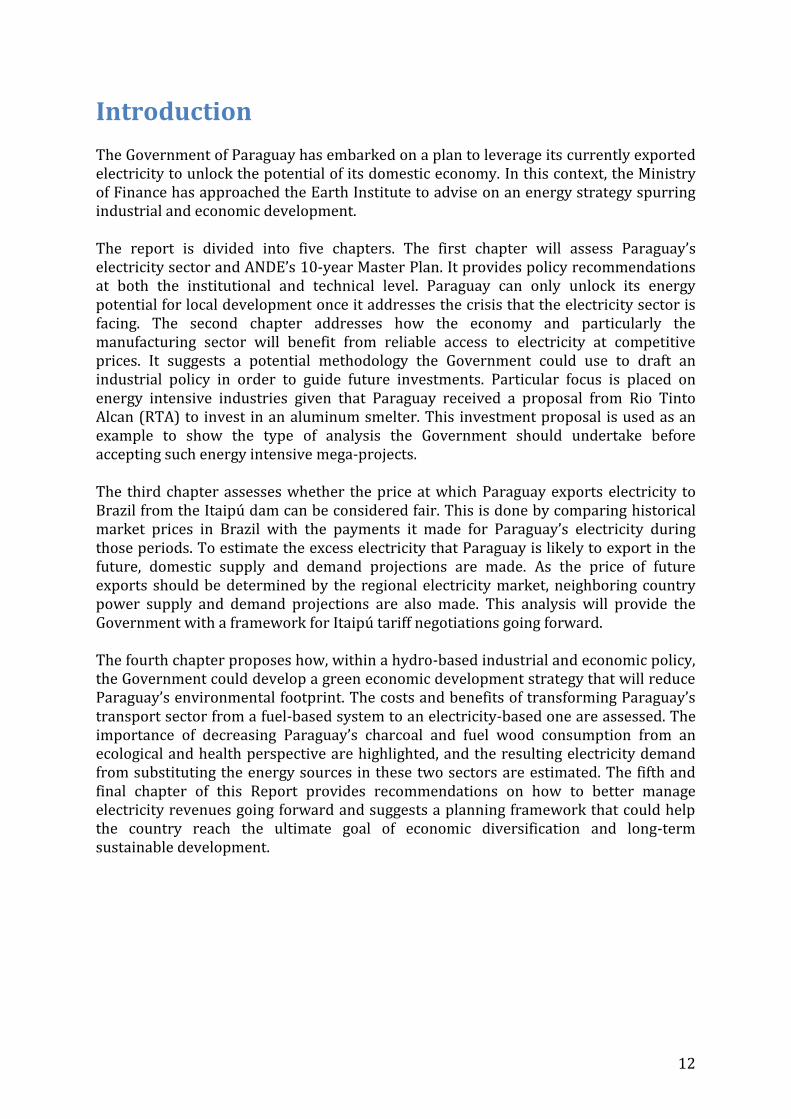
1.1.3 Demand Electricity coverage expanded rapidly over the last decade and reached 98 percent of all households in 2009,5 up from 84 percent in 2001.6 Residential use is the main driver of electricity consumption (42.3 percent), ahead of industrial use (22.6 percent) and commercial use (18.6 percent).7 Table 3: Electricity Demand GWh (2011) %
Residential 3,205.0 42.3 Commercial 1,404.8 18.6 Industrial 1,709.5 22.6 General 592.3 7.8 Government 489.3 6.5 Street lights 169.7 2.2 Average (domestic use) 7,570.5 100.0 Exportation 135.9 ANDE consumption 12.9 Total 7,719.2
Source: ANDE, Resumen Estadístico 2011
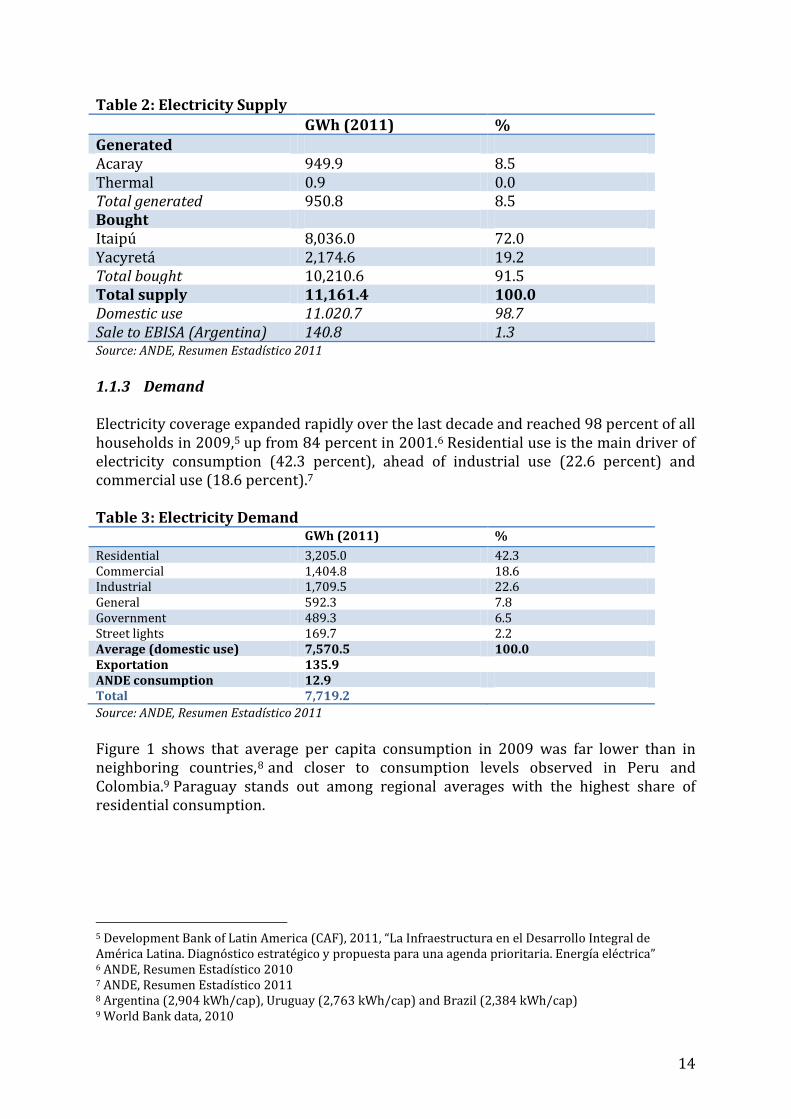
Figure 1 shows that average per capita consumption in 2009 was far lower than in neighboring countries,8 and closer to consumption levels observed in Peru and Colombia.9 Paraguay stands out among regional averages with the highest share of residential consumption.
5 Development Bank of Latin America (CAF), 2011, “La Infraestructura en el Desarrollo Integral de América Latina. Diagnóstico estratégico y propuesta para una agenda prioritaria. Energía eléctrica” 6 ANDE, Resumen Estadístico 2010 7 ANDE, Resumen Estadístico 2011 8 Argentina (2,904 kWh/cap), Uruguay (2,763 kWh/cap) and Brazil (2,384 kWh/cap) 9 World Bank data, 2010
15
Figure 1: Electricity Consumption in Paraguay Compared to the Region
Source: International Energy Agency (2009 data) and World Bank (2009 population data)
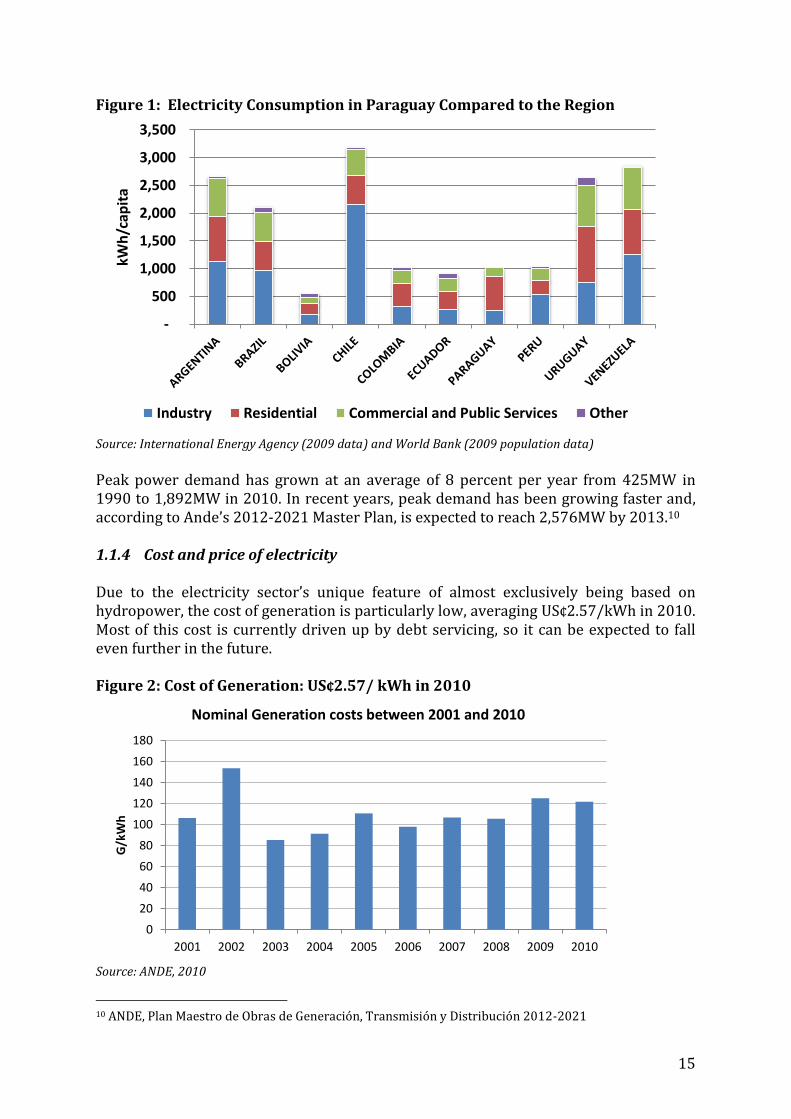
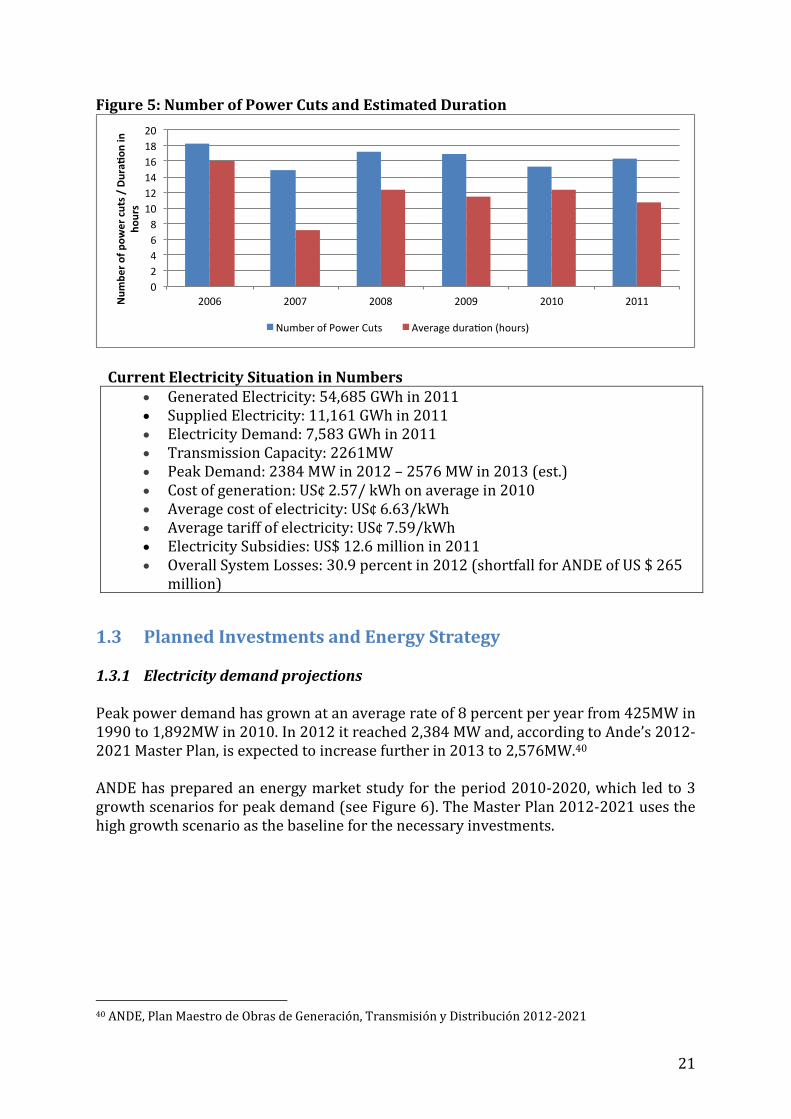
Peak power demand has grown at an average of 8 percent per year from 425MW in 1990 to 1,892MW in 2010. In recent years, peak demand has been growing faster and, according to Ande’s 2012-2021 Master Plan, is expected to reach 2,576MW by 2013.10 1.1.4 Cost and price of electricity Due to the electricity sector’s unique feature of almost exclusively being based on hydropower, the cost of generation is particularly low, averaging US¢2.57/kWh in 2010. Most of this cost is currently driven up by debt servicing, so it can be expected to fall even further in the future. Figure 2: Cost of Generation: US¢2.57/ kWh in 2010
Source: ANDE, 2010
10 ANDE, Plan Maestro de Obras de Generación, Transmisión y Distribución 2012-2021
-
500
1,000
1,500
2,000
2,500
3,000
3,500kW
h/c
apit
a
Industry Residential Commercial and Public Services Other
0
20
40
60
80
100
120
140
160
180
2001 2002 2003 2004 2005 2006 2007 2008 2009 2010
G/k
Wh
Nominal Generation costs between 2001 and 2010
16
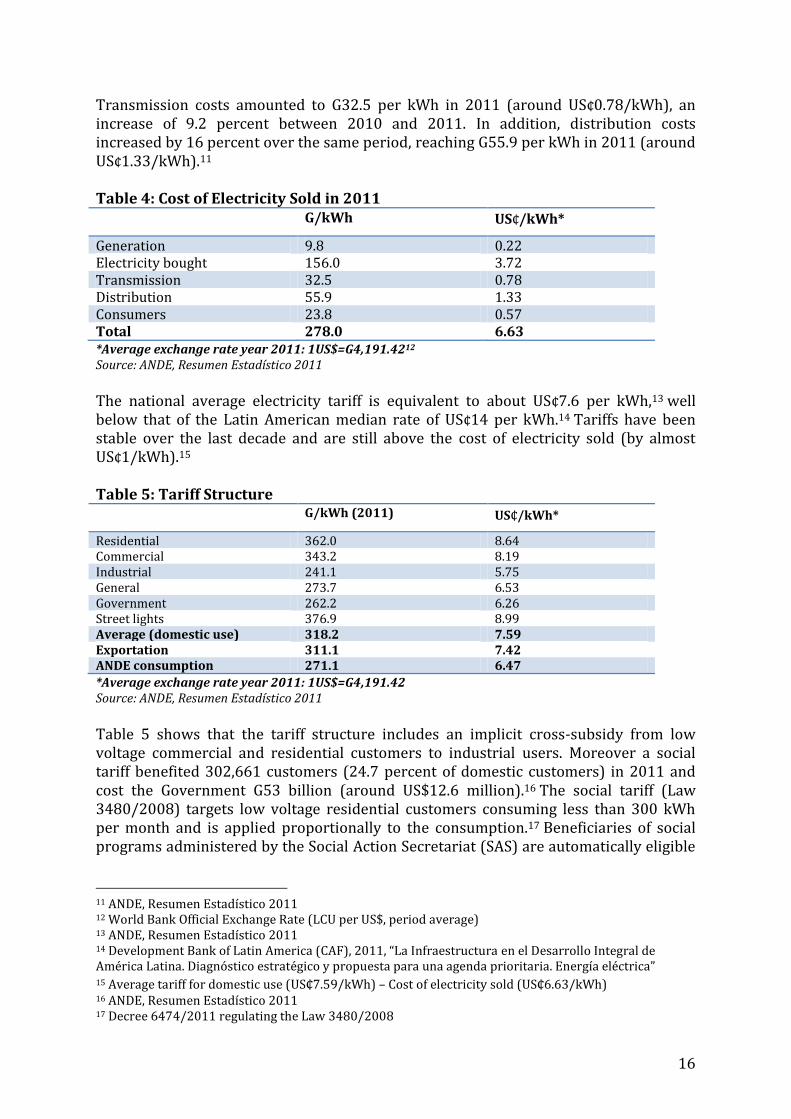
Transmission costs amounted to G32.5 per kWh in 2011 (around US¢0.78/kWh), an increase of 9.2 percent between 2010 and 2011. In addition, distribution costs increased by 16 percent over the same period, reaching G55.9 per kWh in 2011 (around US¢1.33/kWh).11 Table 4: Cost of Electricity Sold in 2011
G/kWh US¢/kWh*
Generation 9.8 0.22 Electricity bought 156.0 3.72 Transmission 32.5 0.78 Distribution 55.9 1.33 Consumers 23.8 0.57 Total 278.0 6.63 *Average exchange rate year 2011: 1US$=G4,191.4212 Source: ANDE, Resumen Estadístico 2011
The national average electricity tariff is equivalent to about US¢7.6 per kWh,13 well below that of the Latin American median rate of US¢14 per kWh.14 Tariffs have been stable over the last decade and are still above the cost of electricity sold (by almost US¢1/kWh).15 Table 5: Tariff Structure G/kWh (2011) US¢/kWh*
Residential 362.0 8.64 Commercial 343.2 8.19 Industrial 241.1 5.75 General 273.7 6.53 Government 262.2 6.26 Street lights 376.9 8.99 Average (domestic use) 318.2 7.59 Exportation 311.1 7.42 ANDE consumption 271.1 6.47
*Average exchange rate year 2011: 1US$=G4,191.42 Source: ANDE, Resumen Estadístico 2011
Table 5 shows that the tariff structure includes an implicit cross-subsidy from low voltage commercial and residential customers to industrial users. Moreover a social tariff benefited 302,661 customers (24.7 percent of domestic customers) in 2011 and cost the Government G53 billion (around US$12.6 million).16 The social tariff (Law 3480/2008) targets low voltage residential customers consuming less than 300 kWh per month and is applied proportionally to the consumption.17 Beneficiaries of social programs administered by the Social Action Secretariat (SAS) are automatically eligible
11 ANDE, Resumen Estadístico 2011 12 World Bank Official Exchange Rate (LCU per US$, period average) 13 ANDE, Resumen Estadístico 2011 14 Development Bank of Latin America (CAF), 2011, “La Infraestructura en el Desarrollo Integral de América Latina. Diagnóstico estratégico y propuesta para una agenda prioritaria. Energía eléctrica” 15 Average tariff for domestic use (US¢7.59/kWh) – Cost of electricity sold (US¢6.63/kWh) 16 ANDE, Resumen Estadístico 2011 17 Decree 6474/2011 regulating the Law 3480/2008

17
for the social tariff.18 Households can apply to benefit from the tariff if they present an affidavit justifying their low level of income.19 Table 6: Social Tariff Structure and Beneficiaries
Household consumption Discount rate on electricity tariff
Beneficiaries
0 – 100 kWh per month 75 percent 199,369 101 – 200 kWh per month 50 percent 82,387 201 – 300 kWh per month 25 percent 20,905 Total 302,661
Sources: ANDE, Resumen Estadístico 2011 and Decree 6474/2011 regulating the Law 3480/2008
Figure 3 shows that the highest percentage of residential customers benefiting from the social tariff in 201020 were in the North and Central provinces21 where the majority of the poorest population lives. Figure 3: Distribution of the Social Tariff by Region
Source: ANDE, 2010
Given the cost of electricity subsidies of around US$ 12.6 million,22 there is a need to closely monitor the beneficiaries’ willingness to pay as well as constantly adjusting the level of the subsidies to the purchasing power of the beneficiaries. The social tariff and cross-subsidy from low voltage commercial and residential customers to industrial users also increases the risk of ANDE not charging a tariff that is on average at cost-recovery-level, which takes into account the total cost of electricity supply plus investments necessary to expand and improve electricity supply. A regular technical
18 Vice-Ministério de Minas y Energía, 2011, Informe de Gestion al 16 de Junio de 2011 19 Decree 6474/2011 regulating the Law 3480/2008 20 ANDE, Resumen Estadístico 2010 21 The North region includes the departments of San Pedro and Concepción, the Central region includes the departments of Caaguazú, Caazapá, Guairá and Paraguay. 22 ANDE, Resumen Estadístico 2011
18
evaluation of the tariff level is crucial to ensure that tariffs are always set at the adequate level.
1.2 Problems Faced by the Electricity Sector 1.2.1 Institutional constraints Paraguay’s state-owned power utility company - Administración Nacional de Electricidad (ANDE) – is solely in charge of generation, transmission and distribution of electricity within the country. There is a lack of incentives for ANDE to cut losses in the system and increase operational efficiency. Its execution rates are low23 and collection performance is estimated at only 70 percent.24 Given the low cost of generation and the way tariffs are set in Paraguay,25 the operational margin ANDE currently generates is a surplus. However, this is transferred to the Ministry of Finance and hence ANDE does not benefit from higher operating margins. Although ANDE is a financially sound public utility company with good technical capacity, its financial ratios may deteriorate if it does not improve its distribution and collection performance. To keep tariffs at competitive levels, investing in the transmission and distribution system, as well as improving the distribution management system are key to sustain ANDE’s financial performance. The Ministry of Finance has recently set up a monitoring unit for public enterprises and consequently the scope of control of the Ministry of Finance over the public entities has improved.26 The second major institutional constraint in the electricity sector is the lack of coordination during the planning phase for future investments. While the Vice Ministry of Mines and Energy (VMME) is responsible for the nationwide energy sector strategy, there is little coordination with ANDE’s Master Plan for the electricity sector. The VMME is meant to be driving the planning process but has significant financing constraints. It receives a budget of US$1.5 million out of the total Ministry’s budget of US$1 billion27 and therefore has neither the capacity, nor the financial means to effectively design and implement a nationwide energy policy in coordination with the other Ministries. ANDE’s size (3,755 staff in 201128) and influence allow the public utility company direct access to Government executives, thereby bypassing the Ministry. The US$2,573 million29 required to finance the planned investments in the electric system over the 2012-2021 time period will be directly paid out to ANDE and not channeled through the VMME.30
23 Meetings in Asuncion with various stakeholders 24 World Bank, 2010, Project Appraisal Document for the Energy Sector Strengthening Project, Report No: 57459-PY 25 While ANDE proposes a yearly tariff rate, this needs to be approved by the National Economic Team, which consists of the Central Bank and the Ministries of Public Works and Communications, Finance, Agriculture and Livestock, Commerce and Industry. Therefore, the electricity tariff decision becomes highly politicized rather than reflecting the true operation costs and investments needs. 26 Meeting with the Ministry of Finance 27 Meeting at the Vice Ministry of Mines and Energy with Ing. Hugo A. Cacace A., Vice Minister, 12 February 2013 28 ANDE, Resumen Estadístico 2011 29 ANDE Master Plan 30 Meeting with ANDE

19
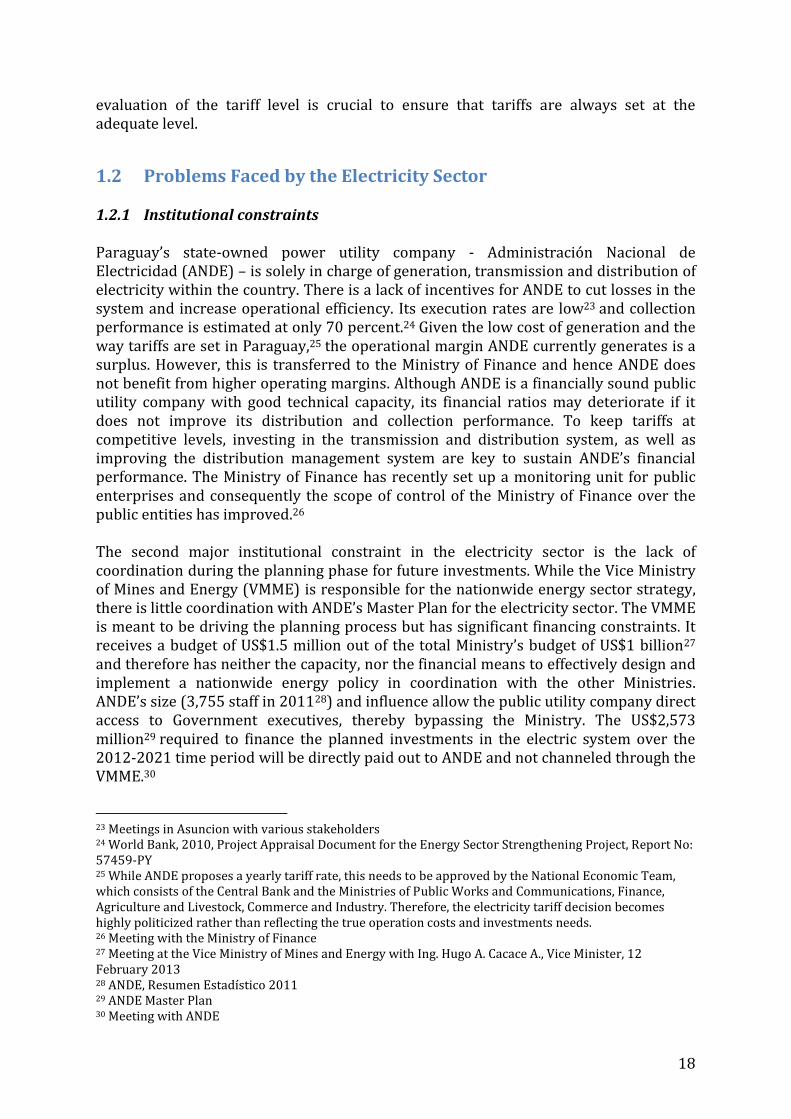
1.2.2 Technical problems The electric system lacks high-voltage transmission lines. The National Interconnected System (SIN) heavily relies on a backbone network of 4,090 km of 220 kV transmission lines, complemented by 1,409 km of 66 kV transmission lines and 70 transmission substations. With only 16 km of 500 kV transmission lines and 0.002 km of 500kV transmission lines per GWh produced, Paraguay has the lowest transmission line ratio in the region (0.066 km/GWh in Brazil, 0.089 in Argentina and 0.079 in Uruguay).31 With this configuration, the reliability of the power supply is highly vulnerable to failures in the transmission system. System losses remain very high (30.9 percent in 2012) and represent a revenue loss estimated at US$266 million per year. These losses have increased steadily over the past decade, from 21 percent in 1999 to 34.5 percent in 2009. A US$100 million loss reduction program launched in 2006 and co-financed by the Inter-American Development Bank (IDB) has helped to reduce system losses to 31.1 percent in 2011 and 30.9 percent in 2012. These overall system losses, split between transmission losses (around 7.6 percent in 2010 and 2011), technical distribution losses and non-technical distribution losses (around 23.5 percent in 2011 equally split32), remain very high and well above the 13.5 percent weighted average for Latin America and the Caribbean region,33 as shown in Figure 4. These are only estimates since ANDE has no reliable metering system in place to measure losses at different voltage levels and in different geographical locations. Given that transmission losses have been estimated at 840,186 MWh in 2011,34 and account for 24 percent of total electric system losses, total system losses represent an estimated revenue shortfall of US$266 million per year for ANDE35. There are many reasons that can explain these excessive losses in Paraguay’s transmission and distribution network. The lack of 500 kV transmission lines and the long distances (about 300km) from the hydroelectric plants to Asunción metropolitan area, which is the main load center in the country, result in voltage fluctuations. Under-investment in the electricity grid has resulted in overloading the distribution system with too many stages of transformation, improper load management and inadequate reactive compensation in substations. Over the last years, it appears to us that emphasis has been placed on increasing household access to the grid in rural areas and low-income urban areas through long 11kV low-tension lines and haphazard sub-transmission/distribution systems. Moreover, since resistive losses in transmission lines are proportional to the square of power flows, periods of peak demand make a disproportionately large contribution to overall losses. As a result, electric power transmission and distribution losses have more than doubled in the last decade (+119 percent), increasing at a faster pace than electricity consumption (only 42 percent).36
31 CRU report, 2011 32 World Bank, 2010, Project Appraisal Document for the Energy Sector Strengthening Project, Report No: 57459-PY 33 World Bank, 2010, Project Appraisal Document for the Energy Sector Strengthening Project, Report No: 57459-PY 34 ANDE, Resumen Estadístico 2011 35 Using the average domestic tariff of US¢7.59/kWh 36 World Bank data, 2000-2009
20
Figure 4: Annual Electricity Sales and Distribution Losses in 2005
Source: World Bank, Benchmarking Data of the Electricity Dist. Sec in LAC 95-05
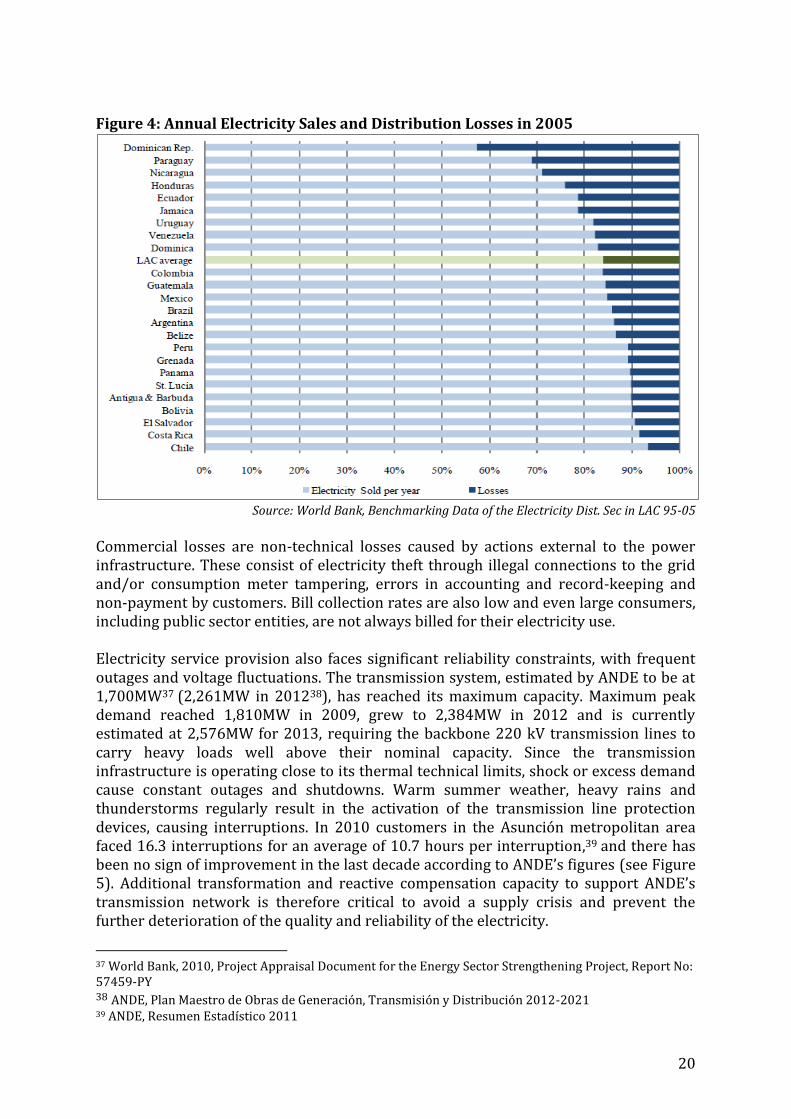
Commercial losses are non-technical losses caused by actions external to the power infrastructure. These consist of electricity theft through illegal connections to the grid and/or consumption meter tampering, errors in accounting and record-keeping and non-payment by customers. Bill collection rates are also low and even large consumers, including public sector entities, are not always billed for their electricity use. Electricity service provision also faces significant reliability constraints, with frequent outages and voltage fluctuations. The transmission system, estimated by ANDE to be at 1,700MW37 (2,261MW in 201238), has reached its maximum capacity. Maximum peak demand reached 1,810MW in 2009, grew to 2,384MW in 2012 and is currently estimated at 2,576MW for 2013, requiring the backbone 220 kV transmission lines to carry heavy loads well above their nominal capacity. Since the transmission infrastructure is operating close to its thermal technical limits, shock or excess demand cause constant outages and shutdowns. Warm summer weather, heavy rains and thunderstorms regularly result in the activation of the transmission line protection devices, causing interruptions. In 2010 customers in the Asunción metropolitan area faced 16.3 interruptions for an average of 10.7 hours per interruption,39 and there has been no sign of improvement in the last decade according to ANDE’s figures (see Figure 5). Additional transformation and reactive compensation capacity to support ANDE’s transmission network is therefore critical to avoid a supply crisis and prevent the further deterioration of the quality and reliability of the electricity.
37 World Bank, 2010, Project Appraisal Document for the Energy Sector Strengthening Project, Report No: 57459-PY 38 ANDE, Plan Maestro de Obras de Generación, Transmisión y Distribución 2012-2021 39 ANDE, Resumen Estadístico 2011
21
Figure 5: Number of Power Cuts and Estimated Duration
Current Electricity Situation in Numbers Generated Electricity: 54,685 GWh in 2011
Supplied Electricity: 11,161 GWh in 2011
Electricity Demand: 7,583 GWh in 2011
Transmission Capacity: 2261MW
Peak Demand: 2384 MW in 2012 – 2576 MW in 2013 (est.) Cost of generation: US¢ 2.57/ kWh on average in 2010
Average cost of electricity: US¢ 6.63/kWh Average tariff of electricity: US¢ 7.59/kWh Electricity Subsidies: US$ 12.6 million in 2011
Overall System Losses: 30.9 percent in 2012 (shortfall for ANDE of US $ 265 million)
1.3 Planned Investments and Energy Strategy 1.3.1 Electricity demand projections Peak power demand has grown at an average rate of 8 percent per year from 425MW in 1990 to 1,892MW in 2010. In 2012 it reached 2,384 MW and, according to Ande’s 2012-2021 Master Plan, is expected to increase further in 2013 to 2,576MW.40 ANDE has prepared an energy market study for the period 2010-2020, which led to 3 growth scenarios for peak demand (see Figure 6). The Master Plan 2012-2021 uses the high growth scenario as the baseline for the necessary investments.
40 ANDE, Plan Maestro de Obras de Generación, Transmisión y Distribución 2012-2021
22
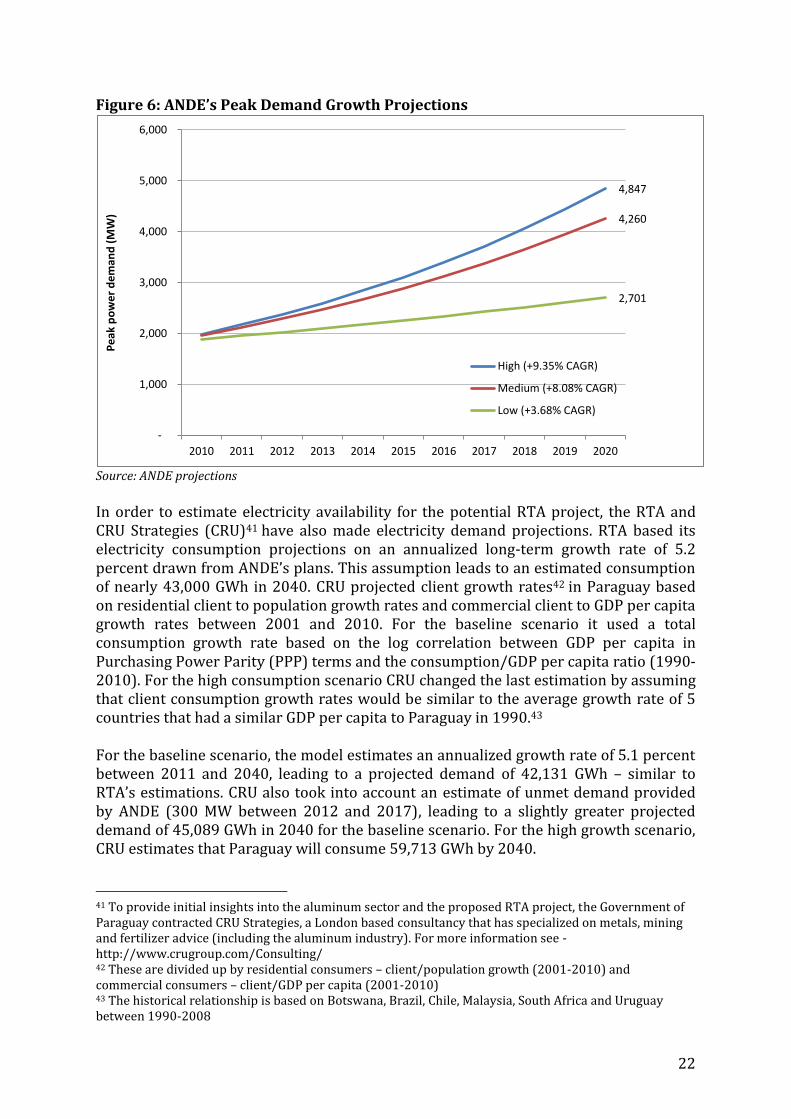
Figure 6: ANDE’s Peak Demand Growth Projections
Source: ANDE projections
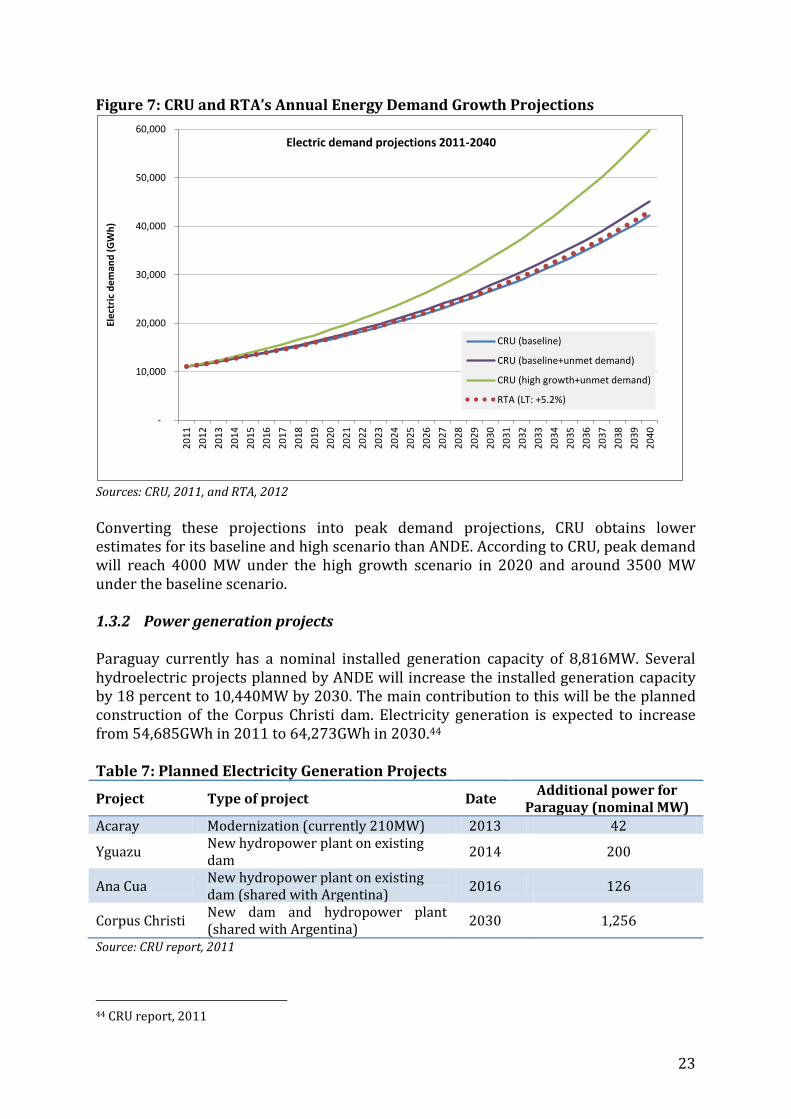
In order to estimate electricity availability for the potential RTA project, the RTA and CRU Strategies (CRU)41 have also made electricity demand projections. RTA based its electricity consumption projections on an annualized long-term growth rate of 5.2 percent drawn from ANDE’s plans. This assumption leads to an estimated consumption of nearly 43,000 GWh in 2040. CRU projected client growth rates42 in Paraguay based on residential client to population growth rates and commercial client to GDP per capita growth rates between 2001 and 2010. For the baseline scenario it used a total consumption growth rate based on the log correlation between GDP per capita in Purchasing Power Parity (PPP) terms and the consumption/GDP per capita ratio (1990-2010). For the high consumption scenario CRU changed the last estimation by assuming that client consumption growth rates would be similar to the average growth rate of 5 countries that had a similar GDP per capita to Paraguay in 1990.43 For the baseline scenario, the model estimates an annualized growth rate of 5.1 percent between 2011 and 2040, leading to a projected demand of 42,131 GWh – similar to RTA’s estimations. CRU also took into account an estimate of unmet demand provided by ANDE (300 MW between 2012 and 2017), leading to a slightly greater projected demand of 45,089 GWh in 2040 for the baseline scenario. For the high growth scenario, CRU estimates that Paraguay will consume 59,713 GWh by 2040.
41 To provide initial insights into the aluminum sector and the proposed RTA project, the Government of Paraguay contracted CRU Strategies, a London based consultancy that has specialized on metals, mining and fertilizer advice (including the aluminum industry). For more information see - http://www.crugroup.com/Consulting/ 42 These are divided up by residential consumers – client/population growth (2001-2010) and commercial consumers – client/GDP per capita (2001-2010) 43 The historical relationship is based on Botswana, Brazil, Chile, Malaysia, South Africa and Uruguay between 1990-2008
4,847
4,260
2,701
-
1,000
2,000
3,000
4,000
5,000
6,000
2010 2011 2012 2013 2014 2015 2016 2017 2018 2019 2020
Pe
ak p
ow
er
de
man
d (
MW
)
High (+9.35% CAGR)
Medium (+8.08% CAGR)
Low (+3.68% CAGR)
23
Figure 7: CRU and RTA’s Annual Energy Demand Growth Projections
Sources: CRU, 2011, and RTA, 2012
Converting these projections into peak demand projections, CRU obtains lower estimates for its baseline and high scenario than ANDE. According to CRU, peak demand will reach 4000 MW under the high growth scenario in 2020 and around 3500 MW under the baseline scenario. 1.3.2 Power generation projects Paraguay currently has a nominal installed generation capacity of 8,816MW. Several hydroelectric projects planned by ANDE will increase the installed generation capacity by 18 percent to 10,440MW by 2030. The main contribution to this will be the planned construction of the Corpus Christi dam. Electricity generation is expected to increase from 54,685GWh in 2011 to 64,273GWh in 2030.44 Table 7: Planned Electricity Generation Projects
Project Type of project Date Additional power for
Paraguay (nominal MW) Acaray Modernization (currently 210MW) 2013 42
Yguazu New hydropower plant on existing dam
2014 200
Ana Cua New hydropower plant on existing dam (shared with Argentina)
2016 126
Corpus Christi New dam and hydropower plant (shared with Argentina)
2030 1,256
Source: CRU report, 2011
44 CRU report, 2011
-
10,000
20,000
30,000
40,000
50,000
60,000
20
11
20
12
20
13
20
14
20
15
20
16
20
17
20
18
20
19
20
20
20
21
20
22
20
23
20
24
20
25
20
26
20
27
20
28
20
29
20
30
20
31
20
32
20
33
20
34
20
35
20
36
20
37
20
38
20
39
20
40
Ele
ctri
c d
em
and
(G
Wh
)
Electric demand projections 2011-2040
CRU (baseline)
CRU (baseline+unmet demand)
CRU (high growth+unmet demand)
RTA (LT: +5.2%)
24
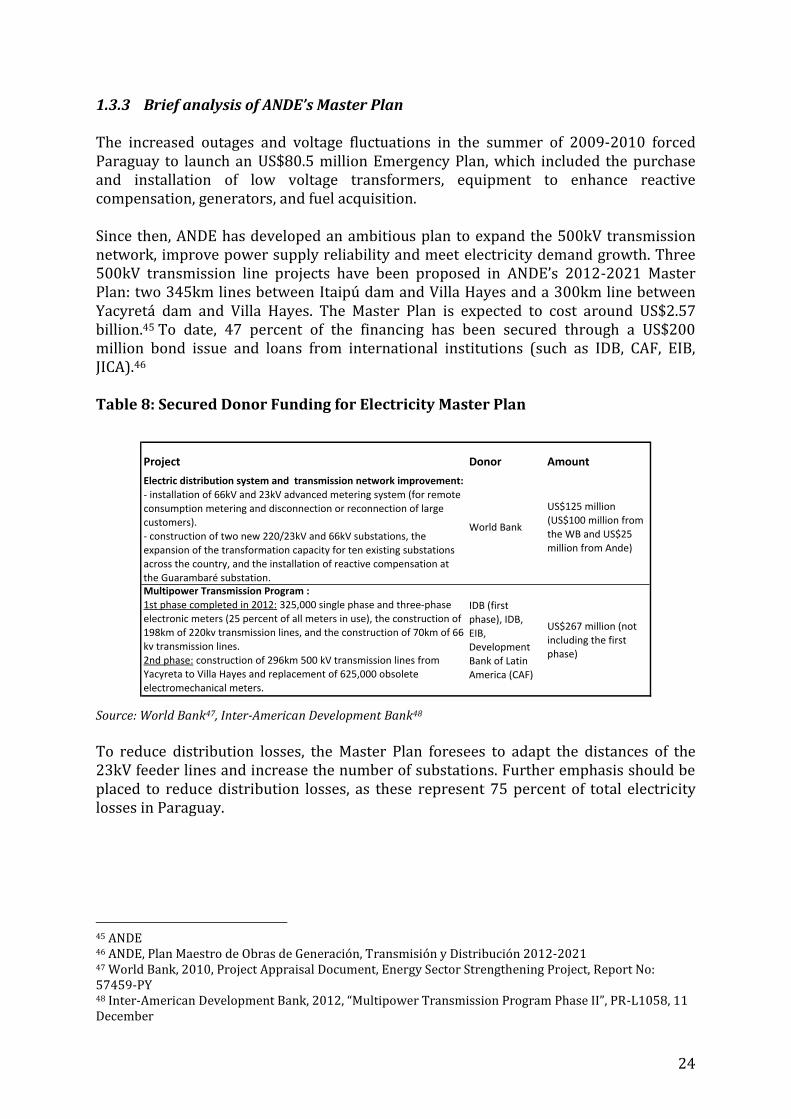
1.3.3 Brief analysis of ANDE’s Master Plan The increased outages and voltage fluctuations in the summer of 2009-2010 forced Paraguay to launch an US$80.5 million Emergency Plan, which included the purchase and installation of low voltage transformers, equipment to enhance reactive compensation, generators, and fuel acquisition. Since then, ANDE has developed an ambitious plan to expand the 500kV transmission network, improve power supply reliability and meet electricity demand growth. Three 500kV transmission line projects have been proposed in ANDE’s 2012-2021 Master Plan: two 345km lines between Itaipú dam and Villa Hayes and a 300km line between Yacyretá dam and Villa Hayes. The Master Plan is expected to cost around US$2.57 billion.45 To date, 47 percent of the financing has been secured through a US$200 million bond issue and loans from international institutions (such as IDB, CAF, EIB, JICA).46 Table 8: Secured Donor Funding for Electricity Master Plan
Source: World Bank47, Inter-American Development Bank48
To reduce distribution losses, the Master Plan foresees to adapt the distances of the 23kV feeder lines and increase the number of substations. Further emphasis should be placed to reduce distribution losses, as these represent 75 percent of total electricity losses in Paraguay.
45 ANDE 46 ANDE, Plan Maestro de Obras de Generación, Transmisión y Distribución 2012-2021 47 World Bank, 2010, Project Appraisal Document, Energy Sector Strengthening Project, Report No: 57459-PY 48 Inter-American Development Bank, 2012, “Multipower Transmission Program Phase II”, PR-L1058, 11 December
Project Donor Amount
Electricdistributionsystemandtransmissionnetworkimprovement:-installationof66kVand23kVadvancedmeteringsystem(forremoteconsumptionmeteringanddisconnectionorreconnectionoflargecustomers).-constructionoftwonew220/23kVand66kVsubstations,theexpansionofthetransformationcapacityfortenexistingsubstationsacrossthecountry,andtheinstallationofreactivecompensationattheGuarambarésubstation.
WorldBank
US$125million(US$100millionfromtheWBandUS$25millionfromAnde)
MultipowerTransmissionProgram:1stphasecompletedin2012:325,000singlephaseandthree-phaseelectronicmeters(25percentofallmetersinuse),theconstructionof198kmof220kvtransmissionlines,andtheconstructionof70kmof66kvtransmissionlines.2ndphase:constructionof296km500kVtransmissionlinesfromYacyretatoVillaHayesandreplacementof625,000obsoleteelectromechanicalmeters.
IDB(firstphase),IDB,EIB,DevelopmentBankofLatinAmerica(CAF)
US$267million(notincludingthefirstphase)

25
1.4 Overcoming the Problems Identified Above 1.4.1 Institutional recommendations The creation of a strong Ministry of Energy should help define a better-integrated strategy for the energy sector. With a greater budget allocation, the Ministry should have the financial means to drive public investment in the energy sector, coordinate with ANDE to elaborate the electricity Master Plan taking into account national energy policies (including strategy for biomass and hydrocarbons), and have better integrated projections. ANDE’s current Master Plan, for instance, does not take into account policies that might be in place to reduce biomass consumption or to promote energy efficiencies. A performance contract between the Ministry of Energy and ANDE could be signed, setting out the performance objectives expected from the utility company. Performance contracts are written agreements clarifying objectives and motivating managers to achieve them. The scope of such contracts generally includes tariffs, investments, subsidies, social objectives, and funding.
Performance indicators can be designed to reward good managerial performance and sanction non-performance.49 According to the World Bank, performance indicators could include: net income, return on assets, debt and equity ratios, interest cover, dividend policy, productivity improvements, customer satisfaction indexes, connection targets, human resource issues, procurement policy, and environmental adherence. However, it should be noted that performance contracts are not the solution to all problems and can be defeated by politics. They should therefore only be used if the Government is willing “to deal with the challenges of information asymmetry, effective incentives, and credible commitments.”50
Increasing incentives in the distribution sector could improve bill collection rates and system performance. Given the characteristics of the electricity sector in Paraguay, addressing the deficiencies in this sector are paramount to curb high distribution and commercial losses. Opening distribution to competition through a performance contract as described above, also called a Management Contract (MC) model, would allow ANDE to retain full ownership of the electricity assets and grant a private contractor the responsibility to run operations without acquiring equity or incurring commercial risk.
Box 1: Efficiency of the Management Contract in Tanzania Under an MC in Tanzania, from mid-2002 to mid-2005, collection rates rose from 67 to 93 percent, system losses fell by 5 percent, 30,000 new connections were installed (at a pace far greater than the previous expansion rate), costs fell by 30 percent, and annual revenues rose by 35 percent. A “poverty tariff” was introduced for consumers using 50kWh or less.51
MCs give private sector managers the power to lay off excess staff, cut services to delinquent customers and raise tariffs to rationalize the use of energy. These are
50 Ibid 51 World Bank, 2008, “Underpowered: The State of the Power Sector in Sub-Saharan Africa”, AICD Background Paper 6

26
unpopular measures that managers in publicly-owned utility companies try to avoid. While potential gains are distributed over time, layoffs and service cuts to delinquent customers might come at a political cost. In Bogota, Colombia, the restructuring process of the distribution company CODENSA in the late 1990s is a relevant case.52
Box 2: Curbing distribution losses in Bogotá, Colombia Through a combination of downsizing and outsourcing a variety of technical services,53 CODENSA significantly increased the customers per employee ratio to 2,100 (compared with 653 customers per employee working in ANDE’s distribution and commercial sector).54 It also improved the quality of services. Average interruption times dropped from 6.3 hours in 1997 to 2 hours in only five years.55 To address distribution losses, CODENSA adapted lines’ voltage rates (high, medium, low) for each market segment (large industrial or commercial customers, medium industrial or commercial customers, residential customers, and irregular users in low-income areas). CODENSA also invested in the installation and replacement of meters, the regularization of power supply in low-income areas and the upgrading of distribution networks. Overall, distribution losses steadily decreased from 22 percent in 1997 to 10 percent in 2000 and to 9 percent in 2007. Equally important, non-technical losses were halved. The combined economic impact of those effects was estimated to come to approximately US$82.4 million.56
On the assumption that improving the distribution management model in Paraguay would halve distribution and commercialization losses, and that half of the electricity saved would result in a permanent reduction in demand, this strategy would increase annual revenues by around US$50 million per year, while lowering peak power demand. To improve the electricity planning mechanism, municipal zoning would help to optimize grid investments. Promoting the identification and definition of residential, commercial and industrial areas would ensure that investments meet the voltage needs required for each zone. In the absence of zoning, industries do not locate themselves accordingly, increasing uncertainty in terms of electric investment needs and making it more difficult to optimize grid expansion. This leads to an increase in average connection times and distribution costs.
52 World Bank, 2009, “Reducing Technical and Non-Technical Losses in the Power Sector”, Background Paper, July 53 By 2002, around 7,000 people were working for Codensa under outsourcing contracts. Source: David Hall, 2005, Electricity privatization and restructuring in Latin America and the impact on workers, Public Services International Research Unit (PSIRU), University of Greenwich 54 Calculation based on ANDE, 2012, Resumen Estadístico Año 2011 (In 2011, 1 089 employees were working in the distribution sector, 789 in the commercialization sector, and ANDE was providing electricity to 1 226 630 customers) 55 World Bank, 2009, “Reducing Technical and Non-Technical Losses in the Power Sector”, Background Paper, July 56 World Bank, 2009, “Reducing Technical and Non-Technical Losses in the Power Sector”, Background Paper, July

27
Finally, the Government could envision creating Independent Power Producer (IPP) opportunities in the electricity sector in the long-run. Since electricity tariffs are relatively low and most of the power generation comes from low-cost hydroelectric sources, supplying the total consumption of the metropolitan area of Asunción (which accounts for 57 percent of national consumption57), IPPs have few incentives to enter the generation market. A 2006 law,58 approved by Paraguay’s Congress in 2008, sets a regulatory framework for IPPs in the electricity sector. According to the law, ANDE has a preferential position for all generation sources above 2MW, and public bidding and partnership with ANDE is required. To date, only five project proposals have been proposed to ANDE and have remained at a very early stage of development. There is no immediate need for the entry of IPPs in the market because of the excess supply as compared to the demand. However, this could be considered once Paraguay enters a phase of energy deficits. 1.4.2 Technical approach Most of the investments in the Master Plan address the transmission infrastructure gap. These are crucial to reduce power outages and cut transmission losses. However, transmission losses only account for one quarter of overall system losses. More needs to be done to tackle the technical and non-technical distribution losses. While 15 percent of the total losses stem from electricity theft and illegal connections,59 over half of total losses stem from technical and management deficiencies both at the distribution and commercial level. Furthermore, it seems that greater emphasis should be placed on smoothing electricity consumption during the day and slowing electricity consumption growth rates over time. a) Supply-side approaches The expansion of an advanced metering system applied to medium and large consumers through smart grids allows optimization of electricity consumption by informing users of real-time prices, peak hour start and end times, accumulated consumption, alerts, etc. Recent experience, both in developed and developing countries, shows that medium and large consumers are responsive to clear and timely information on pricing options. The rate of return and payback periods for installing an advanced metering system for large consumers are usually attractive. The World Bank estimates that, subject to average tariff levels and electricity theft levels, the installation of an advanced metering device, including a component allowing remote disconnection and reconnection, requires an investment of US$50 for large low-voltage consumers and between US$300 and US$400 for high and medium-voltage consumers.60 In Paraguay, this is equivalent to an electricity consumption of about 660 kWh and 4,000-5,300 kWh respectively at an
57 Inter-American Development Bank, 2012, “Multipower Transmission Program Phase II”, PR-L1058, 11 December 58Ley N° 3009 De La Producción y Transporte Independiente de Energía Eléctrica (PTIEE). http://www.ssme.gov.py/vmme/pdf/leyes/Ley%203009%20PTIEE.pdf 59 http://www.americaeconomia.com/negocios-industrias/paraguay-entidad-de-electricidad-pierde-us180m-al-ano-por-robo-y-causas-tecnicas, accessed 2013-03-01 60 World Bank, 2009, “Reducing Technical and Non-Technical Losses in the Power Sector”, Background Paper, July
28
electricity price of US¢7.57 per kWh. The investment is therefore rapidly recovered through billing previously unmetered customers. While these estimations do not account for recurrent costs associated with field meter readings, these are likely to be minimal since labor costs in Paraguay are low compared to the recovered electricity and associated revenues. b) Demand-side approaches On the demand side, policies could aim to optimize electricity use and reduce power demand during peak hours. This is the time when the highest transmission losses occur. Smoothing energy consumption could help to partially offset the yearly increase in electricity demand and thus delay required infrastructure investments. Direct Load Control programs can be used to reduce peak loads by remotely switching off specific appliances. This type of program would be particularly appropriate for Paraguay, given the problems faced during peak hours in the summer months. Typical demand reductions are around 1kW for air conditioners and 0.6kW for water heaters of commercial customers.61 The switch can be operated through radio signals or digital paging. Depending on the duty cycle selected, the switch turns off the condensing unit or element for a specific period or various fractions of a period (e.g. 10 minutes every hour). Direct Load Control programs also typically limit the number of times or hours that a customer’s appliance can be turned off per year or per season.
Box 3: Direct Load Control Program in Vietnam and in the United States In a Direct Load Control pilot program implemented in Vietnam, the load control was exercised only when the electric grid was experiencing a significant imbalance between supply and demand. The 2,000 participating customers were guaranteed that the load control would not be imposed more than 60 times in a year.62 While Direct Load Control is not widespread in emerging and developing countries, it has been in operation for several decades in the United States. A variety of utilities started to develop and deploy large programs in the late 1960s and expanded them significantly in the 1980s and 1990s. So far, Florida Power & Light has implemented the largest program with 740,570 customers.63
Dynamic pricing. Since the transmission and distribution infrastructure has to be designed so the network can handle the maximum instantaneous power demand, smoothing electricity consumption around peak hours allows the grid to bear growing electricity consumption without additional infrastructure requirements. This can save ANDE significant investment costs and spread these over a longer time-span. Dynamic pricing also has potential benefits for the customers, since a shift in consumption patterns can lead to lower electricity tariffs.
61 Thomas Weisel Partners, 2007, A Primer on Demand Response. The Power Grid: Evolving from a “Dumb” Network to a “Smart” Grid 62 Charles River Associates, 2005, “Applications of Dynamic Pricing in Developing and Emerging Economies”, prepared for the World Bank 63 Thomas Weisel Partners, 2007, A Primer on Demand Response. The Power Grid: Evolving from a “Dumb” Network to a “Smart” Grid
29
Box 4: Dynamic Pricing in the United States According to McKinsey and Company, U.S. consumers could save up to US$15 billion per year if everyone would participate in a demand-response program by shifting 5-8 percent of their electricity consumption from peak to off-peak periods and decreasing consumption by 4-7 percent. These shifts would also avoid 250 power plants handling a peak capacity of 31,250MW (equivalent to an investment of US$16 billion needed to meet the peak demand).64 In California, a study following the energy crisis of the summer of 2000 showed that peak hour price levels could have been reduced from US$750 per MWh to US$517 per MWh if hourly market-based prices had been in place, causing Californian consumers to lower peak demand by 193MW.65
The introduction of Time-of-use Rates or Critical Peak Pricing in Paraguay could also have a significant impact on peak hours’ electricity demand. A study analyzing the impact of 70 pilots among residential customers across three continents has shown that the introduction of dynamic pricing has led to a median peak demand reduction of 14-18 percent.66 Assuming a peak demand reduction of 16 percent among residential consumers only, the total peak demand in Paraguay would decrease by 150 MW, bringing the maximum peak demand closer to the current system capacity.
1.5 Summary of Findings and Recommendations
1. The electricity sector is suffering from high inefficiencies. At the institutional level there is limited regulatory supervision of the monopoly state-owned power utility. As a result, the power utility company does not seem incentivized to cut losses in the system, increase operational efficiency and increase its low execution rate. There has also been a lack of investment in the transmission lines, which are loaded above capacity, and there is a lack of payment enforcement, as well as high incidence of electricity theft.
2. The creation of a strong Ministry of Energy should help define a better-integrated strategy for the energy sector and monitor the efficiency of the public power utility. The Ministry would also be responsible for coordinating the energy plans with other institutions. Municipal zoning by residential, commercial and industrial zones would help the planning process for electricity infrastructure in the country.
3. While it is important to build new transmission lines to accommodate higher
demand, emphasis also needs to be placed on reducing transmission losses at the distribution level, as these account for 75 percent of total losses. The Government could expand the advanced metering system so consumers can
64 McKinsey and Company, 2001, “White Paper: The Benefits of Demand-Side Management and Dynamic Pricing Programs”, May 65 GAO, 2005, Electricity Markets. Consumers Could Benefit from Demand Programs, but Challenges Remain. August. 66 Faruqi, 2010, “The Case for Dynamic Pricing”, presented in Sao Paulo, Brazil, 23 August http://www.brattle.com/_documents/uploadlibrary/upload870.pdf

30
optimize consumption. Direct Load Control programs and dynamic pricing can be used to reduce consumption during peak hours. Improving the distribution management model by outsourcing technical services to the private sector could increase bill collection rates and system performance. While this may lead to higher tariff rates, it could potentially halve the system losses and increase annual revenues by about US$50 million.
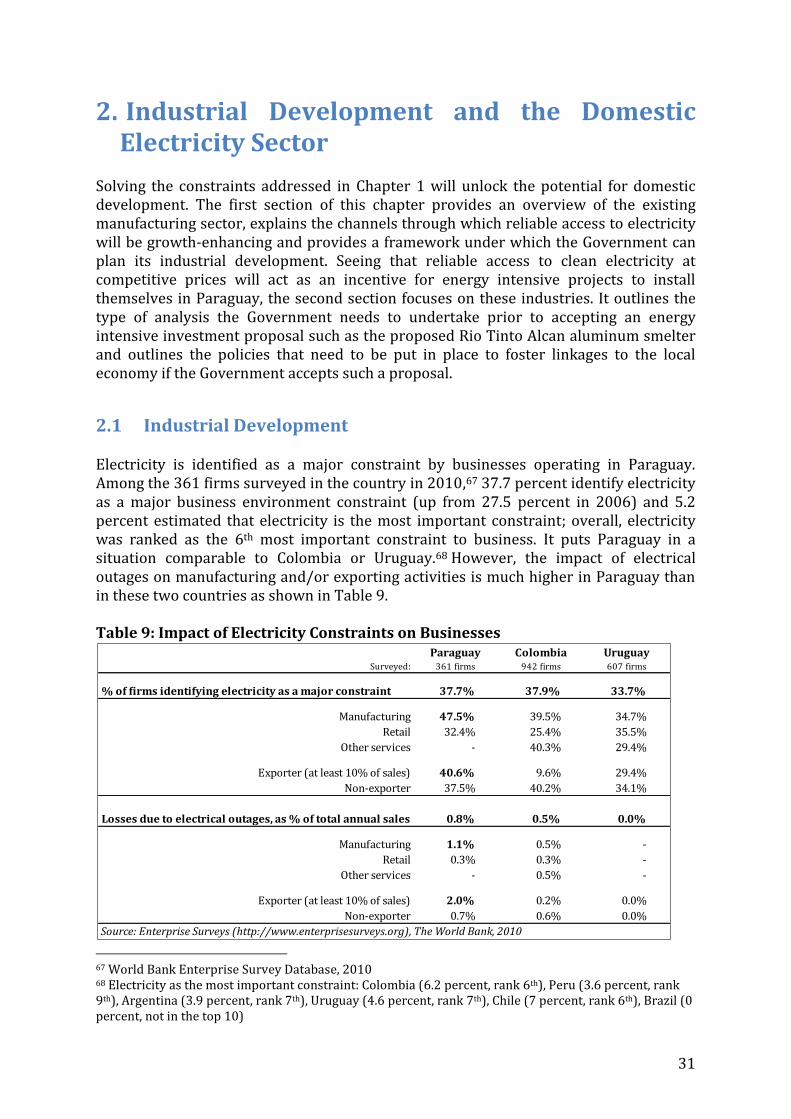
31
2. Industrial Development and the Domestic Electricity Sector
Solving the constraints addressed in Chapter 1 will unlock the potential for domestic development. The first section of this chapter provides an overview of the existing manufacturing sector, explains the channels through which reliable access to electricity will be growth-enhancing and provides a framework under which the Government can plan its industrial development. Seeing that reliable access to clean electricity at competitive prices will act as an incentive for energy intensive projects to install themselves in Paraguay, the second section focuses on these industries. It outlines the type of analysis the Government needs to undertake prior to accepting an energy intensive investment proposal such as the proposed Rio Tinto Alcan aluminum smelter and outlines the policies that need to be put in place to foster linkages to the local economy if the Government accepts such a proposal.
2.1 Industrial Development Electricity is identified as a major constraint by businesses operating in Paraguay. Among the 361 firms surveyed in the country in 2010,67 37.7 percent identify electricity as a major business environment constraint (up from 27.5 percent in 2006) and 5.2 percent estimated that electricity is the most important constraint; overall, electricity was ranked as the 6th most important constraint to business. It puts Paraguay in a situation comparable to Colombia or Uruguay.68 However, the impact of electrical outages on manufacturing and/or exporting activities is much higher in Paraguay than in these two countries as shown in Table 9. Table 9: Impact of Electricity Constraints on Businesses
67 World Bank Enterprise Survey Database, 2010 68 Electricity as the most important constraint: Colombia (6.2 percent, rank 6th), Peru (3.6 percent, rank 9th), Argentina (3.9 percent, rank 7th), Uruguay (4.6 percent, rank 7th), Chile (7 percent, rank 6th), Brazil (0 percent, not in the top 10)
Paraguay Colombia UruguaySurveyed: 361 firms 942 firms 607 firms
% of firms identifying electricity as a major constraint 37.7% 37.9% 33.7%
Manufacturing 47.5% 39.5% 34.7%
Retail 32.4% 25.4% 35.5%
Other services - 40.3% 29.4%
Exporter (at least 10% of sales) 40.6% 9.6% 29.4%
Non-exporter 37.5% 40.2% 34.1%
Losses due to electrical outages, as % of total annual sales 0.8% 0.5% 0.0%
Manufacturing 1.1% 0.5% -
Retail 0.3% 0.3% -
Other services - 0.5% -
Exporter (at least 10% of sales) 2.0% 0.2% 0.0%
Non-exporter 0.7% 0.6% 0.0%
Source: Enterprise Surveys (http://www.enterprisesurveys.org), The World Bank, 2010
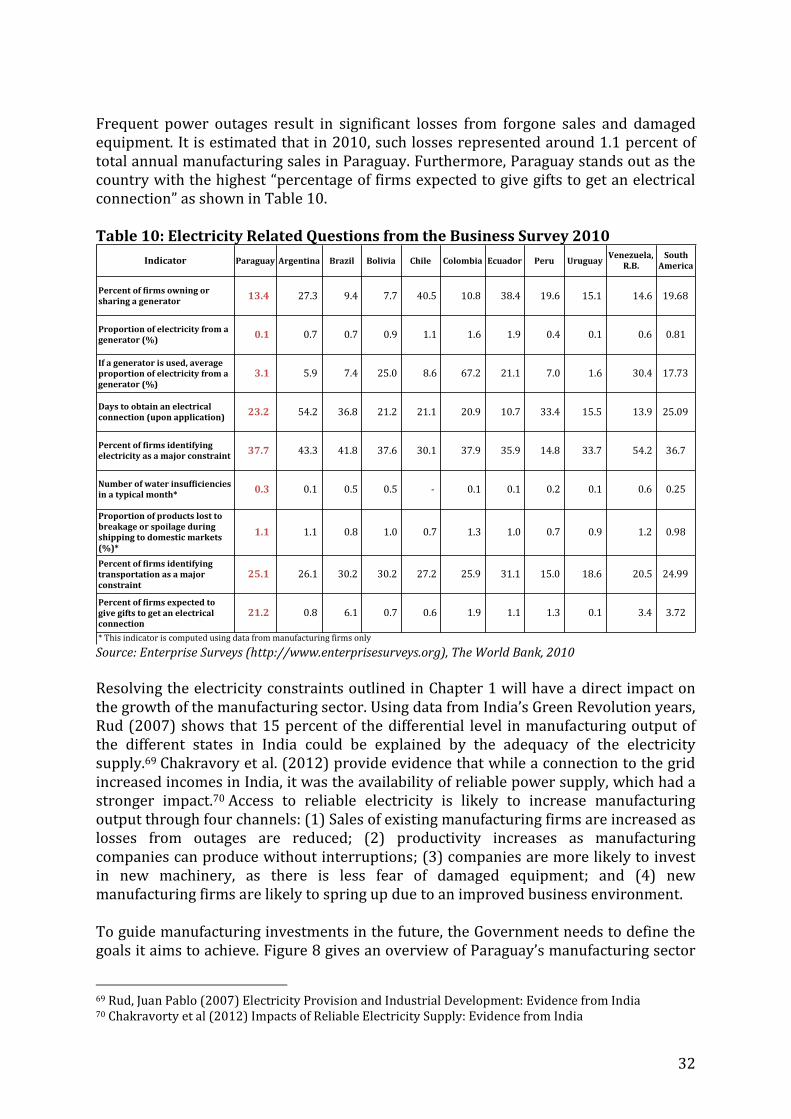
32
Frequent power outages result in significant losses from forgone sales and damaged equipment. It is estimated that in 2010, such losses represented around 1.1 percent of total annual manufacturing sales in Paraguay. Furthermore, Paraguay stands out as the country with the highest “percentage of firms expected to give gifts to get an electrical connection” as shown in Table 10. Table 10: Electricity Related Questions from the Business Survey 2010
Source: Enterprise Surveys (http://www.enterprisesurveys.org), The World Bank, 2010
Resolving the electricity constraints outlined in Chapter 1 will have a direct impact on the growth of the manufacturing sector. Using data from India’s Green Revolution years, Rud (2007) shows that 15 percent of the differential level in manufacturing output of the different states in India could be explained by the adequacy of the electricity supply.69 Chakravory et al. (2012) provide evidence that while a connection to the grid increased incomes in India, it was the availability of reliable power supply, which had a stronger impact.70 Access to reliable electricity is likely to increase manufacturing output through four channels: (1) Sales of existing manufacturing firms are increased as losses from outages are reduced; (2) productivity increases as manufacturing companies can produce without interruptions; (3) companies are more likely to invest in new machinery, as there is less fear of damaged equipment; and (4) new manufacturing firms are likely to spring up due to an improved business environment. To guide manufacturing investments in the future, the Government needs to define the goals it aims to achieve. Figure 8 gives an overview of Paraguay’s manufacturing sector
69 Rud, Juan Pablo (2007) Electricity Provision and Industrial Development: Evidence from India 70 Chakravorty et al (2012) Impacts of Reliable Electricity Supply: Evidence from India
Indicator Paraguay Argentina Brazil Bolivia Chile Colombia Ecuador Peru UruguayVenezuela,
R.B.South
America
Percentoffirmsowningorsharingagenerator
13.4 27.3 9.4 7.7 40.5 10.8 38.4 19.6 15.1 14.6 19.68
Proportionofelectricityfromagenerator(%)
0.1 0.7 0.7 0.9 1.1 1.6 1.9 0.4 0.1 0.6 0.81
Ifageneratorisused,averageproportionofelectricityfromagenerator(%)
3.1 5.9 7.4 25.0 8.6 67.2 21.1 7.0 1.6 30.4 17.73
Daystoobtainanelectricalconnection(uponapplication)
23.2 54.2 36.8 21.2 21.1 20.9 10.7 33.4 15.5 13.9 25.09
Percentoffirmsidentifyingelectricityasamajorconstraint
37.7 43.3 41.8 37.6 30.1 37.9 35.9 14.8 33.7 54.2 36.7
Numberofwaterinsufficienciesinatypicalmonth*
0.3 0.1 0.5 0.5 - 0.1 0.1 0.2 0.1 0.6 0.25
Proportionofproductslosttobreakageorspoilageduringshippingtodomesticmarkets(%)*
1.1 1.1 0.8 1.0 0.7 1.3 1.0 0.7 0.9 1.2 0.98
Percentoffirmsidentifyingtransportationasamajorconstraint
25.1 26.1 30.2 30.2 27.2 25.9 31.1 15.0 18.6 20.5 24.99
Percentoffirmsexpectedtogivegiftstogetanelectricalconnection
21.2 0.8 6.1 0.7 0.6 1.9 1.1 1.3 0.1 3.4 3.72
*Thisindicatoriscomputedusingdatafrommanufacturingfirmsonly
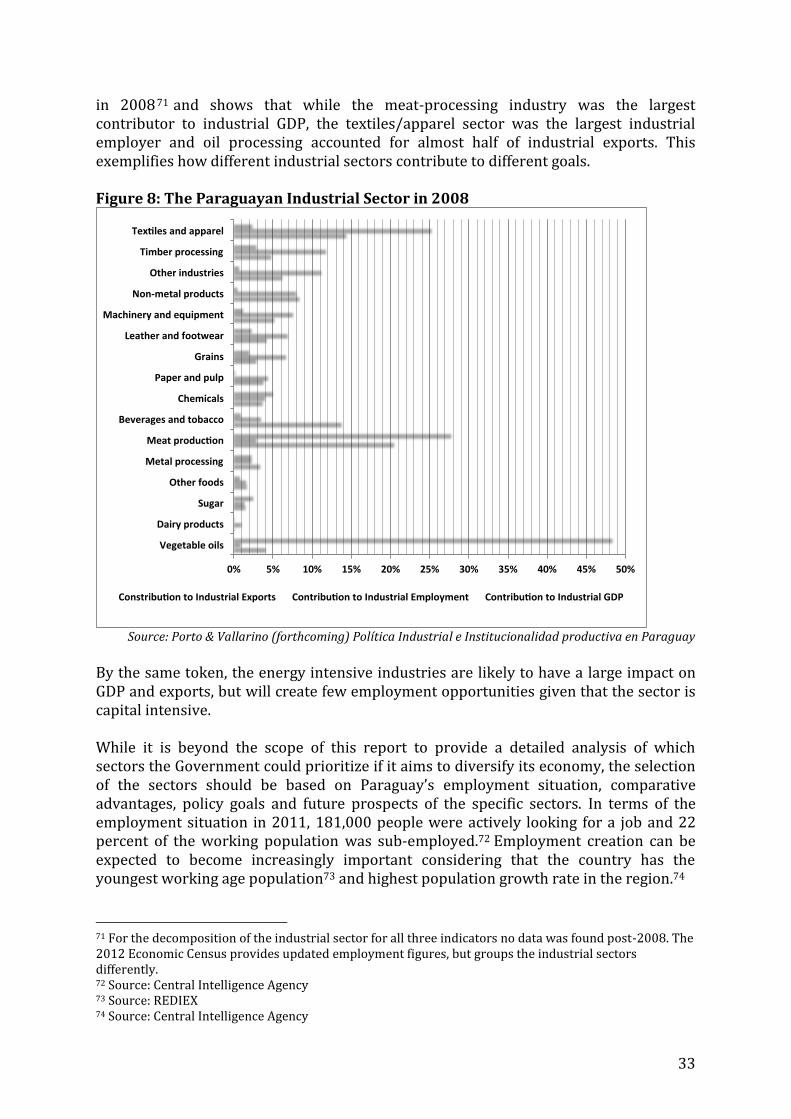
33
in 200871 and shows that while the meat-processing industry was the largest contributor to industrial GDP, the textiles/apparel sector was the largest industrial employer and oil processing accounted for almost half of industrial exports. This exemplifies how different industrial sectors contribute to different goals. Figure 8: The Paraguayan Industrial Sector in 2008
Source: Porto & Vallarino (forthcoming) Política Industrial e Institucionalidad productiva en Paraguay
By the same token, the energy intensive industries are likely to have a large impact on GDP and exports, but will create few employment opportunities given that the sector is capital intensive. While it is beyond the scope of this report to provide a detailed analysis of which sectors the Government could prioritize if it aims to diversify its economy, the selection of the sectors should be based on Paraguay’s employment situation, comparative advantages, policy goals and future prospects of the specific sectors. In terms of the employment situation in 2011, 181,000 people were actively looking for a job and 22 percent of the working population was sub-employed.72 Employment creation can be expected to become increasingly important considering that the country has the youngest working age population73 and highest population growth rate in the region.74
71 For the decomposition of the industrial sector for all three indicators no data was found post-2008. The 2012 Economic Census provides updated employment figures, but groups the industrial sectors differently. 72 Source: Central Intelligence Agency 73 Source: REDIEX 74 Source: Central Intelligence Agency
0% 5% 10% 15% 20% 25% 30% 35% 40% 45% 50%
Vegetableoils
Dairyproducts
Sugar
Otherfoods
Metalprocessing
Meatproduc on
Beveragesandtobacco
Chemicals
Paperandpulp
Grains
Leatherandfootwear
Machineryandequipment
Non-metalproducts
Otherindustries
Timberprocessing
Tex lesandapparel
Constribu ontoIndustrialExports Contribu ontoIndustrialEmployment Contribu ontoIndustrialGDP
34
As for the comparative advantages, apart from cheap and abundant electricity (once the constraints set out in Chapter 1 are addressed), the country benefits from several other comparative advantages, as outlined in annex A. These include a relatively inexpensive labor force (although not highly skilled75), its location next to the largest economies in the region and its free trade access to these markets through the Mercosur agreement. The regional dynamics of rising production costs in Brazil, and investors in Argentina facing an increasingly difficult business environment, might also play a role when companies decide where to establish themselves in the region. While it could be argued that the low tax burden and fiscal incentive provisions act as an additional incentive for companies to invest in Paraguay, this has not been assessed for the 60/90 and Maquila laws. “The balance of evidence from developing countries suggests that fiscal incentives do not effectively counterbalance unattractive investment climate conditions.”76 The composition of the industrial sector shown in Figure 8 already gives a good indication of the industries that place more importance on Paraguay’s comparative advantages. The textiles sector, for example, is labor intensive and does not require a highly skilled workforce. The exports of processed meat reflect the value chain opportunities from the agriculture sector and regional demand for this product. The current industrial sector composition also provides a good starting point to analyze where the Government is most likely to attract investment in the future. It is easier for a company to set up where vertical, upstream and/or downstream linkages already exist. As agriculture still plays a key role in the Paraguayan economy and expertise already exists in this area, the agro-processing sector could be the starting point for industrialization. This sector creates employment opportunities and does not require a highly skilled labor force. The latest economic census estimates that in Paraguay, 21 percent of industrial employment in 2010 was attributed to agro-processing77 (almost triple the employees than in furniture manufacturing, which was listed as the second largest employment sector). Furthermore, the agribusiness sector connects farmers to markets, thereby reaching some of the poorest parts of the population and contributing to geographically balanced economic development.78 As an off-taker of produce, successful agribusiness investments in turn stimulate agriculture growth. Agro-based industries, especially when clustered, can also create the skills, services and infrastructure needed for further industrial development.79
75 See Annex A – labor force competitiveness 76 World Bank (2009) Incentives and Investments: Evidence and Policy Implications 77 Censo Economico National 2011: Resultados Oportunos 78 UNIDO (2013) Agribusiness for Africa’s Prosperity – Country Case Studies 79 World Bank (2013) Africa: Unlocking the Potential of Agribusiness

35
Box 5: Thai Agribusiness Model80 Apart from exporting agriculture commodities such as rice, rubber, cassava and sugar, Thailand has successfully moved into higher-value products over time. Today, the country has become a leading exporter of poultry, pineapple, fruit, vegetable and other processed and prepared foods. It has its own multinational agribusiness, Charoen Pokphand, which is an animal feed, poultry, aquaculture, food processing, seed, and food retailing enterprise.
This was achieved through strong Government support to the farming and agribusiness sectors. A consistent policy of giving a leading role to the private sector was maintained and the state bank of Agriculture and Agricultural Cooperatives provided financial support. After acquiring its initial competitive edge through land and labor expansion, Thai agribusiness has maintained a competitive position since the 1990s through sharp increases in agricultural productivity. Medium-scale farmers with 5–15 hectares have led the commercialization of the sector and stimulated a vibrant agribusiness sector consisting of small and medium enterprises. In central Thailand, these enterprises include construction operations, rice and sugar mills, cassava brokers, producers of cassava pellets for export, metal workshops and agricultural equipment manufacturers, as well as livestock feed mills and village shops.
This successful agro-industry support model has helped to reduce rural poverty sharply from 60 percent in the 1960s to 10 percent in recent years.
By looking at linkages between products with international trade data, Hidalgo et al. (2007) have built a theory of proximity between products showing this graphically as the ‘product space’.81 Without going into detail on the theory, the basic argument is that some products are more likely to be produced in tandem than others. If, for example, a country produces apples, it is quite probable that it will also be producing pears, seeing that the expertise, inputs and weather conditions are similar. Some products have closer and more numerous linkages than others, making spillover effects more likely and enabling economic diversification. While agro-processed products could be prioritized in the short term given the current competitive advantage of Paraguay in this sector, they have fewer connections and less spillover possibilities to other sectors. Paraguay also exports apparel, leather, furniture, medicaments and plastics. These are more ‘complex’ products according to the product space theory and have higher spillover possibilities. Hence, these could be additional sectors that the Government might want to consider prioritizing. The prioritization will require a national industrial policy, which is aligned to the broader objectives of the Government and sets out clear objectives and instruments to support the selected sectors. Resources will have to be spent to support the policy. Areas of support include sector specific infrastructure, training programs, research and
80 World Bank (2013) Africa: Unlocking the Potential of Agribusiness 81 For more information on this theory and an interactive map of Paraguay, see http://atlas.media.mit.edu/

36
development, access to finance and technical assistance in standards and market access. Chile’s experience in drafting an industrial policy and driving diversification contain some valuable lessons that could be adapted to the Paraguayan context.
Box 6: Chile’s Pillars for Diversification: Innovation and Knowledge82
By the end of the 1990’s after implementing several industrial policies to be less dependent on the copper industry, opening up to international capital flows and trade and improving its macroeconomic fundamentals, Chile realized that more reform was needed to achieve higher levels of development. In 2005 this awareness led to the creation of the National Strategy of Innovation for Competitiveness (NSIC). The NSIC is a public-private advisory board for the president of Chile, whose goal was to prepare a strategic plan for Chile’s productive sector for the following 15 years. The NSIC aimed to increase Chile’s knowledge-based productivity while achieving sustainable and inclusive long-term growth. NSIC’s view was that Chile should not move away from its competitive advantages in natural resource extraction, but should use the revenues to help diversify its economy. Finland, Sweden, Australia and New Zealand were to serve as model countries. These developed economies have achieved sustainable and inclusive growth as a result of skilled human capital, innovative capacities, new technology in their productive process, high investments in R&D and above all solid institutions and economic incentives to foster and promote entrepreneurship and innovation.
On that basis NSIC commissioned a research study identifying key competitive sectors with the potential to help Chile achieve a per capita income of $25,000; increase Chile’s contribution to total-factor productivity; reach 80 percent enrollment in secondary education for the 18- to 24-year-old population; reach 2.5 percent of GDP in R&D expenditures; increase diversification according to international rankings; and improve Chile’s place in relevant international competitiveness indices by 2021. The study came up with 7 clusters based on current importance in GDP; a 10-year forecast on the importance of each sector relative to GDP; opportunities and challenges that each sector may present (geographical location, presence of natural resources, human capital, FDI, access to technology, infrastructure, associability, environmental sustainability, regulatory framework etc.); and degree of state intervention needed to achieve its potential. The clusters chosen were: aquiculture, fruit cultivation, mining, swine and aviculture, global services, specialty tourism and functional foods. Logistics and transport, telecommunications and financial services were considered strategic pillars.
The entrepreneurs and SMEs belonging to these clusters have been benefiting from special support and incentives in innovation and technology. The funding of this new industrial policy has mostly come from copper revenues through a new royalty tax on mining.
The national consensus around the need to diversify and to move up to a more sophisticated, productive base was instrumental in the implementation of the national strategy. Public sector, private actors and academia worked to achieve the strategic goals enunciated in the strategy. In 2010, an international evaluation report stated
82 Varas, M. E. (2008). Economic Diversification: The Case of Chile. New York: Revenue Watch Institute
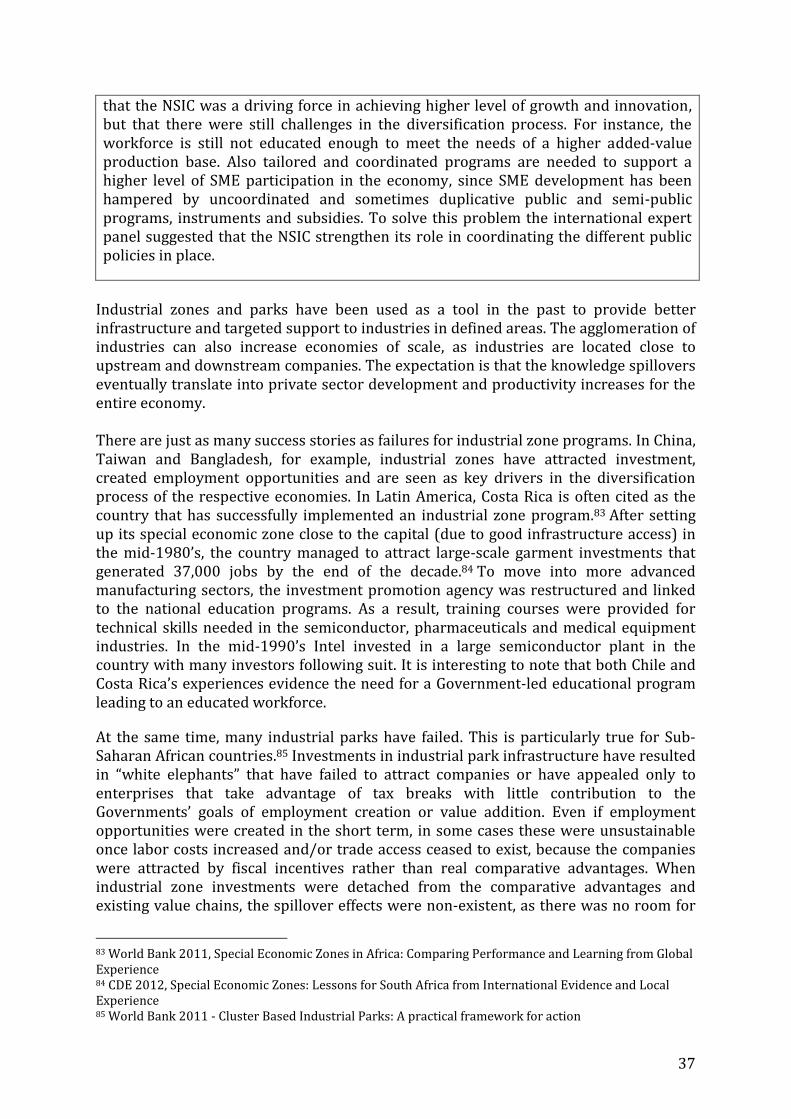
37
that the NSIC was a driving force in achieving higher level of growth and innovation, but that there were still challenges in the diversification process. For instance, the workforce is still not educated enough to meet the needs of a higher added-value production base. Also tailored and coordinated programs are needed to support a higher level of SME participation in the economy, since SME development has been hampered by uncoordinated and sometimes duplicative public and semi-public programs, instruments and subsidies. To solve this problem the international expert panel suggested that the NSIC strengthen its role in coordinating the different public policies in place.
Industrial zones and parks have been used as a tool in the past to provide better infrastructure and targeted support to industries in defined areas. The agglomeration of industries can also increase economies of scale, as industries are located close to upstream and downstream companies. The expectation is that the knowledge spillovers eventually translate into private sector development and productivity increases for the entire economy. There are just as many success stories as failures for industrial zone programs. In China, Taiwan and Bangladesh, for example, industrial zones have attracted investment, created employment opportunities and are seen as key drivers in the diversification process of the respective economies. In Latin America, Costa Rica is often cited as the country that has successfully implemented an industrial zone program.83 After setting up its special economic zone close to the capital (due to good infrastructure access) in the mid-1980’s, the country managed to attract large-scale garment investments that generated 37,000 jobs by the end of the decade.84 To move into more advanced manufacturing sectors, the investment promotion agency was restructured and linked to the national education programs. As a result, training courses were provided for technical skills needed in the semiconductor, pharmaceuticals and medical equipment industries. In the mid-1990’s Intel invested in a large semiconductor plant in the country with many investors following suit. It is interesting to note that both Chile and Costa Rica’s experiences evidence the need for a Government-led educational program leading to an educated workforce.
At the same time, many industrial parks have failed. This is particularly true for Sub-Saharan African countries.85 Investments in industrial park infrastructure have resulted in “white elephants” that have failed to attract companies or have appealed only to enterprises that take advantage of tax breaks with little contribution to the Governments’ goals of employment creation or value addition. Even if employment opportunities were created in the short term, in some cases these were unsustainable once labor costs increased and/or trade access ceased to exist, because the companies were attracted by fiscal incentives rather than real comparative advantages. When industrial zone investments were detached from the comparative advantages and existing value chains, the spillover effects were non-existent, as there was no room for
83 World Bank 2011, Special Economic Zones in Africa: Comparing Performance and Learning from Global Experience 84 CDE 2012, Special Economic Zones: Lessons for South Africa from International Evidence and Local Experience 85 World Bank 2011 - Cluster Based Industrial Parks: A practical framework for action

38
transfer of skills and technology to the local economy. The World Bank concluded that the industrial zone programs in Ghana, Kenya, Lesotho, Nigeria, Senegal and Tanzania have not led to structural changes in export patterns and have failed to provide good quality, upgradeable job opportunities.86 Past experiences show that industrial zones can only play a role in attracting sustainable investment if they are part of an overarching industrial strategy that is based on the comparative advantages of the country. The commercial case should be the basis of any industrial park development plan. Bangladesh, for example, only reaped the rewards of its industrial zone program once it switched from aiming to attract investment in high-technology sectors (for which there was a lack of a qualified labor force at the time) to the garments sector. Basing the selection process on comparative advantages is also important to guarantee the long-term sustainability of the industries that setup in the zone. If the Government of Paraguay opts to include industrial parks in its industrial policy, it will need to guarantee the provision of serviced land and supporting infrastructure within the defined area. Core infrastructure includes an internal road network, drainage system, sewage and solid waste collection, power-substation and distribution system, water storage and distribution system, and information and communication network. Depending on the specific industries that the Government aims to attract, supporting infrastructure will differ. Food-processing industries, for example, will require cold storage facilities, warehouse facilities and/or milk chilling plants. The infrastructure development does not stop at the gates of the industrial zone and the location of the zone will be a defining factor for its success. The location decision should be based on the access to quality infrastructure that links the zone to input and output markets, access to the labor force intended to work in the zone and areas where the Government expects the most linkages and spillover effects to take place. Hence the industrial zone should lie along the major trade gateways and close to the largest metropolitan areas. This is especially true if the Government aims to attract manufacturers that require imported inputs, business services, large pools of labor and transport networks. Industrial zoning should not be viewed as a regional development tool, but rather be based on the attractiveness to potential investors. To better plan for such industrial zoning, the Government could adopt a spatial development corridor approach. Spatial Development corridors are transport/trade corridors characterized by under-utilized economic potential in their environs, but that could be unlocked with spatial planning. “They are therefore seen as a means of configuring, prioritizing and promoting inter-related infrastructure and large-scale economic sectoral investments in defined geographic areas so as to promote trade and investment led economic growth; optimize the use of infrastructure; encourage value-added processing; and enhance the competitiveness of the country. At the regional level the [Spatial Development Corridor] model encourages integrated development within a given space defined by its economic potential rather than by political boundaries.”87
86 World Bank 2011, Special Economic Zones in Africa: Comparing Performance and Learning from Global Experience 87 Thomas, R. H. (2009, January). Development Corridors and Spatial Development in Africa. Washington, D.C.
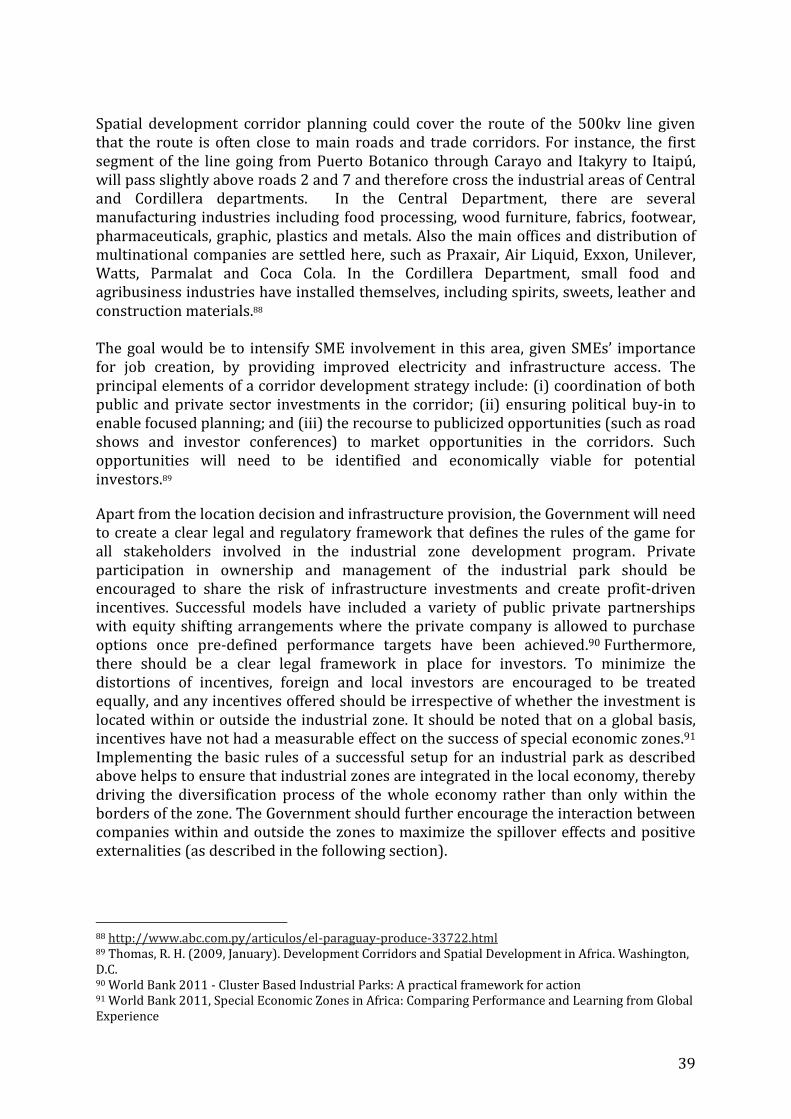
39
Spatial development corridor planning could cover the route of the 500kv line given that the route is often close to main roads and trade corridors. For instance, the first segment of the line going from Puerto Botanico through Carayo and Itakyry to Itaipú, will pass slightly above roads 2 and 7 and therefore cross the industrial areas of Central and Cordillera departments. In the Central Department, there are several manufacturing industries including food processing, wood furniture, fabrics, footwear, pharmaceuticals, graphic, plastics and metals. Also the main offices and distribution of multinational companies are settled here, such as Praxair, Air Liquid, Exxon, Unilever, Watts, Parmalat and Coca Cola. In the Cordillera Department, small food and agribusiness industries have installed themselves, including spirits, sweets, leather and construction materials.88 The goal would be to intensify SME involvement in this area, given SMEs’ importance for job creation, by providing improved electricity and infrastructure access. The principal elements of a corridor development strategy include: (i) coordination of both public and private sector investments in the corridor; (ii) ensuring political buy-in to enable focused planning; and (iii) the recourse to publicized opportunities (such as road shows and investor conferences) to market opportunities in the corridors. Such opportunities will need to be identified and economically viable for potential investors.89
Apart from the location decision and infrastructure provision, the Government will need to create a clear legal and regulatory framework that defines the rules of the game for all stakeholders involved in the industrial zone development program. Private participation in ownership and management of the industrial park should be encouraged to share the risk of infrastructure investments and create profit-driven incentives. Successful models have included a variety of public private partnerships with equity shifting arrangements where the private company is allowed to purchase options once pre-defined performance targets have been achieved.90 Furthermore, there should be a clear legal framework in place for investors. To minimize the distortions of incentives, foreign and local investors are encouraged to be treated equally, and any incentives offered should be irrespective of whether the investment is located within or outside the industrial zone. It should be noted that on a global basis, incentives have not had a measurable effect on the success of special economic zones.91 Implementing the basic rules of a successful setup for an industrial park as described above helps to ensure that industrial zones are integrated in the local economy, thereby driving the diversification process of the whole economy rather than only within the borders of the zone. The Government should further encourage the interaction between companies within and outside the zones to maximize the spillover effects and positive externalities (as described in the following section).
88 http://www.abc.com.py/articulos/el-paraguay-produce-33722.html 89 Thomas, R. H. (2009, January). Development Corridors and Spatial Development in Africa. Washington, D.C. 90 World Bank 2011 - Cluster Based Industrial Parks: A practical framework for action 91 World Bank 2011, Special Economic Zones in Africa: Comparing Performance and Learning from Global Experience

40
2.2 Energy-Intensive Industries The section above highlights the need to base the prioritization of industrial development on Paraguay’s comparative advantages. Clean and abundant electricity at competitive prices will be a large incentive for energy intensive industries to invest in Paraguay once the Government overcomes the problems identified in Chapter 1. This will especially be the case once more stringent worldwide environmental regulations and carbon tariffs are introduced for products with environmentally harmful production processes. Energy-intensive industries are characterized by being capital intensive and using large amounts of heat/energy to physically or chemically transform materials. Figure 9 shows the eight industries where energy costs make up more than 10 percent of operational costs. Figure 9: Average Energy Use as a Percentage of Operating Costs of Energy-intensive Industries
Source: Team analysis, European Commission-Enterprise and Industry, US Department of Energy-Advanced Manufacturing Office, CRU
In some countries these industries consume up to half the energy of the entire industrial sector. The energy sources vary depending on cost and availability. For example, 90 percent of the energy used by Aluar (Argentinian aluminum smelter) comes from natural gas, while coal is most widely used for aluminum smelting in China and geothermal power in Iceland. Table 11 shows that all industries identified in Figure 9 can use electricity, which is the energy of choice in the case of Paraguay.

41
Table 11: Energy Sources for Production by Industry
Since energy intensive industries are not labor intensive, the real reward from these investments are 1) the potential Government revenues and/or 2) the extent to which they act as an anchor to attract further companies to the country, thereby supporting the diversification process. These are the two key variables that the Government needs to analyze when it assesses an investment proposal by an energy intensive industry. The section below exemplifies such analysis for the proposed Rio Tinto Alcan project proposal. 2.2.1 Proposed Rio Tinto Alcan (RTA) Project
Rio Tinto Alcan has approached the Government of Paraguay to invest in a $4bn aluminum smelter in the country. The proposal foresees the production of 670,000 metric tons of aluminum per annum and would consume 1,100MW of Paraguay’s electricity (compared to a peak demand of 2,137MW in 2011). This investment proposal can provide the opportunity for Paraguay to diversify its economy if it attracts downstream beneficiation industries and creates linkages to the local service economy thereby fostering the transfer of skills to its local population. However, it might also present a substantial risk to the Government of losing out on revenues from electricity exports to neighboring countries. Paraguay would have to commit a large proportion of its electricity to one single company for many years to come whereas Paraguay’s large net export capacity will shrink considerably within 20 years even without the RTA project. Table 12 lists potential benefits and drawbacks of the RTA project and provides an overview of Government actions that could help to minimize the risks and maximize the benefits.
Table1.Energysourcesforproductionperindustry
Energy-IntensiveIndustries FuelOil Electricity Biomass NaturalGas Coal
GlassIndustry x x
Cement,limeandplasterindustry x x
Ironandsteelindustry x x x x
Ceramicproductsindustry x x
Bricks,tilesandconstructionproducts x x
Pulp,paperandpaperboardindustry x x x x
AluminumCastingIndustry x x x x
Chemicalproductsindustry x x x x x
Source:Teamanalysis,EuropeanCommission-EnterpriseandIndustry,
USDepartmentofEnergy-AdvancedManufacturingOffice,CRU
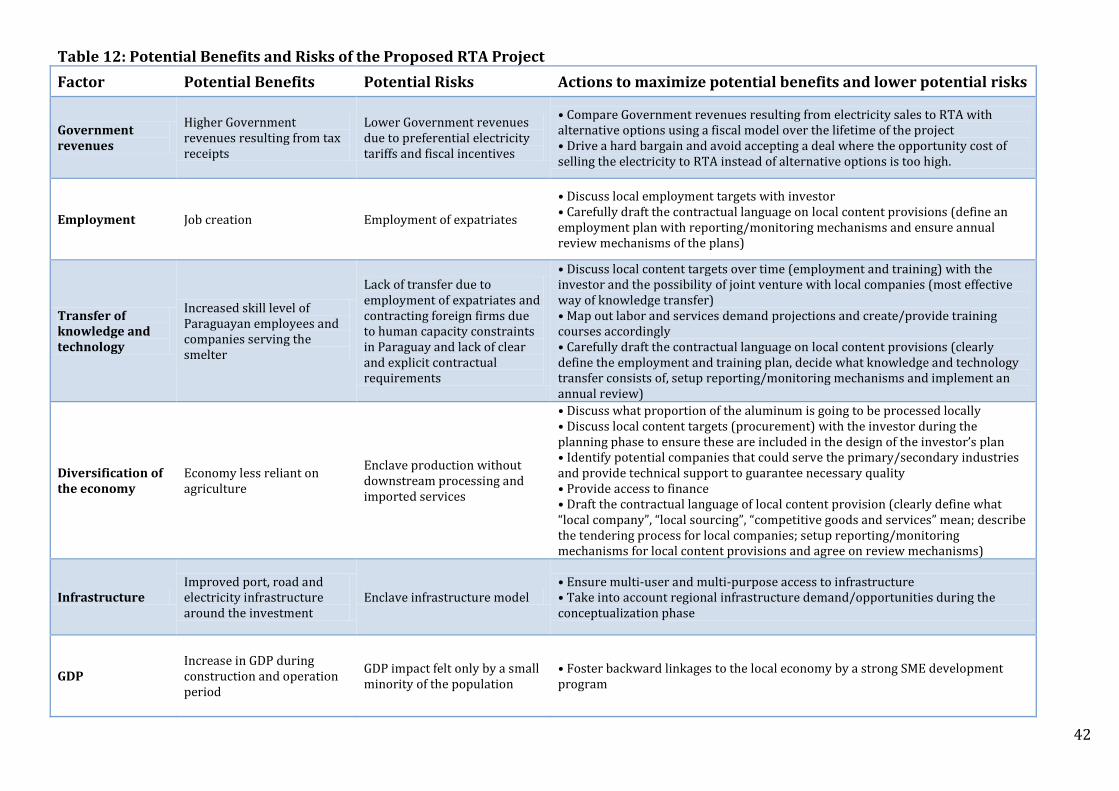
42
Table 12: Potential Benefits and Risks of the Proposed RTA Project
Factor Potential Benefits Potential Risks Actions to maximize potential benefits and lower potential risks
Government revenues
Higher Government revenues resulting from tax receipts
Lower Government revenues due to preferential electricity tariffs and fiscal incentives
• Compare Government revenues resulting from electricity sales to RTA with alternative options using a fiscal model over the lifetime of the project • Drive a hard bargain and avoid accepting a deal where the opportunity cost of selling the electricity to RTA instead of alternative options is too high.
Employment Job creation Employment of expatriates
• Discuss local employment targets with investor • Carefully draft the contractual language on local content provisions (define an employment plan with reporting/monitoring mechanisms and ensure annual review mechanisms of the plans)
Transfer of knowledge and technology
Increased skill level of Paraguayan employees and companies serving the smelter
Lack of transfer due to employment of expatriates and contracting foreign firms due to human capacity constraints in Paraguay and lack of clear and explicit contractual requirements
• Discuss local content targets over time (employment and training) with the investor and the possibility of joint venture with local companies (most effective way of knowledge transfer) • Map out labor and services demand projections and create/provide training courses accordingly • Carefully draft the contractual language on local content provisions (clearly define the employment and training plan, decide what knowledge and technology transfer consists of, setup reporting/monitoring mechanisms and implement an annual review)
Diversification of the economy
Economy less reliant on agriculture
Enclave production without downstream processing and imported services
• Discuss what proportion of the aluminum is going to be processed locally • Discuss local content targets (procurement) with the investor during the planning phase to ensure these are included in the design of the investor’s plan • Identify potential companies that could serve the primary/secondary industries and provide technical support to guarantee necessary quality • Provide access to finance • Draft the contractual language of local content provision (clearly define what “local company”, “local sourcing”, “competitive goods and services” mean; describe the tendering process for local companies; setup reporting/monitoring mechanisms for local content provisions and agree on review mechanisms)
Infrastructure Improved port, road and electricity infrastructure around the investment
Enclave infrastructure model • Ensure multi-user and multi-purpose access to infrastructure • Take into account regional infrastructure demand/opportunities during the conceptualization phase
GDP Increase in GDP during construction and operation period
GDP impact felt only by a small minority of the population
• Foster backward linkages to the local economy by a strong SME development program

43
Institutional capacity
Increased institutional capacity to negotiate and manage big international investments
Conflict of interests and corruption
• Ensure a transparent negotiating process, publish contracts and tariff agreements • Establish a multi-ministerial team, including environmental and social expertise capable of assessing the long-term impact of the investment • Consult the civil society in the negotiation process and provide regular updates on the negotiation process
Investor confidence
Lower perceived risk by investors due to large investment
Worries that political attention is focused on large investment rather than smaller players
• Use investment as marketing tool • Prepare strategic development plan that involves all actors in the economy based on multi-stakeholder consultations • Create an agency to carry out the strategic development plan and that coordinates all Government actions and policies around that strategic plan- the goal is to avoid the multiplication of uncoordinated duplicative policies seeking the same objective
Electricity tariffs Constant, guaranteed and easily projected tariff revenues
• Lower tariff revenues than exports • Lower tariff revenues than from sales to other users
• Negotiate an acceptable electricity tariff for both parties taking into account that the investor will also include infrastructure and fiscal payments into account when deciding whether to invest
Aggregate demand
Increased demand of local goods and services
Inflation • Coordinate with investor to estimate the potential demand for goods and services during the construction phase • Invest in a SME development program to boost productivity and increase supply
Balance of Payments
Net Increase in balance of payments because of high value-added exports
Decrease in balance of payments during construction period because of imports
• Promote downstream and backward linkages to limit imports in the construction phase and increase value –added exports
Local impact • Higher employment • Better infrastructure • Transfer of knowledge
• Rise in inequality • Environmental damage • Displacement of population
• Contractually request participatory and detailed social and environmental impact assessments and resettlement policies if needed • Setup monitoring mechanisms • Discuss development tax with the investor
Exchange Rate
Cheaper imports as a result of the appreciation of the real exchange rate
• Less competitive exports as a result of the appreciation of the real exchange rate Harmful impact on the non-
tradable economy resulting from cheaper imports
• Increase productivity of the domestic productive sector • Careful macroeconomic management
Source: Team analysis, CRU
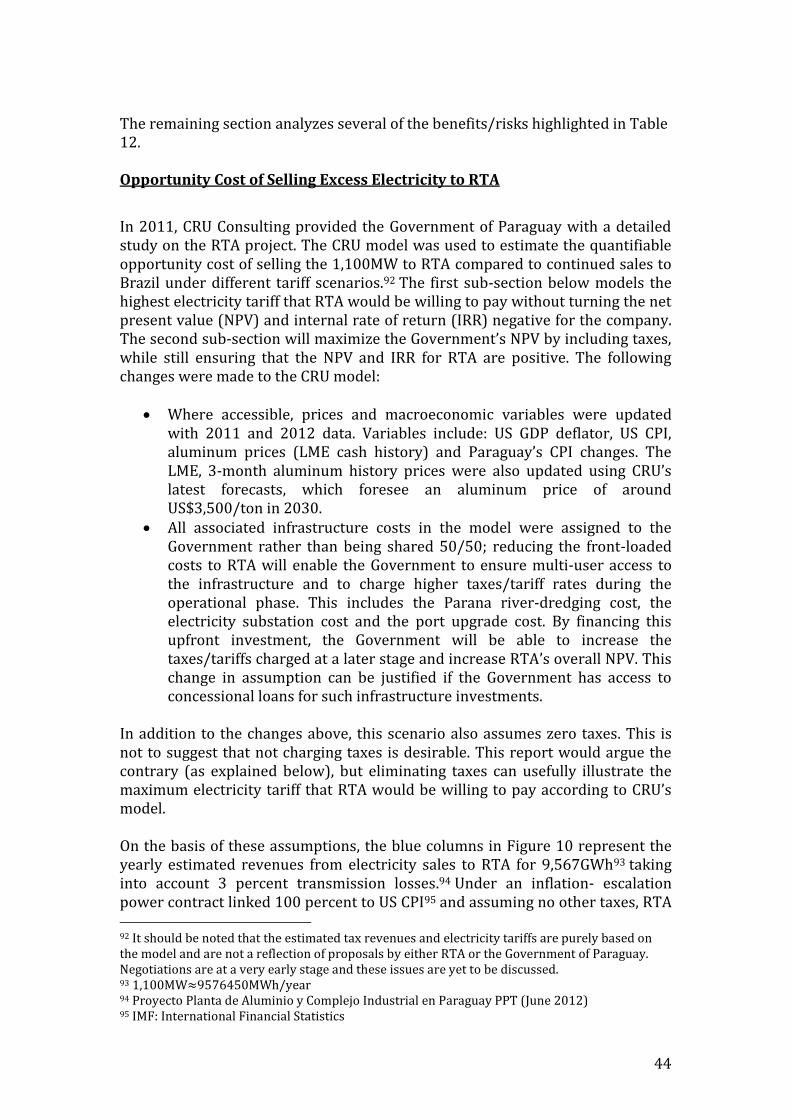
44
The remaining section analyzes several of the benefits/risks highlighted in Table 12. Opportunity Cost of Selling Excess Electricity to RTA
In 2011, CRU Consulting provided the Government of Paraguay with a detailed study on the RTA project. The CRU model was used to estimate the quantifiable opportunity cost of selling the 1,100MW to RTA compared to continued sales to Brazil under different tariff scenarios.92 The first sub-section below models the highest electricity tariff that RTA would be willing to pay without turning the net present value (NPV) and internal rate of return (IRR) negative for the company. The second sub-section will maximize the Government’s NPV by including taxes, while still ensuring that the NPV and IRR for RTA are positive. The following changes were made to the CRU model:
Where accessible, prices and macroeconomic variables were updated with 2011 and 2012 data. Variables include: US GDP deflator, US CPI, aluminum prices (LME cash history) and Paraguay’s CPI changes. The LME, 3-month aluminum history prices were also updated using CRU’s latest forecasts, which foresee an aluminum price of around US$3,500/ton in 2030.
All associated infrastructure costs in the model were assigned to the Government rather than being shared 50/50; reducing the front-loaded costs to RTA will enable the Government to ensure multi-user access to the infrastructure and to charge higher taxes/tariff rates during the operational phase. This includes the Parana river-dredging cost, the electricity substation cost and the port upgrade cost. By financing this upfront investment, the Government will be able to increase the taxes/tariffs charged at a later stage and increase RTA’s overall NPV. This change in assumption can be justified if the Government has access to concessional loans for such infrastructure investments.
In addition to the changes above, this scenario also assumes zero taxes. This is not to suggest that not charging taxes is desirable. This report would argue the contrary (as explained below), but eliminating taxes can usefully illustrate the maximum electricity tariff that RTA would be willing to pay according to CRU’s model. On the basis of these assumptions, the blue columns in Figure 10 represent the yearly estimated revenues from electricity sales to RTA for 9,567GWh93 taking into account 3 percent transmission losses.94 Under an inflation- escalation power contract linked 100 percent to US CPI95 and assuming no other taxes, RTA 92 It should be noted that the estimated tax revenues and electricity tariffs are purely based on the model and are not a reflection of proposals by either RTA or the Government of Paraguay. Negotiations are at a very early stage and these issues are yet to be discussed. 93 1,100MW≈9576450MWh/year 94 Proyecto Planta de Aluminio y Complejo Industrial en Paraguay PPT (June 2012) 95 IMF: International Financial Statistics
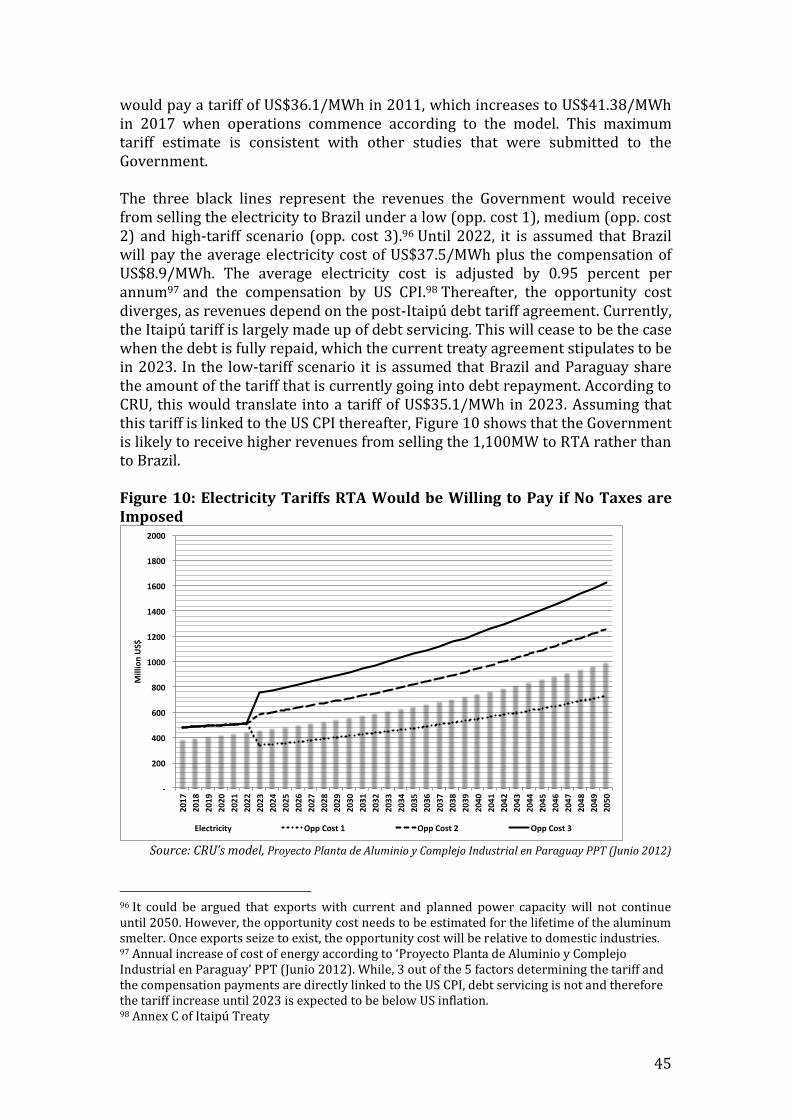
45
would pay a tariff of US$36.1/MWh in 2011, which increases to US$41.38/MWh in 2017 when operations commence according to the model. This maximum tariff estimate is consistent with other studies that were submitted to the Government. The three black lines represent the revenues the Government would receive from selling the electricity to Brazil under a low (opp. cost 1), medium (opp. cost 2) and high-tariff scenario (opp. cost 3).96 Until 2022, it is assumed that Brazil will pay the average electricity cost of US$37.5/MWh plus the compensation of US$8.9/MWh. The average electricity cost is adjusted by 0.95 percent per annum97 and the compensation by US CPI.98 Thereafter, the opportunity cost diverges, as revenues depend on the post-Itaipú debt tariff agreement. Currently, the Itaipú tariff is largely made up of debt servicing. This will cease to be the case when the debt is fully repaid, which the current treaty agreement stipulates to be in 2023. In the low-tariff scenario it is assumed that Brazil and Paraguay share the amount of the tariff that is currently going into debt repayment. According to CRU, this would translate into a tariff of US$35.1/MWh in 2023. Assuming that this tariff is linked to the US CPI thereafter, Figure 10 shows that the Government is likely to receive higher revenues from selling the 1,100MW to RTA rather than to Brazil. Figure 10: Electricity Tariffs RTA Would be Willing to Pay if No Taxes are Imposed
Source: CRU’s model, Proyecto Planta de Aluminio y Complejo Industrial en Paraguay PPT (Junio 2012)
96 It could be argued that exports with current and planned power capacity will not continue until 2050. However, the opportunity cost needs to be estimated for the lifetime of the aluminum smelter. Once exports seize to exist, the opportunity cost will be relative to domestic industries. 97 Annual increase of cost of energy according to ‘Proyecto Planta de Aluminio y Complejo Industrial en Paraguay’ PPT (Junio 2012). While, 3 out of the 5 factors determining the tariff and the compensation payments are directly linked to the US CPI, debt servicing is not and therefore the tariff increase until 2023 is expected to be below US inflation. 98 Annex C of Itaipú Treaty
-
200
400
600
800
1000
1200
1400
1600
1800
2000
2017
2018
2019
2020
2021
2022
2023
2024
2025
2026
2027
2028
2029
2030
2031
2032
2033
2034
2035
2036
2037
2038
2039
2040
2041
2042
2043
2044
2045
2046
2047
2048
2049
2050
MillionUS$
Electricity OppCost1 OppCost2 OppCost3

46
The medium-tariff scenario assumes that the debt servicing component of the guaranteed energy tariff will go to Paraguay rather than being shared (inflating 2011 guaranteed electricity tariff of US$43.8/MWh by 0.95 percent until 2022 and compensation of US$8.9/MWh by US CPI). Under this scenario the revenues from electricity sales to Brazil will always be higher than revenues from sales to RTA.99 Finally, the high-tariff scenario assumes that Paraguay can sell the electricity in Brazil at market price. In the first half of 2012, the average contract price at point of generation in Brazil was US$59.87/MWh (see Table 17). Inflating this price by 2.5 percent100 until 2022 and linking it to the US CPI thereafter shows that sales to RTA would result in large revenue losses. Metal Linked Power Contract with a Resource Rent Tax The previous sub-section gives an indication of the maximum electricity tariff RTA is willing to pay with no other taxes in place. However, the electricity tariff weighs heavily on RTA’s NPV analysis, as these costs are incurred early on in the project. By granting RTA a lower electricity tariff, but charging taxes on revenues, the Government can increase its overall take without harming RTA’s NPV analysis. This sub-section shows that overall revenues for the Government increase by charging a lower tariff rate, but also charging taxes. For this purpose, all taxes in the CRU model are activated (1 percent gross revenue tax on exported share of sales, 9 percent taxes on wages paid by the employee, 10 percent personal income tax, 1 percent property tax, 0.05 percent commercial license tax on book value of plant, 10 percent corporate profit tax, 5 percent tax on all dividends, 16.5 percent of employee benefits). Furthermore, an additional 1 percent environmental tax on total investment, the 14.3 percent tax on dividends paid abroad and the 10.7 percent on interest from bank loans are imposed. The environmental tax is included on the grounds of the adverse environmental impacts resulting from this investment. The dividend tax, with a relatively smaller negative impact on the NPV of the company compared to the positive impact on Paraguay’s NPV, acts as a disincentive to full profit repatriation, and the 10.7 percent tax rate on interest from bank loans is included to discourage transfer pricing. Finally, the model also includes a resource rent tax (RRT), which was not part of the original CRU model. 101 The RRT allows the Government to increase its returns once the company has become profitable. The main advantage of the resource rent tax is its “neutrality.” A company’s calculation of a project’s profitability (which in turn influences the decision of whether to invest) discounts future cash payments more heavily than early payments; therefore,
99 This is also the case when using the average electricity price of US$35.1/MWh as a starting point. 100 This is a conservative inflator as prices are expected to grow faster than inflation as explained in section 3.2 101 While such a tax has been used in the mining industry, we are unaware of its implementation in the aluminum-smelting sector. This can largely be traced back to smaller profit margins. It is unlikely that RTA would be willing to accept a RRT. However, it has been included in this paper for illustrative purposes to compare the maximum possible revenue streams from RTA with potential revenue streams from electricity exports.
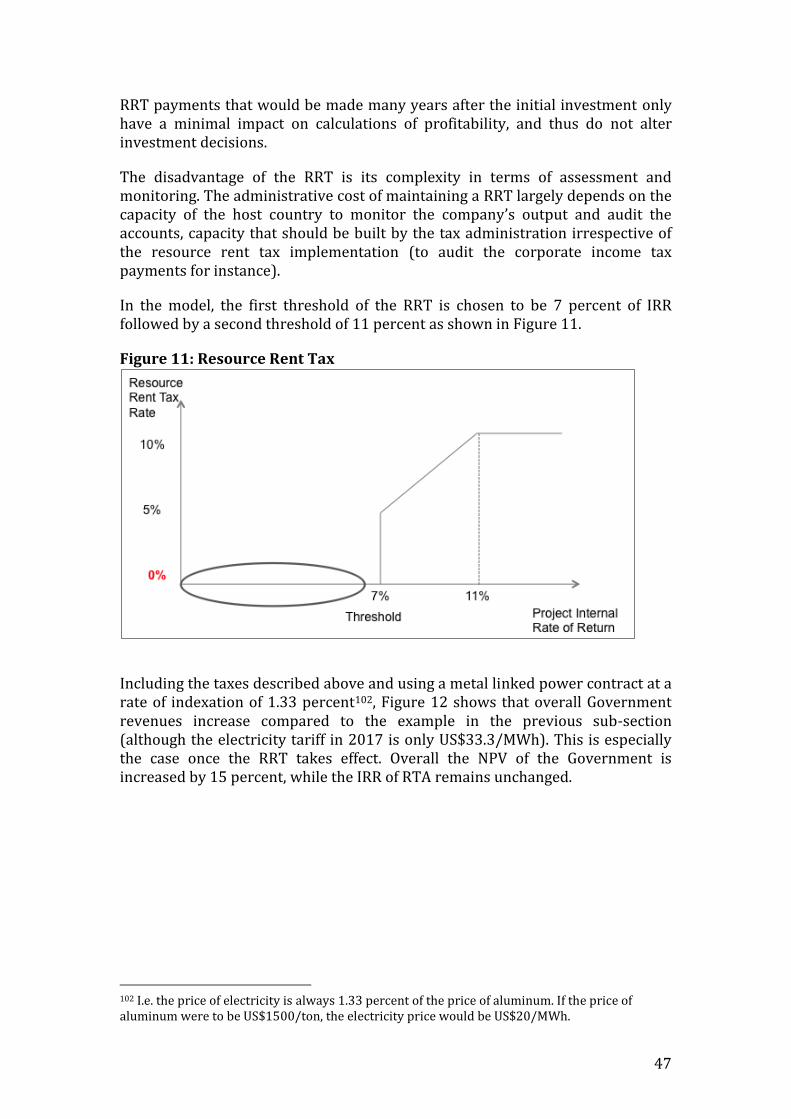
47
RRT payments that would be made many years after the initial investment only have a minimal impact on calculations of profitability, and thus do not alter investment decisions.
The disadvantage of the RRT is its complexity in terms of assessment and monitoring. The administrative cost of maintaining a RRT largely depends on the capacity of the host country to monitor the company’s output and audit the accounts, capacity that should be built by the tax administration irrespective of the resource rent tax implementation (to audit the corporate income tax payments for instance).
In the model, the first threshold of the RRT is chosen to be 7 percent of IRR followed by a second threshold of 11 percent as shown in Figure 11.
Figure 11: Resource Rent Tax
Including the taxes described above and using a metal linked power contract at a rate of indexation of 1.33 percent102, Figure 12 shows that overall Government revenues increase compared to the example in the previous sub-section (although the electricity tariff in 2017 is only US$33.3/MWh). This is especially the case once the RRT takes effect. Overall the NPV of the Government is increased by 15 percent, while the IRR of RTA remains unchanged.
102 I.e. the price of electricity is always 1.33 percent of the price of aluminum. If the price of aluminum were to be US$1500/ton, the electricity price would be US$20/MWh.
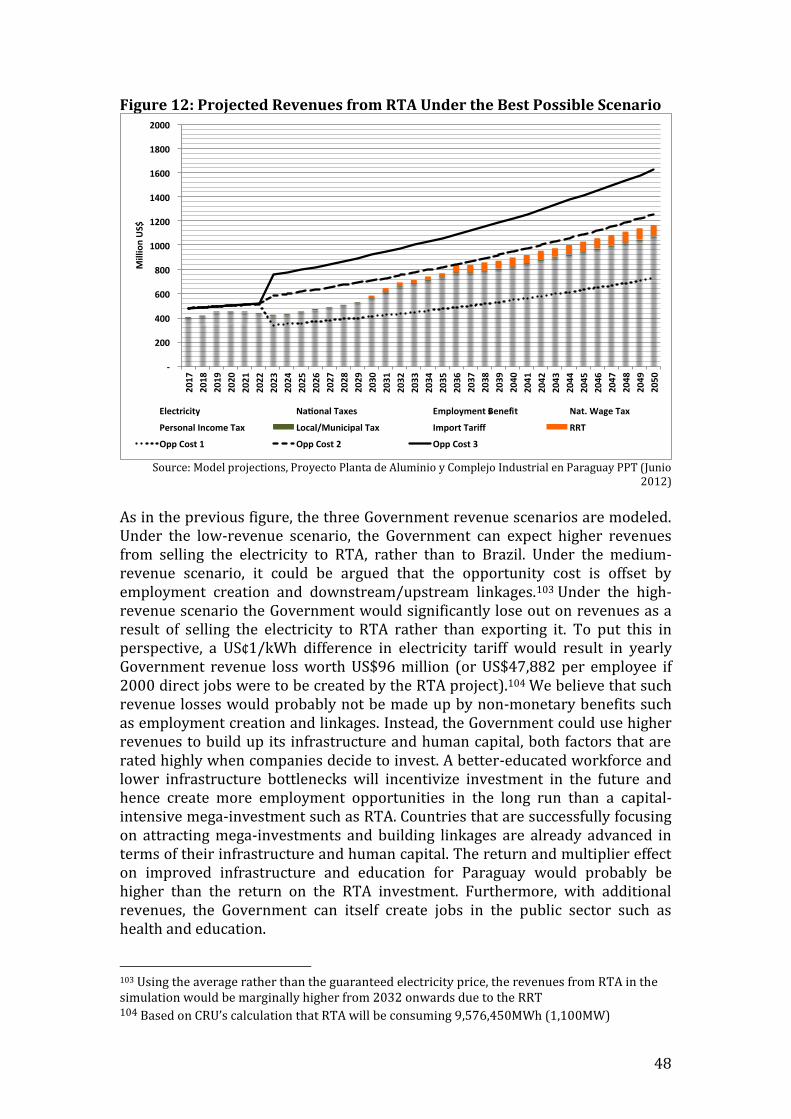
48
Figure 12: Projected Revenues from RTA Under the Best Possible Scenario
Source: Model projections, Proyecto Planta de Aluminio y Complejo Industrial en Paraguay PPT (Junio
2012)
As in the previous figure, the three Government revenue scenarios are modeled. Under the low-revenue scenario, the Government can expect higher revenues from selling the electricity to RTA, rather than to Brazil. Under the medium-revenue scenario, it could be argued that the opportunity cost is offset by employment creation and downstream/upstream linkages.103 Under the high-revenue scenario the Government would significantly lose out on revenues as a result of selling the electricity to RTA rather than exporting it. To put this in perspective, a US¢1/kWh difference in electricity tariff would result in yearly Government revenue loss worth US$96 million (or US$47,882 per employee if 2000 direct jobs were to be created by the RTA project).104 We believe that such revenue losses would probably not be made up by non-monetary benefits such as employment creation and linkages. Instead, the Government could use higher revenues to build up its infrastructure and human capital, both factors that are rated highly when companies decide to invest. A better-educated workforce and lower infrastructure bottlenecks will incentivize investment in the future and hence create more employment opportunities in the long run than a capital-intensive mega-investment such as RTA. Countries that are successfully focusing on attracting mega-investments and building linkages are already advanced in terms of their infrastructure and human capital. The return and multiplier effect on improved infrastructure and education for Paraguay would probably be higher than the return on the RTA investment. Furthermore, with additional revenues, the Government can itself create jobs in the public sector such as health and education.
103 Using the average rather than the guaranteed electricity price, the revenues from RTA in the simulation would be marginally higher from 2032 onwards due to the RRT 104 Based on CRU’s calculation that RTA will be consuming 9,576,450MWh (1,100MW)
-
200
400
600
800
1000
1200
1400
1600
1800
2000
2017
2018
2019
2020
2021
2022
2023
2024
2025
2026
2027
2028
2029
2030
2031
2032
2033
2034
2035
2036
2037
2038
2039
2040
2041
2042
2043
2044
2045
2046
2047
2048
2049
2050
MillionUS$
Electricity Na onalTaxes EmploymentBenefits Nat.WageTax
PersonalIncomeTax Local/MunicipalTax ImportTariff RRT
OppCost1 OppCost2 OppCost3

49
We are optimistic that Paraguay can secure a good sales price for its electricity abroad, higher than today’s tariff. Thus we consider that the high and medium scenarios are highly probable whereas employment creation and downstream/upstream linkages are not guaranteed. Paraguay’s neighbors are all experiencing rapid increases in electricity demand, and at marginal generating costs that are typically far above the US$52.7/MWh that Paraguay receives for its guaranteed electricity exports (see Section 3.2).
Paraguay will most likely absorb its current electricity capacity with its own domestic use within the next 25 years, moving from a large net exporter of electricity to a situation where domestic demand is roughly balanced with supply (see Section 3.2). Of course by then Paraguay will likely have developed new hydroelectric capacity. Nonetheless, we emphasize that Paraguay’s large net export capacity will shrink considerably even without the RTA project. This merely underscores the importance of considering the true opportunity costs of Paraguay’s electricity supplies.
During our consultations, it was raised that revenues from foreign direct investments such as RTA are more likely to be spent responsibly than ‘windfall’ revenues from electricity exports. However, it is unlikely that the country will be able to reap the upstream and downstream benefits of the RTA investment without strong institutional leadership and coordination. Experience has shown that capital-intensive FDIs have lead to institutional mismanagement and hence institutional improvements should be a goal in either scenario. Section 3.3. suggests revenue management systems that could help address these issues. Potential Macroeconomic Impact of the RTA Investment
The RTA investment will have an impact on macroeconomic variables. GDP is expected to grow by 0.5 percent during the construction phase and 1.5 percent during the operation phase.105 During the construction phase, the project will have a temporary negative impact on the balance of payments, as a large proportion of the materials will be imported. Once production commences and aluminum is exported, the project will have a positive impact on the balance of payments. The larger the value added to the aluminum prior being exported, the larger the positive impact on the balance of payments. Inflationary pressure could also be experienced during the construction phase resulting from a sudden rise in demand in the construction sector. During this time period, the Government also needs to monitor the exchange rate movements. Capital inflows combined with rising prices could put upward pressure on the Guarani, thereby hurting other exporting sectors. During the operational phase these problems are unlikely to persist, as the RTA project will not employ and pay workers sufficiently to disrupt the labor market and/or cause demand-pull inflation. To estimate the direct employment opportunities from RTA, it is best to look at similarly-sized aluminum smelters around the world. Table 13 demonstrates that direct employment figures vary, but excluding Venalum, which is an
105 Using CRU’s estimate and IMF’s GDP & deflator estimates to adjust to 2013

50
exception due to the Venezuelan Government employing uncharacteristically high number of workers, the average employment is 0.0032 workers per ton of produced aluminum. Multiplying this by the proposed output of the RTA project, the Government can expect around 2,000 direct employment opportunities during the operational phase of the plant. The publicly available data on national employee percentages is rather scarce, but it can be expected that expatriates, at least during the early years of operation will fill most high skilled jobs. This will continue until Paraguay has a larger pool of educated and experienced engineers.
Table 13: Aluminum Smelters with a Capacity over 350,000Mtpa106
Since direct employment opportunities are relatively small, the most important potential contributor of the RTA project is the creation of linkages to downstream industries that process the aluminum and backward linkages to
106 Excluding China, India and Russia
Country Plant ShareholdersCapacity(Mtpa)
Directemployees
Employeesperton
NationalEmployees
IndustrialPark
%ofoutputfornationalmarket
GDP
contribution
AbuDabi Emal•Dubal(50%)•Mubadala(50%)
750000 2000 0.0027 - No - -
AustraliaBoyneSmelters
•RioTintoalcan(59.4%)•Partners(40.6%)
559000 1300 0.0023 - No 0% -
AustraliaPortlandaluminum
•Alcoa(55%)•CITIC(22.5%)•Marubeni(22.5%)
350000 600 0.0017 - No 0% -
Australia Tomago•RioTintoAlcan(52%)•GoveAluminium(36%)•HydroAluminum(12%)
533000 1200 0.0042 - No 0% -
Bahrein Alba
•MumtalakatHoldingCompany(69%)•SABICInvestmentCompany(21%)•GeneralPublic(10%)
890000 2730 0.0031 87% No 48% -
Brazil Albras•Hydro(51%)•NAAC(49%)
460000 1950 0.0042 98% No 3% -
BrazilVotorantimMetais-CBA
•CBA(100%) 475000 5638 0.0119 - No 50% -
Canada Alouette
•RioTintoAlcan(40%)•AMAG(20%)•HydroAluminum(20%)•SGF(13.33%)•Marubeni(6.67%)
572000 1000 0.0017 - - 50%* -
Canada Alma •RioTintoAlcan(100%) 438000 780 0.0018 - No - -
Canada Becancour•Alcoa(75%)•RioTintoAlcan(25%)
430000 1075 0.0025 - - - -
Dubai Dubal •Dubal(100%) 1207000 3800 0.0031 16% No 8% 2.5%
MozambiqueMozal
•BHPBilliton(47%)•Mitsibushi(25%)•IDC(24%)•Government(4%)
500000 1150 0.0023 - Yes 0% 3%
OmanSoharAluminium
•OmanOilCorporation(40%)•ADWEA(40%)•Alcan(20%)
360000 1000 0.0028 70% Yes 60% 0.6%
Qatar Qatalum•QatarPetroleum(50%)•Hydro(50%)
585000 1500 0.0026 - No - -
SaudiArabiaMa’aden(2014)
- 740000 - - - No 52% -
SouthAfrica Hillside •BHPBilliton(100%) 700000 2000 0.0029 - No 0%* 0.9%
Venezuela Venalum •Venalum(100%) 430000 5000 0.0116 - No 25% -
Source:Teamanalysis,Emal,Alcoa,RioTinto,Alba,Albras,VotoratimMetais,Alouette,Dubal,WorldBank,Shoar,Qatalum,Maadem,BhpBiliton,Venalum
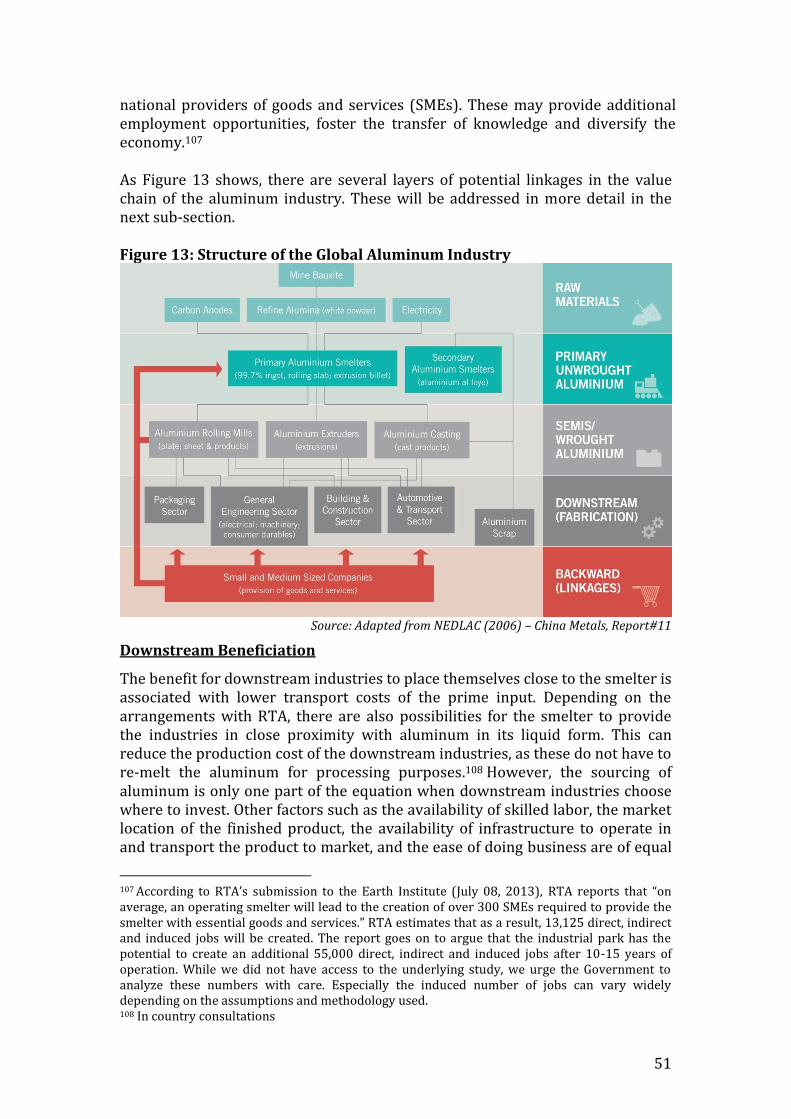
51
national providers of goods and services (SMEs). These may provide additional employment opportunities, foster the transfer of knowledge and diversify the economy.107 As Figure 13 shows, there are several layers of potential linkages in the value chain of the aluminum industry. These will be addressed in more detail in the next sub-section. Figure 13: Structure of the Global Aluminum Industry
Source: Adapted from NEDLAC (2006) – China Metals, Report#11
Downstream Beneficiation
The benefit for downstream industries to place themselves close to the smelter is associated with lower transport costs of the prime input. Depending on the arrangements with RTA, there are also possibilities for the smelter to provide the industries in close proximity with aluminum in its liquid form. This can reduce the production cost of the downstream industries, as these do not have to re-melt the aluminum for processing purposes.108 However, the sourcing of aluminum is only one part of the equation when downstream industries choose where to invest. Other factors such as the availability of skilled labor, the market location of the finished product, the availability of infrastructure to operate in and transport the product to market, and the ease of doing business are of equal
107 According to RTA’s submission to the Earth Institute (July 08, 2013), RTA reports that “on average, an operating smelter will lead to the creation of over 300 SMEs required to provide the smelter with essential goods and services.” RTA estimates that as a result, 13,125 direct, indirect and induced jobs will be created. The report goes on to argue that the industrial park has the potential to create an additional 55,000 direct, indirect and induced jobs after 10-15 years of operation. While we did not have access to the underlying study, we urge the Government to analyze these numbers with care. Especially the induced number of jobs can vary widely depending on the assumptions and methodology used. 108 In country consultations
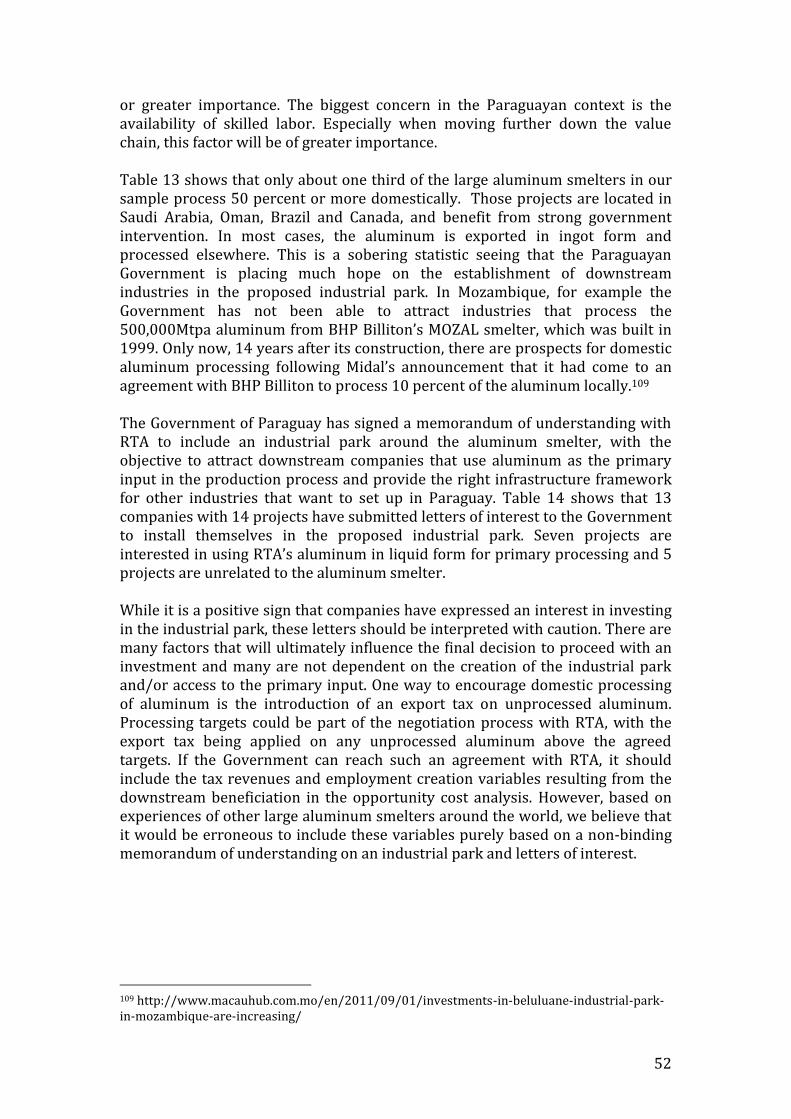
52
or greater importance. The biggest concern in the Paraguayan context is the availability of skilled labor. Especially when moving further down the value chain, this factor will be of greater importance. Table 13 shows that only about one third of the large aluminum smelters in our sample process 50 percent or more domestically. Those projects are located in Saudi Arabia, Oman, Brazil and Canada, and benefit from strong government intervention. In most cases, the aluminum is exported in ingot form and processed elsewhere. This is a sobering statistic seeing that the Paraguayan Government is placing much hope on the establishment of downstream industries in the proposed industrial park. In Mozambique, for example the Government has not been able to attract industries that process the 500,000Mtpa aluminum from BHP Billiton’s MOZAL smelter, which was built in 1999. Only now, 14 years after its construction, there are prospects for domestic aluminum processing following Midal’s announcement that it had come to an agreement with BHP Billiton to process 10 percent of the aluminum locally.109 The Government of Paraguay has signed a memorandum of understanding with RTA to include an industrial park around the aluminum smelter, with the objective to attract downstream companies that use aluminum as the primary input in the production process and provide the right infrastructure framework for other industries that want to set up in Paraguay. Table 14 shows that 13 companies with 14 projects have submitted letters of interest to the Government to install themselves in the proposed industrial park. Seven projects are interested in using RTA’s aluminum in liquid form for primary processing and 5 projects are unrelated to the aluminum smelter. While it is a positive sign that companies have expressed an interest in investing in the industrial park, these letters should be interpreted with caution. There are many factors that will ultimately influence the final decision to proceed with an investment and many are not dependent on the creation of the industrial park and/or access to the primary input. One way to encourage domestic processing of aluminum is the introduction of an export tax on unprocessed aluminum. Processing targets could be part of the negotiation process with RTA, with the export tax being applied on any unprocessed aluminum above the agreed targets. If the Government can reach such an agreement with RTA, it should include the tax revenues and employment creation variables resulting from the downstream beneficiation in the opportunity cost analysis. However, based on experiences of other large aluminum smelters around the world, we believe that it would be erroneous to include these variables purely based on a non-binding memorandum of understanding on an industrial park and letters of interest.
109 http://www.macauhub.com.mo/en/2011/09/01/investments-in-beluluane-industrial-park-in-mozambique-are-increasing/
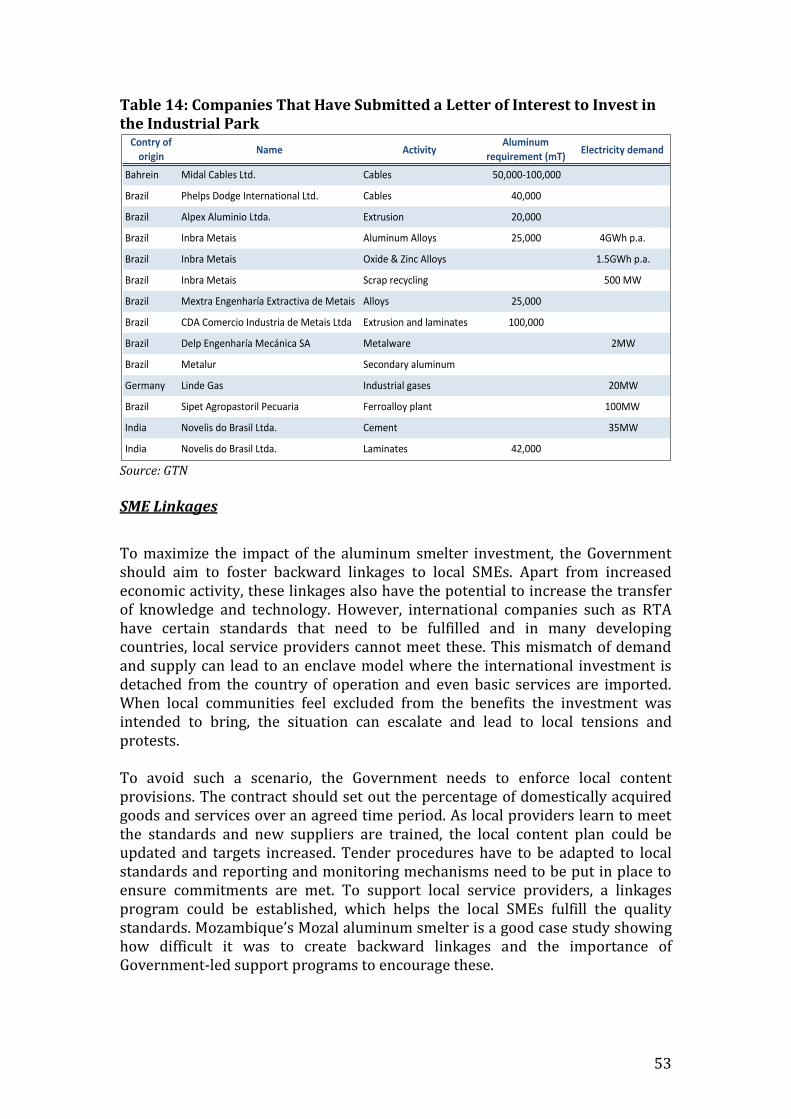
53
Table 14: Companies That Have Submitted a Letter of Interest to Invest in the Industrial Park
Source: GTN
SME Linkages
To maximize the impact of the aluminum smelter investment, the Government should aim to foster backward linkages to local SMEs. Apart from increased economic activity, these linkages also have the potential to increase the transfer of knowledge and technology. However, international companies such as RTA have certain standards that need to be fulfilled and in many developing countries, local service providers cannot meet these. This mismatch of demand and supply can lead to an enclave model where the international investment is detached from the country of operation and even basic services are imported. When local communities feel excluded from the benefits the investment was intended to bring, the situation can escalate and lead to local tensions and protests. To avoid such a scenario, the Government needs to enforce local content provisions. The contract should set out the percentage of domestically acquired goods and services over an agreed time period. As local providers learn to meet the standards and new suppliers are trained, the local content plan could be updated and targets increased. Tender procedures have to be adapted to local standards and reporting and monitoring mechanisms need to be put in place to ensure commitments are met. To support local service providers, a linkages program could be established, which helps the local SMEs fulfill the quality standards. Mozambique’s Mozal aluminum smelter is a good case study showing how difficult it was to create backward linkages and the importance of Government-led support programs to encourage these.
Contryoforigin
Name ActivityAluminum
requirement(mT)Electricitydemand
Bahrein MidalCablesLtd. Cables 50,000-100,000
Brazil PhelpsDodgeInternationalLtd. Cables 40,000
Brazil AlpexAluminioLtda. Extrusion 20,000
Brazil InbraMetais AluminumAlloys 25,000 4GWhp.a.
Brazil InbraMetais Oxide&ZincAlloys 1.5GWhp.a.
Brazil InbraMetais Scraprecycling 500MW
Brazil MextraEngenharíaExtractivadeMetais Alloys 25,000
Brazil CDAComercioIndustriadeMetaisLtda Extrusionandlaminates 100,000
Brazil DelpEngenharíaMecánicaSA Metalware 2MW
Brazil Metalur Secondaryaluminum
Germany LindeGas Industrialgases 20MW
Brazil SipetAgropastorilPecuaria Ferroalloyplant 100MW
India NovelisdoBrasilLtda. Cement 35MW
India NovelisdoBrasilLtda. Laminates 42,000

54
Box 7: Linkages Program for the Mozal Aluminum Smelter in Mozambique With a view to creating greater benefits from foreign direct investment, the Mozambican Government created the policy platform for SME linkage programs. In 1998/1999, prior to the start of operation of Mozal, the Center of Investment Promotion (CPI) conducted a survey to identify potential backward linkages. It concluded that 90 percent of the 370 identified SMEs did not have the quality standards, technological capacity or experience to provide the necessary services. 110 In cooperation with the International Financial Corporation (IFC), Mozal launched its SME development program in 2001 to build local capacity in order to fulfill Mozal’s procurement requirements. During the first construction phase the linkages to the Mozambican economy were minimal, mainly because the contracts were bundled with components that Mozambican SMEs could not fulfill and because the procurement contracts were in English.111 During the second construction phase and subsequent operational phase, the program identified specific contracts, which could be sourced locally. Mozal increased its monthly spending from US$5 million with 40 local firms in 2002 to US$17 million with 250 firms in 2007.112 Between 2006 and 2009, over 140 SMEs were trained in management and technical skills, and 75 SMEs were actively enrolled in the program.113
There has been criticism that many of the SMEs, while registered in Mozambique, were importing most goods from South Africa and not manufacturing them in Mozambique. On average, about two-thirds of expenditure spent on “Mozambican” companies has gone into imports of raw materials and intermediate goods, spare parts, equipment, energy, and fuel
from South Africa. The value-added therefore had a limited impact on the local economy.114
Mozambique’s experience shows that it is necessary for the Government to work closely together with the investor to ensure the creation of backward linkages. The first step involves identifying the goods and services that could potentially be demanded by the RTA project and secondary industries during the construction and operation phases. Table 15 could be used as a reference example considering three key factors that impact employment and income generation at a local level: (1) whether the goods or services could be sourced from the local, regional or national market; (2) the potential level of demand; and (3) the workers’ capacity requirements. This type of analysis will help identify the gap between the supply and demand and help to set up a training
110 Castel-Branco and Goldin (2003) – Impacts of the Mozal Aluminum Smelter on the Mozambican Economy 111 Robins, et al 2009 – TNC FDI Firms and Domestic SME linkages: Reflecting three SADC Case Studies 112 IFC 2007: Developing SMEs through Business Linkages 113 IFC: The IFC Mozlink Program 114 Castel-Branco and Goldin (2003) – Impacts of the Mozal Aluminum Smelter on the Mozambican Economy
55
program that addresses the particular needs. Such analysis should be the product of a joint-effort between RTA and the Government. Table 15: Business Opportunities for Local Procurement
Source: Team analysis
Apart from discussing these issues with the investor, the Government institutions also need to coordinate with each other. The Vice-Ministry of SMEs must be in close contact with REDIEX to project investments and better understand investor requirements. Together with the Ministry of Education it needs to design and implement capacity building programs. A long term SME support strategy should be drafted that trains local suppliers on international standards, quality certification, access to credit, management skills, knowledge sharing and access to market information. These training programs need to be tailored to projected investments and existing standards of local suppliers. Figure 14 shows the model that was adopted in Mozambique after years of struggling to increase linkages to the local economy. In addition, investors should be encouraged to set up Enterprise Centers/ Centers for Knowledge Transfer and Business Incubators. Rio Tinto115 has experience using enterprise centers or business incubator models to provide one-stop shops for SMEs to access contract opportunities, e-procurement systems, training courses, information and communications technology tools, and business development services. These centers can also serve as business incubators for micro-entrepreneurs.116
115 Such as BP in Azerbaijan, Exxon in Chad and Rio Tinto in Australia 116 Paragraph adapted from http://www.ccsi.columbia.edu/files/vale/content/Zambezi_Resource_Based_Development-_Final_Consultative_Draft.pdf
Type SupplyLocation LevelofDemand CapacityRequired Goods&Services
Goods*(nofood) National Medium Medium-Skill Automotiveparts
Goods*(nofood) National Medium Medium-Skill Smallmotorvehicles
Goods*(nofood) National High Medium-Skill Fuels,lubesandgreases
Goods*(nofood) National High Medium-Skill Cleaningsupplies
Goods*(nofood) Local High Medium-Skill Uniforms
Goods*(nofood) Local High Medium-Skill Furnitureandfixtures
Goods*(nofood) National High Medium-Skill HealthSupplies
Goods*(nofood) Local High Medium-Skill Laundryequipment
Goods*(nofood) National High Medium-Skill Machinedtoolsandspareparts
Goods*(nofood) Local High Medium-Skill Officeequipmentandstationary
Goods*(nofood) Local Medium Medium-Skill Appliancesandelectricalgoods
Goods*(nofood) National Medium Medium-Skill Constructionsupplies
Goods*(nofood) National Low High-Skill SoftwareandHardware
Goods*(nofood) National Low Medium-Skill Explosives
Goods*(nofood) National Low Medium-Skill AgriculturalInputs
Food|Cereal Regional High Low-Skill Maize
Food|Cereal Regional High Low-Skill Rice
Food|Legumes/Vegetables Regional High Low-Skill Beans
Food|Legumes/Vegetables Regional High Low-Skill Onion
Food|Legumes/Vegetables Local High Low-Skill Tomato
Food|Legumes/Vegetables Local High Low-Skill Peppers
Food|Legumes/Vegetables Local High Low-Skill Carrots
Food|Legumes/Vegetables Local High Low-Skill Lettuce
Food|Livestock/Fish Regional High Low-Skill Beef(cow,pork,goat)
Food|Livestock/Fish Regional Medium Low-Skill Fish
Food|Livestock/Fish Local High Low-Skill Poultry
Food|Oilseeds Regional Low Low-Skill Sesame
Food|Oilseeds Regional Medium Low-Skill Peanut
Food|Roots/Tubers Regional Medium Low-Skill Cassava
Food|Roots/Tubers Regional Medium Low-Skill SweetPotato
Food|Roots/Tubers Regional Medium Low-Skill IrishPotato
Food|Treecrops/Fruits Regional Medium Low-Skill Cashew
Food|Treecrops/Fruits Regional High Low-Skill Banana
Food|Treecrops/Fruits Regional High Low-Skill Orange
Food|Treecrops/Fruits Regional High Low-Skill Mango
Food|Treecrops/Fruits Regional Low Low-Skill Pineapple
Food|Treecrops/Fruits Regional Low Low-Skill Coconut
Source:TeamAnalysis
Continue,Table?,Businessopportunitiesforlocalprocurement

56
Figure 14: Developing SMEs Through Business Linkages – The Mozlink Model
Source: IFC (2007) – Developing SMEs through Business Linkages
Finally, it is important for the Government to carefully draft the local content provisions. The specificity of the provisions will ensure better enforcement of the requirements. Table 16 describes common legal challenges in local content provisions that may be interpreted differently by the investor and Government officials and may therefore lead to loopholes.
Table 16: Legal Challenges for Local Content Provisions
Challenges Loophole Solution
Definition of “local company”
If no adequate definition is agreed on there is the possibility of having suppliers that are locally registered but with no local ownership or local employment
“Local Company” = significant participation of “locals” in ownership, management and employment (significant to be defined)
Definition of “local sourcing and local goods”
Possible to source from locally-owned or locally-registered trading company– instead of locally manufacturing
“Local Goods” = “high level of local value additions” (high level to be defined)
Definition of “competitive”
It is easy to hide behind the argument that local goods and services are not competitive when the clause includes “source goods locally when prices are at competitive international terms and goods and services of quality comparable with international
It is more efficient to require local sourcing “except in circumstances where the Company can demonstrate it is not economically reasonable to do so”

57
standards”
Local Content Plan
If no requirement for periodic review of the plan is put in place, the mega-project will always use the same targets established at the beginning of the project.
Establish mechanisms for periodic updating of the list of foreign goods/ local goods on a time scale
Timing for Local Content Planning
If not done at the feasibility study, it will not be part of planning and financing
Require a local content plan prior approval of the feasibility study
Source: Team Analysis
Beyond ensuring tight contractual local provisions, the Government should ensure that the investment framework for Paraguay as described in Annex B is updated to maximize the investment impact on the local economy.
2.3. Summary of Findings and Recommendations 1. Reliable access to clean electricity at competitive prices will drive growth
and investment in the manufacturing sector. To guide these investments, an industrial strategy and policy could be prepared based on Paraguay’s comparative advantages and the goals the Government aims to achieve. In the short term, the agro-processing sector could be prioritized, seeing that it would add value to agriculture goods and has the potential to provide many employment opportunities. The Government could use the product space approach to choose a ‘diversification path’ thereafter. Spatial corridor planning and industrial parks can be used as a tool to give targeted support to the manufacturing sector, but the Government needs to ensure private sector participation to share the risk; choose the right location based on access to infrastructure, markets and labor; plan for educational programs to build the skills of the workforce serving the park; and put in place a regulatory framework that guarantees linkages to the local economy.
2. Energy-intensive industries, and particularly the aluminum-smelting sector, do not by themselves create many employment opportunities, and linkages to the local economy are not guaranteed. In considering the sale of electricity to energy-intensive foreign investors such as the proposed RTA aluminum smelter, the Government should be careful to consider the opportunity cost of the electricity. Unless there are truly significant spillovers from the RTA project, the proposed project should not pay less in tariffs and taxes than Paraguay would receive from selling the electricity directly to Brazil or other foreign markets. We believe that such revenue losses are unlikely to be made up by non-monetary benefits such as employment creation and cross-sector linkages. The Government could and should use the higher revenues to build up its infrastructure and human capital, both of which are rated highly by foreign companies deciding where to invest. Countries that are successfully focusing on attracting mega-investments and building linkages are already advanced
58
in terms of their infrastructure and human capital. A better-educated workforce and lower infrastructure bottlenecks will incentivize investment in the future and hence tend to create even more employment opportunities in the long run than a capital-intensive mega-investment such as RTA.
3. The decision of the Government to accept the potential RTA investment is highly dependent on the expected post-Itaipú debt negotiation with Brazil and the price that Paraguay can expect to receive from future electricity exports. Under current and anticipated aluminum prices, and given the business model of the aluminum industry, it is likely that the Government would need to sell its electricity to the smelter at a lower price than if it were exporting it to neighboring countries at market prices. We express our caution over any such arrangement. If the Government moves forward with the proposal, it is recommended that: (1) it accepts the project proposal only if Government revenues from the project are not significantly lower than the revenues from electricity exports; (2) it creates the right regulatory and business environment to attract downstream industries; (3) it includes local content provisions in the contract to establish technology upgrading and backward linkages to the local economy, (4) it requires RTA to setup a training/business incubator program to help local SMEs meet the quality standards for goods and services to the smelter, and (5) it ensures that high environmental regulations are in place and adhered to.

59
3. Fair Pricing of Electricity Sales This chapter will address Paraguay’s past and potential future electricity revenues from Itaipú. As Paraguay’s single most important resource, the hydroelectricity sold to Brazil must be properly priced. The evidence suggests, however, that electricity sales have been systematically underpriced for three decades, leading to significant losses of earnings by Paraguay. In the future, Paraguay should sell its excess electricity from the Itaipú dam at regional market prices.
3.1. Past Itaipú Electricity Sales Itaipú was built on the assumption that both Brazil and Paraguay would share equally in the benefits of the hydropower.117 It was recognized that Paraguay would have a lower domestic use than its allocation of half of the hydropower, so that it would sell its excess electricity to Brazil and earn export revenues on those sales. The original Itaipú Treaty calls for a just price (“precio justo”) on those export sales. In our estimation, Paraguay has not been receiving a fair market price during the life of the project. To estimate a fair market price, we need to understand the Itaipú pricing model. Itaipú’s electricity production is jointly owned by Brazil and Paraguay on a 50-50 basis. Itaipú Binacional (IB) sells the electricity to the two countries at a given US-dollar price per MWh. In addition, when Paraguay exports a part of its electricity to Brazil, Brazil makes an additional payment to Paraguay known as a compensation payment. Once IB receives the revenues for its sales to both countries, it uses the revenues for three main purposes: to service the outstanding IB debt (costo de cargas financieras de préstamos + costo de amortizaciones de préstamos), to pay operations and maintenance (costo de cargas de administración y supervisión + costo de gastos de explotación), and to make a royalty payment (costo de royalties) to each country each year on a 50-50 basis. A small proportion is also used to repay the initial capital investment of the utility companies (costo de utilidades de capital). Let us define variables as follows: GWh IB annual gigawatt-hours sold by IB GWhP IB annual production owned by Paraguay (= 50% of GWh) GWhD IB annual production used domestically by Paraguay GWhX Electricity exports from Paraguay to Brazil (GWhX = GWhP – GWhD) P Price of Electricity sold by IB to Brazil and Paraguay per gigawatt-hour DS Debt service of IB per gigawatt-hour OM Operations and Maintenance costs per gigawatt-hour R Royalties per gigawatt-hour C Compensation paid by Brazil per gigawatt-hour of imports FMP Fair market price of a gigawatt-hour sold to Brazil by Paraguay T Transmission cost per gigawatt-hour to Brazil Market 117 For an overview of the Itaipú debt history, please refer to annex C.
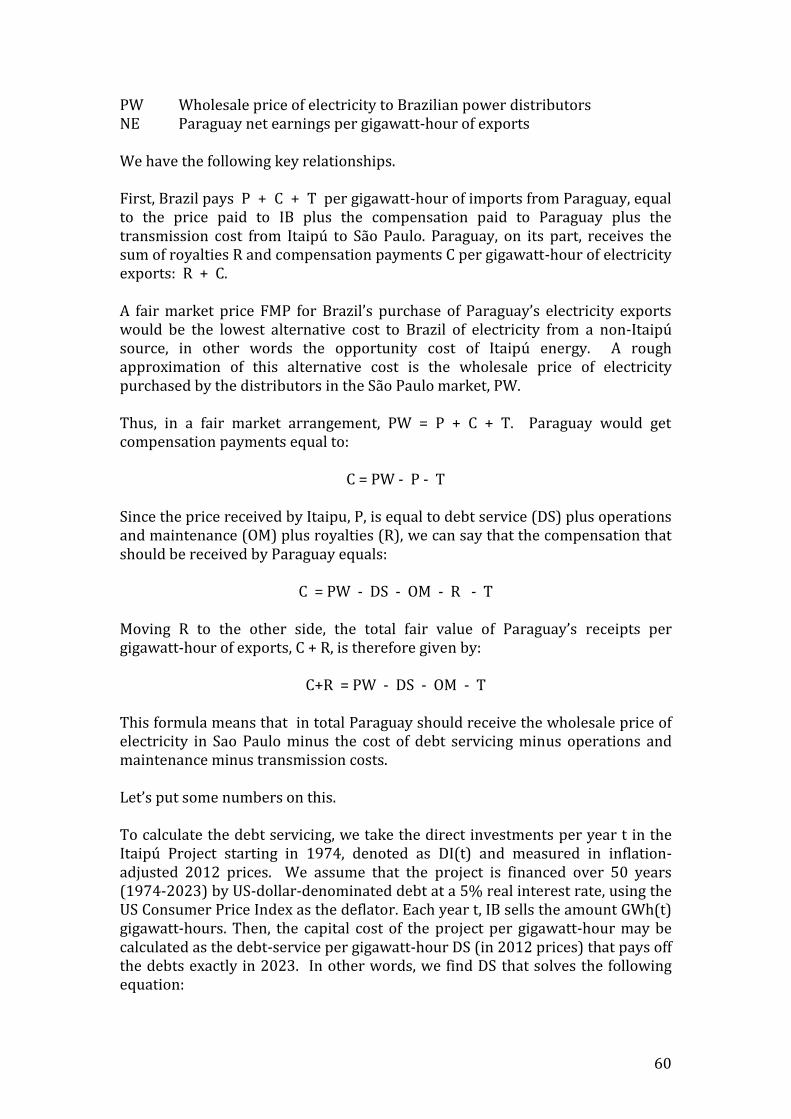
60
PW Wholesale price of electricity to Brazilian power distributors NE Paraguay net earnings per gigawatt-hour of exports We have the following key relationships. First, Brazil pays P + C + T per gigawatt-hour of imports from Paraguay, equal to the price paid to IB plus the compensation paid to Paraguay plus the transmission cost from Itaipú to São Paulo. Paraguay, on its part, receives the sum of royalties R and compensation payments C per gigawatt-hour of electricity exports: R + C. A fair market price FMP for Brazil’s purchase of Paraguay’s electricity exports would be the lowest alternative cost to Brazil of electricity from a non-Itaipú source, in other words the opportunity cost of Itaipú energy. A rough approximation of this alternative cost is the wholesale price of electricity purchased by the distributors in the São Paulo market, PW. Thus, in a fair market arrangement, PW = P + C + T. Paraguay would get compensation payments equal to:
C = PW - P - T Since the price received by Itaipu, P, is equal to debt service (DS) plus operations and maintenance (OM) plus royalties (R), we can say that the compensation that should be received by Paraguay equals:
C = PW - DS - OM - R - T Moving R to the other side, the total fair value of Paraguay’s receipts per gigawatt-hour of exports, C + R, is therefore given by:
C+R = PW - DS - OM - T This formula means that in total Paraguay should receive the wholesale price of electricity in Sao Paulo minus the cost of debt servicing minus operations and maintenance minus transmission costs. Let’s put some numbers on this. To calculate the debt servicing, we take the direct investments per year t in the Itaipú Project starting in 1974, denoted as DI(t) and measured in inflation-adjusted 2012 prices. We assume that the project is financed over 50 years (1974-2023) by US-dollar-denominated debt at a 5% real interest rate, using the US Consumer Price Index as the deflator. Each year t, IB sells the amount GWh(t) gigawatt-hours. Then, the capital cost of the project per gigawatt-hour may be calculated as the debt-service per gigawatt-hour DS (in 2012 prices) that pays off the debts exactly in 2023. In other words, we find DS that solves the following equation:

61
∑ ∑
When we calculate the actual debt-servicing cost of the project, we find that it comes to $31,200 per GWh. Using a similar calculation for OM, we find that on average the operations and maintenance of the project has come to $6,500 per GWh. For the year 2010, the OM was $12,170/GWh. We estimate transmission costs as around $4,400 per GWh. Consider the situation as of 2012. The wholesale price in Brazil for electricity was around $85,000 per gigawatt-hour.118 On this basis, Paraguay should have received compensation plus royalties, C+R, equal to: $37,230 per GWhX = $85,000 - $31,200 - $12,170 - $4,400 per GWhX In fact, Paraguay received far less than this. In 2012, compensation payments from Brazil to Paraguay were only $9,350 per gigawatt-hour and royalties were $5,060 per gigawatt-hour, for a total of $14,410 per gigawatt-hour. 119 The difference is of course considerable. Since Paraguay exported 32,805 GWhX to Brazil, the difference between $37,230 and $14,410 per GWhX amounts to a loss of earnings to Paraguay of $748.6 million in 2012 alone. It is our contention that Paraguay has been dramatically undercompensated for its electricity exports to Brazil since the start of Itaipú. For example, before 2011, compensation payments to Paraguay were only $3,064 per GWh (in 2012 prices). During the entire period, the sum of royalties and compensation payments was consistently very low, seemingly far below a fair market price for Paraguay’s export earnings. If carefully calculated, the lost earnings in Paraguay would come to many billions of dollars. We have not made that calculation since we were not privy to an accurate assessment of the wholesale market price of electricity in Brazil (i.e. the alternative price to IB electricity), yet we suspect that a careful accounting of all costs and prices would show that Brazil has underpaid Paraguay very significantly for decades. We do not expect that the past underpayments will all be made up through increased compensation. Paraguay did, in the past, agree to these low tariffs, even if the bargaining power was on Brazil’s side. Still, we do believe that the compensation now paid to Paraguay by Brazil should be increased considerably, in view of both the fair market price to Paraguay of its electricity sales, and the history of past underpayments. This will of course reduce the surplus earned by Brazilian energy companies that are obtaining IB electricity at sub-market prices.
118 According to ANEEL, the average electricity tariff in the South Eastern region of Brazil in 2012 was G294.87/MWh. Using ANEELs decomposition of the tariff, generation and transmission charges made up 35.8% and 6.7% respectively. Adding these two components makes up PW. 119 Calculations based on data received by the Central bank on electricity consumption, royalty revenues and compensation revenues
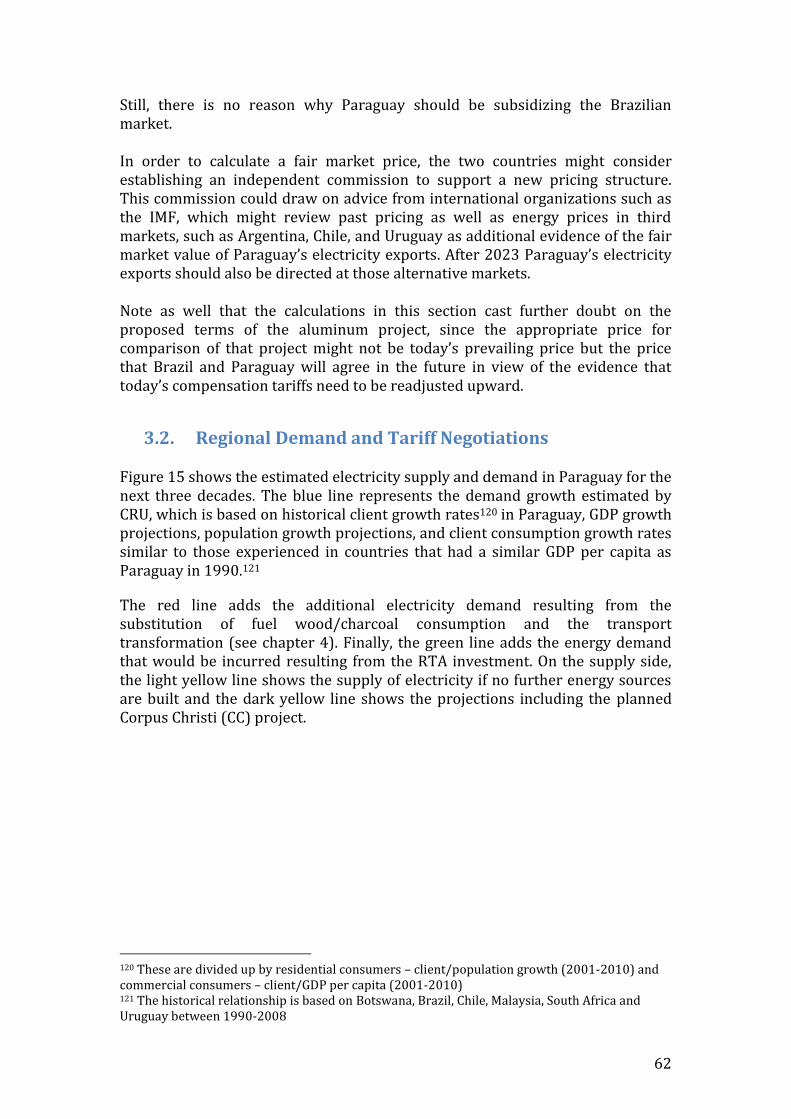
62
Still, there is no reason why Paraguay should be subsidizing the Brazilian market. In order to calculate a fair market price, the two countries might consider establishing an independent commission to support a new pricing structure. This commission could draw on advice from international organizations such as the IMF, which might review past pricing as well as energy prices in third markets, such as Argentina, Chile, and Uruguay as additional evidence of the fair market value of Paraguay’s electricity exports. After 2023 Paraguay’s electricity exports should also be directed at those alternative markets. Note as well that the calculations in this section cast further doubt on the proposed terms of the aluminum project, since the appropriate price for comparison of that project might not be today’s prevailing price but the price that Brazil and Paraguay will agree in the future in view of the evidence that today’s compensation tariffs need to be readjusted upward.
3.2. Regional Demand and Tariff Negotiations Figure 15 shows the estimated electricity supply and demand in Paraguay for the next three decades. The blue line represents the demand growth estimated by CRU, which is based on historical client growth rates120 in Paraguay, GDP growth projections, population growth projections, and client consumption growth rates similar to those experienced in countries that had a similar GDP per capita as Paraguay in 1990.121
The red line adds the additional electricity demand resulting from the substitution of fuel wood/charcoal consumption and the transport transformation (see chapter 4). Finally, the green line adds the energy demand that would be incurred resulting from the RTA investment. On the supply side, the light yellow line shows the supply of electricity if no further energy sources are built and the dark yellow line shows the projections including the planned Corpus Christi (CC) project.
120 These are divided up by residential consumers – client/population growth (2001-2010) and commercial consumers – client/GDP per capita (2001-2010) 121 The historical relationship is based on Botswana, Brazil, Chile, Malaysia, South Africa and Uruguay between 1990-2008
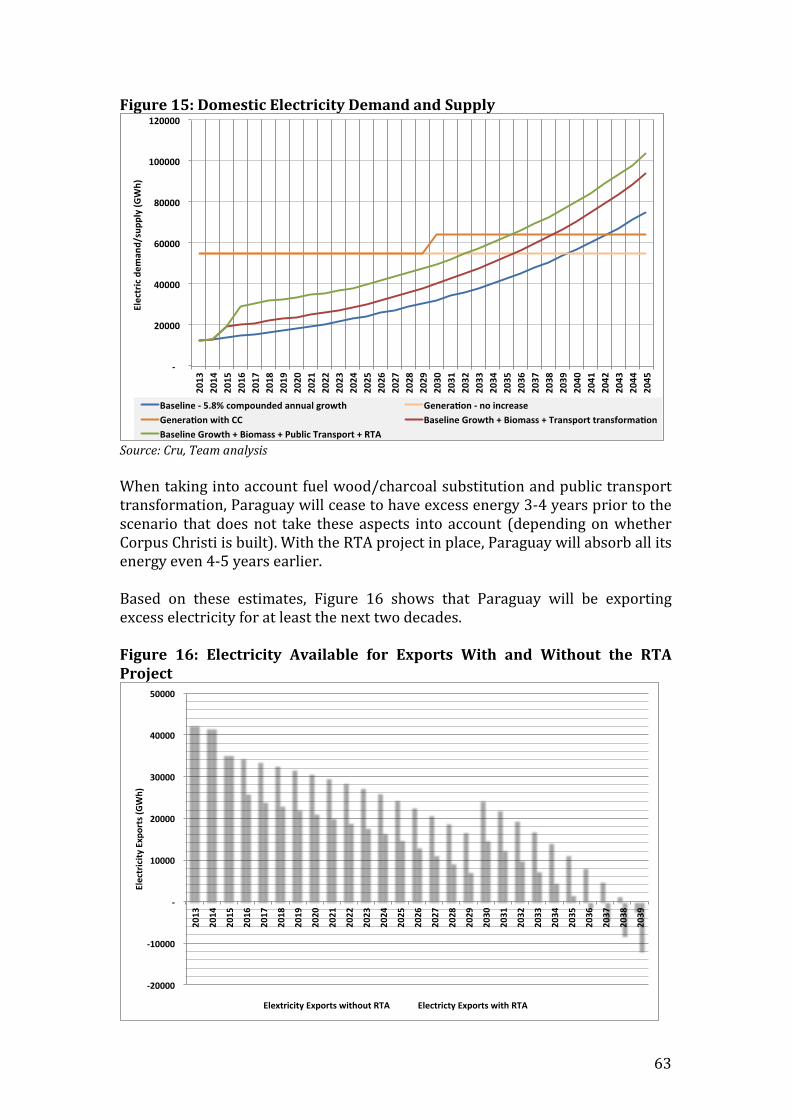
63
Figure 15: Domestic Electricity Demand and Supply
Source: Cru, Team analysis
When taking into account fuel wood/charcoal substitution and public transport transformation, Paraguay will cease to have excess energy 3-4 years prior to the scenario that does not take these aspects into account (depending on whether Corpus Christi is built). With the RTA project in place, Paraguay will absorb all its energy even 4-5 years earlier. Based on these estimates, Figure 16 shows that Paraguay will be exporting excess electricity for at least the next two decades. Figure 16: Electricity Available for Exports With and Without the RTA Project
-20000
-10000
-
10000
20000
30000
40000
50000
2013
2014
2015
2016
2017
2018
2019
2020
2021
2022
2023
2024
2025
2026
2027
2028
2029
2030
2031
2032
2033
2034
2035
2036
2037
2038
2039
ElectricityExports(GWh)
ElextricityExportswithoutRTA ElectrictyExportswithRTA
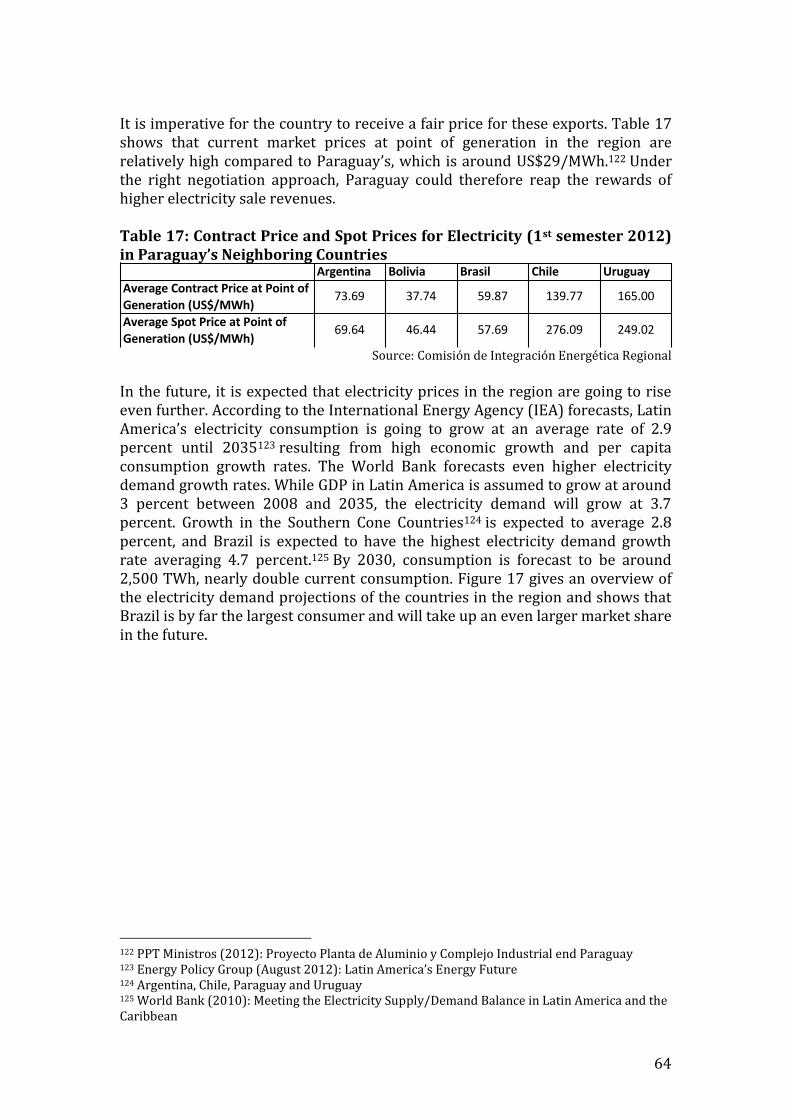
64
It is imperative for the country to receive a fair price for these exports. Table 17 shows that current market prices at point of generation in the region are relatively high compared to Paraguay’s, which is around US$29/MWh.122 Under the right negotiation approach, Paraguay could therefore reap the rewards of higher electricity sale revenues. Table 17: Contract Price and Spot Prices for Electricity (1st semester 2012) in Paraguay’s Neighboring Countries
Source: Comisión de Integración Energética Regional
In the future, it is expected that electricity prices in the region are going to rise even further. According to the International Energy Agency (IEA) forecasts, Latin America’s electricity consumption is going to grow at an average rate of 2.9 percent until 2035123 resulting from high economic growth and per capita consumption growth rates. The World Bank forecasts even higher electricity demand growth rates. While GDP in Latin America is assumed to grow at around 3 percent between 2008 and 2035, the electricity demand will grow at 3.7 percent. Growth in the Southern Cone Countries124 is expected to average 2.8 percent, and Brazil is expected to have the highest electricity demand growth rate averaging 4.7 percent.125 By 2030, consumption is forecast to be around 2,500 TWh, nearly double current consumption. Figure 17 gives an overview of the electricity demand projections of the countries in the region and shows that Brazil is by far the largest consumer and will take up an even larger market share in the future.
122 PPT Ministros (2012): Proyecto Planta de Aluminio y Complejo Industrial end Paraguay 123 Energy Policy Group (August 2012): Latin America’s Energy Future 124 Argentina, Chile, Paraguay and Uruguay 125 World Bank (2010): Meeting the Electricity Supply/Demand Balance in Latin America and the Caribbean
Argentina Bolivia Brasil Chile UruguayAverageContractPriceatPointofGeneration(US$/MWh)
73.69 37.74 59.87 139.77 165.00
AverageSpotPriceatPointofGeneration(US$/MWh)
69.64 46.44 57.69 276.09 249.02
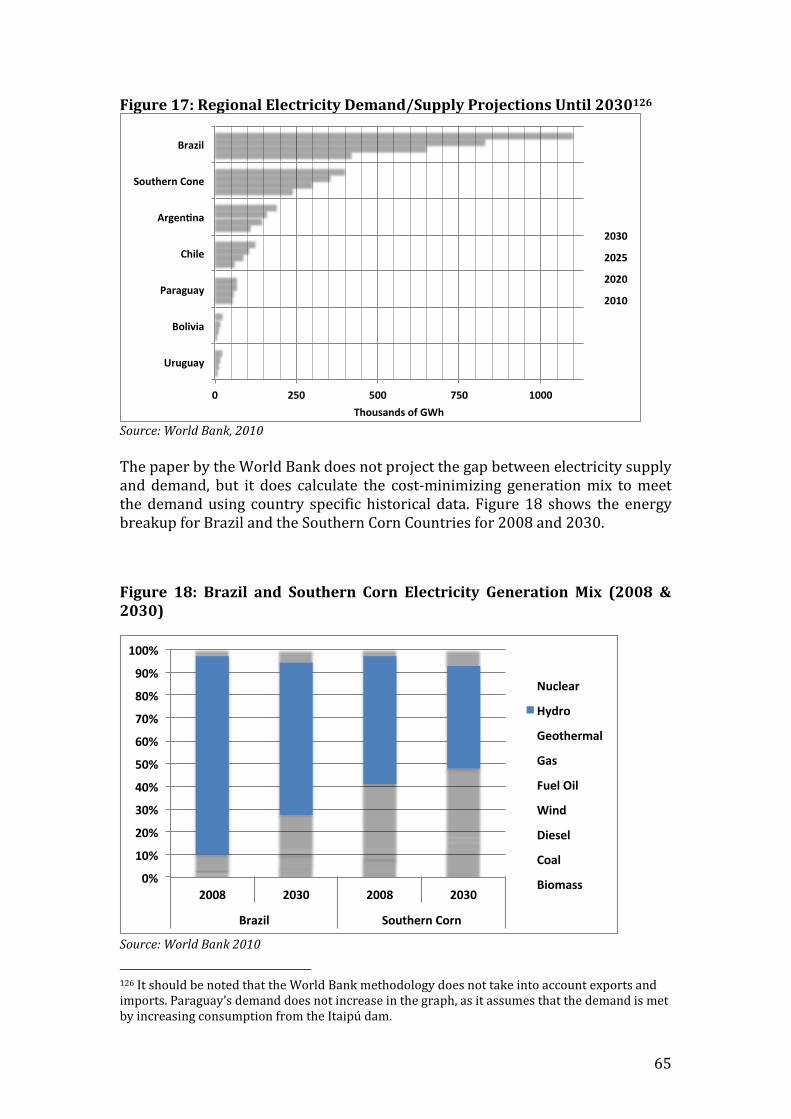
65
Figure 17: Regional Electricity Demand/Supply Projections Until 2030126
Source: World Bank, 2010
The paper by the World Bank does not project the gap between electricity supply and demand, but it does calculate the cost-minimizing generation mix to meet the demand using country specific historical data. Figure 18 shows the energy breakup for Brazil and the Southern Corn Countries for 2008 and 2030.
Figure 18: Brazil and Southern Corn Electricity Generation Mix (2008 & 2030)
Source: World Bank 2010
126 It should be noted that the World Bank methodology does not take into account exports and imports. Paraguay’s demand does not increase in the graph, as it assumes that the demand is met by increasing consumption from the Itaipú dam.
0 250 500 750 1000
Uruguay
Bolivia
Paraguay
Chile
Argen na
SouthernCone
Brazil
ThousandsofGWh
2030
2025
2020
2010
0%
10%
20%
30%
40%
50%
60%
70%
80%
90%
100%
2008 2030 2008 2030
Brazil SouthernCorn
Nuclear
Hydro
Geothermal
Gas
FuelOil
Wind
Diesel
Coal
Biomass
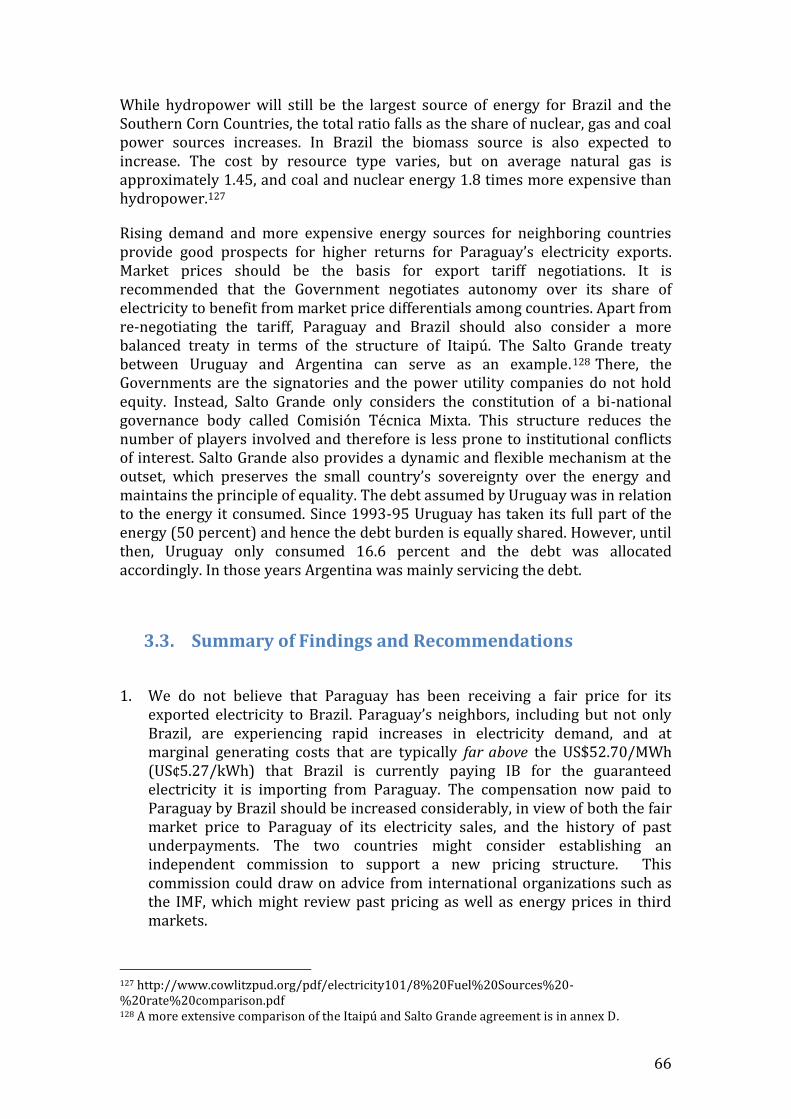
66
While hydropower will still be the largest source of energy for Brazil and the Southern Corn Countries, the total ratio falls as the share of nuclear, gas and coal power sources increases. In Brazil the biomass source is also expected to increase. The cost by resource type varies, but on average natural gas is approximately 1.45, and coal and nuclear energy 1.8 times more expensive than hydropower.127
Rising demand and more expensive energy sources for neighboring countries provide good prospects for higher returns for Paraguay’s electricity exports. Market prices should be the basis for export tariff negotiations. It is recommended that the Government negotiates autonomy over its share of electricity to benefit from market price differentials among countries. Apart from re-negotiating the tariff, Paraguay and Brazil should also consider a more balanced treaty in terms of the structure of Itaipú. The Salto Grande treaty between Uruguay and Argentina can serve as an example.128 There, the Governments are the signatories and the power utility companies do not hold equity. Instead, Salto Grande only considers the constitution of a bi-national governance body called Comisión Técnica Mixta. This structure reduces the number of players involved and therefore is less prone to institutional conflicts of interest. Salto Grande also provides a dynamic and flexible mechanism at the outset, which preserves the small country’s sovereignty over the energy and maintains the principle of equality. The debt assumed by Uruguay was in relation to the energy it consumed. Since 1993-95 Uruguay has taken its full part of the energy (50 percent) and hence the debt burden is equally shared. However, until then, Uruguay only consumed 16.6 percent and the debt was allocated accordingly. In those years Argentina was mainly servicing the debt.
3.3. Summary of Findings and Recommendations
1. We do not believe that Paraguay has been receiving a fair price for its exported electricity to Brazil. Paraguay’s neighbors, including but not only Brazil, are experiencing rapid increases in electricity demand, and at marginal generating costs that are typically far above the US$52.70/MWh (US¢5.27/kWh) that Brazil is currently paying IB for the guaranteed electricity it is importing from Paraguay. The compensation now paid to Paraguay by Brazil should be increased considerably, in view of both the fair market price to Paraguay of its electricity sales, and the history of past underpayments. The two countries might consider establishing an independent commission to support a new pricing structure. This commission could draw on advice from international organizations such as the IMF, which might review past pricing as well as energy prices in third markets.
127 http://www.cowlitzpud.org/pdf/electricity101/8%20Fuel%20Sources%20-%20rate%20comparison.pdf 128 A more extensive comparison of the Itaipú and Salto Grande agreement is in annex D.

67
2. Electricity prices are significantly higher in neighboring countries and are expected to continue to increase in the future as the energy sources become more expensive. These prices should serve as a guideline for future tariff negotiations. Paraguay should also pursue autonomy over its share of electricity to ensure it can sell to third parties. Furthermore, we suggest that payments be based on actual consumption rather than contracted power. We also suggest that the power utility companies do not hold equity in the bi-national entity under the new treaty in order to lower the number of players and potential institutional conflicts of interest.

68
4. Towards a Green Economy
As a result of rapid environmental degradation and global warming, future economic development plans will need to take into account environmental sustainability. Paraguay, having access to abundant clean hydropower energy, could be a front-runner in green economic development based on four pillars: renewable energy; green building and energy efficient technology; energy efficient infrastructure and transportation; and waste-to-energy and recycling.129 In particular, transport transformation and charcoal/fuel wood substitution could be profitable drivers in such a strategy.
4.1. Transport transformation According to the Vice Ministry of Transport, Paraguay’s car fleet totals 1 million vehicles and 13,500 buses. In 2012 the country’s fuel imports amounted to $1.5 billion,130 and $27.5million was spent on fuel subsidies for registered buses. Table 18 provides a statistical overview of Paraguay’s transport sector. Table 18: Overview of Paraguay’s Transport Sector
Source: the Vice Ministry of Transport, Vice Ministério de Minas y Energía 2012, Banco Central, Ministério de Obras Públicas y Comunicaciones
a) Transport Transformation: Cost and Challenges Traffic congestion is worsening in Paraguayan cities due to the increasing number of vehicles. The Government is looking to address the public transport issues in Asunción with the Pya’e Porâ BRT131 project. The US$137 million project132 foresees the construction of a 28km133 electric BRT system from Asunción’s city center to San Lorenzo and Capiatá, combining the advantages of a subway system (exclusive right of way, punctuality and frequency) and an urban bus system (lower costs of construction, maintenance and operation). Additional
129 NACO 2010: Growing a Green Local Economy 130Source: Vice Ministry of Energy 131 Bus Rapid Transit 132 Source: Vice Ministry of Transport 133 Source: Asociación Latino Americana de Sistemas Integrados y BRT 2011
Fleetofprivatevehicules 1million
Includescars,trucks,omnibus,motorbikesandmachineryvehicles
Publicbuses 13500
Importedfuel US$1.5BnDieselandgasoline 87.2%ofimportedfuel
Motorpetrolemconsumptiongrowth 12.5%/yearDailyfuel-dependentmotorizedtripinAsuncion 2.25million
CoverageoftheabovedailytripsbybusesinAsuncion52%
NumberofbusesincirculationinAsuncion 3600Numberofcompaniesowningthebuses 70
Annualsubsidiesforregisteredbuses US$27.5million
oftotaldemandfordailymotorizedtrips

69
corridors are also being studied totaling 111km with a total estimated investment of US$ 873 million.134 The railway plans put forward by the Ministry of Public Works also show the Government’s willingness to move towards more efficient and cleaner transport models. The plans involve the rehabilitation of the 69km abandoned Asunción-Encarnación corridor and the construction of the 568km Paraguayan branch of the Bioceánica linking São Paulo, in Brazil with Antofagasta, in Chile.135 The capital investment for the project is estimated to be around US$2.6 billion, exclusive of rolling stock. Of the several alternatives studied, the preferred option uses electro-diesel locomotives, permitting a dual operation of the railway.136 Drawing on current transport plans and the petrol imports made every year, Paraguay could consider basing the new projects on electricity-based systems. Apart from significantly improving the environmental footprint of the transport sector in Paraguay and thereby raising the wellbeing of the population, an electric-run system could also be cost effective in the long run. The following analysis will provide rough comparative costs for new investments in an electric-based system versus a petroleum-based one. A more in-depth analysis would be required to assess the challenges and opportunities for Paraguay. The Government is planning to update its aged bus fleet. Figure 19 shows that while the purchase of electric buses137 would be roughly 1.7 times more expensive than buying diesel run buses, the operational costs are roughly 5.7 times cheaper. Taking into account the provision of the fuel subsidy for registered buses, the electric alternative is even 6.5 times cheaper. For Asunción, this would translate into yearly operating expenses of US$222 million for diesel run buses compared to US$34 million for the electric run system. Those are of course rough estimates.
134 Source: Vice Ministry of Transport 135 Source: Vice Ministry of Transport 136 Source: Vice Ministry of Transport 137 The calculations are based on electric buses costing US$ 559,200 and diesel buses costing US$326,000. These are the market prices according to US’s Proterra and China’s BYD, which are two of the main electric bus manufacturers in the world Source: EESI 2005, SFMTA, Left Lane 2012, Clean Biz Asia 2012, Proterra 2013, BYD 2013

70
Figure 19: Investment and Operation Comparison, Asunción (3,500 buses)
Source: EESI 2005, SFMTA, Left Lane 2012, Clean Biz Asia 2012, Proterra 2013, BYD 2013
Using these estimates, Figure 20 plots the cumulative costs of these alternatives and shows that the electric run system becomes more profitable after five years when accounting for fuel subsidies. Figure 20: Cumulative Costs of an Electricity-based Transport System Versus a Petroleum-based Transport System in Asunción
Source: Team’s own calculations
Similar results are obtained when introducing the national data. If the whole Paraguayan fleet of 13,500 buses was to be replaced, the total initial investment would accumulate to US$ 7.5 billion for new electric buses and US$ 4.4 billion for new diesel buses. Despite the higher capital cost of the electric fleet, a much lower operational cost would make the electric-bus system more profitable after five to six years of operation. Furthermore, with a well-functioning and punctual
0
250
500
750
1000
1250
1500
1750
2000
Investment
Investment(US$Million)
Diesel Diesel+Subsidies Electric
0
50
100
150
200
250
AnnualOpera on
AnnualOpera ngCosts(US$Million)
Diesel Diesel+Subsidies Electric
1000
1500
2000
2500
3000
3500
4000
Year 1 Year 2 Year 3 Year 4 Year 5 Year 6 Year 7 Year 8 Year 9 Year 10
Electric Buses Diesel Buses Diesel Buses + Subsidies
71
public transport system in place, demand for these services is likely to increase, further lowering the need for expensive fuel imports. A long-term and transformative plan could also include transforming private cars to using electricity. This option may be expensive and challenging today but could become tangible within 10 years, once technological advances make electric vehicles cheaper. In order for Paraguay to be ready to transform the private fleet within 10 years, the country needs to plan ahead of time and be aware of the challenges and issues that need to be solved. To facilitate this exercise, the following will shed light on current obstacles, drawing on analyses from the United States (US) and France, countries that already plan to implement such a transformation. Up-front cost and total cost of ownership will decrease over time It is important to note that, today, the comparatively higher purchase cost of a grid-enabled vehicle offsets the lifetime fuel savings for consumers. This is certainly true in the absence of government financial incentives, which, for instance in the US currently includes a maximum $7,500 ARRA138 tax credit139 for the purchase of a plug-in electric drive vehicle. Figure 21 shows that even with the maximum tax credit, a plug-in hybrid electric vehicle (PHEV) with 40 miles of all-electric range would only offer a marginal economic benefit over the lifetime of the vehicle when compared to a similarly sized internal combustion engine (ICE) car. The margin is even smaller for a fully electric vehicle (EV) with 100 miles of driving range as shown in Figure 22. Excluding the tax credits, these electric alternatives are not yet financially profitable in the US. Similarly, a study in France indicates that, without any purchase subsidy, an EV’s lifetime usage cost is around 15-20 percent higher than a traditional diesel-engine car.140 The US Congressional Budget Office (CBO) reports that the lifetime costs of an electric vehicle (EV) are higher than those of a vehicle with an internal combustion engine or of a hybrid, even with a federal tax credit. CBO suggests that the federal tax credit would have to be set at $12,000 to equalize the lifetime costs. CBO estimates that the current $7,500 tax credit, together with other electrification grant programs and the Advanced Technology Vehicle Manufacturing program, will have a budgetary cost of $7.5 billion by 2019.141
138ARRA refers to 2009 American Recovery and Reinvestment Act 139 The tax credit for new plug-in electric vehicles is worth $2,500 plus $417 for each kilowatt-hour of battery capacity over 4 kwh, and the portion of the credit determined by battery capacity cannot exceed $5,000. Therefore, the total amount of the credit allowed for an EV is limited to $7,500 (source: Internal Revenue Bulletin 2009-48, New Qualified Plug-in Electric Drive Motor Vehicle Credit, Notice 2009-89, November 30, 2009 http://www.irs.gov/irb/2009-48_IRB/ar09.html) 140 Crist, Philippe, 2012, Electric Vehicles Revisited – Costs, Subsidies and Prospects, Discussion Paper 2012-03, OECD/ITF 141 Congressional Budget Office, 2012, Effects of Federal Tax Credits for the Purchase of Electric Vehicles , September

72
However, by 2030, the total cost of ownership for EVs in the US is expected to be around $8,000 less than the ownership of a traditional vehicle142. Under another scenario,143 a French consumer could save about €4,520 (US$6,000) over the lifetime of an EV (compared to its conventional gas-powered ICE vehicle counterpart).144 Figure 21: Plug-in Hybrid Electric Vehicles (PHEVs) Total Cost of Ownership (Including ARRA Tax Credit)145
Figure 22: Pure Electric Vehicles (EVs) Total Cost of Ownership (Including ARRA Tax Credit)146
142 Westcott, Robert, and Werling, Jeffrey, 2010, Economic Impact of the Electrification Roadmap. April. 143Assumptions: ICE vehicle costs increase by 20 percent, BEV vehicle costs decrease by 20 percent, battery costs decrease by 30 percent, oil prices grow by 6 percent per year from $120 Bbl, fuel taxes increase by 2 percent year as do electricity prices, and ICE efficiency increases by 50 percent and BEV efficiency by 30 percent. 144 Crist, Philippe, 2012, Electric Vehicles Revisited – Costs, Subsidies and Prospects, Discussion Paper 2012-03, OECD/ITF 145 Westcott, Robert, and Werling, Jeffrey, 2010, Economic Impact of the Electrification Roadmap. April. 146 Westcott, Robert, and Werling, Jeffrey, 2010, Economic Impact of the Electrification Roadmap. April.

73
Table 19: Federal Incentives Available to Buyers or Producers of Electric vehicles (EV)147
Cost of charging infrastructure EVs can be charged directly from most household electricity circuits in France and it is assumed that this will be the principal recharging mode (93 percent of charging points148) used by EV owners through 2020 (though this might not be the case if fast-recharging technology becomes widespread). Renault recommends that EV owners install a home charging point (cost of approximately €800) and that they equip themselves with a dedicated recharge cable (around €400). The remaining 7 percent of charging stations are projected to be public fast- (23 kVA) and ultrafast- (43 kVA) charging points with total costs ranging from €7,000 to €55,000 per charging point.149 The costs for these points will be shared amongst a number of actors including local authorities, electricity companies, parking garage owners and private workplaces. On average, the total cost for charging facilities is estimated to amount to around €3,000 per EV in 2010 and to decrease to €2,000 per EV in 2020.150 To meet a forecast of 2 million EVs in France in 2020, around 2.2 million charging points
147 Congressional Budget Office, 2012, Effects of Federal Tax Credits for the Purchase of Electric Vehicles , September 148 Depoorter, Stéphanie, and Assimon, Pierre-Marie, 2011, Les véhicules électriques en perspective: Analyse couts - avantages et demande potentielle. Commissariat Général au Développement Durable, available at http://www.developpement-durable.gouv.fr/IMG/pdf/ED41.pdf 149 Depoorter, Stéphanie, and Assimon, Pierre-Marie, 2011, Les véhicules électriques en perspective: Analyse couts - avantages et demande potentielle. Commissariat Général au Développement Durable. 150 Depoorter, Stéphanie, and Assimon, Pierre-Marie, 2011, Les véhicules électriques en perspective: Analyse couts - avantages et demande potentielle. Commissariat Général au Développement Durable.
74
are required, which represents an investment totaling €3 billion over the period 2010-2020.151 Job creation of such transformation In the U.S, a study estimated that implementing a package of EV policies would increase total employment by 1.9 million jobs by 2030 (equivalent to a reduction of unemployment by 1.1 percent). There would be 560,000 additional manufacturing jobs by 2030, 276,000 additional jobs in travel and tourism, and 73,000 additional jobs in professional services. 106,000 employment opportunities in the motor vehicle industry could be created. Employment in the industries that supply key electric and electronic components to electric vehicles could increase by 112,000 jobs.152 There might be a concern that this employment creation will be at the expense of job losses in the petroleum-based car industry. This might be valid but a strong government training policy to facilitate industrial reconversion of the job market could help mitigate this concern. We recommend that the Government pursue the possibility of an initial deployment of electric vehicles in Asunción and other cities, with one or more international producers of such vehicles, on a competitive basis. We suspect that some of the international firms will be interested in supporting Paraguay’s investments in the needed infrastructure and early deployment of electric passenger vehicles.
b) Electricity consumption of transport transformation (railways, buses and private cars)
Figure 23 provides a rough estimate of the use of electricity if the above described electric-bus system is implemented. It also estimates the potential energy demand from converting the private cars to use electricity. Given the relative high cost of electric cars, this option may be difficult to implement in the short term, but may be viable in the medium term as prices of private electric cars continue to fall. The estimates in Figure 23 are based on:
- The Bioceánica project being implemented (based on figures provided by the Vice Ministry of Transport)
- All private cars switching to electricity - All public buses switching to electricity
The assumptions for the electricity demand are based on:
- 300 trips along the Bioceánica per year
151 Depoorter, Stéphanie, and Assimon, Pierre-Marie, 2011, Les véhicules électriques en perspective: Analyse couts - avantages et demande potentielle. Commissariat Général au Développement Durable. 152 Westcott, Robert, and Werling, Jeffrey, 2010, Economic Impact of the Electrification Roadmap. April.
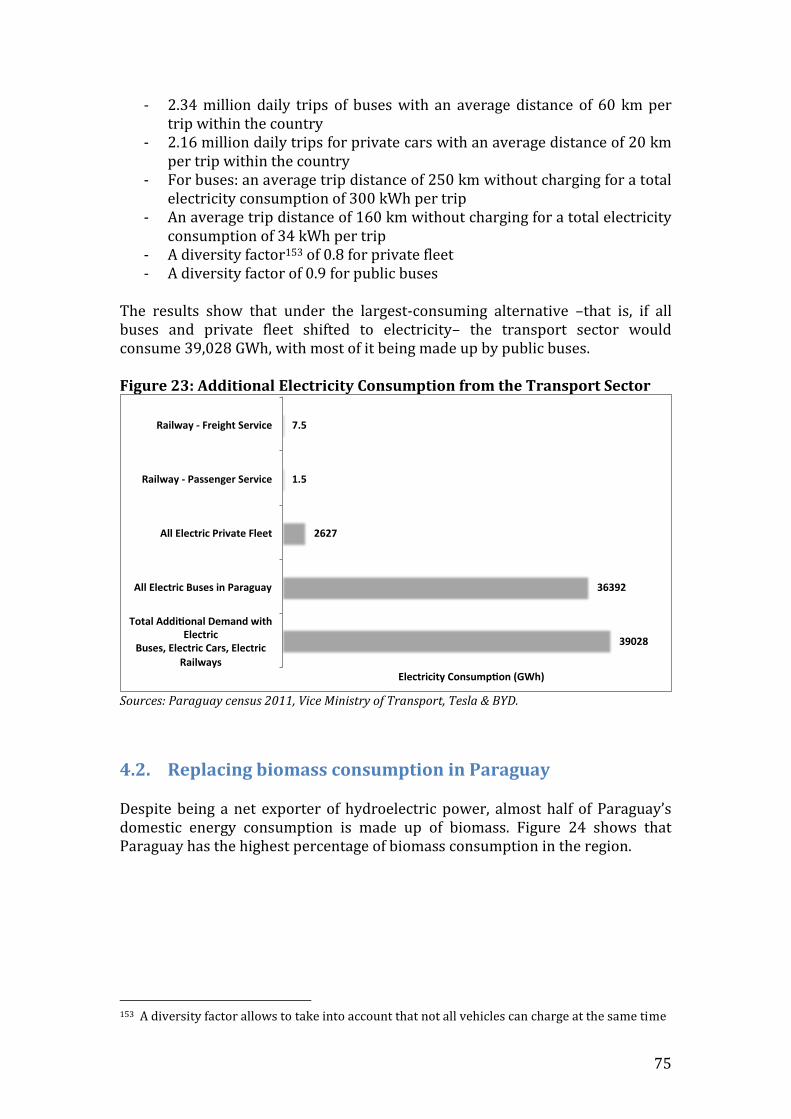
75
- 2.34 million daily trips of buses with an average distance of 60 km per trip within the country
- 2.16 million daily trips for private cars with an average distance of 20 km per trip within the country
- For buses: an average trip distance of 250 km without charging for a total electricity consumption of 300 kWh per trip
- An average trip distance of 160 km without charging for a total electricity consumption of 34 kWh per trip
- A diversity factor153 of 0.8 for private fleet - A diversity factor of 0.9 for public buses
The results show that under the largest-consuming alternative –that is, if all buses and private fleet shifted to electricity– the transport sector would consume 39,028 GWh, with most of it being made up by public buses. Figure 23: Additional Electricity Consumption from the Transport Sector
Sources: Paraguay census 2011, Vice Ministry of Transport, Tesla & BYD.
4.2. Replacing biomass consumption in Paraguay Despite being a net exporter of hydroelectric power, almost half of Paraguay’s domestic energy consumption is made up of biomass. Figure 24 shows that Paraguay has the highest percentage of biomass consumption in the region.
153 A diversity factor allows to take into account that not all vehicles can charge at the same time
39028
36392
2627
1.5
7.5
TotalAddi onalDemandwithElectric
Buses,ElectricCars,ElectricRailways
AllElectricBusesinParaguay
AllElectricPrivateFleet
Railway-PassengerService
Railway-FreightService
ElectricityConsump on(GWh)
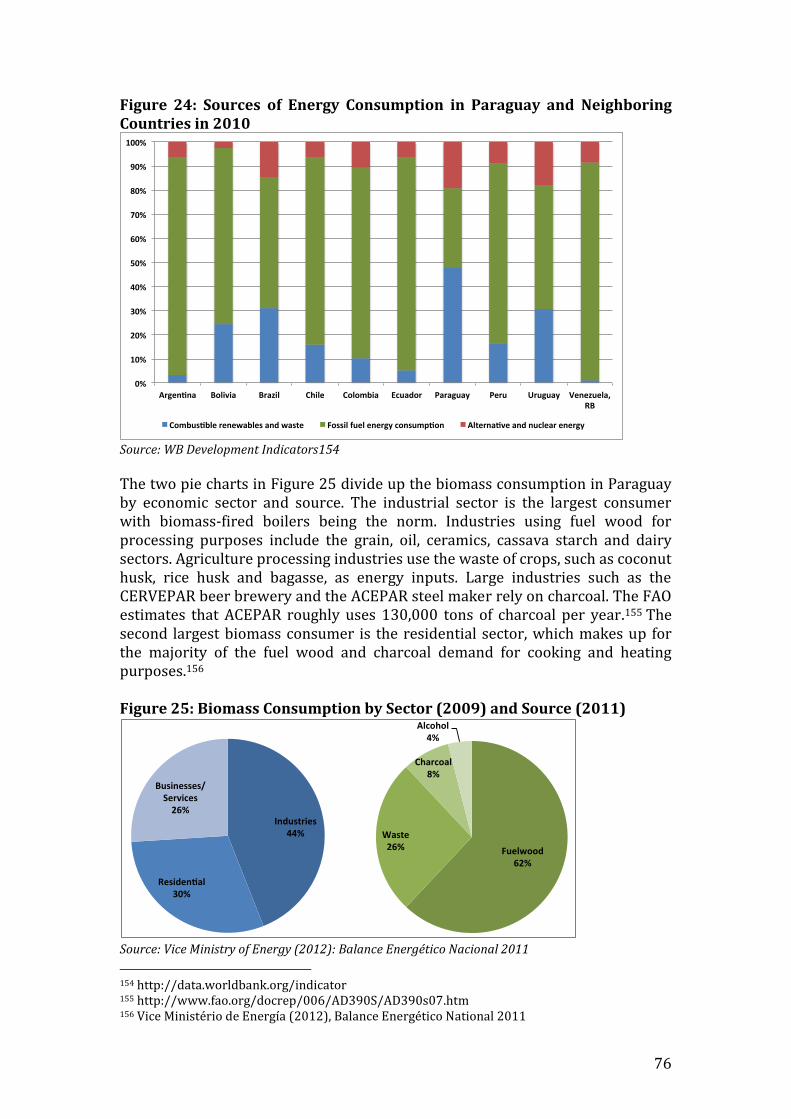
76
Figure 24: Sources of Energy Consumption in Paraguay and Neighboring Countries in 2010
Source: WB Development Indicators154
The two pie charts in Figure 25 divide up the biomass consumption in Paraguay by economic sector and source. The industrial sector is the largest consumer with biomass-fired boilers being the norm. Industries using fuel wood for processing purposes include the grain, oil, ceramics, cassava starch and dairy sectors. Agriculture processing industries use the waste of crops, such as coconut husk, rice husk and bagasse, as energy inputs. Large industries such as the CERVEPAR beer brewery and the ACEPAR steel maker rely on charcoal. The FAO estimates that ACEPAR roughly uses 130,000 tons of charcoal per year.155 The second largest biomass consumer is the residential sector, which makes up for the majority of the fuel wood and charcoal demand for cooking and heating purposes.156 Figure 25: Biomass Consumption by Sector (2009) and Source (2011)
Source: Vice Ministry of Energy (2012): Balance Energético Nacional 2011
154 http://data.worldbank.org/indicator 155 http://www.fao.org/docrep/006/AD390S/AD390s07.htm 156 Vice Ministério de Energía (2012), Balance Energético National 2011
0%
10%
20%
30%
40%
50%
60%
70%
80%
90%
100%
Argen na Bolivia Brazil Chile Colombia Ecuador Paraguay Peru Uruguay Venezuela,RB
Combus blerenewablesandwaste Fossilfuelenergyconsump on Alterna veandnuclearenergy
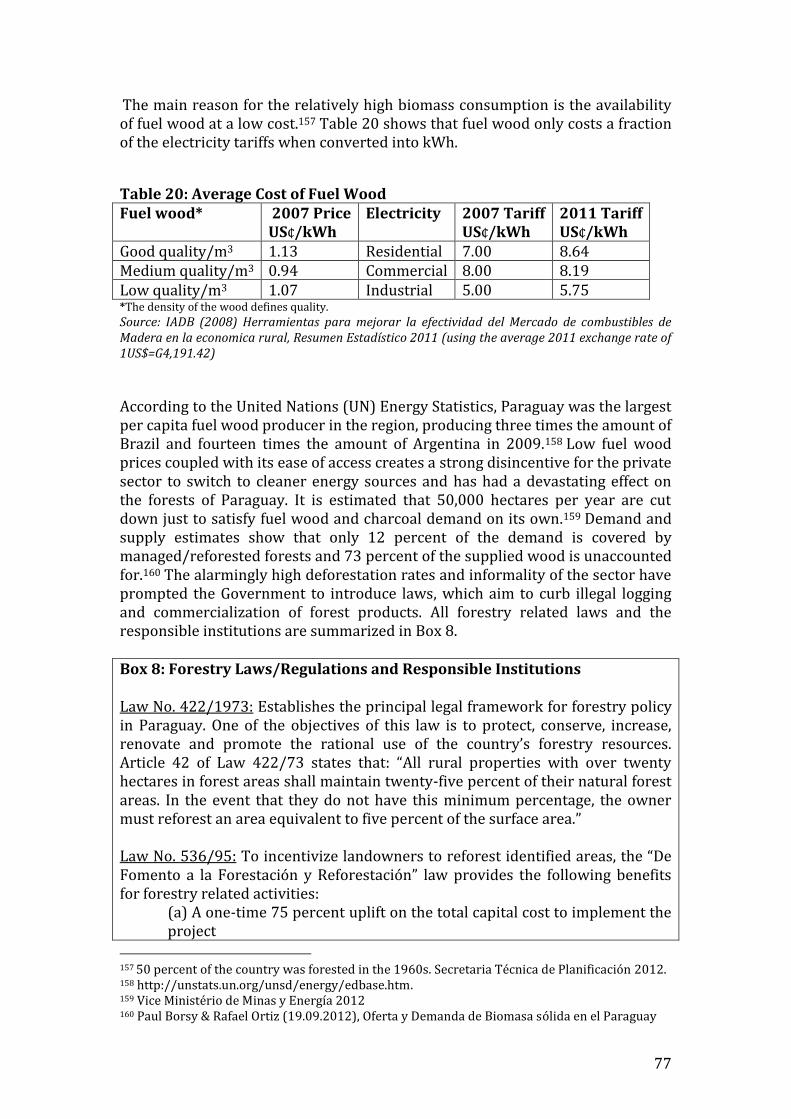
77
The main reason for the relatively high biomass consumption is the availability of fuel wood at a low cost.157 Table 20 shows that fuel wood only costs a fraction of the electricity tariffs when converted into kWh.
Table 20: Average Cost of Fuel Wood Fuel wood* 2007 Price
US¢/kWh Electricity 2007 Tariff
US¢/kWh 2011 Tariff US¢/kWh
Good quality/m3 1.13 Residential 7.00 8.64 Medium quality/m3 0.94 Commercial 8.00 8.19 Low quality/m3 1.07 Industrial 5.00 5.75 *The density of the wood defines quality.
Source: IADB (2008) Herramientas para mejorar la efectividad del Mercado de combustibles de Madera en la economica rural, Resumen Estadístico 2011 (using the average 2011 exchange rate of 1US$=G4,191.42)
According to the United Nations (UN) Energy Statistics, Paraguay was the largest per capita fuel wood producer in the region, producing three times the amount of Brazil and fourteen times the amount of Argentina in 2009.158 Low fuel wood prices coupled with its ease of access creates a strong disincentive for the private sector to switch to cleaner energy sources and has had a devastating effect on the forests of Paraguay. It is estimated that 50,000 hectares per year are cut down just to satisfy fuel wood and charcoal demand on its own.159 Demand and supply estimates show that only 12 percent of the demand is covered by managed/reforested forests and 73 percent of the supplied wood is unaccounted for.160 The alarmingly high deforestation rates and informality of the sector have prompted the Government to introduce laws, which aim to curb illegal logging and commercialization of forest products. All forestry related laws and the responsible institutions are summarized in Box 8. Box 8: Forestry Laws/Regulations and Responsible Institutions Law No. 422/1973: Establishes the principal legal framework for forestry policy in Paraguay. One of the objectives of this law is to protect, conserve, increase, renovate and promote the rational use of the country’s forestry resources. Article 42 of Law 422/73 states that: “All rural properties with over twenty hectares in forest areas shall maintain twenty-five percent of their natural forest areas. In the event that they do not have this minimum percentage, the owner must reforest an area equivalent to five percent of the surface area.” Law No. 536/95: To incentivize landowners to reforest identified areas, the “De Fomento a la Forestación y Reforestación” law provides the following benefits for forestry related activities:
(a) A one-time 75 percent uplift on the total capital cost to implement the project
157 50 percent of the country was forested in the 1960s. Secretaria Técnica de Planificación 2012. 158 http://unstats.un.org/unsd/energy/edbase.htm. 159 Vice Ministério de Minas y Energía 2012 160 Paul Borsy & Rafael Ortiz (19.09.2012), Oferta y Demanda de Biomasa sólida en el Paraguay
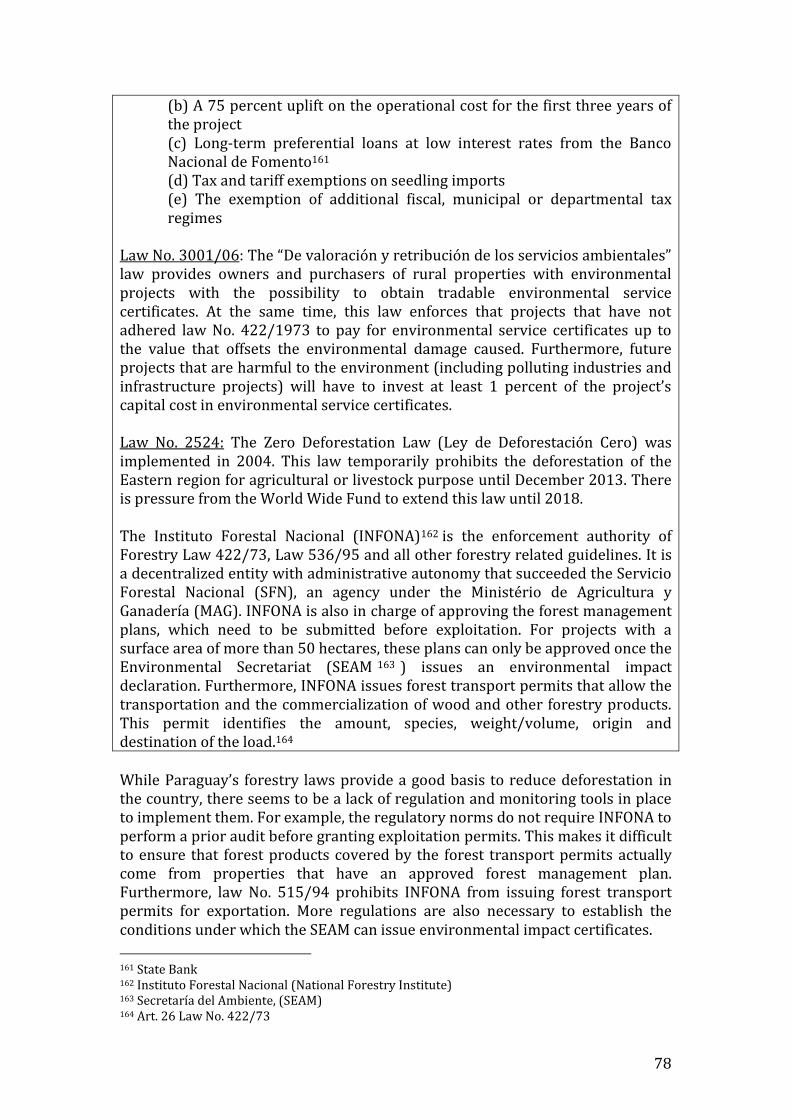
78
(b) A 75 percent uplift on the operational cost for the first three years of the project
(c) Long-term preferential loans at low interest rates from the Banco Nacional de Fomento161
(d) Tax and tariff exemptions on seedling imports (e) The exemption of additional fiscal, municipal or departmental tax
regimes Law No. 3001/06: The “De valoración y retribución de los servicios ambientales” law provides owners and purchasers of rural properties with environmental projects with the possibility to obtain tradable environmental service certificates. At the same time, this law enforces that projects that have not adhered law No. 422/1973 to pay for environmental service certificates up to the value that offsets the environmental damage caused. Furthermore, future projects that are harmful to the environment (including polluting industries and infrastructure projects) will have to invest at least 1 percent of the project’s capital cost in environmental service certificates. Law No. 2524: The Zero Deforestation Law (Ley de Deforestación Cero) was implemented in 2004. This law temporarily prohibits the deforestation of the Eastern region for agricultural or livestock purpose until December 2013. There is pressure from the World Wide Fund to extend this law until 2018. The Instituto Forestal Nacional (INFONA)162 is the enforcement authority of Forestry Law 422/73, Law 536/95 and all other forestry related guidelines. It is a decentralized entity with administrative autonomy that succeeded the Servicio Forestal Nacional (SFN), an agency under the Ministério de Agricultura y Ganadería (MAG). INFONA is also in charge of approving the forest management plans, which need to be submitted before exploitation. For projects with a surface area of more than 50 hectares, these plans can only be approved once the Environmental Secretariat (SEAM 163 ) issues an environmental impact declaration. Furthermore, INFONA issues forest transport permits that allow the transportation and the commercialization of wood and other forestry products. This permit identifies the amount, species, weight/volume, origin and destination of the load.164 While Paraguay’s forestry laws provide a good basis to reduce deforestation in the country, there seems to be a lack of regulation and monitoring tools in place to implement them. For example, the regulatory norms do not require INFONA to perform a prior audit before granting exploitation permits. This makes it difficult to ensure that forest products covered by the forest transport permits actually come from properties that have an approved forest management plan. Furthermore, law No. 515/94 prohibits INFONA from issuing forest transport permits for exportation. More regulations are also necessary to establish the conditions under which the SEAM can issue environmental impact certificates.
161 State Bank 162 Instituto Forestal Nacional (National Forestry Institute) 163 Secretaría del Ambiente, (SEAM) 164 Art. 26 Law No. 422/73

79
While the Zero Deforestation Law has reduced deforestation in the Eastern Region of the country, national deforestation rates are still high. Table 21 shows that Paraguay has consistently had the second highest yearly deforestation rates in the region since 1990. This can largely be traced back to the weak structures and mechanisms in place to enforce the laws on illegal logging and the informal trade of forest products. Table 21: Yearly Rate of Gain or Loss of Forest Area During Given Period
Source: Global Forest Resources Assessment 2010, Global tables
Apart from slowing the deforestation rates for the environmental wellbeing of the country, we consider that more stringent forestry regulation enforcement in Paraguay will drive up the price of fuel wood and charcoal, thereby incentivizing the private sector to switch to electricity as the main source of energy. Wood prices in Paraguay have already seen a steady increase since 2007165 due to higher demand from population and economic growth and a fall in the quantity of trees available to cut down. This trend is illustrated in Figure 26 and can be expected to continue without Government intervention.
165 Paul Borsy & Rafael Ortiz (19.09.2012), Oferta y Demanda de Biomasa sólida en el Paraguay
1990-2000 2000-2005 2005-2010
Uruguay 4.38 1.48 2.79
Chile 0.37 0.26 0.23
Colombia -0.16 -0.16 -0.17
Peru -0.14 -0.14 -0.22
Brazil -0.51 -0.57 -0.42
Bolivia -0.44 -0.46 -0.53
Venezuela -0.57 -0.59 -0.61
Argentina -0.88 -0.81 -0.80
Paraguay -0.88 -0.94 -0.99
Ecuador -1.53 -1.73 -1.89
Average of Region -0.036 -0.366 -0.261
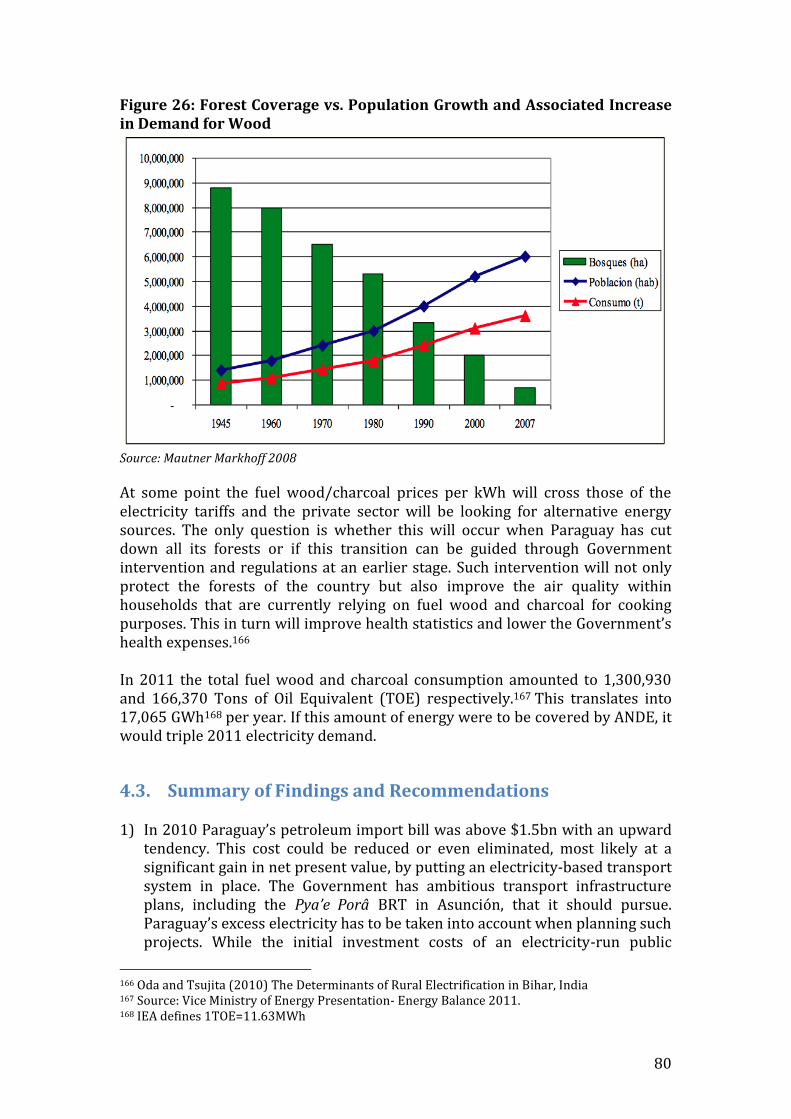
80
Figure 26: Forest Coverage vs. Population Growth and Associated Increase in Demand for Wood
Source: Mautner Markhoff 2008
At some point the fuel wood/charcoal prices per kWh will cross those of the electricity tariffs and the private sector will be looking for alternative energy sources. The only question is whether this will occur when Paraguay has cut down all its forests or if this transition can be guided through Government intervention and regulations at an earlier stage. Such intervention will not only protect the forests of the country but also improve the air quality within households that are currently relying on fuel wood and charcoal for cooking purposes. This in turn will improve health statistics and lower the Government’s health expenses.166 In 2011 the total fuel wood and charcoal consumption amounted to 1,300,930 and 166,370 Tons of Oil Equivalent (TOE) respectively.167 This translates into 17,065 GWh168 per year. If this amount of energy were to be covered by ANDE, it would triple 2011 electricity demand.
4.3. Summary of Findings and Recommendations
1) In 2010 Paraguay’s petroleum import bill was above $1.5bn with an upward tendency. This cost could be reduced or even eliminated, most likely at a significant gain in net present value, by putting an electricity-based transport system in place. The Government has ambitious transport infrastructure plans, including the Pya’e Porâ BRT in Asunción, that it should pursue. Paraguay’s excess electricity has to be taken into account when planning such projects. While the initial investment costs of an electricity-run public
166 Oda and Tsujita (2010) The Determinants of Rural Electrification in Bihar, India 167 Source: Vice Ministry of Energy Presentation- Energy Balance 2011. 168 IEA defines 1TOE=11.63MWh
81
transport system is thought to be around 1.7 times larger than for that of a petroleum-run one, the running costs are 6.5 times cheaper, making it profitable after 6 years. Such substitution would increase fivefold current electricity demand.
2) Over time, there may also be the possibility of moving decisively to electric
passenger vehicles as well, especially given that technological progress will lead to an accelerated decline in the cost of lightweight passenger vehicles for urban use. Investing in infrastructure for electric buses and cars can be a public investment that will infuse money in the economy and create employment opportunities. We recommend that the Government pursue the possibility of an initial deployment of electric vehicles in Asunción and other cities, with one or more international producers of such vehicles, on a competitive basis. We suspect that some of the international firms will be interested in supporting Paraguay’s investments in the needed infrastructure and early deployment of electric passenger vehicles. Further study should assess the opportunities and challenges of this transformation in Paraguay.
3) High fuel wood and charcoal consumption of the residential and industrial
sector have led to rapid unsustainable deforestation rates. The Government will need to enforce more stringent forestry and forest-commercialization regulations to prevent the country from losing its remaining forest assets. The energy demand can be met by electricity and the estimates show that a substation would increase threefold electricity demand in the country.
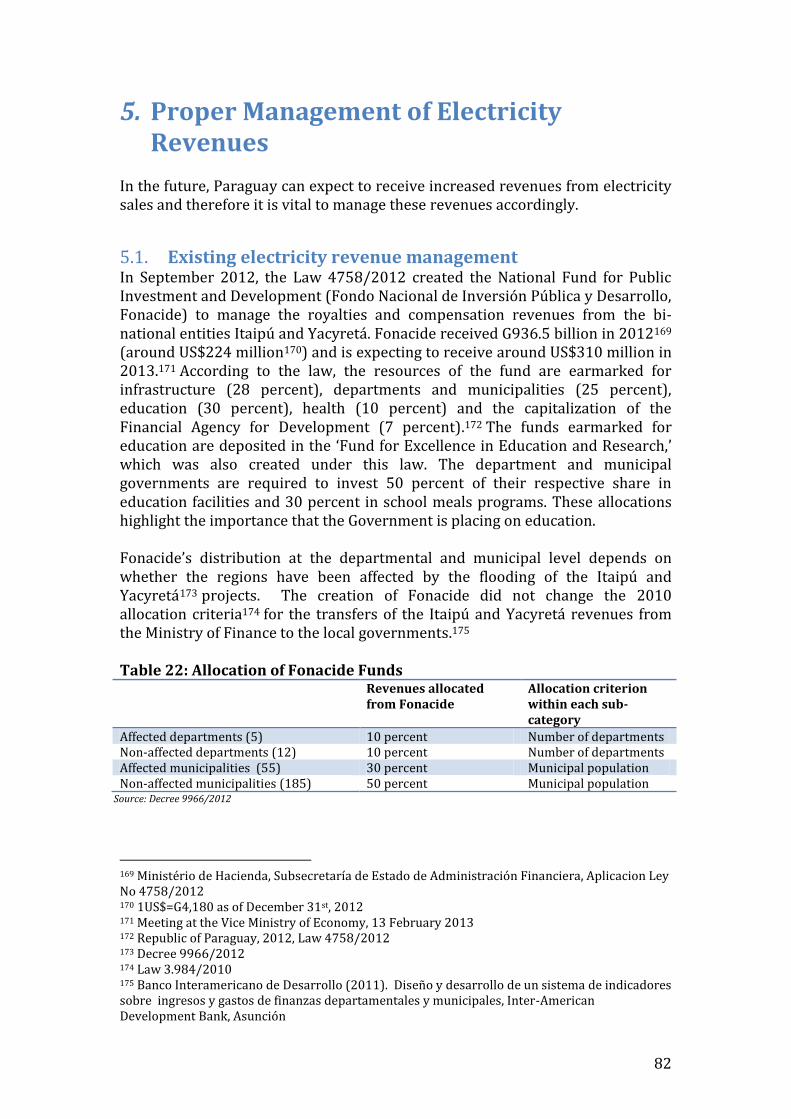
82
5. Proper Management of Electricity Revenues
In the future, Paraguay can expect to receive increased revenues from electricity sales and therefore it is vital to manage these revenues accordingly.
5.1. Existing electricity revenue management In September 2012, the Law 4758/2012 created the National Fund for Public Investment and Development (Fondo Nacional de Inversión Pública y Desarrollo, Fonacide) to manage the royalties and compensation revenues from the bi-national entities Itaipú and Yacyretá. Fonacide received G936.5 billion in 2012169 (around US$224 million170) and is expecting to receive around US$310 million in 2013.171 According to the law, the resources of the fund are earmarked for infrastructure (28 percent), departments and municipalities (25 percent), education (30 percent), health (10 percent) and the capitalization of the Financial Agency for Development (7 percent).172 The funds earmarked for education are deposited in the ‘Fund for Excellence in Education and Research,’ which was also created under this law. The department and municipal governments are required to invest 50 percent of their respective share in education facilities and 30 percent in school meals programs. These allocations highlight the importance that the Government is placing on education.
Fonacide’s distribution at the departmental and municipal level depends on whether the regions have been affected by the flooding of the Itaipú and Yacyretá173 projects. The creation of Fonacide did not change the 2010 allocation criteria174 for the transfers of the Itaipú and Yacyretá revenues from the Ministry of Finance to the local governments.175 Table 22: Allocation of Fonacide Funds Revenues allocated
from Fonacide Allocation criterion within each sub-category
Affected departments (5) 10 percent Number of departments Non-affected departments (12) 10 percent Number of departments Affected municipalities (55) 30 percent Municipal population Non-affected municipalities (185) 50 percent Municipal population
Source: Decree 9966/2012
169 Ministério de Hacienda, Subsecretaría de Estado de Administración Financiera, Aplicacion Ley No 4758/2012 170 1US$=G4,180 as of December 31st, 2012 171 Meeting at the Vice Ministry of Economy, 13 February 2013 172 Republic of Paraguay, 2012, Law 4758/2012 173 Decree 9966/2012 174 Law 3.984/2010 175 Banco Interamericano de Desarrollo (2011). Diseño y desarrollo de un sistema de indicadores sobre ingresos y gastos de finanzas departamentales y municipales, Inter-American Development Bank, Asunción
83
However, it seems that this distribution mechanism does not take into account the fiscal capacity of the municipalities and/or the track record of how efficiently the money has been spent in the past. Hence those municipalities that benefit most from Fonacide are not encouraged to improve spending efficiency. The reliance on guaranteed revenues from Fonacide is also thought to act as a disincentive for increasing tax collection rates at the local level. This is further enforced by the redistribution system from the municipality level to the departmental level. For example, 70 percent of the property tax collected at the municipal level is transferred to departmental governments and to an equity fund helping municipalities with fewer resources.176
Apart from the distribution of Fonacide’s resources at the decentralized level, there are few monitoring tools available for the Government to ensure that these resources are spent efficiently. Few municipalities have detailed short and medium-term investment plans, implementation timelines and/or procurement and evaluation guidelines. We understand that there is no financial management system connected to the SIAF (central administration system) with a sufficient level of disaggregation to monitor the use of resources. Some municipalities have not reported on the use of the resources.177 This has apparently led to an increasing misalignment between public spending at the municipal level and national development priorities.178 There also seems to be a lack of public participation in the decision-making process with little public information related to project implementation. Together, it looks like these factors have led to a sub-optimal allocation of revenues from the electricity sales. While law 3.984/2010 states that municipalities must invest 80 percent of allocated funds from electricity revenue transfers in capital and 20 percent in associated recurrent expenditures, these targets have not been met.179
The enforcement of this law and the accountability of municipalities could be enhanced by increasing transparency. Municipal investment plans should be drawn up on a consultative basis with the population and the project costs and procurement contracts should be disclosed. Boxes 9 and 10 provide examples of such transparency initiatives in Peru and Brazil. To incentivize better planning at the municipal level and higher tax collection rates, the central Government could condition Fonacide transfers based on targets. Box 11 provides an example of how such a mechanism is applied in South Africa.
176 Art culo 153. Impuesto Inmobiliario. Ley Orga nica Municipal. 177 Interview in countries 178 Ministry of Finance of Paraguay (2010). Royalties and compensation: Municipal performance report, third quarter - fiscal 2009, Asunción. And Controller General of the Republic (2007-2010). Special Consideration to the Budget Execution of Operations [different municipalities], Asunción. 179 Ministry of Finance of Paraguay (2010). Royalties and compensation: Municipal performance report, third quarter - fiscal 2009, Asunción. And Controller General of the Republic (2007-2010). Special Consideration to the Budget Execution of Operations [different municipalities], Asunción.
84
Box 9: Canon Mineiro and Transparency in Peru Since 2002, municipalities and regional governments impacted by mining exploitation in Peru have been receiving 100 percent of royalties and 50 percent of the income taxes paid by the companies (Ministry Resolution No. 266-2002-EF/15 of May 1, 2002). Initially, the law established that that these funds could only be earmarked for capital investment. Today 20 percent can be used to pay for project design and the maintenance of public infrastructure. The transfer of funds to regional and local governments is done once a year after mining companies pay the income taxes of the previous year. All transfers and expenditures have to be reported daily and monthly to the Ministry of Economy, which publishes these online on: http://ofi.mef.gob.pe/transparencia/mensual/. Thus, information is available to the public at any given time. Furthermore, the ‘Transparency and Access to Public Information’ Law states that anyone can request information from the regional and local governments, to be provided in a timely manner.180
Box 10: Brazil and Participatory Budgeting Participatory budgeting introduced in Porto Alegre in 1989 is a process through which community representatives define their needs and determine the investment priorities to influence the municipal budget. Participatory budgeting has had a remarkable impact on the accessibility and quality of public service provision in the municipalities that have adopted it. In Porto Alegre, for example, water and sewage access increased from 75 percent of households in 1988 to 98 percent in 1997.181 This transparency and accountability mechanism has created a healthy relationship between municipal administrations and their citizens. Citizens’ participation across income groups ensures people-oriented budget allocation decisions and timely implementation.
180 Interview with Revenue Watch Institute - Peru 181 World Bank, Participatory Budgeting in Brazil, http://siteresources.worldbank.org/INTEMPOWERMENT/Resources/14657_Partic-Budg-Brazil-web.pdf
85
Box 11: South Africa and the Municipal Infrastructure Grant In South Africa, the Municipal Infrastructure Grant (MIG) was launched to combine all the existing capital grants for municipal infrastructure into a single consolidated grant. MIG funds may be used for capital investment (construction, upgrade or rehabilitation), project management, project feasibility studies and/or project business plans. While allocation criteria for municipalities are linked to the number of inhabitants and infrastructure backlogs, municipalities only receive funding if a complete five-year integrated development plan is presented and it is demonstrated that sufficient capacity is available to manage the infrastructure investment program.182 A Municipal Systems Improvement Grant, complementary to the MIG, is designed to provide capacity building programs to municipalities lacking the necessary skills.183
Apart from Fonacide, revenues from Itaipú’s electricity sales are also channeled through the Social and Environmental Fund that was created by the RDE-109/2003 administrative resolution of the Board of Directors (Consejo de Administractión).184 This administrative resolution was enacted as part of Itaipú’s Strategic Plan 2004-2008 (Planeamiento Estratégico 2004-2008) and was later ratified in the 2010-2014 Strategic Plan. The purpose of the Fund is to execute Itapú’s social and environmental policy185 and it is thought to have a budget of around US$100 million.186 Our analysis concludes that complete discretion was granted to the management of the fund and there are no regulatory provisions within the treaty (including its annexes) or in the exchanged diplomatic notes. The idea to earmark Itaipú’s rent for capital, social and environmental expenditure is forward-looking and instrumental in achieving inclusive growth in Paraguay. However, the apparent lack of accountability and transparency mechanisms hampers the realization of the idea. At the central level, it is recommended that revenues be spent mainly on public investments in health, education, and infrastructure. The power of Congress187 combined with a weak enforcement mechanism to recruit, select, promote, dismiss and define the wage rate of the public sector, might explain the relatively
182 Republic of South Africa, 2004, The Municipal Infrastructure Grant Program An Introductory Guide, Prepared by Department of Provincial and Local Government, March 2004 183 Republic of South Africa, 2004, The Municipal Infrastructure Grant 2004 - 2007 From program to projects to sustainable services, Prepared by Department of Provincial and Local Government 184 See art. 6 Itaipú Treaty. 185 http://www.itaipu.gov.br/es/responsabilidad-social/gestion 186 Interview in country 187 Paraguay is the only country in Latin America where the Congress has the power, both by law and practice, to define pay policy in the public sector without reference to the level set in the Executive’s budget (LAFUENTE, Mariano and N. Manning. “Executive-Legislative authority over public servants pay: Lessons from Paraguay”, Working Paper 0210, Working Paper Series on Public Sector Management, World Bank. 2010). This is done through the Personnel Annex, which is part of the budget bill. Using this annex, Congress members can modify salaries of individual positions, therefore giving them the power to respond to their political constituency in the public service (ARROBBIO, Alexandre, M. Lafuente, J. Rinne, Paraguay Policy Notes, Note on Public Employment and Wage Bill. World Bank. 2008).
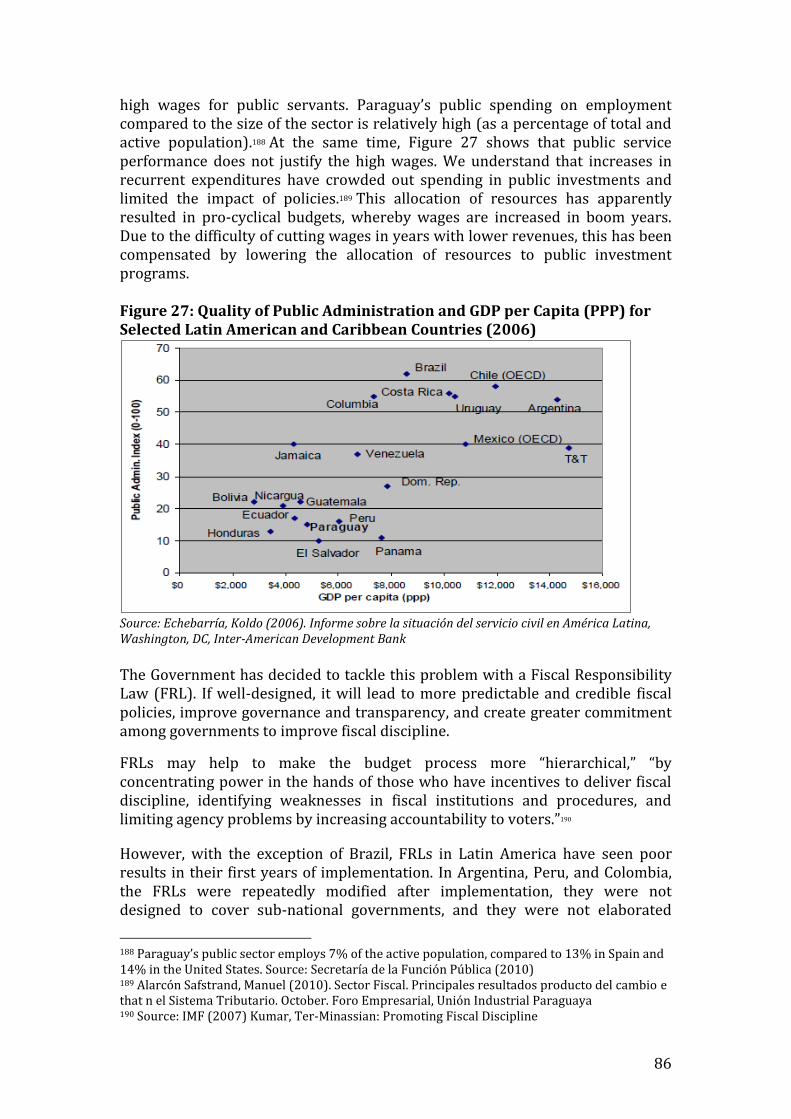
86
high wages for public servants. Paraguay’s public spending on employment compared to the size of the sector is relatively high (as a percentage of total and active population).188 At the same time, Figure 27 shows that public service performance does not justify the high wages. We understand that increases in recurrent expenditures have crowded out spending in public investments and limited the impact of policies.189 This allocation of resources has apparently resulted in pro-cyclical budgets, whereby wages are increased in boom years. Due to the difficulty of cutting wages in years with lower revenues, this has been compensated by lowering the allocation of resources to public investment programs. Figure 27: Quality of Public Administration and GDP per Capita (PPP) for Selected Latin American and Caribbean Countries (2006)
Source: Echebarría, Koldo (2006). Informe sobre la situación del servicio civil en América Latina, Washington, DC, Inter-American Development Bank The Government has decided to tackle this problem with a Fiscal Responsibility Law (FRL). If well-designed, it will lead to more predictable and credible fiscal policies, improve governance and transparency, and create greater commitment among governments to improve fiscal discipline.
FRLs may help to make the budget process more “hierarchical,” “by concentrating power in the hands of those who have incentives to deliver fiscal discipline, identifying weaknesses in fiscal institutions and procedures, and limiting agency problems by increasing accountability to voters.”190
However, with the exception of Brazil, FRLs in Latin America have seen poor results in their first years of implementation. In Argentina, Peru, and Colombia, the FRLs were repeatedly modified after implementation, they were not designed to cover sub-national governments, and they were not elaborated
188 Paraguay’s public sector employs 7% of the active population, compared to 13% in Spain and 14% in the United States. Source: Secretaría de la Función Pública (2010) 189 Alarcón Safstrand, Manuel (2010). Sector Fiscal. Principales resultados producto del cambio e that n el Sistema Tributario. October. Foro Empresarial, Unión Industrial Paraguaya 190 Source: IMF (2007) Kumar, Ter-Minassian: Promoting Fiscal Discipline

87
based on national consensus. As a result, in each of those countries, the fiscal performance continued to deteriorate up until the last revisions of their FRLs.
In Brazil the introduction of its FRL in May 2000 followed a “long process of consensus building in society and among key political actors.” The law was introduced to capitalize on the fiscal efforts that were already underway: reforms of the public financial management system and legislation governing the fiscal relations between the federal and sub-national governments. This included the debt-restructuring program launched in 1997 that promoted transparency and reporting at the sub-national level. Brazil’s FRL lays the emphasis on “procedural and transparency rules and also contains numerical ceilings on selected fiscal indicators” (see Table 23). After the adoption of the FRL, Brazil’s fiscal performance remained strong. Those good results cannot be attributed entirely to the FRL but it has certainly contributed to the fiscal discipline.191
Table 23: Brazil’s Fiscal Responsibility Law in 2000 Procedural Rules and
Transparency Requirements
Numerical Targets Sanctions Escape Clauses
The law sets detailed provisions on the formulation and implementation of the budget and regulates inter- governmental relations. The law also requires transparent fiscal reporting. The Government has to present a brief account of budget execution every two months and report on budget management every four months, identifying remedial policies to achieve fiscal targets if needed.
The ratio of total personnel expenditures to net revenues cannot exceed 50 percent for the federal government, 60 percent for states, and 60 percent for municipalities. There are also limits by branch within each level of government. Permanent spending mandates cannot be created without a corresponding increase in permanent revenues or cuts
If wage expenditures reach95 percent of the ceiling, wage increases, overtime, and new hiring (except in health, education, or social security) are suspended. If debt limits are not complied with, members of the federation are prohibited from receiving voluntary transfers, obtaining direct or indirect guarantees from other members, and contracting credit operations except aimed at re- financing securities debt and reducing personnel expenditures. Public officials can be sanctioned for noncompliance through dismissal, fines, and even jail, according to the Fiscal Crimes Law.
Low economic growth (negative or below 1 percent in the previous four quarters), national catastrophe, state of siege.
Source: IMF (2007) Kumar, Ter-Minassian: Promoting Fiscal Discipline
The IMF has noted that the key-success factors for FRLs are:
- Broad political consensus - A good fiscal institutional framework (need for a good public financial
management system to support the implementation of the law, as well as strong pre-existing institutions)
- Good practice in transparency and accountability, such as clear and open budget formulation, clear execution procedures and an independent audit mechanism/institution. Clear accountability improves the law’s effectiveness and credibility.
191Source: IMF (2007) Kumar, Ter-Minassian: Promoting Fiscal Discipline
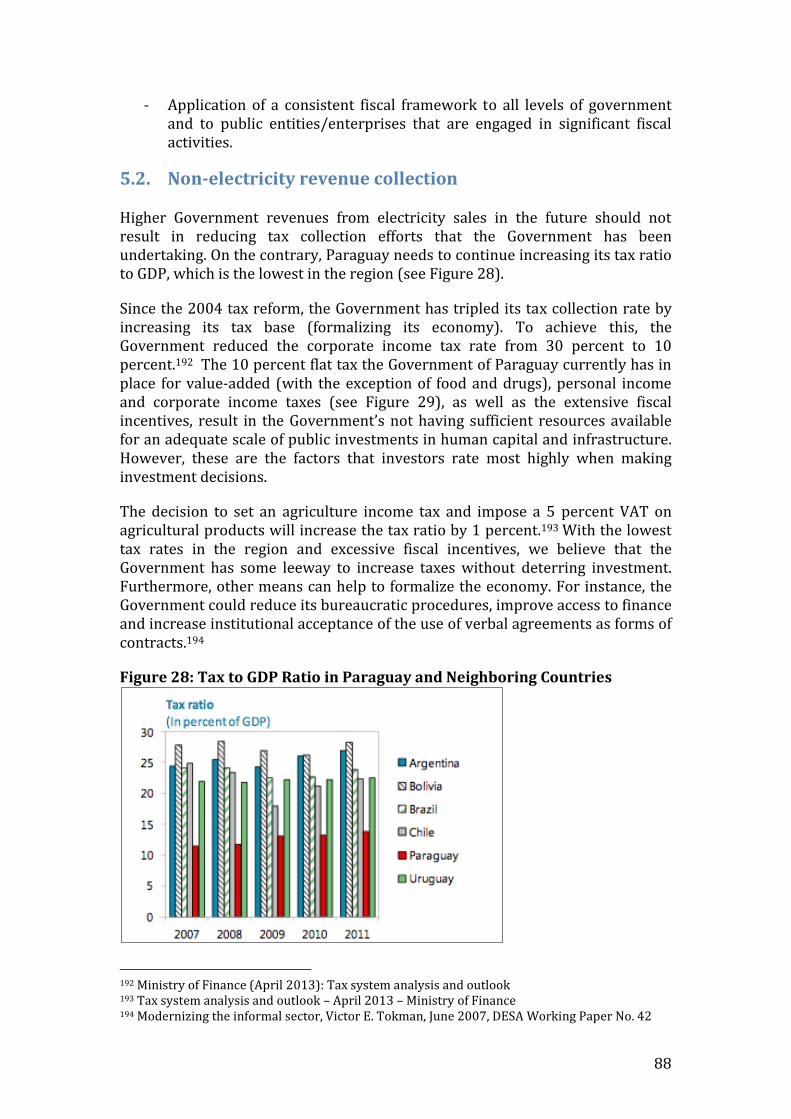
88
- Application of a consistent fiscal framework to all levels of government and to public entities/enterprises that are engaged in significant fiscal activities.
5.2. Non-electricity revenue collection Higher Government revenues from electricity sales in the future should not result in reducing tax collection efforts that the Government has been undertaking. On the contrary, Paraguay needs to continue increasing its tax ratio to GDP, which is the lowest in the region (see Figure 28).
Since the 2004 tax reform, the Government has tripled its tax collection rate by increasing its tax base (formalizing its economy). To achieve this, the Government reduced the corporate income tax rate from 30 percent to 10 percent.192 The 10 percent flat tax the Government of Paraguay currently has in place for value-added (with the exception of food and drugs), personal income and corporate income taxes (see Figure 29), as well as the extensive fiscal incentives, result in the Government’s not having sufficient resources available for an adequate scale of public investments in human capital and infrastructure. However, these are the factors that investors rate most highly when making investment decisions.
The decision to set an agriculture income tax and impose a 5 percent VAT on agricultural products will increase the tax ratio by 1 percent.193 With the lowest tax rates in the region and excessive fiscal incentives, we believe that the Government has some leeway to increase taxes without deterring investment. Furthermore, other means can help to formalize the economy. For instance, the Government could reduce its bureaucratic procedures, improve access to finance and increase institutional acceptance of the use of verbal agreements as forms of contracts.194
Figure 28: Tax to GDP Ratio in Paraguay and Neighboring Countries
192 Ministry of Finance (April 2013): Tax system analysis and outlook 193 Tax system analysis and outlook – April 2013 – Ministry of Finance 194 Modernizing the informal sector, Victor E. Tokman, June 2007, DESA Working Paper No. 42
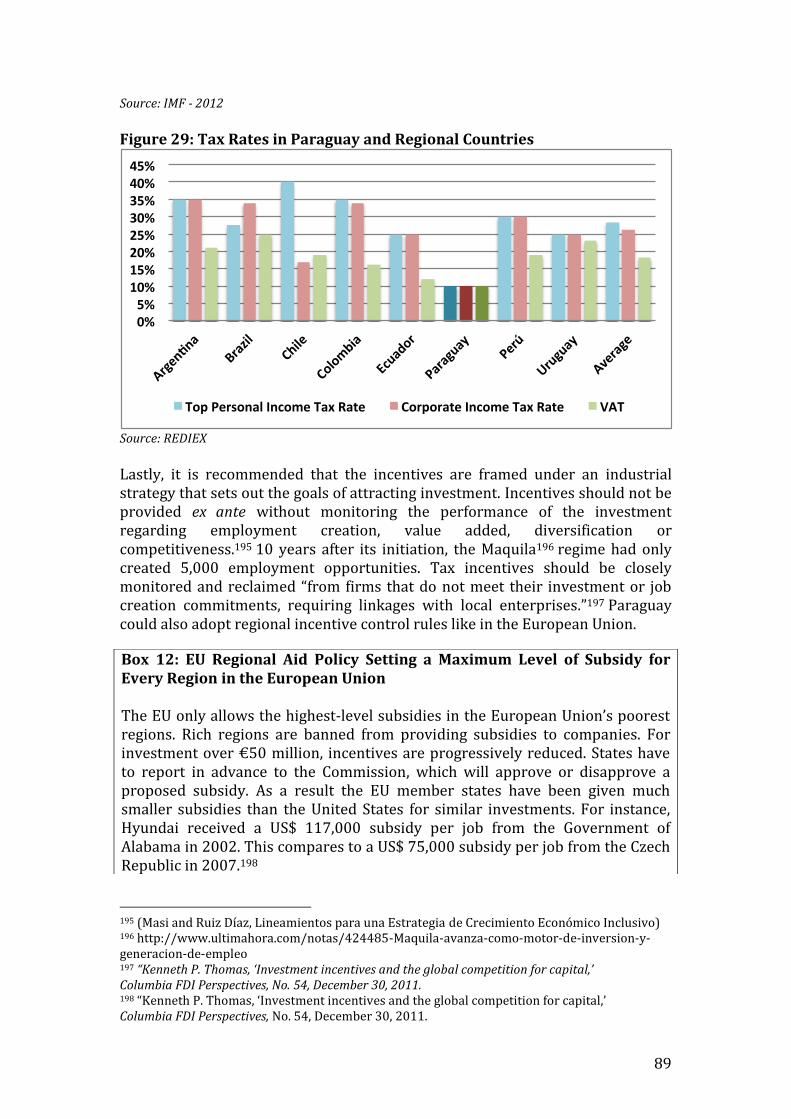
89
Source: IMF - 2012
Figure 29: Tax Rates in Paraguay and Regional Countries
Source: REDIEX
Lastly, it is recommended that the incentives are framed under an industrial strategy that sets out the goals of attracting investment. Incentives should not be provided ex ante without monitoring the performance of the investment regarding employment creation, value added, diversification or competitiveness.195 10 years after its initiation, the Maquila196 regime had only created 5,000 employment opportunities. Tax incentives should be closely monitored and reclaimed “from firms that do not meet their investment or job creation commitments, requiring linkages with local enterprises.”197 Paraguay could also adopt regional incentive control rules like in the European Union.
195 (Masi and Ruiz Díaz, Lineamientos para una Estrategia de Crecimiento Económico Inclusivo) 196 http://www.ultimahora.com/notas/424485-Maquila-avanza-como-motor-de-inversion-y-generacion-de-empleo 197 “Kenneth P. Thomas, ‘Investment incentives and the global competition for capital,’ Columbia FDI Perspectives, No. 54, December 30, 2011. 198 “Kenneth P. Thomas, ‘Investment incentives and the global competition for capital,’ Columbia FDI Perspectives, No. 54, December 30, 2011.
0%5%10%15%20%25%30%35%40%45%
Argenna
Brazil
Chile
Colombia
Ecuador
Paraguay
Perú
Uruguay
Average
TopPersonalIncomeTaxRate CorporateIncomeTaxRate VAT
Box 12: EU Regional Aid Policy Setting a Maximum Level of Subsidy for Every Region in the European Union The EU only allows the highest-level subsidies in the European Union’s poorest regions. Rich regions are banned from providing subsidies to companies. For investment over €50 million, incentives are progressively reduced. States have to report in advance to the Commission, which will approve or disapprove a proposed subsidy. As a result the EU member states have been given much smaller subsidies than the United States for similar investments. For instance, Hyundai received a US$ 117,000 subsidy per job from the Government of Alabama in 2002. This compares to a US$ 75,000 subsidy per job from the Czech Republic in 2007.198
90
There is, in short, room to increase taxes in order to invest in infrastructure and human capital. These investments are paramount for sustainable inclusive growth and diversification of the economy.
5.3. A planning strategy To guide future Government investment and align/coordinate the objectives and activities beyond the energy sector, a long-term development plan could be prepared. Such a plan should contain the vision of where Paraguay aims to be in 20 years, with clear targets for all aspects of importance to the Paraguayan people, including education and training, health, social equity, environment, economic development and infrastructure development. Departmental/municipal plans and sector specific strategies (including those addressed in this report – energy, industry and environment) should be aligned to the overarching long-term development strategy.
By breaking down the targets into shorter time frames and estimating the costs of necessary investments to achieve these goals, it will be clear what tax rates are needed to fund such a development plan. A Medium Term Expenditure Framework (MTEF) can serve as a tool for such an exercise.199An MTEF is used to “forecast the overall resource envelope [based on fiscal targets, estimated revenues and financial obligations], and to allocate spending among sectors for the medium term according to the policy priorities set out in [a] five-year plan.”200 MTEFs enable multi-year budgeting and planning, which almost all major public investment strategies 201 require, both for their design and implementation, and for their success. The objectives of an MTEF are:
- Improved macroeconomic balance, especially fiscal discipline - Greater budgetary predictability for line ministries - More efficient use of public resources
199 Paragraph adapted from Lisa Sachs and Perrine Toledano, with Susan Maples, Resource-Based Development in the Lower Zambezi Basin (June 2011), http://ccsi.columbia.edu/files/2013/12/lowerzambezi.pdf 200 “Minding the Gaps: Integrating Poverty Reduction Strategies and Budgets for Domestic Accountability,” The World Bank et al, April 2007, p. 96. 201 “While annual budgets can be sufficient for annual consumption expenses, public investment strategies require a number of medium-to-long term considerations: a) the estimated social returns on various kinds of medium-term investments, b) the capacity of the government to carry out a multi-year public investment program, c) the possible excessive management costs of public investments if they are too concentrated within the same time-span (in terms of oversight, management, etc..), d) the dangers of illiquidity if large public investment programs are undertaken simultaneously without adequate medium-term expenditure planning, and e) the medium-to-long-term hidden operations and maintenance (O&M) costs associated with capital investments.” Lisa Sachs and Perrine Toledano, with Susan Maples, Resource-Based Development in the Lower Zambezi Basin (June 2011), http://ccsi.columbia.edu/files/2013/12/lowerzambezi.pdf.

91
- Greater political accountability for public expenditure outcomes through more legitimate decision-making processes and greater credibility of budgetary decision-making (political restraint)202
An MTEF is only credible and meaningful if it is integrated into both the planning and the budgeting process. The first step is defining an integrated sectoral strategy for realizing the priorities of a 5-year plan and then determining which public investments are necessary to achieve the priorities. Those public investments should be costed to determine the necessary resource allocation (both by sector and between capital and recurrent expenditures) over a medium term time frame. Based on these costed plans, the Government determines sectoral allocations, which in turn become both the guide and the budget ceilings for the sectors’ programs and budgets over the medium term.203 The annual budget would effectively be the first year of the MTEF, and the outer years of the MTEF would guide the budget allocations in subsequent years. Not only does this bring coherence to the planning and budgeting process, but it also makes budget allocation decisions more accountable, transparent and predictable.204
5.4. Summary of Findings and Recommendations
1. To manage increased electricity revenues more efficiently, better revenue management systems need to be put in place that guarantee transparency and provide monitoring opportunities at the centralized and decentralized level. Earmarking infrastructure and human capital spending from electricity exports, such as the FONACIDE and Fundo Social programs, is commendable but needs to be done in a transparent way to guarantee checks and balances. Requiring local development plans; publishing these plans, contracts and funds online; and rewarding departmental/municipal governments for improved tax collection and successful project implementation could help reduce inefficiencies at the decentralized level.
2. At the central level, it is recommended that revenues be spent mainly on
public investments in health, education, and infrastructure. Paraguay pays its public servants relatively high wages, but does not reap the benefits of quality public administration services. The Fiscal Responsibility Law currently being considered by the Government will partly address this issue and lead to more predictable and credible fiscal policies, improve governance and transparency, and create greater commitment among government institutions to improve fiscal discipline. Increased electricity revenues in the future should not deter the
202 Philippe Le Houerou and Robert Taliercio, “Medium Term Expenditure Frameworks: From Concept to Practice. Preliminary Lessons from Africa,” Africa Region Working Paper Series No. 28, February 2002. 203 Philippe Le Houerou and Robert Taliercio, “Medium Term Expenditure Frameworks: From Concept to Practice. Preliminary Lessons from Africa,” Africa Region Working Paper Series No. 28, February 2002. 204 Paragraph adapted from Lisa Sachs and Perrine Toledano, with Susan Maples, Resource-Based Development in the Lower Zambezi Basin (June 2011), http://ccsi.columbia.edu/files/2013/12/lowerzambezi.pdf

92
Government from its efforts to increase tax collection. On the contrary, these should be increased so the Government can spend on infrastructure and human capital – two areas where it performs relatively poorly in comparison to neighboring countries.
3. To guide Government spending, we recommend that Paraguay adopt a
20-year strategic plan for the country, which can be developed in close cooperation with the broad public and expert communities. Targets should be set for all aspects of importance to the Paraguayan people, including education and training, health, social equity, infrastructure, the environment and economic development. A Medium Term Expenditure Framework can be used to guide coherent planning with the budgeting process, and make budget allocation decisions more accountable, transparent and predictable.
93
ANNEX A: Paraguay’s Comparative Advantages and Barriers to Sustainable Development While the report primarily focuses on the electricity sector, there is whole set of economic and institutional variables that will determine the attractiveness of the country from investors’ perspective. This annex is meant to provide an overview of the most important comparative advantages Paraguay has to offer and the barriers that are holding back development. Positive economic outlook
With a GDP of US$41.1 billion,205 Paraguay is the third smallest economy of South America. The country witnessed significant economic growth rates between 2004 and 2008, during which time the economy grew at an average rate of 4.6 percent, representing the largest GDP increase in three decades. In 2009 GDP contracted as a result of a severe draught affecting the agriculture sector. After rebounding in 2010, the economy slowed again in 2011 and contracted slightly in 2012.206 Much of the expansion and volatility of Paraguay’s GDP can be explained by commodity prices, as the country is a net exporter of agricultural products.207 In 2011 agriculture exports accounted for about 42 percent of its total US$5.5 billion export revenues (see Figure 30). As a relatively open economy (index of economic opening of 66 percent208), but not sufficiently diversified, the country is exposed to commodity price swings, climate conditions and other external factors that are out of the Government’s control.
205 GDP Purchasing Power Parity 206 Central Bank (2012) Cuentas Nacionales de Paraguay 207The World Bank. Energy Sector Strengthening Project. Project Appraisal Document, Sustainable Development Department Country Management Unit for Argentina, Paraguay and Uruguay, The World Bank, Washington: The World Bank, 2010 208 CBP (2011) measured as the percentage of exports plus imports over GDP

94
Figure 30: Primary Sector Exports 2003 – 2011
Source: Central Bank of Paraguay
The services sector (including Government) is the main contributor to Paraguay’s GDP and also provides the largest share of employment opportunities as shown in Figure 31. This can largely be traced back to Paraguay’s open economy, which has created many jobs in the commercial sector. Although the agricultural sector has seen a shift from subsistence small-scale farming to a more mechanized system, it still employs 26 percent of the population209 (down from 45 percent in 2005210). The industrial sector remains small, but has been expanding in recent years (growth rate of 6.5 percent in 2010211). Food processing and beverages make up the largest share of the industrial sector with wood processing, textiles, pharmaceuticals, hides and furs also of importance.212 Figure 31: Structure of Paraguay’s Economy (2012)
Sources: CIA, DGEEC
209 Dirección General de Estatística, Encuestas y Censos (2011) Encuesta Parmanente de Hogares 210 Paraguay country profile. Library of Congress Federal Research Division (October 2005), http://lcweb2.loc.gov/frd/cs/profiles/Paraguay.pdf 211 Central Intelligence Agency 212 Dirección General de Estatística, Encuestas y Censos (2011) Censo Economico Nacional
0
1,000,000
2,000,000
3,000,000
4,000,000
5,000,000
6,000,000
2003 2004 2005 2006 2007 2008 2009 2010 2011
Primary Sector Exports Thousand US$
Agricultural Products Animal Products Total Exports
61%20%
19%
GDPbySector
Services Agriculture Industry
56%26%
17%
EmploymentbySector
Services Agriculture Industry

95
There is a mismatch between the supply and demand for jobs. Many technical and engineering skills do not exist in the country to fill the demand from new investments to come. The official unemployment rate was 5.6 percent in 2011 with 181,000 people actively looking for a job. 21.9 percent were underemployed,213 down from 26.6 percent in 2007. Data on the formal structure of the economy must be analyzed with care, since Paraguay has a relatively large informal sector. According to the World Bank, 75.3 percent of the firms in Paraguay reported having informal or unregistered competitors.214 In 2010 “practices in the informal sector” were listed as the top obstacle for investments,215 and it is believed that a large percentage of the Paraguayan working population is employed informally.216 The medium-term macroeconomic outlook is positive. The IMF projects GDP growth rates of 8.5 percent in 2013 and around 4.7 percent for the following four years. This economic expansion is expected to occur with inflation rates below the 5 percent target and accompanied with increasing foreign direct investment and a falling Government debt.217 Labor competitiveness
Paraguay has a relatively cheap, young and trainable218 labor force. According to the latest census data, 75 percent of Paraguayans are younger than 40219 and 31.4 percent are between 20 and 40 years old. This represents the youngest working age population of South America.220 This trend is expected to continue, as Paraguay has the highest regional population growth rate of 1.26221 percent.
213 Dirección General de Estatística, Encuestas y Censos (2011) Encuesta Parmanente de Hogares 214 World Bank (2012) Business Environment Snapshot for Paraguay - http://rru.worldbank.org/besnapshots/BecpProfilePDF.aspx?economy=paraguay 215 http://www.enterprisesurveys.org/Reports 216Masi, Fernando. "Sector Informal y Cuentapropismo en el Paraguay." CADEP. 2002. http://www.cadep.org.py/uploads/2012/10/Sector-informal-y-cuentapropismo-en-el-Paraguay_-FM.pdf 217 IMF (2012) Article IV Mission 218 Meeting with the Union Industrial Paraguaya 219 Dirección General de Estadísticas, Encuestas y Censos 220 REDIEX 221 Central Intelligence Agency
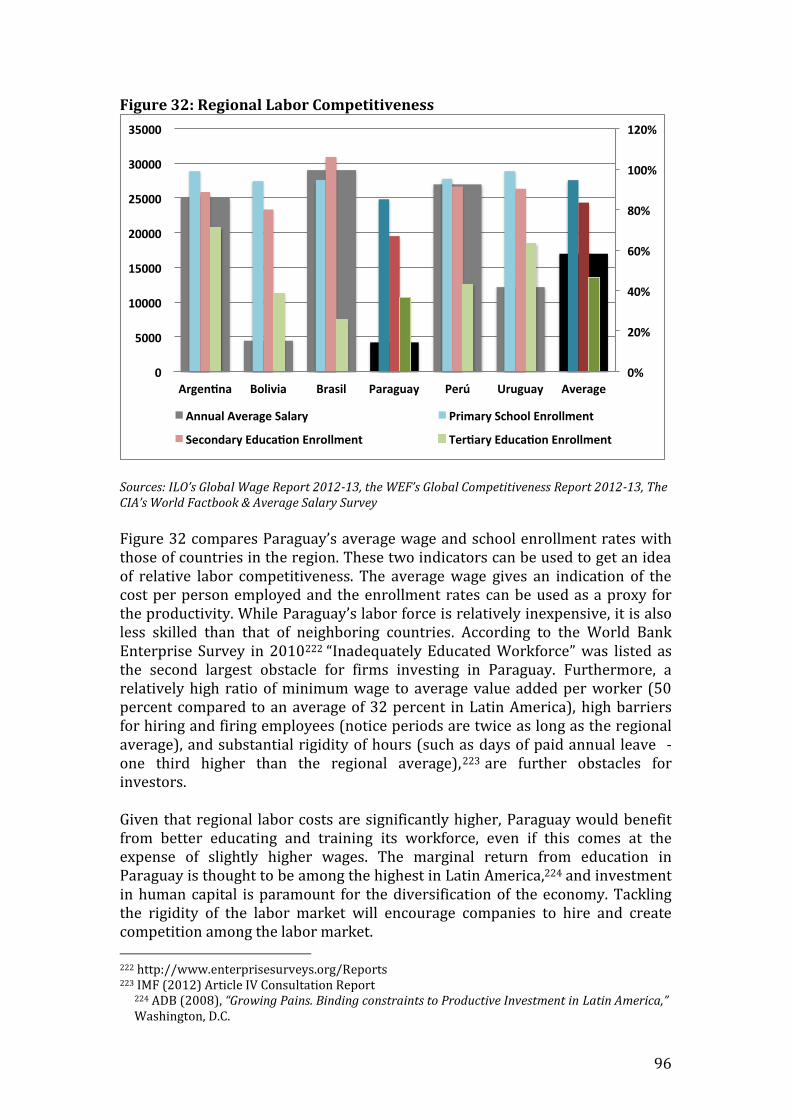
96
Figure 32: Regional Labor Competitiveness
Sources: ILO’s Global Wage Report 2012-13, the WEF’s Global Competitiveness Report 2012-13, The CIA’s World Factbook & Average Salary Survey
Figure 32 compares Paraguay’s average wage and school enrollment rates with those of countries in the region. These two indicators can be used to get an idea of relative labor competitiveness. The average wage gives an indication of the cost per person employed and the enrollment rates can be used as a proxy for the productivity. While Paraguay’s labor force is relatively inexpensive, it is also less skilled than that of neighboring countries. According to the World Bank Enterprise Survey in 2010222 “Inadequately Educated Workforce” was listed as the second largest obstacle for firms investing in Paraguay. Furthermore, a relatively high ratio of minimum wage to average value added per worker (50 percent compared to an average of 32 percent in Latin America), high barriers for hiring and firing employees (notice periods are twice as long as the regional average), and substantial rigidity of hours (such as days of paid annual leave - one third higher than the regional average),223 are further obstacles for investors. Given that regional labor costs are significantly higher, Paraguay would benefit from better educating and training its workforce, even if this comes at the expense of slightly higher wages. The marginal return from education in Paraguay is thought to be among the highest in Latin America,224 and investment in human capital is paramount for the diversification of the economy. Tackling the rigidity of the labor market will encourage companies to hire and create competition among the labor market.
222 http://www.enterprisesurveys.org/Reports 223 IMF (2012) Article IV Consultation Report 224 ADB (2008), “Growing Pains. Binding constraints to Productive Investment in Latin America,” Washington, D.C.
0%
20%
40%
60%
80%
100%
120%
0
5000
10000
15000
20000
25000
30000
35000
Argen na Bolivia Brasil Paraguay Perú Uruguay Average
AnnualAverageSalary PrimarySchoolEnrollment
SecondaryEduca onEnrollment Ter aryEduca onEnrollment
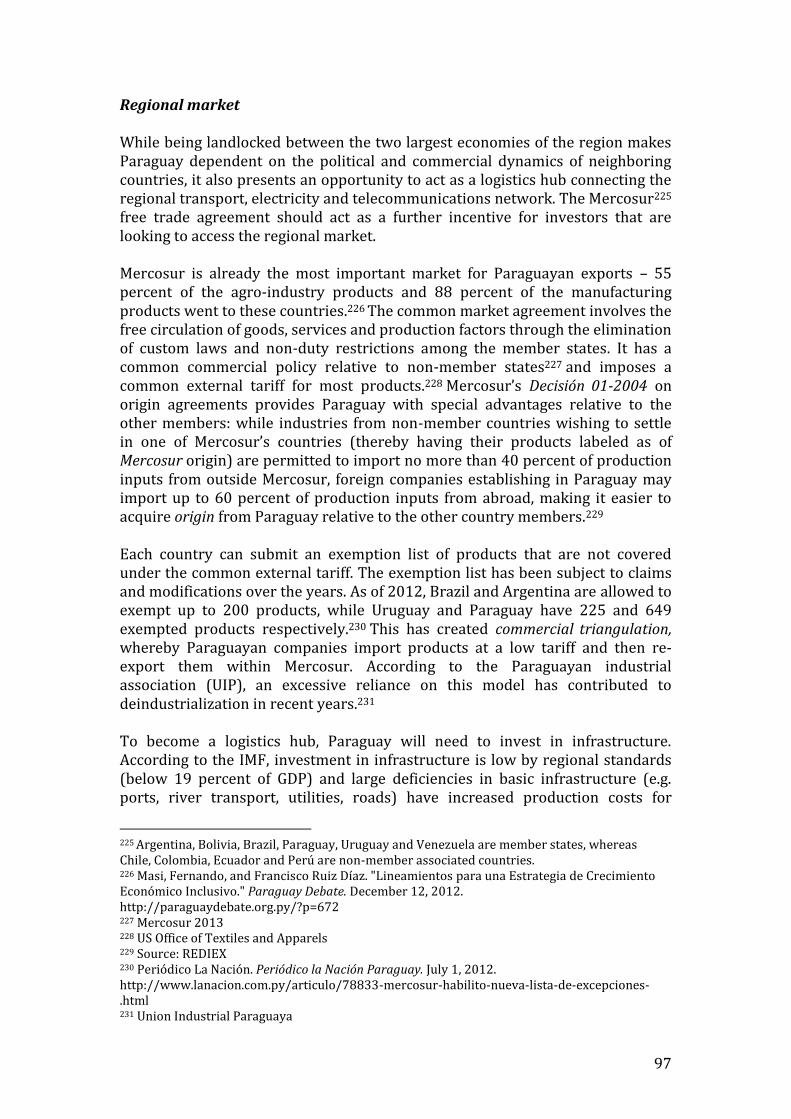
97
Regional market
While being landlocked between the two largest economies of the region makes Paraguay dependent on the political and commercial dynamics of neighboring countries, it also presents an opportunity to act as a logistics hub connecting the regional transport, electricity and telecommunications network. The Mercosur225 free trade agreement should act as a further incentive for investors that are looking to access the regional market. Mercosur is already the most important market for Paraguayan exports – 55 percent of the agro-industry products and 88 percent of the manufacturing products went to these countries.226 The common market agreement involves the free circulation of goods, services and production factors through the elimination of custom laws and non-duty restrictions among the member states. It has a common commercial policy relative to non-member states227 and imposes a common external tariff for most products.228 Mercosur’s Decisión 01-2004 on origin agreements provides Paraguay with special advantages relative to the other members: while industries from non-member countries wishing to settle in one of Mercosur’s countries (thereby having their products labeled as of Mercosur origin) are permitted to import no more than 40 percent of production inputs from outside Mercosur, foreign companies establishing in Paraguay may import up to 60 percent of production inputs from abroad, making it easier to acquire origin from Paraguay relative to the other country members.229 Each country can submit an exemption list of products that are not covered under the common external tariff. The exemption list has been subject to claims and modifications over the years. As of 2012, Brazil and Argentina are allowed to exempt up to 200 products, while Uruguay and Paraguay have 225 and 649 exempted products respectively.230 This has created commercial triangulation, whereby Paraguayan companies import products at a low tariff and then re-export them within Mercosur. According to the Paraguayan industrial association (UIP), an excessive reliance on this model has contributed to deindustrialization in recent years.231 To become a logistics hub, Paraguay will need to invest in infrastructure. According to the IMF, investment in infrastructure is low by regional standards (below 19 percent of GDP) and large deficiencies in basic infrastructure (e.g. ports, river transport, utilities, roads) have increased production costs for
225 Argentina, Bolivia, Brazil, Paraguay, Uruguay and Venezuela are member states, whereas Chile, Colombia, Ecuador and Perú are non-member associated countries. 226 Masi, Fernando, and Francisco Ruiz Díaz. "Lineamientos para una Estrategia de Crecimiento Económico Inclusivo." Paraguay Debate. December 12, 2012. http://paraguaydebate.org.py/?p=672 227 Mercosur 2013 228 US Office of Textiles and Apparels 229 Source: REDIEX 230 Periódico La Nación. Periódico la Nación Paraguay. July 1, 2012. http://www.lanacion.com.py/articulo/78833-mercosur-habilito-nueva-lista-de-excepciones-.html 231 Union Industrial Paraguaya

98
investors and consequently hurt growth prospects.232 The UIP estimated the costs of poor infrastructure connectivity (especially road connectivity) to amount to an equivalent of 4.3 percent of national GDP in 2006.233 The truck overload and inefficient logistics network have prompted the Government to prepare infrastructure plans, which aim to connect roads and railways with the waterways and industry clusters. To finance these investments, the Government envisions public private partnerships, for which it will first need to pass appropriate legislation. Cheap access to electricity
The lack of electric infrastructure, constant outages and high losses in the network mean that the electricity sector today is a constraint rather than a comparative advantage. However, if the Government implements ANDE’s Master Plan and addresses the problems identified in Chapter 1 of this report, access to reliable and clean electricity at competitive prices will become a major comparative advantage compared to neighboring countries where tariff rates are higher and are likely to increase further in the future. Fiscal incentives While it could be argued that the fiscal incentives provided to export oriented companies is a comparative advantage, this has not been analyzed in the Paraguayan context and “the balance of evidence from developing countries suggests that fiscal incentives do not effectively counterbalance unattractive investment climate conditions”.234 The Maquila regulation and the ley 60/90235236 are the most prominent incentives for export-oriented companies.237 Maquila is a production system by which subsidiaries of international firms can locate within Paraguay to produce goods and services that are exported to the headquarters abroad. The maquilas do not pay tariffs on capital goods, raw materials or inputs. Only a 1 percent tax on turnover is charged. Similarly, ley 60/90 implies that national and foreign companies investing in Paraguay are exempted from paying duties on imported capital goods and VAT on domestically purchased capital goods. Furthermore, no taxes are paid on dividends or remittances.238 Figures 33 and 34 show the investment flows associated with the 60/90 regulations. Both figures reveal irregular trends of investment over the last
232 IMF (2012) Article IV Consultation Report 233 http://www.uip.org.py/c/document_library/get_file?uuid=3ad38a38-4bbc-4e46-9950-28ae8e56dfec&groupId=10192 234 World Bank (2009) Incentives and Investments: Evidence and Policy Implications
235 Ley 60/90 has been modified by Law No. 2421/04 – available at http://www.mic.gov.py/v1/sites/172.30.9.105/files/ley2421_incidencia_ley6090.pdf 236 (REDIEX)
237 There are other incentives, including for tax-free zones, special regimes for mines, energy, forestry and exports. 238 (REDIEX)
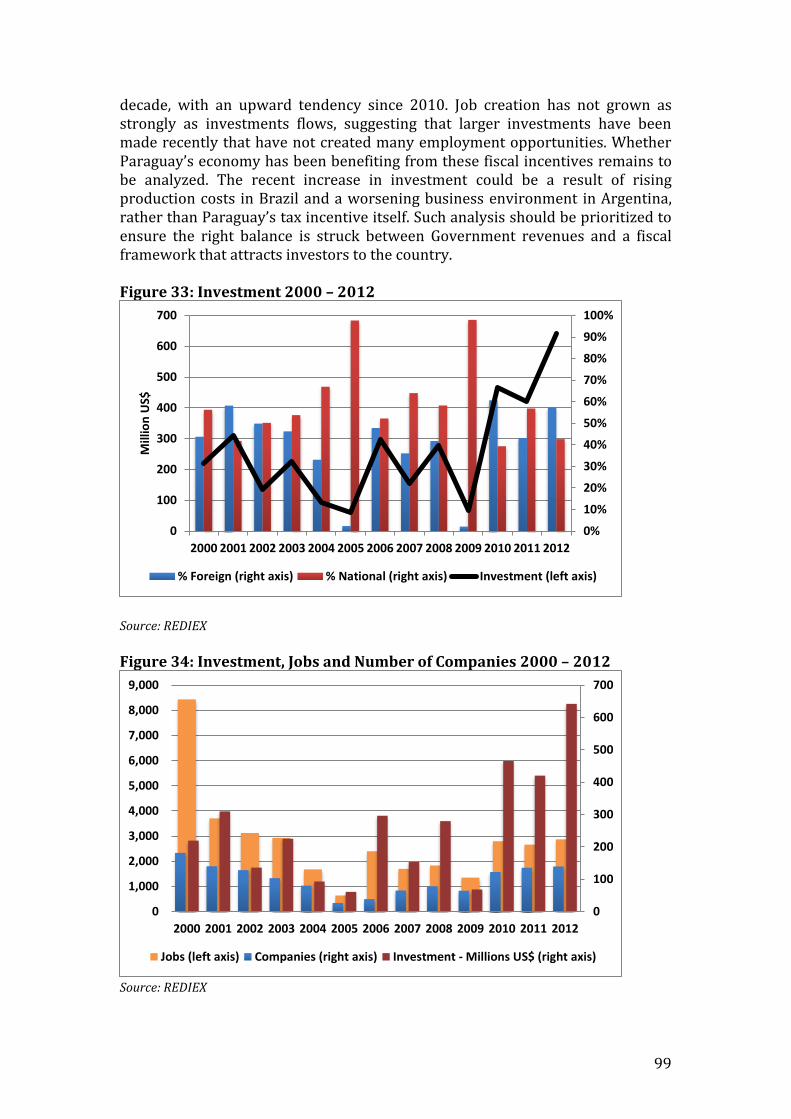
99
decade, with an upward tendency since 2010. Job creation has not grown as strongly as investments flows, suggesting that larger investments have been made recently that have not created many employment opportunities. Whether Paraguay’s economy has been benefiting from these fiscal incentives remains to be analyzed. The recent increase in investment could be a result of rising production costs in Brazil and a worsening business environment in Argentina, rather than Paraguay’s tax incentive itself. Such analysis should be prioritized to ensure the right balance is struck between Government revenues and a fiscal framework that attracts investors to the country. Figure 33: Investment 2000 – 2012
Source: REDIEX
Figure 34: Investment, Jobs and Number of Companies 2000 – 2012
Source: REDIEX
0%
10%
20%
30%
40%
50%
60%
70%
80%
90%
100%
0
100
200
300
400
500
600
700
2000 2001 2002 2003 2004 2005 2006 2007 2008 2009 2010 2011 2012
Mill
ion
US$
% Foreign (right axis) % National (right axis) Investment (left axis)
0
100
200
300
400
500
600
700
0
1,000
2,000
3,000
4,000
5,000
6,000
7,000
8,000
9,000
2000 2001 2002 2003 2004 2005 2006 2007 2008 2009 2010 2011 2012
Jobs (left axis) Companies (right axis) Investment - Millions US$ (right axis)
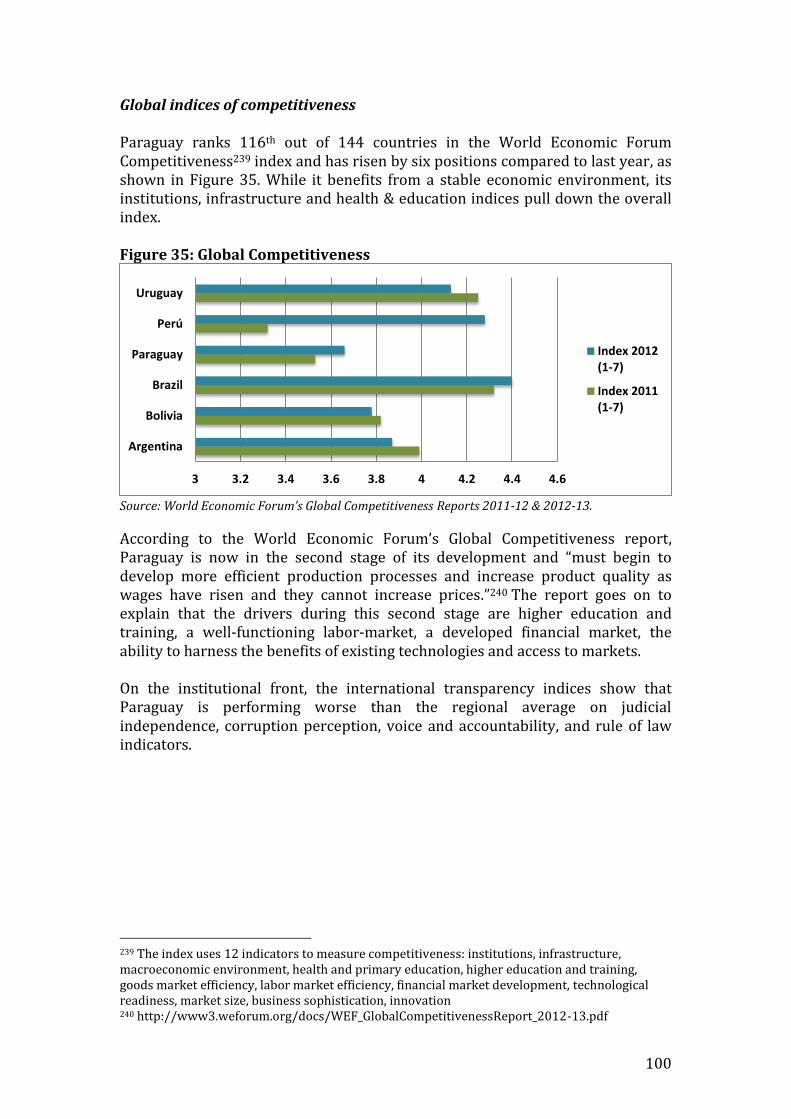
100
Global indices of competitiveness
Paraguay ranks 116th out of 144 countries in the World Economic Forum Competitiveness239 index and has risen by six positions compared to last year, as shown in Figure 35. While it benefits from a stable economic environment, its institutions, infrastructure and health & education indices pull down the overall index. Figure 35: Global Competitiveness
Source: World Economic Forum’s Global Competitiveness Reports 2011-12 & 2012-13.
According to the World Economic Forum’s Global Competitiveness report, Paraguay is now in the second stage of its development and “must begin to develop more efficient production processes and increase product quality as wages have risen and they cannot increase prices.”240 The report goes on to explain that the drivers during this second stage are higher education and training, a well-functioning labor-market, a developed financial market, the ability to harness the benefits of existing technologies and access to markets. On the institutional front, the international transparency indices show that Paraguay is performing worse than the regional average on judicial independence, corruption perception, voice and accountability, and rule of law indicators.
239 The index uses 12 indicators to measure competitiveness: institutions, infrastructure, macroeconomic environment, health and primary education, higher education and training, goods market efficiency, labor market efficiency, financial market development, technological readiness, market size, business sophistication, innovation 240 http://www3.weforum.org/docs/WEF_GlobalCompetitivenessReport_2012-13.pdf
3 3.2 3.4 3.6 3.8 4 4.2 4.4 4.6
Argentina
Bolivia
Brazil
Paraguay
Perú
Uruguay
Index 2012(1-7)
Index 2011(1-7)

101
Figure 36 and 37: Transparency and Accountability Indexes for Paraguay and Regional Countries
Source: Transparency International
0 50 100 150
Paraguay
Peru
Uruguay
Chile
Brazil
Argen na
Bolivia
Average
JucialIndependence2011-2012(outof142countries)
Corrup onPercep on-2012(outof176countries)
0% 20% 40% 60% 80% 100%
Paraguay
Peru
Uruguay
Chile
Brazil
Argen na
Bolivia
Average
VoiceandAccountability(percen lerank-2010)
RuleofLaw(percen lerank-2010)
102
ANNEX B: Mapping of the Investment Legal Framework
I. Constitutional241 Art. 7. Right to a healthy environment
Establishes the fundamental right to inhabit a healthy and ecologically balanced environment, and the public interest in the preservation, conservation and improvement of the environment.
Art. 8. Environmental protection Establishes that the law shall regulate any activity likely to have an impact on the environment; that environmental crimes shall be defined and punished by law; and that any damage to the environment shall entail the obligation to repair and indemnify.
Art. 64. Community property Establishes the right of indigenous people to community property of land, which shall be gratuitously provided by the State. The lands shall be indivisible and not susceptible to seizure, transfer, prescription, or any contractual right.
Art. 86. Labor rights Labor rights cannot be waived.
Art. 87. Employment The State shall promulgate policies to promote professional development. National employees shall be given preference.
Art. 88. Discrimination. Discrimination on any grounds shall not be permitted.
Art. 107. Free Competition Ensures a free market without monopolies and equality of treatment in commercial activities.
Art. 109. Private property Ensures private property within the limits established by law, taking into account its social function. Compensation shall be due in case of expropriation.
Art. 179. Taxes Taxes shall be enforced by laws and set according to fair economic and social principles, as well as following policies that favor national development.
Art. 276. Defensor del Pueblo (Ombudsman) The Defensor del Pueblo is a parliamentary commissioner whose functions are the defense of human rights, the enquiry of popular claims and the
241 This is a broad description of the relevant provisions contained in the Paraguayan Constitution.

103
implementation of the common interest.
Art. 283. Contraloria General de la República (Controller-General) The Contraloria General de la República is in charge of controlling economic and financial activities of the State, the Departments, and Municipalities. The Constitution sets the general principles on which the Paraguayan legal framework is founded. Constitutional provisions are not self-enforceable, as they require further provisions (created by law, decree, or administrative resolutions) in order to regulate their application. Constitutional principles are relevant insofar as the validity of any other normative act would be subject to its compliance within them.
II. Administrative A. Public Procurement
Law No. 2051/02, “De Contrataciones Públicas” Establishes the Public Procurement general framework.
Law No. 3439/07, “Que modifica la Ley No. 2051/02 ‘De Contrataciones Públicas’ y Establece la Carta Orgánica de la Dirección Nacional De Contrataciones Públicas”
Modifies some provisions of the Ley No. 2051/02, which sets the general Public Procurement framework; creates the Dirección Nacional de Contrataciones Públicas (DNCP—National Office of Public Procurement)242 and establishes its by-laws.
Decree No. 21909/03, “Por el cual se reglamenta la Ley No. 2051/03 ‘De Contrataciones Públicas’”
Provides specific provisions for the application of the Law No. 2051/02.
B. Public finance Law No. 1535/99
Sets the legal framework for the drafting and execution of the national budget, which, according to the law, must include all the income and expenses of all State and State-owned entities.
C. Public Registry (Land) Law No. 879/81 “Código De Organización Judicial”
Regulates most of the Public Registries, among them the registry concerning land ownership.
Law No. 2424/2004 “Servicio Nacional De Catastro” Creates and regulates the Servicio Nacional de Catastro, a governmental branch that keeps a record of Paraguayan land.
D. Municipal Law No. 3966/10 “Organica Municipal”
242 The DNCP supervises all the tender process to contract with state or state-owned entities.

104
Establishes the general framework applicable to all municipalities. It sets the general standards for zoning, construction, tax, environmental protection, urban planning and development. Subject to RTA’s prospective facility’s location, the specific municipal and departmental regulations that might affect the project will have to be determined, i.e. the required municipal licenses, construction permissions, taxes, etc.
III. Environmental Law No. 422/73 “Ley Forestal”
Regulates the exploitation and use of national forests.
Law No. 294/93 “Evaluación De Impacto Ambiental and Decreto No. 14.281/96 and 4066/2010.
Sets the requirements to obtain an environmental license. All projects that have a direct or indirect impact on the biodiversity, wellbeing, health, personal security, practices and customs, cultural heritage or legitimate means of livelihood, shall require an environmental license or “Declaración de Impacto Ambiental” (DIA—Declaration of Environmental Impact). Every DIA requires an Environmental Impact Assessment. This assessment should identify all the environmental impacts that the project could cause. RTA will be required to obtain this license and it will need to submit the environmental assessment to the SEAM office. The SEAM evaluates the project and decides whether or not to grant the license.
Law No. 1561/00 “Que crea el Sistema Nacional del Ambiente, el Consejo
Nacional del Ambiente y la Secretaría del Ambiente” Creates the SEAM, a state entity responsible for the issuance of environmental licenses.
Law No. 3464/08 ”Que crea el Instituto Forestal Nacional – INFONA” Creates the INFOMA, a state entity that enforces the provisions set in Ley No. 422/73.
IV. Tax Law No. 125/91 “Que Establece el Nuevo Régimen Tributario”
Establishes the Tax Regime.
Law No. 2421/04, “De reordenamiento administrativo y de adecuación fiscal.”
Modifies some provisions of the Ley No. 125/91, regarding IRACIS (income tax for commercial, industrial and services activities) and IVA (value added tax)
V. Customs Law No. 2422/03 “Código Aduanero”
Establishes the customs regime.
105
Art. 178 of the Código Aduanero, establishes the temporal admission regime for active improvement which permits the admission of foreign goods to the territory, with partial or total suspension of tax payment, to perform improvements and the subsequent re-exportation of the resulting product. Art. 203 of the Código Aduanero establishes the procedure for processing under customs control: it allows the entry of foreign goods into the customs territory, for processing, with full suspension of customs duty payments and it allows subsequent permanent importation of processed products. Art. 287 of the Código Aduanero addresses free zones, which are physically limited areas where imports and exports are not subject to custom taxes, as long as they are utilized, stored and consumed in accordance with the specifications set in the specific legislation
VI. Labor Law No. 213/93 “Código Laboral”
Establishes the Labor regime.
VII. Commercial (Contracts and Property) and Investment Law No. 1183/85 “Código Civil”
Sets the provisions that govern contractual relationships, property ownership, and the qualification of legal entities.
Law No. 117/91 – Foreign Investment Law Gives foreigners the same guarantees, rights and obligations enjoyed by Paraguayan investors.

106
ANNEX C: Itaipú Debt History Our understanding of the Itaipú debt history is as follows.243 The financial agreement for the Itaipú dam was made on the basis of a US$3.5bn capital investment and operations to begin in 1983 (with the last turbine coming on stream in 1989). The largest loan was signed with Eletrobras in November 1975 worth US$2.5bn (in Brazilian Cruceiros) with a grace period until 1983 and an amortization period between 1985 and 2023.244 The interest rate was set at 10 percent plus administration costs and an inflation adjustment factor. The parties opted to finance the majority of the construction through national loans to ensure local procurement. For example, FINAME’s loan for equipment for Itaipú required a minimum of 85 percent inputs from Brazil. Several smaller international loans were acquired from countries providing specialized equipment that could not be procured locally (Paris Club debt). These loans had shorter grace and maturity periods than the one with Eletrobras. During construction it became evident that new loans were necessary to cover costs. Under-budgeting was attributed to the first oil crisis in 1974, which had inflated costs for construction materials and the necessary machinery. To finance the rising construction costs, additional loans were sought on international markets. These were relatively cheap in the late 70s with interest rates of LIBOR + 2-4 percent. Most had an amortization period of approximately 15 years and were backed by the Brazilian Central Bank. The unfolding Latin American debt crisis and escalating interest rates resulted in Itaipú being unable to repay the international loans. To exacerbate matters, the penalties for the defaulting short-term loans caused a rapid rise in Itaipú’s overall debt burden.245 Due to the lack of new credit lines available to refinance this debt, Itaipú had to slow construction. Ultimately Eletrobras provided additional loans to complete the construction. Those additional loans each had different interest rates, grace periods and maturity dates.246 The debt with Eletrobras was consolidated in September 1990. Two credit lines, one in US Dollars and one in Brazilian currency, were agreed, but these still had interest rates of 10 percent plus the US inflation adjustment factor. The international debt of Itaipú was not being repaid and the Government of Brazil renegotiated this debt in 1993 with the agreement that new ‘Brady Bonds’ would replace the old ones. At this time the Paris Club debt was also refinanced. While the international debt renegotiations resulted in a decrease in Itapú’s net debt, the introduction of the ‘Plano Real’ by the Brazilian Government in July 1994 had the opposite effect. Most of the debt with Eletrobras was held in
243 Based on Itapúa Binacional (2003), Prestación de los Servicios de Electricidad y Bases Financeiras: Compendio and interviews in Paraguay. 244 Itaipú Binacional (2003), Prestación de los Servicios de Electricidad y Bases Financeiras: Compendio 245 By 1990 the debt to tertiary countries made up 45 percent of total debt. 246 By the end of 1992 Itaipú was managing 129 loan agreements with 33 institutions on top of those agreements with Eletrobras.

107
Brazilian currency. Prior to the implementation of the plan, high inflation in Brazil was offset by a depreciation of the Cruceiro. This was no longer the case and the debt with Eletrobras jumped from US$10.8bn on July 1, 1994, to US$15.4bn on December 31, 1994. The net debt continued to rise until September 1997 when Eletrobras and Itaipú signed a deal that would consolidate the outstanding debt, lower the interest rates of the loans, convert the debt into US dollars and adjust the tariffs to a level that guarantees the debt to be paid off by 2023 (when annex C of the original treaty terminates). New loans were agreed with Eletrobras between 1998 and 2007 to conclude the construction of the dam and to install two additional turbines. In 2007 it was agreed to drop the US inflation adjustment factor, which had a significant impact on Itaipú’s debt. Figure 38 shows how Itaipú’s debt accumulated between 1979 and 2011 and marks key events during that time period. Figure 38: Itaipú’s Accumulated Debt
Source: Itaipú Binacional (2003), Central Bank of Paraguay
To summarize the above, the increasing debt of Itaipú can be traced back to the following:
1. Increase in construction costs 2. Delay of approximately 2.4 years in turbines coming on stream, thereby
delaying repayment of the debt 3. High interest rates + adjustment factors on loans 4. Below cost-recovery tariffs for extended periods of time (5,340 GWh of
free ‘transitional energy’ was provided to both countries between 1997 and 2002)
5. The implementation of the Plano Real causing a jump of the debt held in Brazilian currency in 1994
0
5
10
15
20
1979 1981 1983 1985 1987 1989 1991 1993 1995 1997 1999 2001 2003 2005 2007 2009 2011
BillionUS$
Pla
nne
d s
tart
of
op
era
tion
s
Sta
rt o
f op
era
tio
ns
De
bt
crisis
Tariff
s b
elo
w c
ost
of
pro
du
ctio
n
Co
nso
lida
tion
of
Ele
tro
bra
s d
eb
t
& a
dju
stm
en
t o
f ta
riff
s
Op
era
tio
n s
tart
s w
ith
18
un
its
Intr
od
uctio
n o
f P
lan
o R
ea
l
Inte
rna
tio
na
l de
bt
rene
go
tia
tio
ns
De
bt co
nso
lida
tio
n a
nd
re
ne
go
tia
tio
n
with
Ele
tro
bra
s
Ag
reem
ent
with
Ele
tro
bra
s t
o s
top
usin
g t
he
U
S
infla
tio
n a
dju
stm
en
t fa
cto
r fo
r o
uts
tand
ing
deb
t
Lo
an
s t
o in
sert
2 a
dd
itio
na
l tu
rbin
es
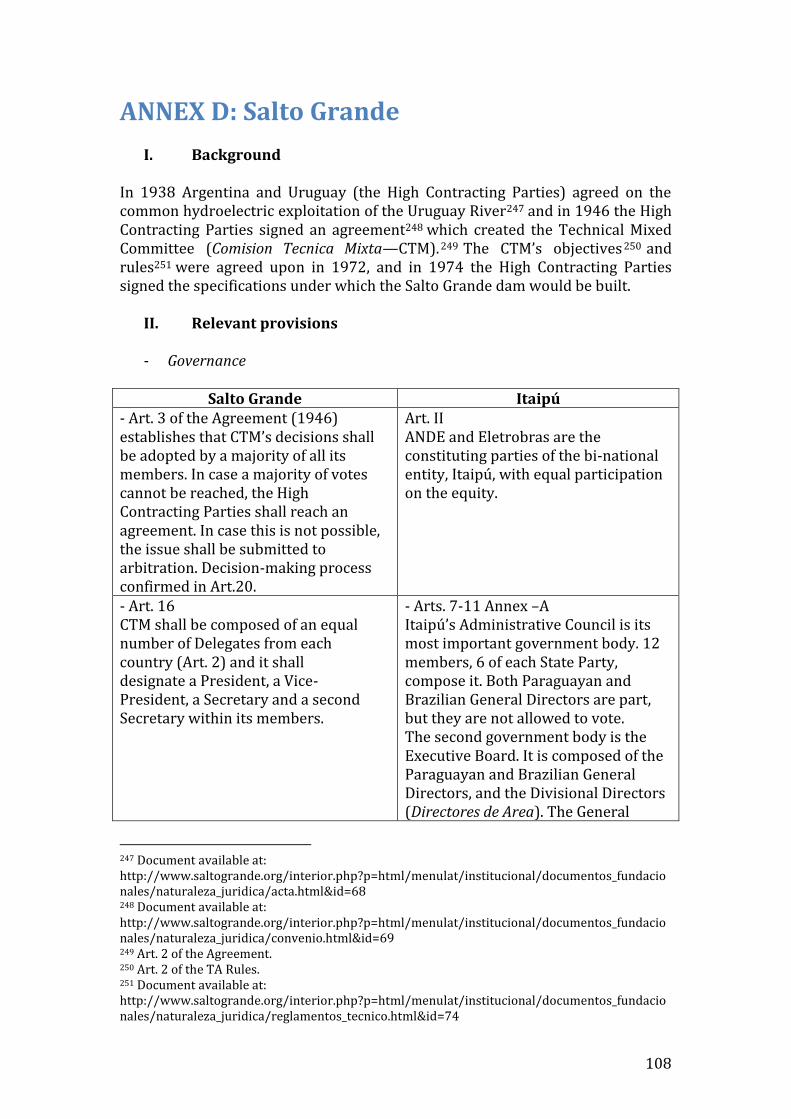
108
ANNEX D: Salto Grande
I. Background In 1938 Argentina and Uruguay (the High Contracting Parties) agreed on the common hydroelectric exploitation of the Uruguay River247 and in 1946 the High Contracting Parties signed an agreement248 which created the Technical Mixed Committee (Comision Tecnica Mixta—CTM).249 The CTM’s objectives 250 and rules251 were agreed upon in 1972, and in 1974 the High Contracting Parties signed the specifications under which the Salto Grande dam would be built.
II. Relevant provisions
- Governance
Salto Grande Itaipú - Art. 3 of the Agreement (1946) establishes that CTM’s decisions shall be adopted by a majority of all its members. In case a majority of votes cannot be reached, the High Contracting Parties shall reach an agreement. In case this is not possible, the issue shall be submitted to arbitration. Decision-making process confirmed in Art.20.
Art. II ANDE and Eletrobras are the constituting parties of the bi-national entity, Itaipú, with equal participation on the equity.
- Art. 16 CTM shall be composed of an equal number of Delegates from each country (Art. 2) and it shall designate a President, a Vice-President, a Secretary and a second Secretary within its members.
- Arts. 7-11 Annex –A Itaipú’s Administrative Council is its most important government body. 12 members, 6 of each State Party, compose it. Both Paraguayan and Brazilian General Directors are part, but they are not allowed to vote. The second government body is the Executive Board. It is composed of the Paraguayan and Brazilian General Directors, and the Divisional Directors (Directores de Area). The General
247 Document available at: http://www.saltogrande.org/interior.php?p=html/menulat/institucional/documentos_fundacionales/naturaleza_juridica/acta.html&id=68 248 Document available at: http://www.saltogrande.org/interior.php?p=html/menulat/institucional/documentos_fundacionales/naturaleza_juridica/convenio.html&id=69 249 Art. 2 of the Agreement. 250 Art. 2 of the TA Rules. 251 Document available at: http://www.saltogrande.org/interior.php?p=html/menulat/institucional/documentos_fundacionales/naturaleza_juridica/reglamentos_tecnico.html&id=74

109
Directors jointly exercise the legal representation.
- Distribution of the electricity production
Salto Grande Itaipú
- Art. 4 of the Agreement (1946) establishes that, should the total installed capacity be allocated in a ratio different than 50 percent for each High Contracting Party, the common costs shall be covered in accordance with such proportion (e.g., if Argentina uses 70 percent of the capacity installed, it has to bear 70 percent of the costs)
- Art. XIII of Itaipú Treaty The energy produced by the dam is divided in equal parts between the High Contracting Parties. This means that each party has the right to 50 percent of the energy produced by Itaipú dam. The article also provides a purchase right, i.e. the prerogative of a High Contracting Party to purchase, for its own consumption, the energy that is not being used by the other.
Art. XV of Itaipú Treaty Additionally, it is provided that Itaipú shall include in its service cost, the amount required for the payment of utilities and the amount required to compensate the High Contracting Party for the assignment of its energy.
- Art. 14 of the Rules of the Agreement (1972) Provides securities for the external leverage. It establishes that Argentina should guarantee 100 percent of the project’s obligations, whereas Uruguay would do so to the extent of 16.66 percent. Uruguay’s ratio would increase in accordance with the proportion of the energy consumed.
- Point III.8. Annex C– Itaipú Treaty (1973 text) The amount required to compensate one of the High Contracting Parties is equal to US$300 per gigawatt-hour assigned to the other High Contracting Party. The compensation shall be done monthly in the currency available to Itaipú.
Related Documents