1. The goal of the measure step is to: A. Define the project’s purpose and scope B. Focus your improvement effort by gathering information about the current situation C. Identify root causes and confirm them with data D. Develop, test and implement solutions that address root causes 2. Process analysis is conducted during the ____phase. A. Define B. Measure C. Analyze D. Improve 3. An ideal process is harmonized with customer _______. A. Profit B. Requirements C. Cost D. None of the above 4. An ideal process is not: A. Harmonized B. Automated C. Lean D. None of the above 5. Define process ______ during process analysis. A. Time B. Boundaries C. Team D. Cost 6. In process analysis, the following symbol is used for: A. Start point B. End point C. Establishing the borders of the process D. All of the above 7. In process analysis, the following symbol is used to show:

Lean Six Sigma Green Belt Measure test exam 131 q+a
Aug 17, 2015
Welcome message from author
This document is posted to help you gain knowledge. Please leave a comment to let me know what you think about it! Share it to your friends and learn new things together.
Transcript
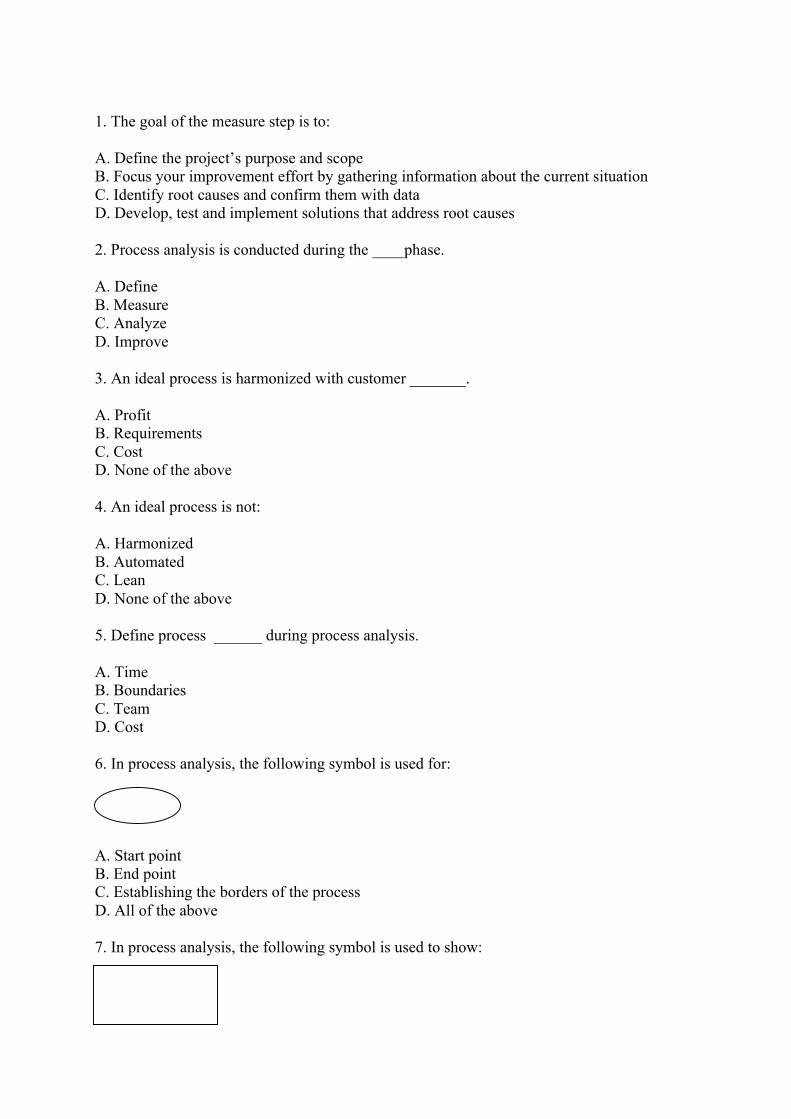
1. The goal of the measure step is to: A. Define the project’s purpose and scope B. Focus your improvement effort by gathering information about the current situation C. Identify root causes and confirm them with data D. Develop, test and implement solutions that address root causes 2. Process analysis is conducted during the ____phase. A. Define B. Measure C. Analyze D. Improve 3. An ideal process is harmonized with customer _______. A. Profit B. Requirements C. Cost D. None of the above 4. An ideal process is not: A. Harmonized B. Automated C. Lean D. None of the above 5. Define process ______ during process analysis. A. Time B. Boundaries C. Team D. Cost 6. In process analysis, the following symbol is used for: A. Start point B. End point C. Establishing the borders of the process D. All of the above 7. In process analysis, the following symbol is used to show:

A. Decision B. Input or output C. Activity D. Connection of processes 8. In process analysis, the following symbol is used to: A. Demonstrates the decision points and shows where infinite loops appear in the process B. Illustrate a process path/flow C. Illustrate the activities in their order of execution D. Establishes the borders of the process 9. In process analysis, the following symbol is used to: A. Connection of processes B. Illustrates a process path/flow C. Establishes the borders of the process D. Boundaries 10. In process analysis, the following symbol is used to: A. Establishes the borders of the process B. Connection of processes C. Electronic input or output D. Illustrate the activities in their order of execution 11. In process analysis, the following symbol is used to: A. Demonstrates the decision points and shows where infinite loops appear in the process B. Connection of processes C. Illustrate the activities in their order of execution D. Connects the process flow with another part of the process or another process 12. A value stream map helps to:
yesyes
2
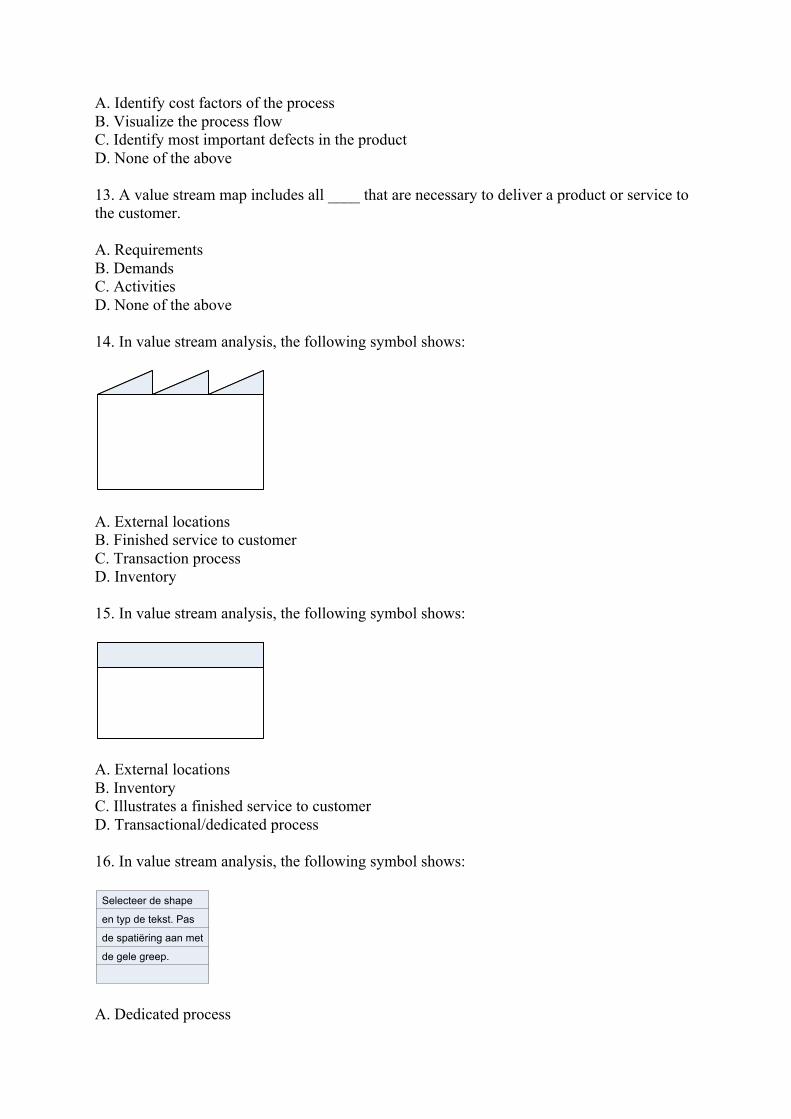
A. Identify cost factors of the process B. Visualize the process flow C. Identify most important defects in the product D. None of the above 13. A value stream map includes all ____ that are necessary to deliver a product or service to the customer. A. Requirements B. Demands C. Activities D. None of the above 14. In value stream analysis, the following symbol shows:
A. External locations B. Finished service to customer C. Transaction process D. Inventory 15. In value stream analysis, the following symbol shows:
A. External locations B. Inventory C. Illustrates a finished service to customer D. Transactional/dedicated process 16. In value stream analysis, the following symbol shows:
Selecteer de shape
en typ de tekst. Pas
de spatiëring aan met
de gele greep.
A. Dedicated process

B. Data box C. Work cell D. Inventory 17. In value stream analysis, the following symbol shows: A. External locations B. Finished service to customer C. Work cell D. Dedicated process 18. In value stream analysis, the following symbol shows:
I
A. Inventory B. Supplier C. Dedicated process D. Internet 19. In value stream analysis, the following symbol shows: A. Push arrow B. Shipments C. Manual info D. Electric info 20. In value stream analysis, the following symbol shows:
Process
A. Invalid process B. Shared process C. Process improvements D. Dedicated process

21. In value stream analysis, the following symbol shows: A. Direction arrow B. Information arrow C. Push arrow D. Time arrow 22. In value stream analysis, the following symbol shows:
A. Inventory shelf B. Production cell C. Data box D. Supermarket 23. In value stream analysis, the following symbol shows: A. Info loop B. Material pull C. Process circle D. Manual info 24. In value stream analysis, the following symbol shows: MAX=XX A. FIFO lane B. LIFO lane C. Production lane D. Moving lane 25. In value stream analysis, the following symbol shows:
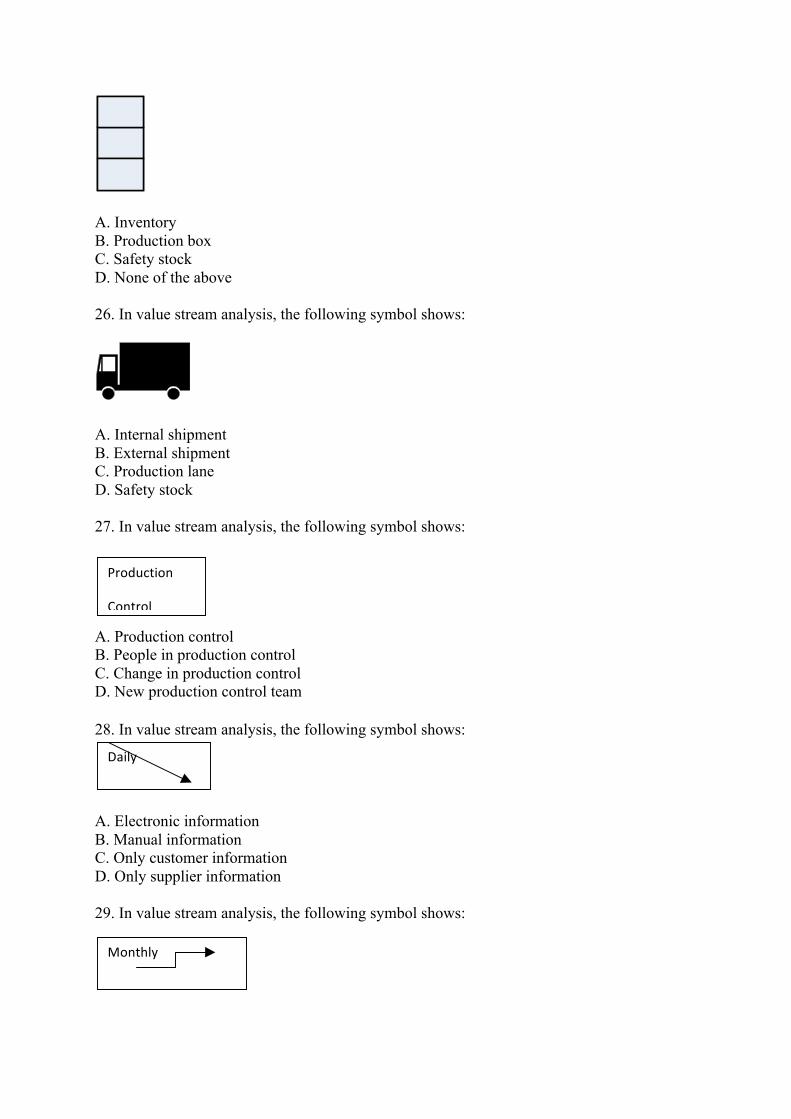
A. Inventory B. Production box C. Safety stock D. None of the above 26. In value stream analysis, the following symbol shows:
A. Internal shipment B. External shipment C. Production lane D. Safety stock 27. In value stream analysis, the following symbol shows: A. Production control B. People in production control C. Change in production control D. New production control team 28. In value stream analysis, the following symbol shows: A. Electronic information B. Manual information C. Only customer information D. Only supplier information 29. In value stream analysis, the following symbol shows:
Production
Control
Daily
Monthly
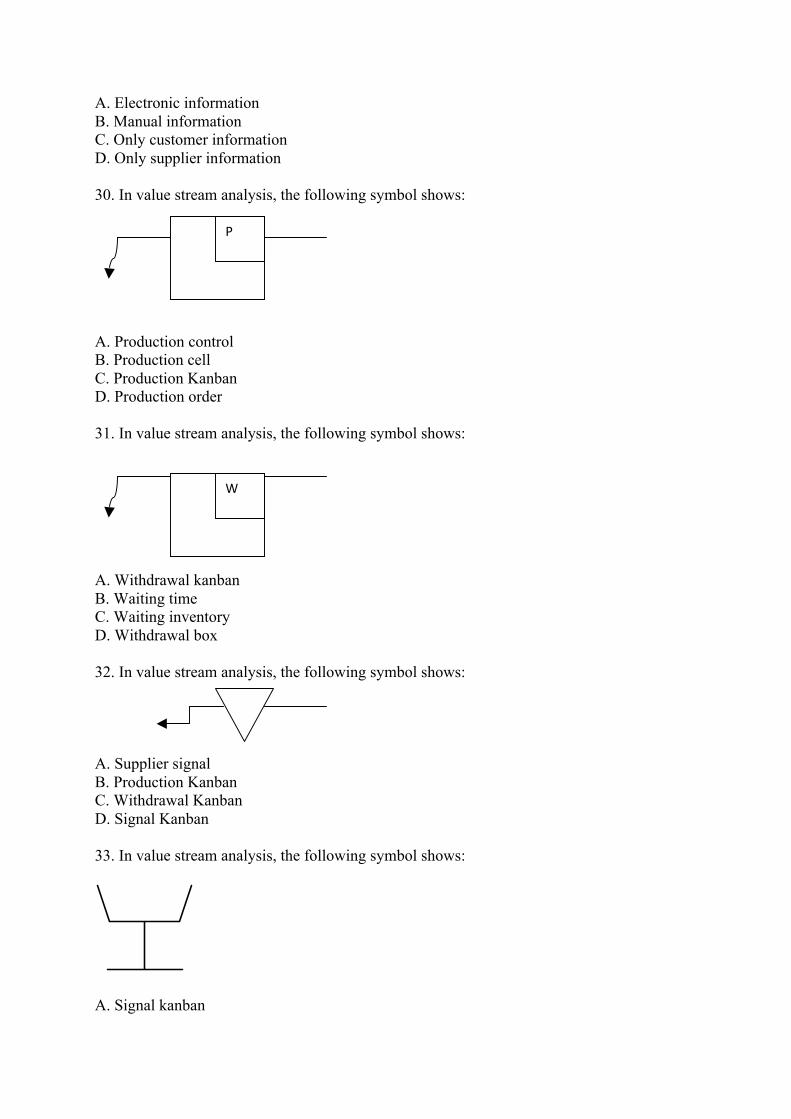
A. Electronic information B. Manual information C. Only customer information D. Only supplier information 30. In value stream analysis, the following symbol shows: A. Production control B. Production cell C. Production Kanban D. Production order 31. In value stream analysis, the following symbol shows: A. Withdrawal kanban B. Waiting time C. Waiting inventory D. Withdrawal box 32. In value stream analysis, the following symbol shows: A. Supplier signal B. Production Kanban C. Withdrawal Kanban D. Signal Kanban 33. In value stream analysis, the following symbol shows:
A. Signal kanban
P
W

B. Production Kanban C. Kanban box D. Withdrawal Kanban 34. In value stream analysis, the following symbol shows:
A. Parallel pull B. Sequenced pull C. Linear pull D. Binary pull 35. In value stream analysis, the following symbol shows: OXOX
A. Load leveling B. Sequenced pull C. Kanban box D. Signal Kanban 36. In value stream analysis, the following symbol shows: A. ITP B. MRP/ERP C. Production cell D. HTTP 37. In value stream analysis, the following symbol shows: A. Go see B. Search C. Operator D. Electronic inspection 38. In value stream analysis, the following symbol shows:
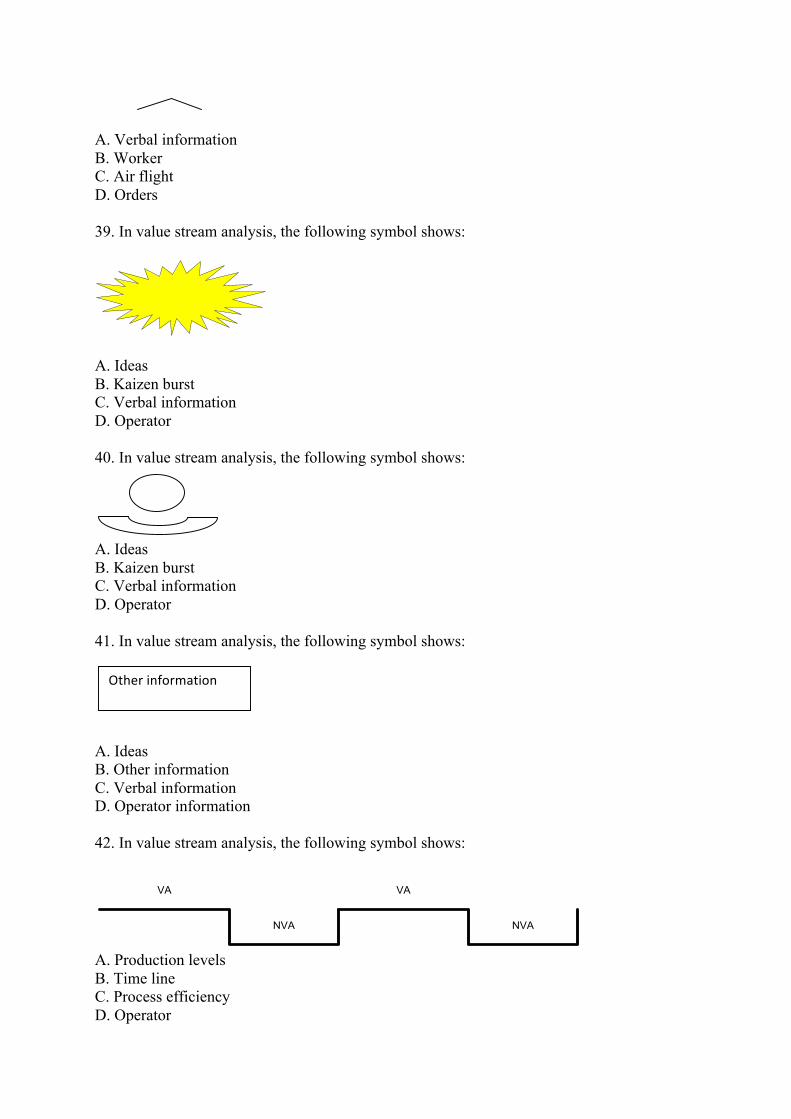
A. Verbal information B. Worker C. Air flight D. Orders 39. In value stream analysis, the following symbol shows:
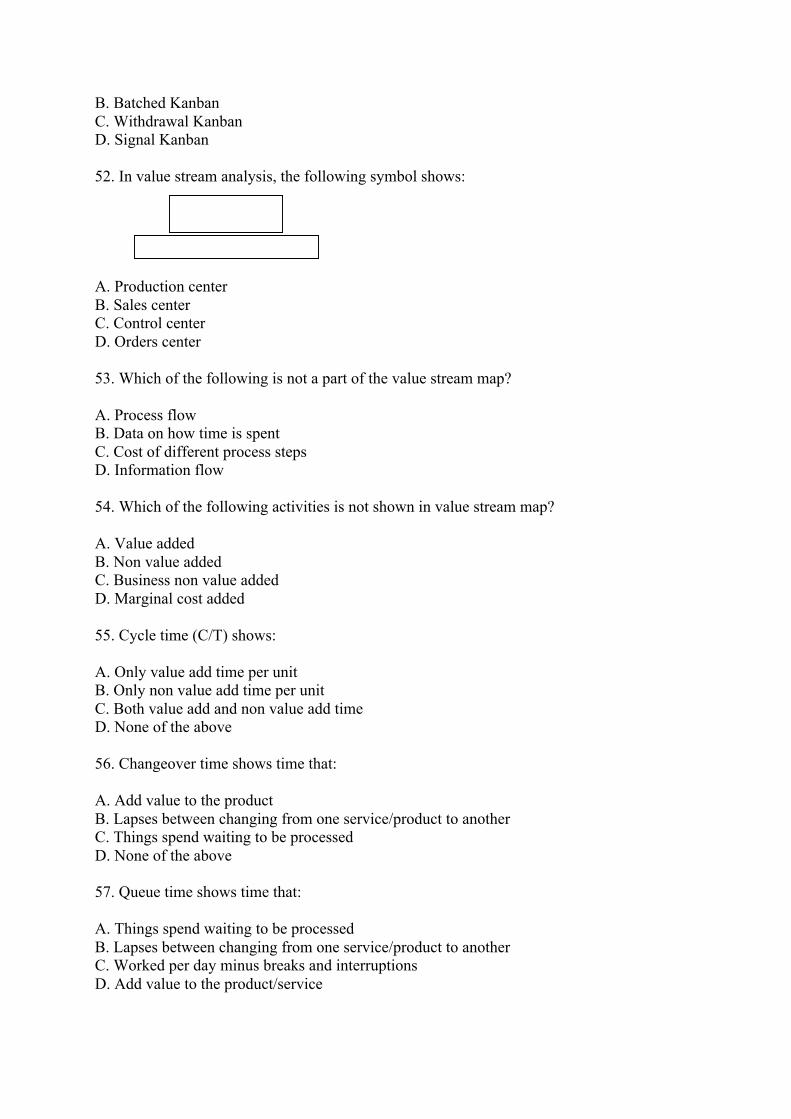
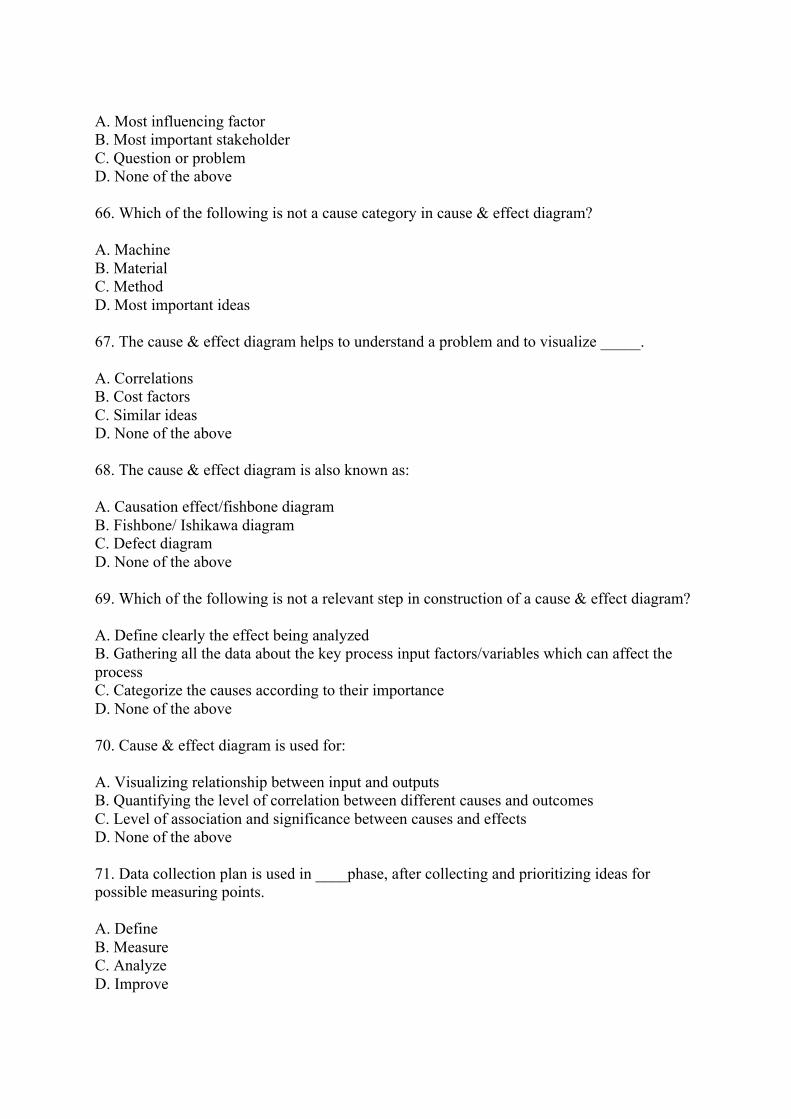
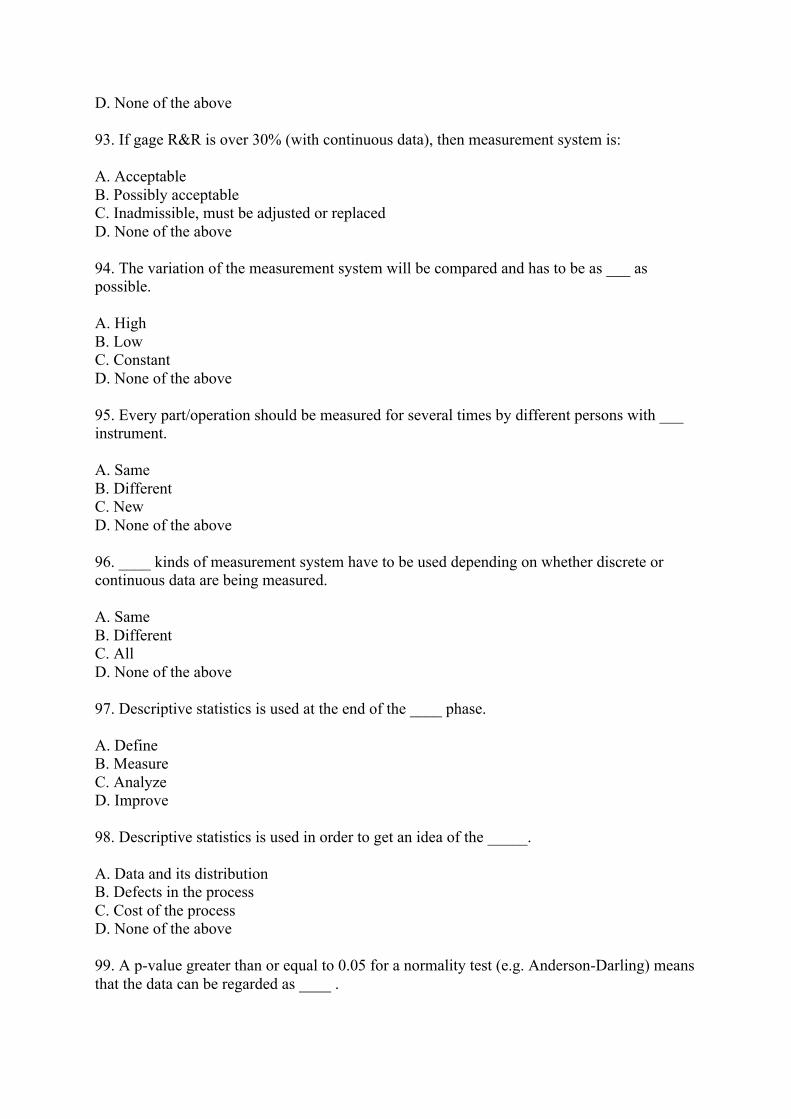
A. Ideas B. Kaizen burst C. Verbal information D. Operator 40. In value stream analysis, the following symbol shows: A. Ideas B. Kaizen burst C. Verbal information D. Operator 41. In value stream analysis, the following symbol shows: A. Ideas B. Other information C. Verbal information D. Operator information 42. In value stream analysis, the following symbol shows:
NVA
VA
NVA
VA
A. Production levels B. Time line C. Process efficiency D. Operator
Other information

43. In value stream analysis, the following symbol shows: A. Rail shipments B. Road shipments C. Air shipments D. Delivery 44. In value stream analysis, the following symbol shows:
A. Rail shipments B. Road shipments C. Air shipments D. Delivery 45. In value stream analysis, the following symbol shows: A. Expedited B. Inventory C. Production arrow D. None of the above 46. In value stream analysis, the following symbol shows: A. Expedited B. Inventory C. Production arrow D. None of the above 47. In value stream analysis, the following symbol shows:

A. Warehouse B. Production cell C. Cross-dock D. Supplier 48. In value stream analysis, the following symbol shows: A. Warehouse B. Production cell C. Cross-dock D. Supplier 49. In value stream analysis, the following symbol shows: A. Only sales orders B. Only purchase orders C. Both sales and purchase orders D. None of the above 50. In value stream analysis, the following symbol shows: A. Telephone communication B. Order line C. Employee communication medium D. None of the above 51. In value stream analysis, the following symbol shows:
A. Production Kanban
IN
B. Batched Kanban C. Withdrawal Kanban D. Signal Kanban 52. In value stream analysis, the following symbol shows: A. Production center B. Sales center C. Control center D. Orders center 53. Which of the following is not a part of the value stream map? A. Process flow B. Data on how time is spent C. Cost of different process steps D. Information flow 54. Which of the following activities is not shown in value stream map? A. Value added B. Non value added C. Business non value added D. Marginal cost added 55. Cycle time (C/T) shows: A. Only value add time per unit B. Only non value add time per unit C. Both value add and non value add time D. None of the above 56. Changeover time shows time that: A. Add value to the product B. Lapses between changing from one service/product to another C. Things spend waiting to be processed D. None of the above 57. Queue time shows time that: A. Things spend waiting to be processed B. Lapses between changing from one service/product to another C. Worked per day minus breaks and interruptions D. Add value to the product/service

58. Takt time shows: A. Value added time B. The demand rate of customers for each type of service or product C. Time that lapses between changing from one service/product to another D. Marginal production rate 59. Complexity of an activity shows: A. Number of similar products/services processed at that activity B. Number of different products/services processed at that activity C. Number of workers in that activity D. Number of tasks finished in that activity 60. Uptime means: A. Time worked per day minus breaks and interruptions B. Business value added minus non value added C. Total non value added D. None of the above 61. Lead time is equal to: A. Amount of work in process divided by average completion rate B. Amount of work in process divided by average waiting time C. Amount of work in process divided by defect rate D. Amount of work in process divided by average shipment time 62. Process cycle efficiency (PCE) is equal to: A. 100*value add time/process lead time B. 10* value add time/process lead time C. 100* process lead time/ value add time D. 10* process lead time/ value add time 63. Cause & effect diagram is used in: A. Measure B. Analyze C. Improve D. All of the above 64. Cause & effect diagram is used to identify: A. Cost factors B. Influencing factors C. Influencing stakeholders D. None of the above 65. The head or front of the cause & effect diagram shows the:
A. Most influencing factor B. Most important stakeholder C. Question or problem D. None of the above 66. Which of the following is not a cause category in cause & effect diagram? A. Machine B. Material C. Method D. Most important ideas 67. The cause & effect diagram helps to understand a problem and to visualize _____. A. Correlations B. Cost factors C. Similar ideas D. None of the above 68. The cause & effect diagram is also known as: A. Causation effect/fishbone diagram B. Fishbone/ Ishikawa diagram C. Defect diagram D. None of the above 69. Which of the following is not a relevant step in construction of a cause & effect diagram? A. Define clearly the effect being analyzed B. Gathering all the data about the key process input factors/variables which can affect the process C. Categorize the causes according to their importance D. None of the above 70. Cause & effect diagram is used for: A. Visualizing relationship between input and outputs B. Quantifying the level of correlation between different causes and outcomes C. Level of association and significance between causes and effects D. None of the above 71. Data collection plan is used in ____phase, after collecting and prioritizing ideas for possible measuring points. A. Define B. Measure C. Analyze D. Improve

72. Every ___ should be included in the data collection plan as an output measurement. A. Independent B. Dependent C. CTQ D. Idea 73. The data collection plan has to be aligned with the _____. A. Project charter B. Pareto analysis C. Cause & effect diagram D. None of the above 74. Before data collection, clearly define the _____of the data collection. A. Goals and objectives B. Input and output variables C. Cost D. None of the above 75. Which of the following is not part of the data collection plan? A. Clearly define goals and objectives of the data collection B. Ensure data collection repeatability C. Ensure data collection accuracy D. Identify most time consuming variables 76. Which of the following is not important to consider in data collection plan? A. Amount of observations needed B. Different states of the variables C. Time interval of data collection D. Association of variables 77. Operational definitions comprise the following except: A. Decision on number of observations needed B. Time interval of observations C. Methodologies that will be employed to record the data D. Identifying the causes of specific effect 78. Data will be considered repeatable if: A. The same person is able to reach the same outcome multiple times on a specific item B. Multiple users who use same measuring equipment C. Data has repeating values D. None of the above 79. Data will be considered reproducible if:

A. The same person is able to reach essentially the same outcome multiple times B. Multiple users who use same measuring equipment and get same results C. Data can be used to reproduce different results D. None of the above 80. Data will be considered accurate if: A. The same person is able to reach essentially the same outcome multiple times B. Multiple users who use same measuring equipment and get same results C. Both A & B D. None of the above 81. In continuous data, the ______ gives direct feedback to the employee about the variation of the current process. A. Frequency plot B. Bar chart C. Pie chart D. Radar graph 82. Data collection forms are used in ___ phase to manually record measurements for defined measuring points. A. Define B. Measure C. Improve D. Both B & C 83. A data collection form should always be _____. A. Adjusted B. Piloted C. Justified D. None of the above 84. The data collected can only be as good as the ____ that records it. A. Instrument B. System C. Record keeper D. None of the above 85. In continuous data, the scale on the x-axis should contain ____ increments. A. Homogeneous B. Partial C. Double D. One third

86. In check sheet with discrete data, a simple recording of checkmarks represents the ____ of an error. A. Intensity B. Effect C. Probability D. Frequency 87. A time stamp ____ when an error occurs. A. Records B. Points out C. Shows D. Removes 88. The goal of the measurement system analysis is to learn as much as possible about the ____ . A. Errors B. Project plan C. Measurement process D. Project implementation 89. Which of the following is not a part of the measurement system analysis? A. Measuring equipment B. user C. Parts D. Cost of measurement 90. Measurement system analysis should be used in the measure phase after having created the ___ and before ____ . A. Project plan, kick-off meeting B. Data collection plan, the actual measurement C. Process analysis, the actual measurement D. None of the above 91. If gage R&R is under 10% (with continuous data), then measurement system is: A. Acceptable B. Possibly acceptable C. Unacceptable, must be adjusted or replaced D. None of the above 92. If gage R&R is 10% to 30% (with continuous data), then measurement system is: A. Acceptable B. Possibly C. Unacceptable, must be adjusted or replaced
D. None of the above 93. If gage R&R is over 30% (with continuous data), then measurement system is: A. Acceptable B. Possibly acceptable C. Inadmissible, must be adjusted or replaced D. None of the above 94. The variation of the measurement system will be compared and has to be as ___ as possible. A. High B. Low C. Constant D. None of the above 95. Every part/operation should be measured for several times by different persons with ___ instrument. A. Same B. Different C. New D. None of the above 96. ____ kinds of measurement system have to be used depending on whether discrete or continuous data are being measured. A. Same B. Different C. All D. None of the above 97. Descriptive statistics is used at the end of the ____ phase. A. Define B. Measure C. Analyze D. Improve 98. Descriptive statistics is used in order to get an idea of the _____. A. Data and its distribution B. Defects in the process C. Cost of the process D. None of the above 99. A p-value greater than or equal to 0.05 for a normality test (e.g. Anderson-Darling) means that the data can be regarded as ____ .
A. Defective B. Normally distributed C. Correct D. None of the above 100. Which of the following is not relevant in histogram descriptive statistics analysis? A. Is the data normally distributed? B. What does the distribution look like (skewed, bimodal distribution, …..)? C. Number of defects D. None of the above 101. Control charts are used to monitor, control and improve process performance by studying ___ and its ____ . A. Cost, sources B. Errors, impacts C. Variation, sources D. Variation, impacts 102. Control charts distinguish ____ from ____ causes of variation. A. Special, all B. Special, common C. New causes, old D. None of the above 103. Control chart is used for following purposes, except: A. Detecting and monitoring process variation over time B. Distinguishes special from common causes of variation C. Serves as a tool of ongoing control of a process D. Identifying cost of variation 104. Type of control chart is selected based on _____ . A. Time available B. Type of data C. Type of product D. Type of process 105. In control charts, defect means: A. Failure to meet one of the acceptance criteria B. Failure to meet at least more than one criteria C. Failure to meet not a single acceptance criteria D. None of the above 106. Defective means an entire unit fails to meet acceptance criteria regardless of the number of ___ on the unit.
A. Defects B. Cost C. Attributes D. None of the above 107. In control charts, frequency of sampling depends on whether it is possible to discern ___ in the data. A. Patterns B. Defects C. Control D. None of the above 108. Control charts helps to: A. Detect assignable causes of variation B. Calculate number of products produced in one cycle C. Detect new variables which can affect the process D. None of the above 109. Which of the following are advantages of using control charts for individual data: A. There is more data to collect B. Is costs less than larger subgroup sizes C. Both A & B D. None of the above 110. When you are interpreting X-bar and R control charts, you should apply the following rules except: A. Whenever a single point falls outside the 3 sigma control limits, a lack of control is indicated. B. Whenever at least 2 out of 3 successive values fall on the same side C. Whenever at least 8 successive values fall on the same side of the centerline D. Whenever at least 3 out of 4 successive values fall on the same side of the center line, a lack of control is in … 111. When you are interpreting X-bar and R control charts, you should apply the following rules except: A. Whenever a single point falls outside the 3 sigma control limits, a lack of control is indicated. B. Whenever at least 1 out of 2 successive values fall on the same side of the centerline and more than 2 sigma… C. Whenever at least 8 successive values fall on the same side of the centerline D. Whenever at least 4 out of 5 successive values fall on the same side of the center line 112. Which of the following is not an appropriate situation to change the control limits?

A. When removing out-of-control data points B. When replacing trial limits C. When there are changes in the process D. Whenever at least 4 out of 5 successive values fall on the same side of the centerline and more than one si.. 113. Which of the following best describes variation in a process? A. A cluster of outcomes located at one central point B. How tightly all the various outcomes are clustered around the average C. The accumulated point cluster in a variation D. Points located outside the mean 114. DPMO stands for: A. Defects per measurement opportunity B. Defects per million opportunities C. Detection rate per million opportunities D. None of the above 115. Process capability is measured in: A. Define & measure B. Measure & analyze C. Measure & improve D. Improve & control 116. Process capability is used for following purposes except: A. To determine the performance of the current process B. To determine the performance of the improved process after the optimizations C. To measure the cost of process capability improvement D. None of the above 117. Which of these defects per million opportunities levels approximates to four sigma quality? A. 408,975 B. 6, 210 C. 4 D. 4,000 118. Firm XYZ produces canned fish, and operates at a yield of 93,319%. Therefore XYZ is operating at a level of: A. 2 sigma B. 3 sigma C. 4 sigma D. 6 sigma

119. Firm ABC operates at a yield of 69,15%. Therefore ABC is operating at level of: A. 1 sigma B. 2 sigma C. 3 sigma D. 4 sigma 120. If a firm operates at a yield of 99,379%, then this firm is operating at level of: A. 1 sigma B. 2 sigma C. 3 sigma D. 4 sigma 121. FMEA is an abbreviation for: A. Failure mode and effects analysis B. Failure mode and entity analysis C. Future mode and effects analysis D. Future mode and entity analysis 122. The process FMEA deals with potential ____ in a process. A. Opportunities B. Weaknesses C. Causes D. None of the above 123. The ____ the risk priority number the more important is is to take preventive measures for risk reduction. A. Lower B. Higher C. Close to the mean D. None of the above 124. FMEA can be used in _____ . A. Define phase B. Measure phase C. Analyze phase D. All phases 125. A failure mode is the way a component, subassembly, product, input or process ___ ______ during the execution of the intended function. A. Might work B. Might fail C. May cause problem D. None of the above

126. Failure modes can be the result from ____ operations or they may cause the failure of a ____ operation. A. Top, bottom B. Upstream, lower level C. Upstream, downstream D. None of the above 127. RPN is the product of ______ , _____ and ____ . A. Seriousness, future state, detections B. Severity, frequency, defects C. Severity, frequency, detection D. Segments, fragments, defects 128. In risk priority number formula, severity means how _______ will the impact of this failure mode be? A. Successful B. Significant C. Sync D. None of the above 129. In risk priority number formula, occurrence means how often is this ____ likely to occur? A. Failure mode B. Opportunity C. Variable D. None of the above 130. In risk priority number formula, detection means how well can you ___ this failure mode before it causes the system to fail? A. Remove B. Identify C. Work on D. None of the above 131. Which of the following are not checkpoints of the measure tollgate? A. The most important measurements have been agreed B. The content, type and form of data collection have been determined with the group C. The team has identified and prioritized potential error causes D. The description of the problem has been checked and substantiated based on collected findings

1 B 2 C 3 B 4 D 5 B 6 D 7 C 8 A 9 B 10 C 11 D 12 B 13 C 14 A 15 D 16 B 17 C 18 A 19 B 20 D 21 C 22 D 23 B 24 A 25 C 26 B 27 A 28 B 29 A 30 C 31 A 32 D 33 C 34 B 35 A 36 B 37 A 38 A 39 B 40 D 41 B 42 B 43 A 44 B 45 A 46 D 47 A 48 C 49 C 50 A
51 B 52 C 53 C 54 D 55 C 56 B 57 A 58 B 59 B 60 A 61 A 62 A 63 D 64 B 65 C 66 D 67 A 68 B 69 D 70 A 71 B 72 C 73 A 74 A 75 D 76 D 77 D 78 A 79 B 80 D 81 A 82 D 83 C 84 B 85 A 86 D 87 A 88 C 89 D 90 B 91 A 92 B 93 C 94 B 95 A 96 B 97 B 98 A 99 B 100 C

101 C 102 B 103 D 104 B 105 A 106 A 107 A 108 A 109 B 110 D 111 B 112 D 113 B 114 B 115 C 116 C 117 B 118 B 119 B 120 D 121 A 122 B 123 B 124 D 125 B 126 C 127 C 128 B 129 A 130 B 131 D
Related Documents