Lake Sidney Lanier Economic Impact Analysis December, 2010 Prepared for the 1071 Coalition Prepared by Bleakly Advisory Group, Inc. Bruce A. Seaman, Ph.D. PBS&J, Inc.

Welcome message from author
This document is posted to help you gain knowledge. Please leave a comment to let me know what you think about it! Share it to your friends and learn new things together.
Transcript
Lake Sidney Lanier Economic Impact Analysis
December, 2010 Prepared for the 1071 Coalition
Prepared by
Bleakly Advisory Group, Inc. Bruce A. Seaman, Ph.D. PBS&J, Inc.

MISSION STATEMENT
1071 Coalition is a non-profit organization
comprised of citizens, civic groups, businesses
and other entities dedicated to maintaining
water levels in Lake Sidney Lanier that sustain
water supply, recreation, and economic
prosperity through the advocacy of
appropriate, science- based water releases
necessary for the ACF river basin.
The research reported here was funded in
part by a grant from the Appalachian Regional
Commission.
Final Report LAKE SIDNEY LANIER ECONOMIC IMPACT ANALYSIS
Table of Contents i
Table of Contents Table of Contents .................................................................................................................................... i
Executive Summary ................................................................................................................................ 1
I. Introduction ...................................................................................................................................... 15
A. Study Purpose and Objectives ..................................................................................................... 15
B. Economic Effects of Lake Management Policies .......................................................................... 16
1. Overview .................................................................................................................................. 16
2. Economic Impact Analysis ........................................................................................................ 17
3. Regional versus National Economic Effects ............................................................................ 18
C. Study Scope and Methodology .................................................................................................... 19
D. Organization of the Report .......................................................................................................... 20
II. Background and Trends ................................................................................................................... 22
A. Study Area Context ...................................................................................................................... 22
B. Overview of ACF Basin Management .......................................................................................... 24
C. Historical Lake Lanier Water Levels ............................................................................................. 26
Summary ...................................................................................................................................... 27
D. Visitor Trends ............................................................................................................................... 28
Summary ...................................................................................................................................... 32
E. Marina Sales ................................................................................................................................. 33
F. Boat Sales and Ownership ............................................................................................................ 34
1. Personal Property Value .......................................................................................................... 34
2. Boat Registrations .................................................................................................................... 36
G. Real Estate Values ....................................................................................................................... 40
1. Introduction ............................................................................................................................. 40
2. Calculation of Lakefront Real Estate Value Premiums ............................................................. 41
3. Short-Term Impacts of Low Water Levels on Lakefront Property Sales .................................. 45
H. Marina Slips and Private Docks ................................................................................................... 46
I. Summary Conclusions ................................................................................................................... 48
III. Impacts of Lake Levels on Recreational Spending .......................................................................... 50
A. Introduction ................................................................................................................................. 50
B. Survey Findings ............................................................................................................................ 50
Final Report LAKE SIDNEY LANIER ECONOMIC IMPACT ANALYSIS
Table of Contents ii
1. Resident and Visitors Survey .................................................................................................... 51
2. Business Survey ........................................................................................................................ 53
3. Summary of Survey Conclusions .............................................................................................. 56
C. Estimation of Direct Economic Impacts ........................................................................................... 56
1. Visitor Spending ....................................................................................................................... 57
2. Marina Slip Renters and Private Dock Owners ........................................................................ 59
3. Estimated Impacts attributable to Lake Levels versus Other Factors ..................................... 60
4. New and Used Boat Sales......................................................................................................... 61
5. Real Estate Impacts .................................................................................................................. 62
6. Summary Conclusions: Direct Impacts ..................................................................................... 65
IV. Economic Impacts ........................................................................................................................... 67
A. Overview ...................................................................................................................................... 67
B. Impact Analysis Findings .............................................................................................................. 69
C. Summary Conclusions: Economic Impacts .................................................................................. 77
V. Water Supply and Other Issues ....................................................................................................... 80
A. Comparative Downstream Populations and Employment ......................................................... 81
1. Overview .................................................................................................................................. 81
2. Population and Employment ................................................................................................... 83
3. Selected Industries ................................................................................................................... 87
4. Summary .................................................................................................................................. 97
B. Municipal and Industrial Water Supply ...................................................................................... 98
1. CDM Study Summary and Conclusions .................................................................................... 98
2. Georgia Water Task Force Study Summary ............................................................................. 99
3. Summary Conclusions ............................................................................................................ 100
VI: Appendix ....................................................................................................................................... A-1
Final Report LAKE SIDNEY LANIER ECONOMIC IMPACT ANALYSIS
Executive Summary 1
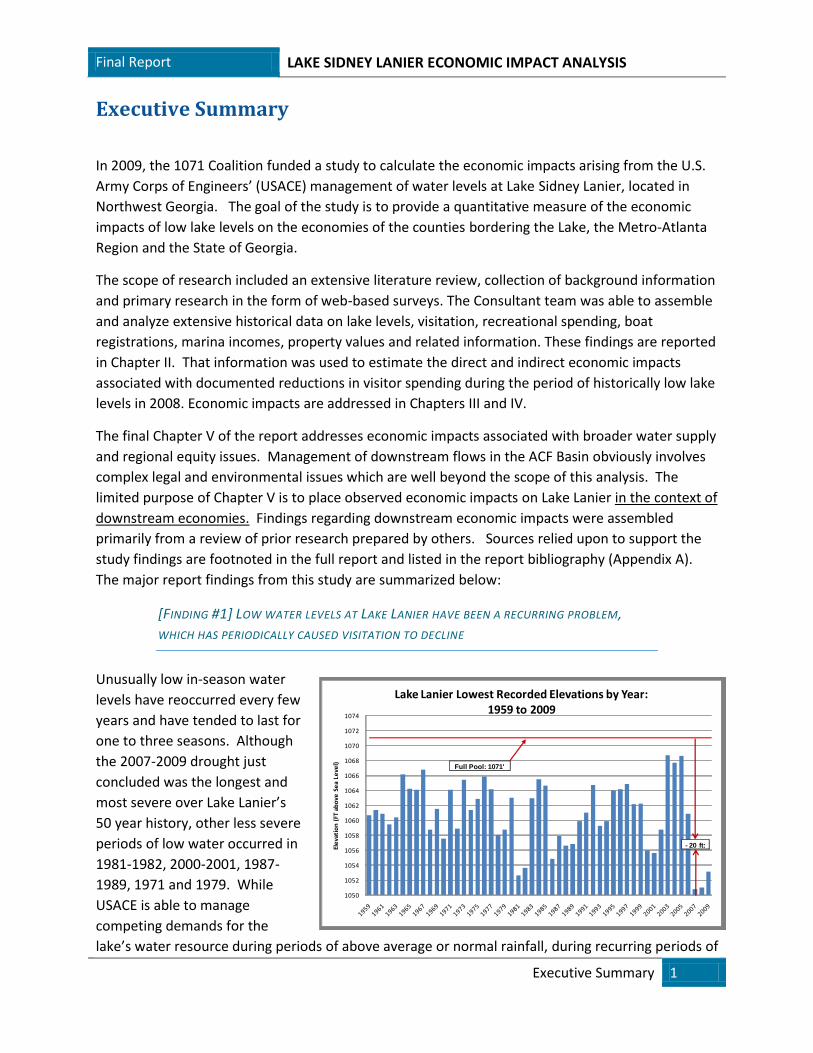
1050
1052
1054
1056
1058
1060
1062
1064
1066
1068
1070
1072
1074
Ele
vati
on
(FT
ab
ove
Se
a Le
vel)
Lake Lanier Lowest Recorded Elevations by Year:1959 to 2009
Full Pool: 1071'
- 20 ft:
Executive Summary
In 2009, the 1071 Coalition funded a study to calculate the economic impacts arising from the U.S.
Army Corps of Engineers’ (USACE) management of water levels at Lake Sidney Lanier, located in
Northwest Georgia. The goal of the study is to provide a quantitative measure of the economic
impacts of low lake levels on the economies of the counties bordering the Lake, the Metro-Atlanta
Region and the State of Georgia.
The scope of research included an extensive literature review, collection of background information
and primary research in the form of web-based surveys. The Consultant team was able to assemble
and analyze extensive historical data on lake levels, visitation, recreational spending, boat
registrations, marina incomes, property values and related information. These findings are reported
in Chapter II. That information was used to estimate the direct and indirect economic impacts
associated with documented reductions in visitor spending during the period of historically low lake
levels in 2008. Economic impacts are addressed in Chapters III and IV.
The final Chapter V of the report addresses economic impacts associated with broader water supply
and regional equity issues. Management of downstream flows in the ACF Basin obviously involves
complex legal and environmental issues which are well beyond the scope of this analysis. The
limited purpose of Chapter V is to place observed economic impacts on Lake Lanier in the context of
downstream economies. Findings regarding downstream economic impacts were assembled
primarily from a review of prior research prepared by others. Sources relied upon to support the
study findings are footnoted in the full report and listed in the report bibliography (Appendix A).
The major report findings from this study are summarized below:
[FINDING #1] LOW WATER LEVELS AT LAKE LANIER HAVE BEEN A RECURRING PROBLEM,
WHICH HAS PERIODICALLY CAUSED VISITATION TO DECLINE
Unusually low in-season water
levels have reoccurred every few
years and have tended to last for
one to three seasons. Although
the 2007-2009 drought just
concluded was the longest and
most severe over Lake Lanier’s
50 year history, other less severe
periods of low water occurred in
1981-1982, 2000-2001, 1987-
1989, 1971 and 1979. While
USACE is able to manage
competing demands for the
lake’s water resource during periods of above average or normal rainfall, during recurring periods of
Final Report LAKE SIDNEY LANIER ECONOMIC IMPACT ANALYSIS
Executive Summary 2
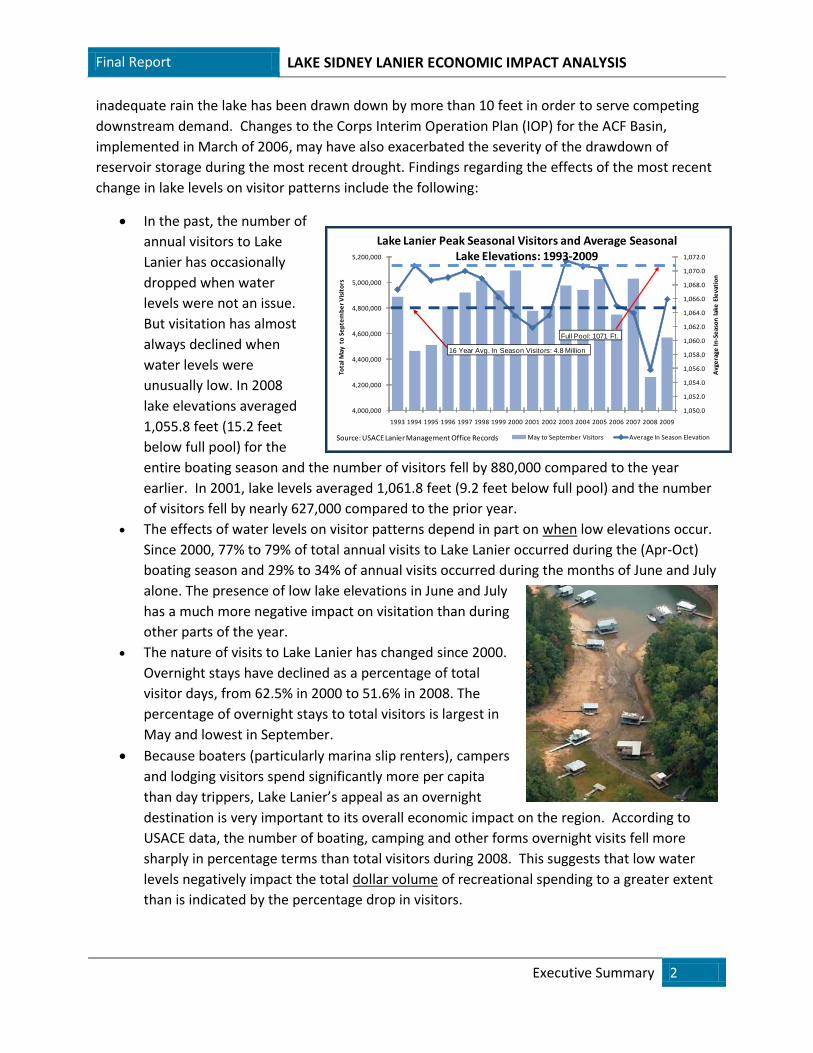
1,050.0
1,052.0
1,054.0
1,056.0
1,058.0
1,060.0
1,062.0
1,064.0
1,066.0
1,068.0
1,070.0
1,072.0
4,000,000
4,200,000
4,400,000
4,600,000
4,800,000
5,000,000
5,200,000
1993 1994 1995 1996 1997 1998 1999 2000 2001 2002 2003 2004 2005 2006 2007 2008 2009
Avg
era
ge I
n-S
eas
on
lak
e E
leva
tio
n
Tota
l May
to
Se
pte
mb
er
Vis
ito
rs
Lake Lanier Peak Seasonal Visitors and Average Seasonal Lake Elevations: 1993-2009
May to September Visitors Average In Season ElevationSource: USACE Lanier Management Office Records
16 Year Avg. In Season Visitors: 4.8 Million
Full Pool: 1071 Ft.
inadequate rain the lake has been drawn down by more than 10 feet in order to serve competing
downstream demand. Changes to the Corps Interim Operation Plan (IOP) for the ACF Basin,
implemented in March of 2006, may have also exacerbated the severity of the drawdown of
reservoir storage during the most recent drought. Findings regarding the effects of the most recent
change in lake levels on visitor patterns include the following:
In the past, the number of
annual visitors to Lake
Lanier has occasionally
dropped when water
levels were not an issue.
But visitation has almost
always declined when
water levels were
unusually low. In 2008
lake elevations averaged
1,055.8 feet (15.2 feet
below full pool) for the
entire boating season and the number of visitors fell by 880,000 compared to the year
earlier. In 2001, lake levels averaged 1,061.8 feet (9.2 feet below full pool) and the number
of visitors fell by nearly 627,000 compared to the prior year.
The effects of water levels on visitor patterns depend in part on when low elevations occur.
Since 2000, 77% to 79% of total annual visits to Lake Lanier occurred during the (Apr-Oct)
boating season and 29% to 34% of annual visits occurred during the months of June and July
alone. The presence of low lake elevations in June and July
has a much more negative impact on visitation than during
other parts of the year.
The nature of visits to Lake Lanier has changed since 2000.
Overnight stays have declined as a percentage of total
visitor days, from 62.5% in 2000 to 51.6% in 2008. The
percentage of overnight stays to total visitors is largest in
May and lowest in September.
Because boaters (particularly marina slip renters), campers
and lodging visitors spend significantly more per capita
than day trippers, Lake Lanier’s appeal as an overnight
destination is very important to its overall economic impact on the region. According to
USACE data, the number of boating, camping and other forms overnight visits fell more
sharply in percentage terms than total visitors during 2008. This suggests that low water
levels negatively impact the total dollar volume of recreational spending to a greater extent
than is indicated by the percentage drop in visitors.
Final Report LAKE SIDNEY LANIER ECONOMIC IMPACT ANALYSIS
Executive Summary 3
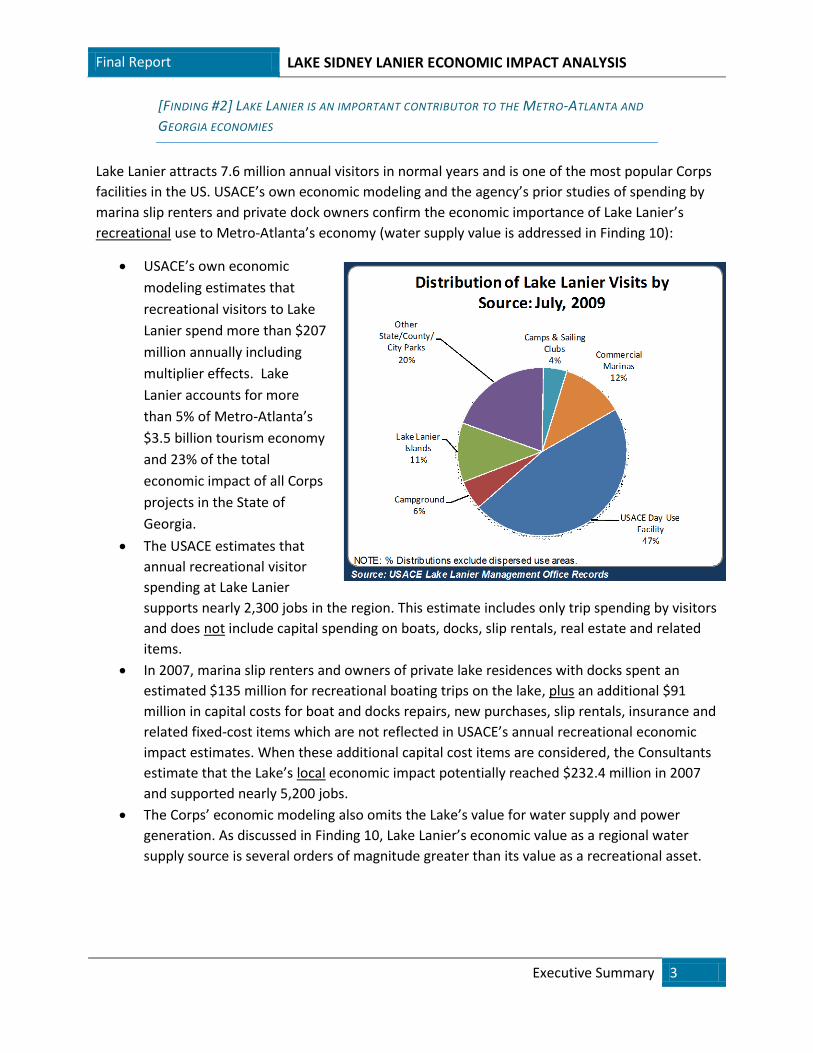
[FINDING #2] LAKE LANIER IS AN IMPORTANT CONTRIBUTOR TO THE METRO-ATLANTA AND
GEORGIA ECONOMIES
Lake Lanier attracts 7.6 million annual visitors in normal years and is one of the most popular Corps
facilities in the US. USACE’s own economic modeling and the agency’s prior studies of spending by
marina slip renters and private dock owners confirm the economic importance of Lake Lanier’s
recreational use to Metro-Atlanta’s economy (water supply value is addressed in Finding 10):
USACE’s own economic
modeling estimates that
recreational visitors to Lake
Lanier spend more than $207
million annually including
multiplier effects. Lake
Lanier accounts for more
than 5% of Metro-Atlanta’s
$3.5 billion tourism economy
and 23% of the total
economic impact of all Corps
projects in the State of
Georgia.
The USACE estimates that
annual recreational visitor
spending at Lake Lanier
supports nearly 2,300 jobs in the region. This estimate includes only trip spending by visitors
and does not include capital spending on boats, docks, slip rentals, real estate and related
items.
In 2007, marina slip renters and owners of private lake residences with docks spent an
estimated $135 million for recreational boating trips on the lake, plus an additional $91
million in capital costs for boat and docks repairs, new purchases, slip rentals, insurance and
related fixed-cost items which are not reflected in USACE’s annual recreational economic
impact estimates. When these additional capital cost items are considered, the Consultants
estimate that the Lake’s local economic impact potentially reached $232.4 million in 2007
and supported nearly 5,200 jobs.
The Corps’ economic modeling also omits the Lake’s value for water supply and power
generation. As discussed in Finding 10, Lake Lanier’s economic value as a regional water
supply source is several orders of magnitude greater than its value as a recreational asset.
Final Report LAKE SIDNEY LANIER ECONOMIC IMPACT ANALYSIS
Executive Summary 4
[FINDING 3] LAKE LANIER IS AN IMPORTANT AMENITY FOR THE SURROUNDING LOCAL
POPULATION
Lake Lanier has been a major contributing factor in supporting the growth and development of
surrounding counties as well as the Metro-Atlanta region, as evidenced by the following findings:
The five counties which surround Lake Lanier contain an estimated population of nearly
1.29 million. That population has grown by more than 40% since 2000, twice as fast as the
combined downstream Georgia counties located below Buford Dam and more than 4 times
the growth rate of the combined Alabama and Florida Counties in the Apalachicola-
Chattahoochee-Flint (ACF) Rivers Basin.
Lake Lanier serves a larger recreational market
beyond the five counties, which extends to an
approximate 30-mile radius and totals 2.1 million
people, equivalent to roughly half of the Metro-
Atlanta population.
Water supplied from Lake Lanier for municipal and
industrial consumption serves an even larger market
of 4.0 million Metro-Atlanta residents and business
which employ more than 2.0 million workers.
The lake provides an amenity to 216,000 residents who live in the immediate vicinity of the
lake shore, as well as companies that provide 133,000 local jobs located between I-985 and
GA 400.
The presence of Lake Lanier adds a “premium” of $5.3 to $6.4 billion in additional value to
nearly 15,500 lakefront homes. This premium generates an additional $52.1 to $63.0 million
in annual county and school district property tax revenues within the counties ($3,370 to
$4,076 per unit), plus additional city taxes for lake properties located in incorporated areas.
Residents of the five counties surrounding Lake Lanier owned more than 26,000 boats
registered as personal property in 2007, contributing an estimated $4.4 million in personal
property taxes to the respective counties and school districts.
[FINDING 4] EVIDENCE COLLECTED FROM MULTIPLE SOURCES SHOWS THAT THE SEVERE
DRAW-DOWN IN LAKE LEVELS DURING 2008 HAD A NEGATIVE EFFECT ON VISITATION AND THE
REGION’S ECONOMY
The study profiles historical trends in lake elevations, annual visitation, boating, real estate and
related spending around Lake Lanier. Lake elevations fell to 50 year lows in 2008. Compared to
2007, Lake Lanier experienced:
Final Report LAKE SIDNEY LANIER ECONOMIC IMPACT ANALYSIS
Executive Summary 5
-
2.0
4.0
6.0
8.0
10.0
12.0
14.0
2004 2005 2006 2007 2008 2009
Ind
ex:
20
04
Val
ue
=1
.0
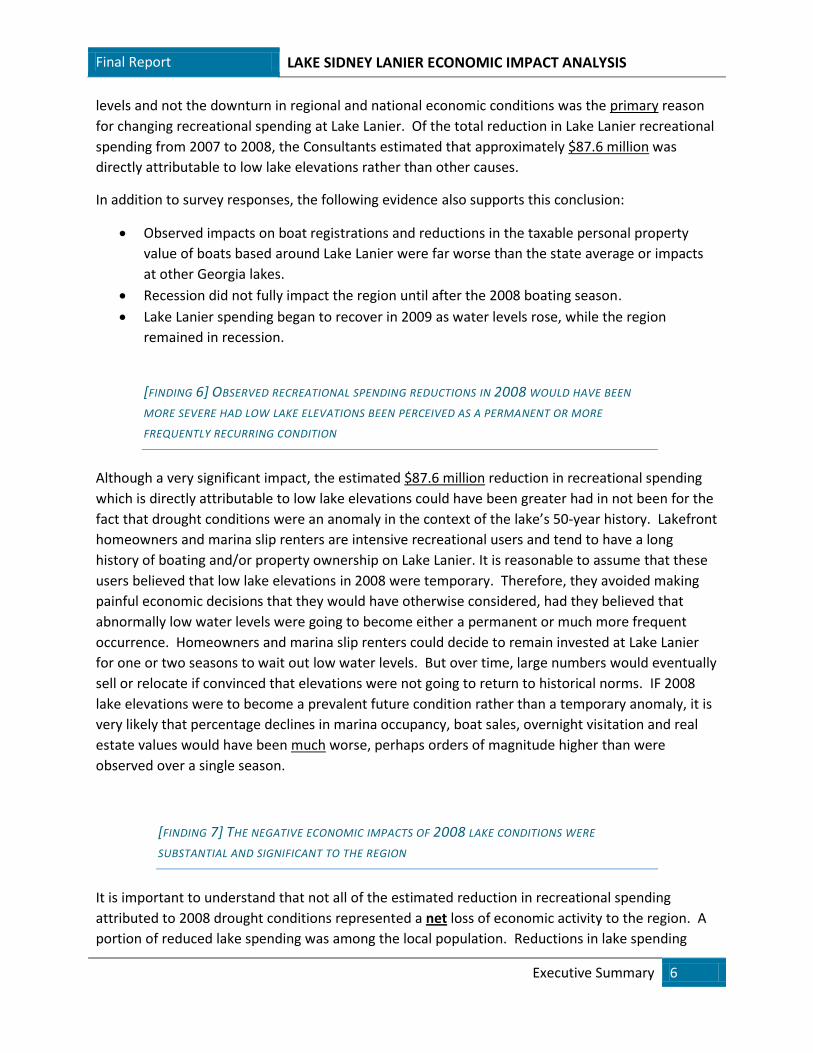
Change in the Value of Taxable Personal PropertyResidential and Commercial Boats: 2004-09 (2004 values = 1.0)
West Point Lake (Troup)
Lake Chatuge (Towns)
Lake Burton (Rabun)
Lake Oconee (Greene)
Lake Allatoona (Cherokee)
Lake Blue Ridge (Fannin)
Lake Lanier Counties [1]
Lake/(County)[1] Lake Lanier totals for Hall, Forsyth, Gwinnett,
Dawson and Lumpkin Counties.
A near 880,000 decline
in total annual visits
including 326,000 fewer
boaters and 68,000
fewer campers;
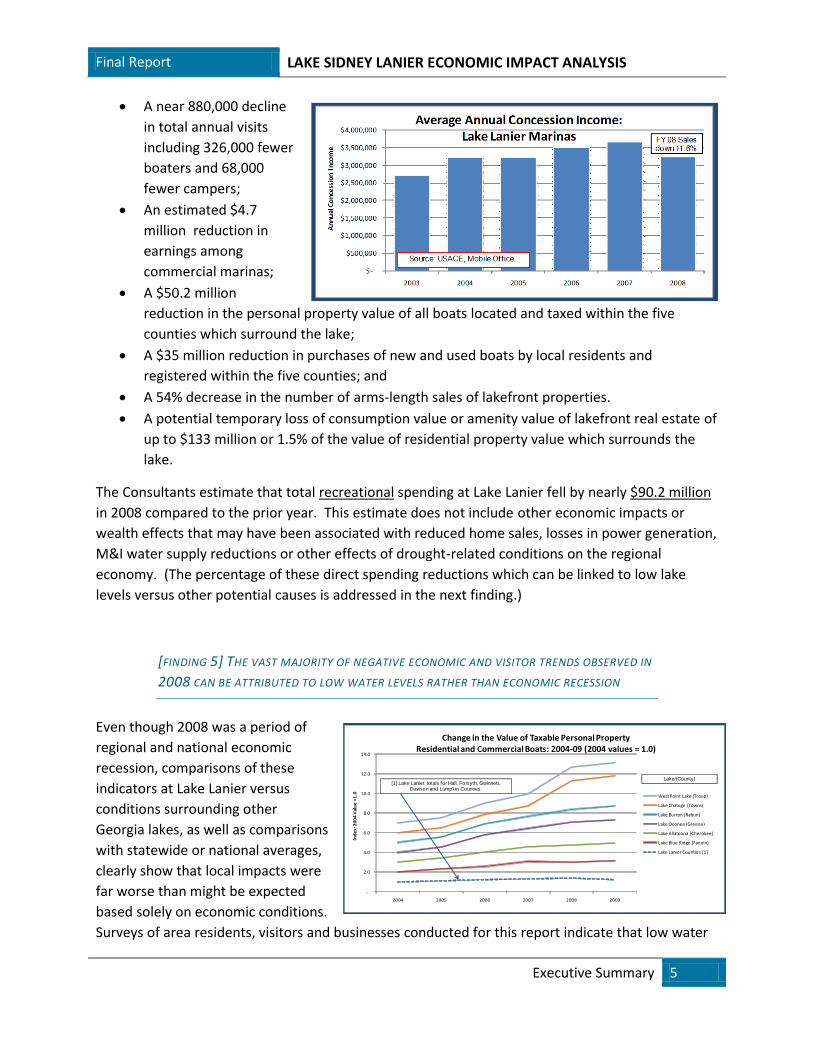
An estimated $4.7
million reduction in
earnings among
commercial marinas;
A $50.2 million
reduction in the personal property value of all boats located and taxed within the five
counties which surround the lake;
A $35 million reduction in purchases of new and used boats by local residents and
registered within the five counties; and
A 54% decrease in the number of arms-length sales of lakefront properties.
A potential temporary loss of consumption value or amenity value of lakefront real estate of
up to $133 million or 1.5% of the value of residential property value which surrounds the
lake.
The Consultants estimate that total recreational spending at Lake Lanier fell by nearly $90.2 million
in 2008 compared to the prior year. This estimate does not include other economic impacts or
wealth effects that may have been associated with reduced home sales, losses in power generation,
M&I water supply reductions or other effects of drought-related conditions on the regional
economy. (The percentage of these direct spending reductions which can be linked to low lake
levels versus other potential causes is addressed in the next finding.)
[FINDING 5] THE VAST MAJORITY OF NEGATIVE ECONOMIC AND VISITOR TRENDS OBSERVED IN
2008 CAN BE ATTRIBUTED TO LOW WATER LEVELS RATHER THAN ECONOMIC RECESSION
Even though 2008 was a period of
regional and national economic
recession, comparisons of these
indicators at Lake Lanier versus
conditions surrounding other
Georgia lakes, as well as comparisons
with statewide or national averages,
clearly show that local impacts were
far worse than might be expected
based solely on economic conditions.
Surveys of area residents, visitors and businesses conducted for this report indicate that low water
Final Report LAKE SIDNEY LANIER ECONOMIC IMPACT ANALYSIS
Executive Summary 6
levels and not the downturn in regional and national economic conditions was the primary reason
for changing recreational spending at Lake Lanier. Of the total reduction in Lake Lanier recreational
spending from 2007 to 2008, the Consultants estimated that approximately $87.6 million was
directly attributable to low lake elevations rather than other causes.
In addition to survey responses, the following evidence also supports this conclusion:
Observed impacts on boat registrations and reductions in the taxable personal property
value of boats based around Lake Lanier were far worse than the state average or impacts
at other Georgia lakes.
Recession did not fully impact the region until after the 2008 boating season.
Lake Lanier spending began to recover in 2009 as water levels rose, while the region
remained in recession.
[FINDING 6] OBSERVED RECREATIONAL SPENDING REDUCTIONS IN 2008 WOULD HAVE BEEN
MORE SEVERE HAD LOW LAKE ELEVATIONS BEEN PERCEIVED AS A PERMANENT OR MORE
FREQUENTLY RECURRING CONDITION
Although a very significant impact, the estimated $87.6 million reduction in recreational spending
which is directly attributable to low lake elevations could have been greater had in not been for the
fact that drought conditions were an anomaly in the context of the lake’s 50-year history. Lakefront
homeowners and marina slip renters are intensive recreational users and tend to have a long
history of boating and/or property ownership on Lake Lanier. It is reasonable to assume that these
users believed that low lake elevations in 2008 were temporary. Therefore, they avoided making
painful economic decisions that they would have otherwise considered, had they believed that
abnormally low water levels were going to become either a permanent or much more frequent
occurrence. Homeowners and marina slip renters could decide to remain invested at Lake Lanier
for one or two seasons to wait out low water levels. But over time, large numbers would eventually
sell or relocate if convinced that elevations were not going to return to historical norms. IF 2008
lake elevations were to become a prevalent future condition rather than a temporary anomaly, it is
very likely that percentage declines in marina occupancy, boat sales, overnight visitation and real
estate values would have been much worse, perhaps orders of magnitude higher than were
observed over a single season.
[FINDING 7] THE NEGATIVE ECONOMIC IMPACTS OF 2008 LAKE CONDITIONS WERE
SUBSTANTIAL AND SIGNIFICANT TO THE REGION
It is important to understand that not all of the estimated reduction in recreational spending
attributed to 2008 drought conditions represented a net loss of economic activity to the region. A
portion of reduced lake spending was among the local population. Reductions in lake spending
Final Report LAKE SIDNEY LANIER ECONOMIC IMPACT ANALYSIS
Executive Summary 7
among local residents were certainly negative to some sectors of the economy, but could have been
neutral to the region as a whole IF residents simply diverted their lake spending to other local
businesses. Net negative economic impacts occur when the region loses visitor spending which
originates from outside the region, and/or when area residents divert their own recreational
spending at Lake Lanier to other states or regions. In addition, the economic impacts of changes in
visitor spending, whether positive or negative are not entirely confined to the region where the
spending change occurs. A portion of any change in economic activity tends to immediately “leak”
from the local economy in the form of payments to non-local vendors, the manufacturer versus
retailer share of retail purchases, or other profits accruing to non-local owners of enterprises
operating in the region. Therefore, the economic impact analysis was very careful to focus on net
impacts, as well as impacts to the local economy versus those of other states or regions.
The net negative regional economic impacts of low water levels at Lake Lanier included:
The annual loss of local option sales tax revenues to surrounding counties ranging from
$1.83 million to $1.94 million;
The annual loss of hotel-motel tax revenues of approximately $34,000;
The annual loss of property tax revenues (from lost personal property value of boats) of
approximately $389,500;
The annual loss of output (the value of all goods and services sold in the region) ranging
from $43.81 million to $54.83 million;
The reduction in output resulted in a corresponding reduction in labor income (salaries,
wages and proprietors’ income) ranging from $25.18 million to $31.51 million; and
The reduction in economic activity and output also caused employment losses ranging from
987 to 1,224 jobs.
In the context of Lake Lanier’s total economic impact on the region’s recreational economy as
measured by USACE, employment losses in the range of 978 to 1,224 jobs are very significant. The
estimated impact of low water levels during 2008 represents an approximate 23% reduction in lake-
supported employment in only one year.
It should be emphasized that these negative impacts focus on measurable short run spending
effects in the counties bordering Lake Lanier. Although they are significant, these numbers
understate the full incremental economic impact of low water levels for three major reasons:
1. Short-term changes in recreational spending always fail to capture total “consumption
values,” or the full economic value of benefits received by those who actually utilize Lake
Lanier and its many related facilities. (Consumption values are explained in the introduction
as well as in Chapter IV of the full report.)
2. The importance of Lake Lanier as a contributor to the size and growth rates of the five
surrounding counties clouds the important distinction between out-of-region and local
visitors to the lake. There is little doubt that the presence of the lake has contributed to
population growth and has attracted upper-income households, seasonal residents and
Final Report LAKE SIDNEY LANIER ECONOMIC IMPACT ANALYSIS
Executive Summary 8
retirees who would not otherwise be living in the region. Persistently low water levels
would impact that particular segment of the resident population and have long run adverse
effects on the local economy, yet the effects of such “endogenous” population size factors
are hard to fully capture in short run spending impact studies.
3. To the extent that the indirect multiplier analysis failed to fully capture the existence of a
wider web of vendors and other suppliers to the lake-based economy located throughout
the state of Georgia, the statewide economic impact of the decline in recreational activity at
Lake Lanier would be larger than the estimated impacts on the local region only. Based on
the naturally higher state-wide multipliers that would apply, relative to the localized
multipliers that were used, such state-wide impacts could be as much as 20% higher than
the local impacts estimated above.
[FINDING 8] DOWNSTREAM ECONOMIES AND POPULATIONS IN THE LOWER ACF BASIN ARE
SUBSTANTIALLY SMALLER THAN THOSE IMMEDIATELY SURROUNDING LAKE LANIER
Based on Finding 7, it is clear that lake management policies which avoid severe draw-downs and
maintain higher pool levels during longer periods of the year would certainly benefit the local lake
recreation economy. However, an important focus of the study was to gather data to determine
whether job and income losses suffered during 2008 as a result of low water levels at Lake Lanier,
were equitable in comparison to economic impacts on downstream economies. Would
management policies designed to reduce negative economic impacts on lake-dependent businesses
simply cause more harmful economic impacts downstream? It was well beyond the scope of the
study to address the complex legal and environmental issues that govern management of the ACF
Basin‘s water resources, nor did the Consultants conduct an economic impact analysis of
downstream economies. However, in order to provide a context for comparison, the report
analyzed the relative population and employment levels of counties in the ACF Basin. The report
also focused on power generation, tourism, fishing and agricultural industries which could be most
directly impacted by changes to downstream flows. (Findings 8 through 10 focus on these issues.)
Analysis of population and employment data for the counties in the ACF Basin revealed the
following:
Alabama and Florida together contain 13% of the ACF River Basin’s total population, 11% of
its businesses and 9% of total private employment, while the Georgia portion of the ACF
Basin contains 5.8 million people, representing 59% of Georgia’s total population and an
even larger share of the state’s economy.
The combined economies of Hall and Forsyth Counties alone are roughly comparable to the
entire Florida portion of the ACF basin and only marginally smaller than the Alabama
portion.
Final Report LAKE SIDNEY LANIER ECONOMIC IMPACT ANALYSIS
Executive Summary 9
The total private sector economies of the 17 Alabama and Florida counties in the ACF Basin,
combined, represent less than half of Gwinnett County in terms of numbers of existing
companies, private payrolls and employees.
While the Florida portion of the ACF Basin is slightly more dependent on tourism as a
percentage of its private employment, the total number of tourism-dependent jobs in that
region appears to be smaller than the counties immediately surrounding Lake Lanier.
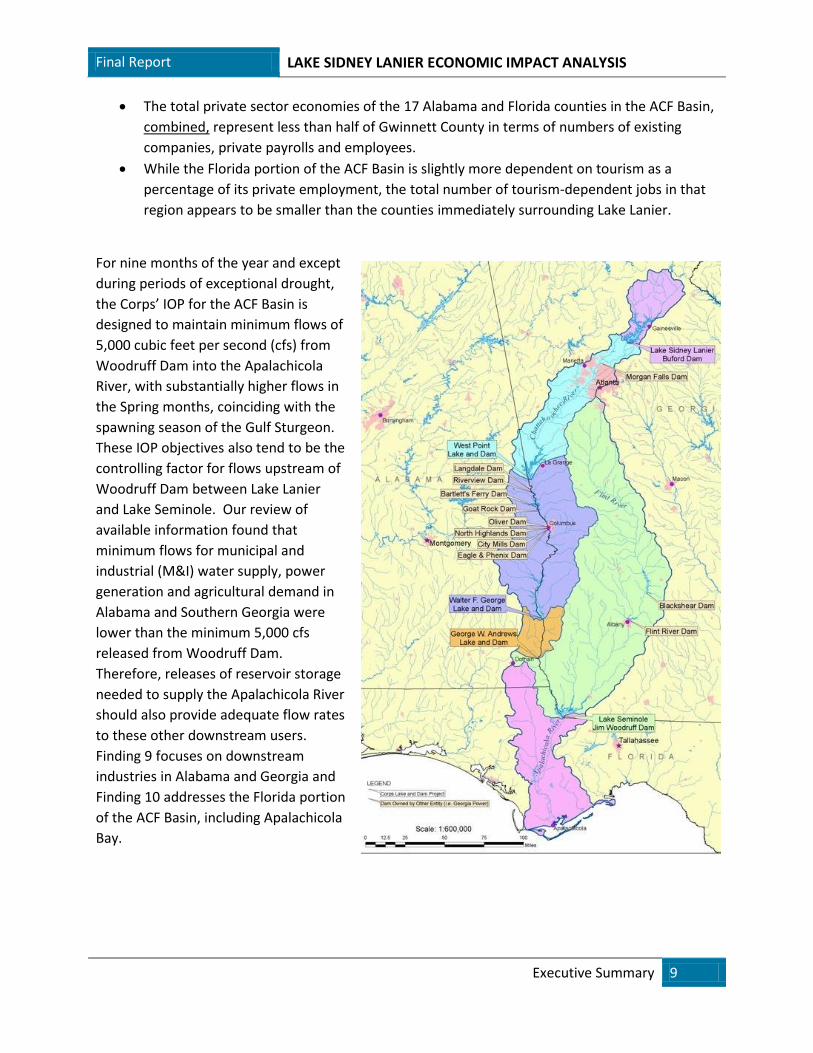
For nine months of the year and except
during periods of exceptional drought,
the Corps’ IOP for the ACF Basin is
designed to maintain minimum flows of
5,000 cubic feet per second (cfs) from
Woodruff Dam into the Apalachicola
River, with substantially higher flows in
the Spring months, coinciding with the
spawning season of the Gulf Sturgeon.
These IOP objectives also tend to be the
controlling factor for flows upstream of
Woodruff Dam between Lake Lanier
and Lake Seminole. Our review of
available information found that
minimum flows for municipal and
industrial (M&I) water supply, power
generation and agricultural demand in
Alabama and Southern Georgia were
lower than the minimum 5,000 cfs
released from Woodruff Dam.
Therefore, releases of reservoir storage
needed to supply the Apalachicola River
should also provide adequate flow rates
to these other downstream users.
Finding 9 focuses on downstream
industries in Alabama and Georgia and
Finding 10 addresses the Florida portion
of the ACF Basin, including Apalachicola
Bay.
Final Report LAKE SIDNEY LANIER ECONOMIC IMPACT ANALYSIS
Executive Summary 10
[FINDING 9] THE NEGATIVE ECONOMIC IMPACTS ON THE LAKE LANIER ECONOMY ESTIMATED
IN 2008 (SEE FINDING #5) WERE SUBSTANTIALLY LARGER THAN THOSE ON DOWNSTREAM
INDUSTRIES IN ALABAMA AND GEORGIA.
Except during those periods of most severe drought, Lake Lanier’s influence on downstream
Alabama and Georgia economies is very difficult to quantify and marginal at best. The analysis
found that downstream industries that rely on Chattahoochee River flows (a) are comparatively
small in size compared to the recreational economy of Lake Lanier; (b) have minimum flow
requirements which are generally satisfied by the 5,000 cfs flow rates from Woodruff dam; (c)
derive marginal or no economic benefits from higher river flows than the required minimums and
(d) did not suffer the magnitude of negative economic impacts that were incurred by Lake Lanier
dependent businesses during the 2007-09 drought. Therefore, there appear to be very limited or
no positive downstream economic impacts to Alabama or Georgia that offset the negative effects of
severe draw-downs of Lake Lanier or the other Corps’ lakes in the ACF Basin. This finding is based
on the following factors:
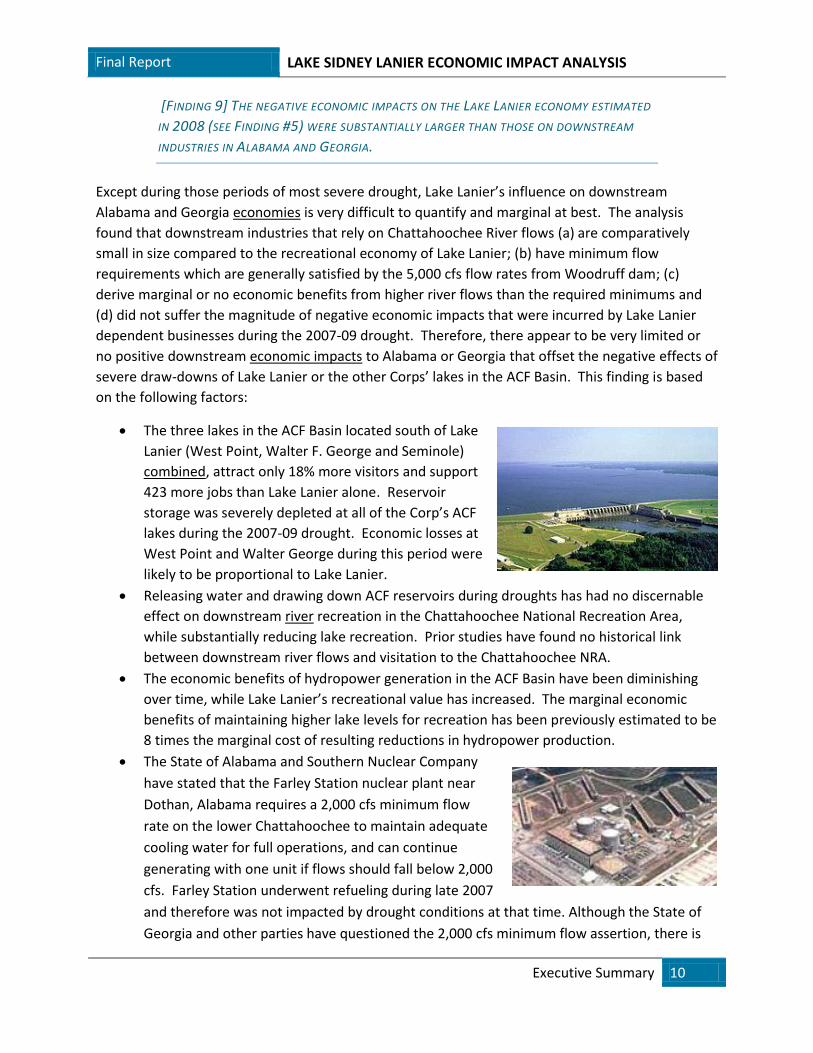
The three lakes in the ACF Basin located south of Lake
Lanier (West Point, Walter F. George and Seminole)
combined, attract only 18% more visitors and support
423 more jobs than Lake Lanier alone. Reservoir
storage was severely depleted at all of the Corp’s ACF
lakes during the 2007-09 drought. Economic losses at
West Point and Walter George during this period were
likely to be proportional to Lake Lanier.
Releasing water and drawing down ACF reservoirs during droughts has had no discernable
effect on downstream river recreation in the Chattahoochee National Recreation Area,
while substantially reducing lake recreation. Prior studies have found no historical link
between downstream river flows and visitation to the Chattahoochee NRA.
The economic benefits of hydropower generation in the ACF Basin have been diminishing
over time, while Lake Lanier’s recreational value has increased. The marginal economic
benefits of maintaining higher lake levels for recreation has been previously estimated to be
8 times the marginal cost of resulting reductions in hydropower production.
The State of Alabama and Southern Nuclear Company
have stated that the Farley Station nuclear plant near
Dothan, Alabama requires a 2,000 cfs minimum flow
rate on the lower Chattahoochee to maintain adequate
cooling water for full operations, and can continue
generating with one unit if flows should fall below 2,000
cfs. Farley Station underwent refueling during late 2007
and therefore was not impacted by drought conditions at that time. Although the State of
Georgia and other parties have questioned the 2,000 cfs minimum flow assertion, there is
Final Report LAKE SIDNEY LANIER ECONOMIC IMPACT ANALYSIS
Executive Summary 11
generally little difficulty in supplying adequate flow during “normal” periods. Marginally
adjusted operational priorities at Lake Lanier are unlikely to restrict downstream flows to a
degree that would restrict power generation at Farley Station.
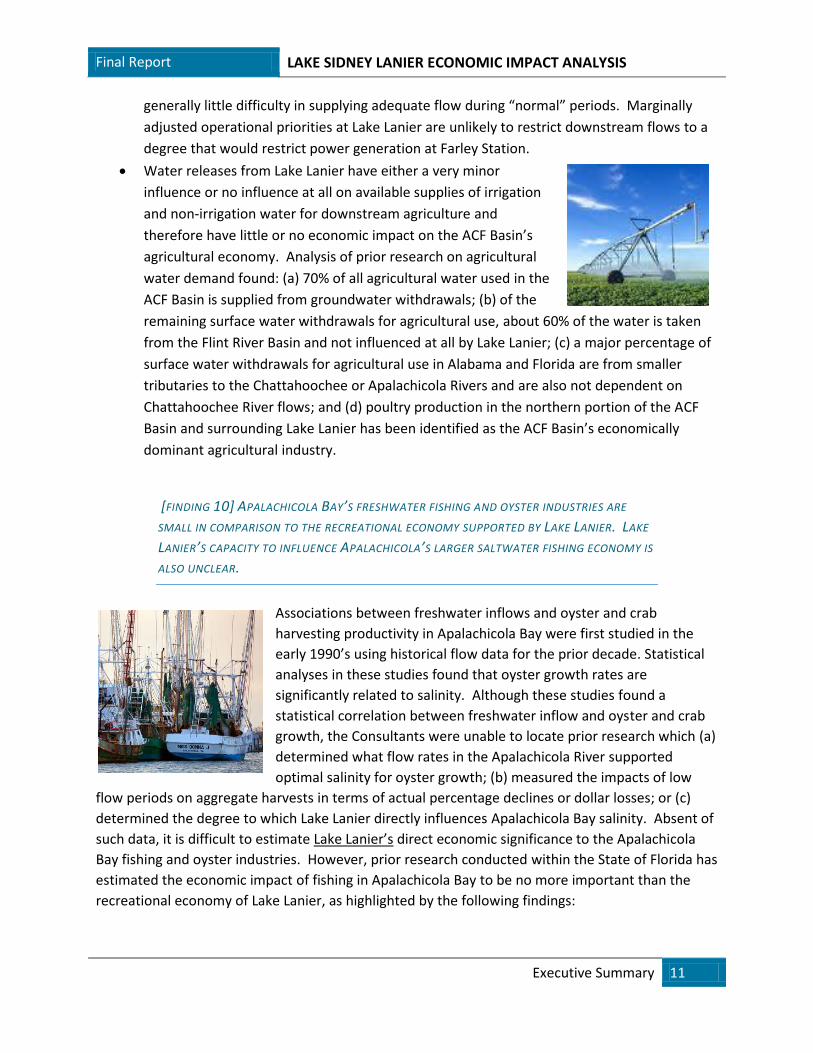
Water releases from Lake Lanier have either a very minor
influence or no influence at all on available supplies of irrigation
and non-irrigation water for downstream agriculture and
therefore have little or no economic impact on the ACF Basin’s
agricultural economy. Analysis of prior research on agricultural
water demand found: (a) 70% of all agricultural water used in the
ACF Basin is supplied from groundwater withdrawals; (b) of the
remaining surface water withdrawals for agricultural use, about 60% of the water is taken
from the Flint River Basin and not influenced at all by Lake Lanier; (c) a major percentage of
surface water withdrawals for agricultural use in Alabama and Florida are from smaller
tributaries to the Chattahoochee or Apalachicola Rivers and are also not dependent on
Chattahoochee River flows; and (d) poultry production in the northern portion of the ACF
Basin and surrounding Lake Lanier has been identified as the ACF Basin’s economically
dominant agricultural industry.
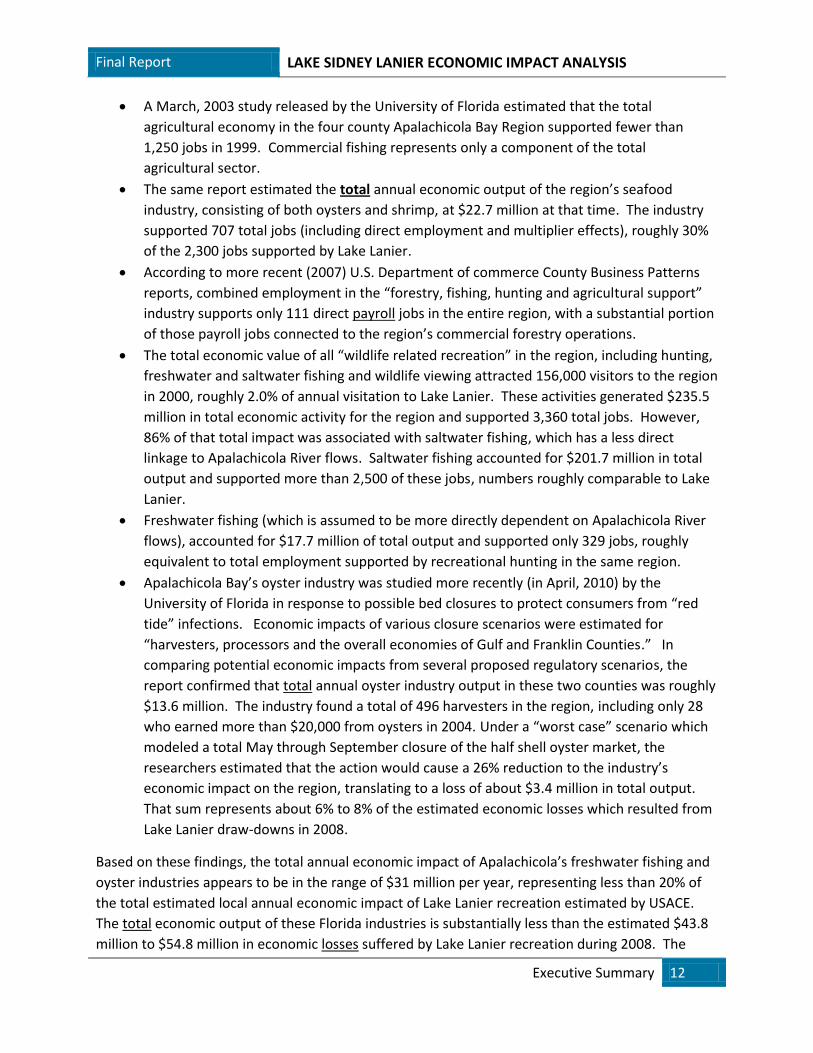
[FINDING 10] APALACHICOLA BAY’S FRESHWATER FISHING AND OYSTER INDUSTRIES ARE
SMALL IN COMPARISON TO THE RECREATIONAL ECONOMY SUPPORTED BY LAKE LANIER. LAKE
LANIER’S CAPACITY TO INFLUENCE APALACHICOLA’S LARGER SALTWATER FISHING ECONOMY IS
ALSO UNCLEAR.
Associations between freshwater inflows and oyster and crab
harvesting productivity in Apalachicola Bay were first studied in the
early 1990’s using historical flow data for the prior decade. Statistical
analyses in these studies found that oyster growth rates are
significantly related to salinity. Although these studies found a
statistical correlation between freshwater inflow and oyster and crab
growth, the Consultants were unable to locate prior research which (a)
determined what flow rates in the Apalachicola River supported
optimal salinity for oyster growth; (b) measured the impacts of low
flow periods on aggregate harvests in terms of actual percentage declines or dollar losses; or (c)
determined the degree to which Lake Lanier directly influences Apalachicola Bay salinity. Absent of
such data, it is difficult to estimate Lake Lanier’s direct economic significance to the Apalachicola
Bay fishing and oyster industries. However, prior research conducted within the State of Florida has
estimated the economic impact of fishing in Apalachicola Bay to be no more important than the
recreational economy of Lake Lanier, as highlighted by the following findings:
Final Report LAKE SIDNEY LANIER ECONOMIC IMPACT ANALYSIS
Executive Summary 12
A March, 2003 study released by the University of Florida estimated that the total
agricultural economy in the four county Apalachicola Bay Region supported fewer than
1,250 jobs in 1999. Commercial fishing represents only a component of the total
agricultural sector.
The same report estimated the total annual economic output of the region’s seafood
industry, consisting of both oysters and shrimp, at $22.7 million at that time. The industry
supported 707 total jobs (including direct employment and multiplier effects), roughly 30%
of the 2,300 jobs supported by Lake Lanier.
According to more recent (2007) U.S. Department of commerce County Business Patterns
reports, combined employment in the “forestry, fishing, hunting and agricultural support”
industry supports only 111 direct payroll jobs in the entire region, with a substantial portion
of those payroll jobs connected to the region’s commercial forestry operations.
The total economic value of all “wildlife related recreation” in the region, including hunting,
freshwater and saltwater fishing and wildlife viewing attracted 156,000 visitors to the region
in 2000, roughly 2.0% of annual visitation to Lake Lanier. These activities generated $235.5
million in total economic activity for the region and supported 3,360 total jobs. However,
86% of that total impact was associated with saltwater fishing, which has a less direct
linkage to Apalachicola River flows. Saltwater fishing accounted for $201.7 million in total
output and supported more than 2,500 of these jobs, numbers roughly comparable to Lake
Lanier.
Freshwater fishing (which is assumed to be more directly dependent on Apalachicola River
flows), accounted for $17.7 million of total output and supported only 329 jobs, roughly
equivalent to total employment supported by recreational hunting in the same region.
Apalachicola Bay’s oyster industry was studied more recently (in April, 2010) by the
University of Florida in response to possible bed closures to protect consumers from “red
tide” infections. Economic impacts of various closure scenarios were estimated for
“harvesters, processors and the overall economies of Gulf and Franklin Counties.” In
comparing potential economic impacts from several proposed regulatory scenarios, the
report confirmed that total annual oyster industry output in these two counties was roughly
$13.6 million. The industry found a total of 496 harvesters in the region, including only 28
who earned more than $20,000 from oysters in 2004. Under a “worst case” scenario which
modeled a total May through September closure of the half shell oyster market, the
researchers estimated that the action would cause a 26% reduction to the industry’s
economic impact on the region, translating to a loss of about $3.4 million in total output.
That sum represents about 6% to 8% of the estimated economic losses which resulted from
Lake Lanier draw-downs in 2008.
Based on these findings, the total annual economic impact of Apalachicola’s freshwater fishing and
oyster industries appears to be in the range of $31 million per year, representing less than 20% of
the total estimated local annual economic impact of Lake Lanier recreation estimated by USACE.
The total economic output of these Florida industries is substantially less than the estimated $43.8
million to $54.8 million in economic losses suffered by Lake Lanier recreation during 2008. The
Final Report LAKE SIDNEY LANIER ECONOMIC IMPACT ANALYSIS
Executive Summary 13
region’s recreational saltwater fishing industry is larger and roughly comparable to Lake Lanier in
terms of total economic impact, but the degree to which water releases from Lake Lanier directly
impact the economic performance of these Florida industries either positively or negatively has
never been quantified and appears to be marginal at best.
[FINDING 11] LAKE LANIER’S VALUE AS A REGIONAL WATER SUPPLY DWARFS ITS SIGNIFICANT
VALUE AS A RECREATIONAL RESOURCE
Even though maintaining higher pool levels might actually be made easier as a result of reducing
lake withdrawals for water supply purposes, losing Lake Lanier as a source of regional water supply
would have enormously negative regional economic consequences for Metro-Atlanta. The
magnitude of negative economic impacts obviously depends upon the timing and degree of
restricted withdrawals and the resulting supply shortfalls.
The economic impacts of resulting water shortages and the enormous public cost to acquire
replacement supply would also have a substantial negative effect on recreational spending. Those
negative impacts are likely to be permanent and worse to the lake-dependent economy than the
effects of low water levels during 2008. The huge negative economic consequences of regional
water supply shortages on Metro-Atlanta, a market of more than 4 million people and one of
Florida’s largest visitor markets, could also be more severe to Florida’s tourism economy than the
limited benefits associated with resulting marginally higher downstream flows in the lower ACF
Basin. The annual economic benefits of continuing to use Lake Lanier for water supply dwarf any
resulting negative effects on lake recreation or downstream economies. This conclusion is
supported by the following findings:
According to a 2004 study, which modeled a much less restrictive scenario than was
recently imposed by court-mandated reductions to water supply withdrawals, the present
value benefits to the national economy associated with Lake Lanier’s use as a regional water
supply was estimated at $19.1 billion.
A more recent study also determined that the cost of replacing Lake Lanier as a source of
regional water supply would have a multi-billion annual negative impact on the Metro-
Atlanta economy. According to a preliminary analysis, court-mandated reductions in water
supply withdrawals could:
o Cause a 34% regional water shortfall by 2012;
o Result in a 13% to 15% reduction in the region’s total economic output and an
annual “cost” of $35 to $39 billion; and
o Lead to the possible loss of 250,000 jobs to the Georgia economy.
The to place this impact in context, potential job losses to the Atlanta Region, which could result
from losing Lake Lanier water supply, exceed the estimated 223,000 total existing (2007) private
sector jobs in all of the Florida and Alabama Counties in the ACF Basin, combined.
Final Report LAKE SIDNEY LANIER ECONOMIC IMPACT ANALYSIS
Executive Summary 14
An ongoing study is being prepared by the Atlanta Regional Commission to refine the preliminary
findings cited above. We understand that this study concludes that it will be even more difficult and
expensive to replace Lake Lanier as a source of water supply than originally anticipated. Therefore,
the resulting regional economic impact of losing/replacing Lake Lanier as a regional water supply
source would also be greater than the $35 to $39 billion annual cost previously estimated, with
resulting higher costs to the national economy as well.
The above findings are presented in more detail in the following report.
Final Report LAKE SIDNEY LANIER ECONOMIC IMPACT ANALYSIS
Introduction 15
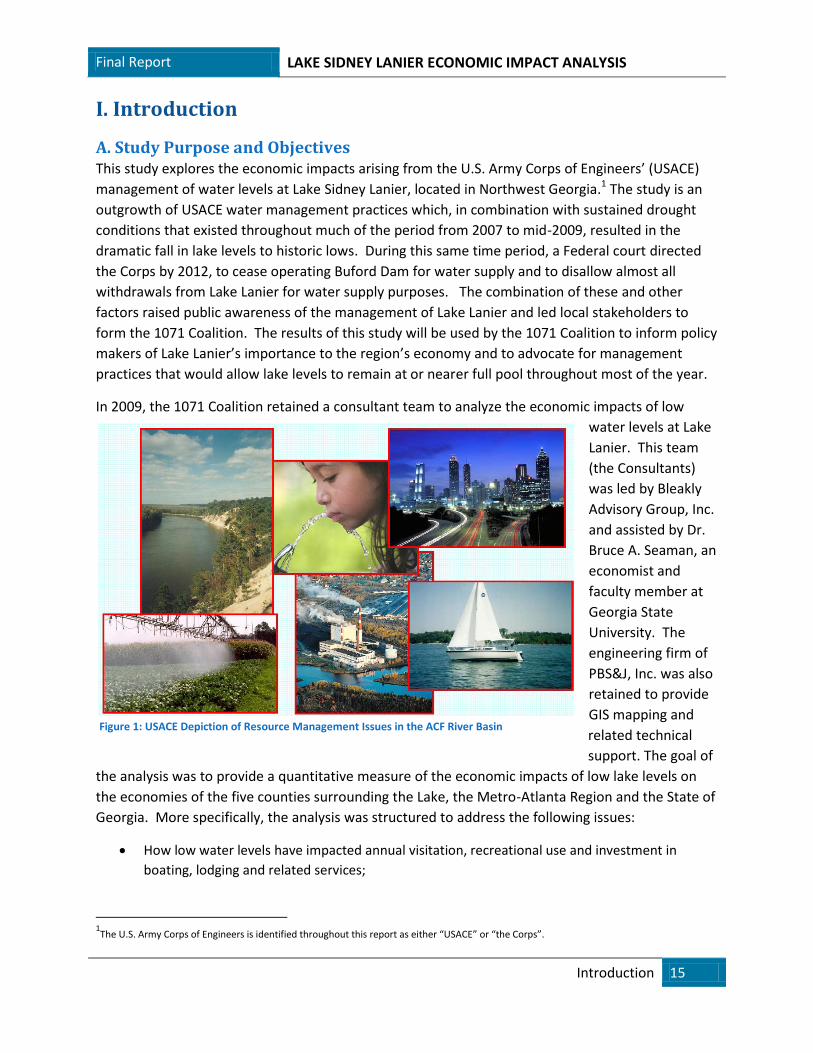
I. Introduction
A. Study Purpose and Objectives This study explores the economic impacts arising from the U.S. Army Corps of Engineers’ (USACE)
management of water levels at Lake Sidney Lanier, located in Northwest Georgia.1 The study is an
outgrowth of USACE water management practices which, in combination with sustained drought
conditions that existed throughout much of the period from 2007 to mid-2009, resulted in the
dramatic fall in lake levels to historic lows. During this same time period, a Federal court directed
the Corps by 2012, to cease operating Buford Dam for water supply and to disallow almost all
withdrawals from Lake Lanier for water supply purposes. The combination of these and other
factors raised public awareness of the management of Lake Lanier and led local stakeholders to
form the 1071 Coalition. The results of this study will be used by the 1071 Coalition to inform policy
makers of Lake Lanier’s importance to the region’s economy and to advocate for management
practices that would allow lake levels to remain at or nearer full pool throughout most of the year.
In 2009, the 1071 Coalition retained a consultant team to analyze the economic impacts of low
water levels at Lake
Lanier. This team
(the Consultants)
was led by Bleakly
Advisory Group, Inc.
and assisted by Dr.
Bruce A. Seaman, an
economist and
faculty member at
Georgia State
University. The
engineering firm of
PBS&J, Inc. was also
retained to provide
GIS mapping and
related technical
support. The goal of
the analysis was to provide a quantitative measure of the economic impacts of low lake levels on
the economies of the five counties surrounding the Lake, the Metro-Atlanta Region and the State of
Georgia. More specifically, the analysis was structured to address the following issues:
How low water levels have impacted annual visitation, recreational use and investment in
boating, lodging and related services;
1The U.S. Army Corps of Engineers is identified throughout this report as either “USACE” or “the Corps”.
Figure 1: USACE Depiction of Resource Management Issues in the ACF River Basin
Final Report LAKE SIDNEY LANIER ECONOMIC IMPACT ANALYSIS
Introduction 16
1050
1052
1054
1056
1058
1060
1062
1064
1066
1068
1070
1072
1074
Ele
vati
on
(FT
ab
ove
Se
a Le
vel)
Lake Lanier Lowest Recorded Elevations by Year:1959 to 2009
Full Pool: 1071'
- 20 ft:
The direct and indirect economic losses resulting from changing recreational spending and
visitor patterns;
The potential effects of low water levels on real estate values and investment;
The economic impacts resulting from the potential loss of Lake Lanier as a source of municipal
and industrial water (M&I) supply for Metro-Atlanta; and
The relative effects of impacts on Lake Lanier counties versus downstream economies in
Georgia, Alabama and Florida. In particular, this study attempted to determine whether the
economies of the counties surrounding the lake have been impacted by lake management
practices and drought conditions to a degree that is disproportionate to downstream users.
The following introduction defines the types of impacts addressed in the report, reviews the scope
of the research and the methodologies used to estimate economic impacts.
B. Economic Effects of Lake Management Policies
1. Overview
The U.S. Army Corps of Engineers must satisfy multiple policy objectives related to the management
of Lake Lanier. Among these are power generation, flood control, municipal and industrial water
supply, downstream navigation, public recreation and environmental protection, including
protection of endangered species. In practice these objectives are often in conflict with one
another and must be balanced when setting goals and implementing policy. USACE’s ability to lower
and raise levels of all Corps lakes in the ACF Basin is the method used to balance competing
demands for the use of this water supply.
As the region has developed and
priorities changed over the 50
years since Lake Lanier was
created, the benefits and costs of
different uses of the lake have
also changed. Residents living on
or near the lake, visitors who
enjoy Lake Lanier for recreation
and businesses that provide
goods and services to those
visitors would like to see higher
elevations maintained,
particularly throughout the
boating season. At the same
time, Metro-Atlanta has become more dependent on Lake Lanier for water supply and downstream
users continue to demand releases in order to maintain water flows for power generation, fish
habitat, downstream recreation and other uses. When annual rainfall has been inadequate to
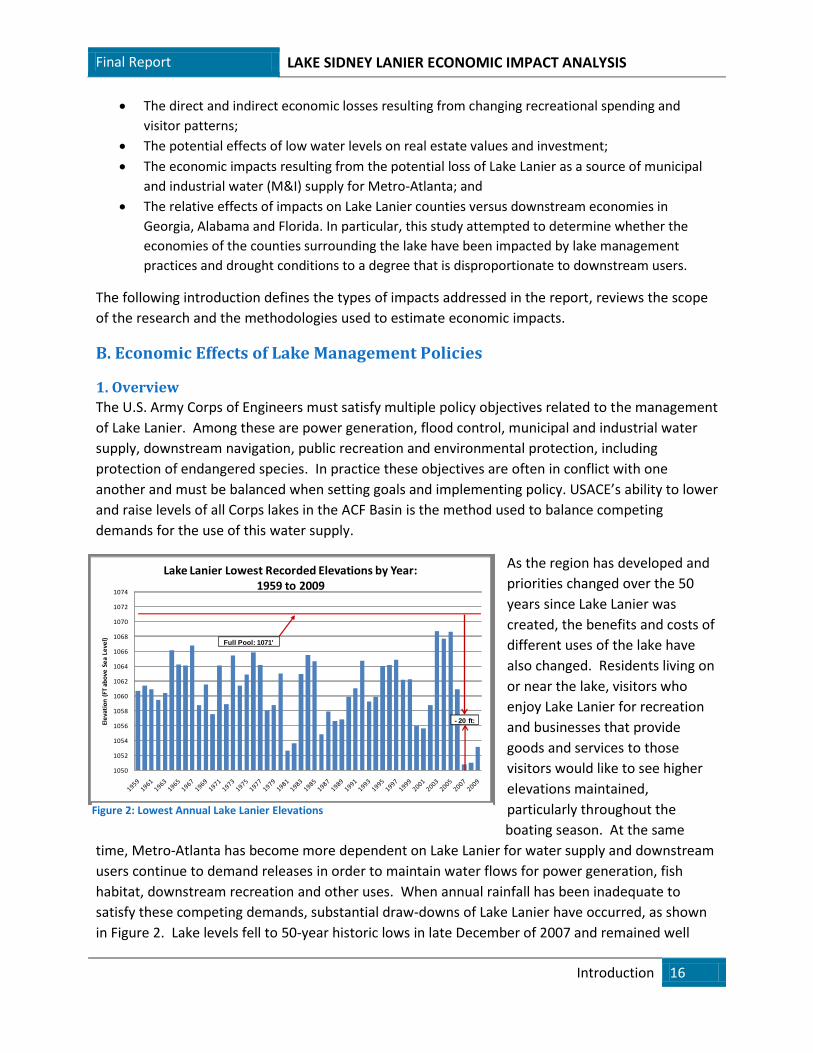
satisfy these competing demands, substantial draw-downs of Lake Lanier have occurred, as shown
in Figure 2. Lake levels fell to 50-year historic lows in late December of 2007 and remained well
Figure 2: Lowest Annual Lake Lanier Elevations
Final Report LAKE SIDNEY LANIER ECONOMIC IMPACT ANALYSIS
Introduction 17
below pool during 2008. More information regarding the Corps’
management of Lake Lanier and historical changes in water levels is
provided in Chapter II.
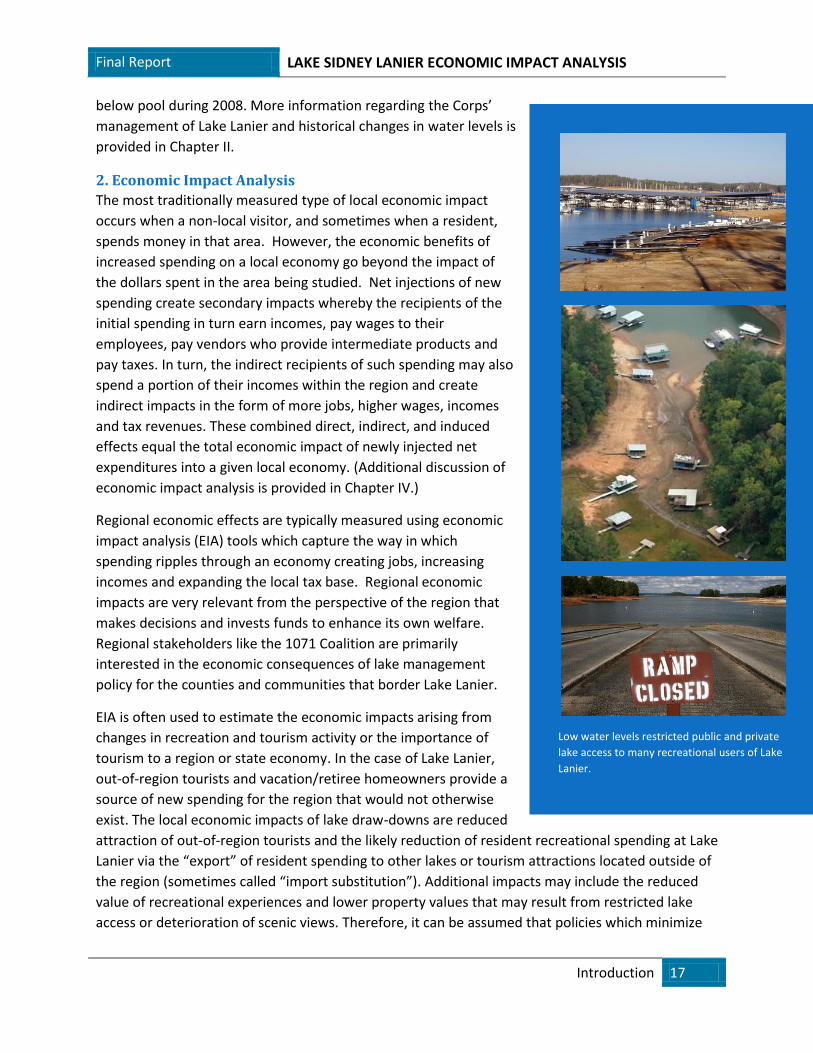
2. Economic Impact Analysis
The most traditionally measured type of local economic impact
occurs when a non-local visitor, and sometimes when a resident,
spends money in that area. However, the economic benefits of
increased spending on a local economy go beyond the impact of
the dollars spent in the area being studied. Net injections of new
spending create secondary impacts whereby the recipients of the
initial spending in turn earn incomes, pay wages to their
employees, pay vendors who provide intermediate products and
pay taxes. In turn, the indirect recipients of such spending may also
spend a portion of their incomes within the region and create
indirect impacts in the form of more jobs, higher wages, incomes
and tax revenues. These combined direct, indirect, and induced
effects equal the total economic impact of newly injected net
expenditures into a given local economy. (Additional discussion of
economic impact analysis is provided in Chapter IV.)
Regional economic effects are typically measured using economic
impact analysis (EIA) tools which capture the way in which
spending ripples through an economy creating jobs, increasing
incomes and expanding the local tax base. Regional economic
impacts are very relevant from the perspective of the region that
makes decisions and invests funds to enhance its own welfare.
Regional stakeholders like the 1071 Coalition are primarily
interested in the economic consequences of lake management
policy for the counties and communities that border Lake Lanier.
EIA is often used to estimate the economic impacts arising from
changes in recreation and tourism activity or the importance of
tourism to a region or state economy. In the case of Lake Lanier,
out-of-region tourists and vacation/retiree homeowners provide a
source of new spending for the region that would not otherwise
exist. The local economic impacts of lake draw-downs are reduced
attraction of out-of-region tourists and the likely reduction of resident recreational spending at Lake
Lanier via the “export” of resident spending to other lakes or tourism attractions located outside of
the region (sometimes called “import substitution”). Additional impacts may include the reduced
value of recreational experiences and lower property values that may result from restricted lake
access or deterioration of scenic views. Therefore, it can be assumed that policies which minimize
Low water levels restricted public and private
lake access to many recreational users of Lake
Lanier.
Final Report LAKE SIDNEY LANIER ECONOMIC IMPACT ANALYSIS
Introduction 18
draw-downs and maintain higher lake levels would have the
opposite effect of policies which allow excessive elevation drops to
occur.
3. Regional versus National Economic Effects
Economic effects can be analyzed from either a regional or national
perspective or both. EIA is commonly used to estimate economic
gains and losses for regional economies. Evaluating economic gains
and losses for the nation requires a somewhat different approach
that captures changes in individual wellbeing, even if much of the
more measurable economic activity is transferred from one region
to another, with questionable net changes for the larger region as a
whole. The phenomenon of one region gaining while another loses
creates potential “aggregation paradoxes” that can easily yield
smaller net economic impacts for a larger region than would be
obtained when summing the individual economic impacts across a
group of smaller sub-regions.
There is a difference between economic benefits that accrue to a
particular region versus increased benefits to the nation as a whole.
In many instances the activity explored through the tools of EIA do
not necessarily benefit the nation. A simple reallocation of
recreation spending across states or regions, from one lake to
another or from a lake attraction to an ocean destination does not
necessarily produce a net gain to the national economy. Similarly,
within the same region a simple transfer of recreation spending
from one tourism attraction to another may not necessarily
produce a net gain for the region.
From a national perspective, positive regional economic impacts
are less important than the overall improvement in economic
value. Economic value is not the same as expenditures, income or
jobs. Economic value is an intrinsic measure of benefit that results
from the use of a product or a resource. Increased value means
people are willing to pay more to buy and consume something. If
water levels were maintained at full pool during longer periods of
the year, users of Lake Lanier should enjoy greater economic value
through better recreational experiences and improved view quality.
Net economic value could increase even though there may be no
corresponding increase in spending, jobs and or income. (See also
the discussion of consumption value and the potentially longer
term economic growth impacts in Section IV.)
Two Prior Economic Studies of Lake Lanier
In November, 2003 the USACE prepared an
Environmental Impact Study (EIS) for the
Operation and Maintenance (O&M) of Lake
Sidney Lanier. The Socioeconomic Impact
Section (Appendix A) of the EIS estimated
changes to the regional economy because of
(1) decreases in dock construction spending
due to changes in permitting or (2) from
drought conditions that would lower
consumer spending because of a drop in
visitor attendance. The EIS determined that
“the actual extent of the impact of low water
levels on lake attendance cannot be
accurately predicted based on historical
information, because lake levels have never
decreased to an extreme.” (page A-3) The EIS
instead used three hypothetical scenarios to
forecast impacts.
In 2003-04, the Atlanta Regional Commission
retained Camp Dresser & McKee, Inc. (CDM)
to evaluate the National Economic
Development benefit changes attributable to
the proposed reallocation of operational
priorities in the ACF Basin Water Control Plan
to a new set of operational priorities. The
Study was co-authored by 3 Ph.D. Energy and
Water Economists from CDM and Dr. Michael
Farmer of Georgia Tech, who is a former
Director of the USACE’s Institute for Water
Resources. The “new priorities” addressed in
that study were designed to reallocate a
substantial portion of Lanier’s conservation
storage from hydropower to water supply,
with related consideration of policy impacts
on recreational benefits, river navigation and
downstream environmental quality. The
study included a detailed economic analysis of
Lake Lanier’s recreational value. The
methodology quantified the economic
benefits of maintaining higher Summer Pool
levels for recreational use by estimating
economic losses that would result from low
lake levels. In that case, the effects of lower
water levels on visitation and related spending
had to be estimated because Lake elevations
had been relatively stable and near full pool
during most of the previous decade.
Final Report LAKE SIDNEY LANIER ECONOMIC IMPACT ANALYSIS
Introduction 19
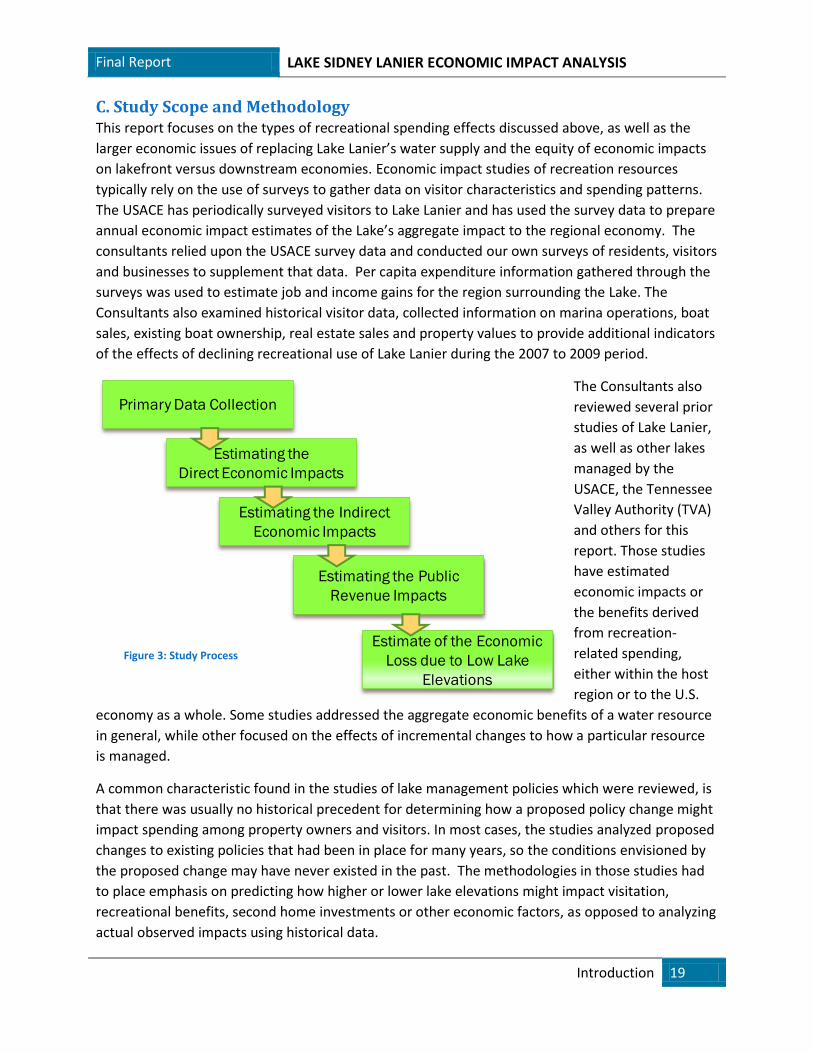
C. Study Scope and Methodology This report focuses on the types of recreational spending effects discussed above, as well as the
larger economic issues of replacing Lake Lanier’s water supply and the equity of economic impacts
on lakefront versus downstream economies. Economic impact studies of recreation resources
typically rely on the use of surveys to gather data on visitor characteristics and spending patterns.
The USACE has periodically surveyed visitors to Lake Lanier and has used the survey data to prepare
annual economic impact estimates of the Lake’s aggregate impact to the regional economy. The
consultants relied upon the USACE survey data and conducted our own surveys of residents, visitors
and businesses to supplement that data. Per capita expenditure information gathered through the
surveys was used to estimate job and income gains for the region surrounding the Lake. The
Consultants also examined historical visitor data, collected information on marina operations, boat
sales, existing boat ownership, real estate sales and property values to provide additional indicators
of the effects of declining recreational use of Lake Lanier during the 2007 to 2009 period.
The Consultants also
reviewed several prior
studies of Lake Lanier,
as well as other lakes
managed by the
USACE, the Tennessee
Valley Authority (TVA)
and others for this
report. Those studies
have estimated
economic impacts or
the benefits derived
from recreation-
related spending,
either within the host
region or to the U.S.
economy as a whole. Some studies addressed the aggregate economic benefits of a water resource
in general, while other focused on the effects of incremental changes to how a particular resource
is managed.
A common characteristic found in the studies of lake management policies which were reviewed, is
that there was usually no historical precedent for determining how a proposed policy change might
impact spending among property owners and visitors. In most cases, the studies analyzed proposed
changes to existing policies that had been in place for many years, so the conditions envisioned by
the proposed change may have never existed in the past. The methodologies in those studies had
to place emphasis on predicting how higher or lower lake elevations might impact visitation,
recreational benefits, second home investments or other economic factors, as opposed to analyzing
actual observed impacts using historical data.
Primary Data Collection
Estimating the
Direct Economic Impacts
Estimating the Indirect
Economic Impacts
Estimating the Public
Revenue Impacts
Estimate of the Economic
Loss due to Low Lake
Elevations
Figure 3: Study Process
Final Report LAKE SIDNEY LANIER ECONOMIC IMPACT ANALYSIS
Introduction 20
In this case, the Consultants had the advantage of examining more than 50 years of detailed daily
elevation data for Lake Lanier. That history has included several years when full pool conditions
existed throughout the peak summer visitor months, as well as years when summer elevations fell
by 15 to 20 feet below full pool. USACE has also counted annual visitors to Lake Lanier using a
consistent methodology that has been in place since 1993. Rather than estimate the effects of a
hypothetical condition, the Consultants were able to observe actual changes to monthly visitor
counts while water levels fell to historic lows from 2007 into 2009. Therefore, this analysis
attempts to quantify the negative economic consequences of actual changes in lake elevations and
actual resulting measured changes in recreational spending, in order to estimate the benefits of a
lake management policy that would be more effective in maintaining full pool. This is a subtle yet
important distinction which helps to support the validity of the study findings.
While the recent existence of historically low elevations at Lake Lanier provided useful data to study
the relationship between water levels, visitation rates and changes in property values, these same
conditions unfortunately coincided with a period of deep economic recession both regionally and
nationally. The existence of adverse economic conditions presented challenges to the Consultants
in separating competing causal factors when analyzing changes. We addressed this challenge in
part by examining similar indicators for other lakes which did not experience comparable draw-
downs to Lake Lanier. The Consultants also had to be especially diligent in applying economic
modeling techniques to avoid confusing wealth effects with annual income and output effects,
adjusting for the distinction between new economic activity and diversions of existing economic
activity, applying relevant local economic "capture" rates and appropriate regional multipliers. The
analysis also focused on measuring incremental changes rather than total impacts and emphasized
net economic impacts, i.e., the impacts that accrue to the region from spending which comes from
outside the region.
In addition to estimating economic impacts from recreational spending, the 1071 Coalition was also
interested in Lake Lanier’s current role as the primary source of municipal and industrial (M&I)
water supply for Metro-Atlanta. In exploring this issue, the Consultants reviewed prior studies
which addressed the same subject. The reports analyzed the cost of supplying replacement water
and the effects of resulting supply shortages on the regional and national economy. While the
studies were obviously prepared at different times and modeled different scenarios of future water
supply shortages in Metro-Atlanta, the resulting economic impact estimates were reasonably
consistent. Rather than develop another analysis and methodology to address this same this issue,
the Consultants summarized and compared the prior studies and discuss the resulting economic
impacts on the region.
D. Organization of the Report The remainder of this report is organized around the above methodology and is presented in four
main sections. The following Section II provides background information and an overview of the
Lake Lanier Region. It presents the primary research and data collection that was conducted for the
Final Report LAKE SIDNEY LANIER ECONOMIC IMPACT ANALYSIS
Introduction 21
analysis. The next section provides background and summary statistics on the spending patterns of
residents and visitors as estimated through USACE surveys and the Consultants’ own survey results.
Economic impact estimates are then presented in Section IV. The final section of the report
addresses the broader water supply and regional equity issues that were assembled primarily from
the review of prior research prepared by others. A summary of the report’s findings and conclusions
is also presented at the beginning of the report.
Final Report LAKE SIDNEY LANIER ECONOMIC IMPACT ANALYSIS
Background and Historical Trends 22
II. Background and Trends
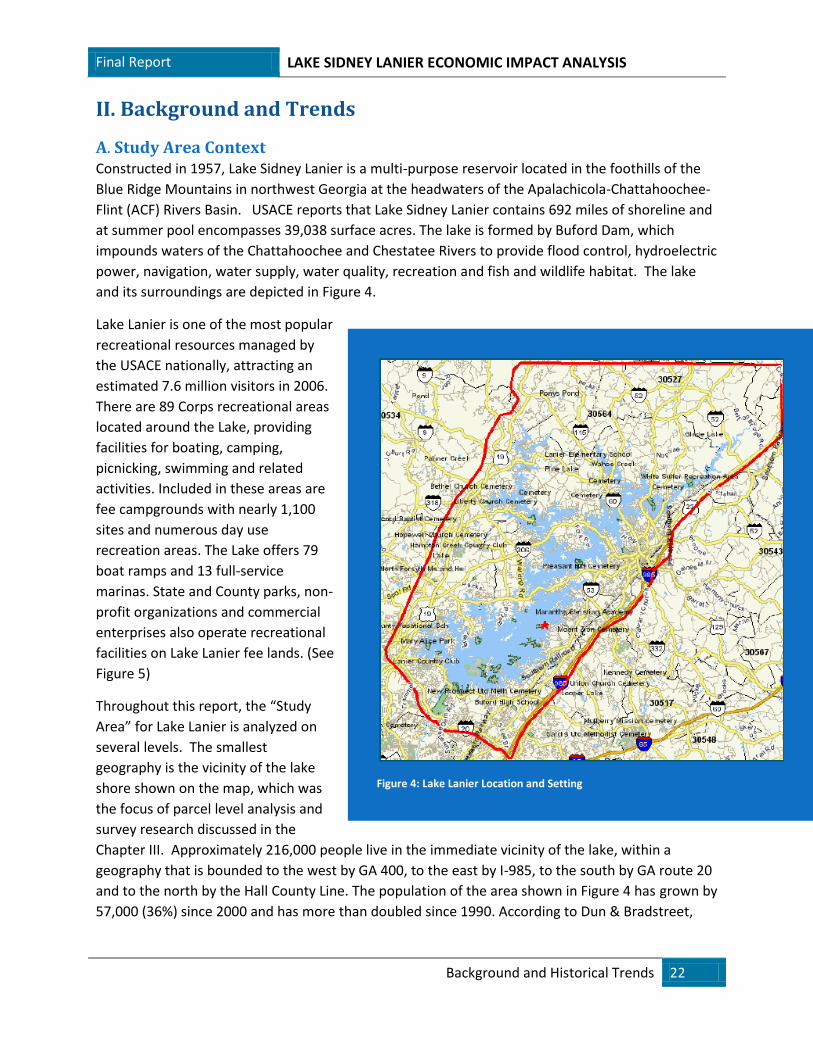
A. Study Area Context Constructed in 1957, Lake Sidney Lanier is a multi-purpose reservoir located in the foothills of the
Blue Ridge Mountains in northwest Georgia at the headwaters of the Apalachicola-Chattahoochee-
Flint (ACF) Rivers Basin. USACE reports that Lake Sidney Lanier contains 692 miles of shoreline and
at summer pool encompasses 39,038 surface acres. The lake is formed by Buford Dam, which
impounds waters of the Chattahoochee and Chestatee Rivers to provide flood control, hydroelectric
power, navigation, water supply, water quality, recreation and fish and wildlife habitat. The lake
and its surroundings are depicted in Figure 4.
Lake Lanier is one of the most popular
recreational resources managed by
the USACE nationally, attracting an
estimated 7.6 million visitors in 2006.
There are 89 Corps recreational areas
located around the Lake, providing
facilities for boating, camping,
picnicking, swimming and related
activities. Included in these areas are
fee campgrounds with nearly 1,100
sites and numerous day use
recreation areas. The Lake offers 79
boat ramps and 13 full-service
marinas. State and County parks, non-
profit organizations and commercial
enterprises also operate recreational
facilities on Lake Lanier fee lands. (See
Figure 5)
Throughout this report, the “Study
Area” for Lake Lanier is analyzed on
several levels. The smallest
geography is the vicinity of the lake
shore shown on the map, which was
the focus of parcel level analysis and
survey research discussed in the
Chapter III. Approximately 216,000 people live in the immediate vicinity of the lake, within a
geography that is bounded to the west by GA 400, to the east by I-985, to the south by GA route 20
and to the north by the Hall County Line. The population of the area shown in Figure 4 has grown by
57,000 (36%) since 2000 and has more than doubled since 1990. According to Dun & Bradstreet,
Figure 4: Lake Lanier Location and Setting
Final Report LAKE SIDNEY LANIER ECONOMIC IMPACT ANALYSIS
Background and Historical Trends 23
“lake dependent” businesses located within the 11 zip codes bordering Lake Lanier employ more
than 133,300 people.
The primary focus of this report are Hall, Forsyth, Gwinnett, Dawson and Lumpkin Counties, which
border the lake and contain the majority of the businesses and properties which are most
dependent upon and directly impacted by the resource. These counties include and extend well
beyond the boundaries shown in Figure 4 and contain a 2009 population of more than 1.2 million
according to U.S. Census Bureau estimates. This population of this larger region has grown by more
than 357,000 (41.4%) since 2000.
One of the reasons for the
lake’s popularity is its proximity
to metropolitan Atlanta. USACE
estimates that Lake Lanier
serves an even larger visitor
market area that consists of
sixteen counties located within
an approximate 30-mile radius.
This radius includes a large
portion of Metro-Atlanta,
including the five bordering
counties plus heavily populated
DeKalb County to the south.2
Compared to populations and
economies surrounding most
Corps projects, this is an
unusually large and diverse
region that contains a
population of more than 2.1
million.
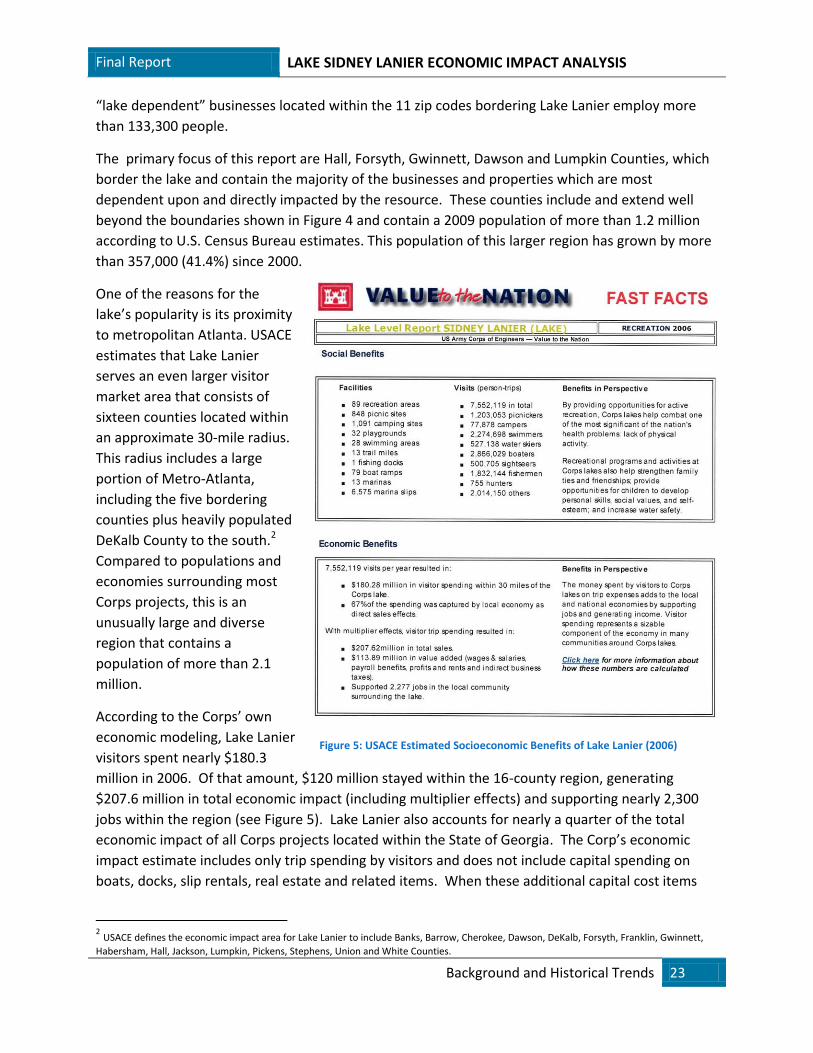
According to the Corps’ own
economic modeling, Lake Lanier
visitors spent nearly $180.3
million in 2006. Of that amount, $120 million stayed within the 16-county region, generating
$207.6 million in total economic impact (including multiplier effects) and supporting nearly 2,300
jobs within the region (see Figure 5). Lake Lanier also accounts for nearly a quarter of the total
economic impact of all Corps projects located within the State of Georgia. The Corp’s economic
impact estimate includes only trip spending by visitors and does not include capital spending on
boats, docks, slip rentals, real estate and related items. When these additional capital cost items
2 USACE defines the economic impact area for Lake Lanier to include Banks, Barrow, Cherokee, Dawson, DeKalb, Forsyth, Franklin, Gwinnett,
Habersham, Hall, Jackson, Lumpkin, Pickens, Stephens, Union and White Counties.
Figure 5: USACE Estimated Socioeconomic Benefits of Lake Lanier (2006)
Final Report LAKE SIDNEY LANIER ECONOMIC IMPACT ANALYSIS
Background and Historical Trends 24
are considered, the Consultants estimate that the Lake’s local economic impact may have reached
$232.4 million in 2007 and supported nearly 5,200 jobs. The economic impacts of Lake Lanier on
this region are addressed further in Chapters III and IV.
The largest study area addressed in this report is the ACF Rivers Basin, which touches 68 counties in
three states and in includes the Atlanta Metropolitan Statistical Area (MSA) and its population of
roughly 4.5 million. The entire ACF Basin contains an estimated 2009 population of nearly 6.6
million people, including 5.8 million Georgians. Economic characteristics of the ACF Basin are
discussed in Chapter V.
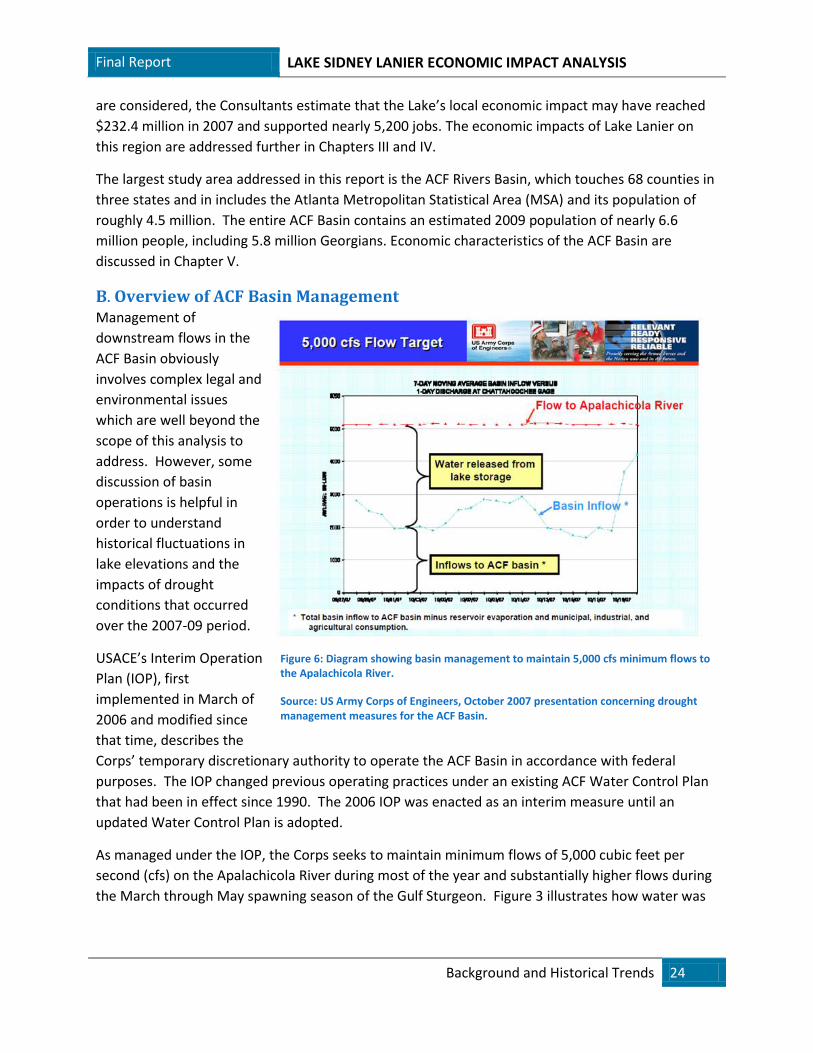
B. Overview of ACF Basin Management Management of
downstream flows in the
ACF Basin obviously
involves complex legal and
environmental issues
which are well beyond the
scope of this analysis to
address. However, some
discussion of basin
operations is helpful in
order to understand
historical fluctuations in
lake elevations and the
impacts of drought
conditions that occurred
over the 2007-09 period.
USACE’s Interim Operation
Plan (IOP), first
implemented in March of
2006 and modified since
that time, describes the
Corps’ temporary discretionary authority to operate the ACF Basin in accordance with federal
purposes. The IOP changed previous operating practices under an existing ACF Water Control Plan
that had been in effect since 1990. The 2006 IOP was enacted as an interim measure until an
updated Water Control Plan is adopted.
As managed under the IOP, the Corps seeks to maintain minimum flows of 5,000 cubic feet per
second (cfs) on the Apalachicola River during most of the year and substantially higher flows during
the March through May spawning season of the Gulf Sturgeon. Figure 3 illustrates how water was
Figure 6: Diagram showing basin management to maintain 5,000 cfs minimum flows to the Apalachicola River.
Source: US Army Corps of Engineers, October 2007 presentation concerning drought management measures for the ACF Basin.
Final Report LAKE SIDNEY LANIER ECONOMIC IMPACT ANALYSIS
Background and Historical Trends 25
released from storage during 2007 when basin inflows were insufficient to maintain this minimum
5,000 cfs flow.3
Implementation of the new IOP corresponded to the beginning of a prolonged and severe drought.
Environmental engineers in the Georgia Environmental Protection Division-Hydrology Unit
characterized the original IOP adopted in 2006 as a “significant deviation” from operating practices
prior to that time, because it did not allow as much opportunity for reservoirs to refill during the
wetter spring months.4 As a result of drought conditions that existed in 2007, an estimated 850,000
acre-feet or 52% of the total storage capacity in the ACF Basin was depleted between May and
November of that year. By mid-November only 32% of the total conservation storage was left in
the ACF Reservoirs. Nearly all of the effective conservation storage capacity behind the West Point
and W.F. George dams was exhausted, leaving Lake Lanier as the only remaining source of
withdrawals to maintain minimum flows to the Apalachicola River. Lake Lanier reached its historical
low point in terms of elevation in late December of 2007 and remained well below pool throughout
most of the 2008 boating season.
Faced with the possible catastrophic loss of all remaining conservation storage, USACE ordered the
“suspension of downramping rates” on October 19, 2007 and began a “reevaluation of minimum
flow to the Apalachicola.” USACE issued an Exceptional Drought Operations (EDO) Plan and
temporary reduced minimum inflows to the Apalachicola River to 4,750 cfs, with authority to limit
releases to 4,500 cfs or possibly lower if necessary under extreme circumstances. USACE issued a
revision of the IOP in April of 2008 (MIOP), which incorporated contingencies for responding to
future drought conditions and provided greater opportunity for reservoirs to refill from December
through February. In June of 2008, The U.S. Fish & Wildlife Service issued a “Biological Opinion”
that the Corps proposed action would have adverse effects, but would not jeopardize the continued
existence of the listed species, nor adversely modify their critical habitat.5
A Congressional Research Service (CRS) Report, issued in November 2007, characterized the Corps’
argument for implementing the EDO as follows: “a justification provided for the lower minimum
flows below Woodruff Dam is to lessen the risk of much lower flows in later years, if the drought
continues. In effect, the EDO would risk harm to the species now, to reduce the risk of greater harm
later (emphasis added).”6 Fortunately, drought conditions eased in early 2008 and higher rainfall
enabled the ACF reservoirs to recover 70% of conservation storage during the latter half of 2008
and return to full pool by the end of 2009, rendering the more difficult tradeoffs in the EDO
unnecessary in the short term.
3 USACE, “Description of Proposed Action Modification to the Interim Operations Plan at Jim Woodruff Dam,” April 2008, p.7.
4 Zeng, Wei, Jaing, Feng and Zhang, Yi, “Reservoir Management in the ACF River System Under the Interim Operation Plan (IOP) During the
Ongoing Drought”, Proceedings from the 2009 Georgia Water Resources Conference, April 27-29, 2009. 5 U.S. Fish & Wildlife Service, Southeast Region, “Key Points in the Consultation on the ACF Revised Interim Operating Plan
Apalachicola/Chattahoochee/Flint River Basin,” June 2, 2008.
6 Carter, Nicole T., Corn, M. Lynne, Abel, Amy et.al. (2007). ”Apalachicola-Chattahoochee-Flint (ACF) Drought: Federal Reservoir and Species
Management,” Congressional Research Service, p9.
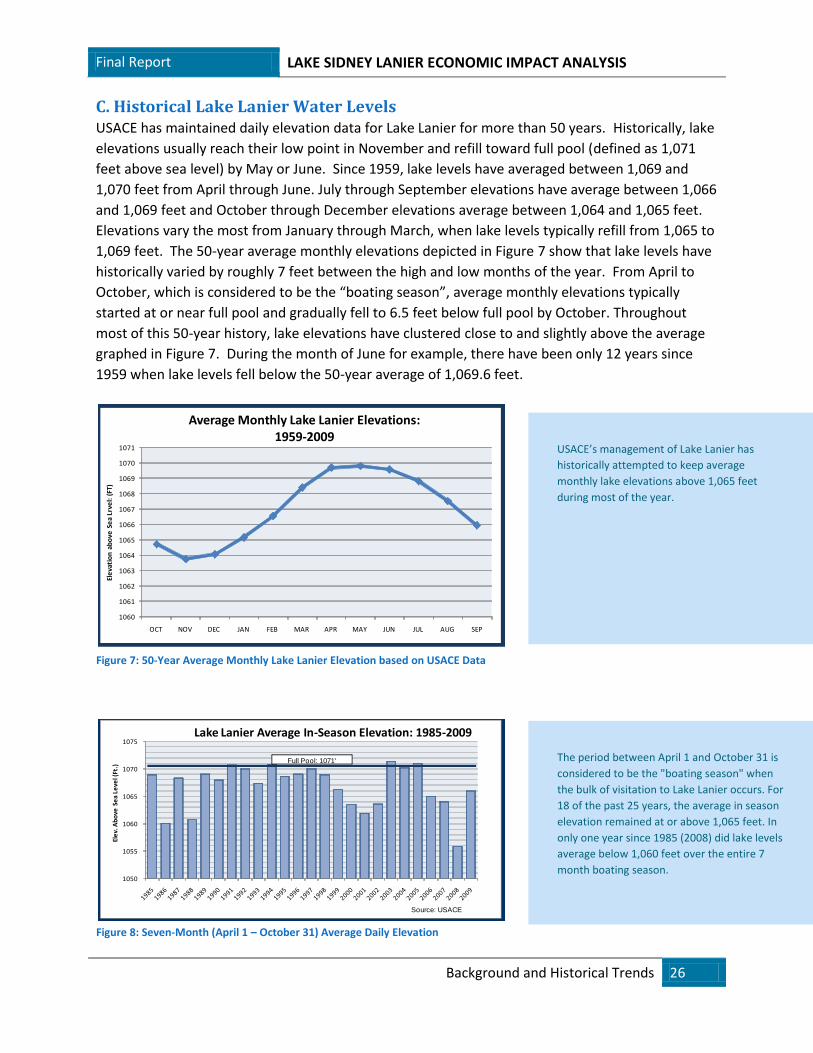
Final Report LAKE SIDNEY LANIER ECONOMIC IMPACT ANALYSIS
Background and Historical Trends 26
1050
1055
1060
1065
1070
1075
Ele
v. A
bo
ve S
ea
Leve
l (Ft
.)
Lake Lanier Average In-Season Elevation: 1985-2009
Source: USACE
Full Pool: 1071'
1060
1061
1062
1063
1064
1065
1066
1067
1068
1069
1070
1071
OCT NOV DEC JAN FEB MAR APR MAY JUN JUL AUG SEP
Ele
vati
on
ab
ove
Se
a Lr
vel:
(FT
)
Average Monthly Lake Lanier Elevations: 1959-2009
C. Historical Lake Lanier Water Levels USACE has maintained daily elevation data for Lake Lanier for more than 50 years. Historically, lake
elevations usually reach their low point in November and refill toward full pool (defined as 1,071
feet above sea level) by May or June. Since 1959, lake levels have averaged between 1,069 and
1,070 feet from April through June. July through September elevations have average between 1,066
and 1,069 feet and October through December elevations average between 1,064 and 1,065 feet.
Elevations vary the most from January through March, when lake levels typically refill from 1,065 to
1,069 feet. The 50-year average monthly elevations depicted in Figure 7 show that lake levels have
historically varied by roughly 7 feet between the high and low months of the year. From April to
October, which is considered to be the “boating season”, average monthly elevations typically
started at or near full pool and gradually fell to 6.5 feet below full pool by October. Throughout
most of this 50-year history, lake elevations have clustered close to and slightly above the average
graphed in Figure 7. During the month of June for example, there have been only 12 years since
1959 when lake levels fell below the 50-year average of 1,069.6 feet.
USACE’s management of Lake Lanier has
historically attempted to keep average
monthly lake elevations above 1,065 feet
during most of the year.
Figure 8: Seven-Month (April 1 – October 31) Average Daily Elevation
Figure 7: 50-Year Average Monthly Lake Lanier Elevation based on USACE Data
The period between April 1 and October 31 is
considered to be the "boating season" when
the bulk of visitation to Lake Lanier occurs. For
18 of the past 25 years, the average in season
elevation remained at or above 1,065 feet. In
only one year since 1985 (2008) did lake levels
average below 1,060 feet over the entire 7
month boating season.
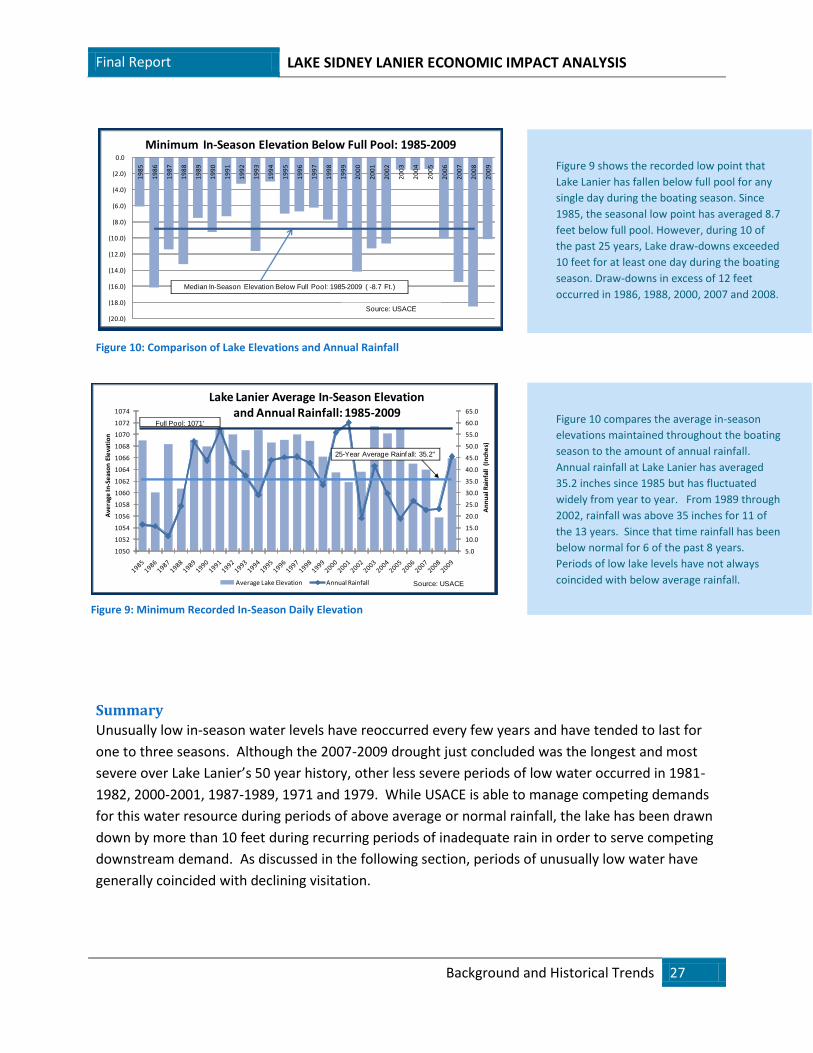
Final Report LAKE SIDNEY LANIER ECONOMIC IMPACT ANALYSIS
Background and Historical Trends 27
Figure 9 shows the recorded low point that
Lake Lanier has fallen below full pool for any
single day during the boating season. Since
1985, the seasonal low point has averaged 8.7
feet below full pool. However, during 10 of
the past 25 years, Lake draw-downs exceeded
10 feet for at least one day during the boating
season. Draw-downs in excess of 12 feet
occurred in 1986, 1988, 2000, 2007 and 2008.
At more than 18 feet, draw-downs during the
2008 boating season were by far the lowest
over the past 25 years.
5.0
10.0
15.0
20.0
25.0
30.0
35.0
40.0
45.0
50.0
55.0
60.0
65.0
1050
1052
1054
1056
1058
1060
1062
1064
1066
1068
1070
1072
1074
An
nu
al R
ain
fall
(In
che
s)
Ave
rage
In-S
eas
on
Ele
vati
on
Lake Lanier Average In-Season Elevation and Annual Rainfall: 1985-2009
Average Lake Elevation Annual Rainfall Source: USACE
Full Pool: 1071'
25-Year Average Rainfall: 35.2"
(20.0)
(18.0)
(16.0)
(14.0)
(12.0)
(10.0)
(8.0)
(6.0)
(4.0)
(2.0)
0.0
19
85
19
86
19
87
19
88
19
89
19
90
19
91
19
92
19
93
19
94
19
95
19
96
19
97
19
98
19
99
20
00
20
01
20
02
20
03
20
04
20
05
20
06
20
07
20
08
20
09
Minimum In-Season Elevation Below Full Pool: 1985-2009
Median In-Season Elevation Below Full Pool: 1985-2009 ( -8.7 Ft.)
Source: USACE
Summary
Unusually low in-season water levels have reoccurred every few years and have tended to last for
one to three seasons. Although the 2007-2009 drought just concluded was the longest and most
severe over Lake Lanier’s 50 year history, other less severe periods of low water occurred in 1981-
1982, 2000-2001, 1987-1989, 1971 and 1979. While USACE is able to manage competing demands
for this water resource during periods of above average or normal rainfall, the lake has been drawn
down by more than 10 feet during recurring periods of inadequate rain in order to serve competing
downstream demand. As discussed in the following section, periods of unusually low water have
generally coincided with declining visitation.
Figure 9: Minimum Recorded In-Season Daily Elevation
Figure 10: Comparison of Lake Elevations and Annual Rainfall
Figure 10 compares the average in-season
elevations maintained throughout the boating
season to the amount of annual rainfall.
Annual rainfall at Lake Lanier has averaged
35.2 inches since 1985 but has fluctuated
widely from year to year. From 1989 through
2002, rainfall was above 35 inches for 11 of
the 13 years. Since that time rainfall has been
below normal for 6 of the past 8 years.
Periods of low lake levels have not always
coincided with below average rainfall.
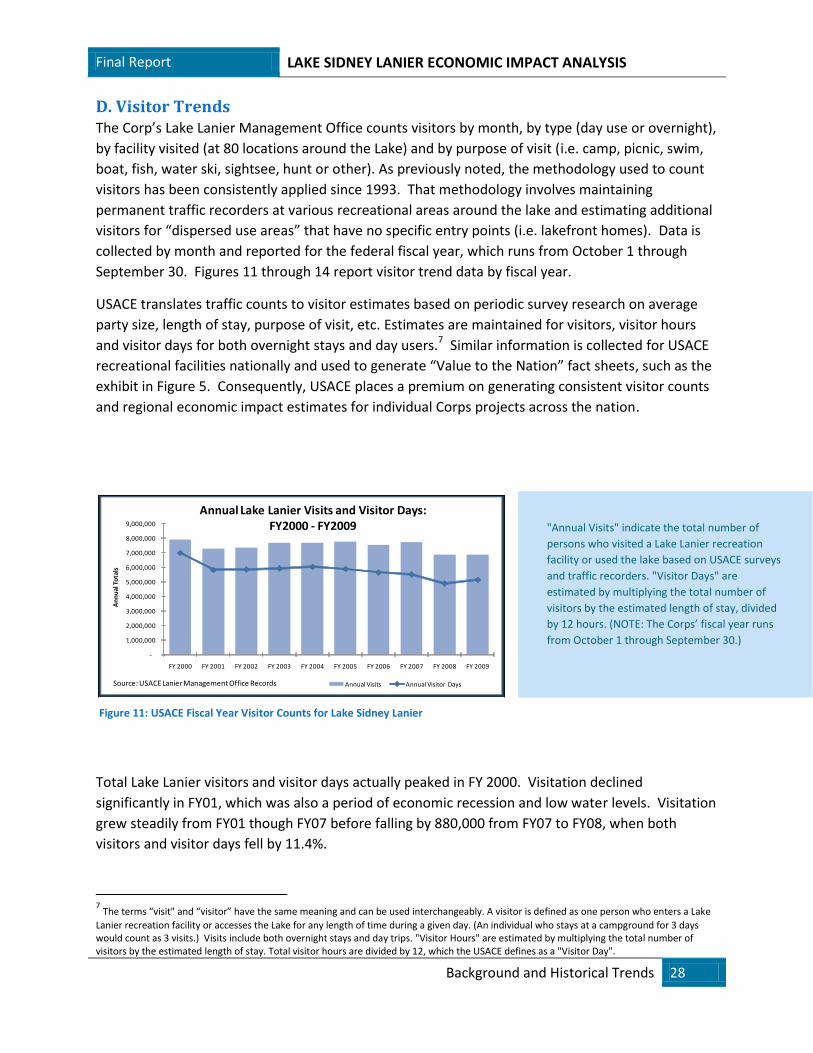
Final Report LAKE SIDNEY LANIER ECONOMIC IMPACT ANALYSIS
Background and Historical Trends 28
-
1,000,000
2,000,000
3,000,000
4,000,000
5,000,000
6,000,000
7,000,000
8,000,000
9,000,000
FY 2000 FY 2001 FY 2002 FY 2003 FY 2004 FY 2005 FY 2006 FY 2007 FY 2008 FY 2009
An
nu
al T
ota
ls
Annual Lake Lanier Visits and Visitor Days: FY2000 - FY2009
Annual Visits Annual Visitor DaysSource: USACE Lanier Management Office Records
D. Visitor Trends The Corp’s Lake Lanier Management Office counts visitors by month, by type (day use or overnight),
by facility visited (at 80 locations around the Lake) and by purpose of visit (i.e. camp, picnic, swim,
boat, fish, water ski, sightsee, hunt or other). As previously noted, the methodology used to count
visitors has been consistently applied since 1993. That methodology involves maintaining
permanent traffic recorders at various recreational areas around the lake and estimating additional
visitors for “dispersed use areas” that have no specific entry points (i.e. lakefront homes). Data is
collected by month and reported for the federal fiscal year, which runs from October 1 through
September 30. Figures 11 through 14 report visitor trend data by fiscal year.
USACE translates traffic counts to visitor estimates based on periodic survey research on average
party size, length of stay, purpose of visit, etc. Estimates are maintained for visitors, visitor hours
and visitor days for both overnight stays and day users.7 Similar information is collected for USACE
recreational facilities nationally and used to generate “Value to the Nation” fact sheets, such as the
exhibit in Figure 5. Consequently, USACE places a premium on generating consistent visitor counts
and regional economic impact estimates for individual Corps projects across the nation.
Total Lake Lanier visitors and visitor days actually peaked in FY 2000. Visitation declined
significantly in FY01, which was also a period of economic recession and low water levels. Visitation
grew steadily from FY01 though FY07 before falling by 880,000 from FY07 to FY08, when both
visitors and visitor days fell by 11.4%.
7 The terms “visit" and “visitor” have the same meaning and can be used interchangeably. A visitor is defined as one person who enters a Lake
Lanier recreation facility or accesses the Lake for any length of time during a given day. (An individual who stays at a campground for 3 days would count as 3 visits.) Visits include both overnight stays and day trips. "Visitor Hours" are estimated by multiplying the total number of visitors by the estimated length of stay. Total visitor hours are divided by 12, which the USACE defines as a "Visitor Day".
"Annual Visits" indicate the total number of
persons who visited a Lake Lanier recreation
facility or used the lake based on USACE surveys
and traffic recorders. "Visitor Days" are
estimated by multiplying the total number of
visitors by the estimated length of stay, divided
by 12 hours. (NOTE: The Corps’ fiscal year runs
from October 1 through September 30.)
Figure 11: USACE Fiscal Year Visitor Counts for Lake Sidney Lanier
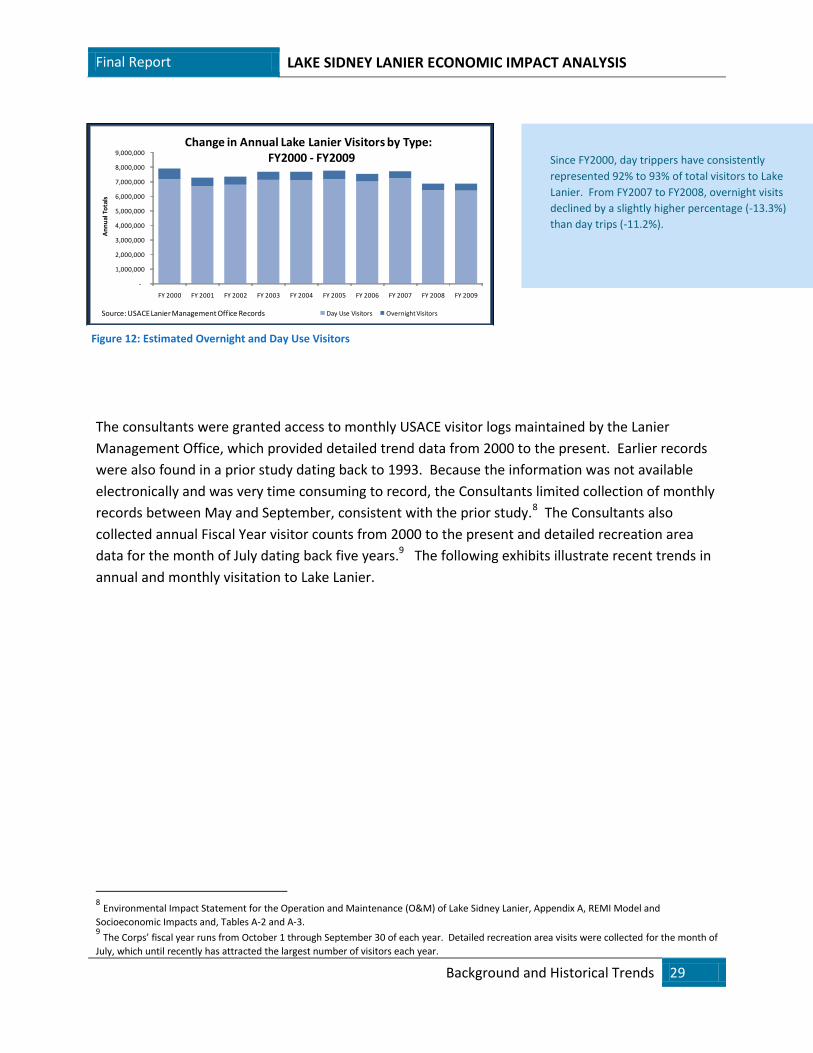
Final Report LAKE SIDNEY LANIER ECONOMIC IMPACT ANALYSIS
Background and Historical Trends 29
-
1,000,000
2,000,000
3,000,000
4,000,000
5,000,000
6,000,000
7,000,000
8,000,000
9,000,000
FY 2000 FY 2001 FY 2002 FY 2003 FY 2004 FY 2005 FY 2006 FY 2007 FY 2008 FY 2009
An
nu
al T
ota
ls
Change in Annual Lake Lanier Visitors by Type:FY2000 - FY2009
Day Use Visitors Overnight VisitorsSource: USACE Lanier Management Office Records
The consultants were granted access to monthly USACE visitor logs maintained by the Lanier
Management Office, which provided detailed trend data from 2000 to the present. Earlier records
were also found in a prior study dating back to 1993. Because the information was not available
electronically and was very time consuming to record, the Consultants limited collection of monthly
records between May and September, consistent with the prior study.8 The Consultants also
collected annual Fiscal Year visitor counts from 2000 to the present and detailed recreation area
data for the month of July dating back five years.9 The following exhibits illustrate recent trends in
annual and monthly visitation to Lake Lanier.
8 Environmental Impact Statement for the Operation and Maintenance (O&M) of Lake Sidney Lanier, Appendix A, REMI Model and
Socioeconomic Impacts and, Tables A-2 and A-3. 9 The Corps’ fiscal year runs from October 1 through September 30 of each year. Detailed recreation area visits were collected for the month of
July, which until recently has attracted the largest number of visitors each year.
Figure 12: Estimated Overnight and Day Use Visitors
Since FY2000, day trippers have consistently
represented 92% to 93% of total visitors to Lake
Lanier. From FY2007 to FY2008, overnight visits
declined by a slightly higher percentage (-13.3%)
than day trips (-11.2%).
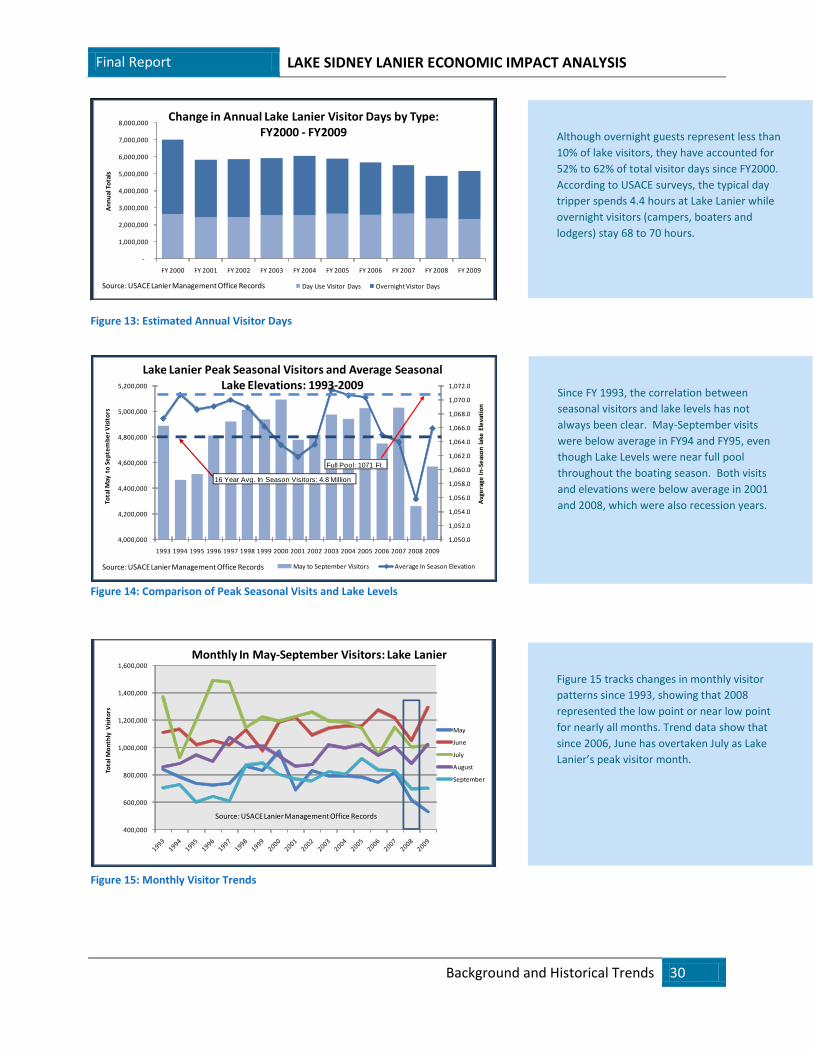
Final Report LAKE SIDNEY LANIER ECONOMIC IMPACT ANALYSIS
Background and Historical Trends 30
-
1,000,000
2,000,000
3,000,000
4,000,000
5,000,000
6,000,000
7,000,000
8,000,000
FY 2000 FY 2001 FY 2002 FY 2003 FY 2004 FY 2005 FY 2006 FY 2007 FY 2008 FY 2009
An
nu
al T
ota
ls
Change in Annual Lake Lanier Visitor Days by Type:FY2000 - FY2009
Day Use Visitor Days Overnight Visitor DaysSource: USACE Lanier Management Office Records
1,050.0
1,052.0
1,054.0
1,056.0
1,058.0
1,060.0
1,062.0
1,064.0
1,066.0
1,068.0
1,070.0
1,072.0
4,000,000
4,200,000
4,400,000
4,600,000
4,800,000
5,000,000
5,200,000
1993 1994 1995 1996 1997 1998 1999 2000 2001 2002 2003 2004 2005 2006 2007 2008 2009
Avg
era
ge I
n-S
eas
on
lak
e E
leva
tio
n
Tota
l May
to
Se
pte
mb
er
Vis
ito
rs
Lake Lanier Peak Seasonal Visitors and Average Seasonal Lake Elevations: 1993-2009
May to September Visitors Average In Season ElevationSource: USACE Lanier Management Office Records
16 Year Avg. In Season Visitors: 4.8 Million
Full Pool: 1071 Ft.
400,000
600,000
800,000
1,000,000
1,200,000
1,400,000
1,600,000
Tota
l Mo
nth
ly V
isit
ors
Monthly In May-September Visitors: Lake Lanier
May
June
July
August
September
Source: USACE Lanier Management Office Records
Figure 13: Estimated Annual Visitor Days
Figure 14: Comparison of Peak Seasonal Visits and Lake Levels
Figure 15: Monthly Visitor Trends
Although overnight guests represent less than
10% of lake visitors, they have accounted for
52% to 62% of total visitor days since FY2000.
According to USACE surveys, the typical day
tripper spends 4.4 hours at Lake Lanier while
overnight visitors (campers, boaters and
lodgers) stay 68 to 70 hours.
Since FY 1993, the correlation between
seasonal visitors and lake levels has not
always been clear. May-September visits
were below average in FY94 and FY95, even
though Lake Levels were near full pool
throughout the boating season. Both visits
and elevations were below average in 2001
and 2008, which were also recession years.
Figure 15 tracks changes in monthly visitor
patterns since 1993, showing that 2008
represented the low point or near low point
for nearly all months. Trend data show that
since 2006, June has overtaken July as Lake
Lanier’s peak visitor month.
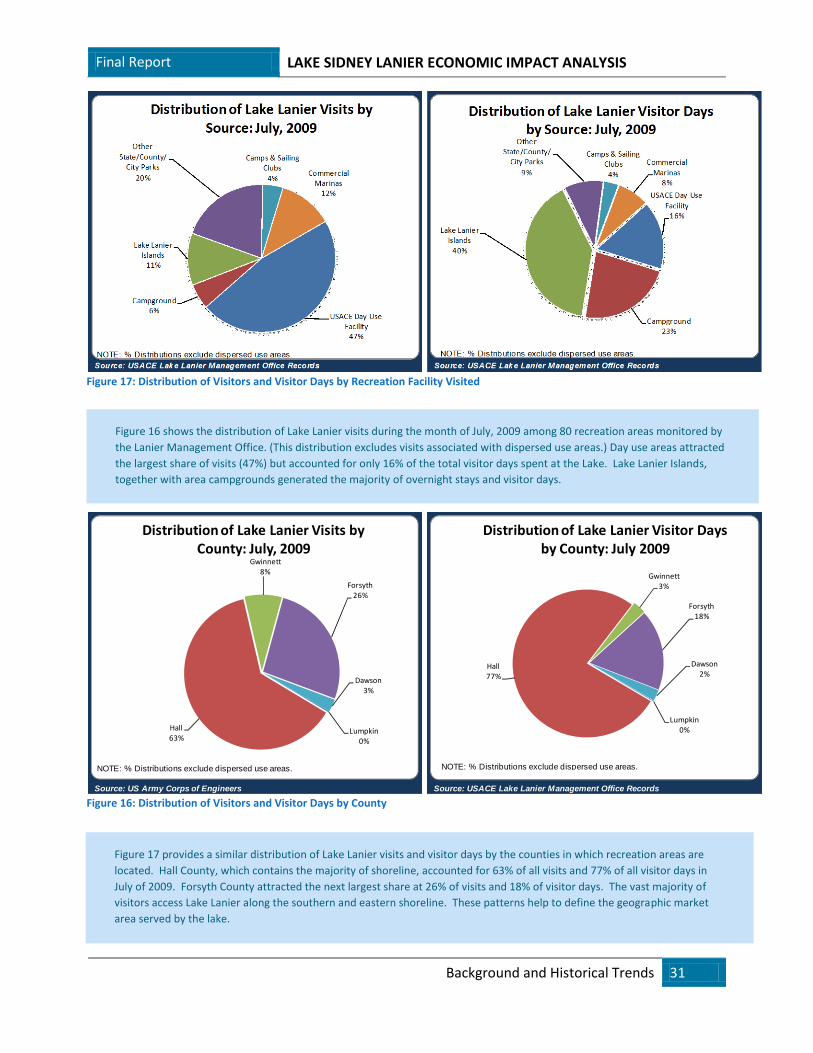
Final Report LAKE SIDNEY LANIER ECONOMIC IMPACT ANALYSIS
Background and Historical Trends 31
Source: USACE Lake Lanier Management Office Records
Lumpkin 0%
Hall77%
Gwinnett3%
Forsyth18%
Dawson2%
Distribution of Lake Lanier Visitor Days by County: July 2009
NOTE: % Distributions exclude dispersed use areas.
Source: US Army Corps of Engineers
Lumpkin 0%
Hall63%
Gwinnett8%
Forsyth26%
Dawson3%
Distribution of Lake Lanier Visits by County: July, 2009
NOTE: % Distributions exclude dispersed use areas.
Figure 17 provides a similar distribution of Lake Lanier visits and visitor days by the counties in which recreation areas are
located. Hall County, which contains the majority of shoreline, accounted for 63% of all visits and 77% of all visitor days in
July of 2009. Forsyth County attracted the next largest share at 26% of visits and 18% of visitor days. The vast majority of
visitors access Lake Lanier along the southern and eastern shoreline. These patterns help to define the geographic market
area served by the lake.
Figure 16 shows the distribution of Lake Lanier visits during the month of July, 2009 among 80 recreation areas monitored by
the Lanier Management Office. (This distribution excludes visits associated with dispersed use areas.) Day use areas attracted
the largest share of visits (47%) but accounted for only 16% of the total visitor days spent at the Lake. Lake Lanier Islands,
together with area campgrounds generated the majority of overnight stays and visitor days.
Figure 16: Distribution of Visitors and Visitor Days by County
Figure 17: Distribution of Visitors and Visitor Days by Recreation Facility Visited
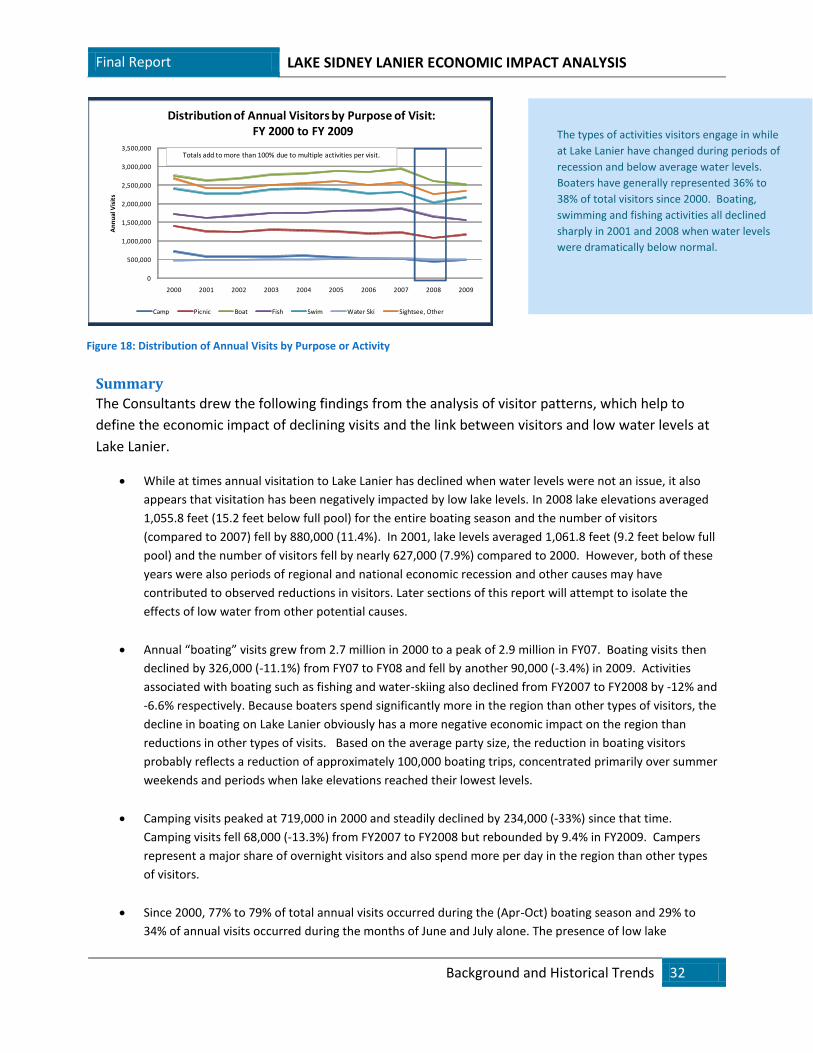
Final Report LAKE SIDNEY LANIER ECONOMIC IMPACT ANALYSIS
Background and Historical Trends 32
0
500,000
1,000,000
1,500,000
2,000,000
2,500,000
3,000,000
3,500,000
2000 2001 2002 2003 2004 2005 2006 2007 2008 2009
An
nu
al V
isit
sDistribution of Annual Visitors by Purpose of Visit:
FY 2000 to FY 2009
Camp Picnic Boat Fish Swim Water Ski Sightsee, Other
Totals add to more than 100% due to multiple activities per visit.
Summary
The Consultants drew the following findings from the analysis of visitor patterns, which help to
define the economic impact of declining visits and the link between visitors and low water levels at
Lake Lanier.
While at times annual visitation to Lake Lanier has declined when water levels were not an issue, it also
appears that visitation has been negatively impacted by low lake levels. In 2008 lake elevations averaged
1,055.8 feet (15.2 feet below full pool) for the entire boating season and the number of visitors
(compared to 2007) fell by 880,000 (11.4%). In 2001, lake levels averaged 1,061.8 feet (9.2 feet below full
pool) and the number of visitors fell by nearly 627,000 (7.9%) compared to 2000. However, both of these
years were also periods of regional and national economic recession and other causes may have
contributed to observed reductions in visitors. Later sections of this report will attempt to isolate the
effects of low water from other potential causes.
Annual “boating” visits grew from 2.7 million in 2000 to a peak of 2.9 million in FY07. Boating visits then
declined by 326,000 (-11.1%) from FY07 to FY08 and fell by another 90,000 (-3.4%) in 2009. Activities
associated with boating such as fishing and water-skiing also declined from FY2007 to FY2008 by -12% and
-6.6% respectively. Because boaters spend significantly more in the region than other types of visitors, the
decline in boating on Lake Lanier obviously has a more negative economic impact on the region than
reductions in other types of visits. Based on the average party size, the reduction in boating visitors
probably reflects a reduction of approximately 100,000 boating trips, concentrated primarily over summer
weekends and periods when lake elevations reached their lowest levels.
Camping visits peaked at 719,000 in 2000 and steadily declined by 234,000 (-33%) since that time.
Camping visits fell 68,000 (-13.3%) from FY2007 to FY2008 but rebounded by 9.4% in FY2009. Campers
represent a major share of overnight visitors and also spend more per day in the region than other types
of visitors.
Since 2000, 77% to 79% of total annual visits occurred during the (Apr-Oct) boating season and 29% to
34% of annual visits occurred during the months of June and July alone. The presence of low lake
Figure 18: Distribution of Annual Visits by Purpose or Activity
The types of activities visitors engage in while
at Lake Lanier have changed during periods of
recession and below average water levels.
Boaters have generally represented 36% to
38% of total visitors since 2000. Boating,
swimming and fishing activities all declined
sharply in 2001 and 2008 when water levels
were dramatically below normal.
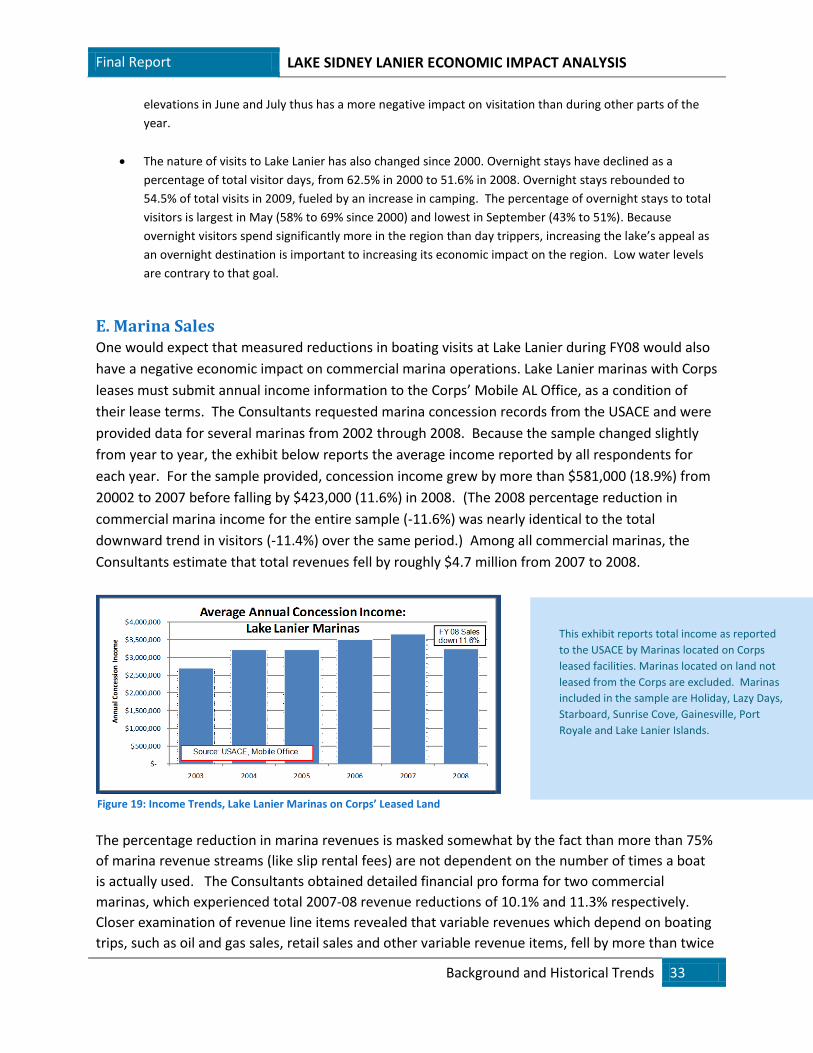
Final Report LAKE SIDNEY LANIER ECONOMIC IMPACT ANALYSIS
Background and Historical Trends 33
elevations in June and July thus has a more negative impact on visitation than during other parts of the
year.
The nature of visits to Lake Lanier has also changed since 2000. Overnight stays have declined as a
percentage of total visitor days, from 62.5% in 2000 to 51.6% in 2008. Overnight stays rebounded to
54.5% of total visits in 2009, fueled by an increase in camping. The percentage of overnight stays to total
visitors is largest in May (58% to 69% since 2000) and lowest in September (43% to 51%). Because
overnight visitors spend significantly more in the region than day trippers, increasing the lake’s appeal as
an overnight destination is important to increasing its economic impact on the region. Low water levels
are contrary to that goal.
E. Marina Sales One would expect that measured reductions in boating visits at Lake Lanier during FY08 would also
have a negative economic impact on commercial marina operations. Lake Lanier marinas with Corps
leases must submit annual income information to the Corps’ Mobile AL Office, as a condition of
their lease terms. The Consultants requested marina concession records from the USACE and were
provided data for several marinas from 2002 through 2008. Because the sample changed slightly
from year to year, the exhibit below reports the average income reported by all respondents for
each year. For the sample provided, concession income grew by more than $581,000 (18.9%) from
20002 to 2007 before falling by $423,000 (11.6%) in 2008. (The 2008 percentage reduction in
commercial marina income for the entire sample (-11.6%) was nearly identical to the total
downward trend in visitors (-11.4%) over the same period.) Among all commercial marinas, the
Consultants estimate that total revenues fell by roughly $4.7 million from 2007 to 2008.
The percentage reduction in marina revenues is masked somewhat by the fact than more than 75%
of marina revenue streams (like slip rental fees) are not dependent on the number of times a boat
is actually used. The Consultants obtained detailed financial pro forma for two commercial
marinas, which experienced total 2007-08 revenue reductions of 10.1% and 11.3% respectively.
Closer examination of revenue line items revealed that variable revenues which depend on boating
trips, such as oil and gas sales, retail sales and other variable revenue items, fell by more than twice
This exhibit reports total income as reported
to the USACE by Marinas located on Corps
leased facilities. Marinas located on land not
leased from the Corps are excluded. Marinas
included in the sample are Holiday, Lazy Days,
Starboard, Sunrise Cove, Gainesville, Port
Royale and Lake Lanier Islands.
Figure 19: Income Trends, Lake Lanier Marinas on Corps’ Leased Land
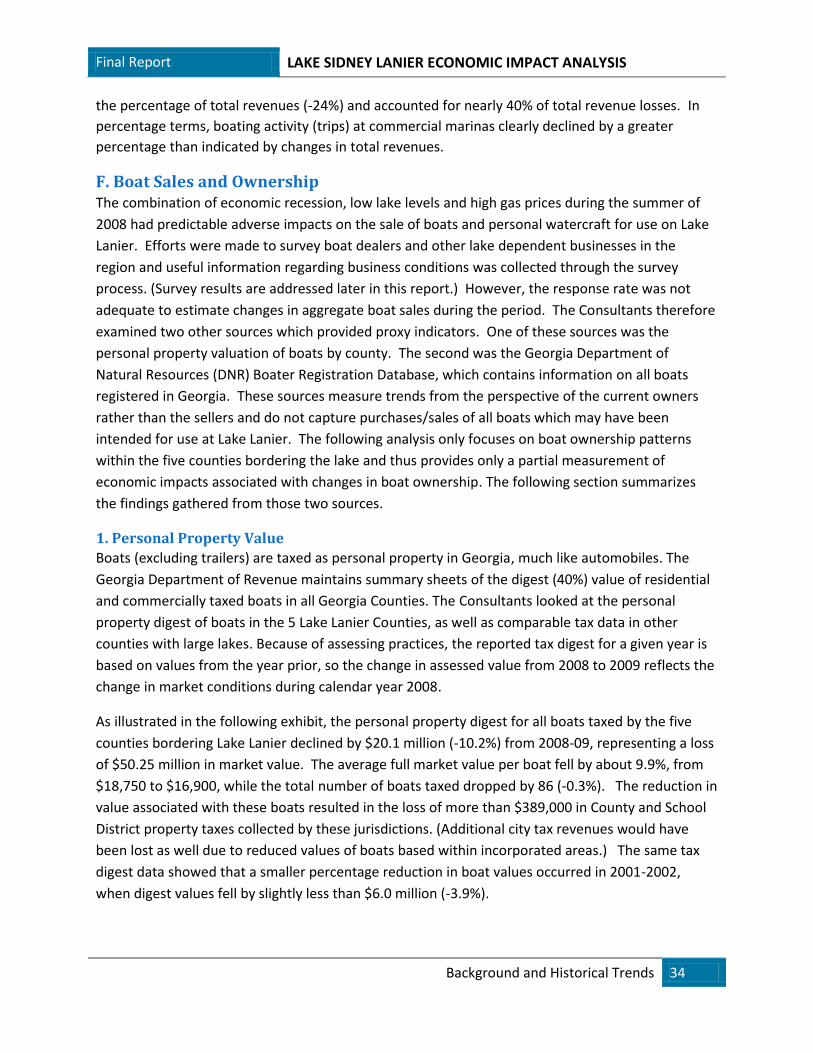
Final Report LAKE SIDNEY LANIER ECONOMIC IMPACT ANALYSIS
Background and Historical Trends 34
the percentage of total revenues (-24%) and accounted for nearly 40% of total revenue losses. In
percentage terms, boating activity (trips) at commercial marinas clearly declined by a greater
percentage than indicated by changes in total revenues.
F. Boat Sales and Ownership The combination of economic recession, low lake levels and high gas prices during the summer of
2008 had predictable adverse impacts on the sale of boats and personal watercraft for use on Lake
Lanier. Efforts were made to survey boat dealers and other lake dependent businesses in the
region and useful information regarding business conditions was collected through the survey
process. (Survey results are addressed later in this report.) However, the response rate was not
adequate to estimate changes in aggregate boat sales during the period. The Consultants therefore
examined two other sources which provided proxy indicators. One of these sources was the
personal property valuation of boats by county. The second was the Georgia Department of
Natural Resources (DNR) Boater Registration Database, which contains information on all boats
registered in Georgia. These sources measure trends from the perspective of the current owners
rather than the sellers and do not capture purchases/sales of all boats which may have been
intended for use at Lake Lanier. The following analysis only focuses on boat ownership patterns
within the five counties bordering the lake and thus provides only a partial measurement of
economic impacts associated with changes in boat ownership. The following section summarizes
the findings gathered from those two sources.
1. Personal Property Value
Boats (excluding trailers) are taxed as personal property in Georgia, much like automobiles. The
Georgia Department of Revenue maintains summary sheets of the digest (40%) value of residential
and commercially taxed boats in all Georgia Counties. The Consultants looked at the personal
property digest of boats in the 5 Lake Lanier Counties, as well as comparable tax data in other
counties with large lakes. Because of assessing practices, the reported tax digest for a given year is
based on values from the year prior, so the change in assessed value from 2008 to 2009 reflects the
change in market conditions during calendar year 2008.
As illustrated in the following exhibit, the personal property digest for all boats taxed by the five
counties bordering Lake Lanier declined by $20.1 million (-10.2%) from 2008-09, representing a loss
of $50.25 million in market value. The average full market value per boat fell by about 9.9%, from
$18,750 to $16,900, while the total number of boats taxed dropped by 86 (-0.3%). The reduction in
value associated with these boats resulted in the loss of more than $389,000 in County and School
District property taxes collected by these jurisdictions. (Additional city tax revenues would have
been lost as well due to reduced values of boats based within incorporated areas.) The same tax
digest data showed that a smaller percentage reduction in boat values occurred in 2001-2002,
when digest values fell by slightly less than $6.0 million (-3.9%).
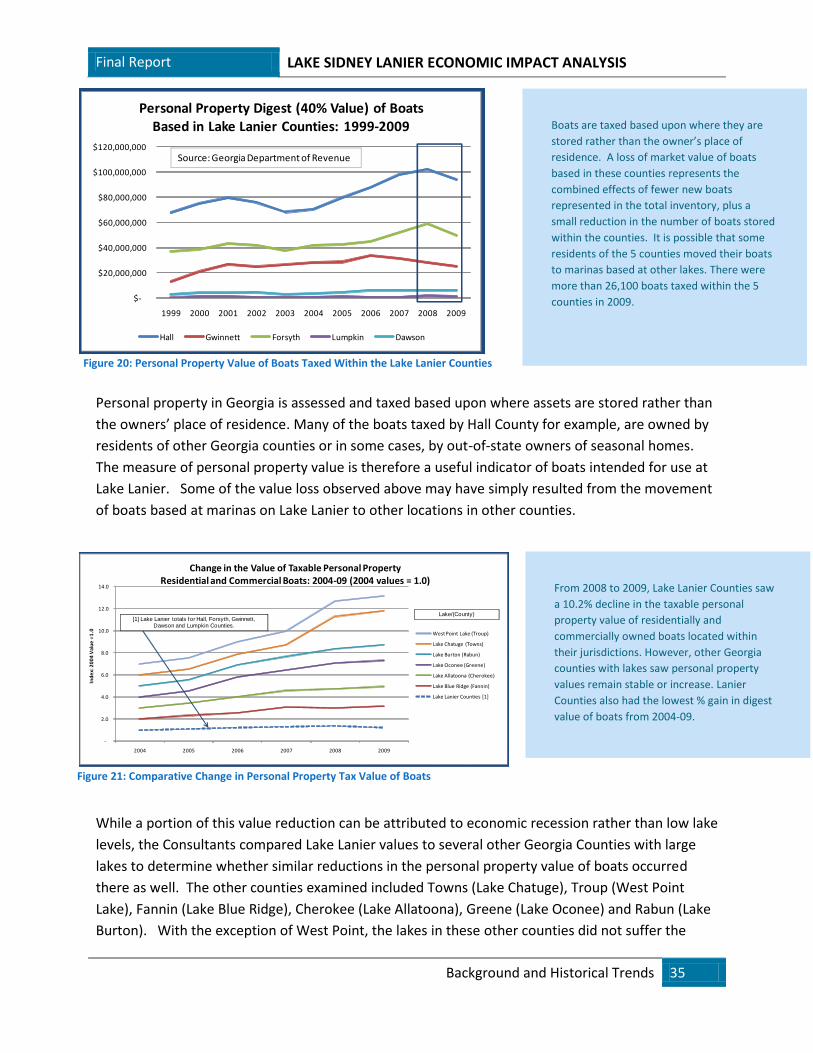
Final Report LAKE SIDNEY LANIER ECONOMIC IMPACT ANALYSIS
Background and Historical Trends 35
$-
$20,000,000
$40,000,000
$60,000,000
$80,000,000
$100,000,000
$120,000,000
1999 2000 2001 2002 2003 2004 2005 2006 2007 2008 2009
Personal Property Digest (40% Value) of Boats Based in Lake Lanier Counties: 1999-2009
Hall Gwinnett Forsyth Lumpkin Dawson
Source: Georgia Department of Revenue
-
2.0
4.0
6.0
8.0
10.0
12.0
14.0
2004 2005 2006 2007 2008 2009
Ind
ex:
20
04
Val
ue
=1
.0
Change in the Value of Taxable Personal PropertyResidential and Commercial Boats: 2004-09 (2004 values = 1.0)
West Point Lake (Troup)
Lake Chatuge (Towns)
Lake Burton (Rabun)
Lake Oconee (Greene)
Lake Allatoona (Cherokee)
Lake Blue Ridge (Fannin)
Lake Lanier Counties [1]
Lake/(County)[1] Lake Lanier totals for Hall, Forsyth, Gwinnett,
Dawson and Lumpkin Counties.
Personal property in Georgia is assessed and taxed based upon where assets are stored rather than
the owners’ place of residence. Many of the boats taxed by Hall County for example, are owned by
residents of other Georgia counties or in some cases, by out-of-state owners of seasonal homes.
The measure of personal property value is therefore a useful indicator of boats intended for use at
Lake Lanier. Some of the value loss observed above may have simply resulted from the movement
of boats based at marinas on Lake Lanier to other locations in other counties.
While a portion of this value reduction can be attributed to economic recession rather than low lake
levels, the Consultants compared Lake Lanier values to several other Georgia Counties with large
lakes to determine whether similar reductions in the personal property value of boats occurred
there as well. The other counties examined included Towns (Lake Chatuge), Troup (West Point
Lake), Fannin (Lake Blue Ridge), Cherokee (Lake Allatoona), Greene (Lake Oconee) and Rabun (Lake
Burton). With the exception of West Point, the lakes in these other counties did not suffer the
Boats are taxed based upon where they are
stored rather than the owner’s place of
residence. A loss of market value of boats
based in these counties represents the
combined effects of fewer new boats
represented in the total inventory, plus a
small reduction in the number of boats stored
within the counties. It is possible that some
residents of the 5 counties moved their boats
to marinas based at other lakes. There were
more than 26,100 boats taxed within the 5
counties in 2009.
Figure 20: Personal Property Value of Boats Taxed Within the Lake Lanier Counties
From 2008 to 2009, Lake Lanier Counties saw
a 10.2% decline in the taxable personal
property value of residentially and
commercially owned boats located within
their jurisdictions. However, other Georgia
counties with lakes saw personal property
values remain stable or increase. Lanier
Counties also had the lowest % gain in digest
value of boats from 2004-09.
Figure 21: Comparative Change in Personal Property Tax Value of Boats
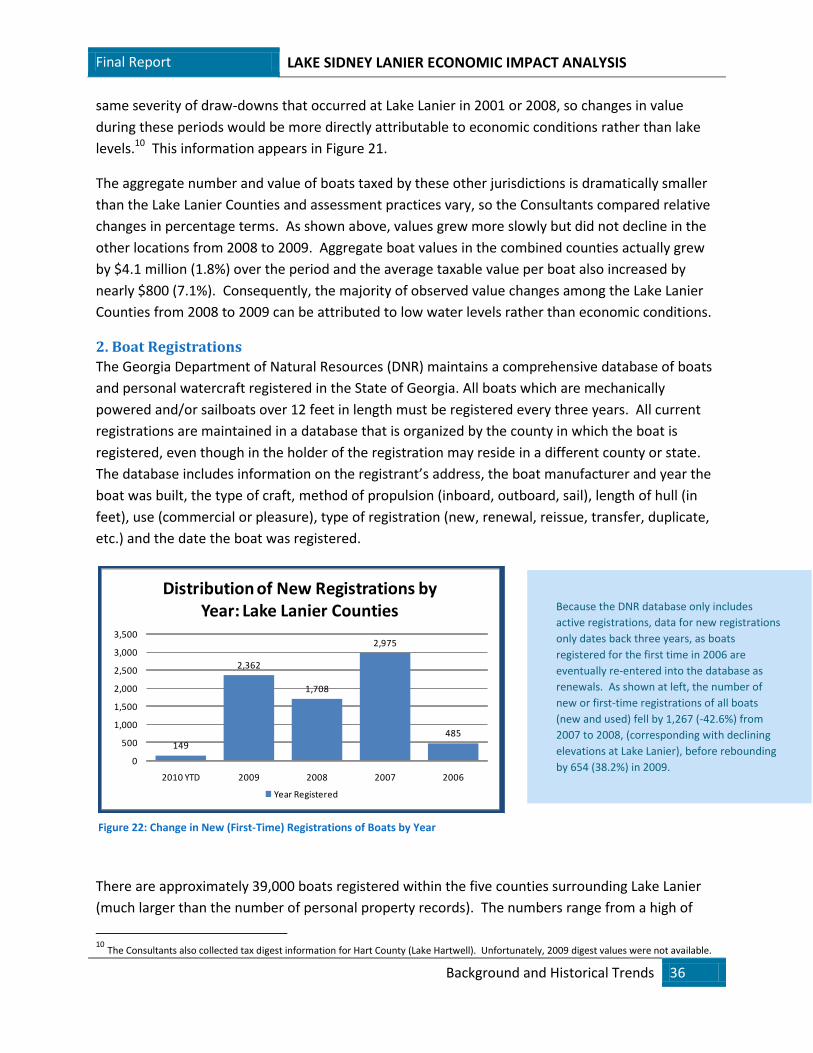
Final Report LAKE SIDNEY LANIER ECONOMIC IMPACT ANALYSIS
Background and Historical Trends 36
149
2,362
1,708
2,975
485
0
500
1,000
1,500
2,000
2,500
3,000
3,500
2010 YTD 2009 2008 2007 2006
Distribution of New Registrations by Year: Lake Lanier Counties
Year Registered
same severity of draw-downs that occurred at Lake Lanier in 2001 or 2008, so changes in value
during these periods would be more directly attributable to economic conditions rather than lake
levels.10 This information appears in Figure 21.
The aggregate number and value of boats taxed by these other jurisdictions is dramatically smaller
than the Lake Lanier Counties and assessment practices vary, so the Consultants compared relative
changes in percentage terms. As shown above, values grew more slowly but did not decline in the
other locations from 2008 to 2009. Aggregate boat values in the combined counties actually grew
by $4.1 million (1.8%) over the period and the average taxable value per boat also increased by
nearly $800 (7.1%). Consequently, the majority of observed value changes among the Lake Lanier
Counties from 2008 to 2009 can be attributed to low water levels rather than economic conditions.
2. Boat Registrations
The Georgia Department of Natural Resources (DNR) maintains a comprehensive database of boats
and personal watercraft registered in the State of Georgia. All boats which are mechanically
powered and/or sailboats over 12 feet in length must be registered every three years. All current
registrations are maintained in a database that is organized by the county in which the boat is
registered, even though in the holder of the registration may reside in a different county or state.
The database includes information on the registrant’s address, the boat manufacturer and year the
boat was built, the type of craft, method of propulsion (inboard, outboard, sail), length of hull (in
feet), use (commercial or pleasure), type of registration (new, renewal, reissue, transfer, duplicate,
etc.) and the date the boat was registered.
There are approximately 39,000 boats registered within the five counties surrounding Lake Lanier
(much larger than the number of personal property records). The numbers range from a high of
10
The Consultants also collected tax digest information for Hart County (Lake Hartwell). Unfortunately, 2009 digest values were not available.
Figure 22: Change in New (First-Time) Registrations of Boats by Year
Because the DNR database only includes
active registrations, data for new registrations
only dates back three years, as boats
registered for the first time in 2006 are
eventually re-entered into the database as
renewals. As shown at left, the number of
new or first-time registrations of all boats
(new and used) fell by 1,267 (-42.6%) from
2007 to 2008, (corresponding with declining
elevations at Lake Lanier), before rebounding
by 654 (38.2%) in 2009.
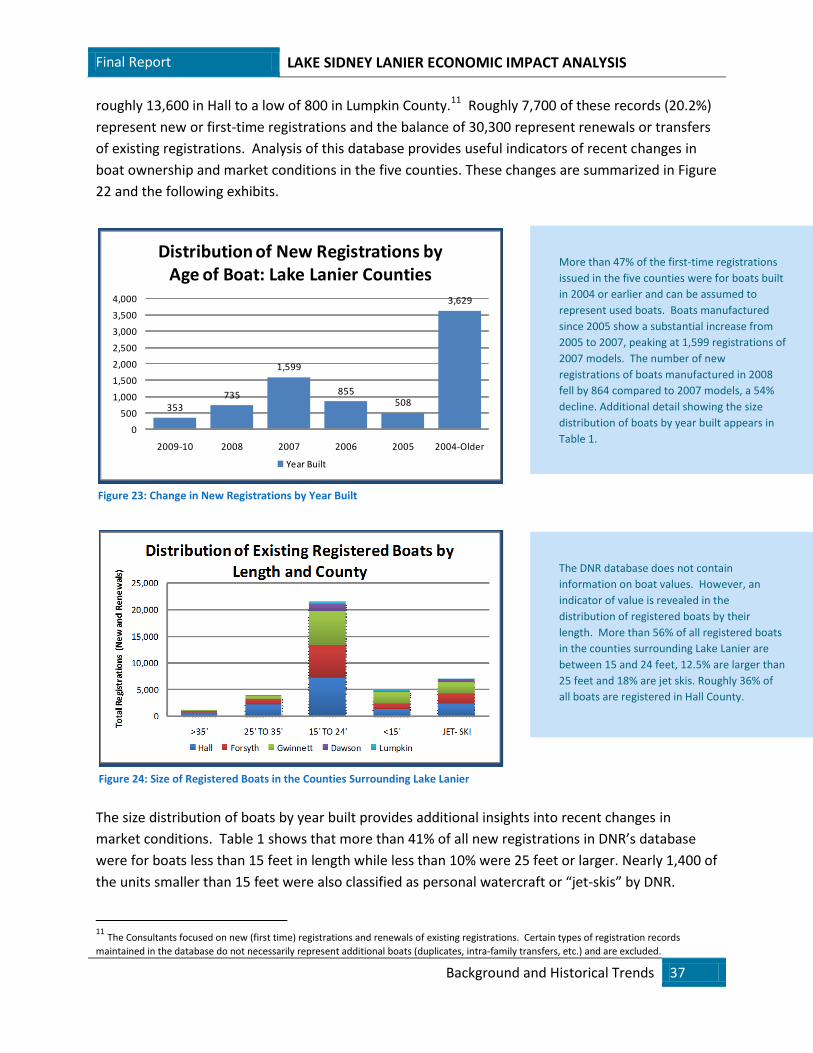
Final Report LAKE SIDNEY LANIER ECONOMIC IMPACT ANALYSIS
Background and Historical Trends 37
353735
1,599
855508
3,629
0
500
1,000
1,500
2,000
2,500
3,000
3,500
4,000
2009-10 2008 2007 2006 2005 2004-Older
Distribution of New Registrations by Age of Boat: Lake Lanier Counties
Year Built
roughly 13,600 in Hall to a low of 800 in Lumpkin County.11 Roughly 7,700 of these records (20.2%)
represent new or first-time registrations and the balance of 30,300 represent renewals or transfers
of existing registrations. Analysis of this database provides useful indicators of recent changes in
boat ownership and market conditions in the five counties. These changes are summarized in Figure
22 and the following exhibits.
The size distribution of boats by year built provides additional insights into recent changes in
market conditions. Table 1 shows that more than 41% of all new registrations in DNR’s database
were for boats less than 15 feet in length while less than 10% were 25 feet or larger. Nearly 1,400 of
the units smaller than 15 feet were also classified as personal watercraft or “jet-skis” by DNR.
11
The Consultants focused on new (first time) registrations and renewals of existing registrations. Certain types of registration records
maintained in the database do not necessarily represent additional boats (duplicates, intra-family transfers, etc.) and are excluded.
Figure 23: Change in New Registrations by Year Built
More than 47% of the first-time registrations
issued in the five counties were for boats built
in 2004 or earlier and can be assumed to
represent used boats. Boats manufactured
since 2005 show a substantial increase from
2005 to 2007, peaking at 1,599 registrations of
2007 models. The number of new
registrations of boats manufactured in 2008
fell by 864 compared to 2007 models, a 54%
decline. Additional detail showing the size
distribution of boats by year built appears in
Table 1.
Figure 24: Size of Registered Boats in the Counties Surrounding Lake Lanier
The DNR database does not contain
information on boat values. However, an
indicator of value is revealed in the
distribution of registered boats by their
length. More than 56% of all registered boats
in the counties surrounding Lake Lanier are
between 15 and 24 feet, 12.5% are larger than
25 feet and 18% are jet skis. Roughly 36% of
all boats are registered in Hall County.
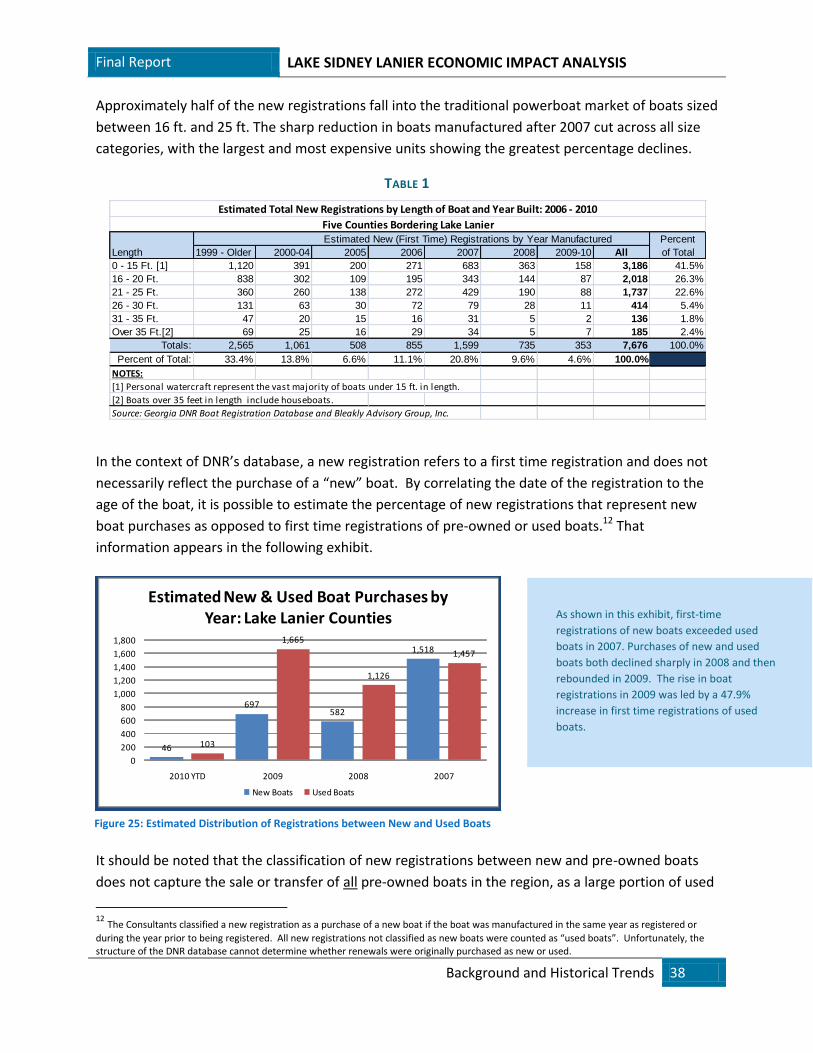
Final Report LAKE SIDNEY LANIER ECONOMIC IMPACT ANALYSIS
Background and Historical Trends 38
46
697582
1,518
103
1,665
1,126
1,457
0
200
400
600
800
1,000
1,200
1,400
1,600
1,800
2010 YTD 2009 2008 2007
Estimated New & Used Boat Purchases by Year: Lake Lanier Counties
New Boats Used Boats
Estimated New (First Time) Registrations by Year Manufactured Percent
Length 1999 - Older 2000-04 2005 2006 2007 2008 2009-10 All of Total
0 - 15 Ft. [1] 1,120 391 200 271 683 363 158 3,186 41.5%
16 - 20 Ft. 838 302 109 195 343 144 87 2,018 26.3%
21 - 25 Ft. 360 260 138 272 429 190 88 1,737 22.6%
26 - 30 Ft. 131 63 30 72 79 28 11 414 5.4%
31 - 35 Ft. 47 20 15 16 31 5 2 136 1.8%
Over 35 Ft.[2] 69 25 16 29 34 5 7 185 2.4%
Totals: 2,565 1,061 508 855 1,599 735 353 7,676 100.0%
Percent of Total: 33.4% 13.8% 6.6% 11.1% 20.8% 9.6% 4.6% 100.0%
NOTES:
[1] Personal watercraft represent the vast majority of boats under 15 ft. in length.
[2] Boats over 35 feet in length include houseboats.
Source: Georgia DNR Boat Registration Database and Bleakly Advisory Group, Inc.
Estimated Total New Registrations by Length of Boat and Year Built: 2006 - 2010
Five Counties Bordering Lake Lanier
Approximately half of the new registrations fall into the traditional powerboat market of boats sized
between 16 ft. and 25 ft. The sharp reduction in boats manufactured after 2007 cut across all size
categories, with the largest and most expensive units showing the greatest percentage declines.
TABLE 1
In the context of DNR’s database, a new registration refers to a first time registration and does not
necessarily reflect the purchase of a “new” boat. By correlating the date of the registration to the
age of the boat, it is possible to estimate the percentage of new registrations that represent new
boat purchases as opposed to first time registrations of pre-owned or used boats.12 That
information appears in the following exhibit.
It should be noted that the classification of new registrations between new and pre-owned boats
does not capture the sale or transfer of all pre-owned boats in the region, as a large portion of used
12
The Consultants classified a new registration as a purchase of a new boat if the boat was manufactured in the same year as registered or
during the year prior to being registered. All new registrations not classified as new boats were counted as “used boats”. Unfortunately, the structure of the DNR database cannot determine whether renewals were originally purchased as new or used.
As shown in this exhibit, first-time
registrations of new boats exceeded used
boats in 2007. Purchases of new and used
boats both declined sharply in 2008 and then
rebounded in 2009. The rise in boat
registrations in 2009 was led by a 47.9%
increase in first time registrations of used
boats.
Figure 25: Estimated Distribution of Registrations between New and Used Boats
Final Report LAKE SIDNEY LANIER ECONOMIC IMPACT ANALYSIS
Background and Historical Trends 39
boat sales are recorded as a transfers of existing registrations rather than new registrations. There
are nearly 14,000 transfers of existing registrations contained in DNR’s database for the 5 counties,
roughly double the number of new registrations. However, it is probable that a significant
percentage of those transfers represent non-arms length sales and the vast majority would not
represent an addition to the stock of boats in the region. Therefore, the following estimates focus
on new registrations only.
By correlating new registration data to the age of boats, it is estimated that more than 1,500 new
boats were purchased in the five counties in 2007. The number of new boat purchases then fell by
936 (-61.6%) from 2007 to 2008 and then increased by 115 (19.8%) in 2009. Additionally, 1,457
new registrations were issued for pre-owned boats during 2007. That number also declined to
1,126 in 2008 (-22.7%) and then rebounded by 47.9% to 1,665 units in 2009.
As the preceding exhibits show, (a) total first-time registrations of new and used boats, (b) total
registrations of boats manufactured after 2007 and (c) estimated registrations of new boats all
declined sharply from 2007 to 2008 and then increased in 2009. Based on the methods used, it
appears that the combination of recession and low lake elevations resulted in the reduction of more
than 900 new boat sales and 300 used boat sales within the five counties from 2007 to 2008. The
next step in the analysis is to determine what those reductions mean in terms of sales losses and to
attempt to distinguish between impacts due to low lake levels and impacts attributable to economic
and market conditions.
The Consultants obtained and reviewed data reported by the National Marine Manufacturers
Association (NMMA) to determine whether patterns observed among the 5 Lake Lanier Counties
were typical of industry-wide trends from 2007 to 2009.13 According to that source:
Nationally, sales of new “traditional powerboats” (inboard, outboard and sterndrive) fell by roughly
64,300 units (-24.1%) from 2007 to 2008 and an additional 49,450 units (-24.2%) in 2009. The average
unit cost of a new powerboat was approximately $35,500 in 2007, $37,400 in 2008 and $36,900 in 2009.
Sales of pre-owned powerboats fell by a smaller percentage than new boats (-8.3%) from 2007 to 2008
and increased by 7.7% from 2008 to 2009. The average unit cost of a pre-owned powerboat was
approximately $9,400 in 2007, $11,100 in 2008 and $10,900 in 2009. Aggregate unit sales of pre-owned
boats also increased relative to new boat sales during this period. In 2007, 2.96 pre-owned boats were
sold for every new boat purchased. That ratio rose to 3.57 to 1 in 2008 and 5.1 to 1 in 2009.
From 2007 to 2008, national sales of sailboats and personal watercraft dropped by -21.2% and -21.7%
respectively, slightly smaller percentages than powerboats. However, national sales of these boats
declined by even larger percentages (-41.9% and -28.9% respectively) in 2009. Therefore, even though
the analysis of boat registration data for Lake Lanier includes a mix of houseboats, sailboats and personal
13
All data quoted in the following paragraphs were obtained from the National Marine Manufacturers Association, 2009 Recreational Boating
Statistical Abstract.
Final Report LAKE SIDNEY LANIER ECONOMIC IMPACT ANALYSIS
Background and Historical Trends 40
watercraft, the presence of these additional types of boats does not skew the sample, as all types of boats
appear to have suffered similar percentage reductions in sales during 2008.
The State of Georgia ranks 14th
in the nation in terms of total annual retail sales of new powerboats,
engines, trailers and aftermarket accessories. Total retail sales of these items in Georgia fell from $463.9
million in 2007 to $335.0 million in 2008 (-27.8%) and fell to $270.1 million (-19.4%) in 2009. (There was
no data available on in-state unit sales.) Georgia was 8.3 percentage points worse than the national
average in terms of 2007-08 industry sales change and slightly better than the national average in 2009.
Therefore, in-state industry conditions were marginally worse than the national average in 2008 but do
not account for the much larger percentage reductions in boat registrations observed at Lake Lanier.
Despite market conditions, total numbers of boats registered in Georgia continued to grow during this
period, from roughly 344,600 in 2007 to 350,500 (a 1.7% increase) in 2008, the last year for which data
are reported. By comparison, the total number of boats registered in the US declined by -1.4% during the
same period. Georgia ranks 12th
nationally in the total number of registered boats and exceeded the
nation in terms of percentage growth in registrations from 2006 through 2008. The five Lake Lanier
counties appear to contain more than 10% of all registered boats in Georgia.
Based on the above national statistics, the Lake Lanier Counties were clearly an anomaly during
2008 and 2009. The percentage drop in new boat registrations around Lake Lanier in 2008 (-61.7%)
was more than 2.5 times the national decline in sales of new powerboats during the same period.
Similarly, the percentage increase in local registrations of new boats in 2009 (up 19.8%) was
contrary to the national average, which saw powerboat sales continue to fall by another -24.4%
relative to 2008. Similarly, the 2007-08 percentage decline in new registrations of pre-owned boats
in the Lake Lanier Counties (-22.7%) was more than 2.7 times worse than the national average and
the 47.9% rebound in local registrations of used boats in 2009 was more than 6 times greater than
the national increase of 7.7%. While the numbers are not completely comparable and the Lanier
data includes a percentage of houseboats, sailboats and personal watercraft in the sample, it is
clear that observed changes in registrations and personal property value discussed above were
primarily attributable to changes in lake levels rather than economic conditions. The dollar value
and economic impacts of those changes will be discussed later in the report.
G. Real Estate Values
1. Introduction
Prior economic impact studies of Lake Lanier as well as other studies of other lakes reviewed for
this report, have discussed the effects of those water resources on their respective local real estate
markets. It is clear in all prior studies that the presence of a lake creates a value premium for
residential real estate that surrounds it, particularly for home sites which offer lake access and/or
scenic views. While the incremental annual construction, rehabilitation, brokerage and financing of
lakefront homes creates benefits to a local economy that might not otherwise exist, real estate
value premiums themselves are a wealth effect and not an annual economic impact. It is important
not to confuse the two concepts.
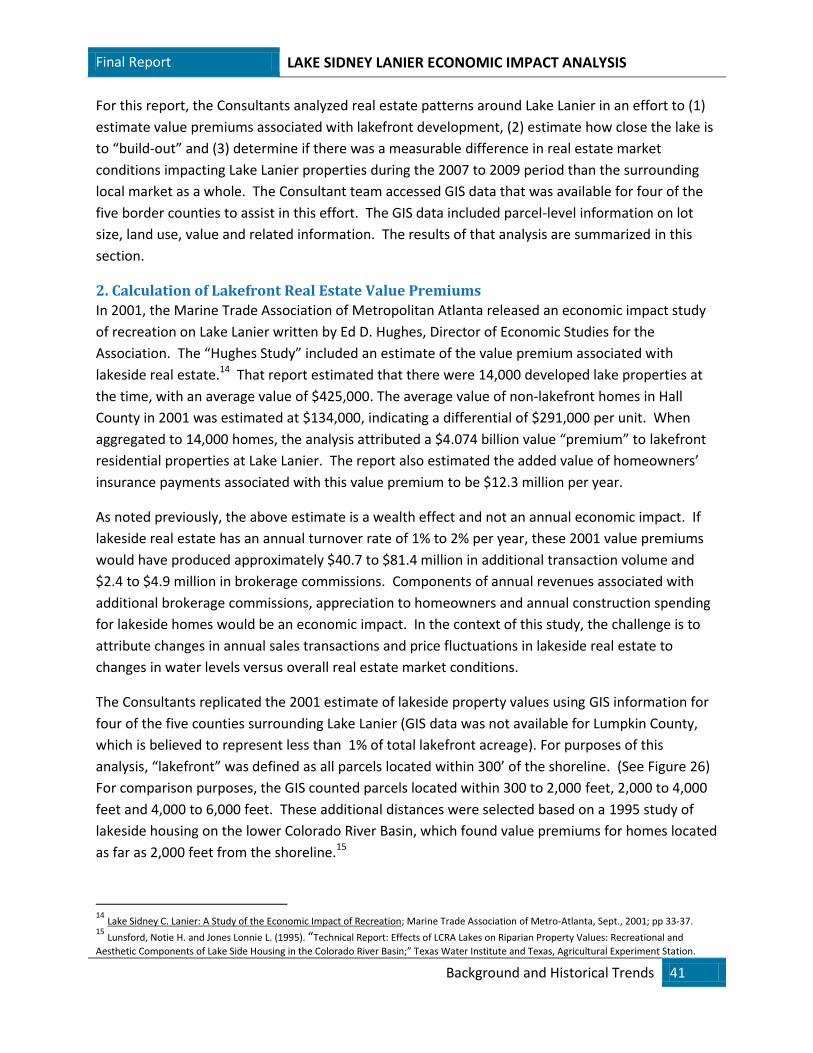
Final Report LAKE SIDNEY LANIER ECONOMIC IMPACT ANALYSIS
Background and Historical Trends 41
For this report, the Consultants analyzed real estate patterns around Lake Lanier in an effort to (1)
estimate value premiums associated with lakefront development, (2) estimate how close the lake is
to “build-out” and (3) determine if there was a measurable difference in real estate market
conditions impacting Lake Lanier properties during the 2007 to 2009 period than the surrounding
local market as a whole. The Consultant team accessed GIS data that was available for four of the
five border counties to assist in this effort. The GIS data included parcel-level information on lot
size, land use, value and related information. The results of that analysis are summarized in this
section.
2. Calculation of Lakefront Real Estate Value Premiums
In 2001, the Marine Trade Association of Metropolitan Atlanta released an economic impact study
of recreation on Lake Lanier written by Ed D. Hughes, Director of Economic Studies for the
Association. The “Hughes Study” included an estimate of the value premium associated with
lakeside real estate.14 That report estimated that there were 14,000 developed lake properties at
the time, with an average value of $425,000. The average value of non-lakefront homes in Hall
County in 2001 was estimated at $134,000, indicating a differential of $291,000 per unit. When
aggregated to 14,000 homes, the analysis attributed a $4.074 billion value “premium” to lakefront
residential properties at Lake Lanier. The report also estimated the added value of homeowners’
insurance payments associated with this value premium to be $12.3 million per year.
As noted previously, the above estimate is a wealth effect and not an annual economic impact. If
lakeside real estate has an annual turnover rate of 1% to 2% per year, these 2001 value premiums
would have produced approximately $40.7 to $81.4 million in additional transaction volume and
$2.4 to $4.9 million in brokerage commissions. Components of annual revenues associated with
additional brokerage commissions, appreciation to homeowners and annual construction spending
for lakeside homes would be an economic impact. In the context of this study, the challenge is to
attribute changes in annual sales transactions and price fluctuations in lakeside real estate to
changes in water levels versus overall real estate market conditions.
The Consultants replicated the 2001 estimate of lakeside property values using GIS information for
four of the five counties surrounding Lake Lanier (GIS data was not available for Lumpkin County,
which is believed to represent less than 1% of total lakefront acreage). For purposes of this
analysis, “lakefront” was defined as all parcels located within 300’ of the shoreline. (See Figure 26)
For comparison purposes, the GIS counted parcels located within 300 to 2,000 feet, 2,000 to 4,000
feet and 4,000 to 6,000 feet. These additional distances were selected based on a 1995 study of
lakeside housing on the lower Colorado River Basin, which found value premiums for homes located
as far as 2,000 feet from the shoreline.15
14
Lake Sidney C. Lanier: A Study of the Economic Impact of Recreation; Marine Trade Association of Metro-Atlanta, Sept., 2001; pp 33-37. 15
Lunsford, Notie H. and Jones Lonnie L. (1995). “Technical Report: Effects of LCRA Lakes on Riparian Property Values: Recreational and
Aesthetic Components of Lake Side Housing in the Colorado River Basin;” Texas Water Institute and Texas, Agricultural Experiment Station.
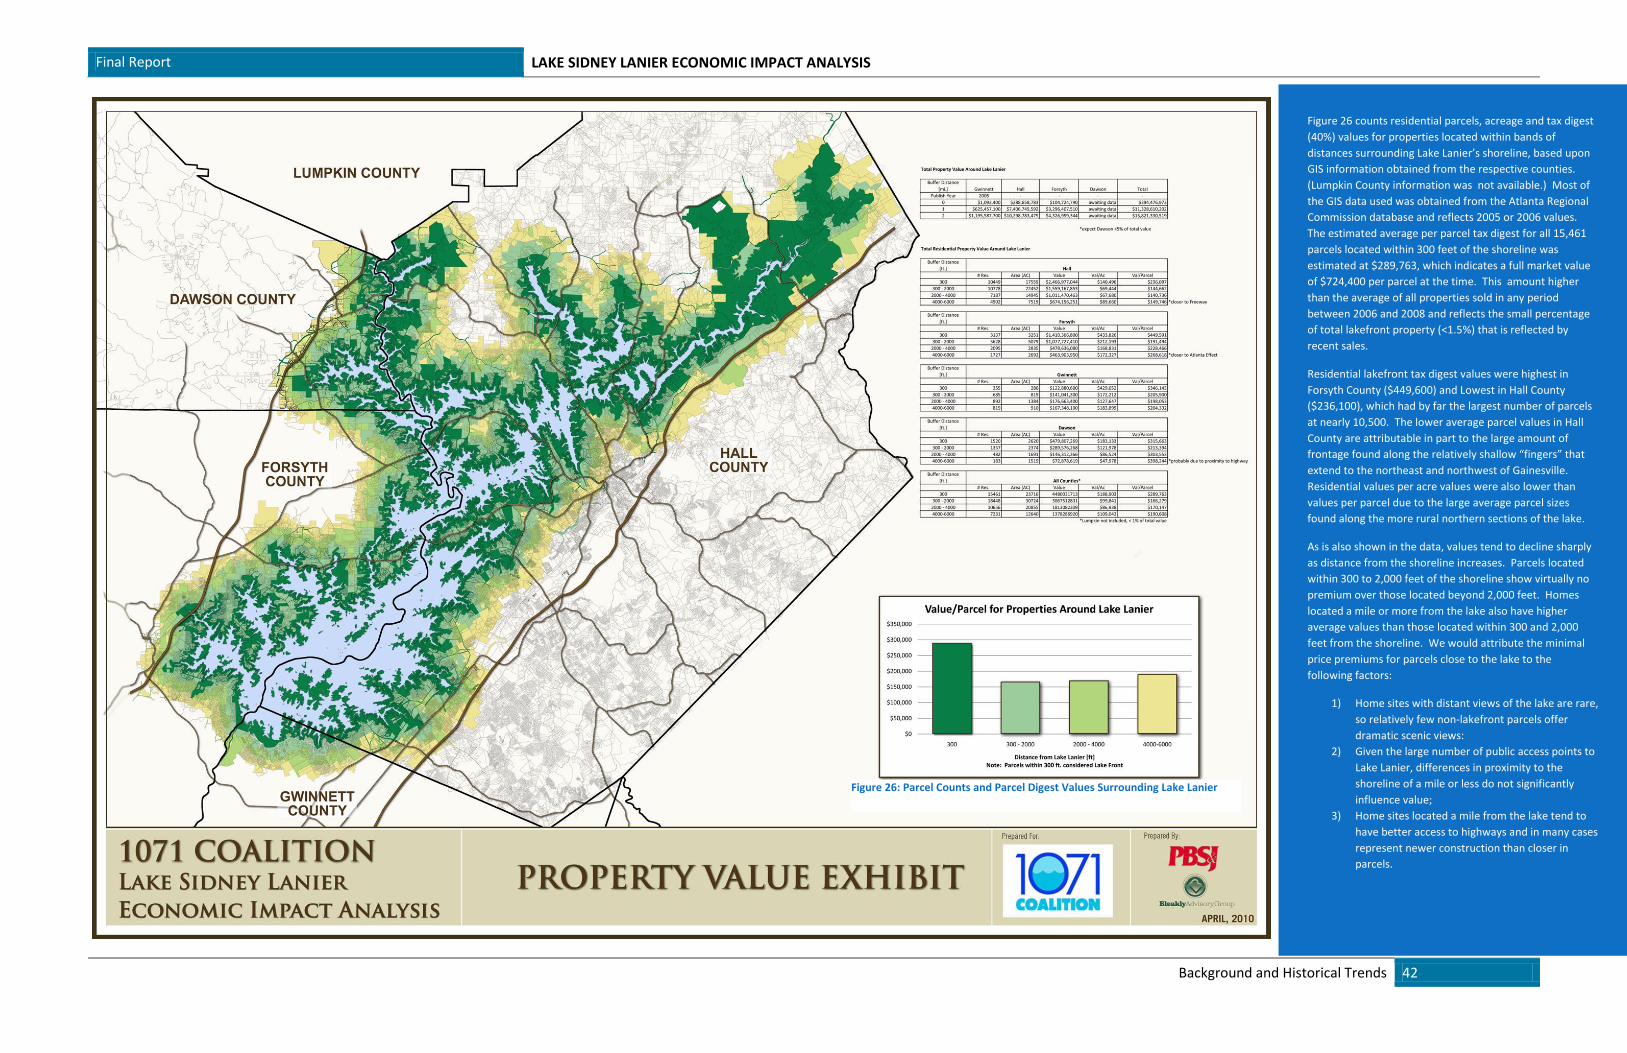
Final Report LAKE SIDNEY LANIER ECONOMIC IMPACT ANALYSIS
Background and Historical Trends 42
Figure 26 counts residential parcels, acreage and tax digest
(40%) values for properties located within bands of
distances surrounding Lake Lanier’s shoreline, based upon
GIS information obtained from the respective counties.
(Lumpkin County information was not available.) Most of
the GIS data used was obtained from the Atlanta Regional
Commission database and reflects 2005 or 2006 values.
The estimated average per parcel tax digest for all 15,461
parcels located within 300 feet of the shoreline was
estimated at $289,763, which indicates a full market value
of $724,400 per parcel at the time. This amount higher
than the average of all properties sold in any period
between 2006 and 2008 and reflects the small percentage
of total lakefront property (<1.5%) that is reflected by
recent sales.
Residential lakefront tax digest values were highest in
Forsyth County ($449,600) and Lowest in Hall County
($236,100), which had by far the largest number of parcels
at nearly 10,500. The lower average parcel values in Hall
County are attributable in part to the large amount of
frontage found along the relatively shallow “fingers” that
extend to the northeast and northwest of Gainesville.
Residential values per acre values were also lower than
values per parcel due to the large average parcel sizes
found along the more rural northern sections of the lake.
As is also shown in the data, values tend to decline sharply
as distance from the shoreline increases. Parcels located
within 300 to 2,000 feet of the shoreline show virtually no
premium over those located beyond 2,000 feet. Homes
located a mile or more from the lake also have higher
average values than those located within 300 and 2,000
feet from the shoreline. We would attribute the minimal
price premiums for parcels close to the lake to the
following factors:
1) Home sites with distant views of the lake are rare,
so relatively few non-lakefront parcels offer
dramatic scenic views:
2) Given the large number of public access points to
Lake Lanier, differences in proximity to the
shoreline of a mile or less do not significantly
influence value;
3) Home sites located a mile from the lake tend to
have better access to highways and in many cases
represent newer construction than closer in
parcels.
Figure 26: Parcel Counts and Parcel Digest Values Surrounding Lake Lanier
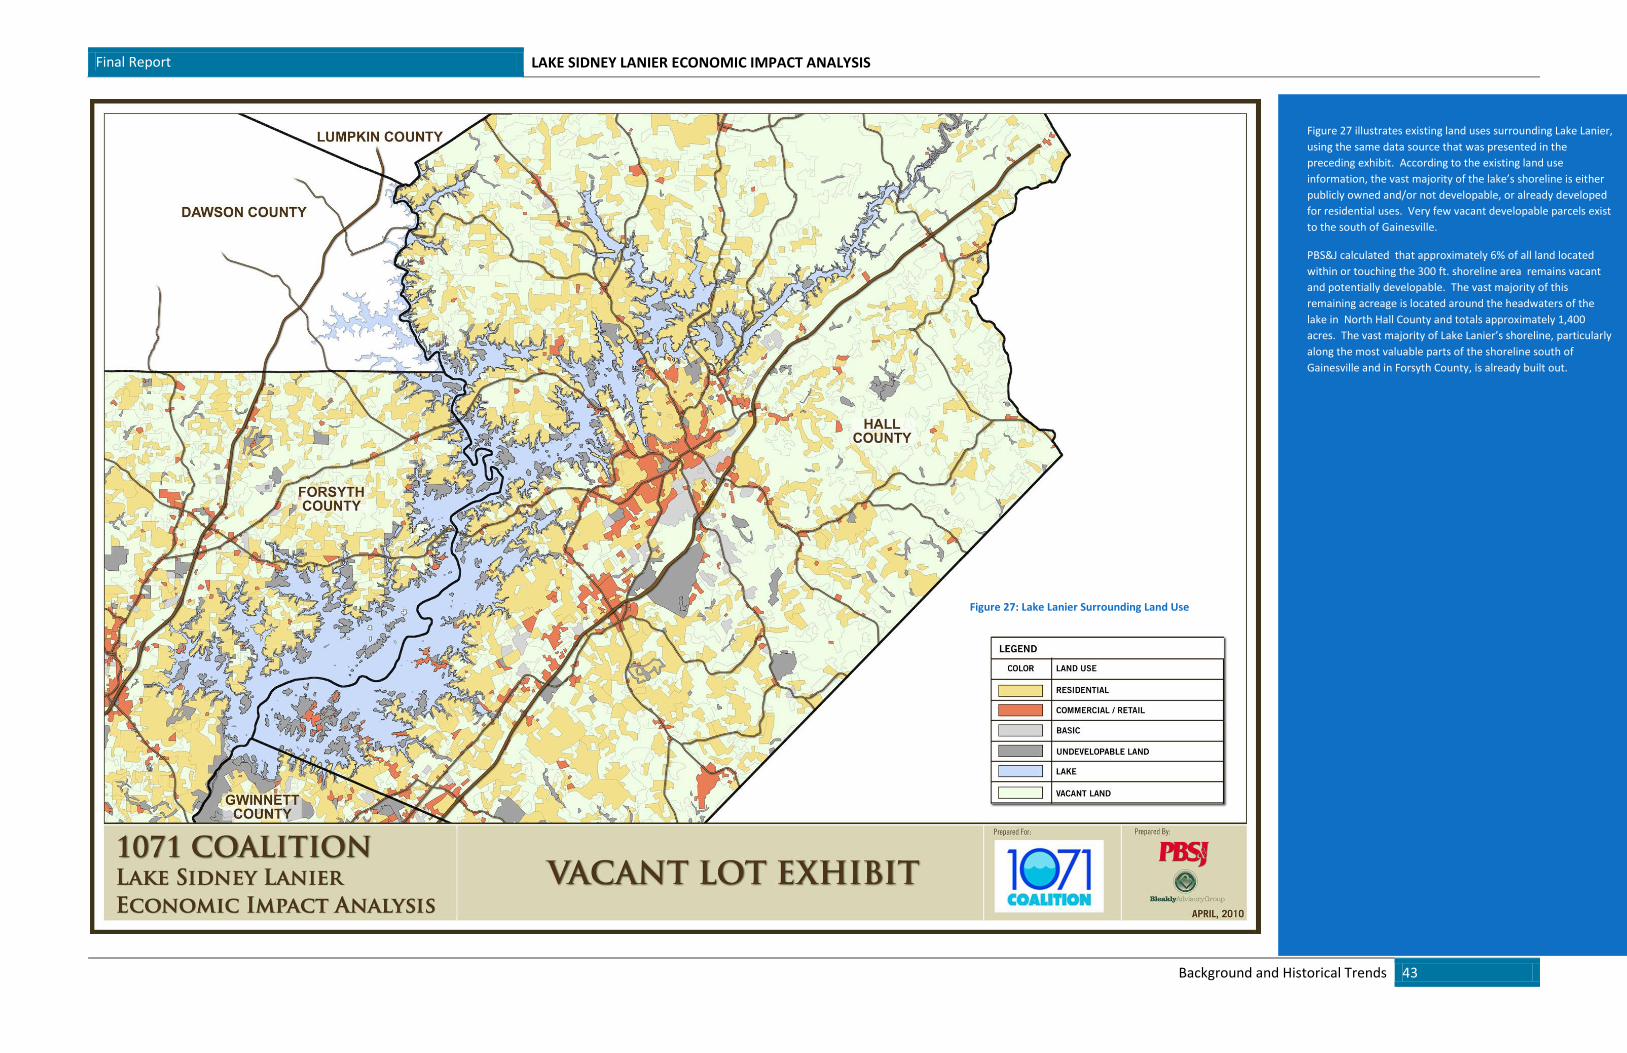
Final Report LAKE SIDNEY LANIER ECONOMIC IMPACT ANALYSIS
Background and Historical Trends 43
Figure 27: Lake Lanier Surrounding Land Use
Figure 27 illustrates existing land uses surrounding Lake Lanier,
using the same data source that was presented in the
preceding exhibit. According to the existing land use
information, the vast majority of the lake’s shoreline is either
publicly owned and/or not developable, or already developed
for residential uses. Very few vacant developable parcels exist
to the south of Gainesville.
PBS&J calculated that approximately 6% of all land located
within or touching the 300 ft. shoreline area remains vacant
and potentially developable. The vast majority of this
remaining acreage is located around the headwaters of the
lake in North Hall County and totals approximately 1,400
acres. The vast majority of Lake Lanier’s shoreline, particularly
along the most valuable parts of the shoreline south of
Gainesville and in Forsyth County, is already built out.
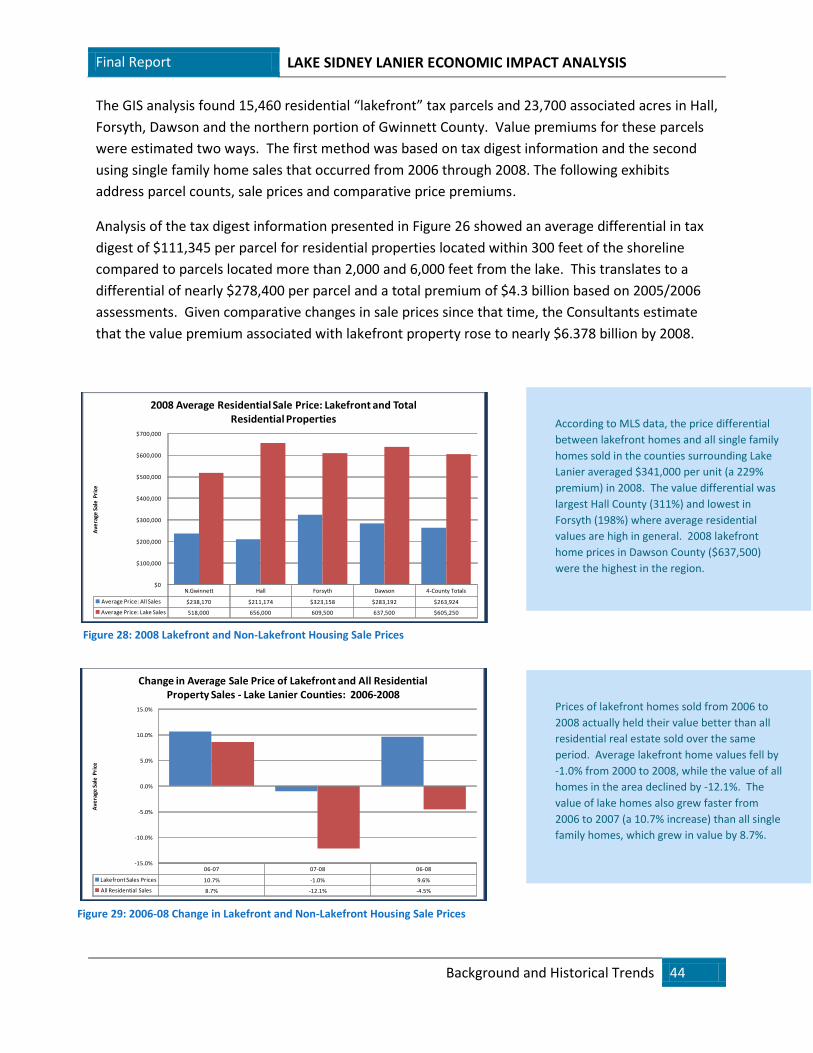
Final Report LAKE SIDNEY LANIER ECONOMIC IMPACT ANALYSIS
Background and Historical Trends 44
N.Gwinnett Hall Forsyth Dawson 4-County Totals
Average Price: All Sales $238,170 $211,174 $323,158 $283,192 $263,924
Average Price: Lake Sales 518,000 656,000 609,500 637,500 $605,250
$0
$100,000
$200,000
$300,000
$400,000
$500,000
$600,000
$700,000
Ave
rage
Sal
e P
rice
2008 Average Residential Sale Price: Lakefront and Total Residential Properties
06-07 07-08 06-08
Lakefront Sales Prices 10.7% -1.0% 9.6%
All Residential Sales 8.7% -12.1% -4.5%
-15.0%
-10.0%
-5.0%
0.0%
5.0%
10.0%
15.0%
Ave
rage
Sal
e P
rice
Change in Average Sale Price of Lakefront and All Residential Property Sales - Lake Lanier Counties: 2006-2008
The GIS analysis found 15,460 residential “lakefront” tax parcels and 23,700 associated acres in Hall,
Forsyth, Dawson and the northern portion of Gwinnett County. Value premiums for these parcels
were estimated two ways. The first method was based on tax digest information and the second
using single family home sales that occurred from 2006 through 2008. The following exhibits
address parcel counts, sale prices and comparative price premiums.
Analysis of the tax digest information presented in Figure 26 showed an average differential in tax
digest of $111,345 per parcel for residential properties located within 300 feet of the shoreline
compared to parcels located more than 2,000 and 6,000 feet from the lake. This translates to a
differential of nearly $278,400 per parcel and a total premium of $4.3 billion based on 2005/2006
assessments. Given comparative changes in sale prices since that time, the Consultants estimate
that the value premium associated with lakefront property rose to nearly $6.378 billion by 2008.
According to MLS data, the price differential
between lakefront homes and all single family
homes sold in the counties surrounding Lake
Lanier averaged $341,000 per unit (a 229%
premium) in 2008. The value differential was
largest Hall County (311%) and lowest in
Forsyth (198%) where average residential
values are high in general. 2008 lakefront
home prices in Dawson County ($637,500)
were the highest in the region.
Figure 28: 2008 Lakefront and Non-Lakefront Housing Sale Prices
Prices of lakefront homes sold from 2006 to
2008 actually held their value better than all
residential real estate sold over the same
period. Average lakefront home values fell by
-1.0% from 2000 to 2008, while the value of all
homes in the area declined by -12.1%. The
value of lake homes also grew faster from
2006 to 2007 (a 10.7% increase) than all single
family homes, which grew in value by 8.7%.
Figure 29: 2006-08 Change in Lakefront and Non-Lakefront Housing Sale Prices
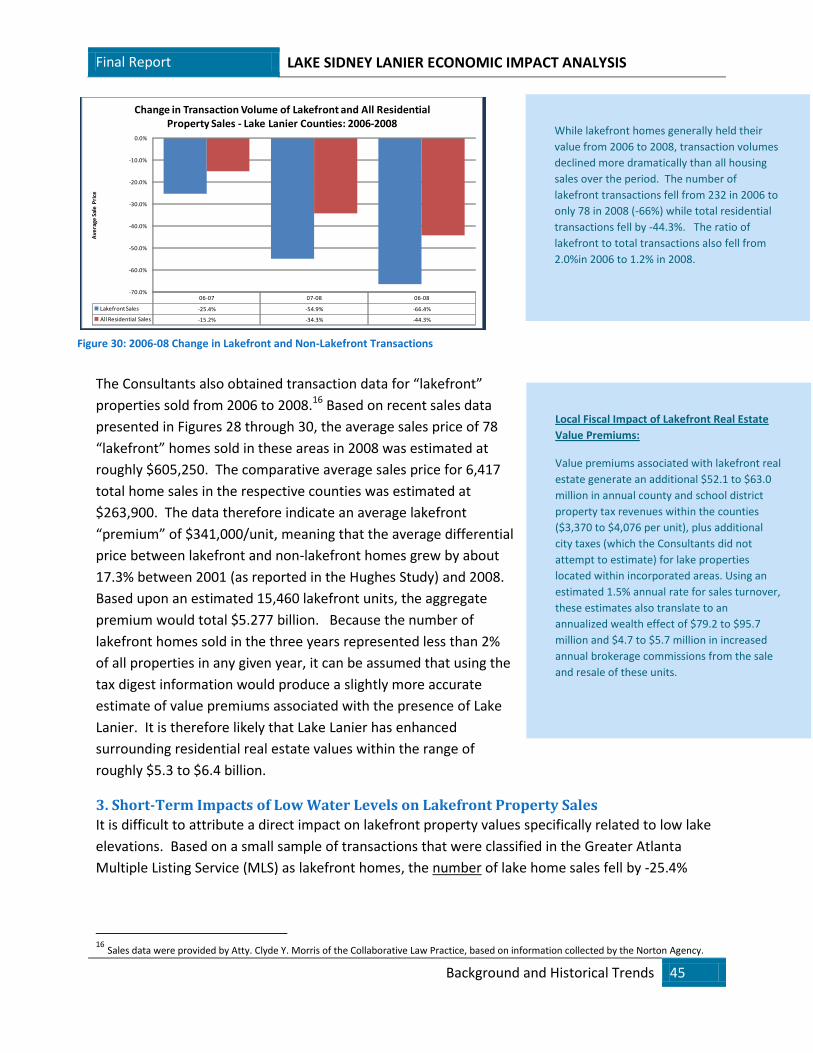
Final Report LAKE SIDNEY LANIER ECONOMIC IMPACT ANALYSIS
Background and Historical Trends 45
06-07 07-08 06-08
Lakefront Sales -25.4% -54.9% -66.4%
All Residential Sales -15.2% -34.3% -44.3%
-70.0%
-60.0%
-50.0%
-40.0%
-30.0%
-20.0%
-10.0%
0.0%
Ave
rage
Sal
e P
rice
Change in Transaction Volume of Lakefront and All Residential Property Sales - Lake Lanier Counties: 2006-2008
The Consultants also obtained transaction data for “lakefront”
properties sold from 2006 to 2008.16 Based on recent sales data
presented in Figures 28 through 30, the average sales price of 78
“lakefront” homes sold in these areas in 2008 was estimated at
roughly $605,250. The comparative average sales price for 6,417
total home sales in the respective counties was estimated at
$263,900. The data therefore indicate an average lakefront
“premium” of $341,000/unit, meaning that the average differential
price between lakefront and non-lakefront homes grew by about
17.3% between 2001 (as reported in the Hughes Study) and 2008.
Based upon an estimated 15,460 lakefront units, the aggregate
premium would total $5.277 billion. Because the number of
lakefront homes sold in the three years represented less than 2%
of all properties in any given year, it can be assumed that using the
tax digest information would produce a slightly more accurate
estimate of value premiums associated with the presence of Lake
Lanier. It is therefore likely that Lake Lanier has enhanced
surrounding residential real estate values within the range of
roughly $5.3 to $6.4 billion.
3. Short-Term Impacts of Low Water Levels on Lakefront Property Sales
It is difficult to attribute a direct impact on lakefront property values specifically related to low lake
elevations. Based on a small sample of transactions that were classified in the Greater Atlanta
Multiple Listing Service (MLS) as lakefront homes, the number of lake home sales fell by -25.4%
16
Sales data were provided by Atty. Clyde Y. Morris of the Collaborative Law Practice, based on information collected by the Norton Agency.
While lakefront homes generally held their
value from 2006 to 2008, transaction volumes
declined more dramatically than all housing
sales over the period. The number of
lakefront transactions fell from 232 in 2006 to
only 78 in 2008 (-66%) while total residential
transactions fell by -44.3%. The ratio of
lakefront to total transactions also fell from
2.0%in 2006 to 1.2% in 2008.
Figure 30: 2006-08 Change in Lakefront and Non-Lakefront Transactions
Local Fiscal Impact of Lakefront Real Estate
Value Premiums:
Value premiums associated with lakefront real
estate generate an additional $52.1 to $63.0
million in annual county and school district
property tax revenues within the counties
($3,370 to $4,076 per unit), plus additional
city taxes (which the Consultants did not
attempt to estimate) for lake properties
located within incorporated areas. Using an
estimated 1.5% annual rate for sales turnover,
these estimates also translate to an
annualized wealth effect of $79.2 to $95.7
million and $4.7 to $5.7 million in increased
annual brokerage commissions from the sale
and resale of these units.
Final Report LAKE SIDNEY LANIER ECONOMIC IMPACT ANALYSIS
Background and Historical Trends 46
from 2006 to 2007.17 The percentage decrease then doubled to (-54.9%) from 2007 to 2008. This
percentage reduction in transactions was significantly greater than all homes in the 4-county
region, which fell by -15.2% from 2006 to 2007 and also more than doubled (to -34.3%) from 2007
to 2008. Yet while the number of transactions fell more sharply than the region as a whole, the
average price of lake homes sold fell only -1.0% from 2007 to 2008, while the price of all single
family homes dropped by -12.1%.
This trend information, coupled by anecdotal evidence, suggests that late 2007 and 2008 drought
conditions were probably viewed as temporary by most buyers and sellers. Many sellers responded
by keeping their homes off the market until conditions improved and the number of transactions
involving lakefront homes fell more sharply in percentage terms than the surrounding market as a
whole from 2007 to 2008. Some distressed sellers of lakefront homes were most certainly hurt,
mostly due to fewer transactions, as overall sale volume fell by $22.4 million from 2006 to 2007 and
an additional $58.5 million from 2007 to 2008. Had numbers of lakefront transactions simply
reflected regional housing market trends (a 34% rather than 55% reduction in unit sales), 114 rather
than 78 lakefront homes would have sold in 2008. It is clearly possible that this difference of 36
additional “lost” sales could be attributed to low water levels at Lake Lanier during the entire 2008
selling season. This additional loss of transactions equates to nearly $21.6 million in reduced sales
volume and $1.3 million in potential lost sales commissions associated with lower transaction
volumes.
H. Marina Slips and Private Docks In 2008, USACE released a study of spending impacts by marina slip renters, community dock users
and/or private dock owners on eight Corps lakes around the country, including Lake Lanier. 18 The
analysis was based upon telephone surveys of trip patterns and spending among marina slip renters
and private dock owners, conducted in 1998.19 Per capita spending estimates were then converted
to 2004 dollars and updated to reflect more recent marina/dock inventories and visitor patterns.
Marina slip renters and private homeowners with docks are among the most intensive users of Lake
Lanier and these users spend significantly more on an annual basis than other types of recreational
visitors. The 2008 report therefore provided useful information on the total number of marina slips
and docks on the lake, the demographic characteristics and trip patterns of those segments of
recreational users and their annual capital spending on boats and docks, maintenance and repairs,
insurance and other costs not counted in other recreational visitor surveys.
17
The MLS data obtained for this report included the northern portion of Gwinnett County and all of Hall, Forsyth and Dawson Counties. Real
estate transactions data for Lumpkin County were not available. 18
Propst, Chang, Lee, Perales and Amsden (February, 2008). Economic Impacts from Spending by Marina Slip Renters and Private Dock Owners
at Lake Sidney Lanier; USACE Recreation Management Support Program. 19
USACE conducted telephone surveys of 211 randomly selected marina slip renters and 342 private dock owners (a 4% sample). The USACE
considered but chose not to include five private yacht clubs with 558 additional slips. Yacht clubs were omitted from the study because they were not completely open to the public and had different spending characteristics and use patterns than commercial marinas. (p.5)
Final Report LAKE SIDNEY LANIER ECONOMIC IMPACT ANALYSIS
Background and Historical Trends 47
This section highlights significant findings from the 2008 USACE report. These findings provide a
baseline of information which is necessary to understand how changes in lake elevations impact
spending patterns among these important market segments. The following findings will be used
later in this report to estimate the economic impacts resulting from reduced spending due to low
lake elevations.
At the time of the study there were an estimated 5,877 marina slips (96% occupied) and 8,018 private
docks on Lake Lanier. Marinas and private docks housed 5,642 and 16,036 boats respectively, accounting
for a total of 21,678 boats “permanently” based on the lake. Surveys indicated that roughly 4% of that
inventory (550+ boats) had been purchased within the prior 12 months. (This 4% sales rate was
consistent with the analysis findings of the boat registration data prior to 2008.)
Marina renters tended to be older (average age of 49), white, college educated with well above average
household incomes. More than 61% of the sample earned incomes above $100,000 (in 1998) and 61%
reported no children under 18 living at home. Roughly 55% of marina renters lived within 30 miles of
their marina and 45% lived outside of the local area. The average distance between a slip renter’s
residence and marina was 35 miles and the average respondent had been boating on the lake for 10
years.
Marina renters made more than 198,400 “party trips” at the time of the survey, representing more than
35 annual trips per boat. The average party size was 3.63 persons. Roughly half of trips involved overnight
stays lasting an average of 2.6 days per trip and the balance were day trips. For all marina users, the
average trip lasted 1.9 days. Nearly 60% of annual boating trips by marina renters were made in the
Spring and Summer. The length and value of boats owned by marina renters were significantly greater
than all boat owners in the region, with 72.4% of all marina boats being larger than 25 feet in length.
Marina users spent an average of $226 per trip in 2004$ of which 89% was spent locally (within 30 miles).
Slip renters also spent an average of nearly $6,600 per year for capital or fixed costs associated with slip
rentals, storage fees, boat maintenance, insurance and related expenses.
Private dock owners had marginally lower incomes than marina slip renters (51% with incomes over
$100,000), were older than marina renters (average age of 56) and 70% had no children under 18 living at
home. Thirty-two percent of private dock owners owned seasonal homes and 68% were primary
residents. The average respondent reported that they had been boating on the lake for 20 years, twice
the duration of marina users.
Private dock owners made nearly 540,700 “party trips” at the time of the survey, more than 67 annual
trips per boat and nearly twice the number as slip renters. The average party size for boating trips among
dock owners was 3.75 persons. Dock owners made more frequent trips but of shorter duration than
marina renters, with only 22% of trips involving overnight stays. Overnight trips lasted an average of 2.5
days per trip and the balance was day trips. For all dock owners, the average trip lasted 1.3 days. Nearly
63% of boating trips by dock owners were also made in the Spring and Summer months, consistent with
marina users.
The length and value of boats owned by dock owners were significantly lower than marina renters, with
55.2% of all boats owned being 20 feet or less in length and more than 96% smaller than 30 feet. This
Final Report LAKE SIDNEY LANIER ECONOMIC IMPACT ANALYSIS
Background and Historical Trends 48
may be due in part to the shallow locations of many private docks on the Lake, which do not easily
accommodate large boats.
Because private dock owners tended to own smaller boats and make more frequent day trips, they spent
an average of $167 per party trip in 2004$ (compared to $226 for marina renters) of which 68% was spent
locally. Dock owners also spent an average of nearly $3,100 per year (half the amount of marina renters)
for capital or fixed costs associated with dock construction/repair, storage fees, boat maintenance,
insurance and related expenses.
Combined annual trip spending by marina renters and private dock owners exceeded $135.4 million
in 2004$. Annual capital spending for boats, docks, insurance, repairs, etc. totaled an additional
$62.65 million. USACE also estimated that combined marina and dock spending supported 509 jobs
in the local economy, including multiplier effects. The portion of these jobs which is attributable to
trip spending is already captured within the economic impact of annual visitation to Lake Lanier as
reported in Figure 4. The balance of employment supported by fixed annual capital spending for
boats, docks, insurance, repairs, etc. is an additional economic impact that is not captured by visitor
spending.
The Consultants estimate that by the end of 2007, the number of marina slips on Lake Lanier (wet
and dry) had increased to 7,931 and the number of private docks had increased to 10,450.
Assuming similar utilization rates to those found in the 1998 surveys, these facilities would be
accommodate nearly 28,100 boats, which represents a 29.6% increase compared to the 1998
surveys. By adjusting for inflation since 2004 and for increases in numbers of marina slips, docks
and boats on the lake since the surveys were undertaken, the Consultants estimate that annual
capital spending for owners and renters of docks and marina slips rose to more than $90.8 million
by 2007. The likely impact of low 2008 lake elevations on this spending will be addressed in the
next chapter.
I. Summary Conclusions The preceding sections profile historical trends in lake elevations, annual visitation, boating, real
estate and related spending around Lake Lanier. As discussed, lake elevations fell to 50 year lows in
2008. Compared to 2007, Lake Lanier experienced:
A near 880,000 decline in total annual visits, including
o 326,000 fewer boaters and
o 68,000 fewer campers;
An estimated $4.7 million reduction in earnings among commercial marinas on Corps’
leased land;
A $50.2 million reduction in the personal property value of all boats located and taxed
within the five counties which surround the Lake;
Final Report LAKE SIDNEY LANIER ECONOMIC IMPACT ANALYSIS
Background and Historical Trends 49
A 61.7% decrease in the number of new boats registered within the five counties;
A 54% decrease in the number of lakefront property sales (transactions).
Even though 2008 was a period of regional and national economic recession, comparisons of these
indicators at Lake Lanier versus conditions surrounding other Georgia lakes, as well as comparisons
with statewide or national averages, clearly show that local impacts were far worse than might be
expected based solely on economic conditions. Abnormally low lake elevations were the dominant
contributing factor to observed changes in recreational activity. The next chapter quantifies the
total direct economic impacts associated with reduced recreational spending during 2008. The
analysis also explores reasons for observed changes in more detail and estimates the portion of
direct impacts which can be attributed to low lake levels versus other factors.
Final Report LAKE SIDNEY LANIER ECONOMIC IMPACT ANALYSIS
Impacts of Lake Levels on Recreational Spending 50
III. Impacts of Lake Levels on Recreational Spending
A. Introduction The preceding chapter documented actual reductions in recreational visits and related economic
indicators over the 2007 to 2008 period when Lake Lanier experienced historically low water levels
and the region suffered a severe economic downturn. This chapter focuses more specifically on the
portion of observed impacts that can be directly attributed to lake levels. It also estimates the
direct economic impacts of those changes on recreational spending, incomes, earnings and job loss.
These inputs will then be used to analyze the total direct and indirect impacts of Lake Lanier’s
changing water levels on the regional economy.
B. Survey Findings One of the methods the Consultants used to help gauge resident, visitor and business reaction to
2007 and 2008 lake conditions was a voluntary on-line survey of recreational users and area
businesses. The Consultants considered mail-back and random telephone survey methods to solicit
input but it became apparent that cost considerations, sampling challenges and the nature of
questions needed to produce quantifiable results made other alternatives difficult to implement.
It was therefore determined that an interactive on-line format would be least intrusive for
respondents and would produce useful information at a reasonable cost. Initially, survey methods
were intended to be used to develop aggregate estimates of changes in recreational visitor
spending, business conditions and employment around the lake. However, as the data collection
efforts began, it became apparent that other data sources such as USACE visitor records and prior
research, marina concession records, boater registrations, etc. provided a comparable and more
defensible basis for making necessary calculations. The surveys therefore became a tool to help
verify and confirm estimates made using other source data, rather than the primary research
method for the impact analysis.
The team produced two questionnaires, one for residents and recreational visitors and the other for
local businesses. The “resident” survey was advertised in a local lake publication, promoted in area
newspapers and through local associations and advocacy groups. The “business” survey was
similarly promoted by the Hall and Forsyth Chambers of Commerce. The consultants also
assembled a targeted mailing list of potential lake dependent businesses within specific NAICS
codes and located in 11 zip codes surrounding Lake Lanier. The mailing list was assembled using
Dun & Bradstreet and chamber of commerce membership lists. Post cards were mailed to key
contact persons within approximately 3,800 businesses with 24,000 employees located in the five
counties. The postcards invited the businesses to participate and provided a link to the survey site.
Post cards targeted boat dealers and marina operators, the hospitality sector, selected retailers,
real estate firms, construction contractors, service businesses and related companies that serviced
lake homeowners, seasonal residents and recreational visitors.
The web site used to collect the survey results remained open from November of 2009 into early
January of 2010 and gathered more than 1,100 responses from residents and businesses. Copies of
Final Report LAKE SIDNEY LANIER ECONOMIC IMPACT ANALYSIS
Impacts of Lake Levels on Recreational Spending 51
the survey instruments appear in the report appendix and selected highlights from each survey are
summarized below.
1. Resident and Visitors Survey
The objectives of this survey were to obtain opinion and estimates from a cross section of lake
residents and recreational visitors concerning (a) how and how often they used Lake Lanier for
recreation; (b) the types of recreational activities they engaged in; (c) their typical spending
patterns when using the lake; (d) their reaction to 2007-2008 conditions in terms of frequency of
lake use and total recreational spending; and (e) the relative importance of low water levels versus
other contributing factors in changing their recreation patterns.
The survey returned 940 valid responses, which were dominated by local residents. The
demographic characteristics of the survey respondents were very similar to those of marina renters
and private dock owners surveyed a decade earlier by the USACE. Important demographic
characteristics of respondents are summarized as follows:
Roughly 67% of respondents were male;
Nearly 60% were between the ages of 45 and 64 and 22.6% were retirees over age 65;
63% of respondents had household incomes over $100,000, including nearly 39% with
annual incomes above $150,000;
The average household contained 2.15 persons and only 22% of respondents had children
under 18 living at home;
98.7% of respondents resided in Georgia and in-state responses were received from
residents of 20 different counties;
Among the Georgia responses, 47% came from Hall County alone, 84% came from the
counties bordering Lake Lanier, 14% (144 responses) came from Cobb, Cherokee, Fulton &
DeKalb Counties and the balance (17 responses) were from scattered locations throughout
Georgia;
12 responses were received from residents of other states, including 7 from Florida.
Predictably, lakefront homeowners dominated the sample, with nearly 71% owning a primary
residence and 17.6% owning a seasonal residence on the lake. Nearly 67% of respondents also
owned a boat used primarily at Lake Lanier and more than 75% participated in boating and related
activities. Among boat owners/users, roughly 75% of respondents also owned private docks, 13%
rented marina slips and the balance towed their boats to day use areas.
Survey participants (even homeowners) did not always access the lake for recreation via their own
homes. Those who cited other forms of lake access included campers (14%); persons staying in
commercial lodging (7.7%), renters of lakefront homes (1.4%); visits to day use areas (42.8%); visits
to friends or relatives who have lakefront homes (35.5%) or persons who worked at businesses
located on the lake (17.1%). More than 75% of respondents identified themselves as either
“regular” (a minimum of once a week) or ”daily” visitors compared to only 17.2% who classified
themselves as “periodic” (one or a few days per month) and 5.6% who were occasional visitors (one
Final Report LAKE SIDNEY LANIER ECONOMIC IMPACT ANALYSIS
Impacts of Lake Levels on Recreational Spending 52
or a few days per year). Surprisingly, 2.0% of respondents categorized themselves as “infrequent”
visitors (less than once a year) yet still completed the survey.
Given the large percentage of respondents who owned boats, it is not surprising that 88% rated
boating and related recreation as “somewhat” or “very” important in terms of their recreational use
of Lake Lanier. Ranked in terms of importance on a scale of 1 to 5 (5 being most important) boating
received the highest response with an average of 4.73, followed by swimming (4.31), sightseeing
(4.16), fishing (3.70) and visits to day use areas (3.44).
Participants were asked to respond to a matrix of items they typically purchase when visiting the
lake for recreation and check boxes indicating dollar ranges of usual spending for each item. Items
included groceries, restaurants, gas and oil, lodging, fishing supplies, sporting goods, boat rentals/
docking fees and admissions to day use areas, golf courses, attractions, etc. For some spending
categories only a small percentage of respondents actually made purchases (such as commercial
lodging) yet those who did spent large sums on that particular item. For other categories such as
groceries, the average expense was relatively small (55% of respondents spent less than $50 per
trip), but the vast majority of respondents purchased groceries when visiting the lake.
Compensating for these factors, the largest spending categories in order of importance were
gasoline purchases for boats and vehicles, restaurant spending, food/groceries and sporting goods.
The final survey questions asked participants to indicate whether the number and purposes of their
lake visits had changed in recent (past 3 to 5) years and if so, attribute causes to those changes. In
response to the first question, approximately a quarter of respondents said they had not changed
the number of recreational days they spent on the lake. Among those who had changed, 19.3% of
respondents indicated that they had significantly decreased the number of days they had spent on
Lake Lanier for recreation, 22.4% had slightly decreased while 20.1% had significantly increased and
12.2% had slightly increased and the number of days they spent at the lake. Because the time frame
indicated in the question was longer than the period of severe drought, it is possible that these
percentages slightly understate changes in visitor patterns from 2007 to 2008. Regardless, the
percentage of the sample which indicated varying levels of decreasing visitor days was ten
percentage points higher than those who had indicated increasing visits.
Of the approximate third of respondents who had significantly or slightly increased their
recreational use of the lake over the period, the predominant or most applicable reasons given for
the increase were (1) a change in hobbies or interests, (2) a change in family circumstances (such as
a recent retirement), (3) a boat purchase or (4) the respondent had move closer or to the lake
within the period. Among the nearly 42% of respondents who had slightly or significantly
decreased their recreational use of the lake, the most applicable reason given was by far, low water
levels. Other economic reasons offered as possible explanations for decreased lake use were, in
almost all cases, dismissed as either not applicable at all or only somewhat applicable.
To solicit comments on whether changing water levels had impacted respondents’ personal
experience and enjoyment of Lake Lanier, they were asked to react (agree or disagree) to a series of
Final Report LAKE SIDNEY LANIER ECONOMIC IMPACT ANALYSIS
Impacts of Lake Levels on Recreational Spending 53
five statements which described increasing levels of impact from none to highly negative. That
question yielded the following responses:
Less than 3% of respondents either somewhat or strongly agreed with the statement that
“water levels weren’t noticeable and had no effect on our experience”, while nearly 95%
strongly or somewhat disagreed with that statement;
Slightly more than 12% either strongly or somewhat agreed that water levels were
“noticeable but didn’t really affect our experience”, while 64.4% strongly disagreed with the
statement and another 21% somewhat disagreed;
A third of respondents agreed that they had not necessarily changed their recreational
activities because of low water, but “did not enjoy visiting the lake as much”, while 42%
strongly disagreed, 18% somewhat disagreed and 5% had no opinion;
More than 56% of respondents agreed that they still visit the lake as much as in the past,
but they had ”changed recreational activities when visiting because of (low) water levels”,
while 34% disagreed and 7% had no opinion;
More than 70% of respondents agreed (including 50% who strongly agreed) that they had
cut back on recreational use of the lake and “visited less often because of water levels”
while less than 20% disagreed with the statement and 7.3% had no opinion.
It is interesting to note that the percentage of respondents who agreed that they had cut back on
their recreational use of Lake Lanier and visited less often, was significantly larger than the
percentage who had not allowed low water levels to impact their recreation activities, even if they
found those activities to be less enjoyable. Because this sample consists of the most intensive users
of Lake Lanier, the survey results are very significant and certainly consistent with the 11%
reduction in total lake visitors estimated by the Corp’s Lanier Management Office. These survey
participants clearly reduced their recreational investments and attributed the cause directly to
water levels rather than general economic factors or changes in family circumstances. These
sentiments were confirmed repeatedly in more than 240 written comments that were submitted
with the surveys. Many of the comments indicated that respondents could no longer access the
lake via their docks, or found the lake to be less safe and less enjoyable for boating because of the
low elevations.
2. Business Survey
The business survey was similarly designed to collect input from various types of local businesses
that might derive income from residents and visitors to Lake Lanier. The objectives of the survey
were to (a) estimate the relative importance of Lake Lanier as a source of customers for various
types of area businesses; (b) the characteristics of those customers; (c) the seasonality of lake-
related revenues; (d) observed changes in recent overall business conditions and (e) the relative
contribution of changes in lake levels to business conditions compared to other possible causes.
The survey also asked businesses to estimate the number of jobs which they had either added or
eliminated within the past three years and to estimate the percentage of those job gains or losses
which could be directly attributable to lake levels (if applicable).
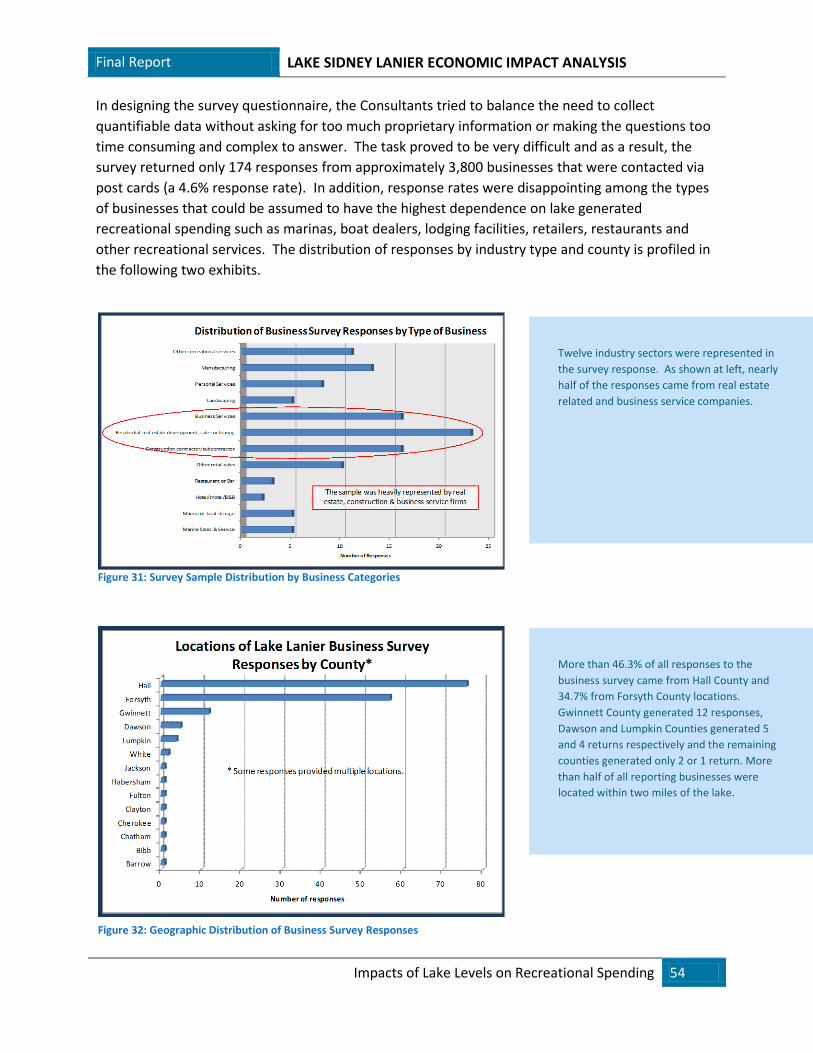
Final Report LAKE SIDNEY LANIER ECONOMIC IMPACT ANALYSIS
Impacts of Lake Levels on Recreational Spending 54
In designing the survey questionnaire, the Consultants tried to balance the need to collect
quantifiable data without asking for too much proprietary information or making the questions too
time consuming and complex to answer. The task proved to be very difficult and as a result, the
survey returned only 174 responses from approximately 3,800 businesses that were contacted via
post cards (a 4.6% response rate). In addition, response rates were disappointing among the types
of businesses that could be assumed to have the highest dependence on lake generated
recreational spending such as marinas, boat dealers, lodging facilities, retailers, restaurants and
other recreational services. The distribution of responses by industry type and county is profiled in
the following two exhibits.
Twelve industry sectors were represented in
the survey response. As shown at left, nearly
half of the responses came from real estate
related and business service companies.
More than 46.3% of all responses to the
business survey came from Hall County and
34.7% from Forsyth County locations.
Gwinnett County generated 12 responses,
Dawson and Lumpkin Counties generated 5
and 4 returns respectively and the remaining
counties generated only 2 or 1 return. More
than half of all reporting businesses were
located within two miles of the lake.
Figure 31: Survey Sample Distribution by Business Categories
Figure 32: Geographic Distribution of Business Survey Responses
Final Report LAKE SIDNEY LANIER ECONOMIC IMPACT ANALYSIS
Impacts of Lake Levels on Recreational Spending 55
The following points highlight the characteristics of businesses that responded to the survey:
83% of respondents owned or co-owned the business;
Most of the reporting businesses were well established, with the median reported years in
operation listed as 17 years;
More than half of all reporting businesses were located within two miles of the lakeshore.
(For the handful of respondents operating out of multiple locations, this estimate includes
only the location nearest Lake Lanier.) The average distance from the lake among all
businesses answering this question was 3.1 miles.
The 174 respondents reported employing more than 11,300 full time, part time and
seasonal workers. However, the sample was skewed by a few large companies that were
responsible for the majority of reported employment. The median number of full-time
employees among all respondents who reported their employment was only 4. The median
number of part time workers employed by 58 firms that hired seasonal workers was 2 and
the median number of seasonal workers employed by the 25 firms with seasonal hires was
3. Nearly 56% of the respondents who reported employment had fewer than 10 combined
full time, part time and seasonal employees, while 28% reported a minimum of 25 workers.
Similar to employment, most of the respondents were small in terms of overall annual sales.
Among those who revealed their annual sales, 21.8% reported annual gross revenues of
under $250,000, 24.4% were between $250,000 and $1.0 Million; 28.8% were between $1.0
and $5.0 million and the remaining 25% had sales above $5.0 million, including 19
respondents who reported more than $10 million in annual sales.
Roughly 80% of respondents indicated that permanent or seasonal lake residents were their
customers and more than 75% identified recreational visitors and boaters as customers. The vast
majority of respondents therefore had direct business ties to the lake and it can be assumed that
they would have been most impacted by changing water levels. Among all respondents, 120 (69%
of the sample) said they derived revenue from lake-related customers and could estimate relative
percentage share of total business revenues attributable to those customers. Among those, 34.2%
estimated that they derived 75% or more of their annual sales from lake-related customers,
another 26.6% derived between 25% and 75% of revenues from lake customers and the remaining
39% derived less than a quarter of their revenues from lake-related business.
In terms of the relative percentages of revenues derived from lake-related customers, lake property
owners and residents were the most important sector, generating an average 42.6% share of
estimated revenues. Visitors from other Metro-Atlanta Counties were the next most important
segment with an average of 19.5%, out of state tourists and visitors generated 11.4% and tourists
and visitors from other parts of Georgia averaged 8.7%. These responses were consistent with
Final Report LAKE SIDNEY LANIER ECONOMIC IMPACT ANALYSIS
Impacts of Lake Levels on Recreational Spending 56
USACE and other research which showed that the vast majority of lake visitors come from Metro-
Atlanta
Respondents were asked to rank factors that have contributed to changing business conditions
since 2006 on a scale of 1 to 6, with 6 indicating most important factor. Among those businesses
which answered this question, water levels were cited as the second most important factor with an
average score of 4.40 on the 1to 6 scale. Regional and national economic conditions were ranked
highest with a score of 4.9 and housing market conditions were cited as third with a score of 4.3.
None of the other factors listed received a score above 3.0.
Respondents were also asked to estimate if changing lake levels had impacted their employment
levels. Among 82 businesses (47%) who answered that question, 20.7% indicated that lake levels
had no impact on their employment, 35.3% indicated lake levels had some impact, 32.1% indicated
that lake levels had a substantial impact and 20.7% characterized the impact as “severe”. Among
business who indicated that lake levels did have some level of impact on employment, 89%
indicated that they had already eliminated full time jobs totaling 114 positions and 85% indicated
that they had eliminated part-time and seasonal jobs totaling 120 positions. This contrasts to only
10 firms who reported that they had created jobs within the previous 3 years.
3. Summary of Survey Conclusions
The survey results from both residents/visitors and businesses confirm that falling lake levels
beginning in late 2007 and continuing into 2009; (1) did in fact cause residents and visitors to
reduce recreational use and spending at Lake Lanier; (2) those behavioral changes were felt by lake
dependent businesses; and (3) businesses suffered significant losses of sales and reduced their
employment as a result. Even among the relatively small sample of businesses that responded,
employment losses were significant at 234 full time, part time and seasonal positions.
Impacts of low water levels were perceived to be very significant from the perspective of
respondents. Among residents and visitors, low water levels (and not economic conditions) were
almost entirely responsible for their reductions in recreational use and spending at Lake Lanier.
Among businesses, lake levels were perceived to be the second most important contributing factor
to changing business conditions, following closely behind the general decline of the overall
economy and slightly ahead of the housing market, which was cited third.
Impacts suggested by the survey results appear consistent with, if not more severe than the
percentage reductions in visitor traffic measured by the USACE. The following section focuses more
specifically on estimating direct changes in recreational spending and employment from 2007 to
2008, which will be used to drive the economic impact projections.
C. Estimation of Direct Economic Impacts Relying upon the background data and survey input reported above, the Consultants proceeded to
estimate the aggregate spending reductions and direct economic impacts associated with reduced
visitation and recreational spending at Lake Lanier from 2007 to 2008. This section describes the
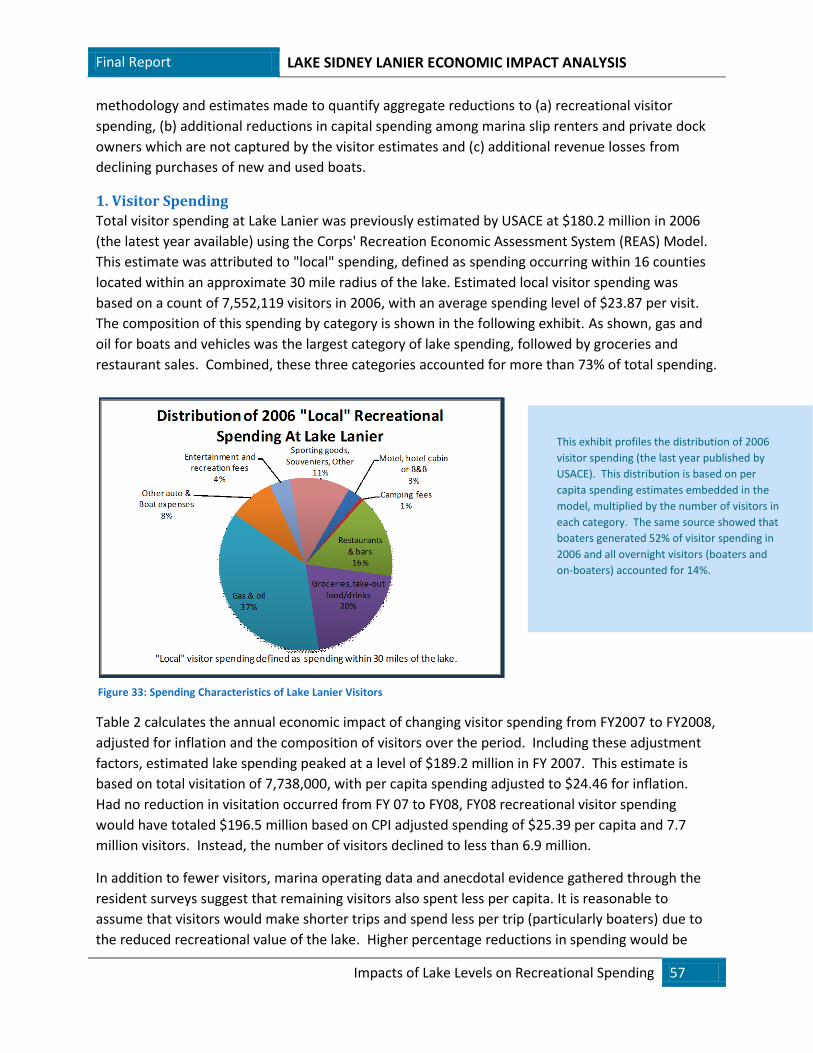
Final Report LAKE SIDNEY LANIER ECONOMIC IMPACT ANALYSIS
Impacts of Lake Levels on Recreational Spending 57
methodology and estimates made to quantify aggregate reductions to (a) recreational visitor
spending, (b) additional reductions in capital spending among marina slip renters and private dock
owners which are not captured by the visitor estimates and (c) additional revenue losses from
declining purchases of new and used boats.
1. Visitor Spending
Total visitor spending at Lake Lanier was previously estimated by USACE at $180.2 million in 2006
(the latest year available) using the Corps' Recreation Economic Assessment System (REAS) Model.
This estimate was attributed to "local" spending, defined as spending occurring within 16 counties
located within an approximate 30 mile radius of the lake. Estimated local visitor spending was
based on a count of 7,552,119 visitors in 2006, with an average spending level of $23.87 per visit.
The composition of this spending by category is shown in the following exhibit. As shown, gas and
oil for boats and vehicles was the largest category of lake spending, followed by groceries and
restaurant sales. Combined, these three categories accounted for more than 73% of total spending.
Table 2 calculates the annual economic impact of changing visitor spending from FY2007 to FY2008,
adjusted for inflation and the composition of visitors over the period. Including these adjustment
factors, estimated lake spending peaked at a level of $189.2 million in FY 2007. This estimate is
based on total visitation of 7,738,000, with per capita spending adjusted to $24.46 for inflation.
Had no reduction in visitation occurred from FY 07 to FY08, FY08 recreational visitor spending
would have totaled $196.5 million based on CPI adjusted spending of $25.39 per capita and 7.7
million visitors. Instead, the number of visitors declined to less than 6.9 million.
In addition to fewer visitors, marina operating data and anecdotal evidence gathered through the
resident surveys suggest that remaining visitors also spent less per capita. It is reasonable to
assume that visitors would make shorter trips and spend less per trip (particularly boaters) due to
the reduced recreational value of the lake. Higher percentage reductions in spending would be
This exhibit profiles the distribution of 2006
visitor spending (the last year published by
USACE). This distribution is based on per
capita spending estimates embedded in the
model, multiplied by the number of visitors in
each category. The same source showed that
boaters generated 52% of visitor spending in
2006 and all overnight visitors (boaters and
on-boaters) accounted for 14%.
Figure 33: Spending Characteristics of Lake Lanier Visitors
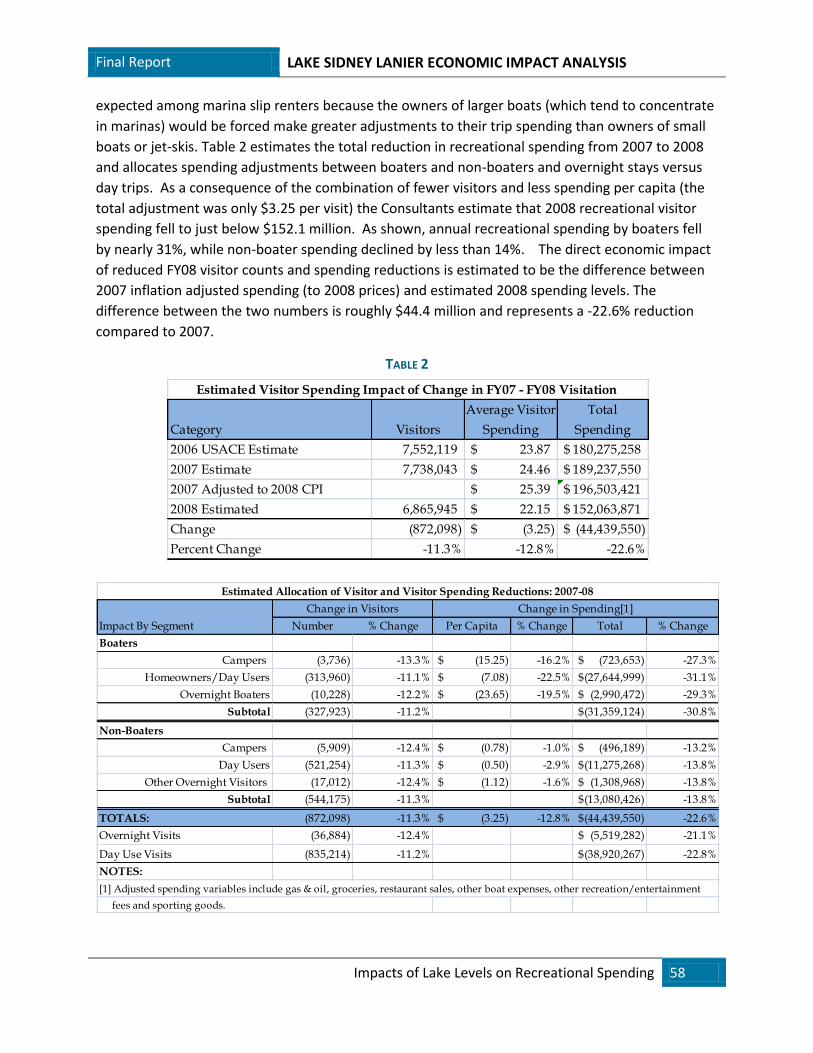
Final Report LAKE SIDNEY LANIER ECONOMIC IMPACT ANALYSIS
Impacts of Lake Levels on Recreational Spending 58
Average Visitor Total
Category Visitors Spending Spending
2006 USACE Estimate 7,552,119 23.87$ 180,275,258$
2007 Estimate 7,738,043 24.46$ 189,237,550$
2007 Adjusted to 2008 CPI 25.39$ 196,503,421$
2008 Estimated 6,865,945 22.15$ 152,063,871$
Change (872,098) (3.25)$ (44,439,550)$
Percent Change -11.3% -12.8% -22.6%
Estimated Visitor Spending Impact of Change in FY07 - FY08 Visitation
Impact By Segment Number % Change Per Capita % Change Total % Change
Boaters
Campers (3,736) -13.3% (15.25)$ -16.2% (723,653)$ -27.3%
Homeowners/Day Users (313,960) -11.1% (7.08)$ -22.5% (27,644,999)$ -31.1%
Overnight Boaters (10,228) -12.2% (23.65)$ -19.5% (2,990,472)$ -29.3%
Subtotal (327,923) -11.2% (31,359,124)$ -30.8%
Non-Boaters
Campers (5,909) -12.4% (0.78)$ -1.0% (496,189)$ -13.2%
Day Users (521,254) -11.3% (0.50)$ -2.9% (11,275,268)$ -13.8%
Other Overnight Visitors (17,012) -12.4% (1.12)$ -1.6% (1,308,968)$ -13.8%
Subtotal (544,175) -11.3% (13,080,426)$ -13.8%
TOTALS: (872,098) -11.3% (3.25)$ -12.8% (44,439,550)$ -22.6%
Overnight Visits (36,884) -12.4% (5,519,282)$ -21.1%
Day Use Visits (835,214) -11.2% (38,920,267)$ -22.8%
NOTES:
[1] Adjusted spending variables include gas & oil, groceries, restaurant sales, other boat expenses, other recreation/entertainment
fees and sporting goods.
Change in Visitors Change in Spending[1]
Estimated Allocation of Visitor and Visitor Spending Reductions: 2007-08
expected among marina slip renters because the owners of larger boats (which tend to concentrate
in marinas) would be forced make greater adjustments to their trip spending than owners of small
boats or jet-skis. Table 2 estimates the total reduction in recreational spending from 2007 to 2008
and allocates spending adjustments between boaters and non-boaters and overnight stays versus
day trips. As a consequence of the combination of fewer visitors and less spending per capita (the
total adjustment was only $3.25 per visit) the Consultants estimate that 2008 recreational visitor
spending fell to just below $152.1 million. As shown, annual recreational spending by boaters fell
by nearly 31%, while non-boater spending declined by less than 14%. The direct economic impact
of reduced FY08 visitor counts and spending reductions is estimated to be the difference between
2007 inflation adjusted spending (to 2008 prices) and estimated 2008 spending levels. The
difference between the two numbers is roughly $44.4 million and represents a -22.6% reduction
compared to 2007.
TABLE 2
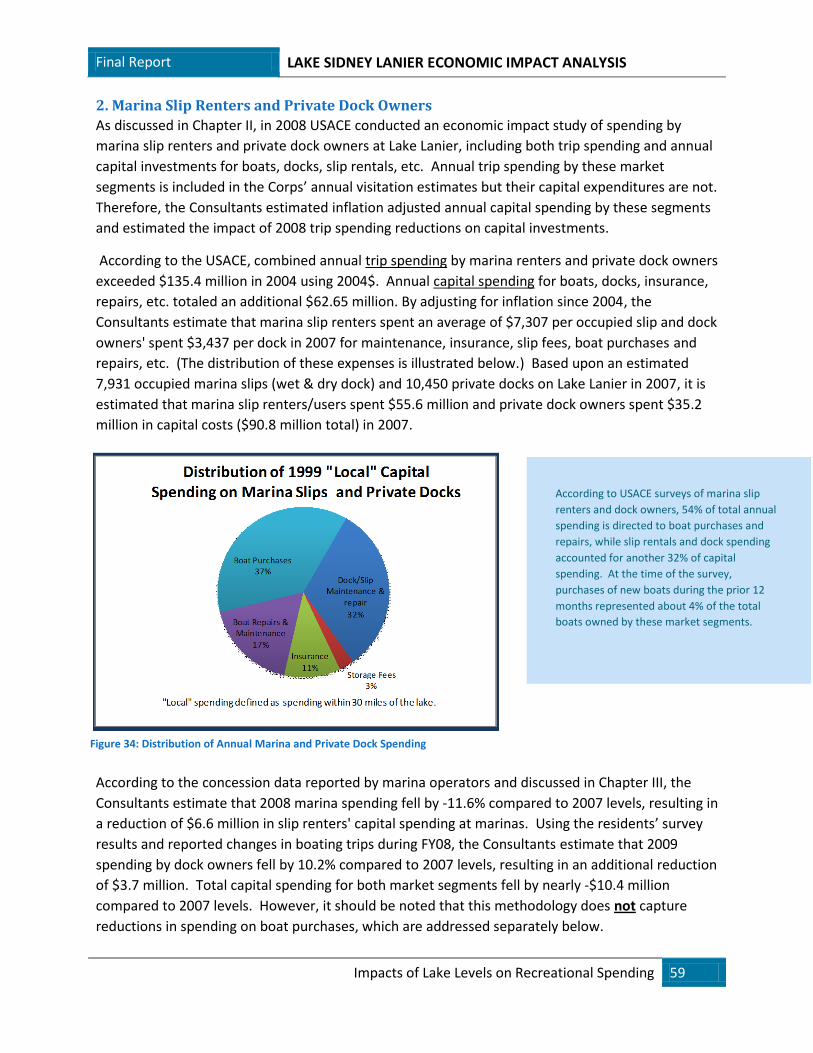
Final Report LAKE SIDNEY LANIER ECONOMIC IMPACT ANALYSIS
Impacts of Lake Levels on Recreational Spending 59
2. Marina Slip Renters and Private Dock Owners
As discussed in Chapter II, in 2008 USACE conducted an economic impact study of spending by
marina slip renters and private dock owners at Lake Lanier, including both trip spending and annual
capital investments for boats, docks, slip rentals, etc. Annual trip spending by these market
segments is included in the Corps’ annual visitation estimates but their capital expenditures are not.
Therefore, the Consultants estimated inflation adjusted annual capital spending by these segments
and estimated the impact of 2008 trip spending reductions on capital investments.
According to the USACE, combined annual trip spending by marina renters and private dock owners
exceeded $135.4 million in 2004 using 2004$. Annual capital spending for boats, docks, insurance,
repairs, etc. totaled an additional $62.65 million. By adjusting for inflation since 2004, the
Consultants estimate that marina slip renters spent an average of $7,307 per occupied slip and dock
owners' spent $3,437 per dock in 2007 for maintenance, insurance, slip fees, boat purchases and
repairs, etc. (The distribution of these expenses is illustrated below.) Based upon an estimated
7,931 occupied marina slips (wet & dry dock) and 10,450 private docks on Lake Lanier in 2007, it is
estimated that marina slip renters/users spent $55.6 million and private dock owners spent $35.2
million in capital costs ($90.8 million total) in 2007.
According to the concession data reported by marina operators and discussed in Chapter III, the
Consultants estimate that 2008 marina spending fell by -11.6% compared to 2007 levels, resulting in
a reduction of $6.6 million in slip renters' capital spending at marinas. Using the residents’ survey
results and reported changes in boating trips during FY08, the Consultants estimate that 2009
spending by dock owners fell by 10.2% compared to 2007 levels, resulting in an additional reduction
of $3.7 million. Total capital spending for both market segments fell by nearly -$10.4 million
compared to 2007 levels. However, it should be noted that this methodology does not capture
reductions in spending on boat purchases, which are addressed separately below.
According to USACE surveys of marina slip
renters and dock owners, 54% of total annual
spending is directed to boat purchases and
repairs, while slip rentals and dock spending
accounted for another 32% of capital
spending. At the time of the survey,
purchases of new boats during the prior 12
months represented about 4% of the total
boats owned by these market segments.
Figure 34: Distribution of Annual Marina and Private Dock Spending
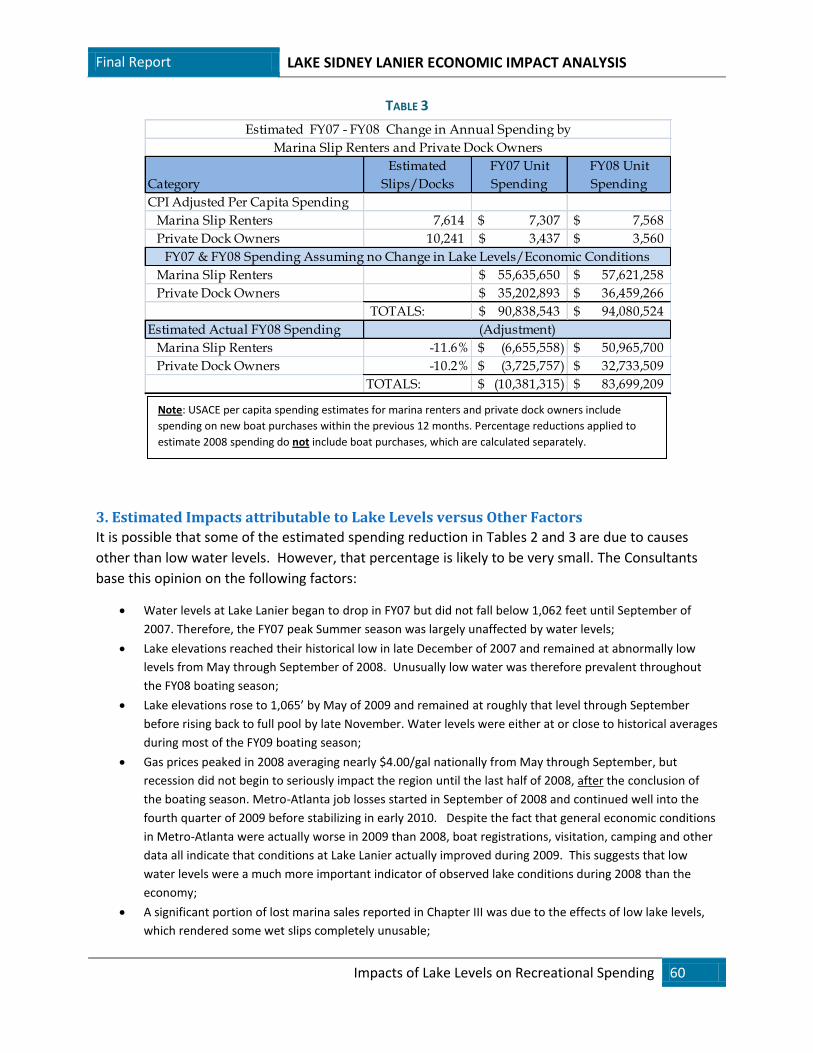
Final Report LAKE SIDNEY LANIER ECONOMIC IMPACT ANALYSIS
Impacts of Lake Levels on Recreational Spending 60
Estimated FY07 Unit FY08 Unit
Category Slips/Docks Spending Spending
CPI Adjusted Per Capita Spending
Marina Slip Renters 7,614 7,307$ 7,568$
Private Dock Owners 10,241 3,437$ 3,560$
Marina Slip Renters 55,635,650$ 57,621,258$
Private Dock Owners 35,202,893$ 36,459,266$
TOTALS: 90,838,543$ 94,080,524$
Estimated Actual FY08 Spending
Marina Slip Renters -11.6% (6,655,558)$ 50,965,700$
Private Dock Owners -10.2% (3,725,757)$ 32,733,509$
TOTALS: (10,381,315)$ 83,699,209$
Estimated FY07 - FY08 Change in Annual Spending by
Marina Slip Renters and Private Dock Owners
(Adjustment)
FY07 & FY08 Spending Assuming no Change in Lake Levels/Economic Conditions
TABLE 3
.
3. Estimated Impacts attributable to Lake Levels versus Other Factors
It is possible that some of the estimated spending reduction in Tables 2 and 3 are due to causes
other than low water levels. However, that percentage is likely to be very small. The Consultants
base this opinion on the following factors:
Water levels at Lake Lanier began to drop in FY07 but did not fall below 1,062 feet until September of
2007. Therefore, the FY07 peak Summer season was largely unaffected by water levels;
Lake elevations reached their historical low in late December of 2007 and remained at abnormally low
levels from May through September of 2008. Unusually low water was therefore prevalent throughout
the FY08 boating season;
Lake elevations rose to 1,065’ by May of 2009 and remained at roughly that level through September
before rising back to full pool by late November. Water levels were either at or close to historical averages
during most of the FY09 boating season;
Gas prices peaked in 2008 averaging nearly $4.00/gal nationally from May through September, but
recession did not begin to seriously impact the region until the last half of 2008, after the conclusion of
the boating season. Metro-Atlanta job losses started in September of 2008 and continued well into the
fourth quarter of 2009 before stabilizing in early 2010. Despite the fact that general economic conditions
in Metro-Atlanta were actually worse in 2009 than 2008, boat registrations, visitation, camping and other
data all indicate that conditions at Lake Lanier actually improved during 2009. This suggests that low
water levels were a much more important indicator of observed lake conditions during 2008 than the
economy;
A significant portion of lost marina sales reported in Chapter III was due to the effects of low lake levels,
which rendered some wet slips completely unusable;
Note: USACE per capita spending estimates for marina renters and private dock owners include
spending on new boat purchases within the previous 12 months. Percentage reductions applied to
estimate 2008 spending do not include boat purchases, which are calculated separately.
Final Report LAKE SIDNEY LANIER ECONOMIC IMPACT ANALYSIS
Impacts of Lake Levels on Recreational Spending 61
Respondents to the resident/visitors survey included a large sample of lakefront property owners who
owned private docks. Of the portion of the sample who reported reduced boating activities during 2008,
the reason was almost entirely attributable to low water levels. This observation is supported by the age
and income characteristics of these dock owners, which includes a major presence of retirees who would
not have been impacted by job losses or large reductions in incomes.
Given these findings, the Consultants estimate that at least 90% of the measured drop in marina
revenues can be specifically traced to low lake elevations. The percentage attributed to private
dock owners is even higher at 95%. Applying these percentages, roughly 92% of the estimated
reduction in capital spending was attributed to drought conditions rather than economic or other
factors. Therefore, drought-related spending reductions during 2008 are estimated at $9.5 million
for these market segments. Reductions in general visitor spending are even less likely to have been
influenced by market forces due to the much lower per capita spending by levels among day
visitors. The consultants estimate that roughly 96% of visitor spending reductions or $23.5 million
can be attributed to low water levels.
4. New and Used Boat Sales
Table 4 converts estimated changes in registrations of new and used boats to value, based upon the
types, lengths and ages of boats reported in Chapter III. Based upon our analysis of new
registrations, the Consultants estimate that $63.7 million worth of additional new and pre-owned
boats were purchased and housed in the 5 counties surrounding Lake Lanier during 2007. In the
following year that investment dropped to less than $28.4 million (-55.4%), resulting in a reduction
of $35.3 million in boat purchases. As previously noted, these numbers do not include transactions
associated with the transfer of existing registrations. Ownership transfers of existing boat
registrations actually increased by 15% from 2007 to 2008 and by more than 56% (1,886 boats) in
2009, probably due to foreclosures, repossessions and other economic reasons. The reduction of
more than $35 million in local boat purchases is both consistent with and helps to explain the larger
($50+ million) drop in the personal property valuation of boats based in the 5 Counties.
If observed changes in the Lake Lanier Counties were consistent with national boating industry
trends, then the DNR boat registration data would have revealed an approximate $13.1 million
reduction in new and used boat purchases from 2007 to 2008. The actual measured decline was
more than $22.1 million larger than that amount, indicating that 63% of the observed $35.3 million
reduction in the value of boat registrations could be directly attributable to low lake elevations
rather than national economic conditions. Again, this is only a partial estimate that does not
include further reductions in boat purchases among residents of other nearby counties (like DeKalb)
who also tend to boat on Lake Lanier. This observation is also consistent with the personal property
valuation of boats, which showed that value reductions in the counties surrounding Lake Lanier
were much worse than those observed elsewhere in Georgia.
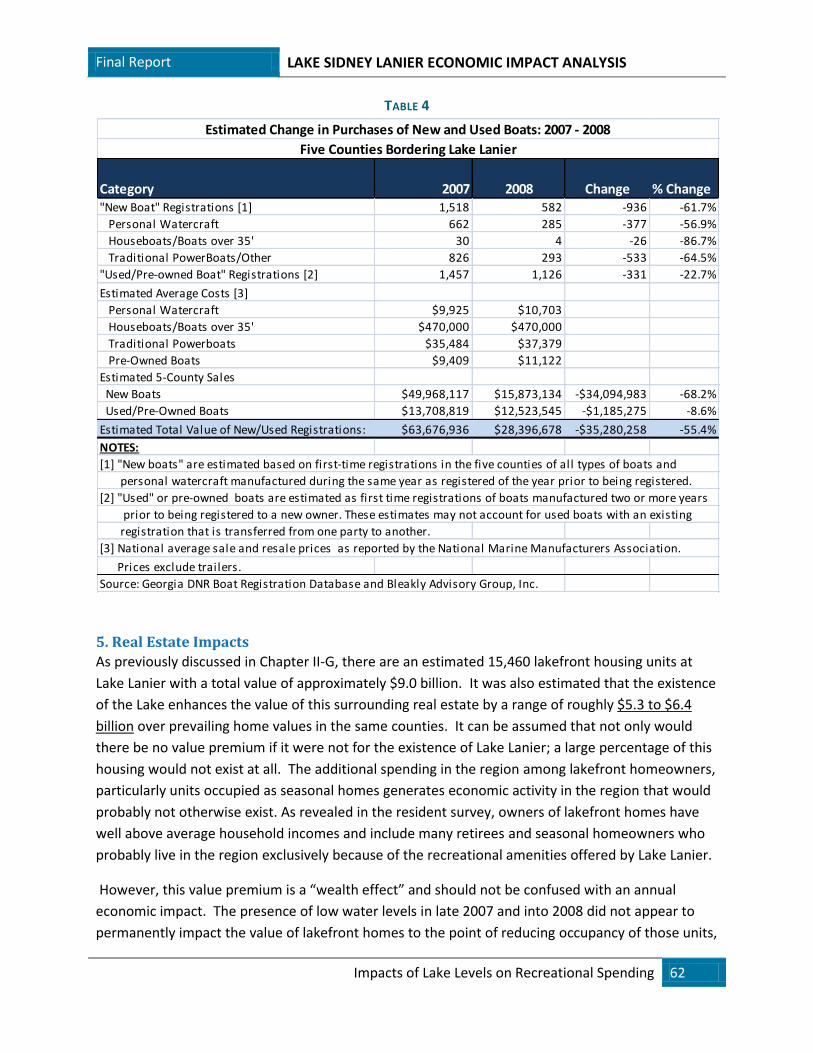
Final Report LAKE SIDNEY LANIER ECONOMIC IMPACT ANALYSIS
Impacts of Lake Levels on Recreational Spending 62
Category 2007 2008 Change % Change"New Boat" Registrations [1] 1,518 582 -936 -61.7%
Personal Watercraft 662 285 -377 -56.9%
Houseboats/Boats over 35' 30 4 -26 -86.7%
Traditional PowerBoats/Other 826 293 -533 -64.5%
"Used/Pre-owned Boat" Registrations [2] 1,457 1,126 -331 -22.7%
Estimated Average Costs [3]
Personal Watercraft $9,925 $10,703
Houseboats/Boats over 35' $470,000 $470,000
Traditional Powerboats $35,484 $37,379
Pre-Owned Boats $9,409 $11,122
Estimated 5-County Sales
New Boats $49,968,117 $15,873,134 -$34,094,983 -68.2%
Used/Pre-Owned Boats $13,708,819 $12,523,545 -$1,185,275 -8.6%
Estimated Total Value of New/Used Registrations: $63,676,936 $28,396,678 -$35,280,258 -55.4%
NOTES:
[1] "New boats" are estimated based on first-time registrations in the five counties of all types of boats and
personal watercraft manufactured during the same year as registered of the year prior to being registered.
[2] "Used" or pre-owned boats are estimated as first time registrations of boats manufactured two or more years
prior to being registered to a new owner. These estimates may not account for used boats with an existing
registration that is transferred from one party to another.
[3] National average sale and resale prices as reported by the National Marine Manufacturers Association.
Prices exclude trailers.
Source: Georgia DNR Boat Registration Database and Bleakly Advisory Group, Inc.
Estimated Change in Purchases of New and Used Boats: 2007 - 2008
Five Counties Bordering Lake Lanier
TABLE 4
5. Real Estate Impacts
As previously discussed in Chapter II-G, there are an estimated 15,460 lakefront housing units at
Lake Lanier with a total value of approximately $9.0 billion. It was also estimated that the existence
of the Lake enhances the value of this surrounding real estate by a range of roughly $5.3 to $6.4
billion over prevailing home values in the same counties. It can be assumed that not only would
there be no value premium if it were not for the existence of Lake Lanier; a large percentage of this
housing would not exist at all. The additional spending in the region among lakefront homeowners,
particularly units occupied as seasonal homes generates economic activity in the region that would
probably not otherwise exist. As revealed in the resident survey, owners of lakefront homes have
well above average household incomes and include many retirees and seasonal homeowners who
probably live in the region exclusively because of the recreational amenities offered by Lake Lanier.
However, this value premium is a “wealth effect” and should not be confused with an annual
economic impact. The presence of low water levels in late 2007 and into 2008 did not appear to
permanently impact the value of lakefront homes to the point of reducing occupancy of those units,
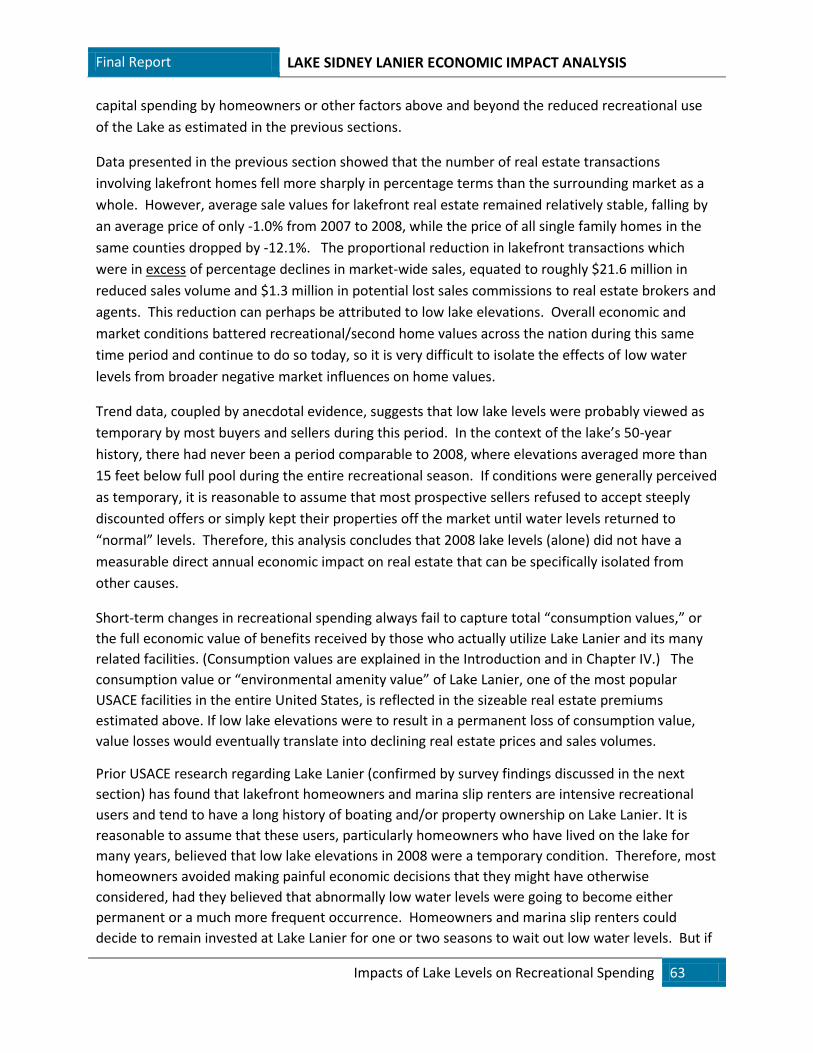
Final Report LAKE SIDNEY LANIER ECONOMIC IMPACT ANALYSIS
Impacts of Lake Levels on Recreational Spending 63
capital spending by homeowners or other factors above and beyond the reduced recreational use
of the Lake as estimated in the previous sections.
Data presented in the previous section showed that the number of real estate transactions
involving lakefront homes fell more sharply in percentage terms than the surrounding market as a
whole. However, average sale values for lakefront real estate remained relatively stable, falling by
an average price of only -1.0% from 2007 to 2008, while the price of all single family homes in the
same counties dropped by -12.1%. The proportional reduction in lakefront transactions which
were in excess of percentage declines in market-wide sales, equated to roughly $21.6 million in
reduced sales volume and $1.3 million in potential lost sales commissions to real estate brokers and
agents. This reduction can perhaps be attributed to low lake elevations. Overall economic and
market conditions battered recreational/second home values across the nation during this same
time period and continue to do so today, so it is very difficult to isolate the effects of low water
levels from broader negative market influences on home values.
Trend data, coupled by anecdotal evidence, suggests that low lake levels were probably viewed as
temporary by most buyers and sellers during this period. In the context of the lake’s 50-year
history, there had never been a period comparable to 2008, where elevations averaged more than
15 feet below full pool during the entire recreational season. If conditions were generally perceived
as temporary, it is reasonable to assume that most prospective sellers refused to accept steeply
discounted offers or simply kept their properties off the market until water levels returned to
“normal” levels. Therefore, this analysis concludes that 2008 lake levels (alone) did not have a
measurable direct annual economic impact on real estate that can be specifically isolated from
other causes.
Short-term changes in recreational spending always fail to capture total “consumption values,” or
the full economic value of benefits received by those who actually utilize Lake Lanier and its many
related facilities. (Consumption values are explained in the Introduction and in Chapter IV.) The
consumption value or “environmental amenity value” of Lake Lanier, one of the most popular
USACE facilities in the entire United States, is reflected in the sizeable real estate premiums
estimated above. If low lake elevations were to result in a permanent loss of consumption value,
value losses would eventually translate into declining real estate prices and sales volumes.
Prior USACE research regarding Lake Lanier (confirmed by survey findings discussed in the next
section) has found that lakefront homeowners and marina slip renters are intensive recreational
users and tend to have a long history of boating and/or property ownership on Lake Lanier. It is
reasonable to assume that these users, particularly homeowners who have lived on the lake for
many years, believed that low lake elevations in 2008 were a temporary condition. Therefore, most
homeowners avoided making painful economic decisions that they might have otherwise
considered, had they believed that abnormally low water levels were going to become either
permanent or a much more frequent occurrence. Homeowners and marina slip renters could
decide to remain invested at Lake Lanier for one or two seasons to wait out low water levels. But if
Final Report LAKE SIDNEY LANIER ECONOMIC IMPACT ANALYSIS
Impacts of Lake Levels on Recreational Spending 64
such conditions persisted over time, large numbers of
homeowners would eventually sell or relocate if convinced
that elevations were not going to return to historical
norms.
Consequently, the negative effects of low water levels on
the consumption value of lakefront real estate are not fully
reflected in a single year of transaction data, particularly if
the beneficiaries of consumption value perceive the
impacts to be drought-related and temporary. However, IF
2008 lake elevations were to become a prevalent future
condition rather than a one-year anomaly, it is very likely
that percentage declines in real estate transactions and
home values will be much larger, perhaps orders of
magnitude greater than were observed over a single
season.
Insights into the potential effects of a permanent or
frequent recurrence of 2008 water levels on the
consumption value of Lake Lanier real estate can be gained
by examining similar studies of amenity values in
comparable settings. Examples cited in Section IV
specifically refer to studies of other lakes. A more recent
study conducted by CoreLogic, Inc., a California-based
consulting firm, analyzed the effects of the BP Deepwater
Horizon oil spill on the amenity value of coastal real estate along sections of the Gulf Coast which
were directly impacted by the oil spill.20 Using “hedonic price theory” to estimate the value that
consumers place on environmental amenities, CoreLogic estimated the impacts of the oil spill on
600,000 residential properties located within 1,000 meters of the Gulf Coast. The study spanned 15
counties stretching from Mississippi to the southern tip of Florida. (Impacts were estimated over 5
years under the assumption that cleanup efforts would be successful and fully restore coastal
amenity values over time.) Temporary impacts were estimated by calculating the “perpetuity value”
consumers place on access to beach amenities as a function of distance to the shoreline, and
converting those estimates to an annual annuity value using a discounted present value technique.
The CoreLogic study concluded that the reduction in home values “is expected to range from $648
million over one year to as much as $3.0 billion over 5 years.” The highest risk/most impacted areas
of the Gulf Coast included 71,000 residential properties which were “at risk” of suffering an
estimated average 5-year loss in beach amenities, valued between $40,000 and $56,000 per unit.
These highest risk counties included Gulfport MI, Mobile AL and Pensacola FL.
20
“New CoreLogic Data Shows the Potential Impact of the BP Deepwater Horizon Oil Spill on Coastal Real Estate”, press release issued by
CoreLogic, Inc. dated August 2, 2010.
Elevation drops of 20 feet experienced
in late 2007 through 2008 clearly
impacted the consumption or amenity
value of Lake Lanier real estate,
rendering hundreds of private docks
unusable and diminishing the view
quality of thousands of lakefront
homes. Loss of amenity value was
greater than reflected in real estate
sales data, as only a small portion of
lakefront real estate is sold or turns
over in a typical year.
Final Report LAKE SIDNEY LANIER ECONOMIC IMPACT ANALYSIS
Impacts of Lake Levels on Recreational Spending 65
It is beyond the scope of this report to calculate the loss of amenity value to Lake Lanier
homeowners associated with a temporary or permanent 20 foot drop in lake levels. However, if it
is assumed that the negative effects of severe elevation drops are comparable to the Gulf Coast
situation and that average real estate values in the three affected Gulf Coast Counties are
comparable to Lake Lanier, then the per unit impacts could be somewhat comparable.
Applying the low end of the range ($40,000 per unit) calculated in the CoreLogic study to 15,460
lakefront units, a one-year loss of amenity value at Lake Lanier would total $133.6 million or 1.5% of
the estimated $9.0 billion in residential property value which surrounds the lake. If it is assumed
that 2008 elevations were a longer-term or recurring condition, the loss of amenity value could
exceed $618.4 million or 6.9% over 5 years.21 These impacts are obviously much larger than
reflected in a single year of home sales data and appear to be reasonable in light of observed
conditions.
Absent of a historical record for such a condition, it would be speculative to suggest how far values
could drop or what the resulting impacts would be. But even a modest 6.9% reduction in lakefront
home values would represent a loss of $1.8 billion in total value. Such a decline would severely
impact the affected homeowners as well the real estate, financial and construction sectors of the
local economy. Value losses of this magnitude would also lower property tax revenues to the
respective counties and school districts by more than $6.1 million.
6. Summary Conclusions: Direct Impacts
Based upon an analysis of changes in visitor spending, annual investments by marina slip renters
and private dock owners, plus changes in local registrations of new and used boats, it is estimated
that local recreational spending at Lake Lanier fell by an estimated $90.1 million in 2008 compared
to 2007 levels. Estimated direct impacts on “local” spending (within a 30-mile radius) of Lake
Lanier included:
A $44.4 million reduction in recreational trip spending due to declining numbers of visitors
and the changing nature of activities among visitors;
A $10.4 million reduction in annual capital spending by marina slip renters and private dock
owners due to their reduced boating activity on the lake;
A $35 million reduction in purchases of new and used boats; and
A potential one-year loss of consumption value or amenity value of lakefront real estate
totaling roughly $133 million of 1.5% of the value of residential property value which
surrounds the lake.
Of the total reduction in Lake Lanier recreational spending from 2007 to 2008, the Consultants
estimated that approximately $87.6 million or 97% was directly attributable to low lake elevations
rather than other causes. It should also be noted that these impacts relate only to recreational
21
When using discounted present value methodology to allocate the effects of a multi-year condition, first year impacts are proportionally
larger than out year effects.
Final Report LAKE SIDNEY LANIER ECONOMIC IMPACT ANALYSIS
Impacts of Lake Levels on Recreational Spending 66
spending and do not include additional economic impacts that may have resulted from reductions
in sales of lakefront homes and resulting losses in real estate sales commissions and financing fees
from new mortgages.
Although very significant, the $87.6 million reduction in direct recreational spending could have
actually been much worse had in not been for the fact that drought conditions were a clear
anomaly in the context of the Lake’s 50-year history. Most recreational users probably avoided
making painful economic decisions that they would have made otherwise, had they believed that
abnormally low water levels were going to become either a permanent or much more frequent
occurrence. Although recreational day visitors could easily adjust their spending habits over the
course of a single season, lakefront homeowners and marina slip renters did not have that same
flexibility. Homeowners and marina slip renters would probably make the decision to remain
invested at Lake Lanier to wait out low water levels, but would eventually sell or relocate if
convinced that lake elevations were not going to return to historical norms. If 2008 lake levels were
to be perceived by the market as a long-term or frequent condition rather than a temporary, one-
time occurrence, it is very likely that percentage declines in marina occupancy, boat sales, overnight
visitation and real estate values would be much more severe and perhaps orders of magnitude
greater than observed over a single season.
The economic impacts of these direct spending reductions, including indirect effects and impacts on
employment are addressed in Section IV.
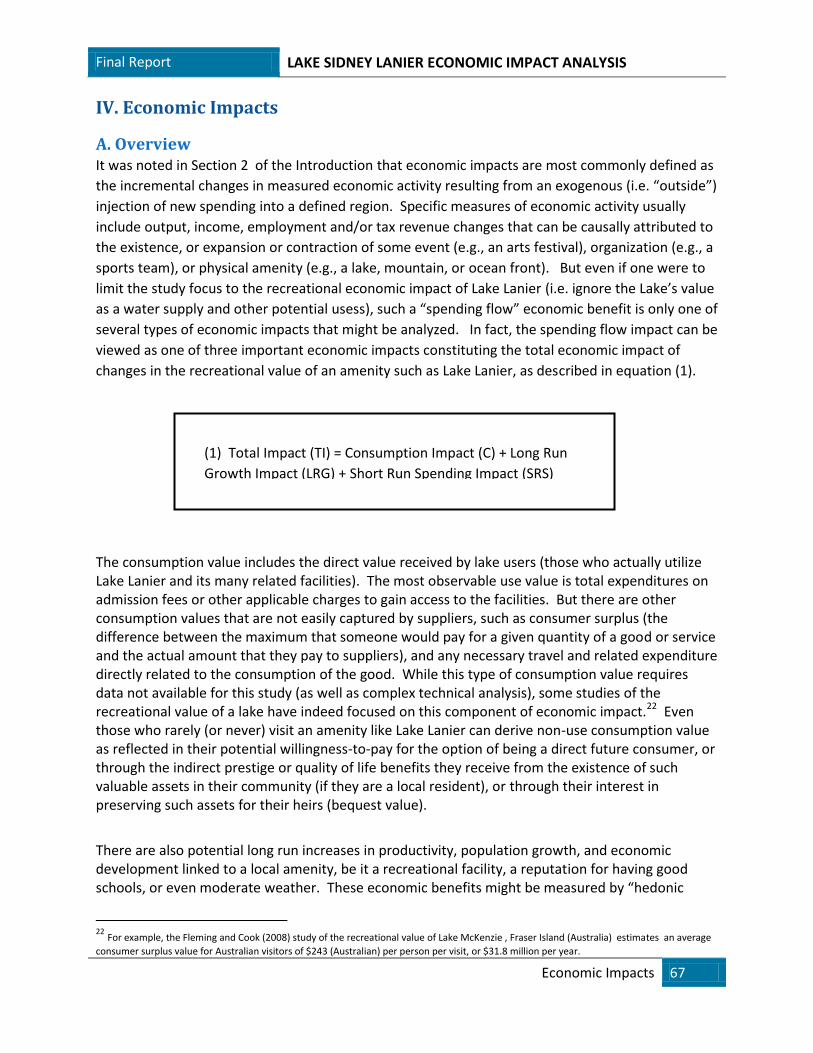
Final Report LAKE SIDNEY LANIER ECONOMIC IMPACT ANALYSIS
Economic Impacts 67
IV. Economic Impacts
A. Overview It was noted in Section 2 of the Introduction that economic impacts are most commonly defined as
the incremental changes in measured economic activity resulting from an exogenous (i.e. “outside”)
injection of new spending into a defined region. Specific measures of economic activity usually
include output, income, employment and/or tax revenue changes that can be causally attributed to
the existence, or expansion or contraction of some event (e.g., an arts festival), organization (e.g., a
sports team), or physical amenity (e.g., a lake, mountain, or ocean front). But even if one were to
limit the study focus to the recreational economic impact of Lake Lanier (i.e. ignore the Lake’s value
as a water supply and other potential usess), such a “spending flow” economic benefit is only one of
several types of economic impacts that might be analyzed. In fact, the spending flow impact can be
viewed as one of three important economic impacts constituting the total economic impact of
changes in the recreational value of an amenity such as Lake Lanier, as described in equation (1).
The consumption value includes the direct value received by lake users (those who actually utilize Lake Lanier and its many related facilities). The most observable use value is total expenditures on admission fees or other applicable charges to gain access to the facilities. But there are other consumption values that are not easily captured by suppliers, such as consumer surplus (the difference between the maximum that someone would pay for a given quantity of a good or service and the actual amount that they pay to suppliers), and any necessary travel and related expenditure directly related to the consumption of the good. While this type of consumption value requires data not available for this study (as well as complex technical analysis), some studies of the recreational value of a lake have indeed focused on this component of economic impact.22 Even those who rarely (or never) visit an amenity like Lake Lanier can derive non-use consumption value as reflected in their potential willingness-to-pay for the option of being a direct future consumer, or through the indirect prestige or quality of life benefits they receive from the existence of such valuable assets in their community (if they are a local resident), or through their interest in preserving such assets for their heirs (bequest value).
There are also potential long run increases in productivity, population growth, and economic development linked to a local amenity, be it a recreational facility, a reputation for having good schools, or even moderate weather. These economic benefits might be measured by “hedonic
22
For example, the Fleming and Cook (2008) study of the recreational value of Lake McKenzie , Fraser Island (Australia) estimates an average
consumer surplus value for Australian visitors of $243 (Australian) per person per visit, or $31.8 million per year.
(1) Total Impact (TI) = Consumption Impact (C) + Long Run
Growth Impact (LRG) + Short Run Spending Impact (SRS)
Final Report LAKE SIDNEY LANIER ECONOMIC IMPACT ANALYSIS
Economic Impacts 68
values “reflected as changes in property values (as addressed in this study) and rents in a community with desirable amenities (which also generate additional local tax revenues used to enhance local public services important for development), or reduced business labor expenses resulting from workers willing to accept lower wages in more desirable locations (hence encouraging business expansion). There is little doubt that the existence of Lake Lanier has been an important factor in the historical population growth of the surrounding counties, especially Hall and Forsyth Counties, although part of the effect has been to shift the location decisions of the regional population who especially value Lake Lanier closer to the shorelines. In any case, since the focus of this study is on the shorter term incremental effects of dramatically low recent lake water levels, the potentially significant longer term economic effect of reduced residential population in the five target counties, if such extremely low lake levels were to persist over a long time period, is not directly addressed. (See inset at right for further explanation.)
The third component of the total economic impact is called the short run spending impact even though the time period over which such impacts are realized can extend over months and even more than a year as the full induced “multiplier” effects of the initial direct spending impacts work their way through the local economy. But those effects are short term in contrast to the longer run economic development effects just discussed. Consumption impacts are also realized in the short run, and are not limited to non-local visitors but also apply to local residents. Conceptually, a sophisticated economic impact study of “X” should attempt to answer the question: “How much would short run economic activity decline in a specific region if X were no longer to exist or to be significantly reduced in size?” A thorough input-output model designed to identify the interdependencies across sectors of the local economy (e.g., indirect vendors), combined with a scrupulous analysis of the data designed to accurately identify directly injected economic impact would ideally be used to address this question. Such an analysis would:
(1) Distinguish between net injections into the region from tourists or other external sources and diversions of local spending;
(2) Identify immediate leakages from the local region by carefully identifying all vendors and spending flows (with the amount of spending retained locally through at least one spending round sometimes termed the “capture rate”),
The conceptual issue raised by the size of the
local population itself being affected by the
existence of the lake (and its water level) is
linked to the distinction in the spending impact
analysis between a “resident visitor” and a “non-
local visitor.” As further discussed in the text,
this is an important distinction to make since net
injections of new economic activity are
fundamentally different from the reallocation
within a target area of existing economic activity.
But that distinction is clouded when the very size
of the resident population may be an
“endogenous” function of the amenity being
studied.
An extreme example is the economic impact on
Perth Australia of its international airport, which
is clearly a critical reason why that isolated city in
Western Australia has been able to grow into a
major metropolis. While a very large
percentage of the users of that airport are
indeed “local residents” who might be viewed as
recycling spending from one local sector of the
economy to another, many of those local
residents and their economic contributions
would doubtless relocate elsewhere were it not
for their ability to enter and leave that region
conveniently rather than endure a lengthy
transcontinental train or auto trip (or traveling
by sea to periodically travel outside Australia).
While Lake Lanier’s effect on the population
growth of the entire five county region cannot
be expected to be as great as that extreme
example, this study does capture part of this
effect by measuring the lost ad valorem property
tax revenues as some boats are relocated to
other lakes outside that local region and housed
elsewhere as Lake Lanier water levels drop.
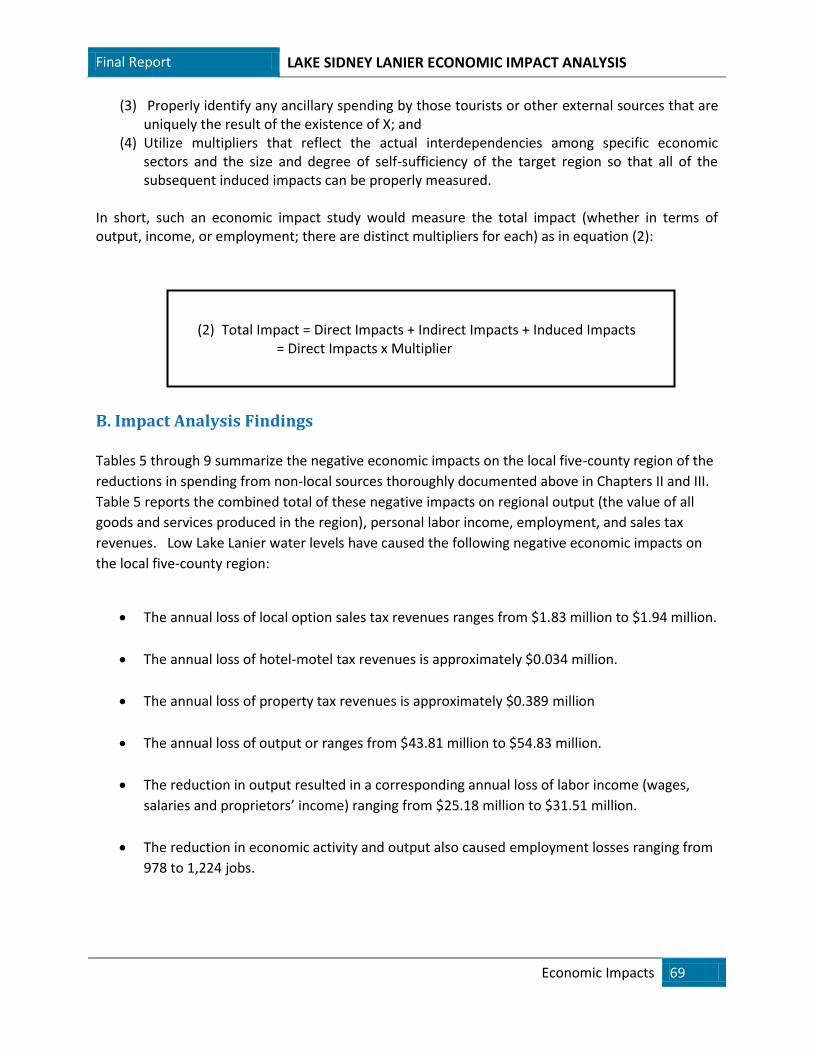
Final Report LAKE SIDNEY LANIER ECONOMIC IMPACT ANALYSIS
Economic Impacts 69
(3) Properly identify any ancillary spending by those tourists or other external sources that are uniquely the result of the existence of X; and
(4) Utilize multipliers that reflect the actual interdependencies among specific economic sectors and the size and degree of self-sufficiency of the target region so that all of the subsequent induced impacts can be properly measured.
In short, such an economic impact study would measure the total impact (whether in terms of output, income, or employment; there are distinct multipliers for each) as in equation (2):
B. Impact Analysis Findings Tables 5 through 9 summarize the negative economic impacts on the local five-county region of the
reductions in spending from non-local sources thoroughly documented above in Chapters II and III.
Table 5 reports the combined total of these negative impacts on regional output (the value of all
goods and services produced in the region), personal labor income, employment, and sales tax
revenues. Low Lake Lanier water levels have caused the following negative economic impacts on
the local five-county region:
The annual loss of local option sales tax revenues ranges from $1.83 million to $1.94 million.
The annual loss of hotel-motel tax revenues is approximately $0.034 million.
The annual loss of property tax revenues is approximately $0.389 million
The annual loss of output or ranges from $43.81 million to $54.83 million.
The reduction in output resulted in a corresponding annual loss of labor income (wages,
salaries and proprietors’ income) ranging from $25.18 million to $31.51 million.
The reduction in economic activity and output also caused employment losses ranging from
978 to 1,224 jobs.
(2) Total Impact = Direct Impacts + Indirect Impacts + Induced Impacts = Direct Impacts x Multiplier
Final Report LAKE SIDNEY LANIER ECONOMIC IMPACT ANALYSIS
Economic Impacts 70
These results are the total impacts stemming from declines in regional economic activity from four
specific sources, as analyzed in Chapters II and III. In all cases they are linked from that earlier
analysis to estimated gross reductions in spending as a result of low water levels distinct from
declines in aggregate economic activity due to the overall weakness in the economy over this
period. The four sources of the negative economic impacts are identified in more detail in Tables 6
through 9 as follows:
Reductions in visitor recreational spending (Table 6)
Reductions in marina slip and private dock owner spending (Table 7)
Reductions in spending linked to lost new and used boat sales (Table 8)
Reductions in spending as a result of lost ad valorem boat property tax revenues (Table 9)
In all tables reporting the results, there are some common methodological features in translating
the gross reductions in spending due to low lake water levels into the specific negative economic
impacts. Any unique issues important to understanding the analysis of any particular table are
identified in the notes following particular tables.
The common elements in the analysis are:
1. The total reduced spending in the first row corresponds to the lower estimated
spending from all sources, non-local visitors as well as five-county local residents.
2. The total reduced non-local visitor spending isolates that portion of the total reduced
spending estimated to originate from sources outside the local five-county area. This
adjustment factor is estimated to be 0.55 (55%), which is roughly the average of a
number of estimates for different lakes provided by the U.S. Army Corps of Engineers.
While attempts were made to generate more refined estimates for this important
parameter specific to Lake Lanier from surveys and interviews conducted by the
consultant team, no better estimates were forthcoming from those sources. Despite
USACE efforts to accurately measure overall visitations (see Chapters II and III), it does
not have good data isolating the origin of those visitors for Lake Lanier. The 55% figure
is deemed a reasonable adjustment given the known geographical relationships
between the target five counties, their relationship to metro-Atlanta, and other studies
regarding both lake and non-lake economic impacts.
3. While the second row in the tables is therefore 0.55 x the gross spending reductions for
both Case 1 and Case 2, the third row begins the divergence in the calculated impacts in
those two cases. Capture rates are the difference in the two cases. A capture rate, as
observed above, refers to that portion of a change in spending that does not
immediately “leak” from the local economy in the form of payments to non-local
vendors, the manufacturer versus retailer share of retail purchases, or other profits
accruing to non-local owners of enterprises operating in the local region. The USACE
estimates the capture rate as 67% for Lake Lanier, but also has reported capture rates as
Final Report LAKE SIDNEY LANIER ECONOMIC IMPACT ANALYSIS
Economic Impacts 71
high as 83% for other lakes in their system. Also, based on the right-hand margin
discussion above on page 50, the existence of a “healthy” Lake Lanier is responsible for
at least some portion of population growth in the local region suggesting that the
economic impacts of Lake Lanier might be underestimated using the standard tools of
economic impact analysis without adjusting for this “endogenous” population effect.
Furthermore, since the Army Corps of Engineers defines the local area for purposes of
deriving multipliers and estimating capture rates as essentially a thirty mile radius
spending area, but the location of vendors relevant to the economies of the five country
area extends beyond that limited territory, there is an additional risk of understating the
economic impacts on Lake Lanier area economies.
4. For the reasons identified in (3), we report both a Case 1 with a capture rate of 85%, as
well as the 67% capture rate in Case 2. Again, while the 67% capture rate is the one
reported by the Corps for Lake Lanier, capture rates of nearly 85% have been cited in
past USACE reports on the local economic impacts of recreation at other Corps of
Engineers Projects. The third row in Tables 6 and 7 (and the fourth row in Table 8) is
therefore either 0.85, or 0.67 multiplied by the total reduced non-local spending in row
two to reflect the “direct spending economic impact.” The analysis regarding lost boat
sales in Table 8 reflects an additional required adjusting for retail profit margins, which
yields the result in summary Table 5. Note that the capture rate is 100% for local lost
property taxes in Table 9, since all property tax revenues obtained by local governments
would be initially spent within those local areas.
5. However, even when the local region does not fully capture all of the spending related
to Lake activities, most of that spending in the “first round” is still subject to local option
sales taxes (e.g., even though non-local manufacturers capture part of the retail price of
goods that are sold in the local area, the local option sales tax would still apply to the
full retail price). Since not all goods (and especially not all services) are subject to local
option sales taxes, some further adjustment is necessary to reflect this tax base erosion
effect. At the direct spending stage, this adjustment factor is estimated to be 0.95 for
all cases except lost new and boat sales (Table 8), where there is no tax base erosion
since those purchases are entirely taxable. The adjustment factor is 0.78 for subsequent
“rounds” of spending, reflecting greater tax base erosion as spending works its way
through the local economy. Since there is no direct sales tax linked to lost property tax
revenues, this adjustment factor is not relevant to Table 9. Therefore, the rows labeled
“Local direct sales tax impact” in Tables 5, 6 and 7 are calculated as 0.95 x total reduced
non-local spending x 0.03 (the local option sales tax is 3.0% in each of the five local
counties). In Table 8 regarding lost boat sales, the calculation does not utilize the 0.95
adjustment factor.
6. The direct impacts identified above in equation (2 ) are labeled “Direct spending +tax
economic impact” in all tables, and reflect the net change in the local economy of all
Final Report LAKE SIDNEY LANIER ECONOMIC IMPACT ANALYSIS
Economic Impacts 72
non-locally sourced economic activity linked to spending changes resulting from low
Lake water levels. This impact does not reflect any additional indirect impacts
elsewhere in the local economy linked to subsequent “multiplier” rounds of economic
output in industries supplying goods and services to the tourism and related businesses
directly operating at the Lake. Nor does it reflect the subsequent induced spending
impacts related to household income changes generated b y the direct impacts.
7. The indirect impacts noted in paragraph (6) are captured in the row labeled “Indirect
economic impact,” and reflects that an additional 20% of local output is generated in
the local industries closely linked to Lake related businesses as suppliers/vendors. This
20% figure is derived from the Corps reported “Type I” IMPLAN database sales multiplier
of 1.2 applicable to Lake Lanier.
8. The induced impacts noted in paragraph (6) are reported as the “Induced economic
Impact” and is consistent with the USACE reported IMPLAN “Type III” database
multiplier of 1.74 that in turn generates the “Total local economic impact.” While the
total economic impact is therefore the direct spending + tax economic impact x 1.74,
the resulting induced economic impact is that total economic impact minus both the
direct impact and the indirect impact.
9. Total employment impacts are derived using the IMPLAN based Type III “jobs multiplier”
reported by the USACE for Lake Lanier. That multiplier of 38.85 is designed to capture
the total jobs created per $1 million of direct impact (defined in the tables as “Direct
spending + tax economic impact), and reflects the sum of all direct, indirect and induced
impacts of such spending injections on total employment. For example, in Table 5, the
Case 1 direct spending + tax economic impact is $31,509,8 28 , which translates into
31.509828 x 38.85 = 1,224 total jobs. For the lower capture rate Case 2, that result is
25.178005 x 38.85 = 978 total jobs. These Table 5 totals are themselves derived from
the subtotals reported in Tables 6, 7, 8 and 9.
10. Finally, the total local sales taxes reported in the last row of all tables except Table 9 are
the sum of the direct sales tax impact and the “induced + indirect sales taxes” reported
separately. Since there are no direct sales tax impacts from the loss of county ad
valorem boat property tax revenues, only the induced + indirect sales tax revenues are
reported in Table 9. The indirect and induced sales tax revenues are those generated
through the multiplier process linked to both vendor supply interactions and household
income spending, and must also adjust for the larger expected erosion of the sales tax
base during such longer term spending rounds. Hence, the typical calculation of these
revenues first requires the isolation of the indirect plus the induced economic impacts,
multiplied by 0.78 to adjust for the tax base erosion, and finally multiplied by the 0.03
(3.0%) local option sales tax rate applicable to the core counties.
Final Report LAKE SIDNEY LANIER ECONOMIC IMPACT ANALYSIS
Economic Impacts 73
NOTES: *1+ Assumes 55% of such spending comes from “non-local” sources (i.e. not originating in the five country target area). [2] Assumes 95% of all non-local visitor direct spending is for items in sales tax base (local option sales tax rate = 3.0%), except for boat sales where it is 100% of the sales tax base. But 78% of indirect and induced spending is in the sales tax base (a tax base erosion of 22%).
Note that the underlying component of reduced spending linked to lost county ad valorem taxes is entirely
spent locally, so the capture rate for that component of reduced spending is 100%
Documentation of the economic impact results is provided in the following tables:
TABLE 5
Summary of TOTAL Incremental Economic Impact From all Non-Local Sources [1]
Category Case 1 (capture = 85%) Case 2 (capture = 67%)
Total reduced spending $87,654,437 $87,654,437
Total reduced non-local spend $48,209,940 $48,209,940
Direct spend economic impact $30,114,481 $23,782,658
Direct sales tax impact [2] $1,395,347 $1,395,347
Direct spend + tax econ impact $31,509,828 $25,178,005
Indirect economic impact $6,301,965 $5,035,601
Induced economic impact $17,015,307 $13,596,123
Indirect + induced sales taxes $545,625 $435,982
Total local economic impact $54,827,100 $43,809,729
Total employment impact 1,224 977
Total local sales taxes $1,904,972 $1,831,329
Final Report LAKE SIDNEY LANIER ECONOMIC IMPACT ANALYSIS
Economic Impacts 74
NOTES: [1] Assumes 55% of visitors are “non-local” (i.e. not originating in the five county target area). [2] Assumes 95% of direct non-local visitor spending is for items in sales tax base (local option sales tax rate = 3.0%) [3] Incorporates 22% erosion of the sales tax base via indirect and induced spending. [4] This figure does not include lost hotel-motel tax revenues, which are likely to be quite modest, inasmuch
as only about 15% of overnight visits to Lake Lanier attractions include lodging in commercial hotel and motel facilities where the collection of this tax is standard practice. With an average 6% hotel-motel tax rate in the five-county area (which is also the average tax rate for Hall (5%) and Forsyth (7%) Counties, these lost annual revenues may be no higher than about $34,238 (assuming average room occupancy of 2.5 persons yielding a loss of about 4,076 room nights, and an average pre-tax nightly room rate of $140; those staying at hotels or motels are also more likely to be visitors from outside the local region).
TABLE 6
Summary of Incremental Economic Impact Reduced Non-Local Visitor Recreational Spending [1]
Category Case 1 (capture = 85%) Case 2 (capture = 67%)
Total reduced spending $44,439,550 $44,439,550
Total reduced non-local visitor spend $24,441,753 $24,441,753
Direct spending economic impact $20,775,490 $16,375,974
Local direct sales tax impact[2] $696,590 $696,590
Direct spending + tax econ impact $21,472,080 $17,072,564
Indirect economic impact $4,294,416 $3,414,513
Induced economic impact $11,594,923 $9,219,185
Indirect + induced local sales taxes [3] $371,811 $295,629
Total local economic impact $37,361,418 $29,706,262
Total employment impact 834 663
Total local sales tax revenues [4] $1,068,400 $992,218
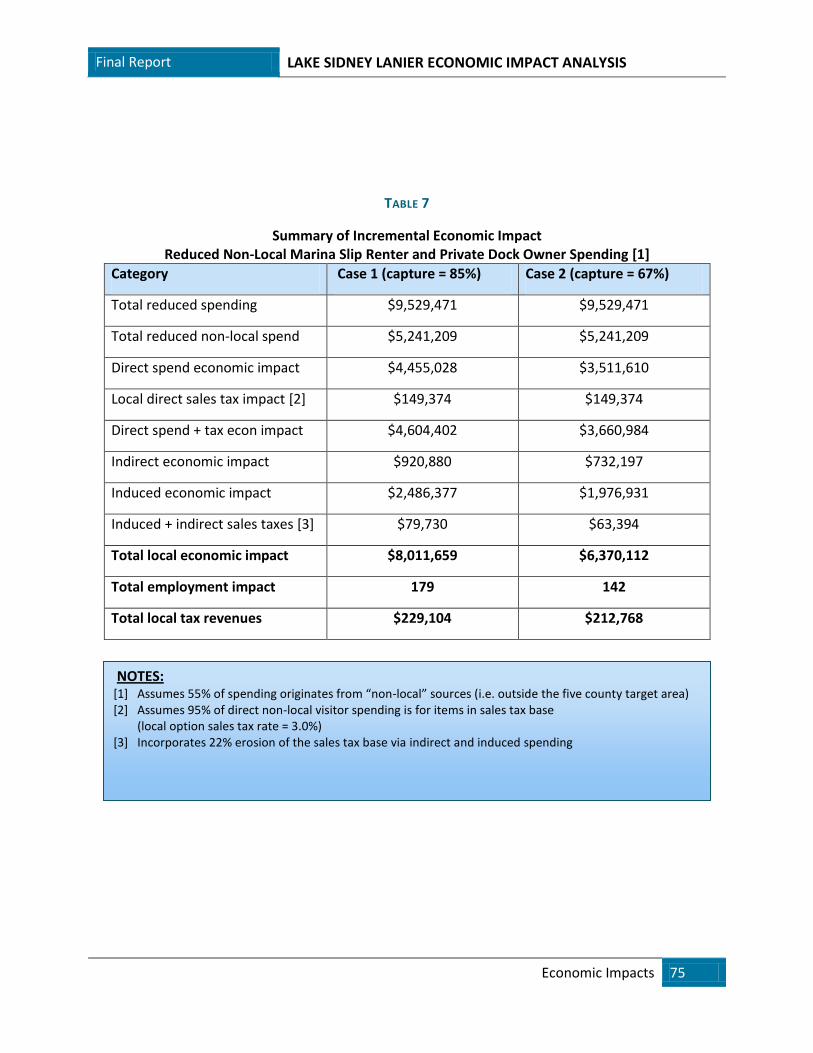
Final Report LAKE SIDNEY LANIER ECONOMIC IMPACT ANALYSIS
Economic Impacts 75
NOTES: [1] Assumes 55% of spending originates from “non-local” sources (i.e. outside the five county target area) [2] Assumes 95% of direct non-local visitor spending is for items in sales tax base (local option sales tax rate = 3.0%) [3] Incorporates 22% erosion of the sales tax base via indirect and induced spending
TABLE 7
Summary of Incremental Economic Impact Reduced Non-Local Marina Slip Renter and Private Dock Owner Spending [1]
Category Case 1 (capture = 85%) Case 2 (capture = 67%)
Total reduced spending $9,529,471 $9,529,471
Total reduced non-local spend $5,241,209 $5,241,209
Direct spend economic impact $4,455,028 $3,511,610
Local direct sales tax impact [2] $149,374 $149,374
Direct spend + tax econ impact $4,604,402 $3,660,984
Indirect economic impact $920,880 $732,197
Induced economic impact $2,486,377 $1,976,931
Induced + indirect sales taxes [3] $79,730 $63,394
Total local economic impact $8,011,659 $6,370,112
Total employment impact 179 142
Total local tax revenues $229,104 $212,768
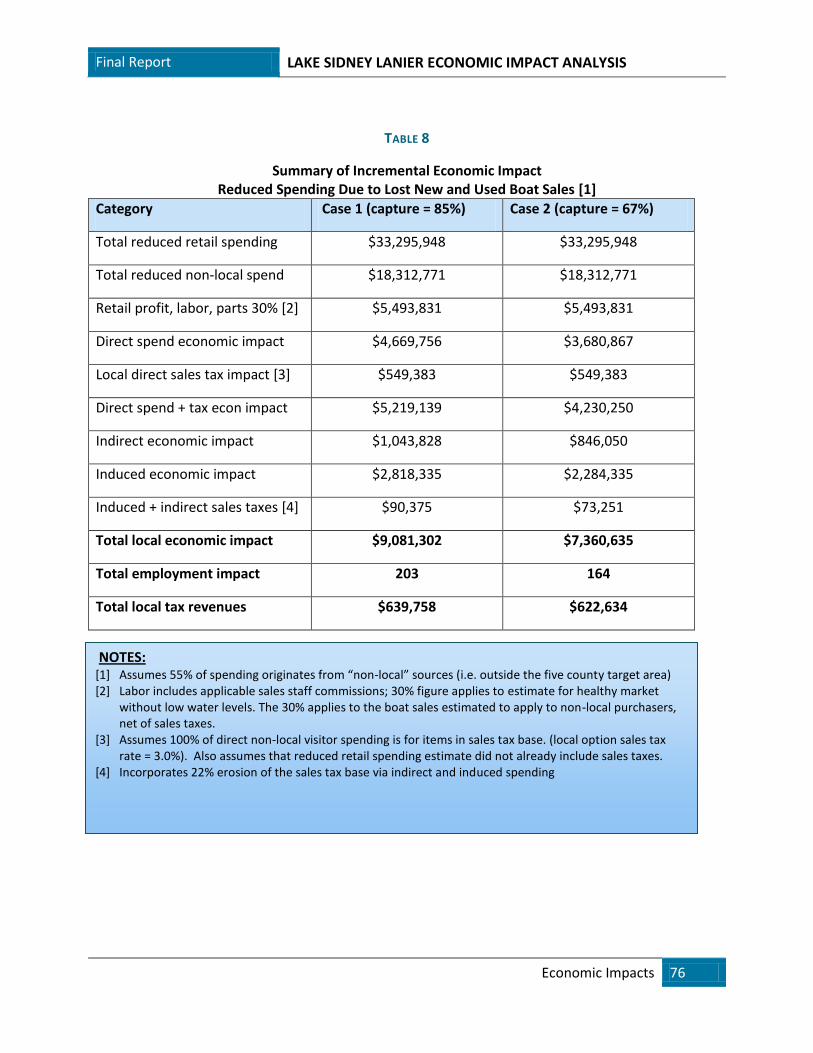
Final Report LAKE SIDNEY LANIER ECONOMIC IMPACT ANALYSIS
Economic Impacts 76
NOTES: [1] Assumes 55% of spending originates from “non-local” sources (i.e. outside the five county target area) [2] Labor includes applicable sales staff commissions; 30% figure applies to estimate for healthy market
without low water levels. The 30% applies to the boat sales estimated to apply to non-local purchasers, net of sales taxes.
[3] Assumes 100% of direct non-local visitor spending is for items in sales tax base. (local option sales tax rate = 3.0%). Also assumes that reduced retail spending estimate did not already include sales taxes.
[4] Incorporates 22% erosion of the sales tax base via indirect and induced spending
TABLE 8
Summary of Incremental Economic Impact Reduced Spending Due to Lost New and Used Boat Sales [1]
Category Case 1 (capture = 85%) Case 2 (capture = 67%)
Total reduced retail spending $33,295,948 $33,295,948
Total reduced non-local spend $18,312,771 $18,312,771
Retail profit, labor, parts 30% [2] $5,493,831 $5,493,831
Direct spend economic impact $4,669,756 $3,680,867
Local direct sales tax impact [3] $549,383 $549,383
Direct spend + tax econ impact $5,219,139 $4,230,250
Indirect economic impact $1,043,828 $846,050
Induced economic impact $2,818,335 $2,284,335
Induced + indirect sales taxes [4] $90,375 $73,251
Total local economic impact $9,081,302 $7,360,635
Total employment impact 203 164
Total local tax revenues $639,758 $622,634
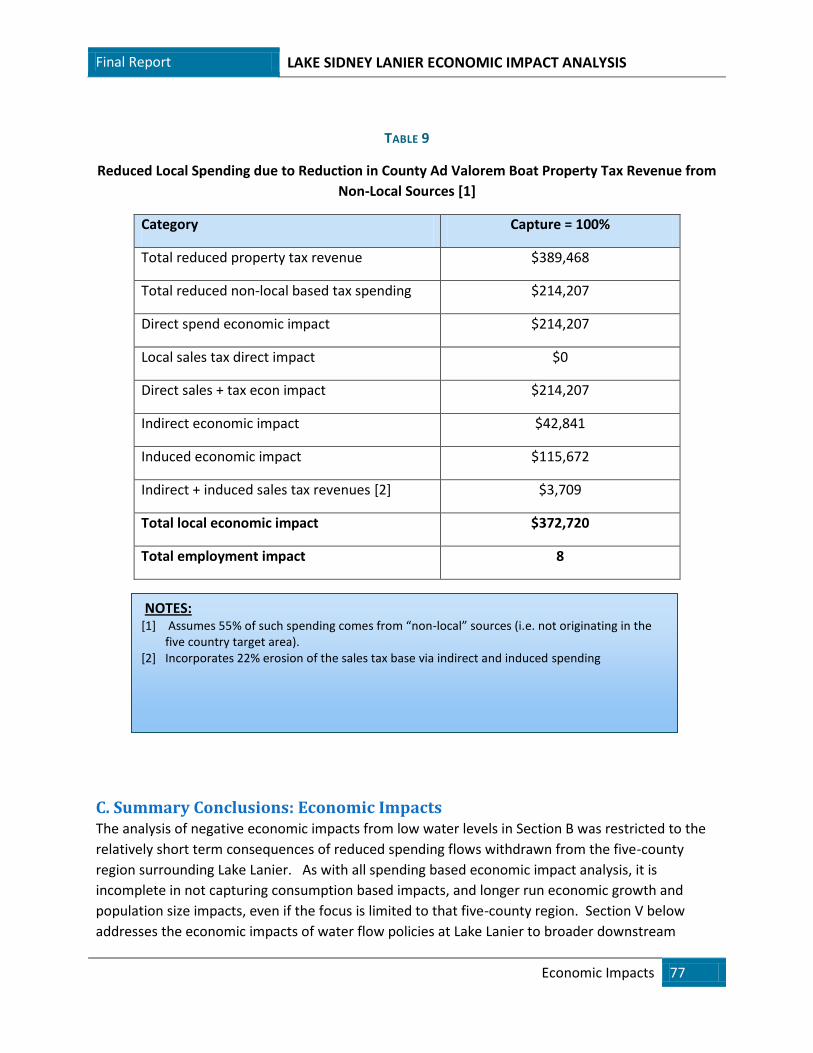
Final Report LAKE SIDNEY LANIER ECONOMIC IMPACT ANALYSIS
Economic Impacts 77
NOTES: [1] Assumes 55% of such spending comes from “non-local” sources (i.e. not originating in the
five country target area). [2] Incorporates 22% erosion of the sales tax base via indirect and induced spending
TABLE 9
Reduced Local Spending due to Reduction in County Ad Valorem Boat Property Tax Revenue from
Non-Local Sources [1]
Category Capture = 100%
Total reduced property tax revenue $389,468
Total reduced non-local based tax spending $214,207
Direct spend economic impact $214,207
Local sales tax direct impact $0
Direct sales + tax econ impact $214,207
Indirect economic impact $42,841
Induced economic impact $115,672
Indirect + induced sales tax revenues [2] $3,709
Total local economic impact $372,720
Total employment impact 8
C. Summary Conclusions: Economic Impacts The analysis of negative economic impacts from low water levels in Section B was restricted to the
relatively short term consequences of reduced spending flows withdrawn from the five-county
region surrounding Lake Lanier. As with all spending based economic impact analysis, it is
incomplete in not capturing consumption based impacts, and longer run economic growth and
population size impacts, even if the focus is limited to that five-county region. Section V below
addresses the economic impacts of water flow policies at Lake Lanier to broader downstream
Final Report LAKE SIDNEY LANIER ECONOMIC IMPACT ANALYSIS
Economic Impacts 78
regions going well beyond the largely recreationally based impacts addressed in Section IV. In
particular, the value of Lake Lanier as the primary water supply source for metropolitan Atlanta
dwarfs any recreational spending flow impacts to the five core lake counties.
The analysis of spending flow economic impacts focused on annual output, income, job, and tax
revenue impacts rather than property value based wealth effects (i.e., “flow” effects rather than
“stock” effects), and was careful to adjust for the distinctions between net injections of new
spending and economic activity into a region and the redistribution of existing spending across
current sectors of those local economies. It was also careful to adjust for local capture rates prior
to analyzing any subsequent rounds of economic impact via indirect and induced effects, since it is
vital to recognize that (even if initially taxed) an important portion of locally based spending actually
leaves that region immediately in the form of non-local manufacturer margins, non-local profit
repatriation, and other non-locally based vendor incomes. However, certain methodological
assumptions used by the Army Corps of Engineers in generating key data used in this study run the
risk of understating some of these localized impacts. The difficulties in accurately measuring the
visitor flows were discussed in great detail in Sections II and III, and the earlier discussion in this
section also referred to the absence of reliable data on the home locations of such visitors (e.g., as
potentially measured by zip codes), important to accurately measuring the proportions of local
versus non-local sources of recreational spending.
But there are other analytical challenges. For example, by focusing on the recreation spending that
accrues within a 30-mile radius of each of their “projects,” the USACE runs a risk of understating the
intricate web of supply chain vendors linked to Lake Lanier based economic activity important to
the bordering counties. By defining the region in that way, the capture rate might be understated,
as well as the magnitude of the relevant sales, income and employment multipliers, which are
generally positively correlated with the size of the target region. On the other hand, as the target
region is expanded, the proportion of locally based lake visitors versus non-local lake visitors tends
to also increase, which itself would reduce the proportion of the total spending changes that can be
considered net direct economic impacts on that local region. A recognition of these complex
factors, as well as the likelihood that lower Lake Lanier water levels can generate a shift of some
local spending outside of the region as county residents seek more distant substitute lake
recreation opportunities (and even possibly reevaluate their very decision to choose counties with
close proximity to Lake Lanier as their homes), were key reasons for providing two cases, with one
having a higher capture rate than the rate usually cited for Lake Lanier by the USACE.
Even utilizing a generally cautious methodological approach to measuring the negative recreation
based local impacts stemming from low water levels (net of macroeconomic recession effects), that
analysis identified significantly negative results for the economies of the local five-county region
most closely related to Lake Lanier. While the analysis was focused on comparing FY 2008, when
lake levels were unusually low, to FY 2007, it was that dramatic contrast in lake water levels that
provided the necessary data to attempt to isolate these effects. Therefore, these results should not
be interpreted merely as a rare historical experience, but as indicative of the fundamental
Final Report LAKE SIDNEY LANIER ECONOMIC IMPACT ANALYSIS
Economic Impacts 79
magnitude of the importance of water level management for the economies of the core five-county
Lake Lanier region.
While a bibliography of other studies in measuring the economic impact of lakes is provided in the
Appendix, it is important to remember why the results of alternative studies are difficult to
compare to the results of this study of Lake Lanier: (1) not all studies are focused on the unique
incremental economic impacts of low water levels, but tend to examine the overall total
recreational value of a lake, or the value of lake proximity on property (riparian) values; (2) some
studies focus on consumption values linked to concepts such as consumer surplus or travel cost
proxies for consumption value rather than “spending flow” impacts focused on output, income, jobs
and tax revenues, and (3) some studies, even past studies of Lake Lanier, have not isolated the
effects of changing water levels, or have emphasized property and home value wealth effects
rather than annual output, income, employment and tax revenue flow effects.
Those annual economic impacts on the five core county region from low Lake Lanier water levels
linked to the recreational value of Lake Lanier are again summarized as follows:
The annual loss of local option sales tax revenues ranges from $1.83 million to $1.94 million.
The annual loss of hotel-motel tax revenues is approximately $34,000.
The annual loss of property tax revenues is approximately $389,000.
The annual loss of output or the value of all goods and services produced in the region
ranges from $43.81 million to $54.83 million.
The annual loss of labor income due to falling output ranges from $25.18 million to $31.51
million.
Reductions in the production of goods and services resulted in annual job losses
(employment) ranging from 978 to 1,224.
In the context of Lake Lanier’s total economic impact on the region’s recreational economy,
employment losses in the range of 978 to 1,224 jobs are very significant. USACE estimates that
Lake Lanier supported nearly 2,300 total jobs in the region in 2006 based on recreational trip
spending alone. The Consultants estimate that the Lake supported a higher range of 4,131 to 5,188
jobs in 2007, if annual capital spending items for boats, docks, etc. is measured in addition to trip
spending. Therefore, the estimated impact of low water levels during 2008 represents an
approximate 23% reduction in lake-supported employment in only one year. As noted in the
previous section, the economic impacts of low water levels were partially mitigated by the public
perception that drought conditions were temporary and that lake elevations would eventually
return to full pool. Observed negative economic impacts could be much worse if low lake levels
were to become a permanent or more frequent occurrence.
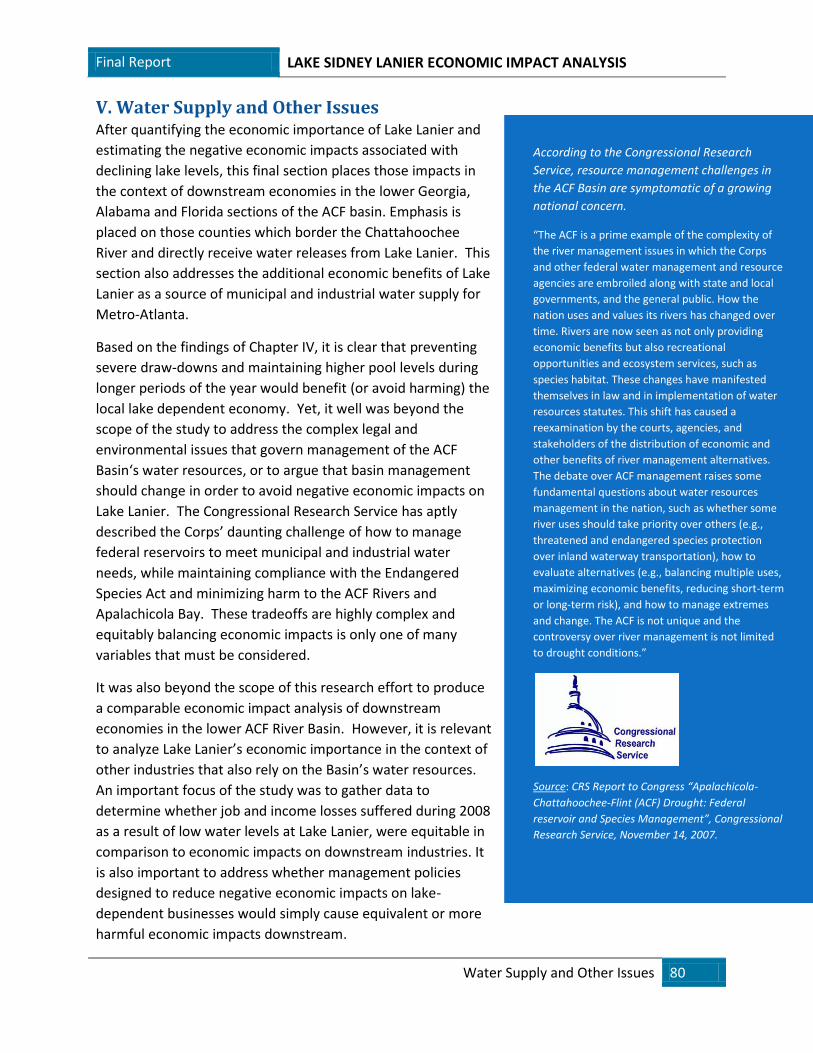
Final Report LAKE SIDNEY LANIER ECONOMIC IMPACT ANALYSIS
Water Supply and Other Issues 80
V. Water Supply and Other Issues After quantifying the economic importance of Lake Lanier and
estimating the negative economic impacts associated with
declining lake levels, this final section places those impacts in
the context of downstream economies in the lower Georgia,
Alabama and Florida sections of the ACF basin. Emphasis is
placed on those counties which border the Chattahoochee
River and directly receive water releases from Lake Lanier. This
section also addresses the additional economic benefits of Lake
Lanier as a source of municipal and industrial water supply for
Metro-Atlanta.
Based on the findings of Chapter IV, it is clear that preventing
severe draw-downs and maintaining higher pool levels during
longer periods of the year would benefit (or avoid harming) the
local lake dependent economy. Yet, it well was beyond the
scope of the study to address the complex legal and
environmental issues that govern management of the ACF
Basin‘s water resources, or to argue that basin management
should change in order to avoid negative economic impacts on
Lake Lanier. The Congressional Research Service has aptly
described the Corps’ daunting challenge of how to manage
federal reservoirs to meet municipal and industrial water
needs, while maintaining compliance with the Endangered
Species Act and minimizing harm to the ACF Rivers and
Apalachicola Bay. These tradeoffs are highly complex and
equitably balancing economic impacts is only one of many
variables that must be considered.
It was also beyond the scope of this research effort to produce
a comparable economic impact analysis of downstream
economies in the lower ACF River Basin. However, it is relevant
to analyze Lake Lanier’s economic importance in the context of
other industries that also rely on the Basin’s water resources.
An important focus of the study was to gather data to
determine whether job and income losses suffered during 2008
as a result of low water levels at Lake Lanier, were equitable in
comparison to economic impacts on downstream industries. It
is also important to address whether management policies
designed to reduce negative economic impacts on lake-
dependent businesses would simply cause equivalent or more
harmful economic impacts downstream.
According to the Congressional Research
Service, resource management challenges in
the ACF Basin are symptomatic of a growing
national concern.
“The ACF is a prime example of the complexity of
the river management issues in which the Corps
and other federal water management and resource
agencies are embroiled along with state and local
governments, and the general public. How the
nation uses and values its rivers has changed over
time. Rivers are now seen as not only providing
economic benefits but also recreational
opportunities and ecosystem services, such as
species habitat. These changes have manifested
themselves in law and in implementation of water
resources statutes. This shift has caused a
reexamination by the courts, agencies, and
stakeholders of the distribution of economic and
other benefits of river management alternatives.
The debate over ACF management raises some
fundamental questions about water resources
management in the nation, such as whether some
river uses should take priority over others (e.g.,
threatened and endangered species protection
over inland waterway transportation), how to
evaluate alternatives (e.g., balancing multiple uses,
maximizing economic benefits, reducing short-term
or long-term risk), and how to manage extremes
and change. The ACF is not unique and the
controversy over river management is not limited
to drought conditions.”
Source: CRS Report to Congress “Apalachicola-
Chattahoochee-Flint (ACF) Drought: Federal
reservoir and Species Management”, Congressional
Research Service, November 14, 2007.
Final Report LAKE SIDNEY LANIER ECONOMIC IMPACT ANALYSIS
Water Supply and Other Issues 81
So in order to provide a context for comparison, the Consultants analyzed the relative population
and employment levels of counties in the ACF Basin. The study effort also focused on power
generation, tourism, fishing and agricultural industries which could be most directly impacted by
changes in downstream flows. We conducted an extensive literature search to gather information
on these downstream industries, which in some cases included impact studies prepared by other
researchers. For example, the 2004 CDM study touched upon downstream impacts associated with
changing the ACF Water Control Plan to maintain higher pool levels at Lake Lanier.23 The
Consultants also reviewed a statewide economic impact of study of Florida’s commercial fishing
industry24 and a 2003 assessment of the aggregate economic impact of Apalachicola Bay’s
commercial fisheries and wildlife-related recreation to the region.25 (We found no comparable
economic analysis for water-dependent industries in the Alabama portion of the ACF Basin.)
These existing studies focused on estimating aggregate industry economic impacts and did not
quantify incremental economic impacts that could result from increased or reduced inflows to the
lower ACF Basin. We also located a 2010 study which estimated the economic impact of various
regulatory options in response to “red tide” infections to the Apalachicola Bay oyster industry. That
report looked at both the aggregate impact of the region’s oyster industry and the incremental
negative effects of shutting down oyster harvesting during certain portions of the year.26 Those
findings are also reported in this section.
It can be reasonably assumed that allowing downstream flows in the ACF Basin to fall below certain
thresholds would cause negative economic impacts on some industries and users. It is much more
difficult to estimate economic impacts across a range of flow rates, or to directly link Lake Lanier
withdrawals to specific downstream flows. Placing the economy surrounding Lake Lanier in the
context of downstream users sheds light on whether efforts to maintain higher pool levels at Lake
Lanier could produce negative downstream effects that could offset all or part of the economic
benefits of protecting the lake’s value as a recreational asset, but does not specifically measure the
cost or extent of those impacts. The scope of such a comparison is therefore necessarily limited to
addressing the relative magnitude of downstream economies and the specific industries which are
most directly dependent on downstream flows.
A. Comparative Downstream Populations and Employment
1. Overview
As illustrated in the following diagrams and maps, Lake Lanier is located at the headwaters of the
ACF Rivers Basin, which originates in north east Georgia, crosses the Georgia-Alabama border into
23
This Chapter quotes several findings from the Lake Lanier National Economic Development Update: Evaluation of Water Supply, Hydropower
and Recreation Benefits, February, 2004; prepared by Camp Dresser & McKee for the Atlanta Regional Commission and the Cobb County-Marietta Water Authority. See the inset appearing on page 5 of the Introduction for additional information about that study. 24
Hodges, Alan W, Mulkey, David, Philippakos, Effie and Adams, Chuck, “Economic Impact of Florida's Commercial Fisheries and Aquaculture
Industries”, University of Florida Cooperative Extension Service, Institute of Food and Agricultural Sciences, 2000. 25
Hodges, Alan W. and Adams, Charles “Values Associated with the Apalachicola Bay Marine Economy,” International Agricultural Trade and
Policy Center, University of Florida Institute of Food and Agricultural Services, March 2003. 26
Morgan, K.L., Stevens, T.J., Degner, R.L., Larkin, S.L. and Adams C.M (2010). ”Economic Impacts of Alternative Regulatory Scenarios on the
Florida Fresh Half-Shell Oyster Industry: A Study of Potential Outcomes,” University of Florida IFAS Extension.
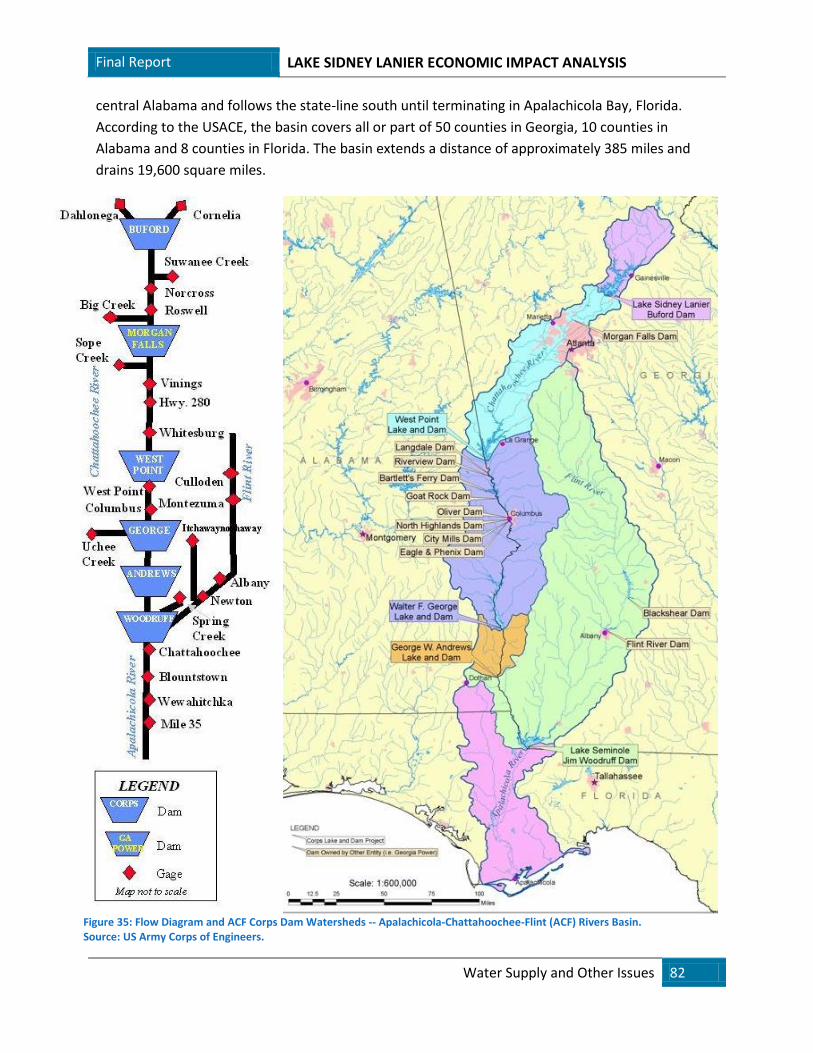
Final Report LAKE SIDNEY LANIER ECONOMIC IMPACT ANALYSIS
Water Supply and Other Issues 82
central Alabama and follows the state-line south until terminating in Apalachicola Bay, Florida.
According to the USACE, the basin covers all or part of 50 counties in Georgia, 10 counties in
Alabama and 8 counties in Florida. The basin extends a distance of approximately 385 miles and
drains 19,600 square miles.
Figure 35: Flow Diagram and ACF Corps Dam Watersheds -- Apalachicola-Chattahoochee-Flint (ACF) Rivers Basin. Source: US Army Corps of Engineers.
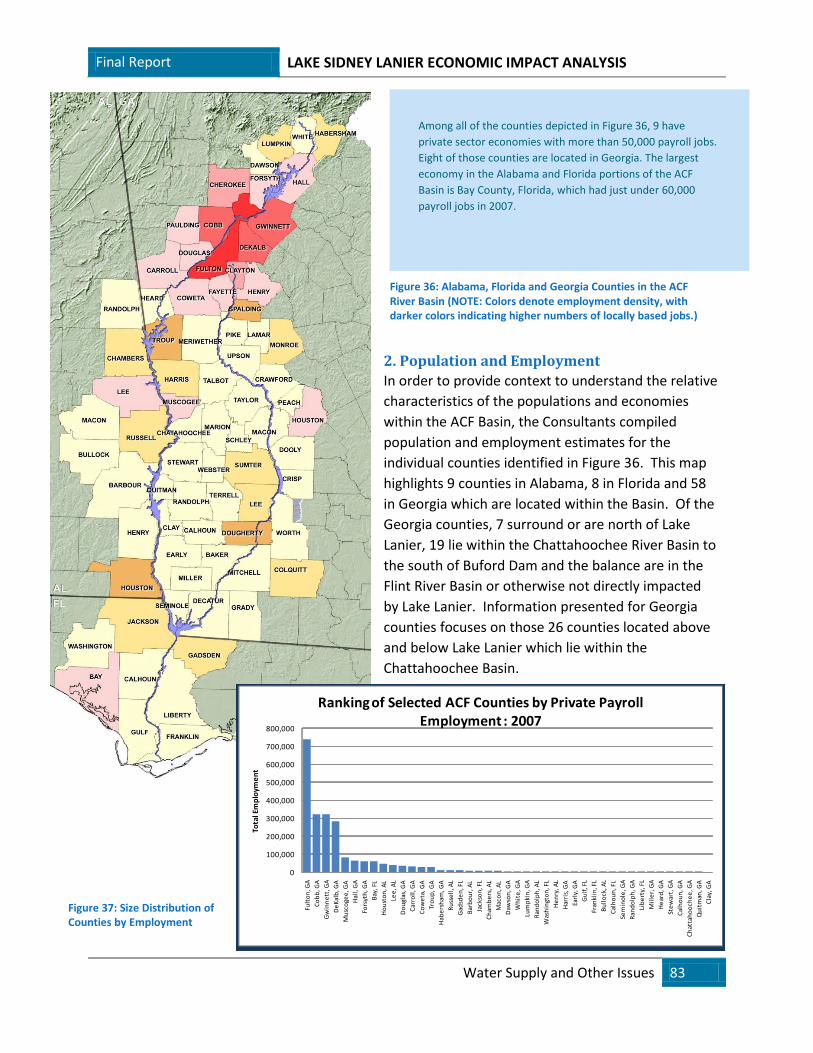
Final Report LAKE SIDNEY LANIER ECONOMIC IMPACT ANALYSIS
Water Supply and Other Issues 83
0
100,000
200,000
300,000
400,000
500,000
600,000
700,000
800,000
Fult
on
, GA
Co
bb
, GA
Gw
inn
ett
, GA
De
Kal
b, G
A
Mu
sco
gee
, GA
Hal
l, G
A
Fors
yth
, GA
Bay
, FL
Ho
ust
on
, AL
Lee
, AL
Do
ugl
as, G
A
Car
roll
, GA
Co
we
ta, G
A
Tro
up
, GA
Hab
ers
ham
, GA
Ru
sse
ll, A
L
Gad
sde
n, F
L
Bar
bo
ur,
AL
Jack
son
, FL
Ch
amb
ers
, AL
Mac
on
, AL
Daw
son
, GA
Wh
ite
, GA
Lum
pki
n, G
A
Ran
do
lph
, AL
Was
hin
gto
n, F
L
He
nry
, AL
Har
ris,
GA
Earl
y, G
A
Gu
lf, F
L
Fran
klin
, FL
Bu
llo
ck, A
L
Cal
ho
un
, FL
Sem
ino
le, G
A
Ran
do
lph
, GA
Lib
ert
y, F
L
Mil
ler,
GA
He
ard
, GA
Ste
war
t, G
A
Cal
ho
un
, GA
Ch
atta
ho
och
ee
, GA
Qu
itm
an, G
A
Cla
y, G
A
Tota
l Em
plo
yme
nt
Ranking of Selected ACF Counties by Private Payroll Employment : 2007
2. Population and Employment
In order to provide context to understand the relative
characteristics of the populations and economies
within the ACF Basin, the Consultants compiled
population and employment estimates for the
individual counties identified in Figure 36. This map
highlights 9 counties in Alabama, 8 in Florida and 58
in Georgia which are located within the Basin. Of the
Georgia counties, 7 surround or are north of Lake
Lanier, 19 lie within the Chattahoochee River Basin to
the south of Buford Dam and the balance are in the
Flint River Basin or otherwise not directly impacted
by Lake Lanier. Information presented for Georgia
counties focuses on those 26 counties located above
and below Lake Lanier which lie within the
Chattahoochee Basin.
Among all of the counties depicted in Figure 36, 9 have
private sector economies with more than 50,000 payroll jobs.
Eight of those counties are located in Georgia. The largest
economy in the Alabama and Florida portions of the ACF
Basin is Bay County, Florida, which had just under 60,000
payroll jobs in 2007.
Figure 36: Alabama, Florida and Georgia Counties in the ACF River Basin (NOTE: Colors denote employment density, with darker colors indicating higher numbers of locally based jobs.)
Figure 37: Size Distribution of Counties by Employment
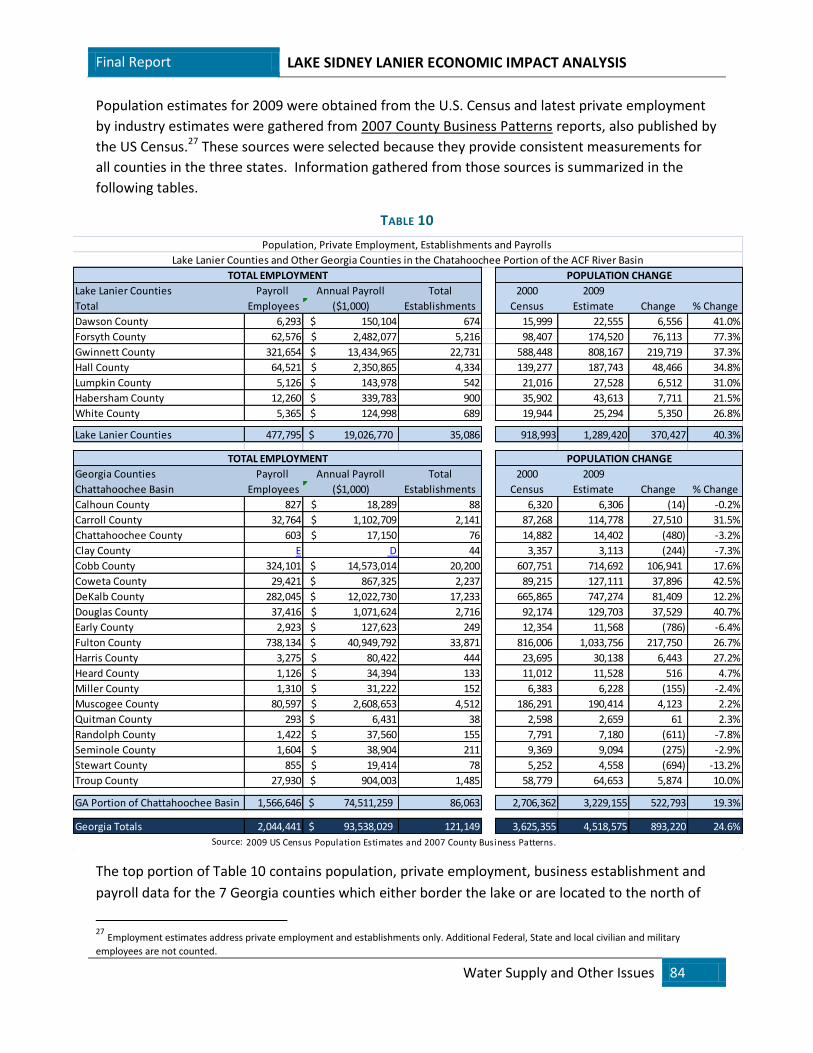
Final Report LAKE SIDNEY LANIER ECONOMIC IMPACT ANALYSIS
Water Supply and Other Issues 84
Lake Lanier Counties Payroll Annual Payroll Total 2000 2009
Total Employees ($1,000) Establishments Census Estimate Change % Change
Dawson County 6,293 $ 150,104 674 15,999 22,555 6,556 41.0%
Forsyth County 62,576 $ 2,482,077 5,216 98,407 174,520 76,113 77.3%
Gwinnett County 321,654 $ 13,434,965 22,731 588,448 808,167 219,719 37.3%
Hall County 64,521 $ 2,350,865 4,334 139,277 187,743 48,466 34.8%
Lumpkin County 5,126 $ 143,978 542 21,016 27,528 6,512 31.0%
Habersham County 12,260 $ 339,783 900 35,902 43,613 7,711 21.5%
White County 5,365 $ 124,998 689 19,944 25,294 5,350 26.8%
Lake Lanier Counties 477,795 19,026,770$ 35,086 918,993 1,289,420 370,427 40.3%
Georgia Counties Payroll Annual Payroll Total 2000 2009
Chattahoochee Basin Employees ($1,000) Establishments Census Estimate Change % Change
Calhoun County 827 $ 18,289 88 6,320 6,306 (14) -0.2%
Carroll County 32,764 $ 1,102,709 2,141 87,268 114,778 27,510 31.5%
Chattahoochee County 603 $ 17,150 76 14,882 14,402 (480) -3.2%
Clay County E D 44 3,357 3,113 (244) -7.3%
Cobb County 324,101 $ 14,573,014 20,200 607,751 714,692 106,941 17.6%
Coweta County 29,421 $ 867,325 2,237 89,215 127,111 37,896 42.5%
DeKalb County 282,045 $ 12,022,730 17,233 665,865 747,274 81,409 12.2%
Douglas County 37,416 $ 1,071,624 2,716 92,174 129,703 37,529 40.7%
Early County 2,923 $ 127,623 249 12,354 11,568 (786) -6.4%
Fulton County 738,134 $ 40,949,792 33,871 816,006 1,033,756 217,750 26.7%
Harris County 3,275 $ 80,422 444 23,695 30,138 6,443 27.2%
Heard County 1,126 $ 34,394 133 11,012 11,528 516 4.7%
Miller County 1,310 $ 31,222 152 6,383 6,228 (155) -2.4%
Muscogee County 80,597 $ 2,608,653 4,512 186,291 190,414 4,123 2.2%
Quitman County 293 $ 6,431 38 2,598 2,659 61 2.3%
Randolph County 1,422 $ 37,560 155 7,791 7,180 (611) -7.8%
Seminole County 1,604 $ 38,904 211 9,369 9,094 (275) -2.9%
Stewart County 855 $ 19,414 78 5,252 4,558 (694) -13.2%
Troup County 27,930 $ 904,003 1,485 58,779 64,653 5,874 10.0%
GA Portion of Chattahoochee Basin 1,566,646 74,511,259$ 86,063 2,706,362 3,229,155 522,793 19.3%
Georgia Totals 2,044,441 93,538,029$ 121,149 3,625,355 4,518,575 893,220 24.6%
Source: 2009 US Census Population Estimates and 2007 County Business Patterns.
TOTAL EMPLOYMENT POPULATION CHANGE
TOTAL EMPLOYMENT POPULATION CHANGE
Lake Lanier Counties and Other Georgia Counties in the Chatahoochee Portion of the ACF River Basin
Population, Private Employment, Establishments and Payrolls
Population estimates for 2009 were obtained from the U.S. Census and latest private employment
by industry estimates were gathered from 2007 County Business Patterns reports, also published by
the US Census.27 These sources were selected because they provide consistent measurements for
all counties in the three states. Information gathered from those sources is summarized in the
following tables.
TABLE 10
The top portion of Table 10 contains population, private employment, business establishment and
payroll data for the 7 Georgia counties which either border the lake or are located to the north of
27
Employment estimates address private employment and establishments only. Additional Federal, State and local civilian and military
employees are not counted.
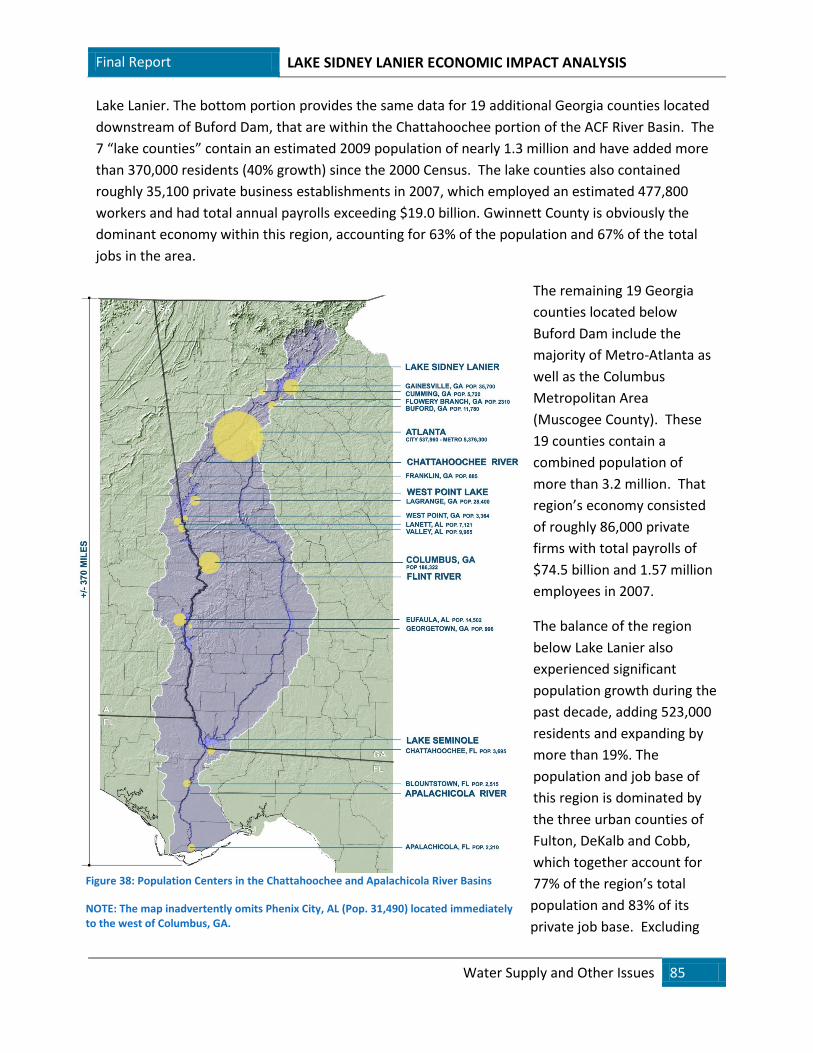
Final Report LAKE SIDNEY LANIER ECONOMIC IMPACT ANALYSIS
Water Supply and Other Issues 85
Lake Lanier. The bottom portion provides the same data for 19 additional Georgia counties located
downstream of Buford Dam, that are within the Chattahoochee portion of the ACF River Basin. The
7 “lake counties” contain an estimated 2009 population of nearly 1.3 million and have added more
than 370,000 residents (40% growth) since the 2000 Census. The lake counties also contained
roughly 35,100 private business establishments in 2007, which employed an estimated 477,800
workers and had total annual payrolls exceeding $19.0 billion. Gwinnett County is obviously the
dominant economy within this region, accounting for 63% of the population and 67% of the total
jobs in the area.
The remaining 19 Georgia
counties located below
Buford Dam include the
majority of Metro-Atlanta as
well as the Columbus
Metropolitan Area
(Muscogee County). These
19 counties contain a
combined population of
more than 3.2 million. That
region’s economy consisted
of roughly 86,000 private
firms with total payrolls of
$74.5 billion and 1.57 million
employees in 2007.
The balance of the region
below Lake Lanier also
experienced significant
population growth during the
past decade, adding 523,000
residents and expanding by
more than 19%. The
population and job base of
this region is dominated by
the three urban counties of
Fulton, DeKalb and Cobb,
which together account for
77% of the region’s total
population and 83% of its
private job base. Excluding
Figure 38: Population Centers in the Chattahoochee and Apalachicola River Basins
NOTE: The map inadvertently omits Phenix City, AL (Pop. 31,490) located immediately to the west of Columbus, GA.
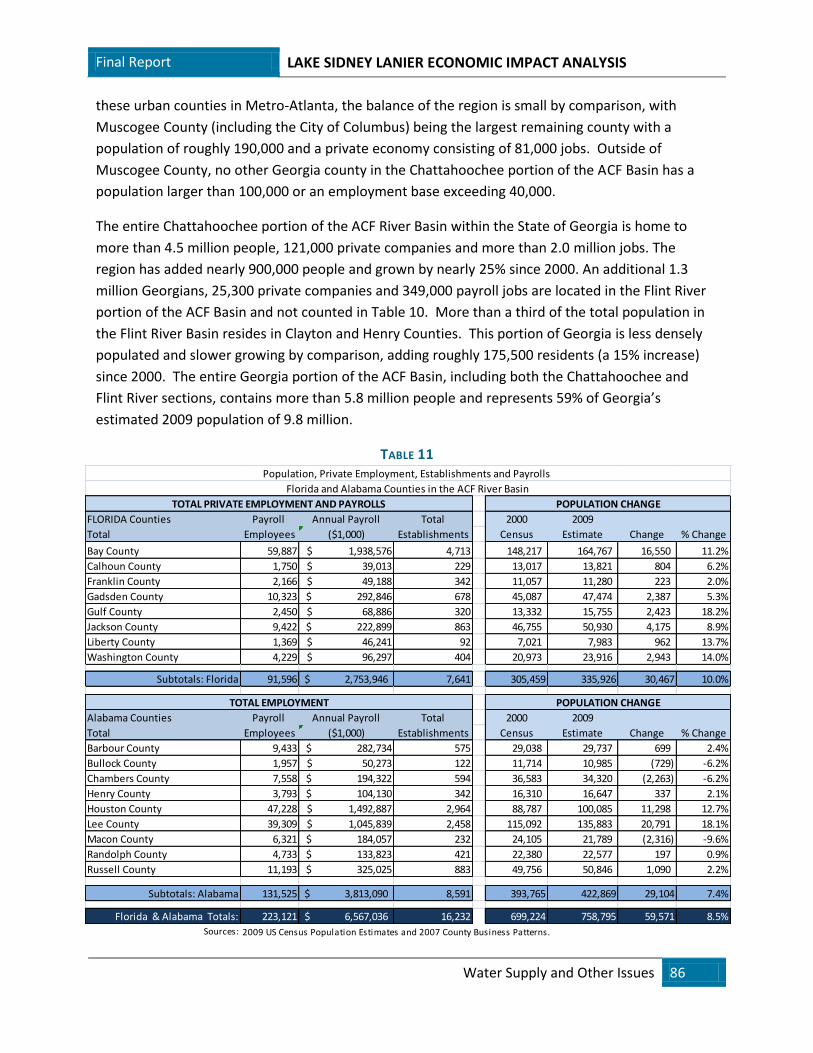
Final Report LAKE SIDNEY LANIER ECONOMIC IMPACT ANALYSIS
Water Supply and Other Issues 86
FLORIDA Counties Payroll Annual Payroll Total 2000 2009
Total Employees ($1,000) Establishments Census Estimate Change % Change
Bay County 59,887 $ 1,938,576 4,713 148,217 164,767 16,550 11.2%
Calhoun County 1,750 $ 39,013 229 13,017 13,821 804 6.2%
Franklin County 2,166 $ 49,188 342 11,057 11,280 223 2.0%
Gadsden County 10,323 $ 292,846 678 45,087 47,474 2,387 5.3%
Gulf County 2,450 $ 68,886 320 13,332 15,755 2,423 18.2%
Jackson County 9,422 $ 222,899 863 46,755 50,930 4,175 8.9%
Liberty County 1,369 $ 46,241 92 7,021 7,983 962 13.7%
Washington County 4,229 $ 96,297 404 20,973 23,916 2,943 14.0%
Subtotals: Florida 91,596 2,753,946$ 7,641 305,459 335,926 30,467 10.0%
Alabama Counties Payroll Annual Payroll Total 2000 2009
Total Employees ($1,000) Establishments Census Estimate Change % Change
Barbour County 9,433 $ 282,734 575 29,038 29,737 699 2.4%
Bullock County 1,957 $ 50,273 122 11,714 10,985 (729) -6.2%
Chambers County 7,558 $ 194,322 594 36,583 34,320 (2,263) -6.2%
Henry County 3,793 $ 104,130 342 16,310 16,647 337 2.1%
Houston County 47,228 $ 1,492,887 2,964 88,787 100,085 11,298 12.7%
Lee County 39,309 $ 1,045,839 2,458 115,092 135,883 20,791 18.1%
Macon County 6,321 $ 184,057 232 24,105 21,789 (2,316) -9.6%
Randolph County 4,733 $ 133,823 421 22,380 22,577 197 0.9%
Russell County 11,193 $ 325,025 883 49,756 50,846 1,090 2.2%
Subtotals: Alabama 131,525 3,813,090$ 8,591 393,765 422,869 29,104 7.4%
Florida & Alabama Totals: 223,121 6,567,036$ 16,232 699,224 758,795 59,571 8.5%
Sources: 2009 US Census Population Estimates and 2007 County Business Patterns.
Population, Private Employment, Establishments and Payrolls
Florida and Alabama Counties in the ACF River Basin
TOTAL PRIVATE EMPLOYMENT AND PAYROLLS POPULATION CHANGE
TOTAL EMPLOYMENT POPULATION CHANGE
these urban counties in Metro-Atlanta, the balance of the region is small by comparison, with
Muscogee County (including the City of Columbus) being the largest remaining county with a
population of roughly 190,000 and a private economy consisting of 81,000 jobs. Outside of
Muscogee County, no other Georgia county in the Chattahoochee portion of the ACF Basin has a
population larger than 100,000 or an employment base exceeding 40,000.
The entire Chattahoochee portion of the ACF River Basin within the State of Georgia is home to
more than 4.5 million people, 121,000 private companies and more than 2.0 million jobs. The
region has added nearly 900,000 people and grown by nearly 25% since 2000. An additional 1.3
million Georgians, 25,300 private companies and 349,000 payroll jobs are located in the Flint River
portion of the ACF Basin and not counted in Table 10. More than a third of the total population in
the Flint River Basin resides in Clayton and Henry Counties. This portion of Georgia is less densely
populated and slower growing by comparison, adding roughly 175,500 residents (a 15% increase)
since 2000. The entire Georgia portion of the ACF Basin, including both the Chattahoochee and
Flint River sections, contains more than 5.8 million people and represents 59% of Georgia’s
estimated 2009 population of 9.8 million.
TABLE 11
Final Report LAKE SIDNEY LANIER ECONOMIC IMPACT ANALYSIS
Water Supply and Other Issues 87
Table 11 provides comparable comparative data for the Alabama and Florida counties which are
also located in the ACF Basin. The total population within these counties is small in comparison to
the Georgia portion, with 423,000 Alabama residents and 336,000 Florida residents respectively in
2009. Population growth in these counties has also been slower than in Georgia, with total decade-
long growth of 7.4% in Alabama and 10.0% in Florida. The combined 2009 population of the ACF
Basin in the two States totals slightly less than 759,000, roughly 41% smaller than the seven Lake
Lanier Counties alone. The magnitude of Florida and Alabama population growth since 2000
(59,600) represents less than 15% of the more than 370,000 residents added to the 7 counties
surrounding Lake Lanier over the same period.
The economies of the Florida and Alabama counties listed in Table 11 are similarly modest by
comparison to the Georgia portion of the ACF Basin. In 2007, the 17 Alabama and Florida counties
(combined) had an estimated 16,200 private companies employing 223,000 workers and total
payrolls of just below $6.6 billion. (This combined total payroll is less than half the size of Georgia’s
Gwinnett County alone.) With a population of more than 362,000 and 127,000 local payroll jobs,
the combined economies of Hall and Forsyth Counties alone are roughly comparable to the entire
Florida portion of the ACF Basin and are only marginally smaller than the Alabama portion.
Together, Alabama and Florida contain 13% of the ACF River Basin’s total population, 11% of its
businesses and 9% of its private employment.
3. Selected Industries
Beyond the aggregate data, it is also important to focus on those key downstream industries/users
that are also dependent on water levels and could be influenced to varying degrees by water
releases from Lake Lanier. The most noteworthy among those industry sectors, including those
which have been most frequently cited as reasons for maintaining adequate downstream flows, are
tourism and recreation, fishing, power generation and agriculture. Each of these sectors is
discussed in this section.
a. Tourism
In order to provide an indicator of the relative importance of tourism industry activity within these
respective regions, the Consultants made a similar comparison of employment among
establishments in the accommodations and food service industry. This industry is typically the
largest component of the tourism sector, although not the only industry that is supported by visitor
spending. (Amusement and recreation services and certain retail trade and other service sectors
can also be important components of tourism employment). Employment in this sector was
isolated in order to provide a reasonable proxy measure of the relative importance of tourism to
the economies of each region. That information is summarized in Table 12.
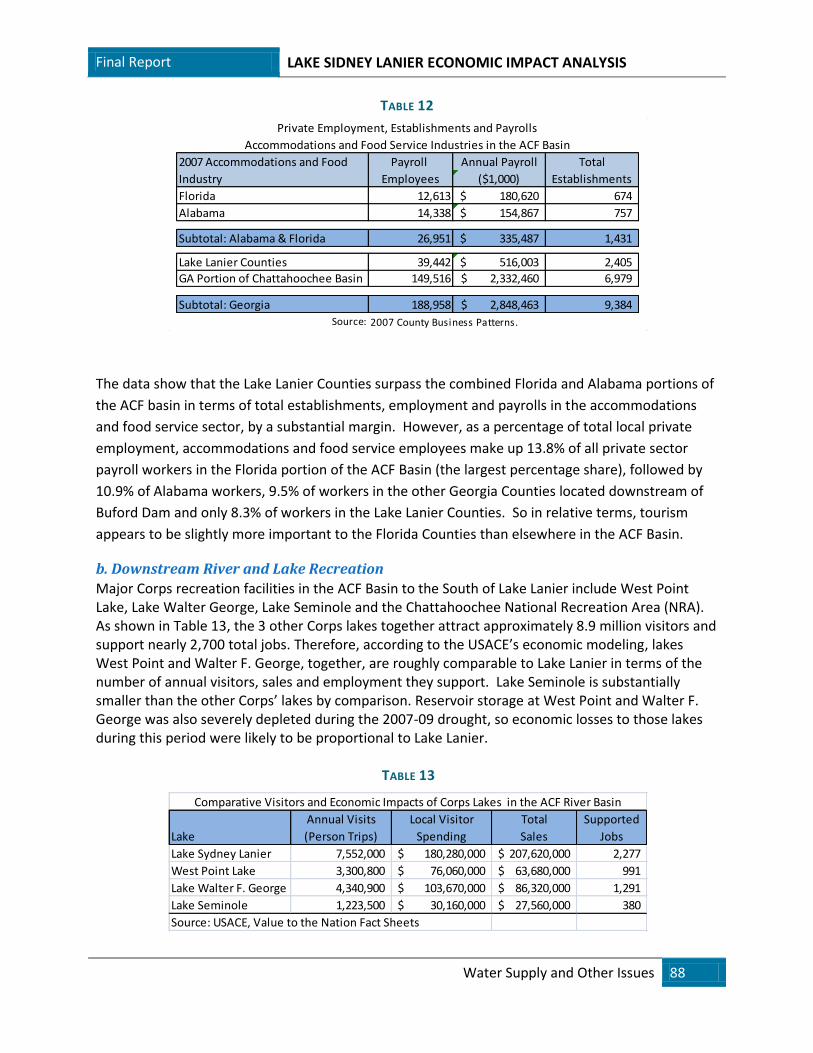
Final Report LAKE SIDNEY LANIER ECONOMIC IMPACT ANALYSIS
Water Supply and Other Issues 88
Annual Visits Local Visitor Total Supported
Lake (Person Trips) Spending Sales Jobs
Lake Sydney Lanier 7,552,000 180,280,000$ 207,620,000$ 2,277
West Point Lake 3,300,800 76,060,000$ 63,680,000$ 991
Lake Walter F. George 4,340,900 103,670,000$ 86,320,000$ 1,291
Lake Seminole 1,223,500 30,160,000$ 27,560,000$ 380
Source: USACE, Value to the Nation Fact Sheets
Comparative Visitors and Economic Impacts of Corps Lakes in the ACF River Basin
2007 Accommodations and Food Payroll Annual Payroll Total
Industry Employees ($1,000) Establishments
Florida 12,613 180,620$ 674
Alabama 14,338 154,867$ 757
Subtotal: Alabama & Florida 26,951 335,487$ 1,431
Lake Lanier Counties 39,442 516,003$ 2,405
GA Portion of Chattahoochee Basin 149,516 2,332,460$ 6,979
Subtotal: Georgia 188,958 2,848,463$ 9,384
Source: 2007 County Business Patterns.
Private Employment, Establishments and Payrolls
Accommodations and Food Service Industries in the ACF Basin
TABLE 12
The data show that the Lake Lanier Counties surpass the combined Florida and Alabama portions of
the ACF basin in terms of total establishments, employment and payrolls in the accommodations
and food service sector, by a substantial margin. However, as a percentage of total local private
employment, accommodations and food service employees make up 13.8% of all private sector
payroll workers in the Florida portion of the ACF Basin (the largest percentage share), followed by
10.9% of Alabama workers, 9.5% of workers in the other Georgia Counties located downstream of
Buford Dam and only 8.3% of workers in the Lake Lanier Counties. So in relative terms, tourism
appears to be slightly more important to the Florida Counties than elsewhere in the ACF Basin.
b. Downstream River and Lake Recreation
Major Corps recreation facilities in the ACF Basin to the South of Lake Lanier include West Point Lake, Lake Walter George, Lake Seminole and the Chattahoochee National Recreation Area (NRA). As shown in Table 13, the 3 other Corps lakes together attract approximately 8.9 million visitors and support nearly 2,700 total jobs. Therefore, according to the USACE’s economic modeling, lakes West Point and Walter F. George, together, are roughly comparable to Lake Lanier in terms of the number of annual visitors, sales and employment they support. Lake Seminole is substantially smaller than the other Corps’ lakes by comparison. Reservoir storage at West Point and Walter F. George was also severely depleted during the 2007-09 drought, so economic losses to those lakes during this period were likely to be proportional to Lake Lanier.
TABLE 13
Final Report LAKE SIDNEY LANIER ECONOMIC IMPACT ANALYSIS
Water Supply and Other Issues 89
In addition the Corps lakes, the Chattahoochee NRA draws an estimated 2.8 million annual visitors
to 23 day use facilities below Lake Lanier, located primarily in Metro-Atlanta. The NRA contains no
overnight facilities and the Consultants found no comparable estimates of the relative economic
impacts of the Chattahoochee NRA versus the four Corps lakes in the basin. However, the above-
referenced 2004 CDM Report, in investigating downstream recreation, concluded that there was
“no statistical relationship between historical visitation and in-stream flows at the (downstream)
Chattahoochee National Recreation Area” leading to the report’s conclusion that releasing water
and drawing down the reservoir during droughts “has no discernable effect on downstream river
recreation.”28
Tourism publications and individual web sites heavily promote sport fishing in the lower fresh water
reaches of the Apalachicola River, in Apalachicola Bay and along its barrier islands. It can therefore
be assumed that fishing is an important component of that region’s tourism economy, although as
noted in Table 13, the aggregate number of tourism jobs in the Florida portion of the ACF Basin is
not overly large.
As noted previously, in 2003 the University of Florida’s Institute of Food and Agricultural Services
estimated economic values associated with the Apalachicola Bay marine economy. The report
estimated that all “wildlife related recreation” in the region, including hunting, freshwater and
saltwater fishing and wildlife viewing attracted 156,000 visitors to the region in 2000, roughly 2.0%
of annual visitation to Lake Lanier. Yet these activities generated $235.5 million in total economic
activity for the region and supported 3,360 total jobs, approximately 1,100 more jobs than Lake
Lanier. The vast majority (86%) of that total impact was associated with saltwater fishing, which
accounted for $201.7 million in total output and supported more than 2,500 of these jobs, while
freshwater fishing (which is assumed to be more directly dependent on Apalachicola River flow),
accounted for $17.7 million of total output and supported only 329 jobs, roughly equivalent to total
employment supported by recreational hunting in the same region.
c. Commercial Fisheries
Economic development and tourism literature produced by the state of Florida notes that
“Apalachicola Bay produces 90 percent of Florida's and 13 percent of the Nation's oyster harvest,
and functions as a nursery for shrimp, blue crabs and a variety of fin fish.” According to the Florida
Department of Environmental Protection’s web site, the Apalachicola watershed is reported to have
“the greatest number of freshwater fish species in Florida, with 86 species identified.” The
economic importance of this industry is often cited in connection with ACF Basin management
issues. Florida’s Department of Environmental Protection indicated on its web site that “the total
commercial fishing industry in the Apalachicola Bay is responsible for $134,000,000 in economic
output and an additional $71,000,000 in value added impacts,”29 but does not cite the source of
28
ibid, pages 21 and 52. 29
This statement appears on the Florida Department of Environmental Protection web site, “Apalachicola-Chattahoochee-Flint River (AFC)
Timeline of Action as of July 27, 2009.” The source of the estimate is not cited.
Final Report LAKE SIDNEY LANIER ECONOMIC IMPACT ANALYSIS
Water Supply and Other Issues 90
that finding. In a Gainesville times news article published on January 3, 2008, a researcher at
Florida's Apalachicola National Estuarine Research Reserve was quoted as claiming that, "at least 50
percent of the bay's economy is based on fishing and seafood harvesting." That assessment is
unlikely given that total output of all industries in the region approached $1.4 billion in 2002.
(Finance insurance and real estate was the region’s largest private industry with annual output of
$364 million.) The Apalachicola Bay Chamber of Commerce also reports that “more than 1,000
people are employed by the oyster industry” in Florida’s Franklin County alone.
Information gathered from other Florida sources suggests that these estimates may be overstated,
or may include industry components that are not dependent on ACF River flows. For example,
analysis of 2007 County Business Patterns data for Bay, Gulf and Franklin County Florida suggests
that the region has minimal payroll employment associated with commercial fishing. Combined 3-
county employment in the “forestry, fishing, hunting and agricultural support” industry revealed
only 111 payroll jobs in the entire sector, with the vast majority of that number associated with
commercial logging operations located in Gulf County. Due do data suppression, only three
business establishments in the entire region, all located in Bay County, could be specifically
identified as “commercial fishing” operations with employees. However, these companies reported
a combined annual payroll of only $135,000. If substantial numbers of people are employed in
these industries, then nearly all must be self employed or derive minimal income from fishing or
oystering.
The same 2003 University of Florida study estimated that the total agricultural economy in the four-
County Apalachicola Bay Region supported fewer than 1,250 jobs in 1999. Commercial fishing
represents only a component of the total agricultural sector. The report estimated the total annual
economic output of Apalachicola’s seafood industry, consisting of both oysters and shrimp, at $22.7
million at that time.30 The industry supported 707 total jobs (including direct employment and
multiplier effects), roughly 30% of the 2,300 jobs supported by Lake Lanier. The National Marine
Fisheries Service estimated that the total 2008 landed value of all commercial catch on Florida’s
entire Gulf Coast totaled $122.9 million. Oysters represented roughly $5.4 million (4.4%) of that
amount, while shrimp landings totaled nearly $23.3 million (19%).31
Another more recent University of Florida Study released in April of 2010, examined the economic
impacts of imposing possible closures of the fresh half-shell oyster market along a section of the
Florida Panhandle over varying possible time periods. The reason given for considering the
proposed closure alternatives was to protect consumers from infections found in oysters, which
tend to be more prevalent during certain times of the year. The report states that “economic
impacts were estimated for (oyster) harvesters, processors and the overall economies of Gulf and
Franklin Counties” and noted that “oyster beds located in the coastal waters off these counties are
30
Ibid, p. 2-3. 31
US Department of Commerce, NOAA, National Marine Fisheries Service (2010). “Fisheries Economics of the United States 2008: Economics
and Sociocultural Status and Trends Service.” P. 137.
Final Report LAKE SIDNEY LANIER ECONOMIC IMPACT ANALYSIS
Water Supply and Other Issues 91
considered the most productive in the state.” In comparing potential economic impacts from
several proposed regulatory scenarios, the study first estimated the overall size of the local oyster
industry. The report’s executive summary reported the following findings based on an analysis of
2000 to 2004 data:
Total harvester revenues from oysters were estimated at $3.3 million. F.O.B. gross revenues were
estimated at approximately $5.8 million, and the total economic impact on the region was approximately
$13.6 million.
During the 2004 calendar year, 496 individuals, harvested and sold Florida oysters. Of these harvesters,
448 sold only oysters (90%) while 48 sold oysters and some other saltwater species.
Dockside revenues received by the 496 harvesters for oysters amounted to nearly $3 million in 2004,
while dockside revenues for all other saltwater species sold by oyster harvesters generated about
$111,000. Other species accounted for less than 4% of the harvesters' annual income from commercial
fishing.
Of the 496 harvesters, only 28 earned more than $20,000 from oysters in 2004. About 150 earned less
than $1,000.
Under a “worst case” scenario which modeled a total closure of the half shell oyster market from May
through September, the researchers estimated that the 5 month shut-down would cause “a 26%
reduction of the industry’s economic impact on the region, which translates to a loss of about $3.4
million.”
With fewer than 500 existing oyster harvesters, (including only 28 who earned more than $20,000
per year and appear to depend on oysters for their livelihoods), and a total industry impact of
$13.6 million, Franklin and Gulf Counties’ oyster industry provides only a small fraction of the $1.4
billion annual output of all industries in these same counties. A complete 5-month closure of the
local oyster industry was found to produce a negative economic impact on the region of only $3.4
million, roughly 10% of estimated economic losses at Lake Lanier during 2008.
The linkage between the performance of Apalachicola Bay’s seafood and recreational fishing
industries and freshwater inflows from the ACF Basin has been a primary concern of the Florida DEP
and the issue has been studied for some time. A 1991 study prepared by the Northwest Florida
Water Management District was among the earliest sources we found which linked ACF Basin
inflows to oyster productivity. Using trend data from the 1980’s, that study positively correlated
periods of low minimum flows to poor oyster productivity and smaller sizes after compensating for
time lag effects (usually two years later). Years in which high flows were present for 100 days or
more (“high flow” defined as exceeding 30,000 cfs) were also found to be detrimental to the oyster
population.32
32
Wilbur, Dara H. (1991).”Associations between freshwater inflows and oyster productivity in Apalachicola Bay, Florida;” Northwest Florida
Water Management District.
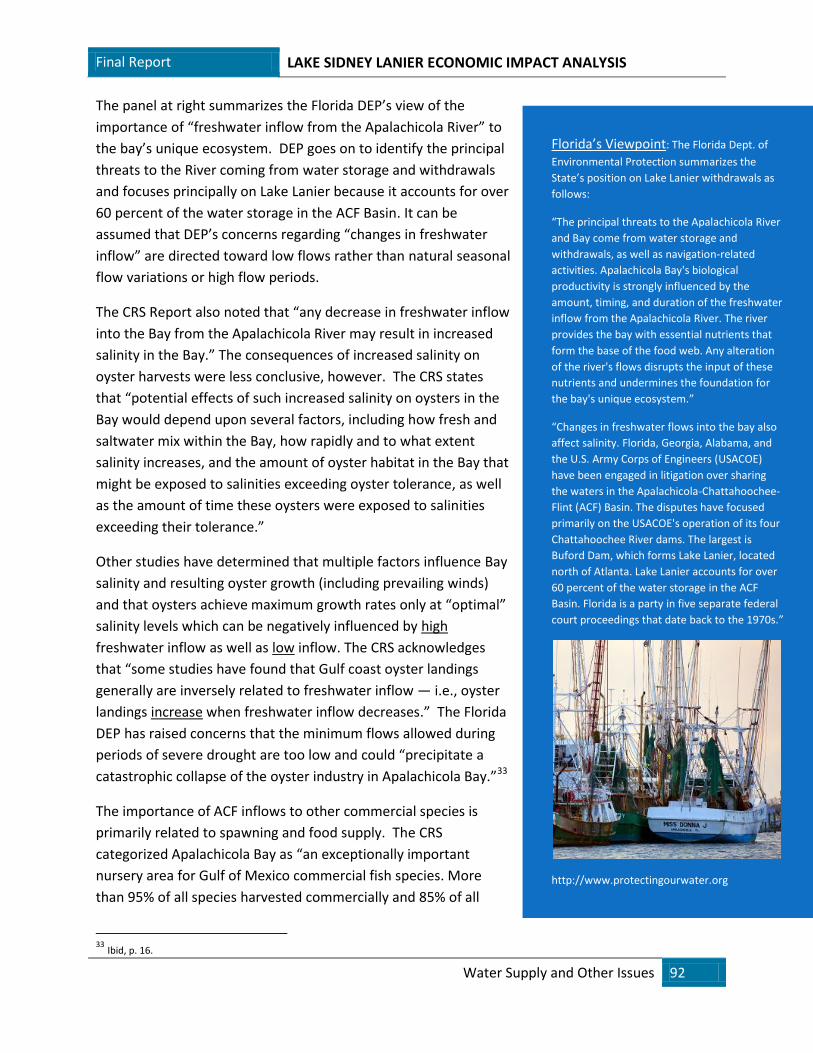
Final Report LAKE SIDNEY LANIER ECONOMIC IMPACT ANALYSIS
Water Supply and Other Issues 92
The panel at right summarizes the Florida DEP’s view of the
importance of “freshwater inflow from the Apalachicola River” to
the bay’s unique ecosystem. DEP goes on to identify the principal
threats to the River coming from water storage and withdrawals
and focuses principally on Lake Lanier because it accounts for over
60 percent of the water storage in the ACF Basin. It can be
assumed that DEP’s concerns regarding “changes in freshwater
inflow” are directed toward low flows rather than natural seasonal
flow variations or high flow periods.
The CRS Report also noted that “any decrease in freshwater inflow
into the Bay from the Apalachicola River may result in increased
salinity in the Bay.” The consequences of increased salinity on
oyster harvests were less conclusive, however. The CRS states
that “potential effects of such increased salinity on oysters in the
Bay would depend upon several factors, including how fresh and
saltwater mix within the Bay, how rapidly and to what extent
salinity increases, and the amount of oyster habitat in the Bay that
might be exposed to salinities exceeding oyster tolerance, as well
as the amount of time these oysters were exposed to salinities
exceeding their tolerance.”
Other studies have determined that multiple factors influence Bay
salinity and resulting oyster growth (including prevailing winds)
and that oysters achieve maximum growth rates only at “optimal”
salinity levels which can be negatively influenced by high
freshwater inflow as well as low inflow. The CRS acknowledges
that “some studies have found that Gulf coast oyster landings
generally are inversely related to freshwater inflow — i.e., oyster
landings increase when freshwater inflow decreases.” The Florida
DEP has raised concerns that the minimum flows allowed during
periods of severe drought are too low and could “precipitate a
catastrophic collapse of the oyster industry in Apalachicola Bay.”33
The importance of ACF inflows to other commercial species is
primarily related to spawning and food supply. The CRS
categorized Apalachicola Bay as “an exceptionally important
nursery area for Gulf of Mexico commercial fish species. More
than 95% of all species harvested commercially and 85% of all
33
Ibid, p. 16.
Florida’s Viewpoint: The Florida Dept. of
Environmental Protection summarizes the
State’s position on Lake Lanier withdrawals as
follows:
“The principal threats to the Apalachicola River
and Bay come from water storage and
withdrawals, as well as navigation-related
activities. Apalachicola Bay's biological
productivity is strongly influenced by the
amount, timing, and duration of the freshwater
inflow from the Apalachicola River. The river
provides the bay with essential nutrients that
form the base of the food web. Any alteration
of the river's flows disrupts the input of these
nutrients and undermines the foundation for
the bay's unique ecosystem.”
“Changes in freshwater flows into the bay also
affect salinity. Florida, Georgia, Alabama, and
the U.S. Army Corps of Engineers (USACOE)
have been engaged in litigation over sharing
the waters in the Apalachicola-Chattahoochee-
Flint (ACF) Basin. The disputes have focused
primarily on the USACOE's operation of its four
Chattahoochee River dams. The largest is
Buford Dam, which forms Lake Lanier, located
north of Atlanta. Lake Lanier accounts for over
60 percent of the water storage in the ACF
Basin. Florida is a party in five separate federal
court proceedings that date back to the 1970s.”
http://www.protectingourwater.org
Final Report LAKE SIDNEY LANIER ECONOMIC IMPACT ANALYSIS
Water Supply and Other Issues 93
species harvested recreationally in the open Gulf spend a portion of their life in estuarine waters.”
Changes in Apalachicola Bay salinity can affect the suitability of this habitat for forage and nursery
use. In contrast to oysters, a decline in finfish populations is generally associated with low inflows.
Although the Consultants found studies which established a statistical correlation between
freshwater inflow and species growth, we were unable to locate any prior research which (a)
determined what flow rates into the Apalachicola River provided optimal salinity for fish habitat
and achieved maximum growth rates for these species; (b) quantified the minimum point and
duration of low flows which cause growth rates to decline or cause damage to the ecosystem, or (c)
measured the impacts of low flow periods on aggregate harvests in terms of percentage declines or
dollar losses. We could find no research which documents any resulting impact of low flow periods
to changes in saltwater finfish landings or to economic impacts on recreational saltwater fishing.
Absent of such data, it is difficult to estimate how Lake Lanier’s operation directly influences
Apalachicola Bay’s fishing and oyster industries either positively or negatively, particularly during
periods of normal rainfall. The CRS even acknowledged that it “could locate no Corps estimates of
how much water has been released (in 2007) from Lake Lanier specifically to meet minimum flow
(for the Apalachicola River). Attempts to independently estimate releases from Lake Lanier
minimum flows are complicated by numerous factors (e.g., withdrawals along the course of the
river, return flows, and contributions from streams and groundwater) that influence river flow.”34
The CDM report similarly concluded that “far downstream at the Florida border, the link between
Lanier releases and in-stream flows is extremely tenuous – at times not measurable at all in
comparison to natural stream flow variation or releases from reservoirs more immediately
upstream.”35
d. Power Generation
A total of 13 mainstem dams exist on the Chattahoochee River south of Lake Lanier. These dams
were constructed by the U.S. Army Corps of Engineers, individual power companies and industrial
users. Over most of the River’s length, hydroelectric plants release water for production of
hydropower and to control river flow. (The locations of these dams are shown in Figure 35 on page
82.) In addition to these hydropower plants, the Chattahoochee River provides cooling water for
the 1,170 megawatt Farley Nuclear Power Plant located in Dothan Alabama, plus three coal and/or
natural gas-fired plants in Georgia and one additional plant in Florida. Maintaining adequate stream
flows for power generation and cooling water is another function of Lake Lanier and the other
Corps lakes in the ACF Basin.
34
Ibid, p. 7. 35
Ibid, p. 7.
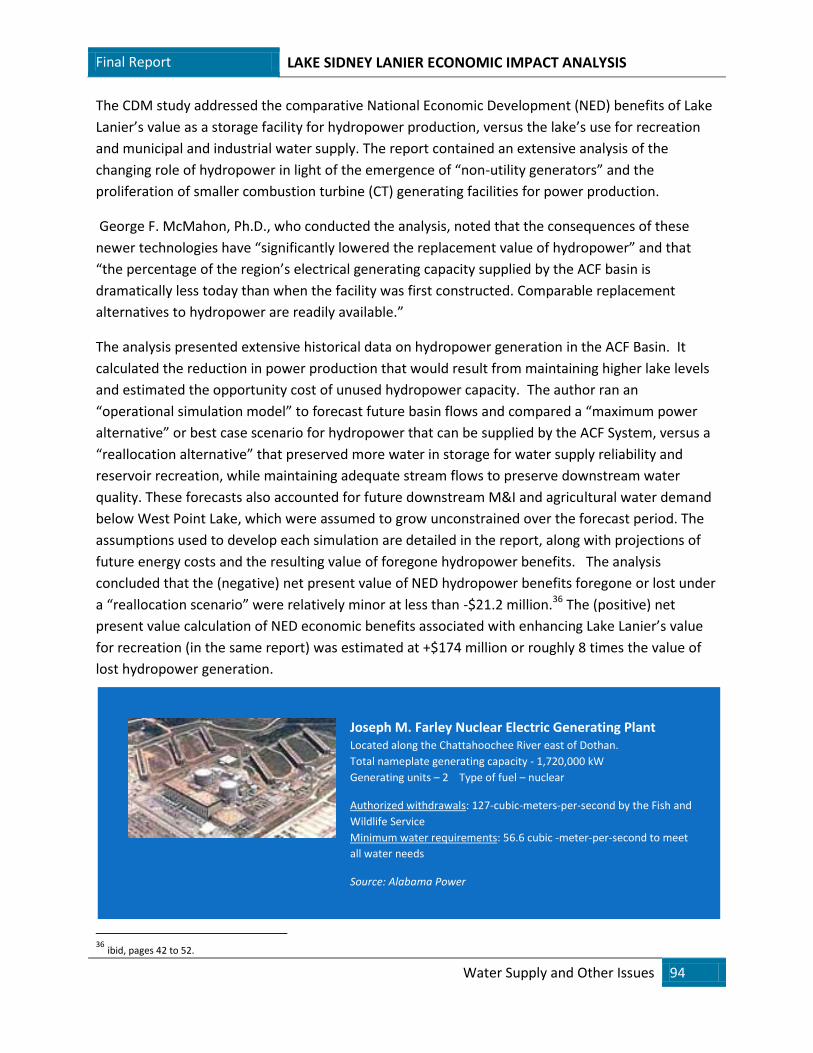
Final Report LAKE SIDNEY LANIER ECONOMIC IMPACT ANALYSIS
Water Supply and Other Issues 94
Joseph M. Farley Nuclear Electric Generating Plant
Located along the Chattahoochee River east of Dothan.
Total nameplate generating capacity - 1,720,000 kW
Generating units – 2 Type of fuel – nuclear
Authorized withdrawals: 127-cubic-meters-per-second by the Fish and
Wildlife Service
Minimum water requirements: 56.6 cubic -meter-per-second to meet
all water needs
Source: Alabama Power
The CDM study addressed the comparative National Economic Development (NED) benefits of Lake
Lanier’s value as a storage facility for hydropower production, versus the lake’s use for recreation
and municipal and industrial water supply. The report contained an extensive analysis of the
changing role of hydropower in light of the emergence of “non-utility generators” and the
proliferation of smaller combustion turbine (CT) generating facilities for power production.
George F. McMahon, Ph.D., who conducted the analysis, noted that the consequences of these
newer technologies have “significantly lowered the replacement value of hydropower” and that
“the percentage of the region’s electrical generating capacity supplied by the ACF basin is
dramatically less today than when the facility was first constructed. Comparable replacement
alternatives to hydropower are readily available.”
The analysis presented extensive historical data on hydropower generation in the ACF Basin. It
calculated the reduction in power production that would result from maintaining higher lake levels
and estimated the opportunity cost of unused hydropower capacity. The author ran an
“operational simulation model” to forecast future basin flows and compared a “maximum power
alternative” or best case scenario for hydropower that can be supplied by the ACF System, versus a
“reallocation alternative” that preserved more water in storage for water supply reliability and
reservoir recreation, while maintaining adequate stream flows to preserve downstream water
quality. These forecasts also accounted for future downstream M&I and agricultural water demand
below West Point Lake, which were assumed to grow unconstrained over the forecast period. The
assumptions used to develop each simulation are detailed in the report, along with projections of
future energy costs and the resulting value of foregone hydropower benefits. The analysis
concluded that the (negative) net present value of NED hydropower benefits foregone or lost under
a “reallocation scenario” were relatively minor at less than -$21.2 million.36 The (positive) net
present value calculation of NED economic benefits associated with enhancing Lake Lanier’s value
for recreation (in the same report) was estimated at +$174 million or roughly 8 times the value of
lost hydropower generation.
36
ibid, pages 42 to 52.
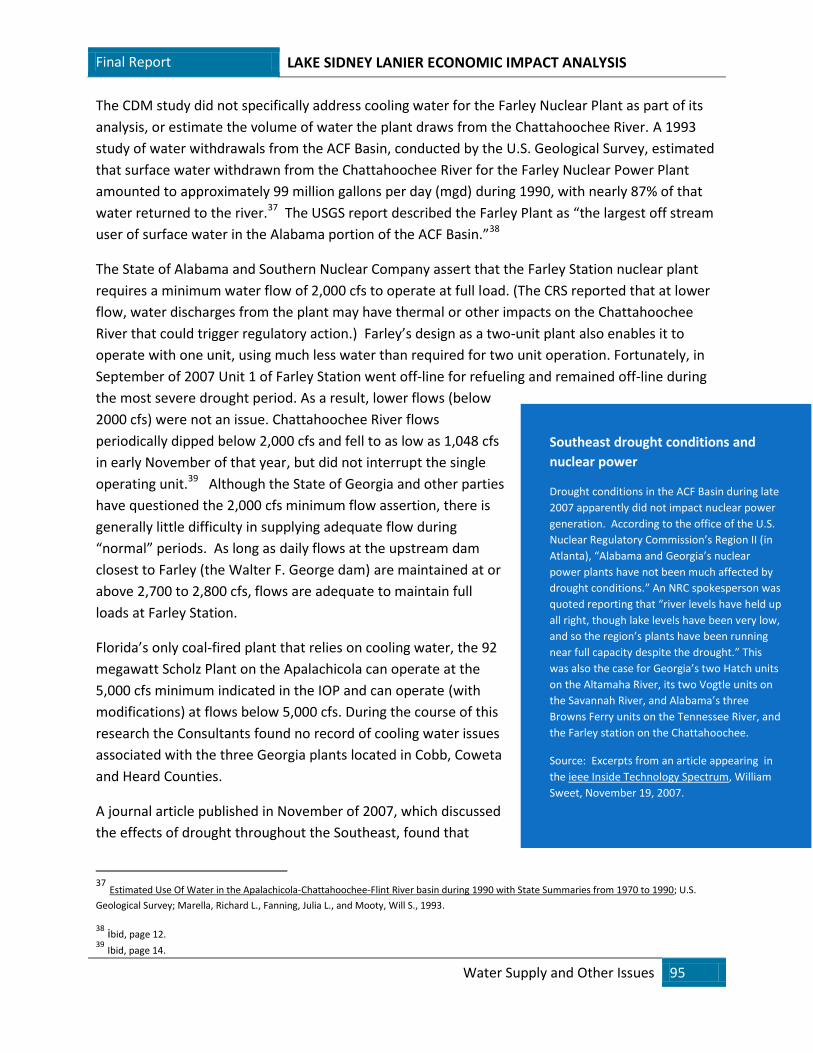
Final Report LAKE SIDNEY LANIER ECONOMIC IMPACT ANALYSIS
Water Supply and Other Issues 95
The CDM study did not specifically address cooling water for the Farley Nuclear Plant as part of its
analysis, or estimate the volume of water the plant draws from the Chattahoochee River. A 1993
study of water withdrawals from the ACF Basin, conducted by the U.S. Geological Survey, estimated
that surface water withdrawn from the Chattahoochee River for the Farley Nuclear Power Plant
amounted to approximately 99 million gallons per day (mgd) during 1990, with nearly 87% of that
water returned to the river.37 The USGS report described the Farley Plant as “the largest off stream
user of surface water in the Alabama portion of the ACF Basin.”38
The State of Alabama and Southern Nuclear Company assert that the Farley Station nuclear plant
requires a minimum water flow of 2,000 cfs to operate at full load. (The CRS reported that at lower
flow, water discharges from the plant may have thermal or other impacts on the Chattahoochee
River that could trigger regulatory action.) Farley’s design as a two-unit plant also enables it to
operate with one unit, using much less water than required for two unit operation. Fortunately, in
September of 2007 Unit 1 of Farley Station went off-line for refueling and remained off-line during
the most severe drought period. As a result, lower flows (below
2000 cfs) were not an issue. Chattahoochee River flows
periodically dipped below 2,000 cfs and fell to as low as 1,048 cfs
in early November of that year, but did not interrupt the single
operating unit.39 Although the State of Georgia and other parties
have questioned the 2,000 cfs minimum flow assertion, there is
generally little difficulty in supplying adequate flow during
“normal” periods. As long as daily flows at the upstream dam
closest to Farley (the Walter F. George dam) are maintained at or
above 2,700 to 2,800 cfs, flows are adequate to maintain full
loads at Farley Station.
Florida’s only coal-fired plant that relies on cooling water, the 92
megawatt Scholz Plant on the Apalachicola can operate at the
5,000 cfs minimum indicated in the IOP and can operate (with
modifications) at flows below 5,000 cfs. During the course of this
research the Consultants found no record of cooling water issues
associated with the three Georgia plants located in Cobb, Coweta
and Heard Counties.
A journal article published in November of 2007, which discussed
the effects of drought throughout the Southeast, found that
37 Estimated Use Of Water in the Apalachicola-Chattahoochee-Flint River basin during 1990 with State Summaries from 1970 to 1990; U.S.
Geological Survey; Marella, Richard L., Fanning, Julia L., and Mooty, Will S., 1993.
38 ibid, page 12.
39 Ibid, page 14.
Southeast drought conditions and
nuclear power
Drought conditions in the ACF Basin during late
2007 apparently did not impact nuclear power
generation. According to the office of the U.S.
Nuclear Regulatory Commission’s Region II (in
Atlanta), “Alabama and Georgia’s nuclear
power plants have not been much affected by
drought conditions.” An NRC spokesperson was
quoted reporting that “river levels have held up
all right, though lake levels have been very low,
and so the region’s plants have been running
near full capacity despite the drought.” This
was also the case for Georgia’s two Hatch units
on the Altamaha River, its two Vogtle units on
the Savannah River, and Alabama’s three
Browns Ferry units on the Tennessee River, and
the Farley station on the Chattahoochee.
Source: Excerpts from an article appearing in
the ieee Inside Technology Spectrum, William
Sweet, November 19, 2007.
Final Report LAKE SIDNEY LANIER ECONOMIC IMPACT ANALYSIS
Water Supply and Other Issues 96
Farley Station and all of Alabama and Georgia’s nuclear power plants had sufficient cooling water to
continue generating power at that time. While the CDM study did not specifically address cooling
water supplies for downstream thermoelectric power plants, all alternative management scenarios
for Lake Lanier modeled the continuation of “adequate stream flows to preserve downstream water
quality” as a baseline assumption. Under those assumptions, the positive economic impacts of
maintaining marginally higher pool levels at Lake Lanier for longer periods of the year would have
only a fractional negative downstream economic impact on hydroelectric power generation and
fully satisfy the cooling water needs for thermoelectric power plants.
e. Agriculture
Use of the Chattahoochee and Apalachicola Rivers as a water source for agricultural uses has not
been written about as extensively or advocated as strongly by downstream interests, as compared
to River’s role in power generation, downstream navigation or fishing. Agricultural water use
includes water for irrigation and non-irrigation purposes. Irrigation water use includes the
application of water on lands to assist in the growing of crops and pasture, or to maintain
vegetative growth in recreational lands, parks, and golf courses. Non-irrigation agricultural water
use includes water used for livestock, feedlots, dairy operations, fish farming and other farm needs.
The Consultant’s gathered available information on agricultural land uses within the ACF basin and
the above-referenced USGS study did estimate agricultural water withdrawals back in the early
1990’s. Limited information collected from those sources is summarized as follows:
Agricultural land uses accounted for roughly 14% of all land use within the ACF Basin at the
time;40
Groundwater withdrawals are much more common for agricultural uses than surface water
withdrawals. Only 30% of all agricultural water used in the ACF Basin in 1990 (77.7 mgd)
was from surface water withdrawals, compared to 177.2 mgd consumed from
groundwater;
Georgia accounted for more than 80% of total agricultural water withdrawals from the ACF
Basin in 1990. Alabama and Florida combined withdrew less than 50 mgd for agricultural
purposes, roughly half the amount used by the Farley Station nuclear plant. Of that
amount, roughly 35 mgd was drawn from groundwater sources and 15 mgd from surface
waters. A major percentage of surface water withdrawals for agricultural uses in Alabama
and Florida were from smaller tributaries to the Chattahoochee or Apalachicola Rivers and
were also not influenced by water releases from Lake Lanier;
Prior to 1990, the largest use and growth in demand for irrigation water occurred in
Southwest Georgia in the Flint River portion of the ACF Basin, and was not impacted by
water releases from Lake Lanier. Of the 77.7 mgd of surface water consumed for
40
Citizen Guide to Alabama Rivers: Chattahoochee and Coastal Plain Streams; Alabama Water Watch Program, Auburn University, January
2003.
Final Report LAKE SIDNEY LANIER ECONOMIC IMPACT ANALYSIS
Water Supply and Other Issues 97
agricultural purposes in 1990, more than 47 mgd (60%) was withdrawn from the Flint River
Basin; and
Poultry production in the northern portion of the ACF Basin and surrounding Lake Lanier
was identified as the Basin’s economically most important agricultural activity.
Based on these findings it appears that water releases from Lake Lanier have either a very minor
influence or no influence at all on available supplies of irrigation and non-irrigation water for
downstream agricultural users.
4. Summary
The preceding section presented comparative data on the population and economies of the
Georgia, Alabama and Florida portion of the ACF Basin which are impacted by water released from
Lake Lanier. In summary, this analysis concluded:
The combined economies of Hall and Forsyth Counties alone are roughly comparable to the
entire Florida portion of the ACF basin and only marginally smaller than the Alabama
portion.
The economies of all of all 17 AL and FL counties in the ACF Basin combined, are less than
half the size of Gwinnett County in terms of existing companies, private payrolls and
employees.
Alabama and Florida together contain only 13% of the ACF River Basin’s total population,
11% of its businesses and 9% of total private employment, while the Georgia portion of the
ACF Basin contains 5.8 million people, representing 59% of Georgia’s total population and
an even larger portion of the state’s economy.
While the Florida portion of the ACF Basin is slightly more dependent on tourism as a
percentage of its private employment, the aggregate number of tourism jobs in that region
is smaller than in the counties surrounding Lake Lanier.
The total annual economic impact of Apalachicola’s freshwater fishing and oyster industries
appears to be in the range of $31 million per year, representing less than 20% of the total
estimated local annual economic impact of Lake Lanier recreation as estimated by USACE.
The total economic output of these Florida industries is roughly comparable to the level of
economic losses suffered by Lake Lanier recreation during 2008.
Recreational saltwater fishing is substantially larger and more important to the economy of
the Apalachicola Bay region than its oyster fishery. In terms of its total economic impact,
saltwater fishing is roughly comparable to Lake Lanier.
The effective influence of Lake Lanier water releases in regulating salinity in Apalachicola
Bay appears to be very limited at best. “Optimal” freshwater inflow conditions for the
region’s fishing and oyster industries, or how the ACF Basin could be regulated to provide
optimal conditions, has apparently never been determined. During peak drought conditions
in late 2007, USACE was unable to quantify how much water had been released from Lake
Lanier specifically to meet minimum flow for the Apalachicola River. Others have described
Final Report LAKE SIDNEY LANIER ECONOMIC IMPACT ANALYSIS
Water Supply and Other Issues 98
the link between Lanier releases and in-stream flows at the Florida border as “extremely
tenuous and at times not measurable.”
The NED economic benefits of hydropower generation in the ACF Basin have been
diminishing over time, while the Lake Lanier’s recreational value has increased. The
marginal economic benefits of maintaining higher lake levels for recreation has been
previously estimated to be 8 times the marginal cost of the resulting reductions in
hydropower production. Changing operational priorities at Lake Lanier are also unlikely to
restrict downstream flows to a degree that would prevent the supply of adequate cooling
water for the Farley Station nuclear plant in Alabama.
Based on these findings, it is reasonable to conclude that marginally changing operating policies at
Lake Lanier, designed to prevent severe draw-downs and maintain lake levels closer to full pool
during longer periods of the year, would have minimal adverse economic impacts on downstream
economies. The Consultants believe that it is not necessary to adjust the economic impact
estimates in Chapter IV to account for possible downstream job losses, as it is difficult to construct a
credible scenario whereby such job losses would occur.
B. Municipal and Industrial Water Supply The final section of this report addresses Lake Lanier’s importance as the primary source of
Metropolitan Atlanta’s municipal and industrial water supply. It was also beyond the scope of this
study to independently quantify the lake’s economic impact as a source of M&I water supply.
However, the consultants did review two prior research efforts which addressed this same issue.
The first was a 2004 Camp Dresser & McKee study prepared for the Atlanta Regional Commission
and the second was a 2009 presentation prepared by the Governor’s Georgia Water Task Force.
That analysis addressed the costs of a recent Federal Court ruling which restricts future Lake Lanier
water supply withdrawals.
Both studies specifically addressed the economic consequences of water supply shortages in the
event that permitted lake withdrawals were no longer adequate to meet demand. Each analysis
forecasted different scenarios of future supply/demand conditions, which obviously resulted in
different impact estimates. The studies also made different measures of economic impact. The
CDM Study looked at the National Economic Development (NED) benefits of maintaining Lake
Lanier as a source of M&I water supply, while the Georgia Water Task force focused on the effects
of reduced water supplies on Metro-Atlanta’s economic output or gross regional product (GRP). Yet
despite these differences, the conclusions were reasonably consistent and very significant. The
results of each study are summarized below.
1. CDM Study Summary and Conclusions
The 2004 CDM Study examined the impacts of water supply shortages on future water rates,
consumer incomes and water dependent industries.41 It measured impacts over 50 years, assuming
that Lake Lanier could not be used to meet future water demand growth, as opposed to no longer
41 ibid, pages 28-34.
Final Report LAKE SIDNEY LANIER ECONOMIC IMPACT ANALYSIS
Water Supply and Other Issues 99
being allowed to service the region’s existing demand. The consultant team developed a model
which projected demand growth supplied by water withdrawals from Lake Lanier and the
Chattahoochee River through Atlanta.
The baseline “without reallocation” alternative capped withdrawal levels, which resulted in an
annual projected shortage of 143.1 million gallons per day (mgd) by 2050. The model then
calculated the effects of prolonged water shortages on water/sewer rates, driven in part by the cost
of implementing water conservation and reclamation programs. The basis for estimating the
effects of supply shortages on rates referenced actual drought management experience in
California during the late 1990s. Combined water and sewer cost impacts were then forecast
through the useful life of the Buford Dam (to 2057) and discounted back to the present. The
authors used the federal discount rate of 6.625% to discount these increased future costs to arrive
at a net M&I water shortage cost of $19.1 billion to the national economy.
According to information provided by the Atlanta Regional Commission, approximately (66%) of
Metro-Atlanta’s M&I water supplied is currently (2006 data) returned to the Chattahoochee Basin.
Infiltration/inflow reductions and other conservation measures are expected to increase the return
ratio to 78% by 2035.42 In its report, CDM estimated that actual net water consumption (water
withdrawals minus waste-water returns) in the Atlanta area would have very limited impacts on
downstream flows.”43 Therefore, present value water shortage cost was classified as a “foregone
benefit” and a net loss to the national economy (or foregone consumer surplus) based on the
finding that water shortage costs could be avoided entirely by enabling Lake Lanier to meet
projected demand growth, with relatively little resulting downstream impacts.
The authors also emphasized that their analysis only measured the direct national economic
development (NED) losses by failing to reallocate Lanier’s water resources and did not consider the
regional economic development (RED) consequences of prolonged water shortages on Metro-
Atlanta’s economy. The author stated that “RED losses are not known but would be large and
detrimental to Atlanta’s multi-billion dollar economy, substantially affecting the State’s and the
South’s employment and economic activity.” Negative regional economic development impacts
would be an indirect consequence of failing to reallocate Lake Lanier resources for water supply and
are “additive” to the calculation of direct NED losses. Although it did not calculate these costs to
the regional economy, the study concludes that “it is certain that indirect losses several times, if not
orders of magnitude greater (emphasis added) would accrue (to the nation) due to the huge RED
costs of inadequate water supply in the Atlanta Area being absorbed by the national economy.”44
2. Georgia Water Task Force Study Summary
The Georgia Water Task Force, supported by the Bain Consulting Group, examined the potential
economic impacts of a water supply shortfall that would result from a 2009 Federal Court ruling,
which ordered the reduction of water supply withdrawals from Lake Lanier to mid-1970’s levels by
42 Atlanta Regional Commission Regional Water Supply Plan, page 2-7. 43 Ibid, page 60. 44 ibid, page 34.
Final Report LAKE SIDNEY LANIER ECONOMIC IMPACT ANALYSIS
Water Supply and Other Issues 100
2012.45 The Task Force estimated a “no action response” scenario, which assumed that the court
order would be implemented. The consequences of that scenario lowered permitted water
withdrawals from the Chattahoochee River and Lake Lanier by 66% and assumed that all other
supply sources are capped at current levels. The scenario resulted in a 34% regional water shortfall
by 2012. The consequences of that action in terms of resulting regional water supply shortages
were obviously much more severe than modeled by the CDM Study in 2003.
The Task Force examined prior reports which studied the economic effects of comparable water
shortages in California and Texas. Those studies found that the “costs” of water supply shortfalls
resulted in:
Reduced quality of life (restrictions on home water use, investment in landscaping, etc.);
Declining property values (including reduced development potential);
Lower economic output from existing businesses (due to higher costs) and
Reduced future business investment (as businesses relocate elsewhere or grow more slowly
within the region).
The Task Force concluded that a near term water supply shortfall in excess of 30% would impose
massive costs on the region. Water shortages could result in a 13% to 15% reduction to the region’s
total $257 billion annual Gross Regional Product (GRP), translating to an annual economic loss of
$34.9 to $39.3 billion in 2012 dollars. These results were consistent in percentage terms with the
findings of the other studies reviewed by the Task Force. We also understand that a forthcoming
report, being prepared by the Atlanta Regional Commission, will refine this preliminary analysis.
The ARC’s analysis has determined that it will be even more difficult and expensive to replace Lake
Lanier as a source of water supply than initially projected. Therefore the economic impact of losing
Lake Lanier as a primary source of Metro Atlanta’s water supply could be far greater than this
preliminary estimate.
The Task Force did not estimate the employment effects of a 13% to 15% reduction to Metro-
Atlanta’s GRP or total economic output. However, if a decline in GRP produces a proportional 13%
to 15% reduction in the region’s employment, the effects of regional water supply shortages could
eventually result in the loss of more than 250,000 jobs. Although the water shortage scenario
modeled by the Georgia Water Task Force is substantially more severe that the earlier CDM Report,
it is consistent with the references to indirect economic losses to the national economy being
“several orders of magnitude” higher as a result of having to absorb the regional economic impacts
of inadequate water supply in the Atlanta Region.
3. Summary Conclusions
The two prior reports cited above analyzed different future water supply scenarios but reached
similar conclusions. In summary:
45“Water Task Force: Estimating the Economic Cost of Inaction”, PowerPoint presentation dated November 3, 2009.
Final Report LAKE SIDNEY LANIER ECONOMIC IMPACT ANALYSIS
Water Supply and Other Issues 101
There are currently no realistically accessible, reasonable cost, or environmentally
acceptable water supply alternatives to Lake Lanier in the short term;
The magnitude of negative economic impacts associated with losing Lake Lanier as a source
of regional M&I water supply depends on the timing and degree of restricted withdrawals
and the resulting supply shortfalls;
The cost of replacing Lake Lanier as a source of regional water supply would have a multi-
billion annual negative impact on Metro-Atlanta and the U.S. economy;
The annual positive economic impact of continuing to use Lake Lanier for water supply
purposes dwarfs any resulting negative effects on recreational or downstream uses.
Even though maintaining higher pool levels might actually be made easier as a result of reducing
lake withdrawals for water supply purposes, losing Lake Lanier as a source of regional water supply
would have enormously negative regional economic consequences for Metro-Atlanta. The
economic impacts of resulting water shortages and the enormous public cost to acquire
replacement supply would also have a substantial negative effect on recreational spending. Those
negative impacts are likely to be permanent and worse to the lake-dependent economy than the
effects of low water levels during 2008.
The potential to sustain 250,000 job losses to the Atlanta Region as a result of losing Lake Lanier
water supply, exceed the estimated 223,000 total existing private sector jobs (in 2007) located in all
of the Florida and Alabama Counties of the ACF Basin, combined. The huge negative economic
consequences of regional water supply shortages on Metro-Atlanta, a market of more than 4
million people and one of Florida’s largest visitor markets, are very likely to be more severe to
Florida’s tourism economy than the marginal benefits associated with resulting 1% to 2% higher
downstream flows in the lower ACF Basin. The annual economic benefits of continuing to use Lake
Lanier for water supply clearly dwarf any resulting negative effects on lake recreation or
downstream industries.
This study’s overall findings and conclusions are contained in the executive summary at the
beginning of the report.
Final Report LAKE LANIER ECONOMIC IMPACT ANALYSIS
Appendix: Contents A - 1
VI: Appendix
A. Bibliography
B. Survey Questionnaires
C. Detail Tables
Final Report LAKE LANIER ECONOMIC IMPACT ANALYSIS
Appendix A: Bibliography A - 2
Appendix A: Bibliography
Alabama Water Watch Program, Auburn University (2003), “Citizen Guide to Alabama Rivers:
Chattahoochee and Coastal Plain Streams.”
Basile Baumann Prost Cole & Associates, Inc. (2007) “Economic Impact of West Point Lake at
Various Lake Water Levels,” City of LaGrange Georgia.
Bergstrom, John C. et al. (1990). “Economic Impacts of State Parks on State Economies in the
South,” Southern Journal of Agricultural Economics, December: 69-77.
Bhat, Gajanan et al. (1998). “An Eco-Regional Approach to the Economic Valuation of Land and
Water Based Recreation in the United States,” Environmental Management, 22(1): 69-77.
Brown, Tommy L. (2005). “Economic Impact of Changing Water Levels on Lake Ontario and the St.
Lawrence River for Recreational Boaters and Associated Businesses,” Human Dimensions
Research Unit, study funded by the International Joint Commission, in cooperation with the
U.S. Army Corps of Engineers and the Cornell Cooperative Extension Sea Grant program.
Carter, Nicole T., Corn, M. Lynne, Abel, Amy et.al. (2007). ”Apalachicola‐Chattahoochee‐Flint (ACF)
Drought: Federal Reservoir and Species Management,” Congressional Research Service.
Colby, Bonnie and Steven Wishart (2002). “Riparian Areas Generate Property Value Premium for
Landowners,” Working Paper from the Agricultural Resource Economics Program, University
of Arizona.
Colby, Bonnie and Steven Wishart (2002). “Quantifying the Influence of Desert Riparian Areas on
Residential Property Values,” Appraisal Journal (July).
Fleming, Christopher M. and Averil Cook (2008). “The recreational value of Lake McKenzie, Fraser
Island (Australia): An application of the travel cost method,” Tourism Management, 29:
1197-1205.
Georgia Water Task Force (2009). “Estimating the Economic Cost of Inaction,” (November 3).
Hawks, Laurie J. and J.M. Bowker (1994). “Estimating the Local Economic Impact of Lake
Recreation in Northern California,” Proceedings, 1993 Southeastern Recreation Research
Conference, Vol. 15 (General Technical Report SE-90).
Hodges, Alan W, Mulkey, David, Philippakos, Effie and Adams, Chuck (2000). “Economic Impact of
Florida's Commercial Fisheries and Aquaculture Industries,” University of Florida
Cooperative Extension Service, Institute of Food and Agricultural Sciences.
Final Report LAKE LANIER ECONOMIC IMPACT ANALYSIS
Appendix A: Bibliography A - 3
Hodges, Alan W. and Adams, Charles (2003). “Values Associated with the Apalachicola Bay Marine
Economy,” International Agricultural Trade and Policy Center, University of Florida Institute
of Food and Agricultural Services.
Hughes, E.D. (2001). “Lake Sidney Lanier: A Study of the Economic Impact of Recreation,” Greater
Hall Chamber of Commerce.
Landers, Mark N., Painter, Jaime A (2007), “How Much Water is in the Apalachicola,
Chattahoochee and Flint Rivers, and How Much is Used?,” U.S. Department of the Interior,
U.S. Geological Survey.
Lansford, Notie, Jr. and Lonnie L. Jones (1995). “Effects of LCRA Lakes on Riparian Property Values:
Recreational and Aesthetic Components of Lake Side Housing in the Colorado River Basin,”
Technical Report No. 170, Texas Water Resources Institute, Texas A&M University.
Lynch, Tim et al. (2003). “The Economic Impact of the 2nd Annual Florida Panhandle Birding and
Wildflower Festival (Hosted in Gulf, Franklin and Bay Counties, October 2002). Center for
Economic Forecasting and Analysis, School of Management (Center for Applied Business
Research), Florida State University, March.
Marella, Richard L., Fanning, Julia L., and Mooty, Will S., (1993) “Estimated Use of Water in the
Apalachicola-Chattahoochee-Flint River basin during 1990 with State Summaries from 1970
to 1990,” Water-Resources Investigation Report 93-4084, U.S. Geological Survey, Geological
Survey of Alabama, Florida Department of Environmental Regulation and Georgia Geological
Survey.
McGinley, Susan (2006). “Location, Location, Location: The Effect of Riparian Areas on Property
Values in Tucson,” The University of Arizona College of Agriculture and Life Sciences.
McMahon, George F., et al. (2004). “Lake Lanier National Economic Development Update:
Evaluation of Water Supply, Hydropower and Recreation Benefits,” Atlanta Regional
Commission and Cobb-County-Marietta Water Authority. CDM Consulting.
Morgan, K.L., Stevens, T.J., Degner, R.L., Larkin S.L., and Adams C.M., (2010) “Economic Impacts of
Alternative Regulatory Scenarios on the Florida Fresh Half-Shell Oyster Industry: A Study of
Potential Outcomes,” University of Florida IFAS Extension.
Murray, Matthew N., Barbour, Karie, Hill, Brian, and Stewart, Kevin (2003), “Economic Effects of
TVA Lake Management Policy in East Tennessee,” University of Tennessee, Center for
Business and Economic Research.
National Marine Manufacturers Association (2009), “2009 Recreational Boating Statistical
Abstract”, Industry Statistics and Research.
Final Report LAKE LANIER ECONOMIC IMPACT ANALYSIS
Appendix A: Bibliography A - 4
Norvell, Stuart and Kevin Kluge (2005). “Socioeconomic Impacts of Unmet Water Needs in the
Region B Water Planning Area,” Texas Water Development Board (prepared in support of
the Region B Water Planning Group and the 2006 Texas State Water Plan).
Propst, Dennis B, et al. (1998). “Estimating the Local Economic Impacts of Recreation at Corps of
Engineers Projects – 1996,” Technical Report R-98-1, Natural Resources Technical Support
Program, U.S. Army Corps of Engineers.
Propst, Dennis B., Daniel J. Stynes and R. Scott Jackson (1992). “A Summary of Spending Profiles for
Recreation Visitors to Corps of Engineers Projects,” Technical Report R-92-1, U.S. Army
Corps of Engineers.
Propst, Dennis B., Chang, Wen-Huei, Lee, LiChu, Perales, Kathleen and Amsden, Benoni L. (2008).
“Economic Impacts from Spending by Marina Slip Renters and Private Dock Owners at Lake
Sidney Lanier”, Recreation Management Support Program, U.S. Army Corps of Engineers.
Sorte, Bruce and Chris Buerger (2006). “Economic Impact Study for Detroit Lake and the Upper
North Santiam Canyon,” Special Report 1071, Oregon State University Extension Service.
U.S. Army Corps of Engineers (2006). Economic Impact Analysis (Recreation Management Support
Program), including updated National Visitor Survey,
http://corpslakes.usace.army.mil/employees/economic/economic.cfm
U.S. Army Corps of Engineers (2003). “Final Environmental Impact Statement for the Operation
and Maintenance (O&M) of Lake Sidney Lanier, Appendix A, REMI Model and
Socioeconomic Impacts.”
U.S. Army Corps of Engineers (2008). “Description of Proposed Action Modification to the Interim
Operations Plan at Jim Woodruff Dam.”
U.S. Department of Commerce, NOAA, National Marine Fisheries Service (2010). “Fisheries Economics
of the United States 2008: Economics and Sociocultural Status and Trends Service.”
U.S. Fish & Wildlife Service, Southeast Region, (2008). “Key Points in the Consultation on the ACF
Revised Interim Operating Plan Apalachicola/Chattahoochee/Flint River Basin.”
Zeng, Wei, Jaing, Feng and Zhang, Yi (2009). “Reservoir Management in the ACF River System
Under the Interim Operation Plan (IOP) During the Ongoing Drought”, Proceedings from the
2009 Georgia Water Resources Conference , April 27‐29, 2009.
Related Documents