DESIGN AND IMPLEMENTATION OF PI CONTROLLER USING GENETIC ALGORITHM AND ANT COLONY OPTIMIZATION FOR A SPHERICAL TANK PROCESS Mr. G. SAKTHIVEL Lecturer (selection grade) Department of Instrumentation Engg Annamalai university chidambaram. By A. KRISHNAMOORTHY M.E. (Process Control & Instrumentation Engg.) (2009-2011)

Welcome message from author
This document is posted to help you gain knowledge. Please leave a comment to let me know what you think about it! Share it to your friends and learn new things together.
Transcript
DESIGN AND IMPLEMENTATION OF PI CONTROLLER USING GENETIC ALGORITHM AND ANT COLONY
OPTIMIZATION FOR A SPHERICAL TANK PROCESS
Mr. G. SAKTHIVELLecturer (selection grade)
Department of Instrumentation EnggAnnamalai university
chidambaram.
By
A. KRISHNAMOORTHYM.E. (Process Control & Instrumentation Engg.)
(2009-2011)
OBJECTIVES OF THE PROJECT WORK
• To identify the model of the spherical tank process by black box modeling for
various operating region.
a) Low Level
b) Middle Level
c) High Level
• To tune the PI controller by Ziegler- Nichols method.
• To optimize the designed PI controller using ACO (Ant Colony Optimization)
Technique for various cost function like IAE, ITAE, ISE.
• To tune the PI controller by Genetic algorithm.
• To compare the results of ACO tuned PI controller with Z-N tuned PI
and GA tuned PI controller in terms of time domain specification and
performance indices like ISE, MSE, ITAE, IAE.
• To obtain the results form both simulation and real time process for
the corresponding models.
• To check to robustness of the above designed controller and test the
ACO under white noise.
PI CONTROLLER
• It consist of proportional and integral action
• PID can be implemented as a stand alone controller (or) part of the controller
e.g. DDC (or) DCS
• Various actions
P-ACTION P = Kp* e
I-ACTION I = ki ∫e dt
D-ACTION D = Kd d(e)/ dt
where
Kp = proportional gain
KI = Integral gain
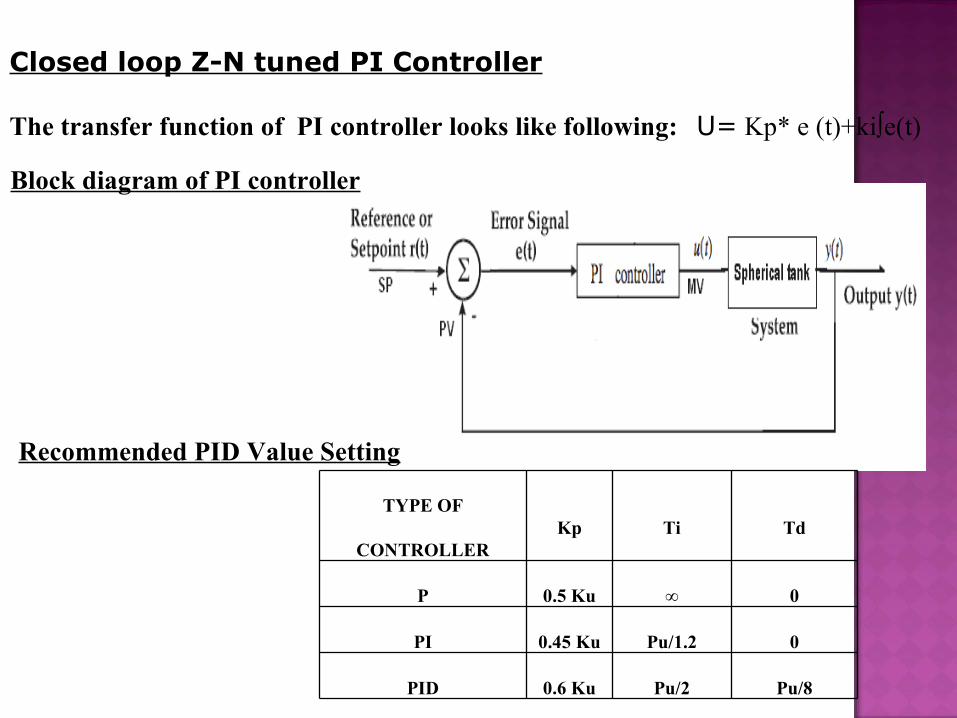
Closed loop Z-N tuned PI Controller
The transfer function of PI controller looks like following:
U= Kp* e (t)+ki∫e(t)
Block diagram of PI controller
TYPE OF
CONTROLLERKp Ti Td
P 0.5 Ku ∞ 0
PI 0.45 Ku Pu/1.2 0
PID 0.6 Ku Pu/2 Pu/8
Recommended PID Value Setting
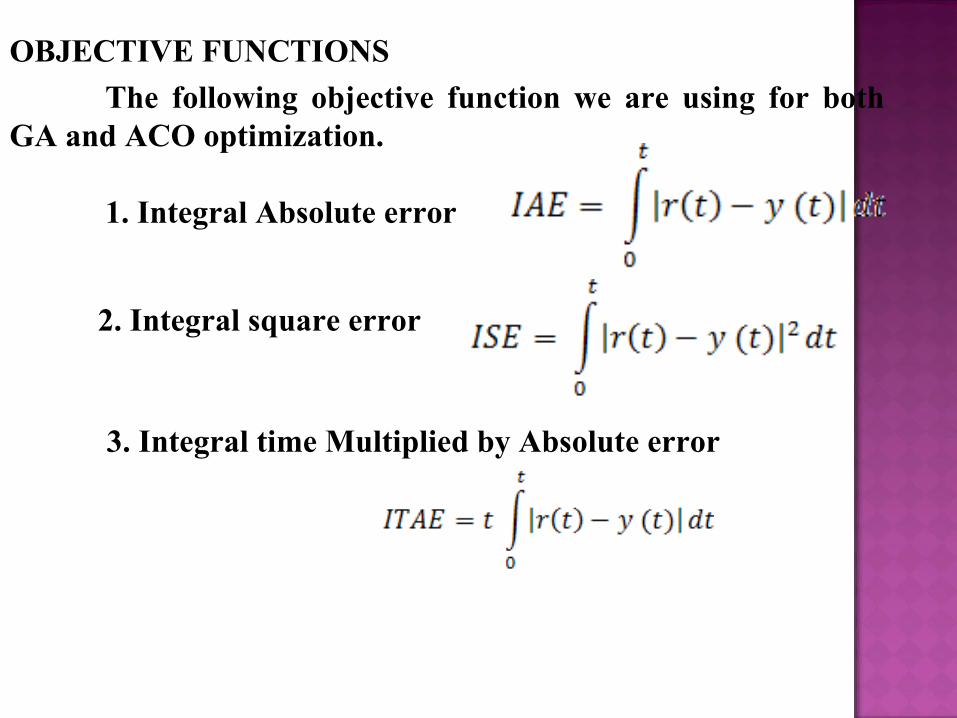
OBJECTIVE FUNCTIONS
The following objective function we are using for both GA and ACO optimization.
1. Integral Absolute error
2. Integral square error
3. Integral time Multiplied by Absolute error

It is a type of machine learning technique
Mimics the biological process of evolution Genetic algorithms
Software programs that learn in an evolutionary manner, similar to the way biological systems evolve
An efficient, domain-independent search heuristic for a broad spectrum of problem domains
Main theme: Survival of the fittes. Moving towards better and better solutions by letting only
the fittest parents to create the future generations
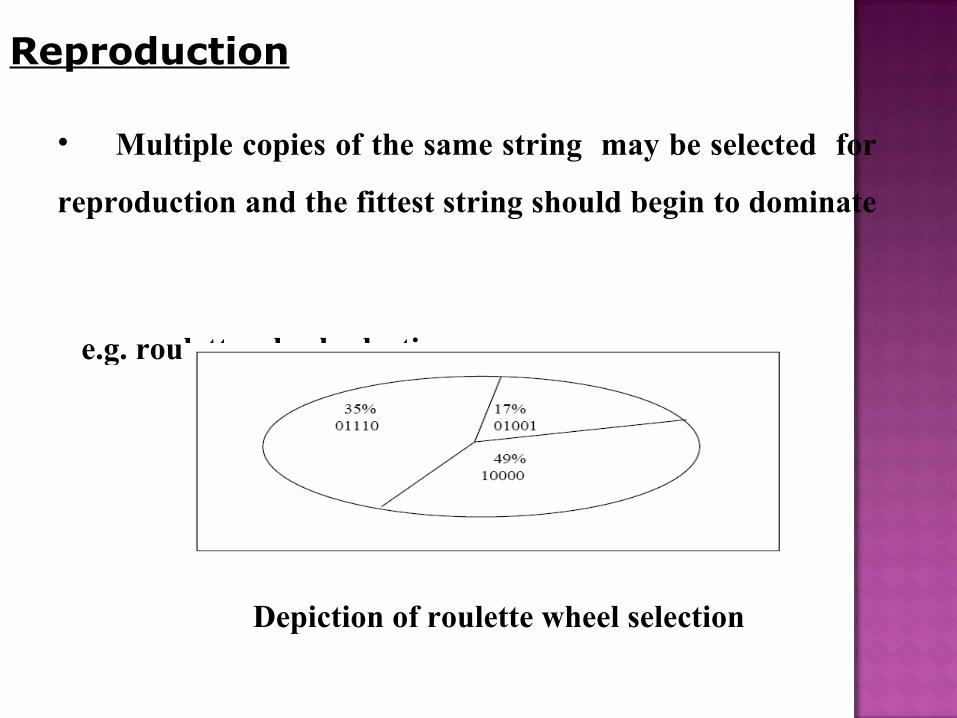
Reproduction
• Multiple copies of the same string may be selected for
reproduction and the fittest string should begin to dominate
e.g. roulette wheel selection
Depiction of roulette wheel selection
CROSSOVER
•Once the selection process is completed, the crossover algorithm is initiated.
•The crossover operations swaps certain port of the two selected strings in a bid to capture the good parts of old chromosomes and create better new ones.
Singe point
Multi point
Uniform
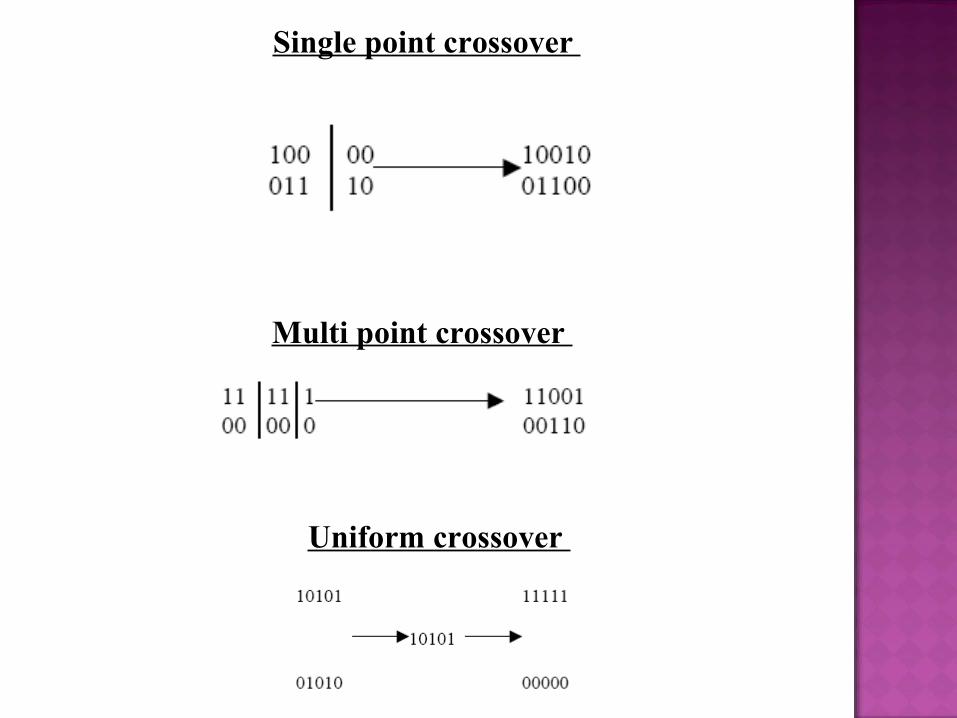
Single point crossover
Multi point crossover
Uniform crossover
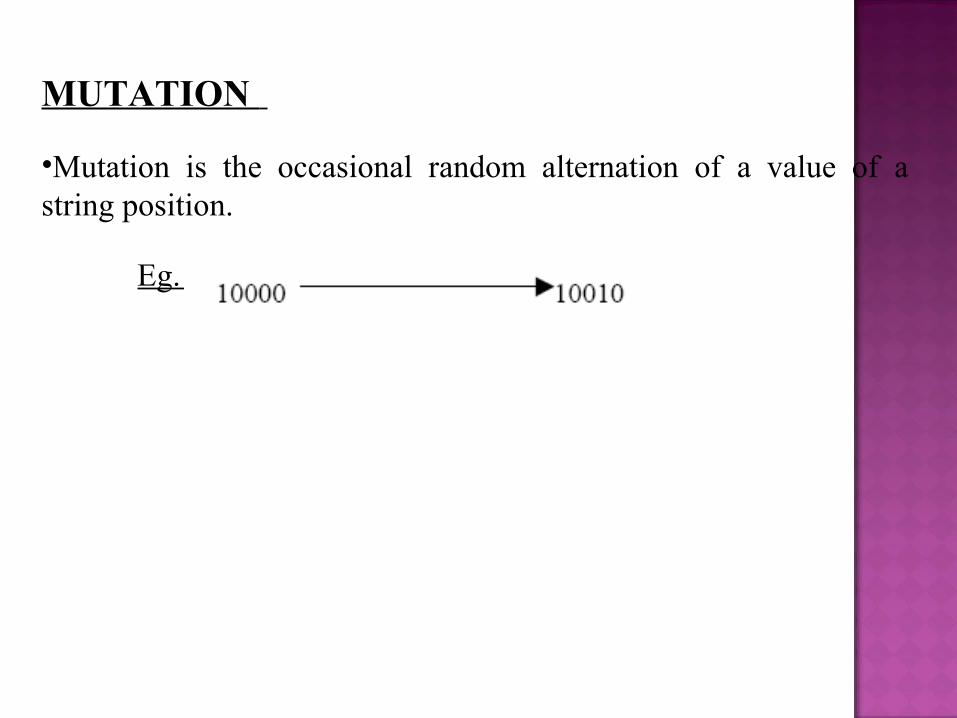
MUTATION
•Mutation is the occasional random alternation of a value of a string position.
Eg.
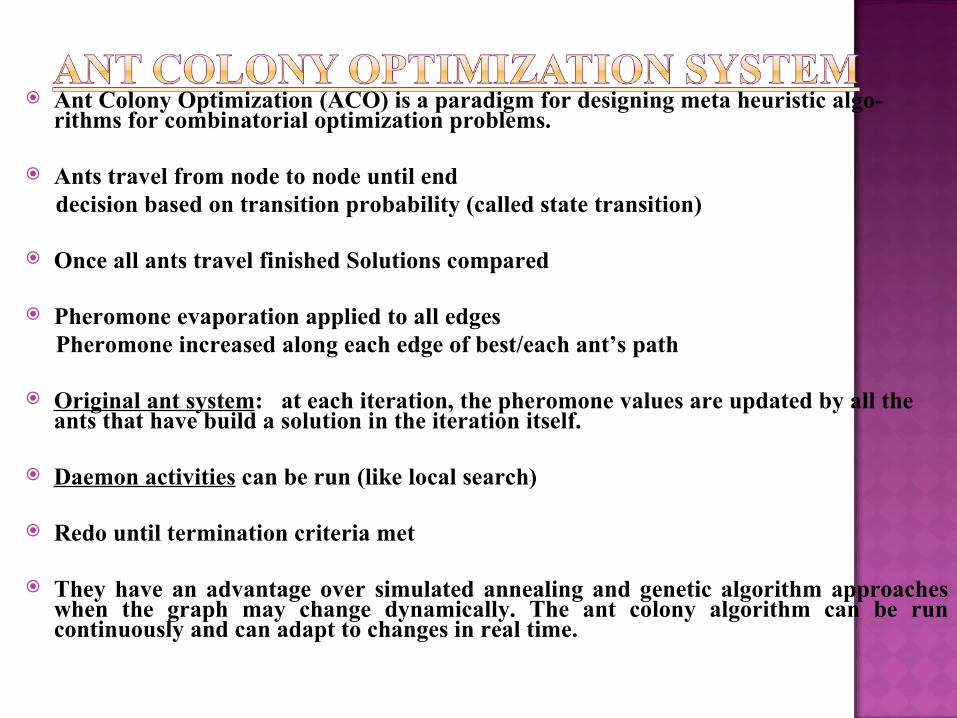
Ant Colony Optimization (ACO) is a paradigm for designing meta heuristic algo-rithms for combinatorial optimization problems.
Ants travel from node to node until end decision based on transition probability (called state transition)
Once all ants travel finished Solutions compared
Pheromone evaporation applied to all edges Pheromone increased along each edge of best/each ant’s path
Original ant system: at each iteration, the pheromone values are updated by all the ants that have build a solution in the iteration itself.
Daemon activities can be run (like local search)
Redo until termination criteria met
They have an advantage over simulated annealing and genetic algorithm approaches when the graph may change dynamically. The ant colony algorithm can be run continuously and can adapt to changes in real time.
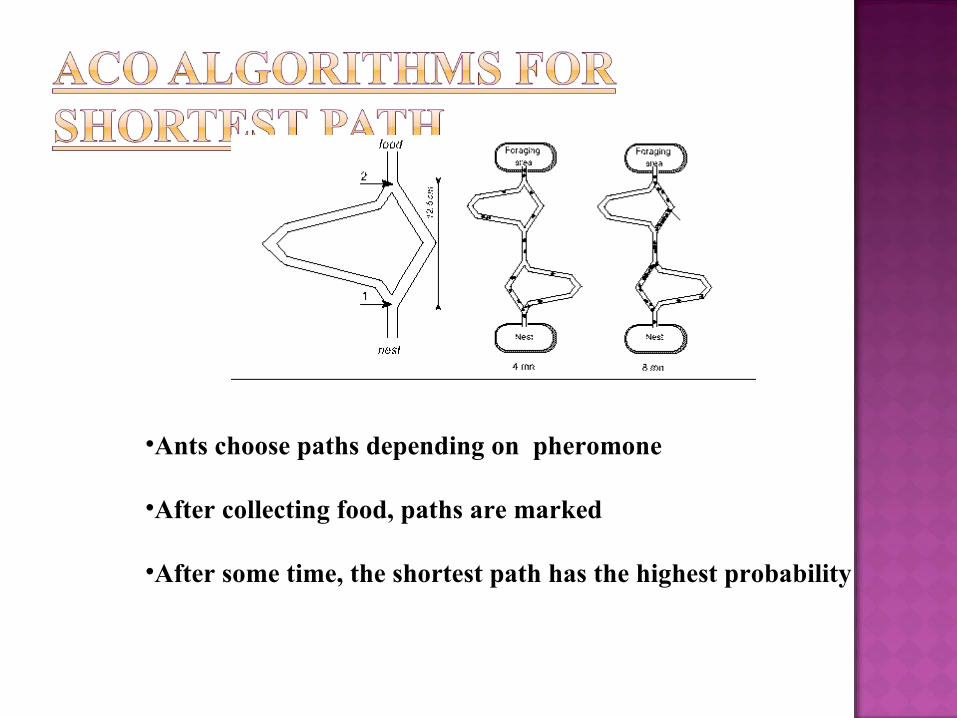
•Ants choose paths depending on pheromone
•After collecting food, paths are marked
•After some time, the shortest path has the highest probability
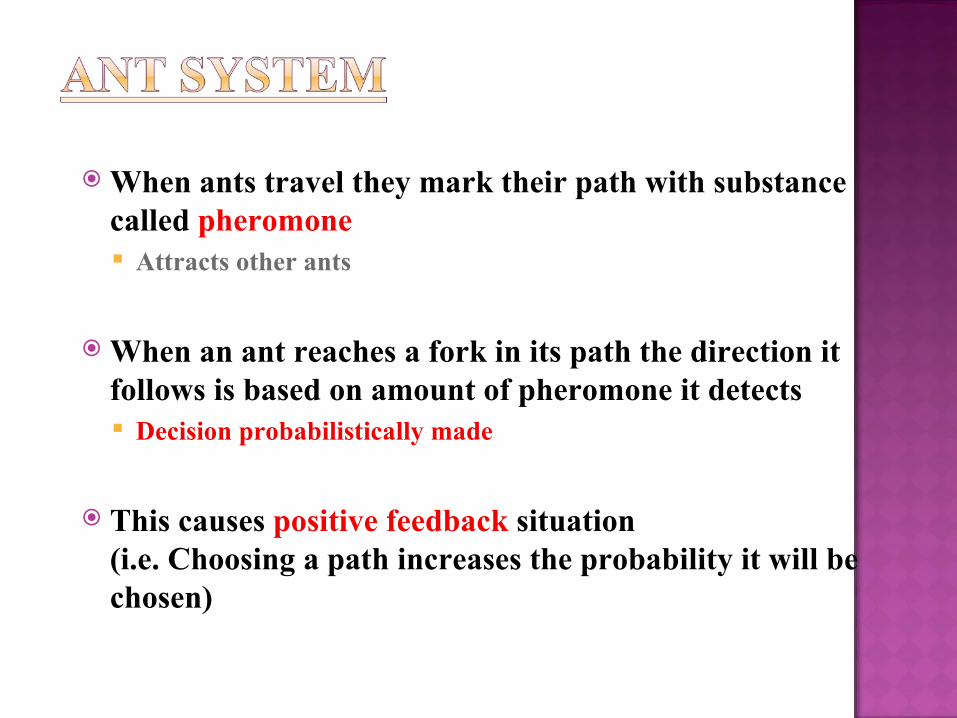
When ants travel they mark their path with substance called pheromone Attracts other ants
When an ant reaches a fork in its path the direction it follows is based on amount of pheromone it detects Decision probabilistically made
This causes positive feedback situation (i.e. Choosing a path increases the probability it will be chosen)
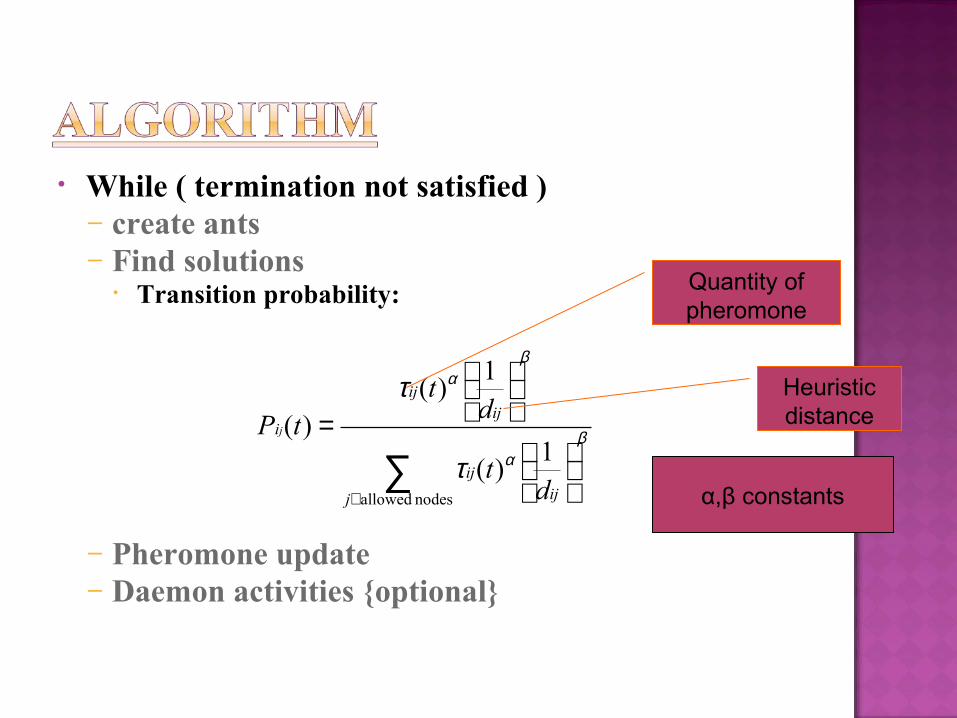
• While ( termination not satisfied )– create ants– Find solutions
• Transition probability:
– Pheromone update– Daemon activities {optional}
∑∈
=
nodes allowed
1)(
1)(
)(
j ijij
ijij
i
dt
dt
tP j βα
βα
τ
τ
Quantity of pheromone
Heuristic distance
α,β constants
∑∈
+−=+),(
)()1()1(
jiedgeusedthatColonyk k
ijij L
Qtt τρτ
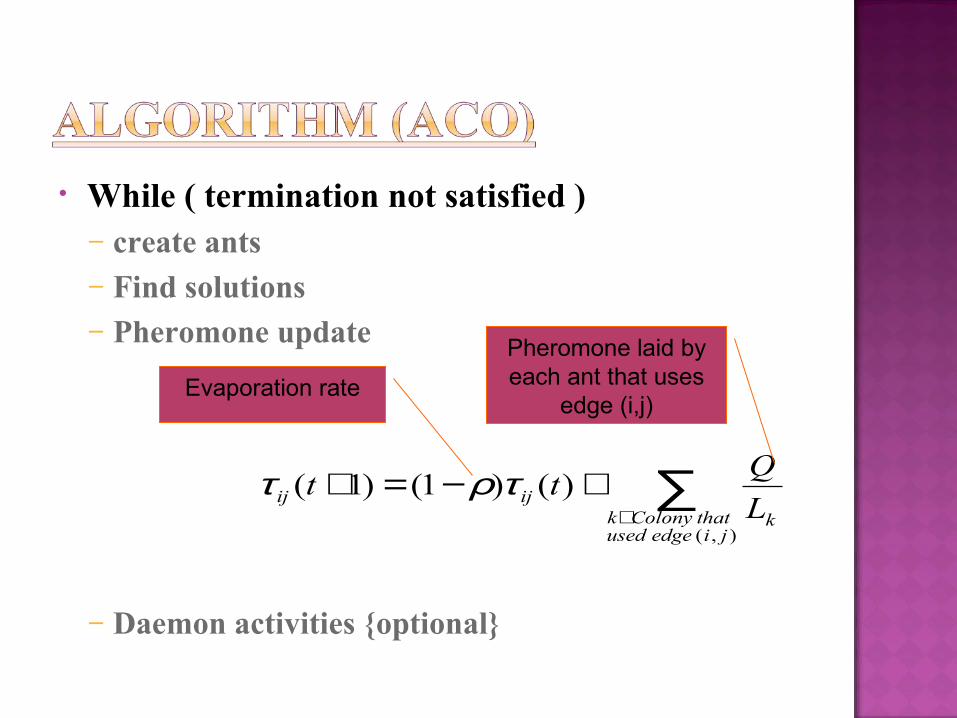
• While ( termination not satisfied )– create ants– Find solutions– Pheromone update
– Daemon activities {optional}
Evaporation rate
Pheromone laid by each ant that uses
edge (i,j)
RESULTS AND DISCUSION
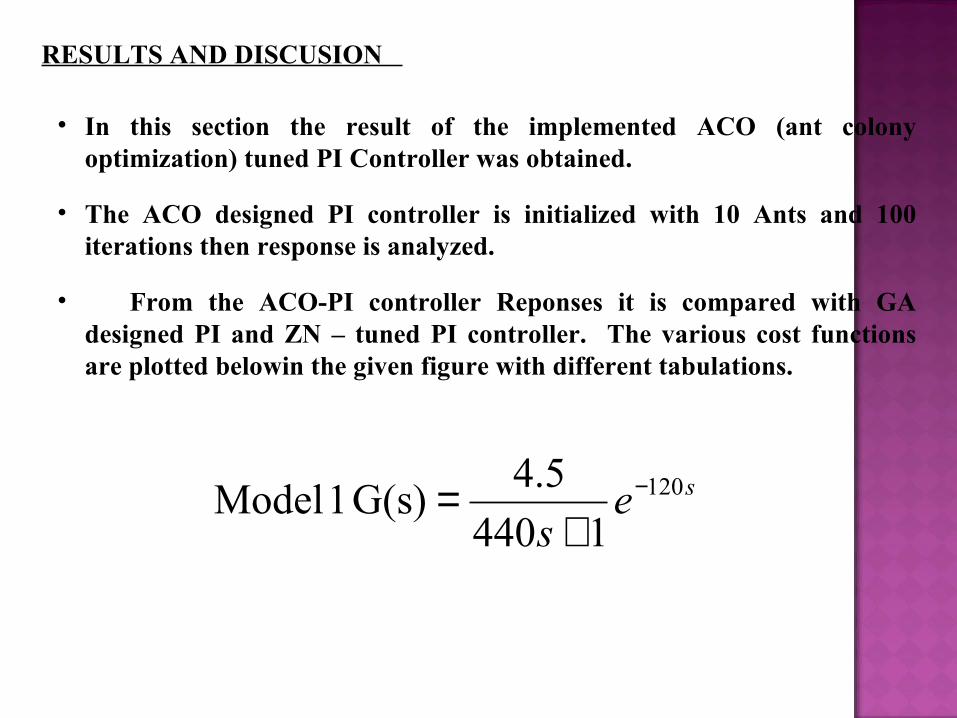
• In this section the result of the implemented ACO (ant colony optimization) tuned PI Controller was obtained.
• The ACO designed PI controller is initialized with 10 Ants and 100 iterations then response is analyzed.
• From the ACO-PI controller Reponses it is compared with GA designed PI and ZN – tuned PI controller. The various cost functions are plotted belowin the given figure with different tabulations.
ses
120
1440
5.4G(s) 1 Model −
+=
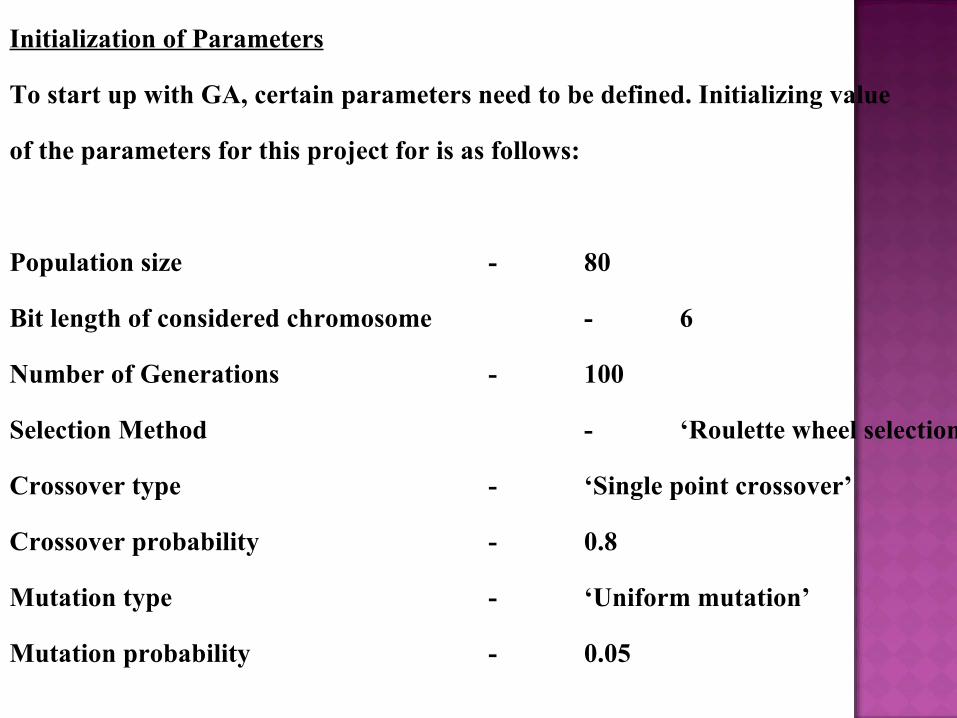
Initialization of Parameters
To start up with GA, certain parameters need to be defined. Initializing value
of the parameters for this project for is as follows:
Population size - 80
Bit length of considered chromosome - 6
Number of Generations - 100
Selection Method - ‘Roulette wheel selection’
Crossover type - ‘Single point crossover’
Crossover probability - 0.8
Mutation type - ‘Uniform mutation’
Mutation probability - 0.05
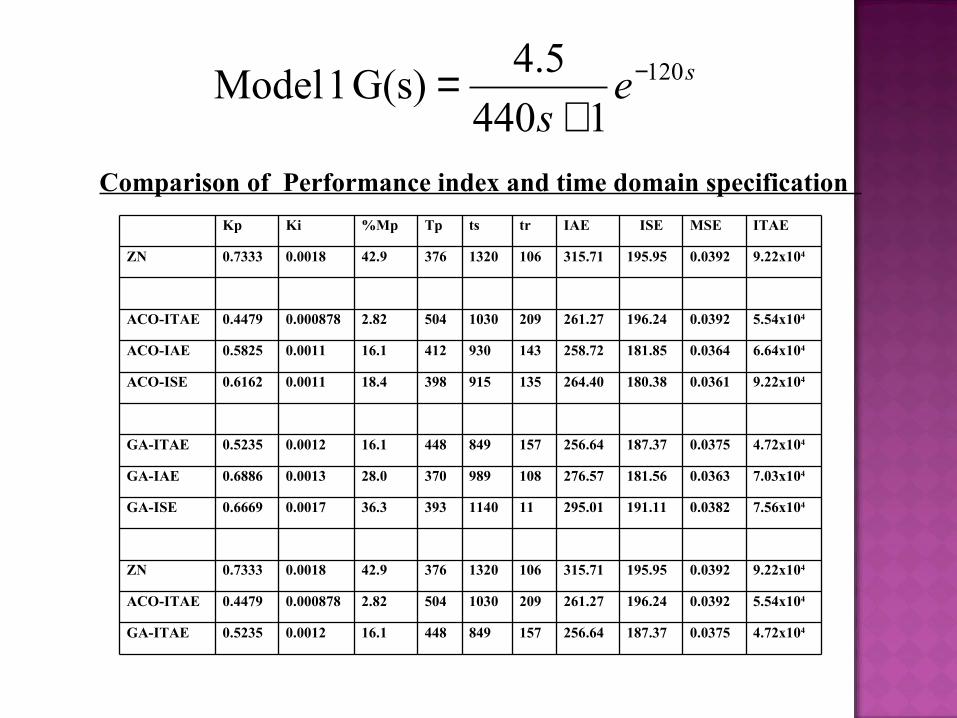
Kp Ki %Mp Tp ts tr IAE ISE MSE ITAE
ZN 0.7333 0.0018 42.9 376 1320 106 315.71 195.95 0.0392 9.22x10⁴
ACO-ITAE 0.4479 0.000878 2.82 504 1030 209 261.27 196.24 0.0392 5.54x10⁴
ACO-IAE 0.5825 0.0011 16.1 412 930 143 258.72 181.85 0.0364 6.64x10⁴
ACO-ISE 0.6162 0.0011 18.4 398 915 135 264.40 180.38 0.0361 9.22x10⁴
GA-ITAE 0.5235 0.0012 16.1 448 849 157 256.64 187.37 0.0375 4.72x10⁴
GA-IAE 0.6886 0.0013 28.0 370 989 108 276.57 181.56 0.0363 7.03x10⁴
GA-ISE 0.6669 0.0017 36.3 393 1140 11 295.01 191.11 0.0382 7.56x10⁴
ZN 0.7333 0.0018 42.9 376 1320 106 315.71 195.95 0.0392 9.22x10⁴
ACO-ITAE 0.4479 0.000878 2.82 504 1030 209 261.27 196.24 0.0392 5.54x10⁴
GA-ITAE 0.5235 0.0012 16.1 448 849 157 256.64 187.37 0.0375 4.72x10⁴
Comparison of Performance index and time domain specification
ses
120
1440
5.4G(s) 1 Model −
+=
500 1000 1500 2000 2500 3000 3500 4000 4500 50000
0.5
1
1.5
Step Response
Time (sec)
Am
plitude
ZN
ACO-itae
GA-itae
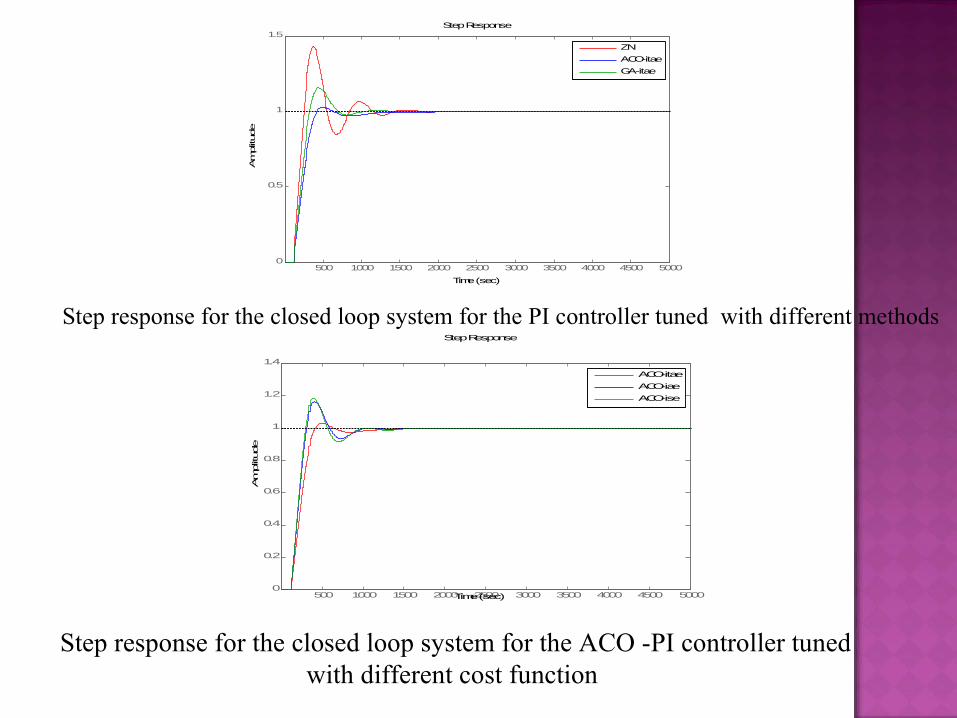
Step response for the closed loop system for the PI controller tuned with different methods
500 1000 1500 2000 2500 3000 3500 4000 4500 50000
0.2
0.4
0.6
0.8
1
1.2
1.4
Step Response
Time (sec)
Am
plitude
ACO-itae
ACO-iae
ACO-ise
Step response for the closed loop system for the ACO -PI controller tuned with different cost function
500 1000 1500 2000 2500 3000 3500 4000 4500 50000
0.2
0.4
0.6
0.8
1
1.2
1.4
Step Response
Time (sec)
Am
plitu
de
GA-itae
GA-iae
GA-ise
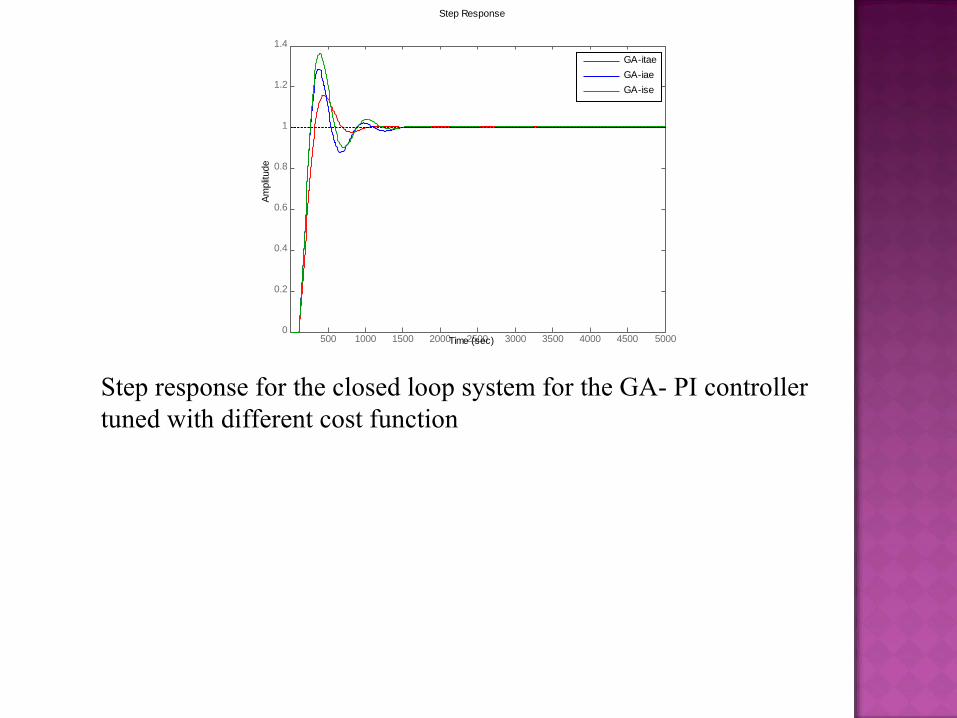
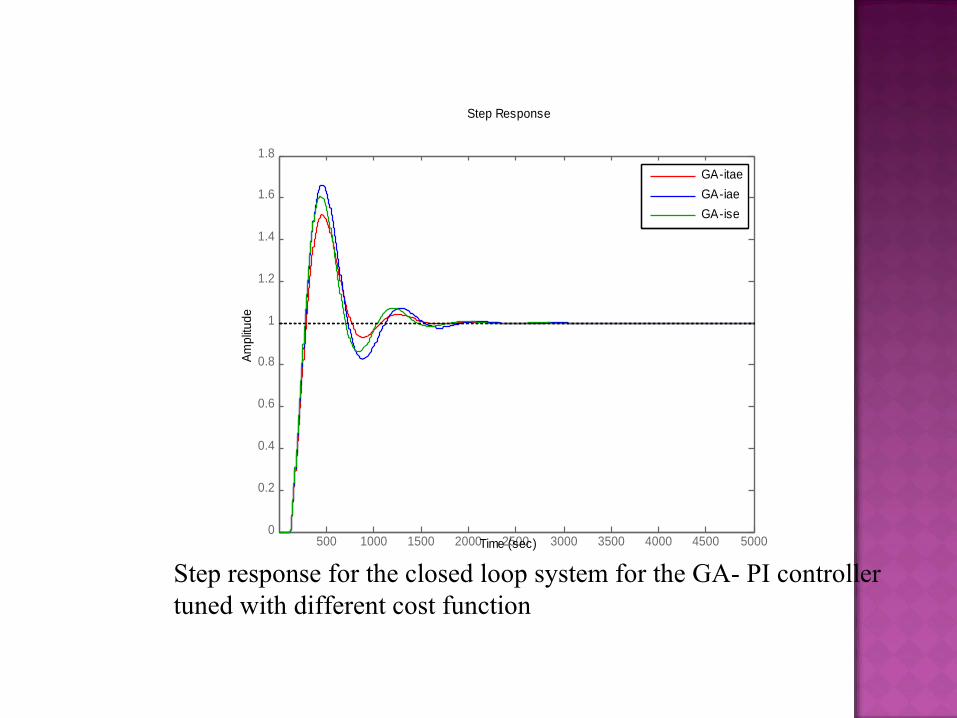
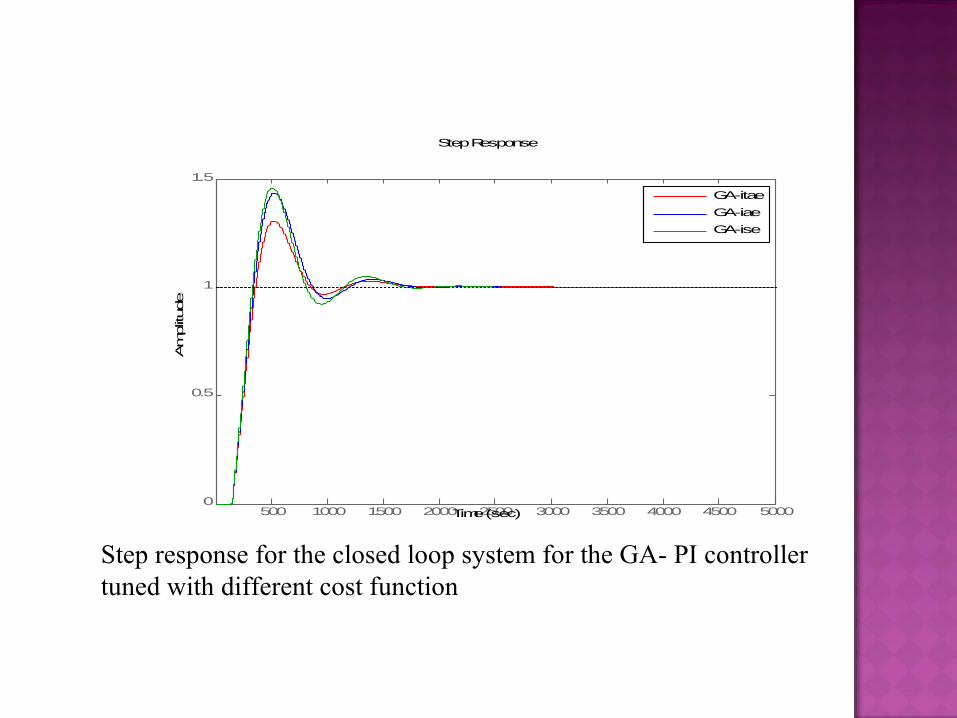
Step response for the closed loop system for the GA- PI controller tuned with different cost function
0 10 20 30 40 50 60 70 80 90 1000
0.5
1
1.5Kp distribution
Kpd
istr
ibut
ion
0 10 20 30 40 50 60 70 80 90 1000
2
4
6x 10
-3 Ki distribution
nuber of iterations
Ki d
istr
ibut
ion
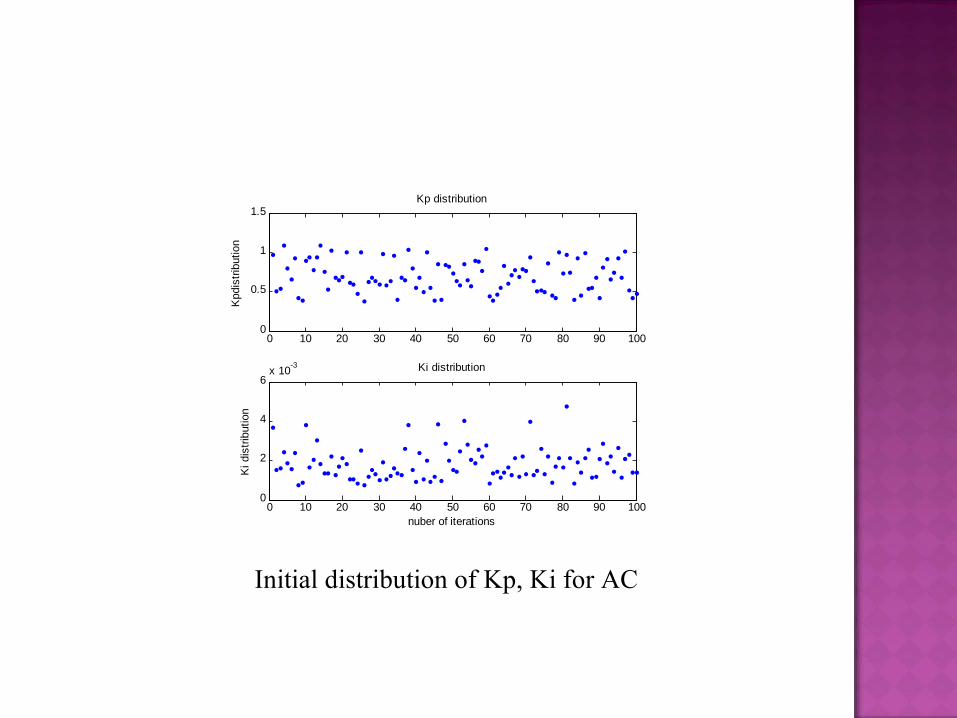
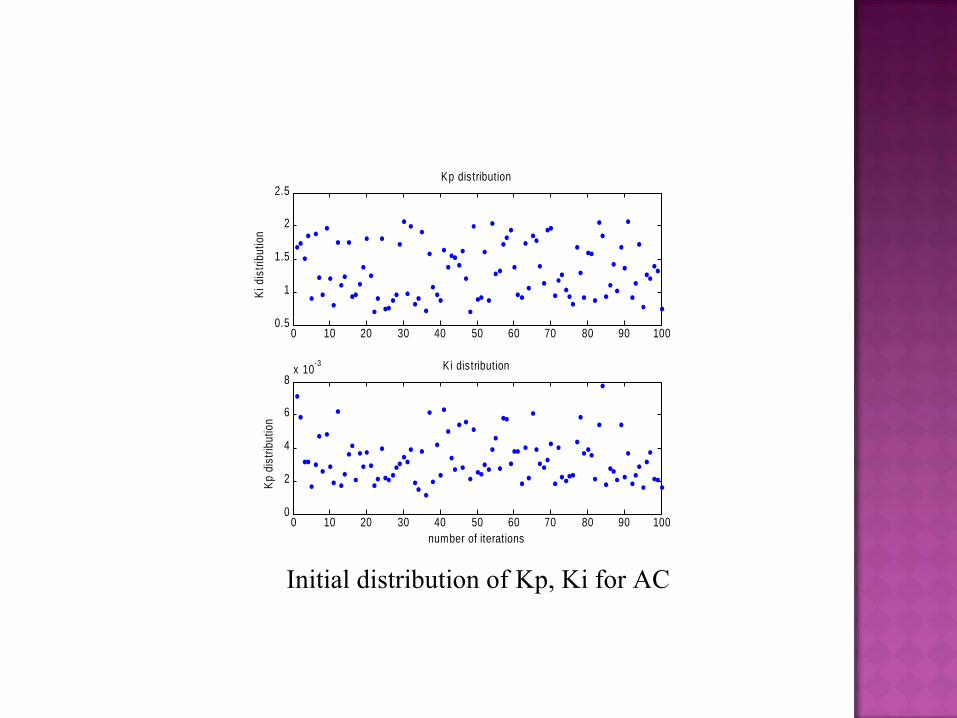
Initial distribution of Kp, Ki for AC
0 20 40 60 80 100 1200.35
0.4
0.45
0.5Kp setteled
0 20 40 60 80 100 1206
7
8
9
10x 10
-4 Ki settelled
number of iterations
gain
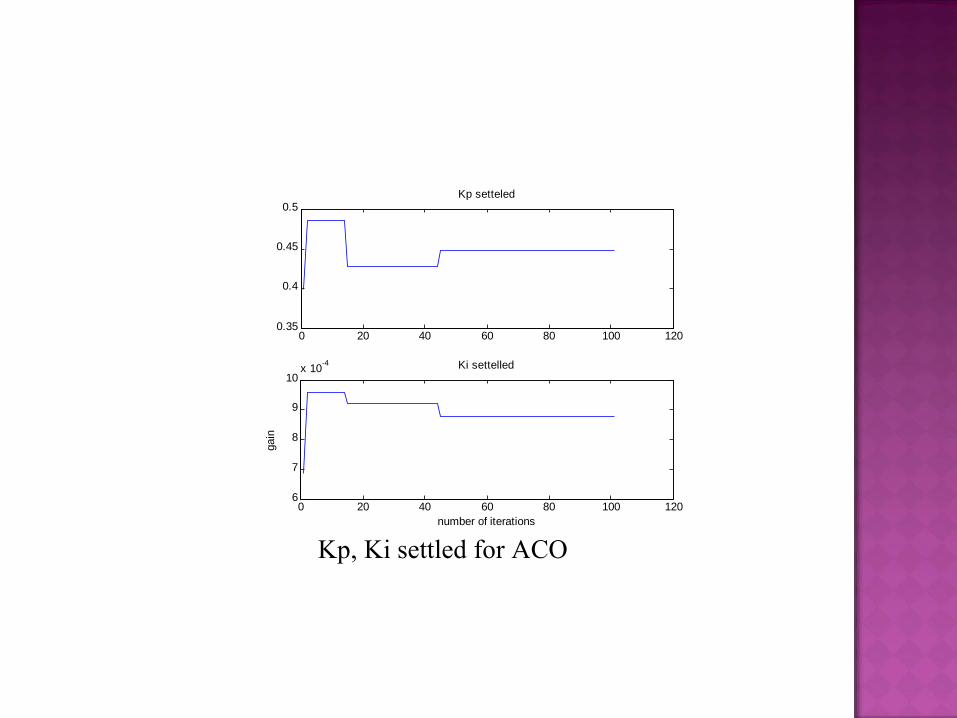
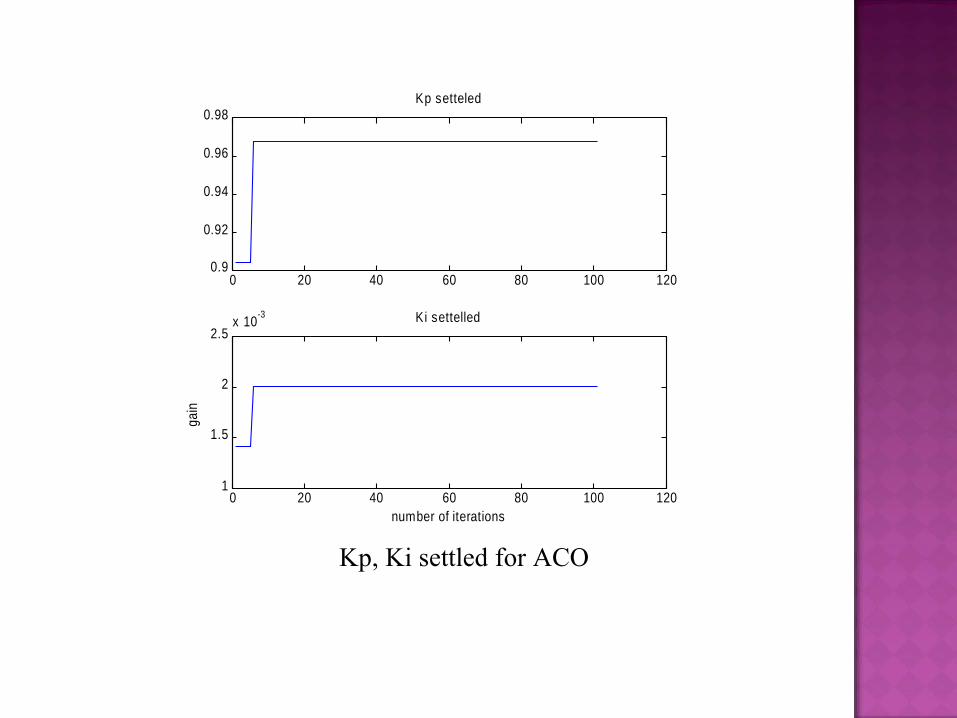
Kp, Ki settled for ACO
0 10 20 30 40 50 60 70 80 90 1000
2
4
6Kp Value
Gai
n
0 10 20 30 40 50 60 70 80 90 1000
0.01
0.02
0.03
0.04Ki Value
Generations
Gai
n
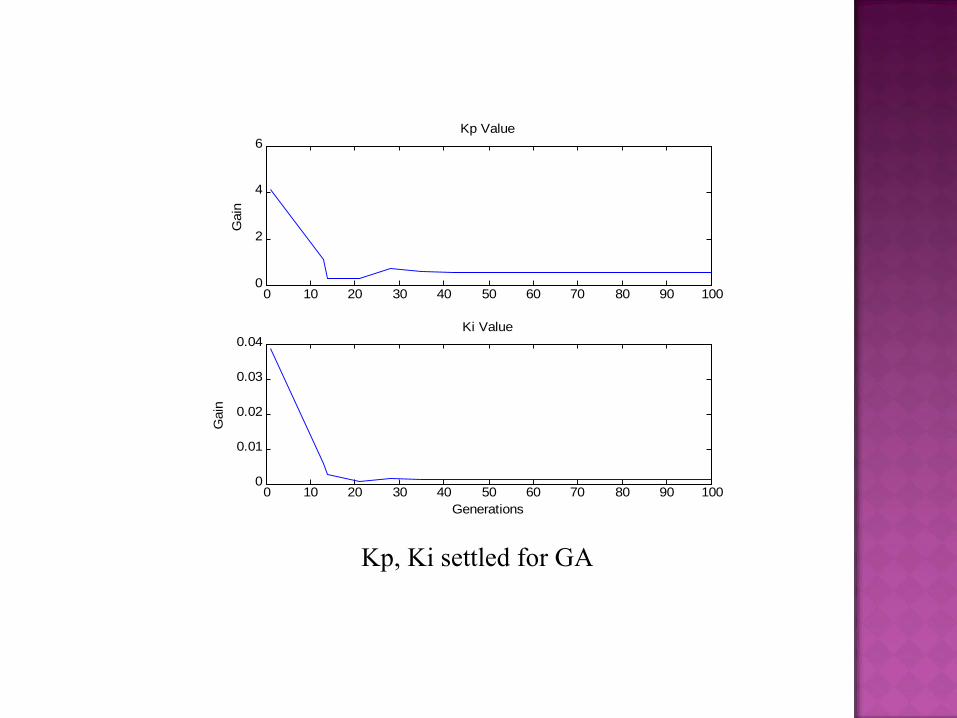
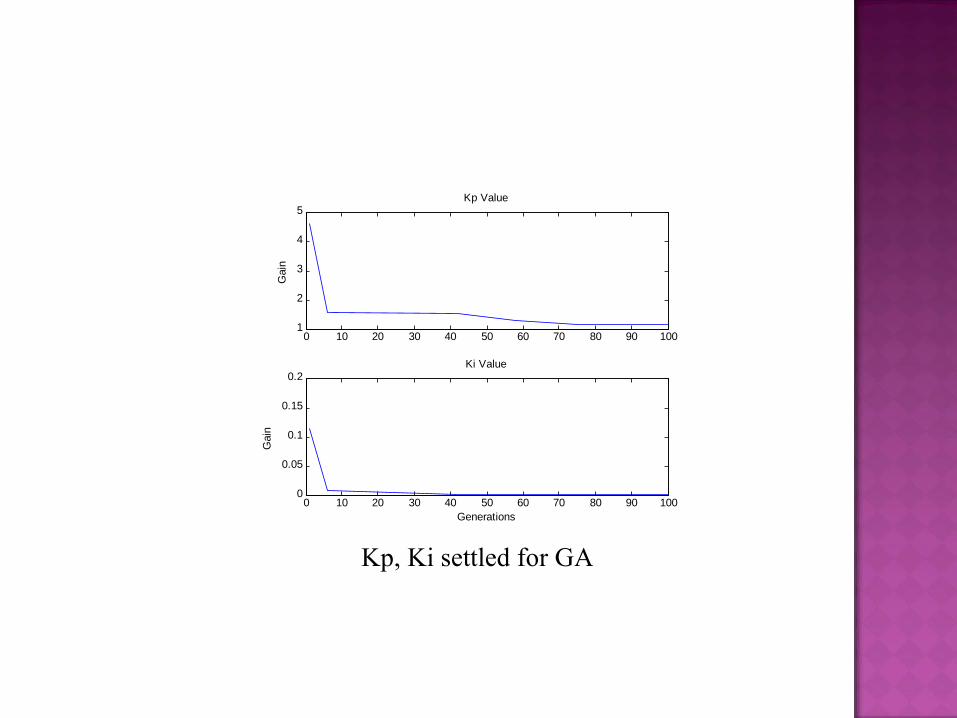
Kp, Ki settled for GA
0 20 40 60 80 100 120800
1000
1200
1400
1600
1800
2000
2200
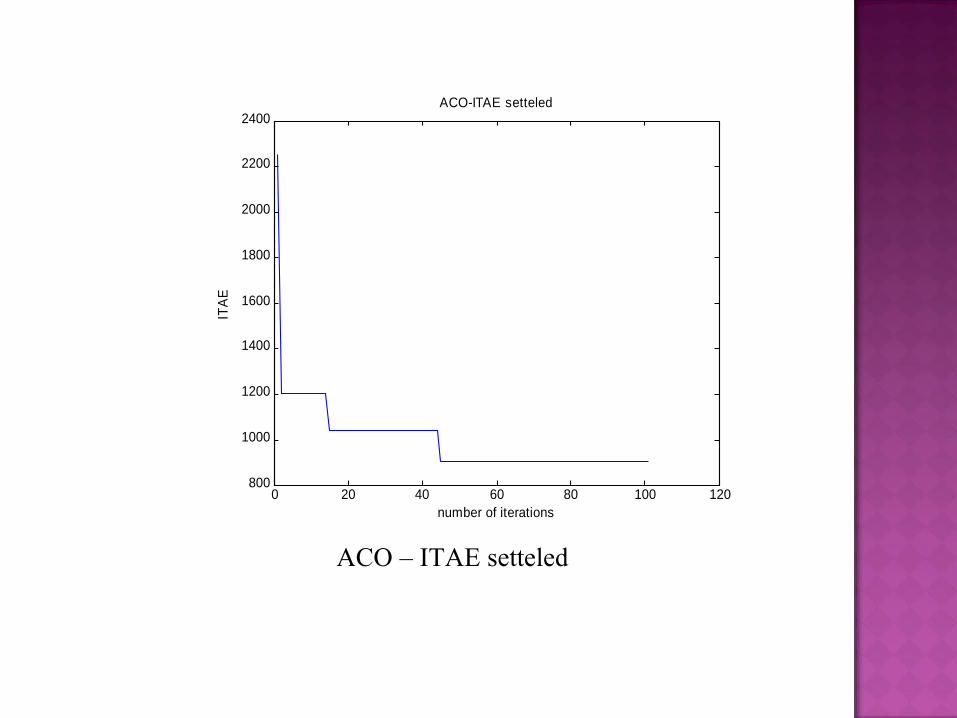
2400ACO-ITAE setteled
number of iterations
ITA
E
ACO – ITAE setteled
ses
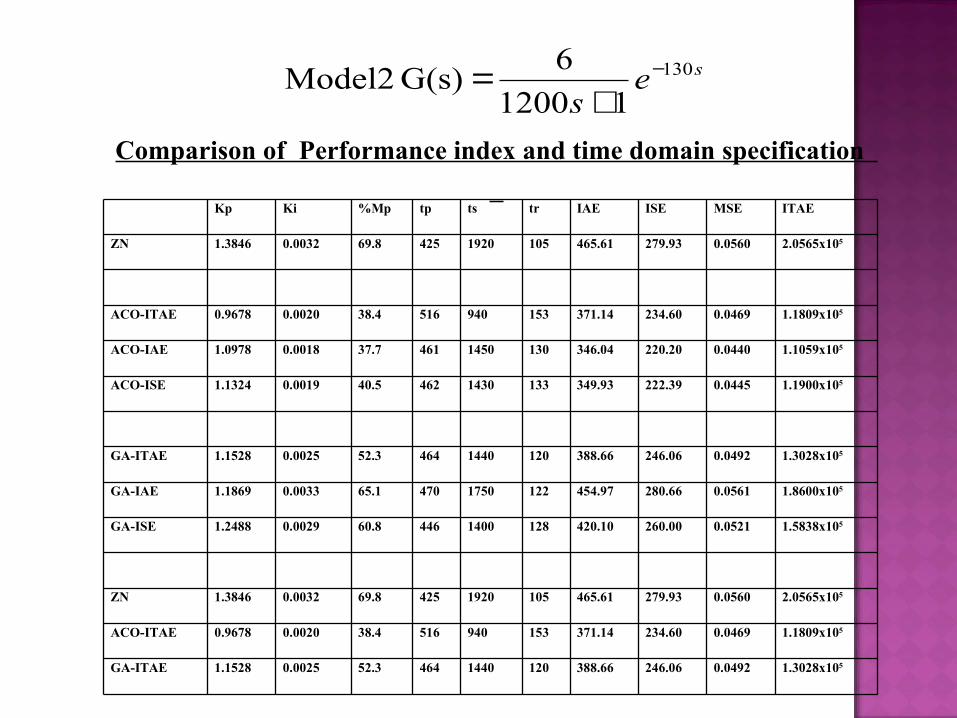
130
11200
6G(s) Model2 −
+=
Kp Ki %Mp tp ts tr IAE ISE MSE ITAE
ZN 1.3846 0.0032 69.8 425 1920 105 465.61 279.93 0.0560 2.0565x10⁵
ACO-ITAE 0.9678 0.0020 38.4 516 940 153 371.14 234.60 0.0469 1.1809x10⁵
ACO-IAE 1.0978 0.0018 37.7 461 1450 130 346.04 220.20 0.0440 1.1059x10⁵
ACO-ISE 1.1324 0.0019 40.5 462 1430 133 349.93 222.39 0.0445 1.1900x10⁵
GA-ITAE 1.1528 0.0025 52.3 464 1440 120 388.66 246.06 0.0492 1.3028x10⁵
GA-IAE 1.1869 0.0033 65.1 470 1750 122 454.97 280.66 0.0561 1.8600x10⁵
GA-ISE 1.2488 0.0029 60.8 446 1400 128 420.10 260.00 0.0521 1.5838x10⁵
ZN 1.3846 0.0032 69.8 425 1920 105 465.61 279.93 0.0560 2.0565x10⁵
ACO-ITAE 0.9678 0.0020 38.4 516 940 153 371.14 234.60 0.0469 1.1809x10⁵
GA-ITAE 1.1528 0.0025 52.3 464 1440 120 388.66 246.06 0.0492 1.3028x10⁵
Comparison of Performance index and time domain specification
500 1000 1500 2000 2500 3000 3500 4000 4500 50000
0.2
0.4
0.6
0.8
1
1.2
1.4
1.6
1.8
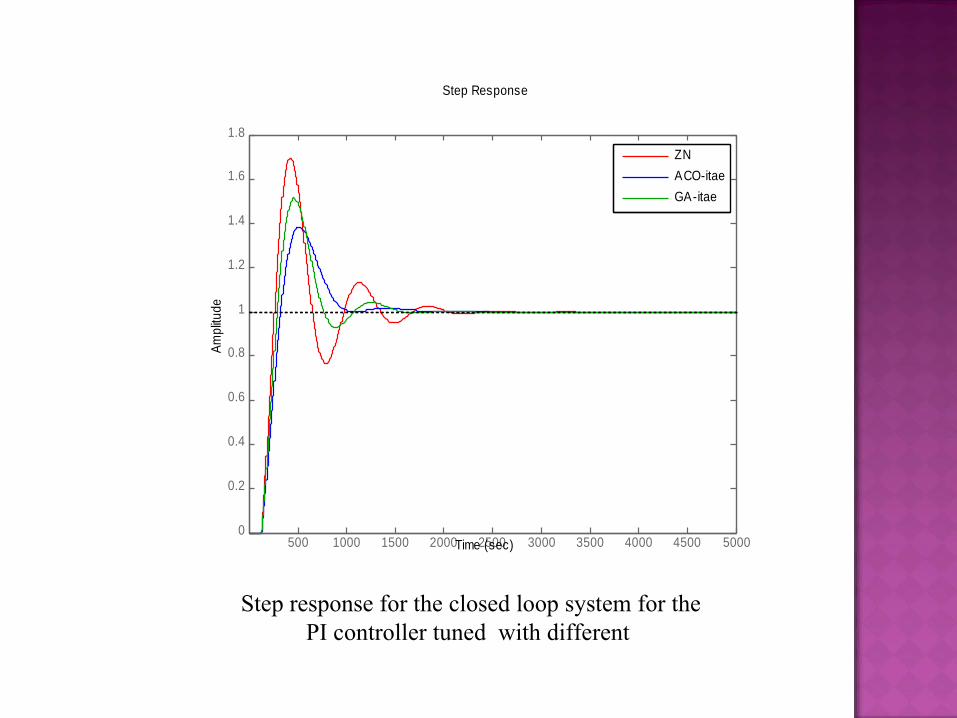
Step Response
Time (sec)
Am
plitu
de
ZN
ACO-itae
GA-itae
Step response for the closed loop system for the PI controller tuned with different
500 1000 1500 2000 2500 3000 3500 4000 4500 50000
0.5
1
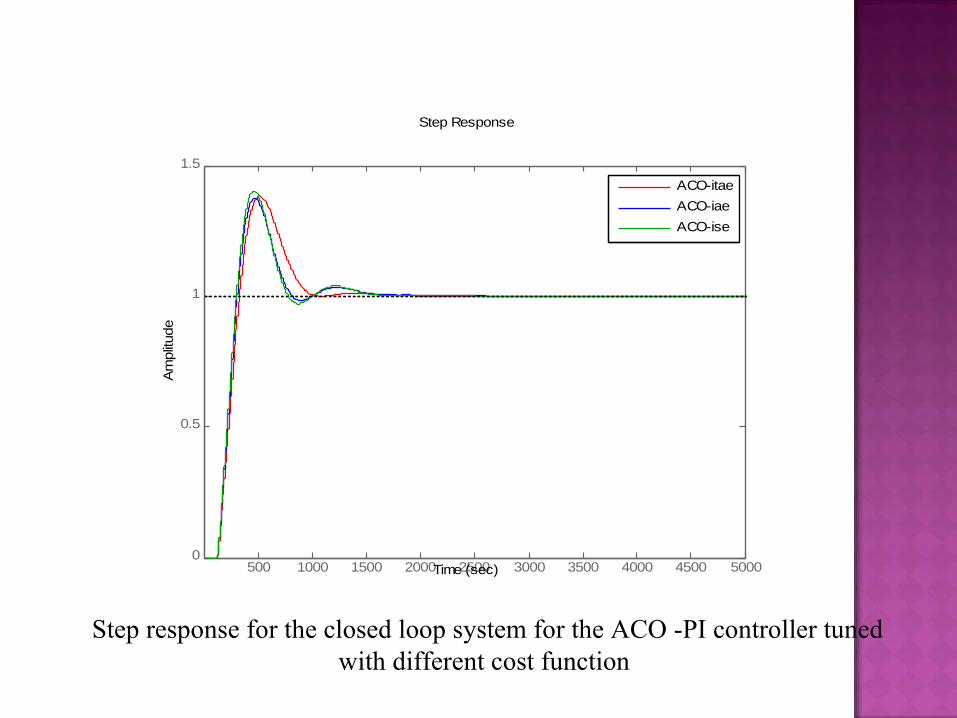
1.5
Step Response
Time (sec)
Am
plitu
deACO-itae
ACO-iae
ACO-ise
Step response for the closed loop system for the ACO -PI controller tuned with different cost function
500 1000 1500 2000 2500 3000 3500 4000 4500 50000
0.2
0.4
0.6
0.8
1
1.2
1.4
1.6
1.8
Step Response
Time (sec)
Am
plitu
de
GA-itae
GA-iae
GA-ise
Step response for the closed loop system for the GA- PI controller tuned with different cost function
0 10 20 30 40 50 60 70 80 90 1000.5
1
1.5
2
2.5Kp dis tribution
Ki d
istri
butio
n
0 10 20 30 40 50 60 70 80 90 1000
2
4
6
8x 10
-3 Ki distribution
number of iterations
Kp
dist
ribut
ion
Initial distribution of Kp, Ki for AC
0 20 40 60 80 100 1200.9
0.92
0.94
0.96
0.98Kp setteled
0 20 40 60 80 100 1201
1.5
2
2.5x 10
-3 Ki settelled
number of iterations
gain
Kp, Ki settled for ACO
0 10 20 30 40 50 60 70 80 90 1001
2
3
4
5Kp Value
Gai
n
0 10 20 30 40 50 60 70 80 90 1000
0.05
0.1
0.15
0.2Ki Value
Generations
Gai
n
Kp, Ki settled for GA
0 20 40 60 80 100 1202450
2500
2550
2600
2650
2700
2750
2800
2850
2900
2950ACO-ITAE setteled
number of iterations
ITA
E
ACO – ITAE settled
ses
150
11050
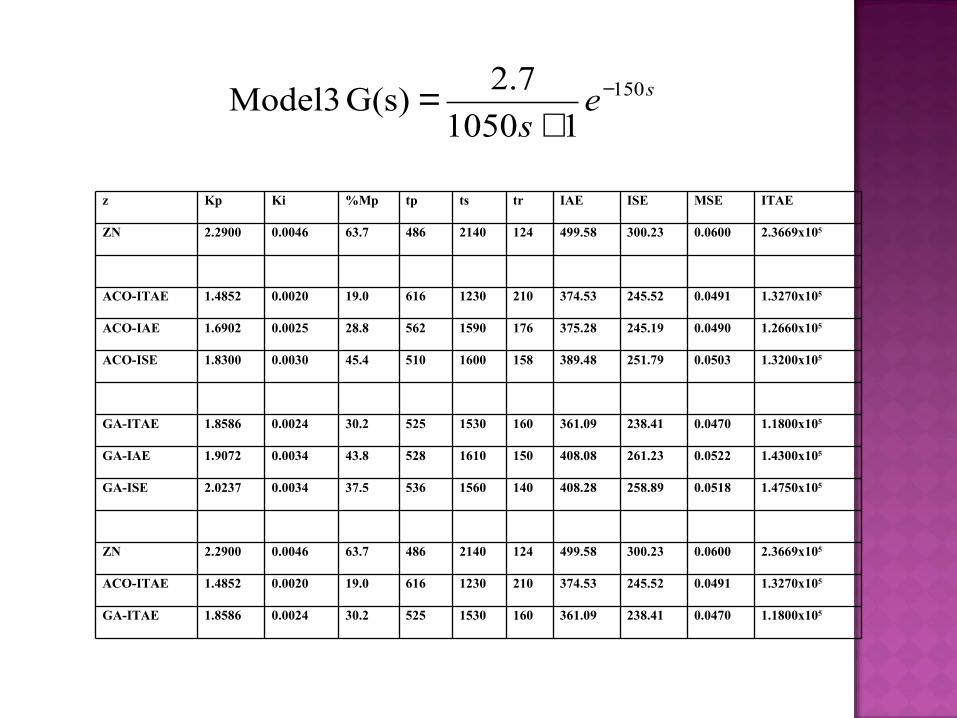
7.2G(s) Model3 −
+=
z Kp Ki %Mp tp ts tr IAE ISE MSE ITAE
ZN 2.2900 0.0046 63.7 486 2140 124 499.58 300.23 0.0600 2.3669x10⁵
ACO-ITAE 1.4852 0.0020 19.0 616 1230 210 374.53 245.52 0.0491 1.3270x10⁵
ACO-IAE 1.6902 0.0025 28.8 562 1590 176 375.28 245.19 0.0490 1.2660x10⁵
ACO-ISE 1.8300 0.0030 45.4 510 1600 158 389.48 251.79 0.0503 1.3200x10⁵
GA-ITAE 1.8586 0.0024 30.2 525 1530 160 361.09 238.41 0.0470 1.1800x10⁵
GA-IAE 1.9072 0.0034 43.8 528 1610 150 408.08 261.23 0.0522 1.4300x10⁵
GA-ISE 2.0237 0.0034 37.5 536 1560 140 408.28 258.89 0.0518 1.4750x10⁵
ZN 2.2900 0.0046 63.7 486 2140 124 499.58 300.23 0.0600 2.3669x10⁵
ACO-ITAE 1.4852 0.0020 19.0 616 1230 210 374.53 245.52 0.0491 1.3270x10⁵
GA-ITAE 1.8586 0.0024 30.2 525 1530 160 361.09 238.41 0.0470 1.1800x10⁵
500 1000 1500 2000 2500 3000 3500 4000 4500 50000
0.2
0.4
0.6
0.8
1
1.2
1.4
1.6
1.8
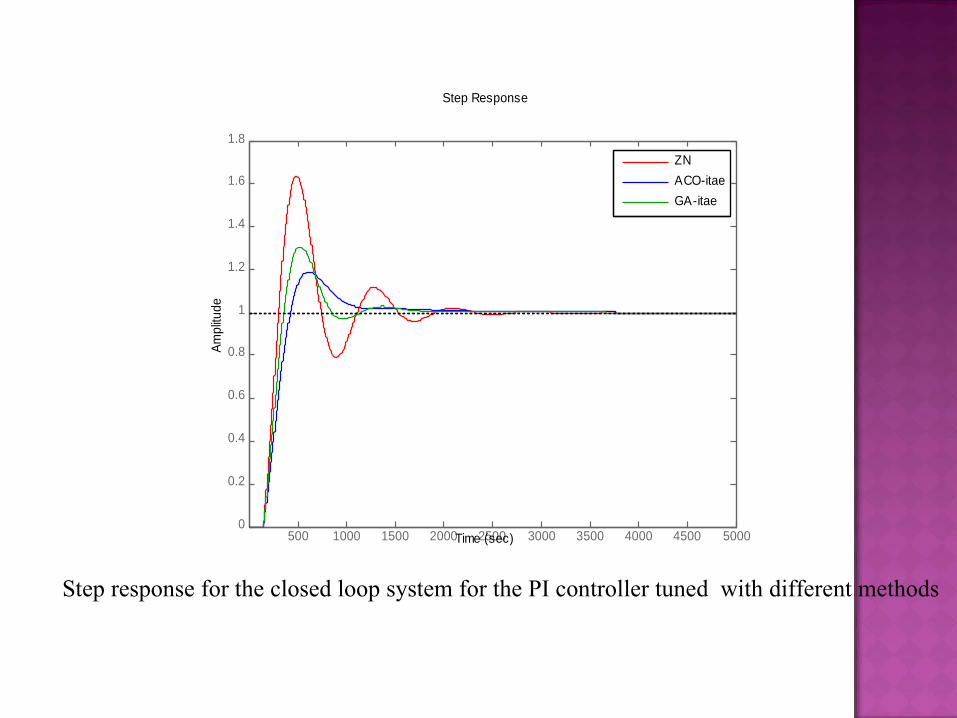
Step Response
Time (sec)
Am
plitu
de
ZN
ACO-itae
GA-itae
Step response for the closed loop system for the PI controller tuned with different methods
500 1000 1500 2000 2500 3000 3500 4000 4500 50000
0.2
0.4
0.6
0.8
1
1.2
1.4
Step Response
Time (sec)
Am
plitu
de
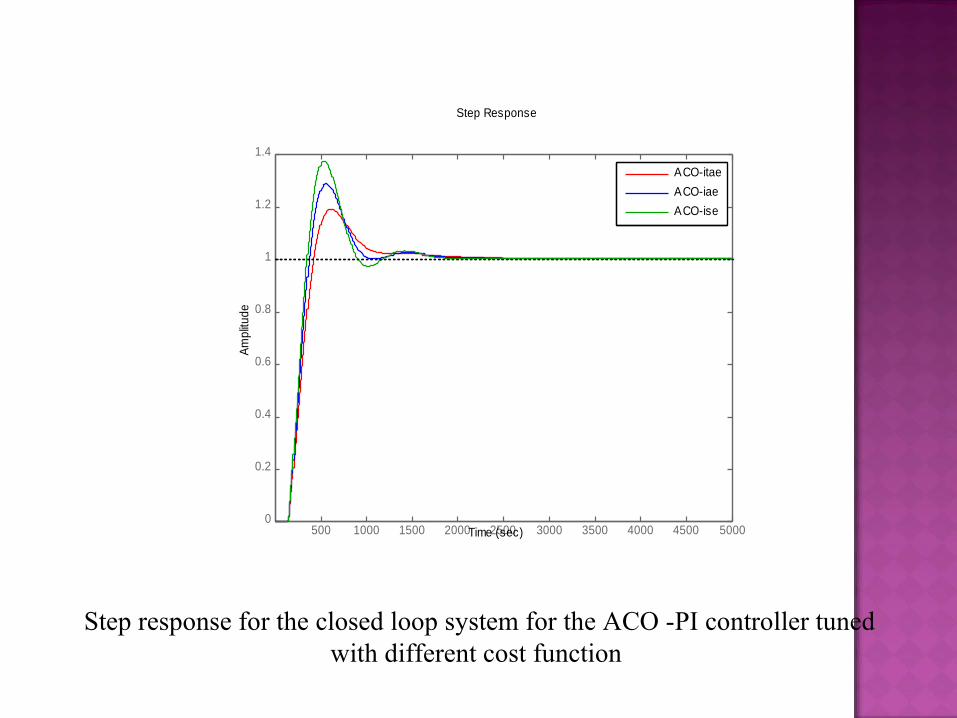
ACO-itae
ACO-iae
ACO-ise
Step response for the closed loop system for the ACO -PI controller tuned with different cost function
500 1000 1500 2000 2500 3000 3500 4000 4500 50000
0.5
1
1.5
Step Response
Time (sec)
Am
plitude
GA-itae
GA-iae
GA-ise
Step response for the closed loop system for the GA- PI controller tuned with different cost function
0 10 20 30 40 50 60 70 80 90 1001
2
3
4Kp,Ki distributions
Ki dis
trib
ution
0 10 20 30 40 50 60 70 80 90 1000
0.005
0.01
0.015
number of generation
Kp d
istrib
ution
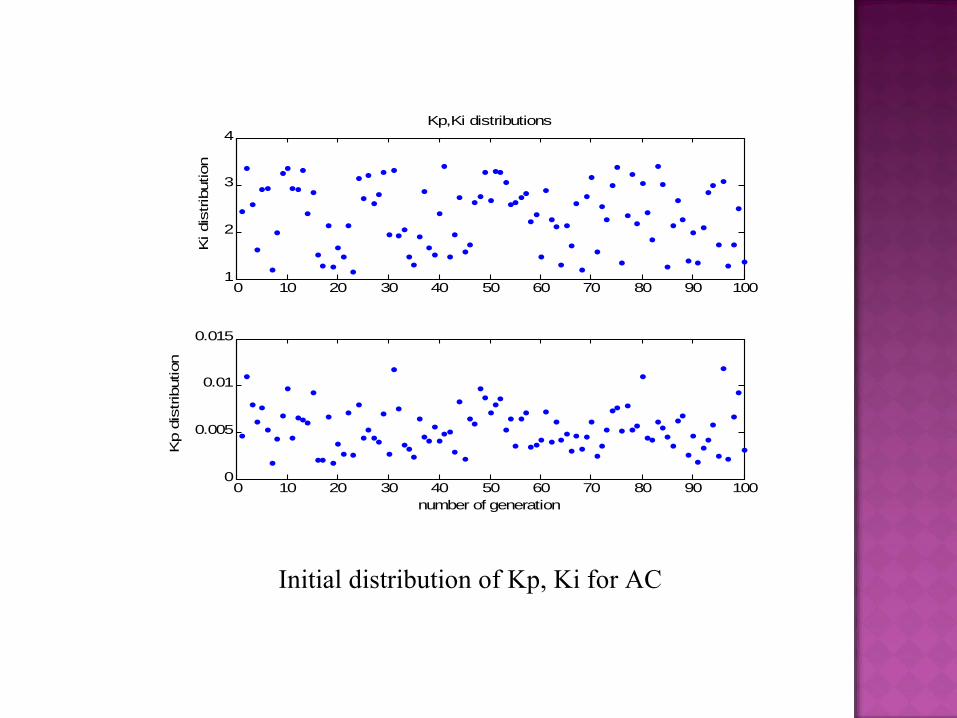
Initial distribution of Kp, Ki for AC
0 20 40 60 80 100 120
1.4
1.6
1.8
2Kp setteled
0 20 40 60 80 100 1202
2.5
3x 10
-3 Ki settelled
number of iterations
gain
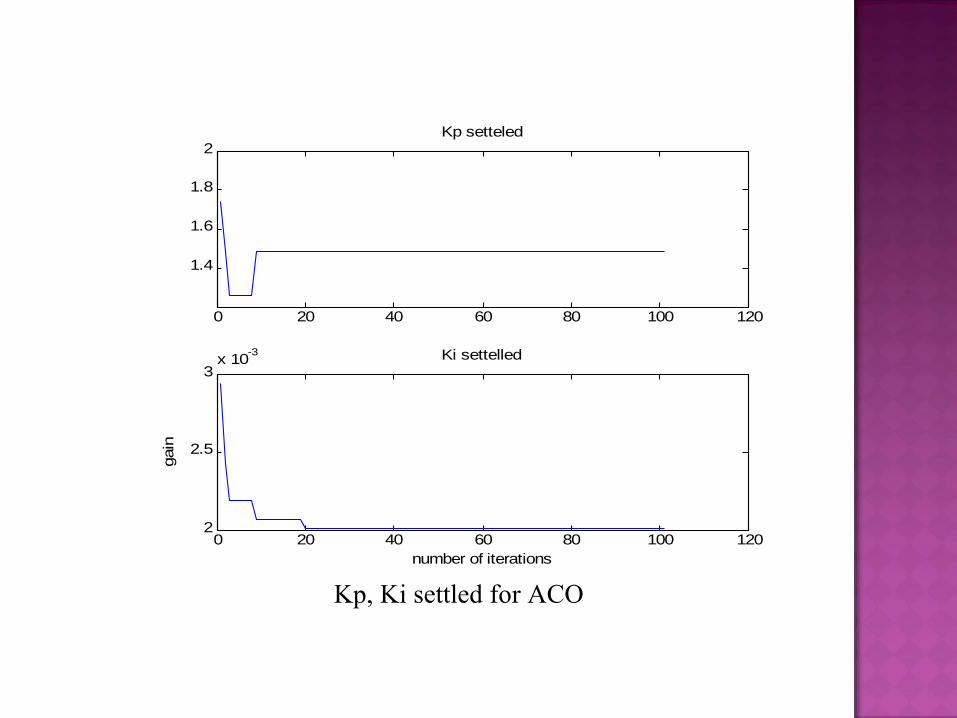
Kp, Ki settled for ACO
0 10 20 30 40 50 60 70 80 90 1000
2
4
6
8Kp Value
Gain
0 10 20 30 40 50 60 70 80 90 1000
0.2
0.4
0.6
0.8Ki Value
Generations
Gain
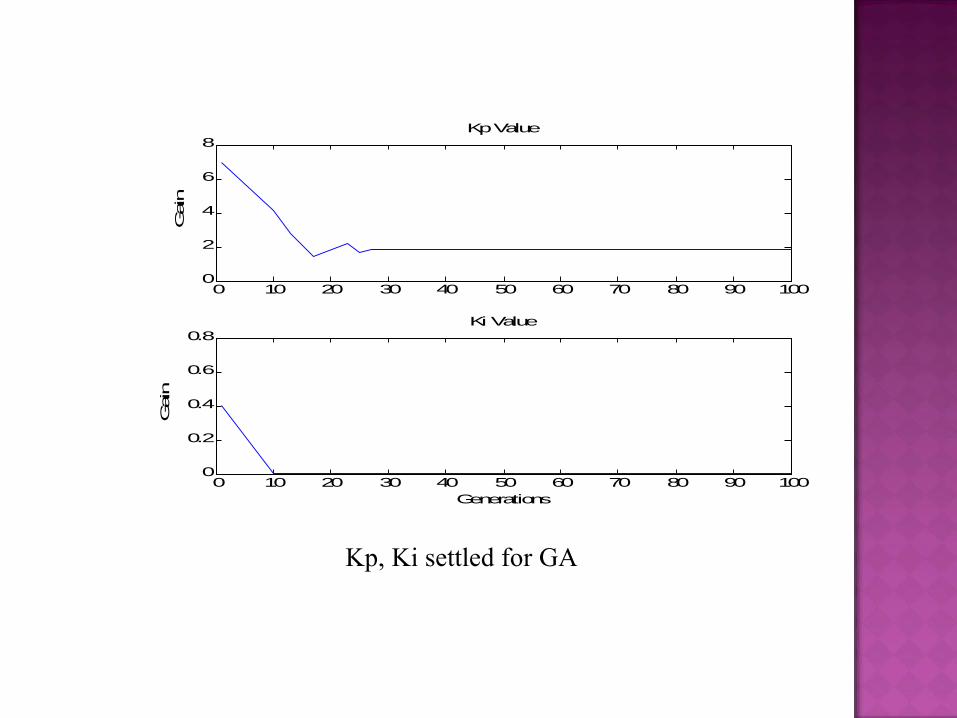
Kp, Ki settled for GA
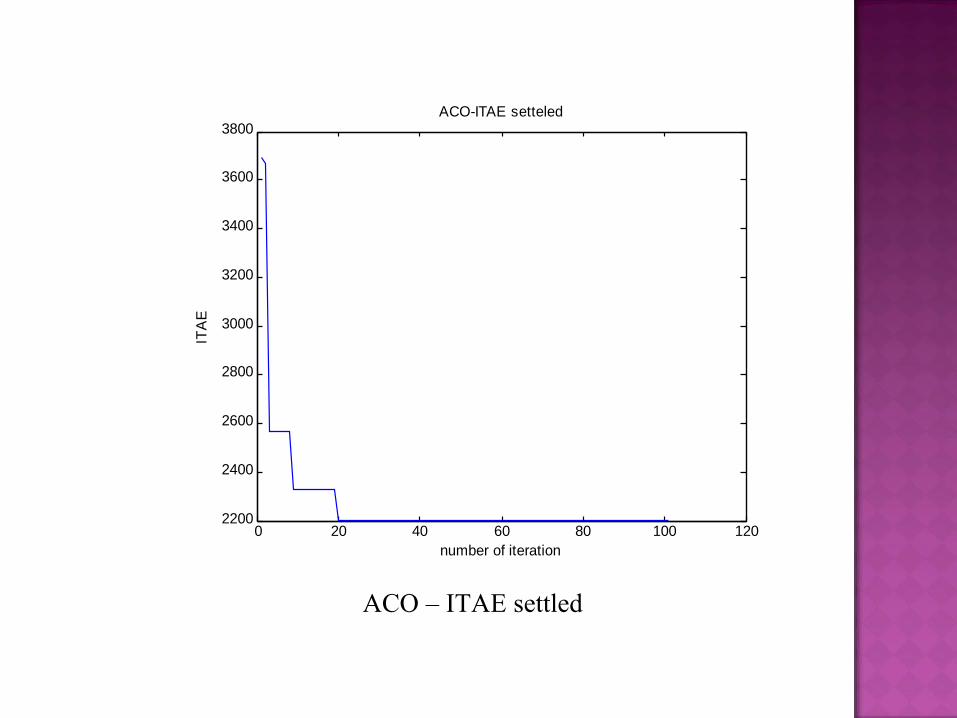
0 20 40 60 80 100 1202200
2400
2600
2800
3000
3200
3400
3600
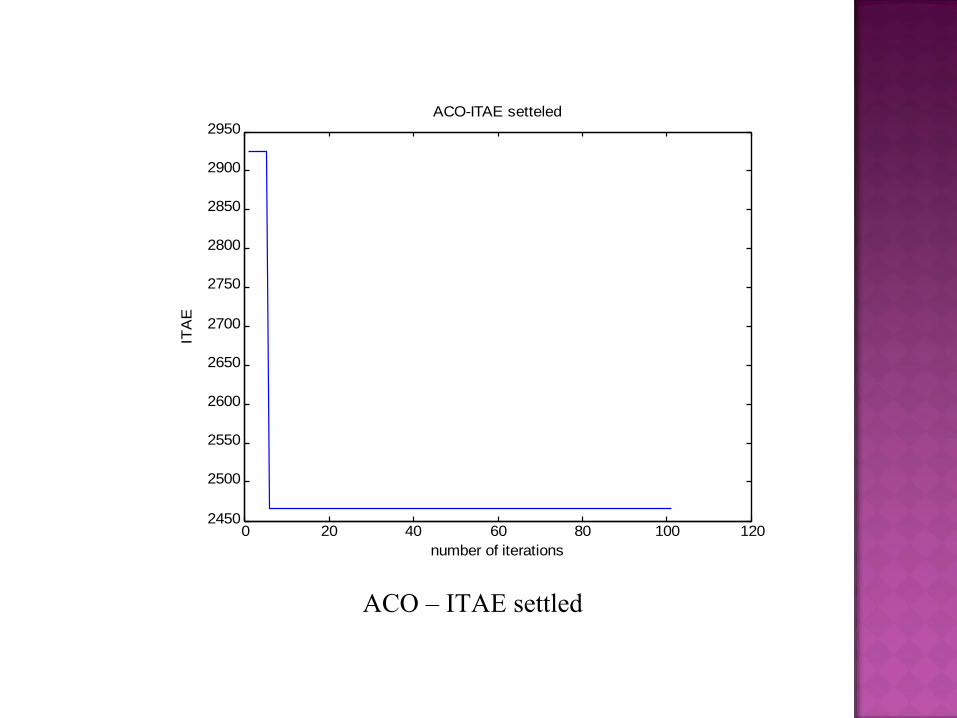
3800ACO-ITAE setteled
number of iteration
ITA
E
ACO – ITAE settled
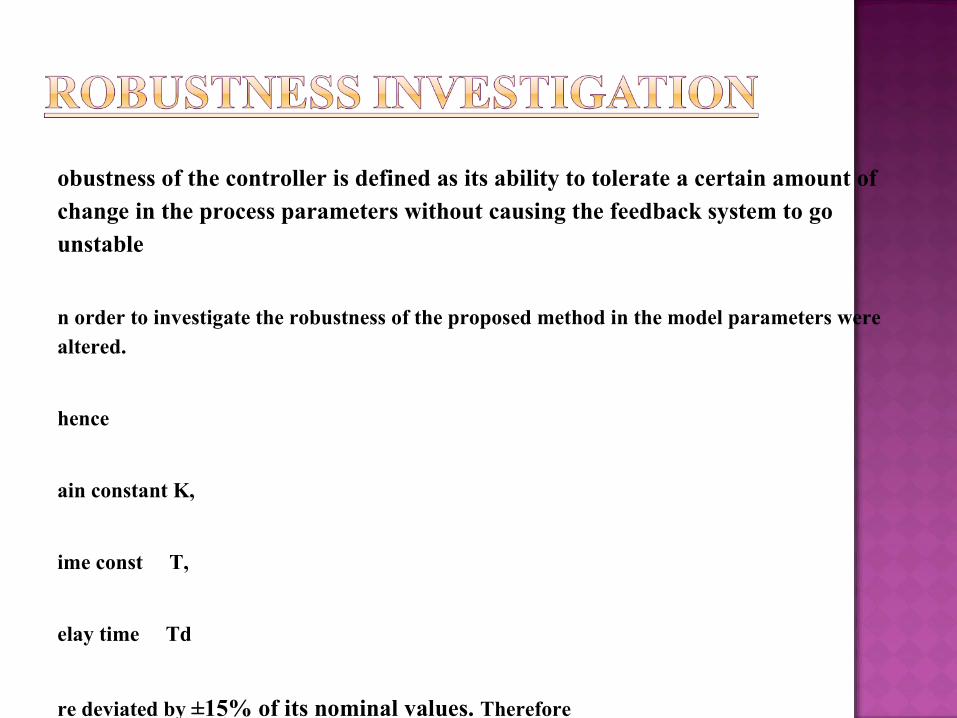
obustness of the controller is defined as its ability to tolerate a certain amount of change in the process parameters without causing the feedback system to go unstable
n order to investigate the robustness of the proposed method in the model parameters were altered.
hence
ain constant K,
ime const T,
elay time Td
re deviated by ±15% of its nominal values. Therefore
k is incremented by 15%
T is incremented by 15%
Td is reduced by 15% of
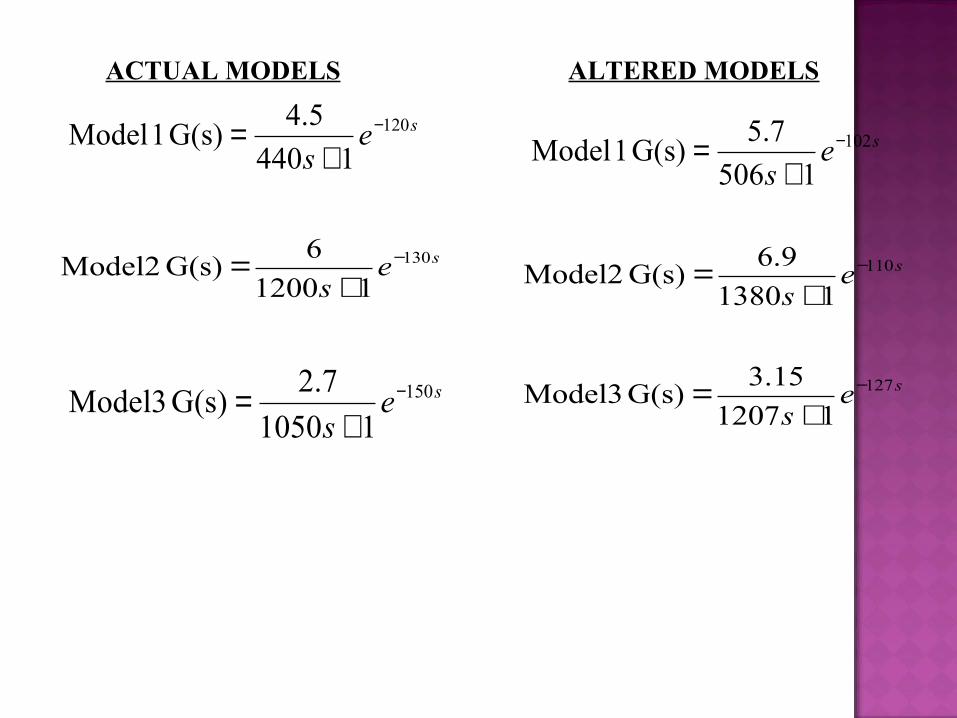
ses
120
1440
5.4G(s) 1 Model −
+=
ses
150
11050
7.2G(s) Model3 −
+=
ses
130
11200
6G(s) Model2 −
+=
ACTUAL MODELS
ses
102
1506
7.5G(s) 1 Model −
+=
ses
110
11380
9.6G(s) Model2 −
+=
ses
127
11207
15.3G(s) Model3 −
+=
ALTERED MODELS
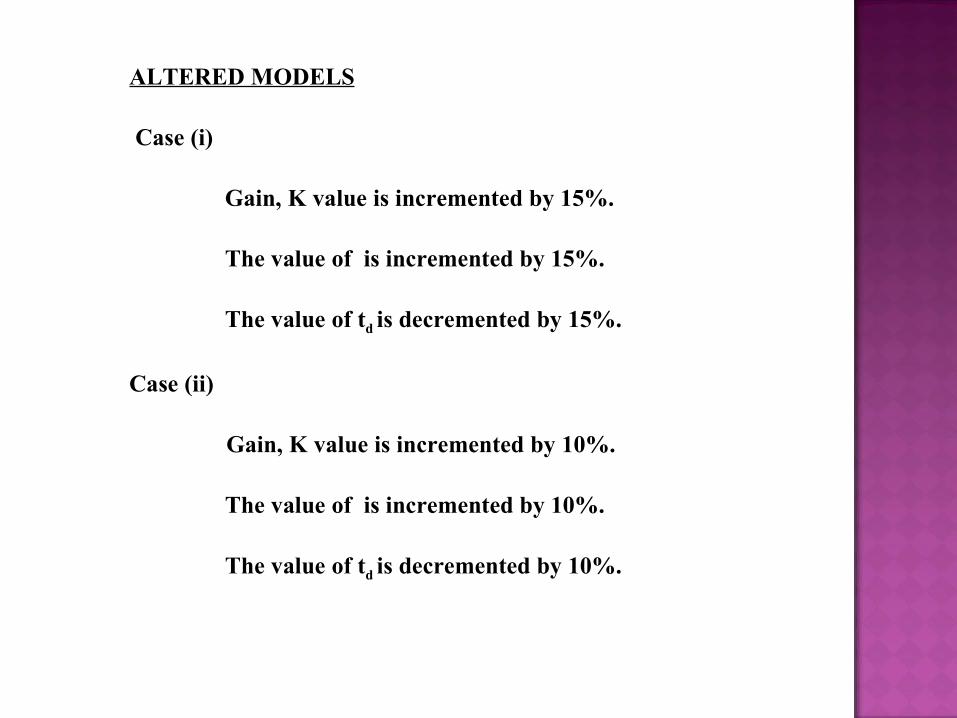
ALTERED MODELS
Case (i)
Gain, K value is incremented by 15%.
The value of is incremented by 15%.
The value of td is decremented by 15%.
Case (ii)
Gain, K value is incremented by 10%.
The value of is incremented by 10%.
The value of td is decremented by 10%.
Case (iii)
Gain, K value is incremented by 25%.and , td values no changes.
Case (iv)
Time constant is incremented by 25%.
and k, td values no changes.
Case (v)
Time delay td is incremented by 25%.
and k, values no changes.
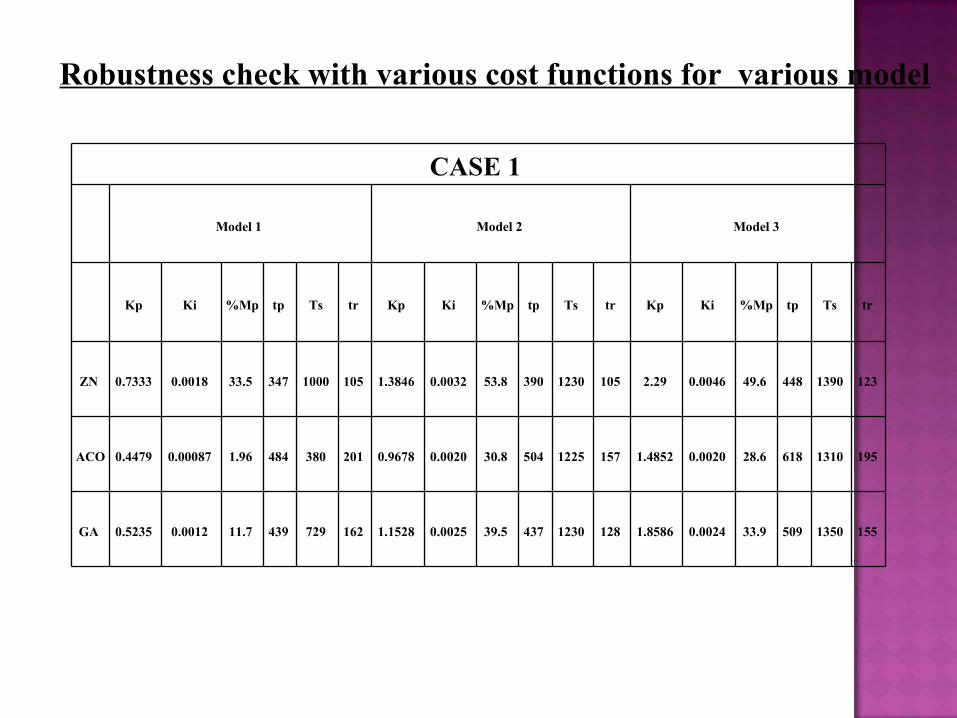
CASE 1
Model 1 Model 2 Model 3
Kp Ki %Mp tp Ts tr Kp Ki %Mp tp Ts tr Kp Ki %Mp tp Ts tr
ZN 0.7333 0.0018 33.5 347 1000 105 1.3846 0.0032 53.8 390 1230 105 2.29 0.0046 49.6 448 1390 123
ACO 0.4479 0.00087 1.96 484 380 201 0.9678 0.0020 30.8 504 1225 157 1.4852 0.0020 28.6 618 1310 195
GA 0.5235 0.0012 11.7 439 729 162 1.1528 0.0025 39.5 437 1230 128 1.8586 0.0024 33.9 509 1350 155
Robustness check with various cost functions for various model
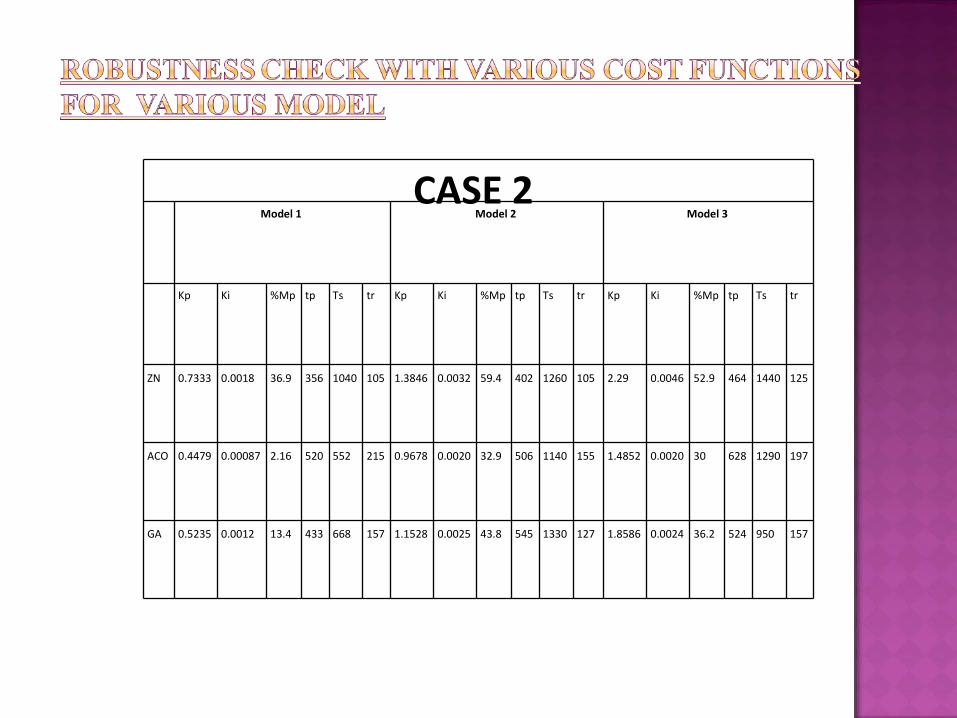
CASE 2 Model 1 Model 2 Model 3
Kp Ki %Mp tp Ts tr Kp Ki %Mp tp Ts tr Kp Ki %Mp tp Ts tr
ZN 0.7333 0.0018 36.9 356 1040 105 1.3846 0.0032 59.4 402 1260 105 2.29 0.0046 52.9 464 1440 125
ACO 0.4479 0.00087 2.16 520 552 215 0.9678 0.0020 32.9 506 1140 155 1.4852 0.0020 30 628 1290 197
GA 0.5235 0.0012 13.4 433 668 157 1.1528 0.0025 43.8 545 1330 127 1.8586 0.0024 36.2 524 950 157
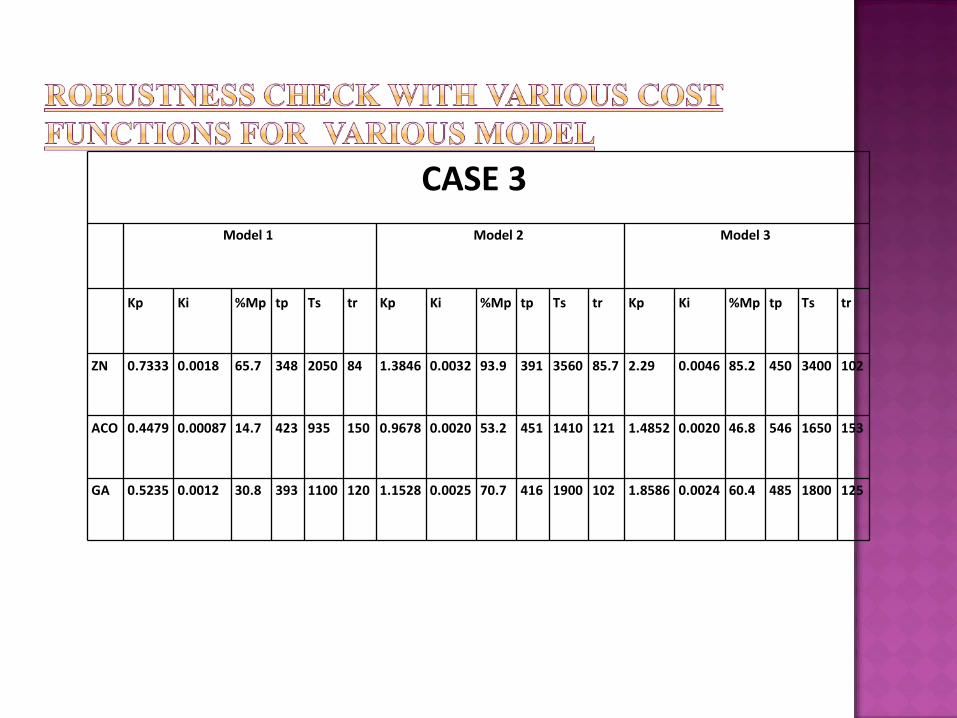
CASE 3 Model 1 Model 2 Model 3
Kp Ki %Mp tp Ts tr Kp Ki %Mp tp Ts tr Kp Ki %Mp tp Ts tr
ZN 0.7333 0.0018 65.7 348 2050 84 1.3846 0.0032 93.9 391 3560 85.7 2.29 0.0046 85.2 450 3400 102
ACO 0.4479 0.00087 14.7 423 935 150 0.9678 0.0020 53.2 451 1410 121 1.4852 0.0020 46.8 546 1650 153
GA 0.5235 0.0012 30.8 393 1100 120 1.1528 0.0025 70.7 416 1900 102 1.8586 0.0024 60.4 485 1800 125
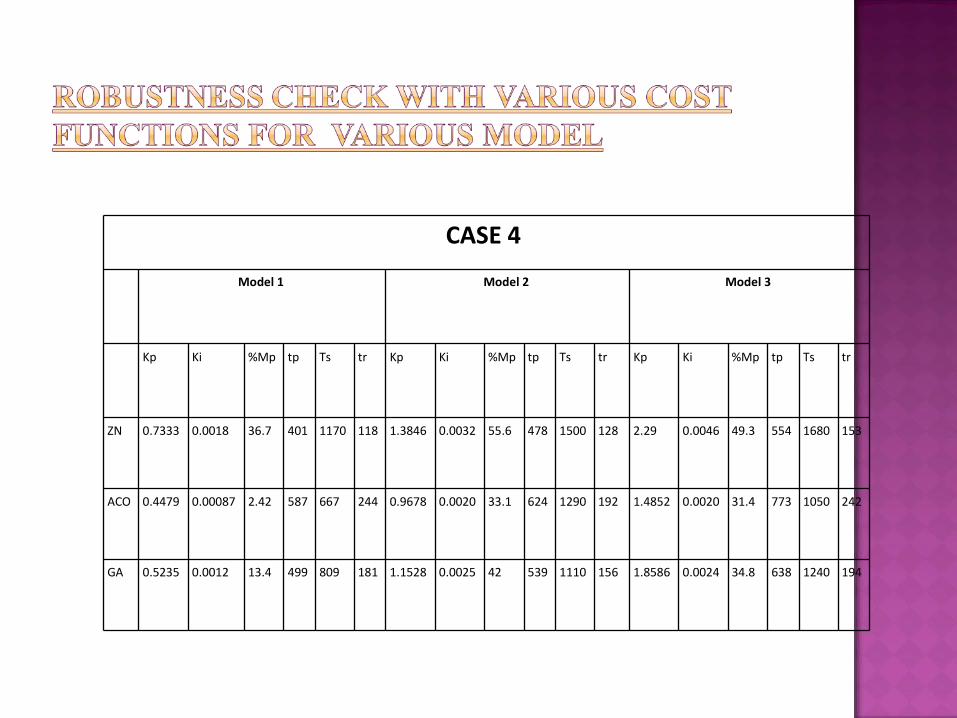
CASE 4
Model 1 Model 2 Model 3
Kp Ki %Mp tp Ts tr Kp Ki %Mp tp Ts tr Kp Ki %Mp tp Ts tr
ZN 0.7333 0.0018 36.7 401 1170 118 1.3846 0.0032 55.6 478 1500 128 2.29 0.0046 49.3 554 1680 153
ACO 0.4479 0.00087 2.42 587 667 244 0.9678 0.0020 33.1 624 1290 192 1.4852 0.0020 31.4 773 1050 242
GA 0.5235 0.0012 13.4 499 809 181 1.1528 0.0025 42 539 1110 156 1.8586 0.0024 34.8 638 1240 194
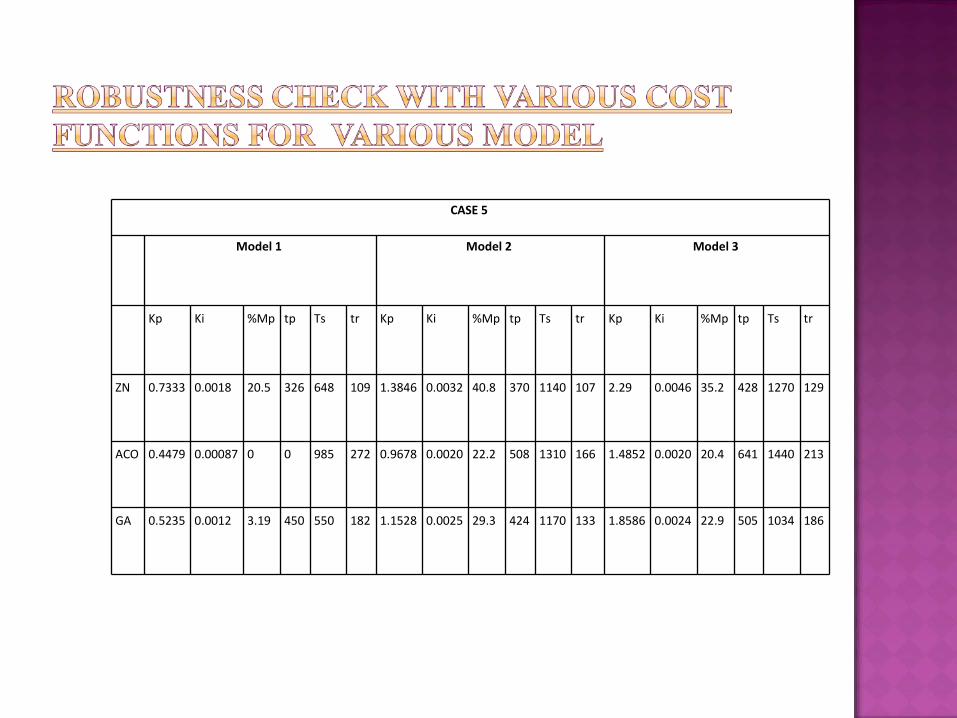
CASE 5
Model 1 Model 2 Model 3
Kp Ki %Mp tp Ts tr Kp Ki %Mp tp Ts tr Kp Ki %Mp tp Ts tr
ZN 0.7333 0.0018 20.5 326 648 109 1.3846 0.0032 40.8 370 1140 107 2.29 0.0046 35.2 428 1270 129
ACO 0.4479 0.00087 0 0 985 272 0.9678 0.0020 22.2 508 1310 166 1.4852 0.0020 20.4 641 1440 213
GA 0.5235 0.0012 3.19 450 550 182 1.1528 0.0025 29.3 424 1170 133 1.8586 0.0024 22.9 505 1034 186
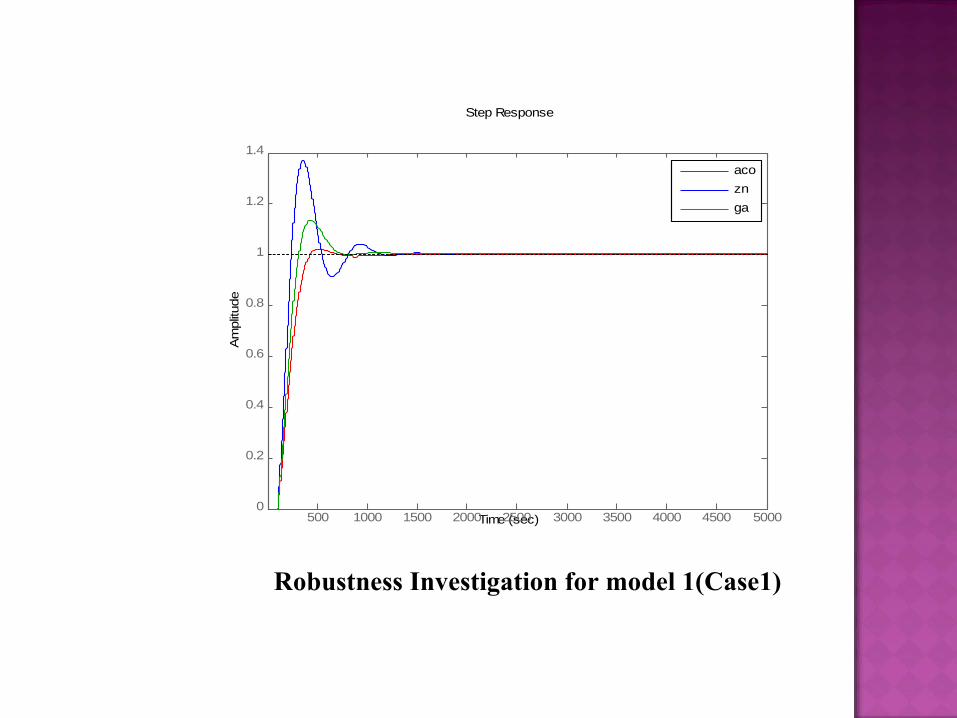
Step Response
Time (sec)
Am
plitu
de
500 1000 1500 2000 2500 3000 3500 4000 4500 50000
0.2
0.4
0.6
0.8
1
1.2
1.4
aco
zn
ga
Robustness Investigation for model 1(Case1)
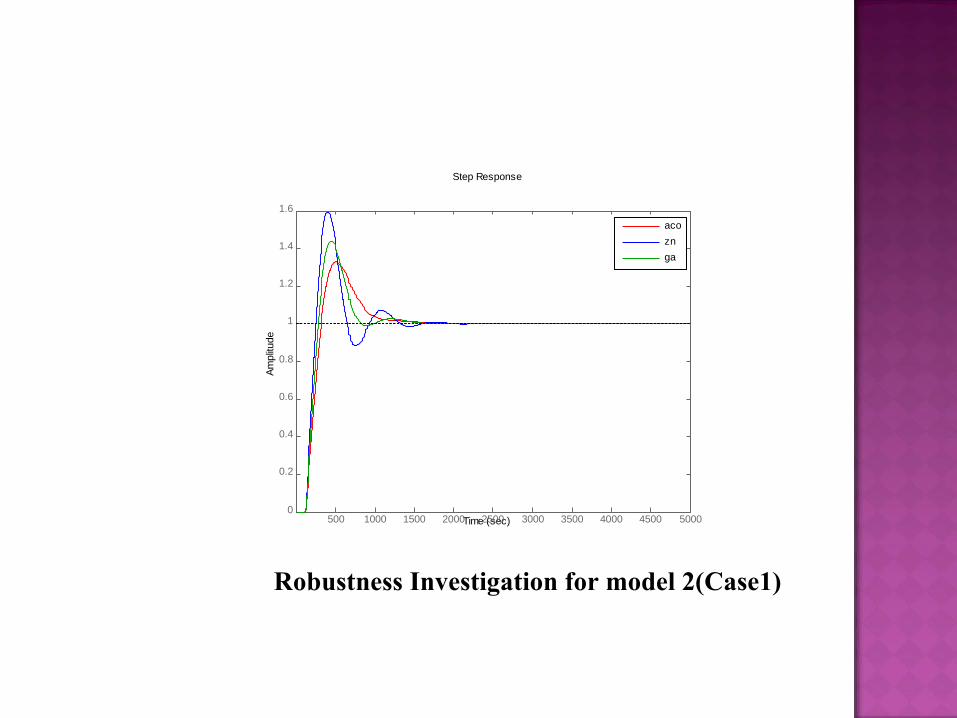
Step Response
Time (sec)
Am
plitu
de
500 1000 1500 2000 2500 3000 3500 4000 4500 50000
0.2
0.4
0.6
0.8
1
1.2
1.4
1.6
aco
zn
ga
Robustness Investigation for model 2(Case1)
Step Response
Time (sec)
Am
plitu
de
500 1000 1500 2000 2500 3000 3500 4000 4500 50000
0.2
0.4
0.6
0.8
1
1.2
1.4
1.6
aco
zn
ga
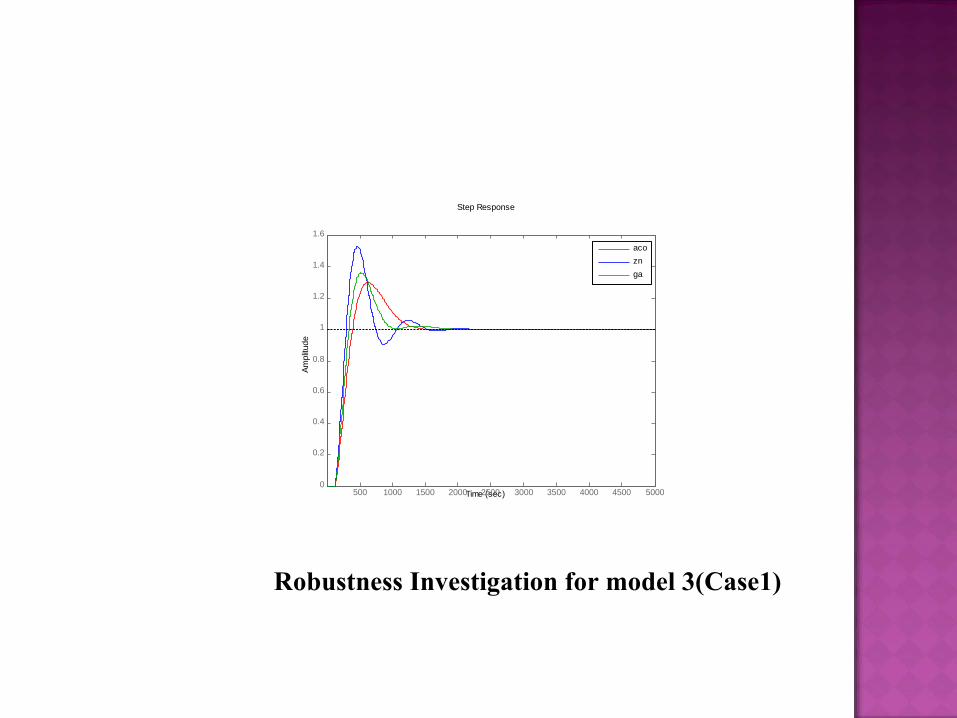
Robustness Investigation for model 3(Case1)
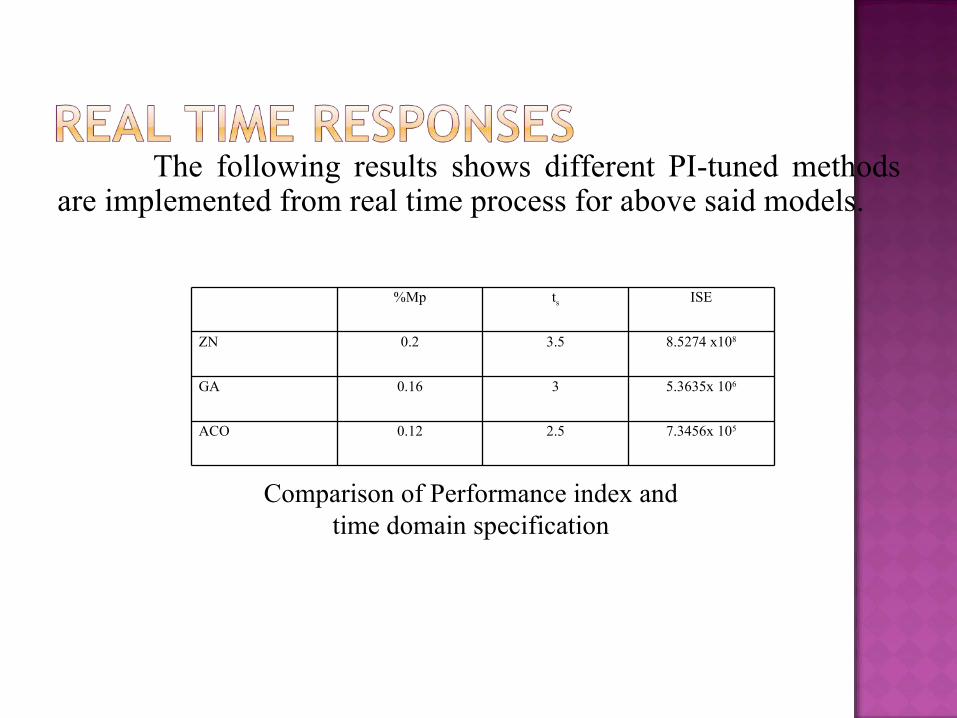
The following results shows different PI-tuned methods are implemented from real time process for above said models.
%Mp ts ISE
ZN 0.2 3.5 8.5274 x10⁸
GA 0.16 3 5.3635x 10⁶
ACO 0.12 2.5 7.3456x 10⁵
Comparison of Performance index and time domain specification
0 1 2 3 4 5 6 7 8
x 1 05
0
1 0
2 0
3 0
4 0
5 0
6 0
7 0
t im e
ampli
tude
A C O
G AZN
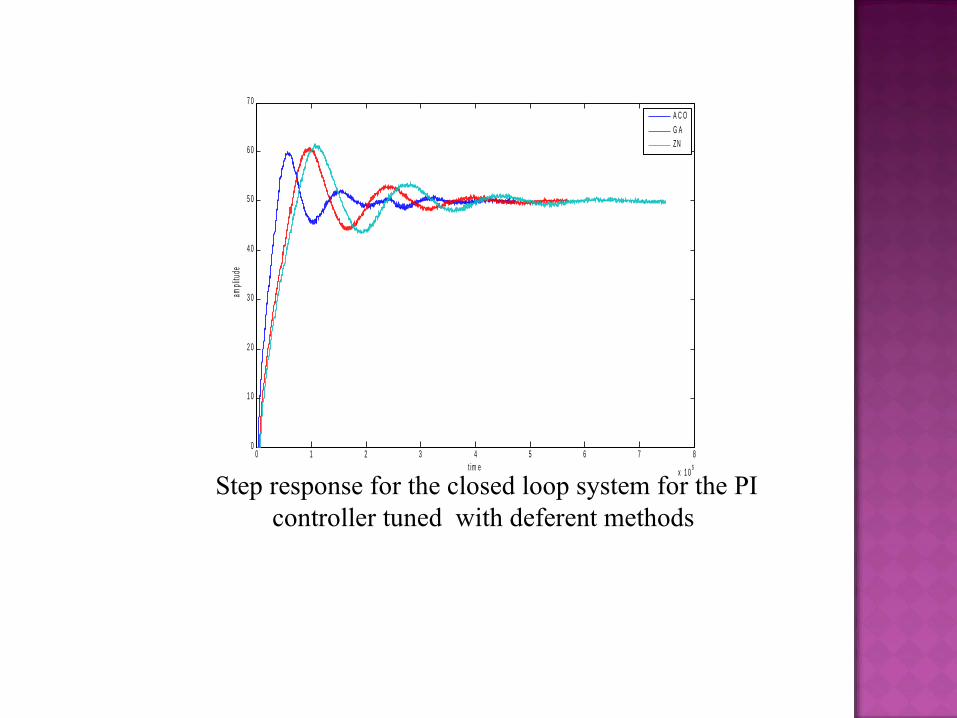
Step response for the closed loop system for the PI controller tuned with deferent methods
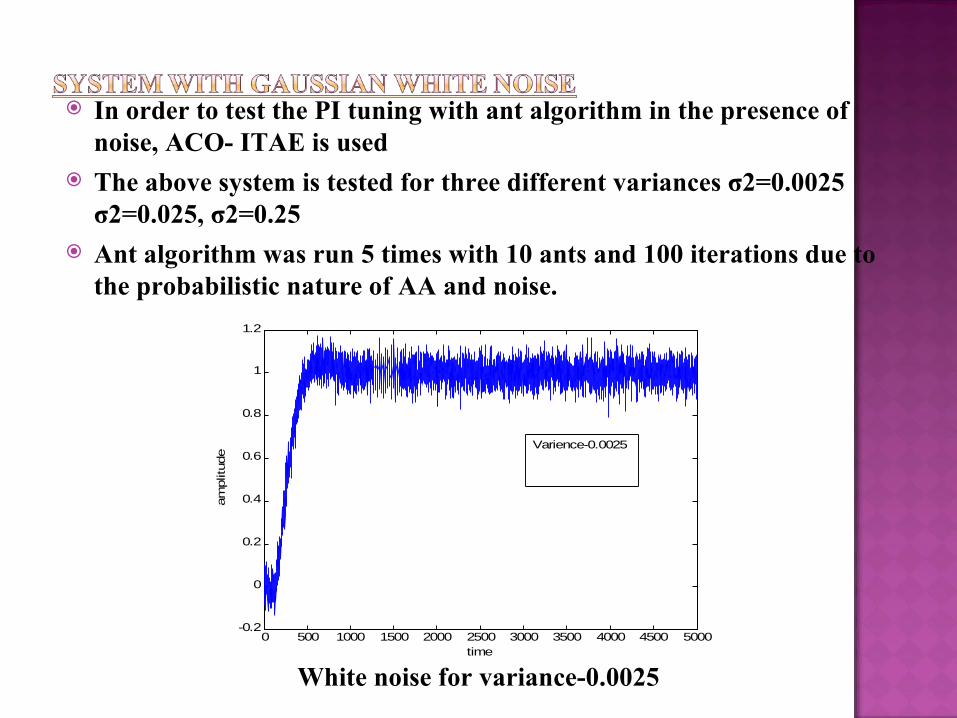
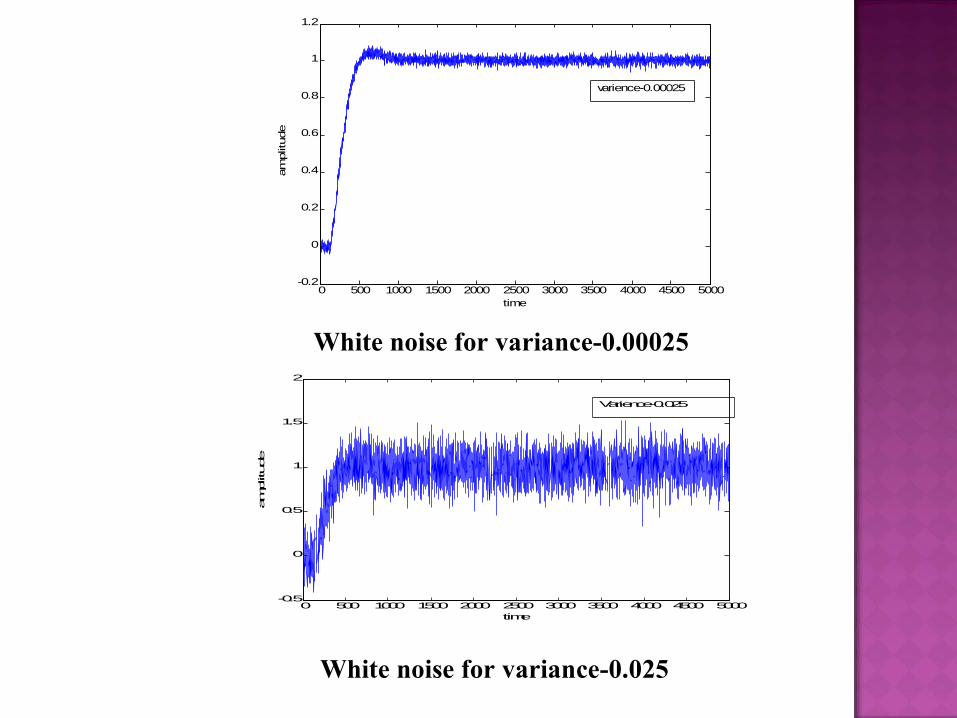
In order to test the PI tuning with ant algorithm in the presence of noise, ACO- ITAE is used
The above system is tested for three different variances σ2=0.0025 σ2=0.025, σ2=0.25
Ant algorithm was run 5 times with 10 ants and 100 iterations due to the probabilistic nature of AA and noise.
0 500 1000 1500 2000 2500 3000 3500 4000 4500 5000-0.2
0
0.2
0.4
0.6
0.8
1
1.2
time
am
plit
ude
Varience-0.0025
White noise for variance-0.0025
0 500 1000 1500 2000 2500 3000 3500 4000 4500 5000-0.2
0
0.2
0.4
0.6
0.8
1
1.2
time
am
plit
ude
varience-0.00025
0 500 1000 1500 2000 2500 3000 3500 4000 4500 5000-0.5
0
0.5
1
1.5
2
time
am
plitude
Varience-0.025
White noise for variance-0.025
White noise for variance-0.00025
In phase 2 of this project work, the conventional PI controller was tuned by Z-N tuning method and compared with proposed GA and ACO methods.
Then it is implemented to the first order with dead time process. Then simulation studies are carried out to analyze the performance of the spherical tank process and Robustness of above mentioned controller for the different set points.
It is also implemented in real time for the real time results of GA, ACO, ZN same set points. The result of both simulation and real time process were compared.
From the output response obtained using ACO tuned PI controller gives less over shoot, fastest settling time, fastest rise time then the other techniques.
Time domain specification and performance indices were tabulated for the above said models.
Ying- Tung Haiao, (2004) Ant colony optimization for Designing of PID controller, IEEE, internation symposium on computer Aided control system aided control systems design Taipei, Taiwan, September 2-4, 2004.
s S. Nithya, Abhay Singh Gour, N. Sivakumaran, T.K. Radhakrishnan and N. Anantharaman, Model Based controller Design for shell and Tube heat exchanger, sensors and Transducers Journal, Vol.84, Issue 10, October 2007, pp.1677-1686.
, Sigurd Skogestasd, Simple analytic rules for model reduction ad PID controller tuning, Journal of process control, 13,2003, pp.291-309.
g P. Wang and D.P Kwok, “Optimal design of PID process controllers based on genetic algorithms” control Engineer practices Vol.2,no.4, pp.641-648, 1994.

Thank you
Related Documents