
Welcome message from author
This document is posted to help you gain knowledge. Please leave a comment to let me know what you think about it! Share it to your friends and learn new things together.
Transcript


Keeping it Simple
• Simple
• Accessible
• Long-term Change
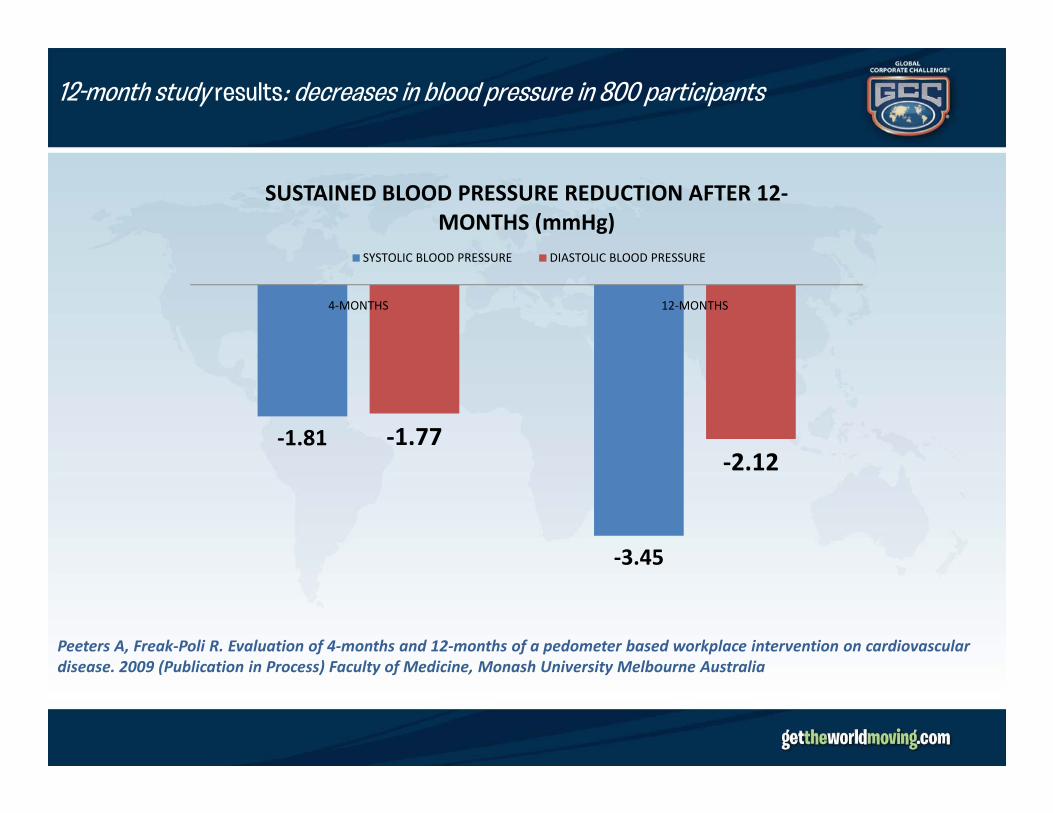
4-MONTHS 12-MONTHS
SUSTAINED BLOOD PRESSURE REDUCTION AFTER 12-
MONTHS (mmHg)
SYSTOLIC BLOOD PRESSURE DIASTOLIC BLOOD PRESSURE
12-month study results: decreases in blood pressure in 800 participants
-1.81
-3.45
-1.77-2.12
Peeters A, Freak-Poli R. Evaluation of 4-months and 12-months of a pedometer based workplace intervention on cardiovascular
disease. 2009 (Publication in Process) Faculty of Medicine, Monash University Melbourne Australia

12-month study results: decreases in weight & waist circumference
-0.70
-0.50
4-months 12-months
12-months sustained decreases in body weight and
waist circumference
WEIGHT (kg) WAIST (cm)
Peeters A, Freak-Poli R. Evaluation of 4-months and 12-months of a pedometer based workplace intervention on
cardiovascular disease. 2009 (Publication in Process) Faculty of Medicine, Monash University Melbourne Australia
-2.31
-1.02
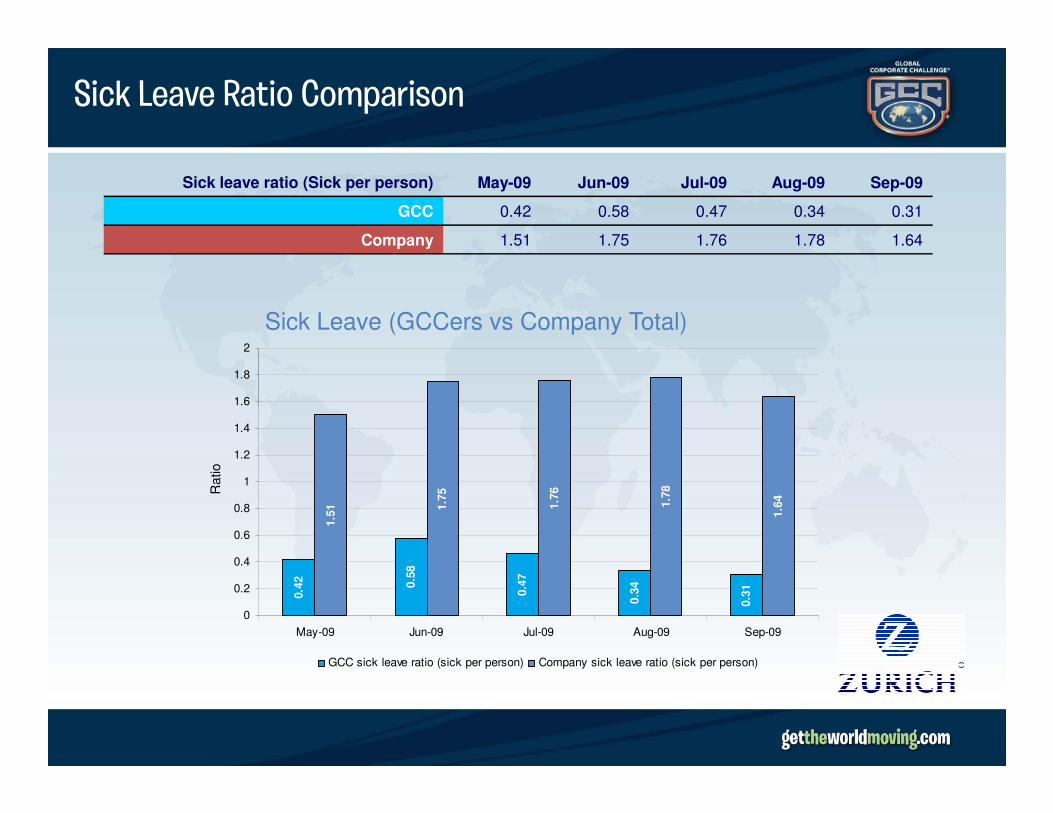
Sick Leave Ratio Comparison
Sick leave ratio (Sick per person) May-09 Jun-09 Jul-09 Aug-09 Sep-09
GCC 0.42 0.58 0.47 0.34 0.31
Company 1.51 1.75 1.76 1.78 1.64
1.6
1.8
2
Sick Leave (GCCers vs Company Total)0.4
2 0.5
8
0.4
7
0.3
4
0.3
1
1.5
1 1.7
5
1.7
6
1.7
8
1.6
4
0
0.2
0.4
0.6
0.8
1
1.2
1.4
1.6
May-09 Jun-09 Jul-09 Aug-09 Sep-09
GCC sick leave ratio (sick per person) Company sick leave ratio (sick per person)
Ratio

2009 Global Corporate Challenge
• 60,000 Employees
• 8,500 Teams
• 1000 Global Companies• 1000 Global Companies
• 55 Countries
•168 DET Participants

Overall GCC Performance
BASELINE GLOBAL STEP COUNTS:
800-2500 steps/day
34 calories/ 0.5km
-equivalent energy to ½ a small apple?
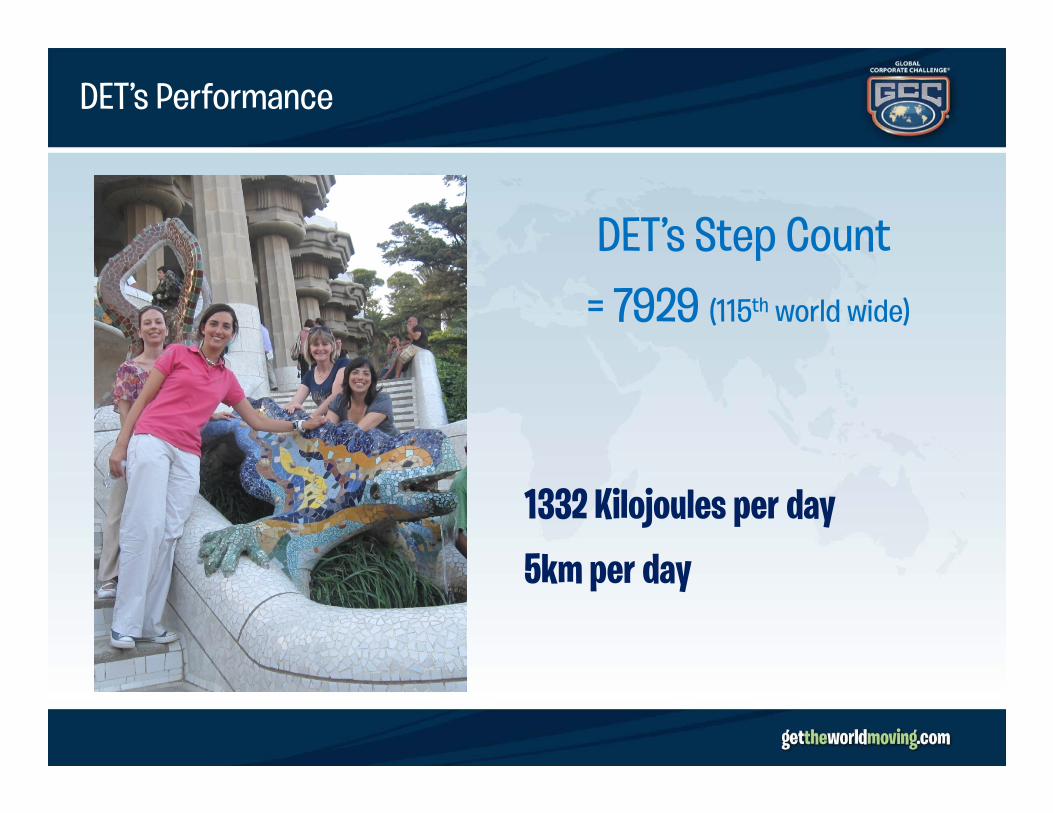
DET’s Performance
DET’s Step Count
= 7929 (115th world wide)
1332 Kilojoules per day
5km per day
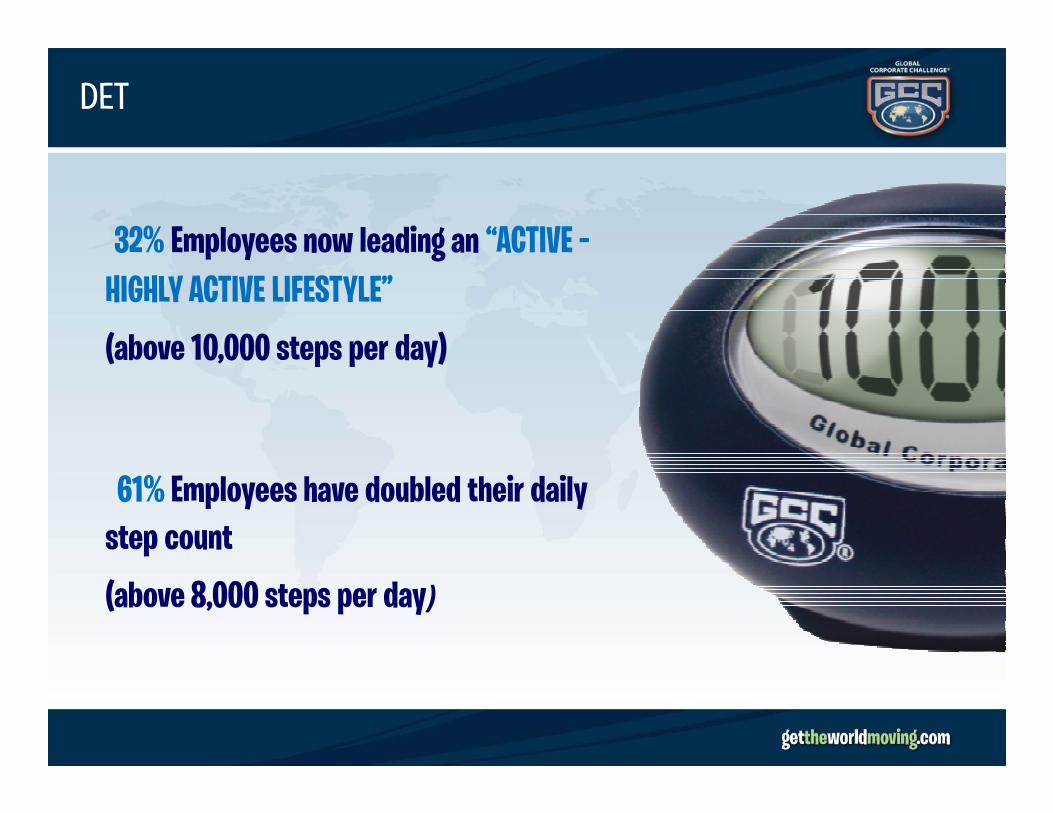
32% Employees now leading an “ACTIVE –
HIGHLY ACTIVE LIFESTYLE”
(above 10,000 steps per day)
DET
61% Employees have doubled their daily
step count
(above 8,000 steps per day)

Impact on DET‘s health
Health Benefits:
62% reported an increase in energy
66% reported an increase in fitness66% reported an increase in fitness
36% reported a loss in weight
Average GCC reported weight loss = 4.7kg

DET‘s Step Counts
Ranking Team Name Step Average Total KM’s
1Dungeon Dwelling Dynamos 13385 7495.848
2Travelling DETberries 11879 6652.424
3Highway To Hellth 11451 6412.782
4Wide World Walkers again! 11103 6217.855
5Humanities Go Getters 10147 5682.564
66Wii Phit 9778 5475.895
7HR Puf N Stuf'd 9500 5320.044
8The StepAlots 9356 5239.638
9The Proclaimers 9308 5212.843
10Chocoholics / T&H 8779 4916.31

Congratulations !!!
115th place out of 1,000 Global 1,000 Global companies

Starts on the 20th of May.
Ends on the 7th of September.
GCC In 2010
Ends on the 7th of September.

One Big Addition in 2010

Related Documents


![Procedure: 4.5.2p4. Annual, Sick, and Personal Leave · 2017-02-03 · 1 Procedure: 4.5.2p4. [III.U.6.d.] Annual, Sick, and Personal Leave [Previously titled Accrued Leave] Revised:](https://static.cupdf.com/doc/110x72/5f3405a2dc90684072672c41/procedure-452p4-annual-sick-and-personal-leave-2017-02-03-1-procedure-452p4.jpg)

