Shriram Transport Finance Company Ltd Investor Update – Q1 FY2020 Just another milestone in our growth journey July 24, 2019

Welcome message from author
This document is posted to help you gain knowledge. Please leave a comment to let me know what you think about it! Share it to your friends and learn new things together.
Transcript

Shriram Transport Finance Company Ltd Investor Update – Q1 FY2020
Just another milestone in our growth journey
July 24, 2019
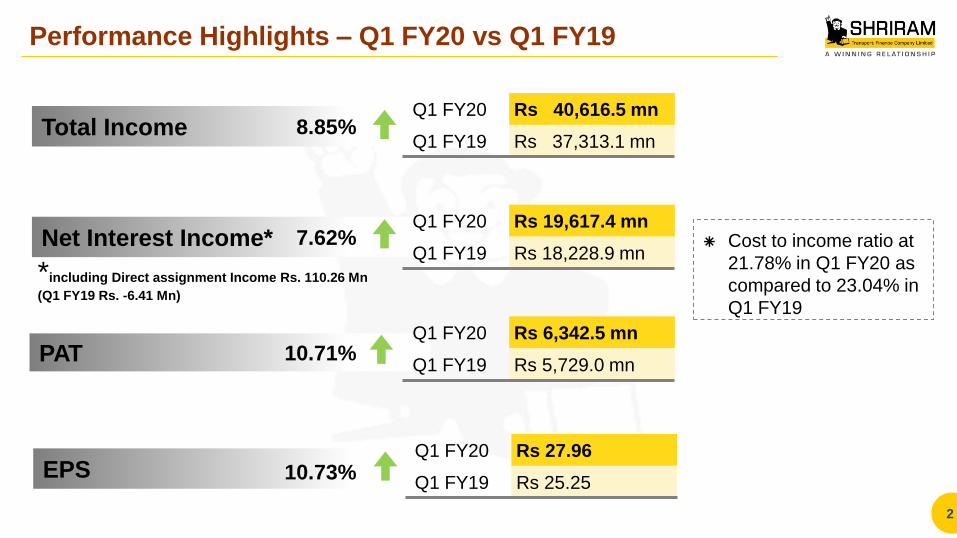
EPS
Performance Highlights – Q1 FY20 vs Q1 FY19
2
Total Income
Net Interest Income*
PAT
*including Direct assignment Income Rs. 110.26 Mn
(Q1 FY19 Rs. -6.41 Mn)
8.85%
7.62%
10.71%
10.73%
Q1 FY20 Rs 40,616.5 mn
Q1 FY19 Rs 37,313.1 mn
Q1 FY20 Rs 27.96
Q1 FY19 Rs 25.25
Q1 FY20 Rs 19,617.4 mn
Q1 FY19 Rs 18,228.9 mn
Q1 FY20 Rs 6,342.5 mn
Q1 FY19 Rs 5,729.0 mn
Cost to income ratio at
21.78% in Q1 FY20 as
compared to 23.04% in
Q1 FY19
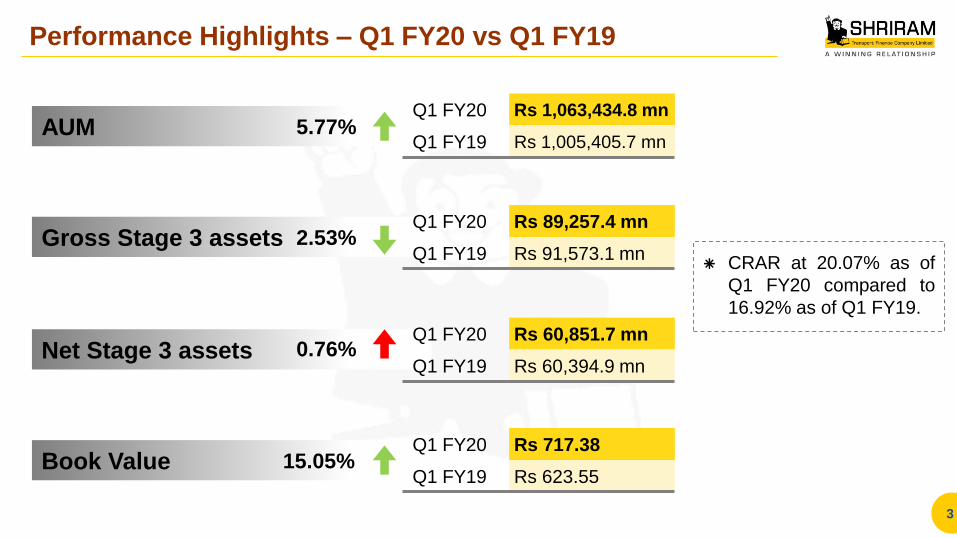
Performance Highlights – Q1 FY20 vs Q1 FY19
3
AUM
Gross Stage 3 assets
Net Stage 3 assets
Book Value
5.77%
2.53%
0.76%
15.05%
Q1 FY20 Rs 1,063,434.8 mn
Q1 FY19 Rs 1,005,405.7 mn
Q1 FY20 Rs 717.38
Q1 FY19 Rs 623.55
Q1 FY20 Rs 89,257.4 mn
Q1 FY19 Rs 91,573.1 mn
Q1 FY20 Rs 60,851.7 mn
Q1 FY19 Rs 60,394.9 mn
CRAR at 20.07% as of
Q1 FY20 compared to
16.92% as of Q1 FY19.
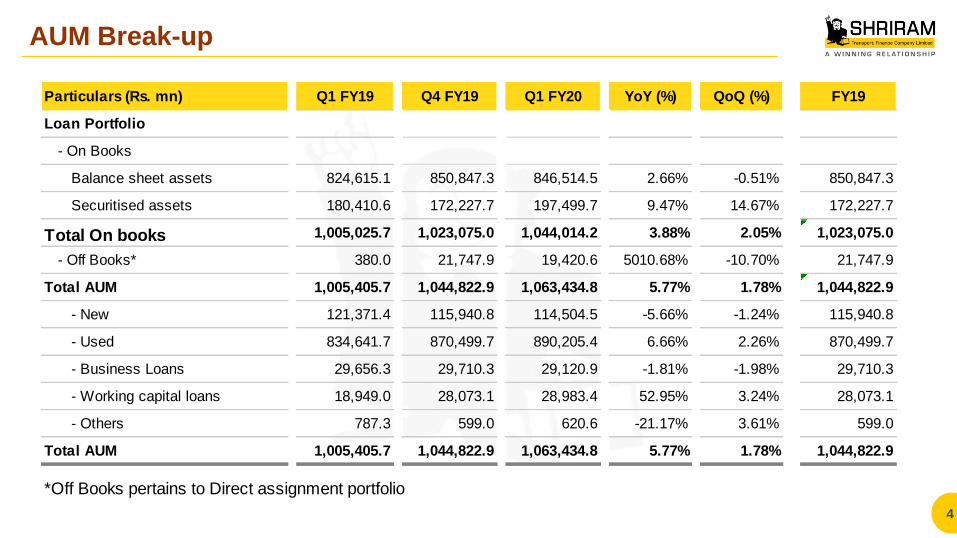
AUM Break-up
4
Particulars (Rs. mn) Q1 FY19 Q4 FY19 Q1 FY20 YoY (%) QoQ (%) FY19
Loan Portfolio
- On Books
Balance sheet assets 824,615.1 850,847.3 846,514.5 2.66% -0.51% 850,847.3
Securitised assets 180,410.6 172,227.7 197,499.7 9.47% 14.67% 172,227.7
Total On books 1,005,025.7 1,023,075.0 1,044,014.2 3.88% 2.05% 1,023,075.0
- Off Books* 380.0 21,747.9 19,420.6 5010.68% -10.70% 21,747.9
Total AUM 1,005,405.7 1,044,822.9 1,063,434.8 5.77% 1.78% 1,044,822.9
- New 121,371.4 115,940.8 114,504.5 -5.66% -1.24% 115,940.8
- Used 834,641.7 870,499.7 890,205.4 6.66% 2.26% 870,499.7
- Business Loans 29,656.3 29,710.3 29,120.9 -1.81% -1.98% 29,710.3
- Working capital loans 18,949.0 28,073.1 28,983.4 52.95% 3.24% 28,073.1
- Others 787.3 599.0 620.6 -21.17% 3.61% 599.0
Total AUM 1,005,405.7 1,044,822.9 1,063,434.8 5.77% 1.78% 1,044,822.9
*Off Books pertains to Direct assignment portfolio
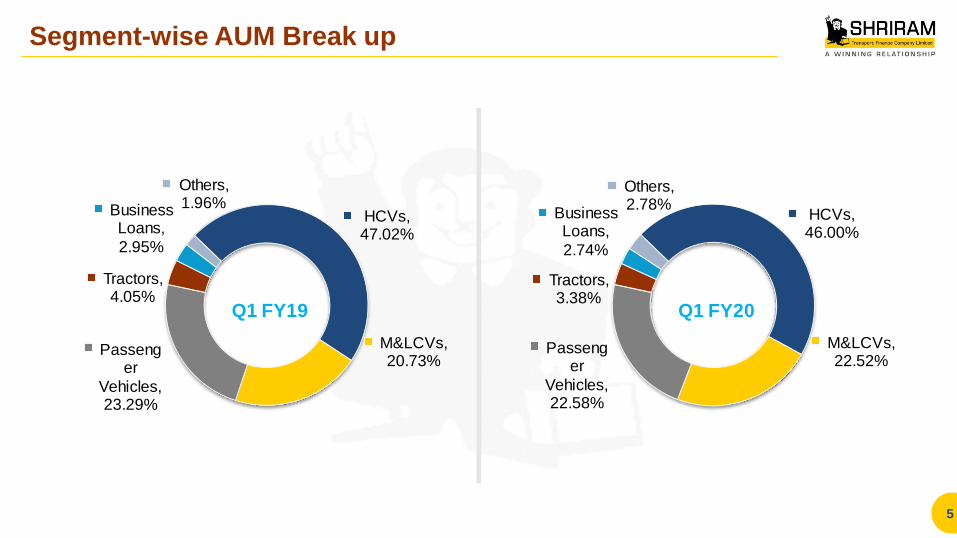
Segment-wise AUM Break up
5
HCVs, 46.00%
M&LCVs, 22.52%
Passenger
Vehicles, 22.58%
Tractors, 3.38%
Business Loans,
2.74%
Others, 2.78%
Q1 FY20
HCVs, 47.02%
M&LCVs, 20.73%
Passenger
Vehicles, 23.29%
Tractors, 4.05%
Business Loans,
2.95%
Others, 1.96%
Q1 FY19
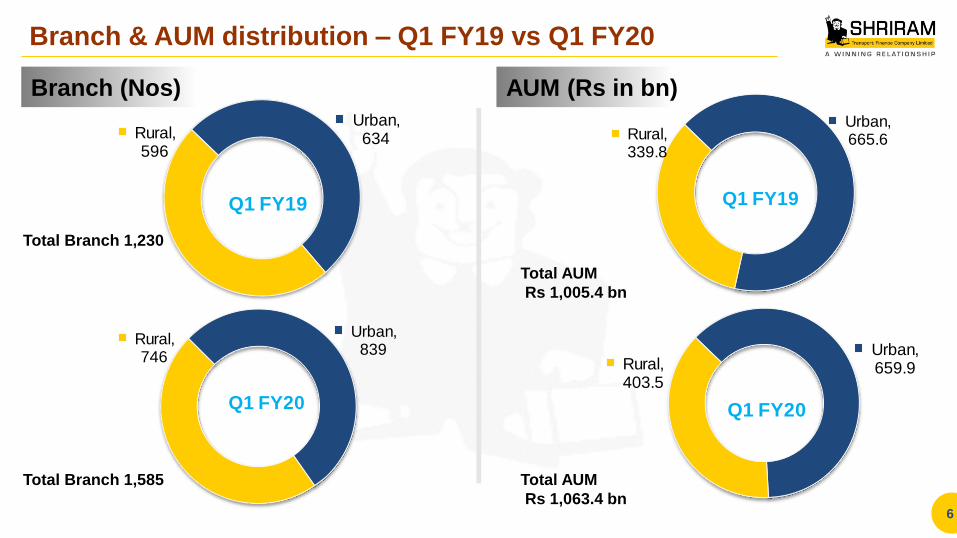
Branch & AUM distribution – Q1 FY19 vs Q1 FY20
6
Branch (Nos) AUM (Rs in bn)
Total AUM
Rs 1,063.4 bn
Total Branch 1,230
Total Branch 1,585
Urban, 665.6Rural,
339.8
Q1 FY19
Urban, 659.9Rural,
403.5
Q1 FY20
Urban, 634 Rural,
596
Q1 FY19
Urban, 839
Rural, 746
Q1 FY20
Total AUM
Rs 1,005.4 bn
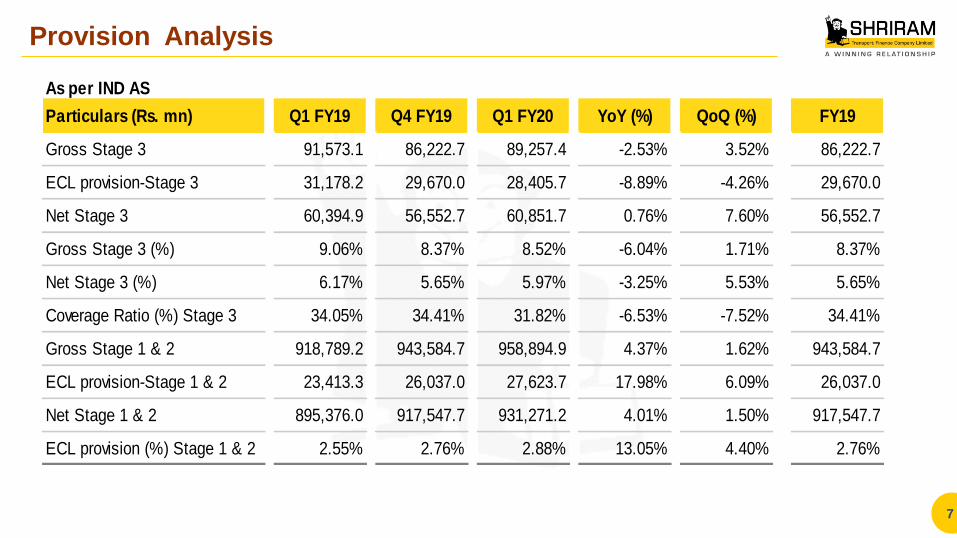
Provision Analysis
7
As per IND AS
Particulars (Rs. mn) Q1 FY19 Q4 FY19 Q1 FY20 YoY (%) QoQ (%) FY19
Gross Stage 3 91,573.1 86,222.7 89,257.4 -2.53% 3.52% 86,222.7
ECL provision-Stage 3 31,178.2 29,670.0 28,405.7 -8.89% -4.26% 29,670.0
Net Stage 3 60,394.9 56,552.7 60,851.7 0.76% 7.60% 56,552.7
Gross Stage 3 (%) 9.06% 8.37% 8.52% -6.04% 1.71% 8.37%
Net Stage 3 (%) 6.17% 5.65% 5.97% -3.25% 5.53% 5.65%
Coverage Ratio (%) Stage 3 34.05% 34.41% 31.82% -6.53% -7.52% 34.41%
Gross Stage 1 & 2 918,789.2 943,584.7 958,894.9 4.37% 1.62% 943,584.7
ECL provision-Stage 1 & 2 23,413.3 26,037.0 27,623.7 17.98% 6.09% 26,037.0
Net Stage 1 & 2 895,376.0 917,547.7 931,271.2 4.01% 1.50% 917,547.7
ECL provision (%) Stage 1 & 2 2.55% 2.76% 2.88% 13.05% 4.40% 2.76%
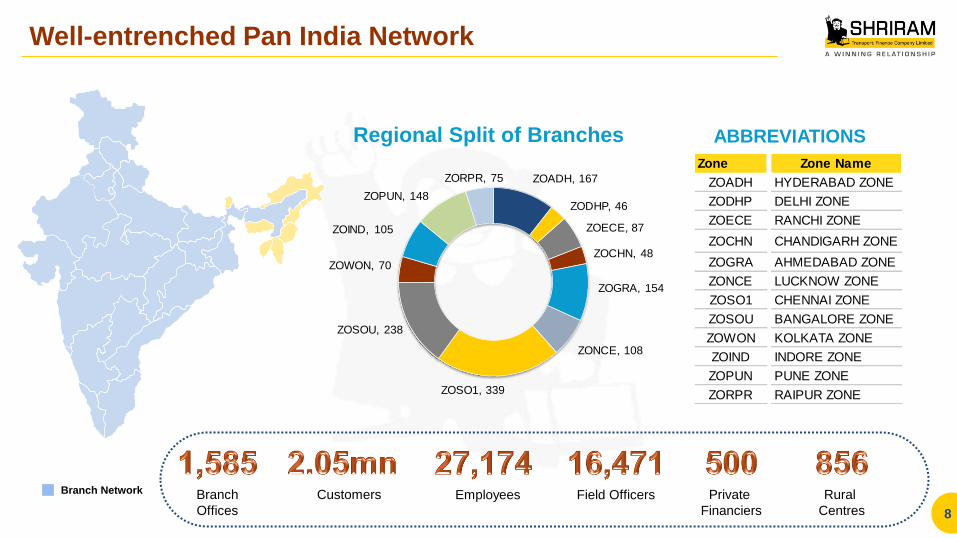
Well-entrenched Pan India Network
8
Branch Network Branch
Offices
Rural
Centres
Private
Financiers
Field Officers Customers
Regional Split of Branches
Employees
ABBREVIATIONS
Zone Zone Name
ZOADH HYDERABAD ZONE
ZODHP DELHI ZONE
ZOECE RANCHI ZONE
ZOCHN CHANDIGARH ZONE
ZOGRA AHMEDABAD ZONE
ZONCE LUCKNOW ZONE
ZOSO1 CHENNAI ZONE
ZOSOU BANGALORE ZONE
ZOWON KOLKATA ZONE
ZOIND INDORE ZONE
ZOPUN PUNE ZONE
ZORPR RAIPUR ZONE
ZOADH, 167
ZODHP, 46
ZOECE, 87
ZOCHN, 48
ZOGRA, 154
ZONCE, 108
ZOSO1, 339
ZOSOU, 238
ZOWON, 70
ZOIND, 105
ZOPUN, 148
ZORPR, 75
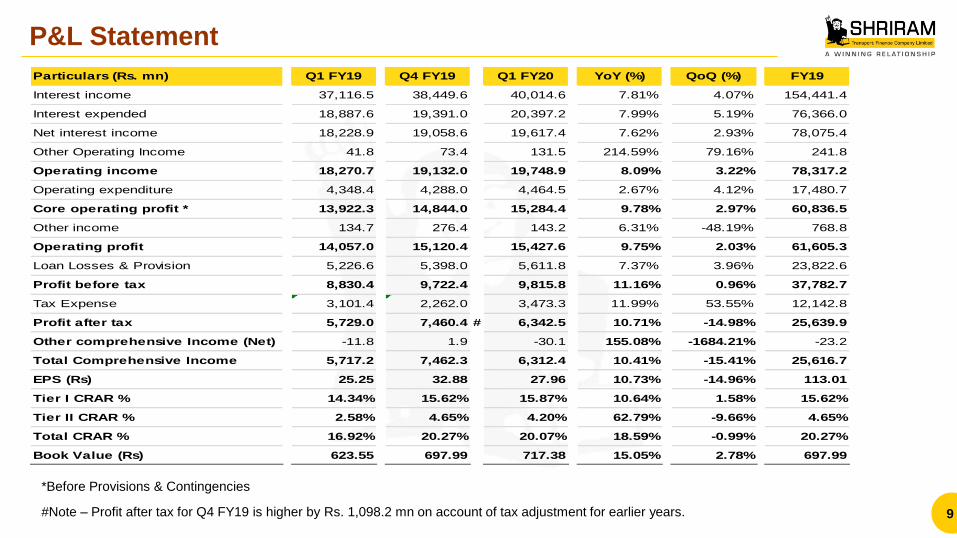
P&L Statement
*Before Provisions & Contingencies
Particulars (Rs. mn) Q1 FY19 Q4 FY19 Q1 FY20 YoY (%) QoQ (%) FY19
Interest income 37,116.5 38,449.6 40,014.6 7.81% 4.07% 154,441.4
Interest expended 18,887.6 19,391.0 20,397.2 7.99% 5.19% 76,366.0
Net interest income 18,228.9 19,058.6 19,617.4 7.62% 2.93% 78,075.4
Other Operating Income 41.8 73.4 131.5 214.59% 79.16% 241.8
Operating income 18,270.7 19,132.0 19,748.9 8.09% 3.22% 78,317.2
Operating expenditure 4,348.4 4,288.0 4,464.5 2.67% 4.12% 17,480.7
Core operating profit * 13,922.3 14,844.0 15,284.4 9.78% 2.97% 60,836.5
Other income 134.7 276.4 143.2 6.31% -48.19% 768.8
Operating profit 14,057.0 15,120.4 15,427.6 9.75% 2.03% 61,605.3
Loan Losses & Provision 5,226.6 5,398.0 5,611.8 7.37% 3.96% 23,822.6
Profit before tax 8,830.4 9,722.4 9,815.8 11.16% 0.96% 37,782.7
Tax Expense 3,101.4 2,262.0 3,473.3 11.99% 53.55% 12,142.8
Profit after tax 5,729.0 7,460.4 # 6,342.5 10.71% -14.98% 25,639.9
Other comprehensive Income (Net) -11.8 1.9 -30.1 155.08% -1684.21% -23.2
Total Comprehensive Income 5,717.2 7,462.3 6,312.4 10.41% -15.41% 25,616.7
EPS (Rs) 25.25 32.88 27.96 10.73% -14.96% 113.01
Tier I CRAR % 14.34% 15.62% 15.87% 10.64% 1.58% 15.62%
Tier II CRAR % 2.58% 4.65% 4.20% 62.79% -9.66% 4.65%
Total CRAR % 16.92% 20.27% 20.07% 18.59% -0.99% 20.27%
Book Value (Rs) 623.55 697.99 717.38 15.05% 2.78% 697.99
#Note – Profit after tax for Q4 FY19 is higher by Rs. 1,098.2 mn on account of tax adjustment for earlier years. 9
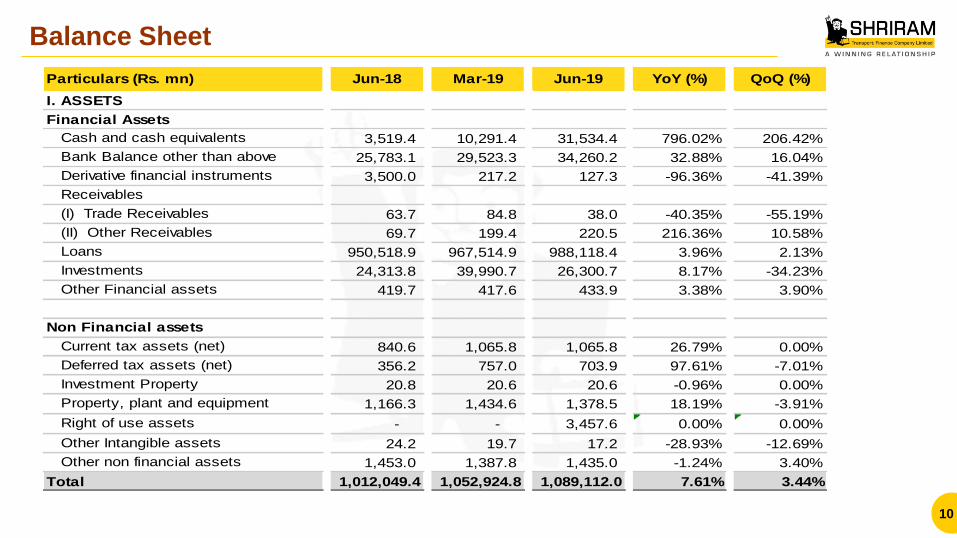
Balance Sheet
10
Particulars (Rs. mn) Jun-18 Mar-19 Jun-19 YoY (%) QoQ (%)
I. ASSETS
Financial Assets
Cash and cash equivalents 3,519.4 10,291.4 31,534.4 796.02% 206.42%
Bank Balance other than above 25,783.1 29,523.3 34,260.2 32.88% 16.04%
Derivative financial instruments 3,500.0 217.2 127.3 -96.36% -41.39%
Receivables
(I) Trade Receivables 63.7 84.8 38.0 -40.35% -55.19%
(II) Other Receivables 69.7 199.4 220.5 216.36% 10.58%
Loans 950,518.9 967,514.9 988,118.4 3.96% 2.13%
Investments 24,313.8 39,990.7 26,300.7 8.17% -34.23%
Other Financial assets 419.7 417.6 433.9 3.38% 3.90%
Non Financial assets
Current tax assets (net) 840.6 1,065.8 1,065.8 26.79% 0.00%
Deferred tax assets (net) 356.2 757.0 703.9 97.61% -7.01%
Investment Property 20.8 20.6 20.6 -0.96% 0.00%
Property, plant and equipment 1,166.3 1,434.6 1,378.5 18.19% -3.91%
Right of use assets - - 3,457.6 0.00% 0.00%
Other Intangible assets 24.2 19.7 17.2 -28.93% -12.69%
Other non financial assets 1,453.0 1,387.8 1,435.0 -1.24% 3.40%
Total 1,012,049.4 1,052,924.8 1,089,112.0 7.61% 3.44%
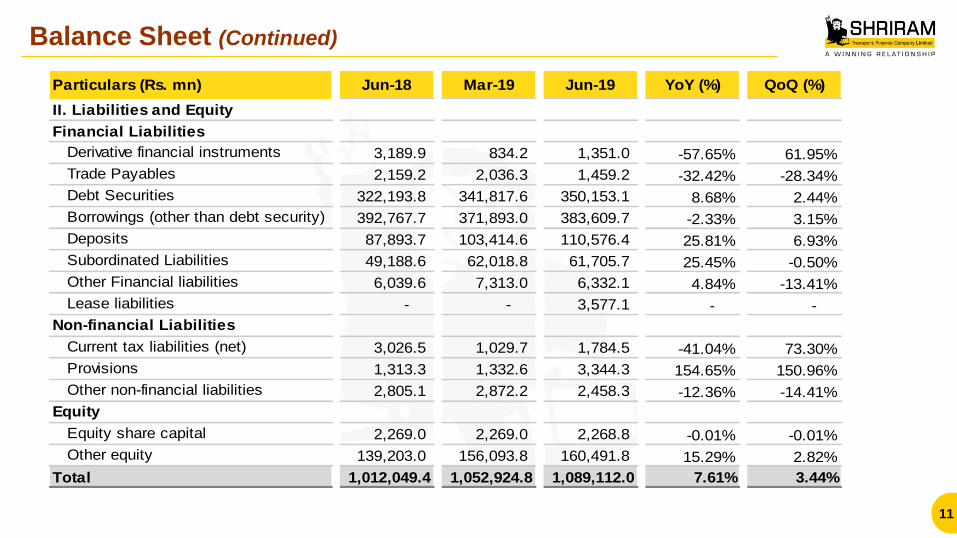
Balance Sheet (Continued)
11
Particulars (Rs. mn) Jun-18 Mar-19 Jun-19 YoY (%) QoQ (%)
II. Liabilities and Equity
Financial Liabilities
Derivative financial instruments 3,189.9 834.2 1,351.0 -57.65% 61.95%
Trade Payables 2,159.2 2,036.3 1,459.2 -32.42% -28.34%
Debt Securities 322,193.8 341,817.6 350,153.1 8.68% 2.44%
Borrowings (other than debt security) 392,767.7 371,893.0 383,609.7 -2.33% 3.15%
Deposits 87,893.7 103,414.6 110,576.4 25.81% 6.93%
Subordinated Liabilities 49,188.6 62,018.8 61,705.7 25.45% -0.50%
Other Financial liabilities 6,039.6 7,313.0 6,332.1 4.84% -13.41%
Lease liabilities - - 3,577.1 - -
Non-financial Liabilities
Current tax liabilities (net) 3,026.5 1,029.7 1,784.5 -41.04% 73.30%
Provisions 1,313.3 1,332.6 3,344.3 154.65% 150.96%
Other non-financial liabilities 2,805.1 2,872.2 2,458.3 -12.36% -14.41%
Equity
Equity share capital 2,269.0 2,269.0 2,268.8 -0.01% -0.01%
Other equity 139,203.0 156,093.8 160,491.8 15.29% 2.82%
Total 1,012,049.4 1,052,924.8 1,089,112.0 7.61% 3.44%
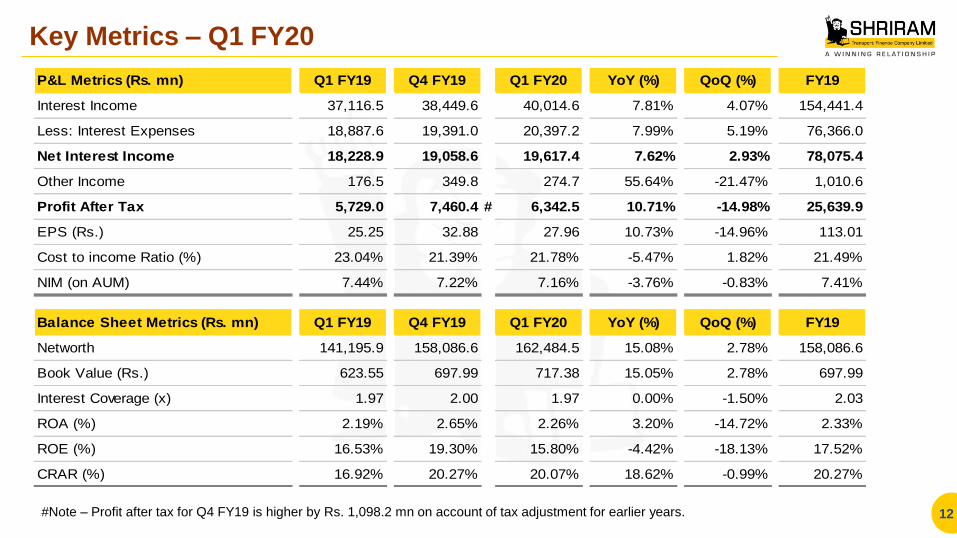
Key Metrics – Q1 FY20
12
P&L Metrics (Rs. mn) Q1 FY19 Q4 FY19 Q1 FY20 YoY (%) QoQ (%) FY19
Interest Income 37,116.5 38,449.6 40,014.6 7.81% 4.07% 154,441.4
Less: Interest Expenses 18,887.6 19,391.0 20,397.2 7.99% 5.19% 76,366.0
Net Interest Income 18,228.9 19,058.6 19,617.4 7.62% 2.93% 78,075.4
Other Income 176.5 349.8 274.7 55.64% -21.47% 1,010.6
Profit After Tax 5,729.0 7,460.4 # 6,342.5 10.71% -14.98% 25,639.9
EPS (Rs.) 25.25 32.88 27.96 10.73% -14.96% 113.01
Cost to income Ratio (%) 23.04% 21.39% 21.78% -5.47% 1.82% 21.49%
NIM (on AUM) 7.44% 7.22% 7.16% -3.76% -0.83% 7.41%
Balance Sheet Metrics (Rs. mn) Q1 FY19 Q4 FY19 Q1 FY20 YoY (%) QoQ (%) FY19
Networth 141,195.9 158,086.6 162,484.5 15.08% 2.78% 158,086.6
Book Value (Rs.) 623.55 697.99 717.38 15.05% 2.78% 697.99
Interest Coverage (x) 1.97 2.00 1.97 0.00% -1.50% 2.03
ROA (%) 2.19% 2.65% 2.26% 3.20% -14.72% 2.33%
ROE (%) 16.53% 19.30% 15.80% -4.42% -18.13% 17.52%
CRAR (%) 16.92% 20.27% 20.07% 18.62% -0.99% 20.27%
#Note – Profit after tax for Q4 FY19 is higher by Rs. 1,098.2 mn on account of tax adjustment for earlier years.
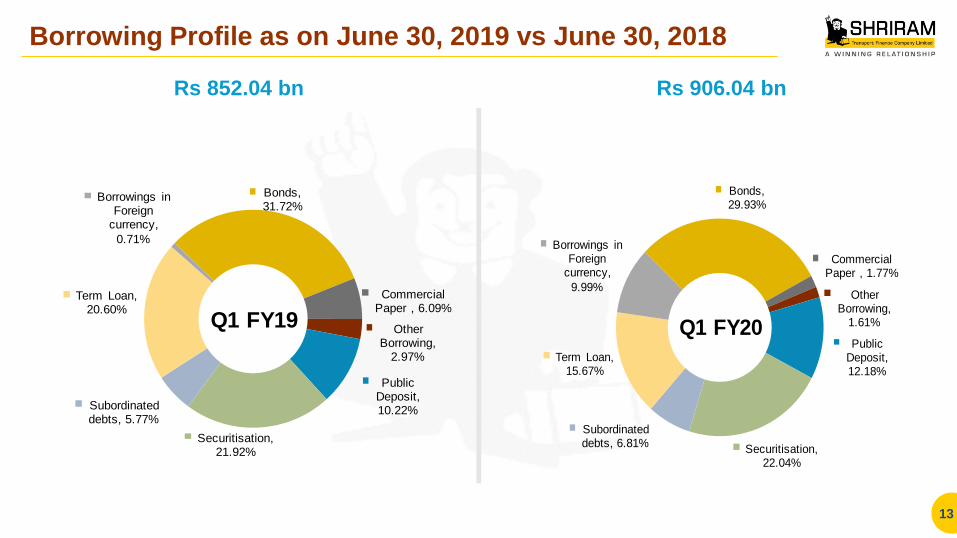
Borrowing Profile as on June 30, 2019 vs June 30, 2018
13
Rs 852.04 bn Rs 906.04 bn
Bonds, 31.72%
Commercial Paper , 6.09%
Other Borrowing,
2.97%
Public Deposit, 10.22%
Securitisation, 21.92%
Subordinated debts, 5.77%
Term Loan, 20.60%
Borrowings in Foreign
currency,
0.71%
Q1 FY19
Bonds, 29.93%
Commercial Paper , 1.77%
Other Borrowing,
1.61%
Public Deposit, 12.18%
Securitisation, 22.04%
Subordinated debts, 6.81%
Term Loan, 15.67%
Borrowings in Foreign
currency,
9.99%
Q1 FY20
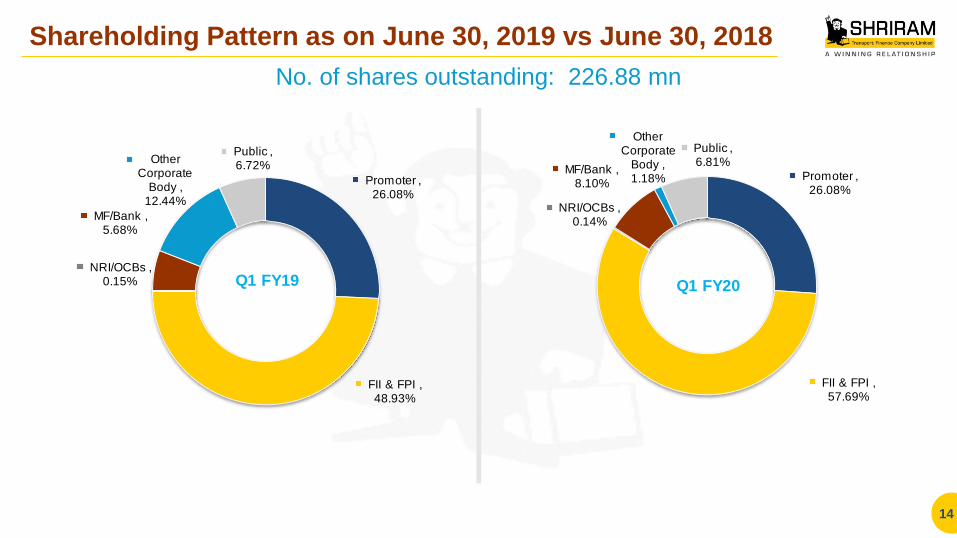
Shareholding Pattern as on June 30, 2019 vs June 30, 2018
14
No. of shares outstanding: 226.88 mn
Promoter , 26.08%
FII & FPI , 48.93%
NRI/OCBs , 0.15%
MF/Bank , 5.68%
Other Corporate
Body , 12.44%
Public , 6.72%
Q1 FY19
Promoter , 26.08%
FII & FPI , 57.69%
NRI/OCBs , 0.14%
MF/Bank , 8.10%
Other Corporate
Body , 1.18%
Public , 6.81%
Q1 FY20
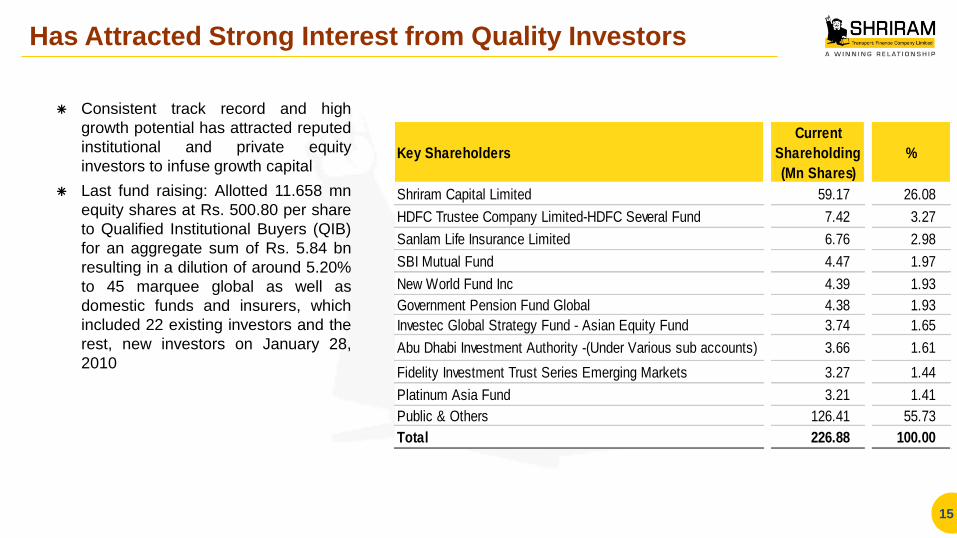
Has Attracted Strong Interest from Quality Investors
Consistent track record and high
growth potential has attracted reputed
institutional and private equity
investors to infuse growth capital
Last fund raising: Allotted 11.658 mn
equity shares at Rs. 500.80 per share
to Qualified Institutional Buyers (QIB)
for an aggregate sum of Rs. 5.84 bn
resulting in a dilution of around 5.20%
to 45 marquee global as well as
domestic funds and insurers, which
included 22 existing investors and the
rest, new investors on January 28,
2010
15
Key Shareholders
Current
Shareholding
(Mn Shares)
%
Shriram Capital Limited 59.17 26.08
HDFC Trustee Company Limited-HDFC Several Fund 7.42 3.27
Sanlam Life Insurance Limited 6.76 2.98
SBI Mutual Fund 4.47 1.97
New World Fund Inc 4.39 1.93
Government Pension Fund Global 4.38 1.93
Investec Global Strategy Fund - Asian Equity Fund 3.74 1.65
Abu Dhabi Investment Authority -(Under Various sub accounts) 3.66 1.61
Fidelity Investment Trust Series Emerging Markets 3.27 1.44
Platinum Asia Fund 3.21 1.41
Public & Others 126.41 55.73
Total 226.88 100.00

Contact Us
16
For any Investor Relations
queries please contact
Sanjay K. Mundra Shriram Transport Finance Co. Ltd
Email: [email protected]
Tel. No. +91-22-4095 9507
About Us
About Shriram Transport Finance Co. Ltd.
Shriram Transport Finance Co Ltd. is the largest asset financing NBFC in India with Assets under management Rs. 106,343.48
crores. The company is a leader in organized financing of pre-owned trucks with strategic presence in 5-10 year old trucks. It has a
pan-India presence with a network of 1,585 branches, and employs 27,174 employees including 16,471 field officers. The
company has built a strong customer base of approx. 2.05 mn. Over the past 40 years, it has developed strong competencies in
the areas of loan origination, valuation of pre-owned trucks and collection. It has a vertically integrated business model and offers a
number of products which include: Pre-owned CV financing, New CV financing and other loans like accidental repair loans, tyre
loans and working capital finance, etc. For more information please visit www.stfc.in
Forward Looking Statement
Certain statements in this document with words or phrases such as “will”, “should”, etc., and similar expressions or variation of
these expressions or those concerning our future prospects are forward looking statements. Actual results may differ materially
from those suggested by the forward looking statements due to a number of risks or uncertainties associated with the expectations.
These risks and uncertainties include, but are not limited to, our ability to successfully implement our strategy and changes in
government policies. The company may, from time to time, make additional written and oral forward looking statements, including
statements contained in the company’s filings with the stock exchanges and our reports to shareholders. The company does not
undertake to update any forward-looking statements that may be made from time to time by or on behalf of the company.
17

Thank You
Related Documents