Welcome message from author
This document is posted to help you gain knowledge. Please leave a comment to let me know what you think about it! Share it to your friends and learn new things together.
Transcript

FOREWORDMild tapering of inflation and a normal monsoon finally paved the way for lowering of REPO rate by 25 basis points, taking it to its lowest level in the last 5 years. The continued fall in both imports and exports, coupled with tepid investment demand has led RBI to pass on the cut. The Y-o-Y GDP growth rate also slowed down from 7.9% in the JFM quarter to 7.1% this quarter. The expected rise in oil prices from next year is also a major concern for the economy, which imports most of the oil it needs. High NPAs in the banking sector and construction delays in infrastructure and real estate also remain as major concerns.
However, the economy remains strong despite headwinds facing the world economy and geopolitical turmoil across Asia and Europe. The Manufacturing Purchasing Managers’ Index (PMI) is still above 52 level and GDP growth forecasts till 2020 by various multilateral agencies, remain above 7%. The lowering of Repo rate is expected to bring down both project finance as well as home loan costs, lowering the overall cost of buying a house.
The inevitable implementation of Real Estate Regulation and Development (RERA) Act, 2016 has led developers to hasten the delivery of their projects. This trend was clearly evident in the quarterly average prices data of Under Construction (UC) vs Ready-to-Move-in (RM) stock, where the premium commanded by RM properties came down due to increase in RM stock, as a portion of UC projects were delivered over the quarter.
RERA is a step in the right direction but will bear fruit only in 2-3 years, and till then the Indian real estate sector remains in turbulent waters, and its health can only be gauged through inferential means like pricing and inflation in the sector.
Price, as an end-product of interaction between the underlying demand and supply elements, incorporates all the sector related imperfections like delays and surge/dearth of transactions. Its trend also serves as a guidance to fiscal decision making by the government and RBI and investment decision making by private equity funds and retail home buyers.
Real estate in every city is heterogeneous and each locality and project can be mapped to different budget segments and geographies. Each budget segment and geography corresponds to a certain share of supply and consumer preference in the market.
Towards this end, Magicbricks presents a holistic price Index for each of the 14 major cities in India. The City Index reflects the price movement across localities, geographies and budget segments in the city. This bottom-up approach helps to identify factors affecting demand-supply dynamics of the city.
Analysis of City Indices over a 3-year period shows that Navi Mumbai had the highest gain of 18%, while New Delhi continued to face tough market with a 21% decline.
Regionally, Western India performed the best with 8.9% average gain, followed by South with 7.6% increment. North India saw an average decline of 7.4%, while Kolkata had the same average price as eleven quarters ago. It is important to note that any gains made are eroded when benchmarked against inflation in economy, in the study period.
Another important sign of our times is the 8% premium commanded by the Ready-to-Move-in (RM) properties over the Under Construction (UC) properties at a pan-India level. This ratio was at 5.1% eleven quarters ago and is a reflection of the falling consumer confidence in timely delivery of projects.
These are changing times and we would love to hear from you. Do write to us at [email protected] and share yours views on this report and how we could make PropIndex even better.
Sudhir Pai CEO, Magicbricks.com
METHODOLOGYRealistic price discovery has been the biggest problem area in the Indian real estate market. As consumers and industry struggle to arrive at a realistic benchmark pricing to assess the true value of their individual units, Magicbricks, as the largest repository of residential property listings, brings you the trusted Indian Apartment Price Index in a new and easy to use format. Mirroring the Indian Real Estate scenario, this price index presents an animated representation of the real estate market.
Magicbricks publishes the quarter-on-quarter inflation and deflation trends of the residential real estate prices in India. It collects real estate demand-supply data on a daily basis for more than 100 cities in India, of which, the fourteen top cities are selected for computing the National Property Price Index.
The National Property Price Index and its constituent indices are subjected to a series of stringent steps.
Each quarter, Magicbricks measures the individual property level price changes, which are then aggregated at the locality level. While comparing the average pricing figures for the current quarter and comparing with the previous one, quarterly price changes are calculated. These price changes are further aggregated at the city level and even further at an all-India level.
As the top receiver and aggregator of residential demand, Magicbricks’ data provides consumers with realistic benchmarks to the assess true property pricing. Where demand exceeds supply, consumers have no chance of negotiating values.
However, where demand is far lower than supply, buyers can look for more options and therefore, negotiate
pricing. If, on the other hand, you are a seller looking for benchmark pricing, you will effect the fastest sale if your asking values are close to the buyer’s paying power.
There are various co-relations of demand and the overall real estate market as well as its future potential. Not only is demand a preceding indicator to supply, it is also a fairly good indicator of actual transaction activity in the region.
We have aggregated the 14 cities covered under the report into various localities. While calculating the city level property pricing indicator, we have applied demand as weight to each locality. This weight is equal to the locality’s share of the demand being contributed to the city’s total demand. As a consequence, the locality receiving higher demand for residential units will be given a higher weightage. Following that, each city’s price movement is calculated by aggregating the price movements of individual localities, according to their individual weightages.
In terms of checks and balances towards making the data and analysis more robust and objective, we have made sure that superfluous information does not deviate the desired results. Hence, we have applied checks and balances at the locality level listing data collection and aggregation.
A statistical technique called “Inter-Quartile Range” (IQR) has been used to ensure that unintentional input deviations of house size and price figures, which may distort the actual value of the house and corrupt the analysis, are addressed. The technique aims to remove the outlier data sets, while securing the correct values.
The Interquartile Range technique works through measuring variability of each data set, while dividing the data set into quartiles. The technique measures the value of data points on the first and third quartiles of the data and calculates the difference between the two.
This range, called ‘IQR’, gives the effective extent of data set, while removing the first 25% and the last 25%. Subsequently, a test is applied to each of the values in the data set. If a particular data lies within an IQR of the first and third quartile values, then that data is considered part of the data set, otherwise not. The set of listing values of each locality are statistically cleaned.
Magicbricks, on an average, covers more than 500 localities for Tier-I cities of India. Yet for the sake of analysis, we take only those localities where the recipient demand is at least 0.05% of the city’s total demand. Only localities with at least 50 actively traded properties have been included in the analysis. Following that process, we shortlisted various localities which in some sense, impact the pricing dynamics of the city.
We then calculate the average prices of the city for the quarter, while applying demand weights to the average prices of each locality. These average prices at the city level are further aggregated to the final outcome of the ‘National Price Index’.
The difference in Under Construction and Ready-to-Move-in property has been assessed and included in the report. Rental yield and affordability too has been addressed for the top 10 localities by supply in every city. These are critical tools which well used can help with realistic price discovery.
GLOSSARY & DEFINITIONS1. City Property Index :This is a composite index which is a function of supply of properties as well as
the average capital appreciation/drop in various localities of the city in the quarter. The City Index is the weighted average of the average rate per square foot in that locality and the supply of properties from that locality. Localities with higher supply of properties will have a bigger impact on the Index.
2. Price trend basis budget segments: To better understand the city’s price trend, the localities have been divided into budget segments basis their capital value (Rs/sq ft). We have tracked the weighted average price for each budget segment for a 2+ year period from quarter ending September 2013 to quarter ending September 2016.
Subsequently, the movement of the localities in each price segment is mapped to derive respective short term and long term price change trends. The number of budget segments vary according to the city characteristics.
3. Zone wise distribution of localities: The various localities in the cities are all geographically divided into five key regions: Northern, Southern, Eastern, Western and Central. The localities are analyzed at the local zonal level to better understand the effect of the various drivers of price and demand, which are active mostly at the zonal level rather than at the city level.
4. Zone wise distribution of property budget segments: To better understand how each of the city zones contribute to the city’s supply, and how they are able to provide housing at various price points, the supply is distributed into budget segments across various geographic zones. For instance, if a zone has most of its supply in the premium budget segment, then it naturally becomes a premium destination within the city. The price changes within the various budget segments are also analyzed at the zonal level to go to the depths of the price changes across the city and to easily contribute the price changes to local factors.
5. Capital Value Tables (given in Annexures): This shows the actual range of prices within which properties are available in each locality in the quarter. Prices are shown in Rupees per square foot basis, these are the prevailing rates for properties in each locality.
6. Price trend – Top 10 localities by consumer preference: This section presents the price trend of the Top 10 localities in the city by consumer preference. These localities have the highest consumer focus and assessment of price trend in these localities assists in understanding the prevalent and future price trend in the city.
7. Price trend basis construction status: This Index looks at the movement in prices of Under Construction (UC) and Ready-to-Move-in (RM) properties across localities in the city. It is a weighted price index where weight is assigned to each locality basis its share in the consumer preference in the city.
What is the PropIndex?
The PropIndex gives you locality-wise property values in two forms – as locality price ranges for sale and rent in the annexure to every city with additional information on whether it has gone up or down in the quarter, and what is the rental yield in that locality. These prices are based on the listed prices of properties for sale or rent on the website www.magicbricks.com. This helps you to understand the average locality price ranges and to assess whether the price of the property for sale or rent that you are assessing, lies within the average price ranges in the locality. In a market where data or information is hard to come by, this data helps you to assess whether you are being quoted rational values for the property you are considering.
Why do I get locality sale and rent prices and how do I use them?
When you buy a property you must know what the average locality prices are. When you buy property directly from the developer, the price per sq ft is the value you pay. Then there are additional preferred location charges (PLC) such as vastu related, view related or floor related. When you buy from the secondary market or from an individual seller, the price is determined basis a notional value of the property. The sale values in the PropIndex help you to establish the price you should demand if you are a seller or what you should pay if you are a buyer. Rental values, similarly, are the average values that are listed on the website. They serve as benchmarks of the expected rental prices in the locality.
What is rental yield and why is it significant?
If you pay a certain price for a property, there is an amount you earn per annum as rent. When the rental income is expressed as a percentage of the property value, it is rental yield. It is a good yardstick to compute which property to select as a Buy to Let investment.
Why is it called a Property Index and not Property values?
Magicbricks has a very large number of listings. The number per locality depends on market conditions and how many consumers or brokers or developers choose to post their properties for sale or rent. When we are computing values at the locality or city levels we do not want any one locality to skew the index value of the city. As a result when any one or more localities have more than usual or less than usual number of listings, using the ratio of price to number of listings helps to even out unusual spikes or troughs in the data. This gives you unbiased city or locality averages.
How do I use an index number?
Magicbricks Index was computed first in 2011. The values in the year 2011 have been used as the base value and is assumed to be 100. When the value is below that
base number, the index is said to have fallen. When it is more than that number, the index is said to have gone up. This gives users like you, who are interested in property markets, an idea of how the property market in your city has performed vis-à-vis other cities. When the economic conditions are good and the builder is actively developing and the consumer is actively buying, the index value rises above 100. When markets are flat due to lack of economic activity and therefore developer and consumer disinterest, the index values remain at 100 or drop below that.
Very high index values shows a lot of investor activity and therefore severe peaking of property values. As an end user you should avoid buying when there is intense buying and speculative activity. That however, is a good time for you to sell as high property prices will give you good returns on your investment. When the index value comes down dramatically, the chances are that you will not get good returns as a seller. But if you find the property that you like in this cycle, it is a good time to negotiate the best values and buy as the chances are that there will be fewer buyers in the market. Since the PropIndex is now 5-years old, a look at how the index values have moved over the years gives you a good idea of how the market has performed in different quarters. If you are interested in how property markets have performed across a period of time, the PropIndex values give you a fair idea of the movement.
Do I get any specific Advice that helps my property decisions?
Magicbricks has a team of data scientists and researchers who are constantly studying the property markets and values to get the trends. In the past two quarters, for instance, they have noticed that ready-to-move-in property has been significantly more expensive than under construction property. This probably indicates that consumers do not want to buy property that is not complete and has chances of delayed delivery and prefer to spend more to buy property that they can purchase and move into. This is useful to you as a buyer and alerts you to general trends of other buyers.
What is the editorial and how is it useful to me?
The editorial team of Magicbricks constantly assesses the property market developments and factors such as infrastructure announcements and transport corridor development, to figure out how they can impact values of residential real estate in your city. In each edition of PropIndex they assess what all has happened in the quarter and how it will impact the value of the property that you are interested in. This analysis gives you an idea of the issues you should consider when buying property in that city.
How do I use the different sections of the PropIndex?
The key takeaways are useful in getting an overview of the property market in your city. The geographical distribution of localities allows you to assess in which areas property is available for sale. The distribution of properties by capital value allows you to freeze the price segment where you are likely to get the type of property you are looking for. The budget wise price change helps to compute how the price range that you are looking for has been performing. If values have been rising in your budget of interest you may have to hurry up with your property decision if you are an end user. If it has dropped, figure out if there is a problem in that category. This exercise has been done for each part of the city. The price trend by construction basis tells you which the best stage is at which you should enter the property market. The price changes basis construction status takes this analysis a step forward. Read it carefully and you will be able to assess exactly when you should enter the market as a buyer and as an investor.
What is the Corridor of Growth?
Magicbricks has figured that the bulk of new property in any city is developed along a few transport corridors leading out of the city. These have been identified and studied for stock, price rise, current status, future potential and its physical and social infrastructure such as water, power, sewerage and drainage facilities, transport links, schools, colleges, hospitals and entertainment centres in the vicinity. Advice has been given on the basis of rental and buyer’s demand, the best configurations to buy – 2, 3 and 4BHK, past and future estimated price trends and also how it figures in the master plan of the city. News updates of each corridor allows you to understand the drivers of those corridors.
HOW TO USE THE PROPINDEX
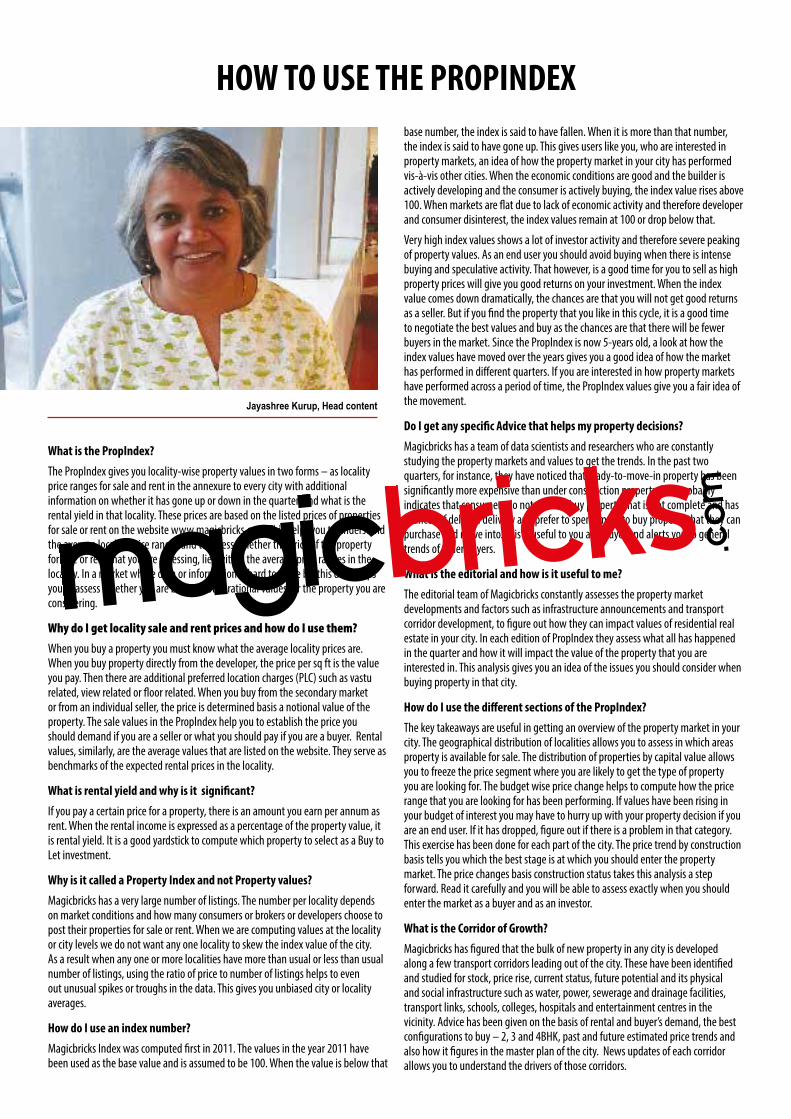
Jayashree Kurup, Head content

In line with general lack of activity in the residential market, the National Property Index remained stagnant at the same level
as in the last quarter, with prices falling by a marginal 0.12%. This is in continuation of the inactivity seen in the last many quarters.
NPI is the weighted average of consumer preference share of 14 cities and their individual City Index value.
On a quarterly level, South was the only region which inched up substantially in terms of prices from the last quarter while North fell the most. Although it cannot be said with certainty that prices have hit rock bottom and will not fall any further, any downward movement, going forward, will be restricted.
On a three year scale, Western India has done better than all other regions, with its cities having 8.9% price increment, on an average.
The worst performer was the North region, where prices fell by more than 7% in the last three years. The second best gains were witnessed in Southern India, where prices moved up by 7.6% over the same period.
In terms of historical price change, Navi Mumbai was the best performer with a significant 18% increment over the last three years, followed by Hyderabad and Pune, which had a 10% gain each. Thane stood fourth with a 9% gain, while Bengaluru and Ahmedabad had a 7% gain each. Next were Mumbai and Chennai with a 5% gain each.
Gains of lower than 5% were witnessed only in the North and Eastern regions, with Noida and Greater Noida showing the maximum gain in Delhi-NCR of just 4% each. Both, Gurgaon from Delhi-NCR and Kolkata from the Eastern region, had the same price in the Jul-Sep
2016 quarter, as three years ago. Only two of the top 14 cities considered for PropIndex saw a price decline in the last three years and both belonged to Delhi-NCR. While prices in Ghaziabad fell by 6%, New Delhi performed the worst, with a whopping 21% fall in prices.
In terms of quarterly change, Hyderabad performed the best with a 2.8% increase over the last quarter, followed by Bengaluru at 2.0% and Navi Mumbai at 1.2%. Overall, the Southern region was the best performer, with Chennai also giving a 0.7% price increment and standing fourth in the top 14 cities.
In terms of worst performers, four cities saw price drop, with the highest drop in Greater Noida of 1.7%, followed by Noida witnessing a drop of 1.2%. Mumbai and New Delhi were the other two cities noting a price drop, amounting to 0.8% and 0.7%, respectively.
VOL 6, ISSUE 2; JUL-SEP, FY 2016-17 propindex.magicbricks.com
[Jul-Sep 2016]
[Buyers looking for an exit]
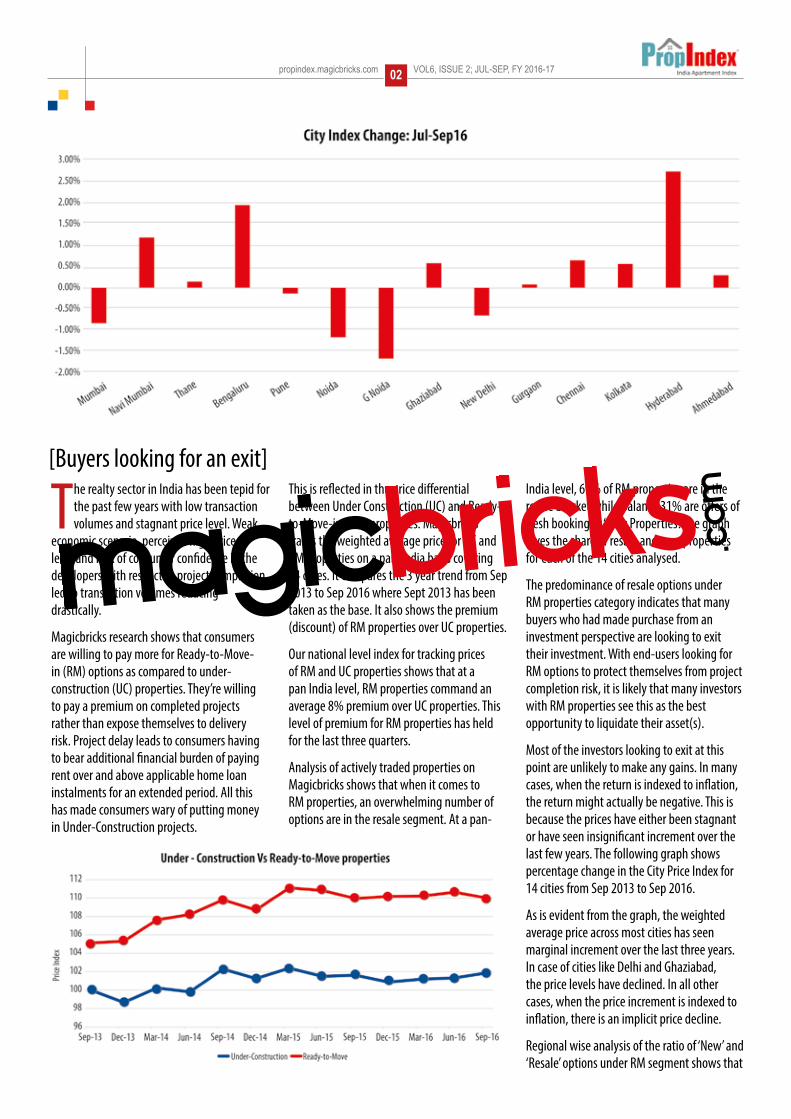
The realty sector in India has been tepid for the past few years with low transaction volumes and stagnant price level. Weak
economic scenario, perceived high price level and lack of consumer confidence in the developers with respect to project completion led to transaction volumes reducing drastically.
Magicbricks research shows that consumers are willing to pay more for Ready-to-Move-in (RM) options as compared to under-construction (UC) properties. They’re willing to pay a premium on completed projects rather than expose themselves to delivery risk. Project delay leads to consumers having to bear additional financial burden of paying rent over and above applicable home loan instalments for an extended period. All this has made consumers wary of putting money in Under-Construction projects.
This is reflected in the price differential between Under Construction (UC) and Ready-to-Move-in (RM) properties. Magicbricks tracks the weighted average price for UC and RM properties on a pan-India basis covering 14 cities. It compares the 3 year trend from Sep 2013 to Sep 2016 where Sept 2013 has been taken as the base. It also shows the premium (discount) of RM properties over UC properties.
Our national level index for tracking prices of RM and UC properties shows that at a pan India level, RM properties command an average 8% premium over UC properties. This level of premium for RM properties has held for the last three quarters.
Analysis of actively traded properties on Magicbricks shows that when it comes to RM properties, an overwhelming number of options are in the resale segment. At a pan-
India level, 69% of RM properties are in the resale bracket while balance 31% are offers of fresh booking or ‘New Properties’. The graph gives the share of resale and new properties for each of the 14 cities analysed.
The predominance of resale options under RM properties category indicates that many buyers who had made purchase from an investment perspective are looking to exit their investment. With end-users looking for RM options to protect themselves from project completion risk, it is likely that many investors with RM properties see this as the best opportunity to liquidate their asset(s).
Most of the investors looking to exit at this point are unlikely to make any gains. In many cases, when the return is indexed to inflation, the return might actually be negative. This is because the prices have either been stagnant or have seen insignificant increment over the last few years. The following graph shows percentage change in the City Price Index for 14 cities from Sep 2013 to Sep 2016.
As is evident from the graph, the weighted average price across most cities has seen marginal increment over the last three years. In case of cities like Delhi and Ghaziabad, the price levels have declined. In all other cases, when the price increment is indexed to inflation, there is an implicit price decline.
Regional wise analysis of the ratio of ‘New’ and ‘Resale’ options under RM segment shows that
propindex.magicbricks.com VOL6, ISSUE 2; JUL-SEP, FY 2016-1702
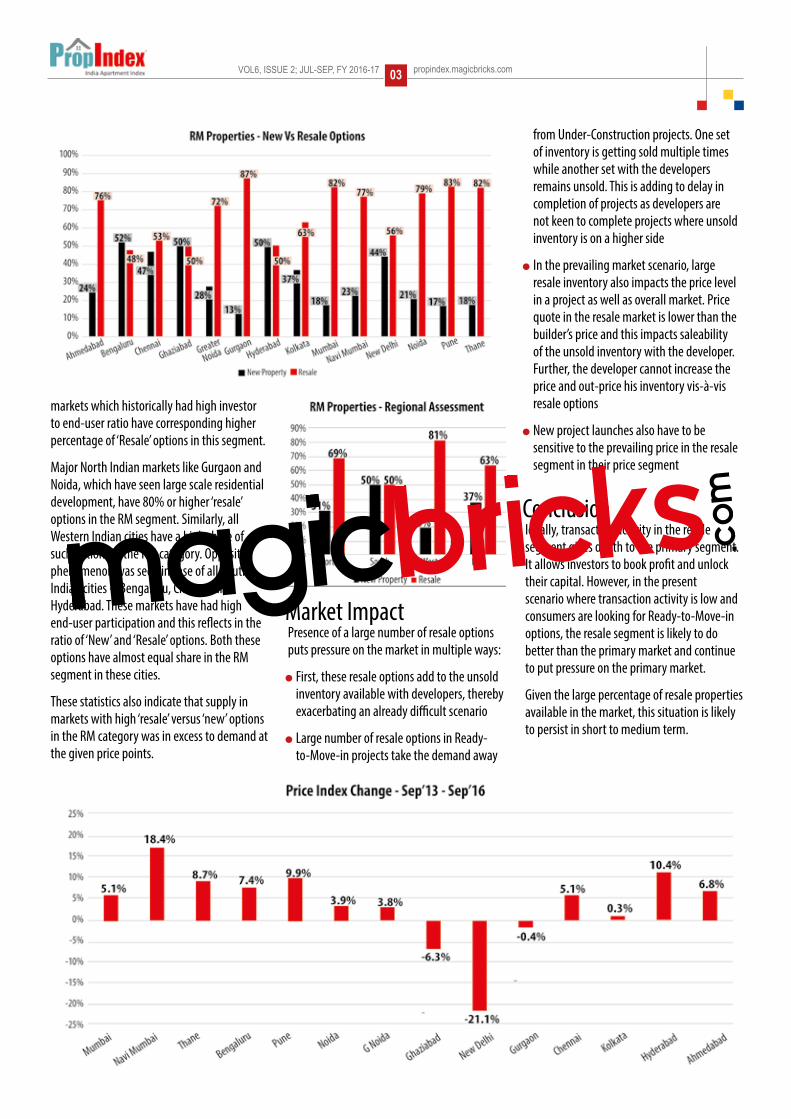
markets which historically had high investor to end-user ratio have corresponding higher percentage of ‘Resale’ options in this segment.
Major North Indian markets like Gurgaon and Noida, which have seen large scale residential development, have 80% or higher ‘resale’ options in the RM segment. Similarly, all Western Indian cities have a high share of such options in the RM category. Opposite phenomenon was seen in case of all South Indian cities – Bengaluru, Chennai and Hyderabad. These markets have had high end-user participation and this reflects in the ratio of ‘New’ and ‘Resale’ options. Both these options have almost equal share in the RM segment in these cities.
These statistics also indicate that supply in markets with high ‘resale’ versus ‘new’ options in the RM category was in excess to demand at the given price points.
Market ImpactPresence of a large number of resale options puts pressure on the market in multiple ways:
l First, these resale options add to the unsold inventory available with developers, thereby exacerbating an already difficult scenario
l Large number of resale options in Ready-to-Move-in projects take the demand away
from Under-Construction projects. One set of inventory is getting sold multiple times while another set with the developers remains unsold. This is adding to delay in completion of projects as developers are not keen to complete projects where unsold inventory is on a higher side
l In the prevailing market scenario, large resale inventory also impacts the price level in a project as well as overall market. Price quote in the resale market is lower than the builder’s price and this impacts saleability of the unsold inventory with the developer. Further, the developer cannot increase the price and out-price his inventory vis-à-vis resale options
l New project launches also have to be sensitive to the prevailing price in the resale segment in their price segment
ConclusionIdeally, transaction activity in the resale segment gives depth to the primary segment. It allows investors to book profit and unlock their capital. However, in the present scenario where transaction activity is low and consumers are looking for Ready-to-Move-in options, the resale segment is likely to do better than the primary market and continue to put pressure on the primary market.
Given the large percentage of resale properties available in the market, this situation is likely to persist in short to medium term.
VOL6, ISSUE 2; JUL-SEP, FY 2016-17 propindex.magicbricks.com03

PUNE propindex.magicbricks.com VOL6, ISSUE 2; JUL-SEP, FY 2016-1704
[PROPINDEX - PUNE][Key Takeaways]
Pune witnesses constructive measures
Maybe Pune did not see many on-ground transactions this quarter but that does not dismiss the efforts made by the
state govt and the govt authorities to bring about a change which impacts real estate.
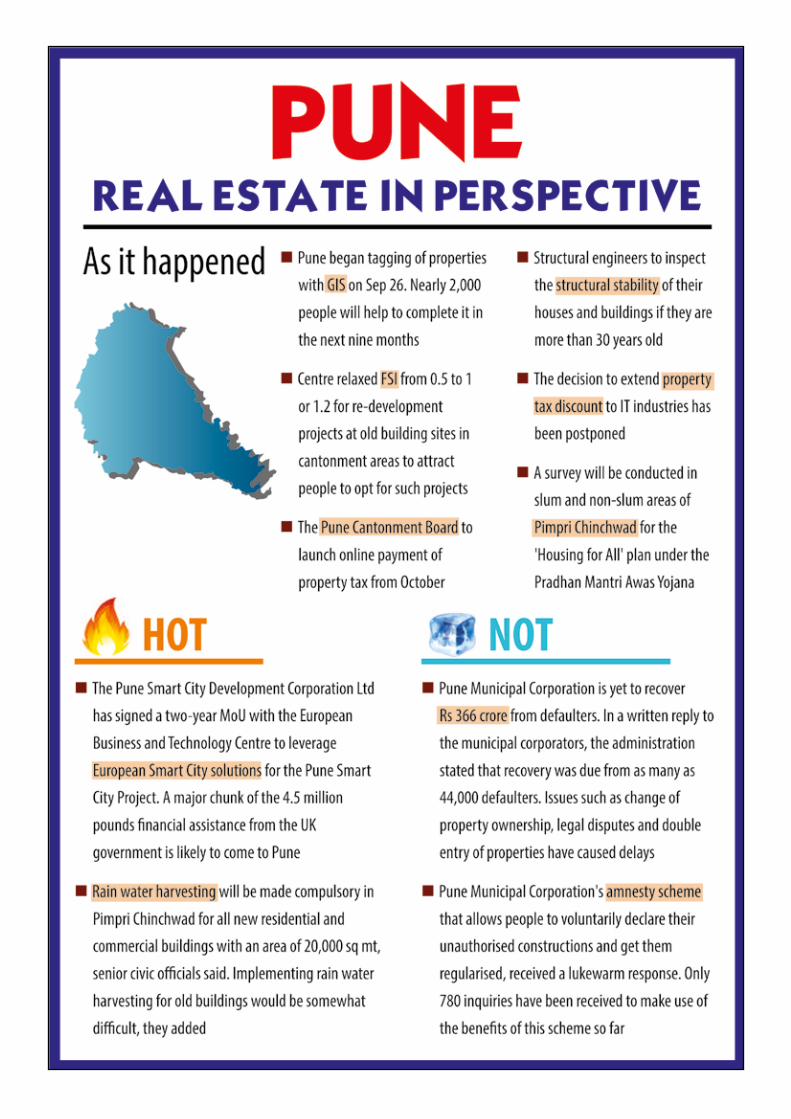
News about old buildings collapsing across states has caught the attention of the media and people alike. In order to bring some safety parameters, the Pimpri-Chinchwad Municipal Corporation (PCMC) is trying to set up a panel of structural engineers who will inspect old buildings across the city. All buildings (over 30 years’-old) have to get a renewal certificate every 10 years from the first check from structural engineers, authorized by PMC.
In a bid to push sales volume, the FSI has been relaxed from 0.5 to 1 or 1.2 for re-development
projects at old building sites in the cantonment areas. The initial FSI had kept people away from undertaking any re-development project and the cantonment areas were left with too many dilapidated old building structures. This hopefully will change with the revision.
In another news, the Pune Cantonment Board will soon launch online payment of property tax. In association with a private bank, consumers can either pay through the bank’s portal or visit its branches.
GIS tagging will be an ongoing activity for the next nine months. This will be deployed for Pune Municipal Corporation to check illegal constructions. Information collected, based on roads, areas, plot numbers and municipal zones, should be part of the data bank.
To fulfil the ‘Housing for All’ goal, under the Pradhan Mantri Awas Yojana, Pimpri Chinchwad’s slum and non-slum areas will be scrutinised to estimate affordable housing demand. Accordingly, the authorities will draw up a plan and implement.
Smart Pune will become a reality with the usage of European Smart City solutions for the Pune Smart City Project. The UK government has facilitated 4.5 million pounds financial assistance for the same. A two-year MoU with the European Business and Technology Centre has been signed.
The benefits from these advancements might take some time to render but in the long run its impact on the real estate sector will definitely be positive.
Magicbricks Bureau
EDITORIAL
The City Index remained stagnant as the last quarter. The Jul-Sep 2016 quarter had slightly more localities with price decline than increment
At least 59% localities saw an average drop of 2.4%, pushing down the Apr-Jun 2016 Index by under 1%. The balance 41% localities saw price rise of 1.9%, pushing up the Index also by less than 1%
Out of the eight budget segments, six budget segments have seen a decline in the price level. The balance budget segments saw a marginal increment in prices
The overall price movement varied from +1.4% to -1.2% in the quarter
On an average, prices in the West zone, which account for more than 40% share of consumer preference
and more than 35% share of supply in the secondary market, saw a price decrease of 1% as compared to the last quarter
Price movement in high demand localities was a mixed bag with few localities like Baner and Wakad witnessing marginal increment while others like Hinjewadi and Sinhagad Road saw a price decline
The East zone, the second most preferred zone and also has the second highest share of supply in the secondary market, saw a price decline by 0.4%
South zone saw the highest price decline amongst various zones in Pune with both the major budget segments witnessing a decline. The price trend in the Central zone was
positive as more budget segments in the zone saw a price increment as compared to price decline
Analysis across 92 localities shows that on an average, Ready to-Move-in properties were marginally cheaper as compared to Under Construction properties
The average difference in prices has reversed; earlier the RM properties were more expensive but in this quarter, UC properties have become slightly more expensive
There has been a price reversal of 200 basis points as compared to the Apr-Jun 2016 quarter
While the weighted average price of RM properties was Rs 6,650 per sq ft, the same for UC properties was Rs 6,690 per sq ft
VOL6, ISSUE 2; JUL-SEP, FY 2016-17 propindex.magicbricks.com PUNE05
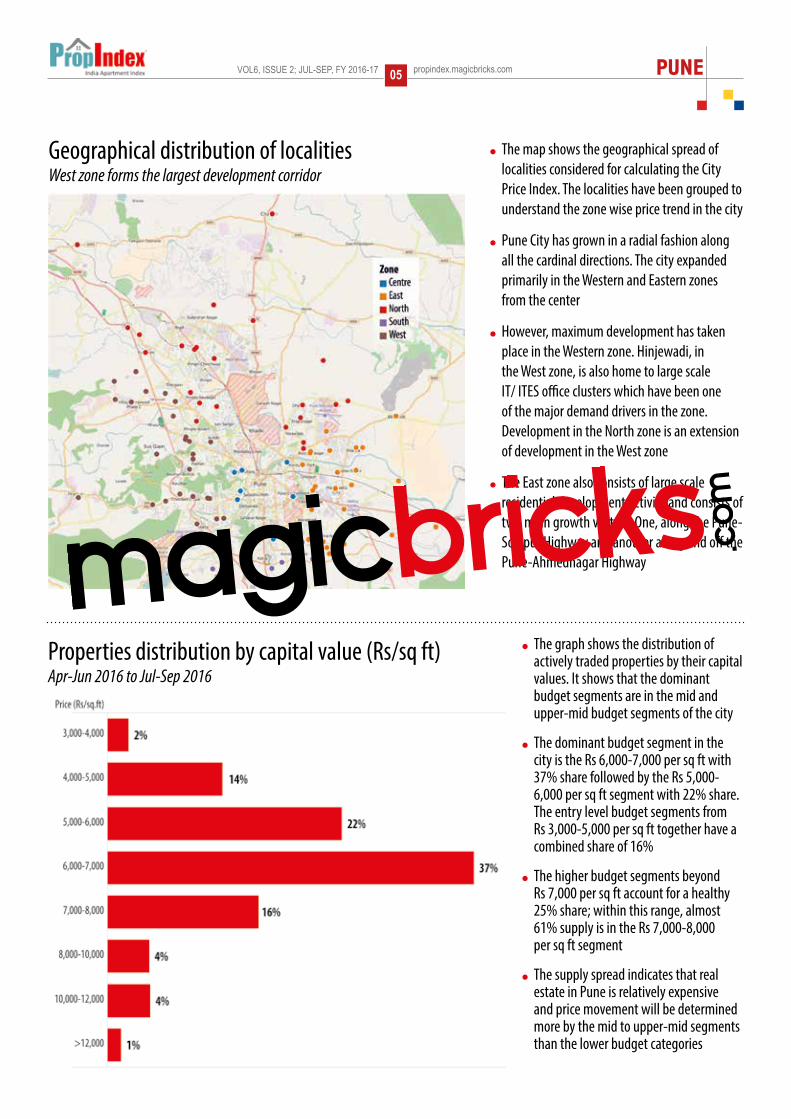
Properties distribution by capital value (Rs/sq ft)Apr-Jun 2016 to Jul-Sep 2016
The graph shows the distribution of actively traded properties by their capital values. It shows that the dominant budget segments are in the mid and upper-mid budget segments of the city
The dominant budget segment in the city is the Rs 6,000-7,000 per sq ft with 37% share followed by the Rs 5,000-6,000 per sq ft segment with 22% share. The entry level budget segments from Rs 3,000-5,000 per sq ft together have a combined share of 16%
The higher budget segments beyond Rs 7,000 per sq ft account for a healthy 25% share; within this range, almost 61% supply is in the Rs 7,000-8,000 per sq ft segment
The supply spread indicates that real estate in Pune is relatively expensive and price movement will be determined more by the mid to upper-mid segments than the lower budget categories
The map shows the geographical spread of localities considered for calculating the City Price Index. The localities have been grouped to understand the zone wise price trend in the city
Pune City has grown in a radial fashion along all the cardinal directions. The city expanded primarily in the Western and Eastern zones from the center
However, maximum development has taken place in the Western zone. Hinjewadi, in the West zone, is also home to large scale IT/ ITES office clusters which have been one of the major demand drivers in the zone. Development in the North zone is an extension of development in the West zone
The East zone also consists of large scale residential development activity and consists of two main growth vectors. One, along the Pune-Solapur Highway and another along and off the Pune-Ahmednagar Highway
Geographical distribution of localitiesWest zone forms the largest development corridor
PUNE propindex.magicbricks.com VOL6, ISSUE 2; JUL-SEP, FY 2016-1706
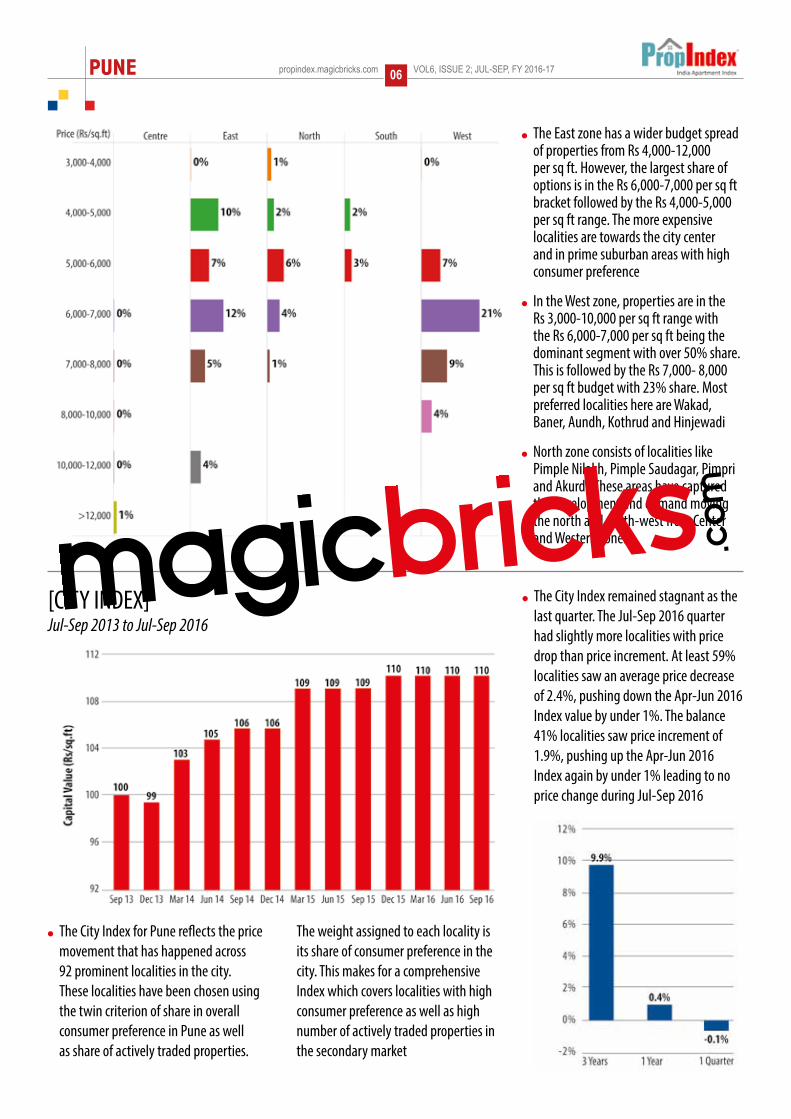
The City Index for Pune reflects the price movement that has happened across 92 prominent localities in the city. These localities have been chosen using the twin criterion of share in overall consumer preference in Pune as well as share of actively traded properties.
The weight assigned to each locality is its share of consumer preference in the city. This makes for a comprehensive Index which covers localities with high consumer preference as well as high number of actively traded properties in the secondary market
The City Index remained stagnant as the last quarter. The Jul-Sep 2016 quarter had slightly more localities with price drop than price increment. At least 59% localities saw an average price decrease of 2.4%, pushing down the Apr-Jun 2016 Index value by under 1%. The balance 41% localities saw price increment of 1.9%, pushing up the Apr-Jun 2016 Index again by under 1% leading to no price change during Jul-Sep 2016
The East zone has a wider budget spread of properties from Rs 4,000-12,000 per sq ft. However, the largest share of options is in the Rs 6,000-7,000 per sq ft bracket followed by the Rs 4,000-5,000 per sq ft range. The more expensive localities are towards the city center and in prime suburban areas with high consumer preference
In the West zone, properties are in the Rs 3,000-10,000 per sq ft range with the Rs 6,000-7,000 per sq ft being the dominant segment with over 50% share. This is followed by the Rs 7,000- 8,000 per sq ft budget with 23% share. Most preferred localities here are Wakad, Baner, Aundh, Kothrud and Hinjewadi
North zone consists of localities like Pimple Nilakh, Pimple Saudagar, Pimpri and Akurdi. These areas have captured the development and demand moving the north and north-west from Center and Western zones
[CITY INDEX]Jul-Sep 2013 to Jul-Sep 2016
VOL6, ISSUE 2; JUL-SEP, FY 2016-17 propindex.magicbricks.com PUNE07
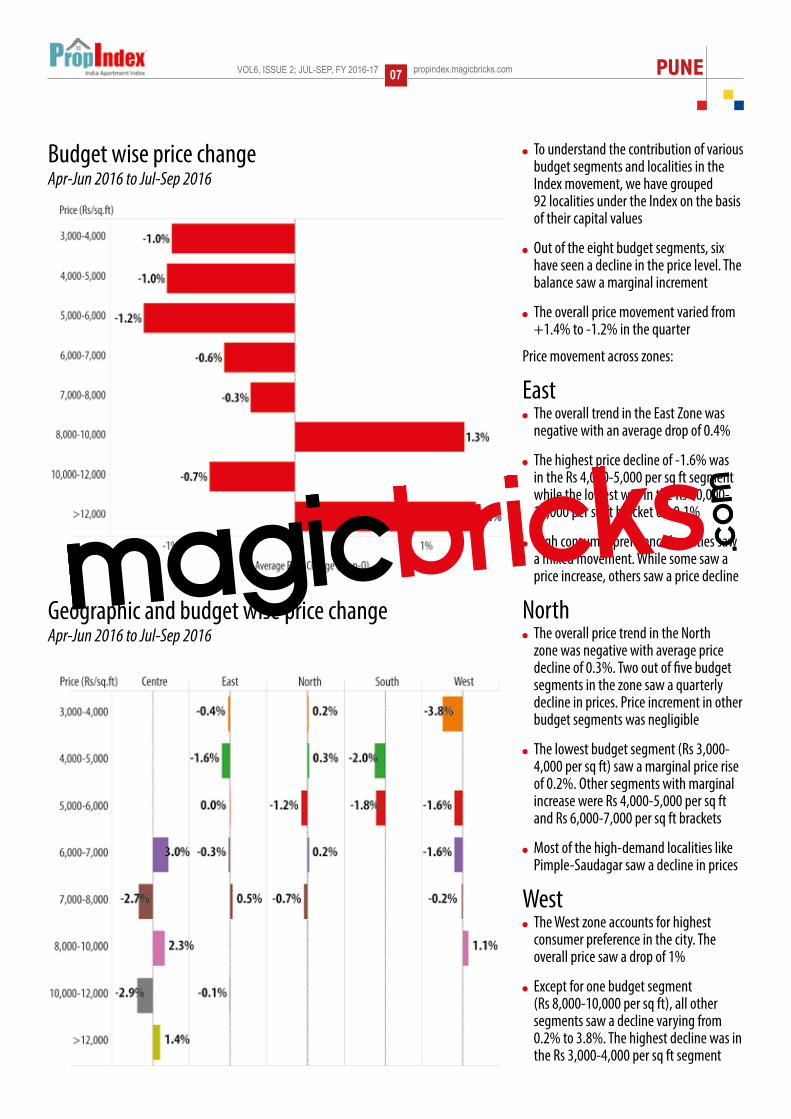
Budget wise price changeApr-Jun 2016 to Jul-Sep 2016
To understand the contribution of various budget segments and localities in the Index movement, we have grouped 92 localities under the Index on the basis of their capital values
Out of the eight budget segments, six have seen a decline in the price level. The balance saw a marginal increment
The overall price movement varied from +1.4% to -1.2% in the quarter
Price movement across zones:
East The overall trend in the East Zone was
negative with an average drop of 0.4%
The highest price decline of -1.6% was in the Rs 4,000-5,000 per sq ft segment while the lowest was in the Rs 10,000- 12,000 per sq ft bracket of -0.1%
High consumer preference localities saw a mixed movement. While some saw a price increase, others saw a price decline
North The overall price trend in the North
zone was negative with average price decline of 0.3%. Two out of five budget segments in the zone saw a quarterly decline in prices. Price increment in other budget segments was negligible
The lowest budget segment (Rs 3,000- 4,000 per sq ft) saw a marginal price rise of 0.2%. Other segments with marginal increase were Rs 4,000-5,000 per sq ft and Rs 6,000-7,000 per sq ft brackets
Most of the high-demand localities like Pimple-Saudagar saw a decline in prices
West The West zone accounts for highest
consumer preference in the city. The overall price saw a drop of 1%
Except for one budget segment (Rs 8,000-10,000 per sq ft), all other segments saw a decline varying from 0.2% to 3.8%. The highest decline was in the Rs 3,000-4,000 per sq ft segment
Geographic and budget wise price changeApr-Jun 2016 to Jul-Sep 2016
PUNE propindex.magicbricks.com VOL6, ISSUE 2; JUL-SEP, FY 2016-1708
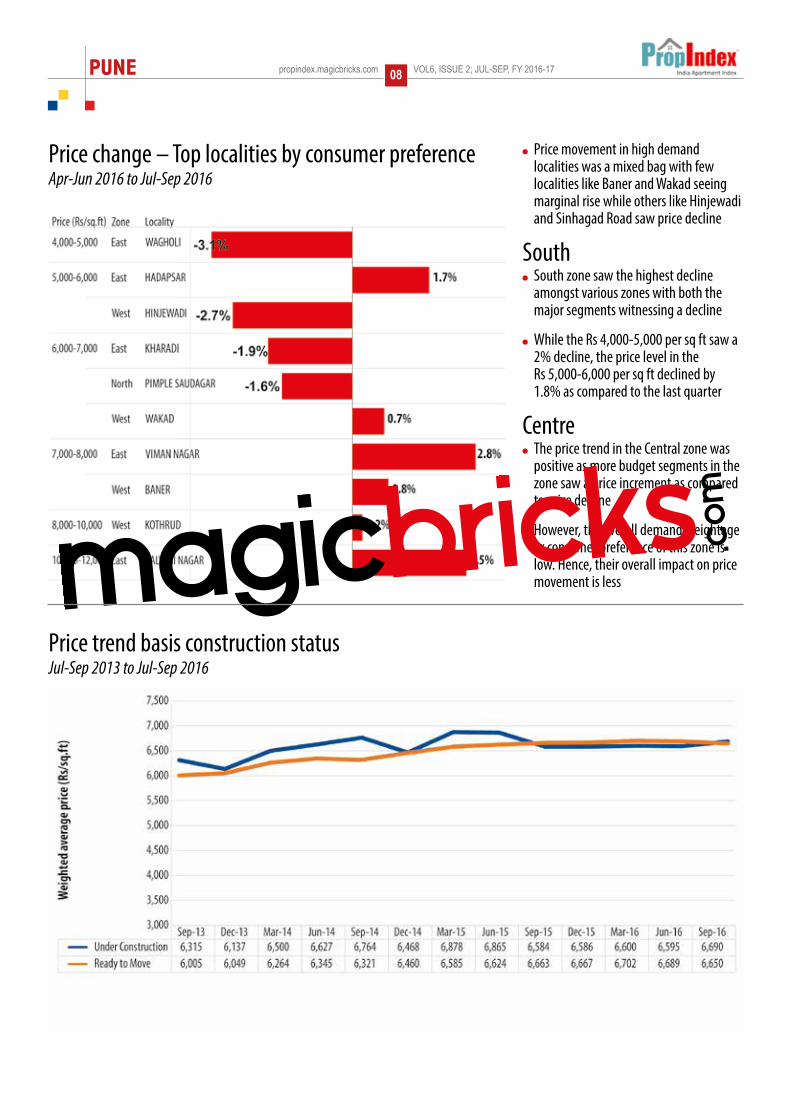
Price movement in high demand localities was a mixed bag with few localities like Baner and Wakad seeing marginal rise while others like Hinjewadi and Sinhagad Road saw price decline
South South zone saw the highest decline
amongst various zones with both the major segments witnessing a decline
While the Rs 4,000-5,000 per sq ft saw a 2% decline, the price level in the Rs 5,000-6,000 per sq ft declined by 1.8% as compared to the last quarter
Centre The price trend in the Central zone was
positive as more budget segments in the zone saw a price increment as compared to price decline
However, the overall demand weightage or consumer preference of this zone is low. Hence, their overall impact on price movement is less
Price change – Top localities by consumer preferenceApr-Jun 2016 to Jul-Sep 2016
Price trend basis construction statusJul-Sep 2013 to Jul-Sep 2016
VOL6, ISSUE 2; JUL-SEP, FY 2016-17 propindex.magicbricks.com PUNE09
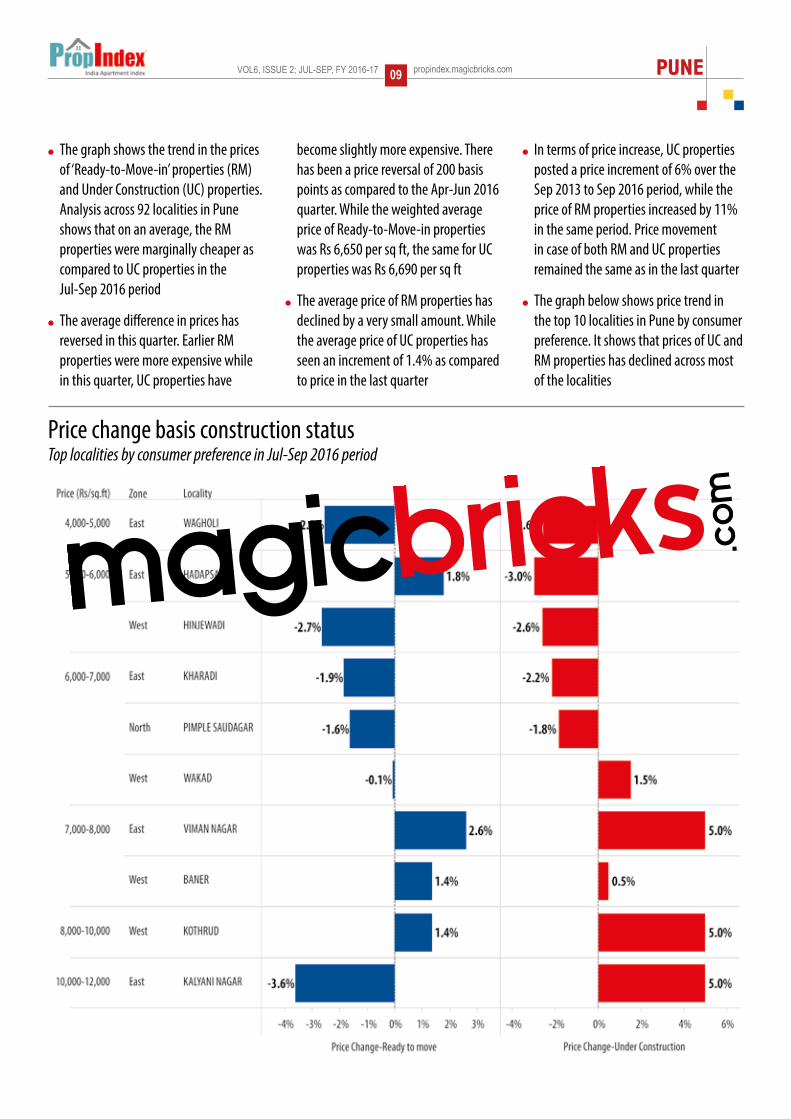
Price change basis construction status Top localities by consumer preference in Jul-Sep 2016 period
The graph shows the trend in the prices of ‘Ready-to-Move-in’ properties (RM) and Under Construction (UC) properties. Analysis across 92 localities in Pune shows that on an average, the RM properties were marginally cheaper as compared to UC properties in the Jul-Sep 2016 period
The average difference in prices has reversed in this quarter. Earlier RM properties were more expensive while in this quarter, UC properties have
become slightly more expensive. There has been a price reversal of 200 basis points as compared to the Apr-Jun 2016 quarter. While the weighted average price of Ready-to-Move-in properties was Rs 6,650 per sq ft, the same for UC properties was Rs 6,690 per sq ft
The average price of RM properties has declined by a very small amount. While the average price of UC properties has seen an increment of 1.4% as compared to price in the last quarter
In terms of price increase, UC properties posted a price increment of 6% over the Sep 2013 to Sep 2016 period, while the price of RM properties increased by 11% in the same period. Price movement in case of both RM and UC properties remained the same as in the last quarter
The graph below shows price trend in the top 10 localities in Pune by consumer preference. It shows that prices of UC and RM properties has declined across most of the localities

PUNE propindex.magicbricks.com VOL6, ISSUE 2; JUL-SEP, FY 2016-1710
Capital values
Aundh 7044-11408 15000-24000 2.5%Balewadi 5767-7986 12000-18000 2.6%Baner 5783-8759 12000-19000 2.6%Baner - Pashan Link Road 6147-8734 13000-20000 2.6%Baner road 5273-8334 12000-19000 2.8%Bavdhan 5417-7713 11000-18000 2.6%Bhosari 4526-6388 10000-15000 2.8%Bibwewadi 5961-9586 13000-19000 2.5%BT Kawade Road 5854-8138 13000-20000 2.9%Chikhali 3909-5666 8000-13000 2.7%Chinchwad 4886-7344 12000-18000 3.00%Dange Chowk 5275-6855 12000-18000 2.8%Dhayari 4100-6413 9000-13000 2.6%Erandwane 9448-15258 18000-25000 2.2%Handewadi Road 4036-5604 9000-13000 2.8%Hinjewadi 4910-6834 11000-18000 2.9%Karve Nagar 6989-10576 14000-22000 2.3%Kaspate Vasti 5420-7194 12000-18000 2.9%Katraj 4250-6746 10000-16000 2.9%Kharadi 5268-7463 13000-19000 3.00%Kondhwa 4229-6706 10000-16000 3.00%Koregaon Park 8306-13816 21000-34000 2.9%Kothrud 7530-11786 15000-23000 2.4%Manjri 4081-6055 10000-16000 2.9%Model Colony 11384-17879 19000-30000 2.00%Moshi 3641-5545 9000-13000 2.8%Narhe 4050-6064 9000-13000 2.7%NIBM Road 5127-7416 11000-17000 2.7%Pashan 5865-8427 12000-20000 2.6%Pashan-Sus Road 5900-8484 13000-19000 2.6%Pimple Gurav 5302-7717 12000-18000 2.9%Pimple Nilakh 5800-8262 13000-20000 2.8%Pimple Saudagar 5889-7802 13000-20000 2.9%Pimpri 5026-7462 12000-16000 2.8%Pimpri Chinchwad 5069-7533 12000-18000 3.00%Prabhat Road 13347-19308 20000-30000 1.9%Rahatni 5418-7229 13000-18000 3.1%Ravet 4738-6645 10000-15000 2.8%Sadashiv Peth 8112-11750 17000-26000 2.6%Satara Road 3849-6541 9000-17000 3.1%Shivaji Nagar 10897-17502 19000-30000 2.00%Sinhagad Road 5035-7840 10000-16000 2.4%Talegaon Dabhade 3143-4660 7000-11000 2.9%Thergaon 5149-7272 12000-17000 2.9%Undri 3976-5944 8000-13000 2.8%Vishal Nagar 5312-7701 13000-19000 3.00%Wagholi 3827-5593 9000-13000 2.8%Wakad 5346-7250 12000-18000 2.9%Wakad-Hinjewadi 5127-7085 12000-18000 2.9%Wanawari 5453-8558 13000-20000 2.8%Warje 5652-8029 12000-17000 2.4%
LOCALITY CAPITAL RENTAL YIELD
Corridor Description and RatingAreas Included: Baner, Balewadi, Pimple Nilakh and Pimple Saudagar
Fig 1: Map of the corridor
BANER - PIMPLE SAUDAGAR
Corridor of growth (COG)13
Properties available in the corridor
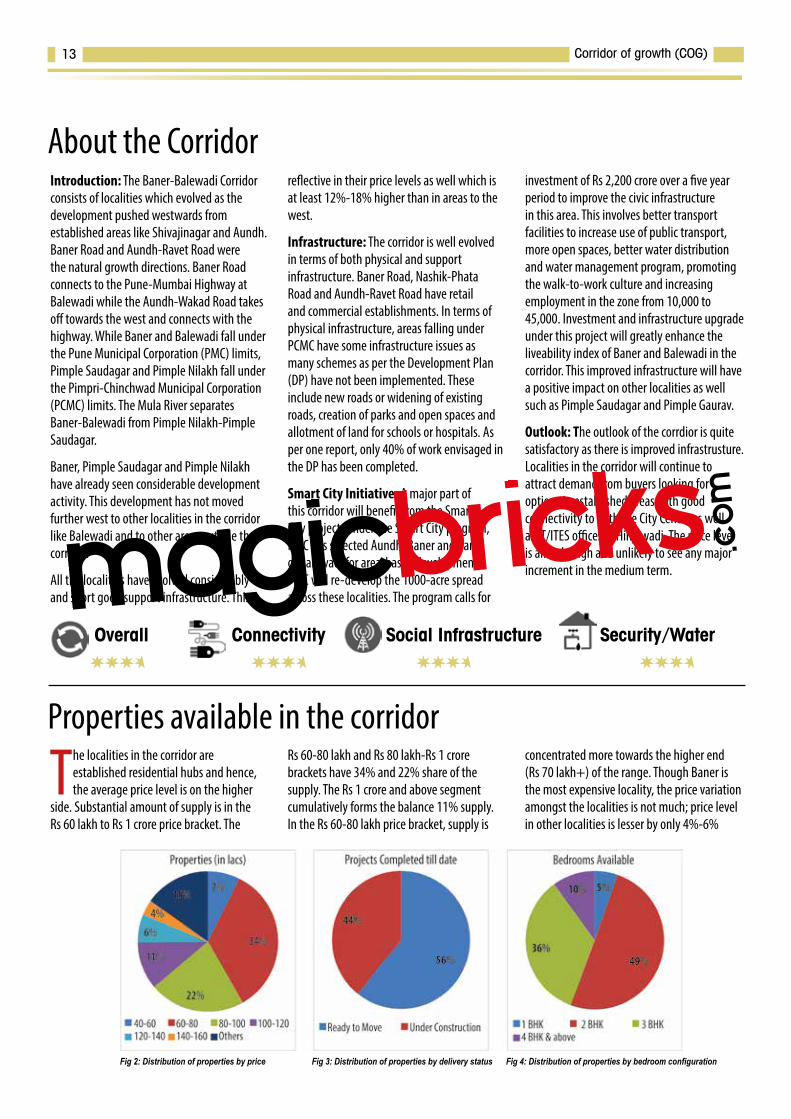
The localities in the corridor are established residential hubs and hence, the average price level is on the higher
side. Substantial amount of supply is in the Rs 60 lakh to Rs 1 crore price bracket. The
Rs 60-80 lakh and Rs 80 lakh-Rs 1 crore brackets have 34% and 22% share of the supply. The Rs 1 crore and above segment cumulatively forms the balance 11% supply. In the Rs 60-80 lakh price bracket, supply is
concentrated more towards the higher end (Rs 70 lakh+) of the range. Though Baner is the most expensive locality, the price variation amongst the localities is not much; price level in other localities is lesser by only 4%-6%
About the CorridorIntroduction: The Baner-Balewadi Corridor consists of localities which evolved as the development pushed westwards from established areas like Shivajinagar and Aundh. Baner Road and Aundh-Ravet Road were the natural growth directions. Baner Road connects to the Pune-Mumbai Highway at Balewadi while the Aundh-Wakad Road takes off towards the west and connects with the highway. While Baner and Balewadi fall under the Pune Municipal Corporation (PMC) limits, Pimple Saudagar and Pimple Nilakh fall under the Pimpri-Chinchwad Municipal Corporation (PCMC) limits. The Mula River separates Baner-Balewadi from Pimple Nilakh-Pimple Saudagar.
Baner, Pimple Saudagar and Pimple Nilakh have already seen considerable development activity. This development has not moved further west to other localities in the corridor like Balewadi and to other areas outside the corridor.
All the localities have evolved considerably and sport good support infrastructure. This is
reflective in their price levels as well which is at least 12%-18% higher than in areas to the west.
Infrastructure: The corridor is well evolved in terms of both physical and support infrastructure. Baner Road, Nashik-Phata Road and Aundh-Ravet Road have retail and commercial establishments. In terms of physical infrastructure, areas falling under PCMC have some infrastructure issues as many schemes as per the Development Plan (DP) have not been implemented. These include new roads or widening of existing roads, creation of parks and open spaces and allotment of land for schools or hospitals. As per one report, only 40% of work envisaged in the DP has been completed.
Smart City Initiative: A major part of this corridor will benefit from the Smart City project. Under the Smart City program, PMC has selected Aundh, Baner and parts of Balewadi for area-based development. PMC will re-develop the 1000-acre spread across these localities. The program calls for
investment of Rs 2,200 crore over a five year period to improve the civic infrastructure in this area. This involves better transport facilities to increase use of public transport, more open spaces, better water distribution and water management program, promoting the walk-to-work culture and increasing employment in the zone from 10,000 to 45,000. Investment and infrastructure upgrade under this project will greatly enhance the liveability index of Baner and Balewadi in the corridor. This improved infrastructure will have a positive impact on other localities as well such as Pimple Saudagar and Pimple Gaurav.
Outlook: The outlook of the corrdior is quite satisfactory as there is improved infrastrusture.Localities in the corridor will continue to attract demand from buyers looking for options in established areas with good connectivity to both the City Center as well as IT/ITES offices in Hinjewadi. The price level is already high and unlikely to see any major increment in the medium term.
Overall Connectivity Social Infrastructure Security/Water
Fig 2: Distribution of properties by price Fig 3: Distribution of properties by delivery status Fig 4: Distribution of properties by bedroom configuration
Corridor of growth (COG)14
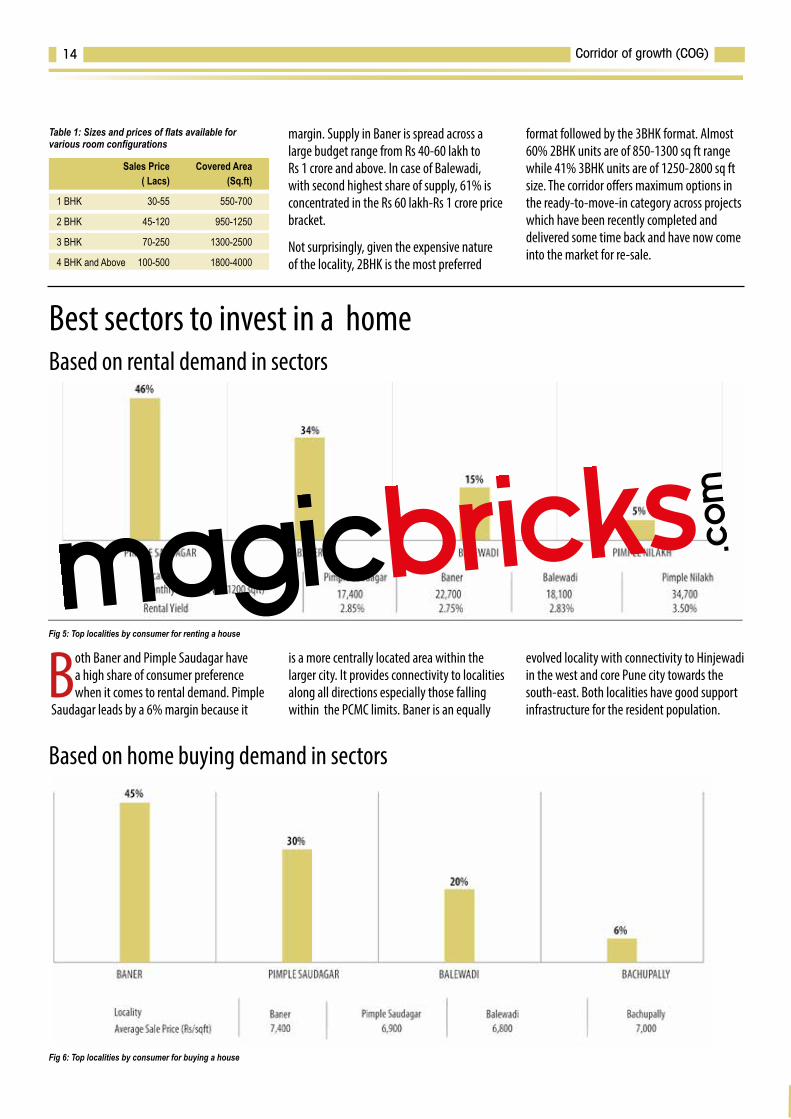
Both Baner and Pimple Saudagar have a high share of consumer preference when it comes to rental demand. Pimple
Saudagar leads by a 6% margin because it
is a more centrally located area within the larger city. It provides connectivity to localities along all directions especially those falling within the PCMC limits. Baner is an equally
evolved locality with connectivity to Hinjewadi in the west and core Pune city towards the south-east. Both localities have good support infrastructure for the resident population.
Sales Price Covered Area ( Lacs) (Sq.ft)
1 BHK 30-55 550-700
2 BHK 45-120 950-1250
3 BHK 70-250 1300-2500
4 BHK and Above 100-500 1800-4000
Best sectors to invest in a home Based on rental demand in sectors
Table 1: Sizes and prices of flats available for various room configurations
Based on home buying demand in sectors
Fig 5: Top localities by consumer for renting a house
Fig 6: Top localities by consumer for buying a house
margin. Supply in Baner is spread across a large budget range from Rs 40-60 lakh to Rs 1 crore and above. In case of Balewadi, with second highest share of supply, 61% is concentrated in the Rs 60 lakh-Rs 1 crore price bracket.
Not surprisingly, given the expensive nature of the locality, 2BHK is the most preferred
format followed by the 3BHK format. Almost 60% 2BHK units are of 850-1300 sq ft range while 41% 3BHK units are of 1250-2800 sq ft size. The corridor offers maximum options in the ready-to-move-in category across projects which have been recently completed and delivered some time back and have now come into the market for re-sale.
Best bedroom configurations to buy Preferred buying and renting options
Buying Renting Total (BHKs) Total (BHKs)
1 BHK 5% 16%
2 BHK 49% 52%
3 BHK 36% 29%
4 BHK and Above 10% 3%
Table 2: Demand distribution for buying and renting
In terms of consumer demand for home purchase, Baner is the most preferred locality in the corridor followed by Pimple
Saudagar. One reason for this change can be
the fact that Baner offers options across a wide budget range. In case of Pimple Saudagar, 86% properties are spread across Rs 40 lakh to Rs 1 crore price bracket. While in case of
Baner, 86% properties are spread across the Rs 20 lakh to Rs 2 crore range. Baner offers wider variety of choices to a consumer and investors are also interested to buy a property here.
Consumers prefer the 2BHK format in the corridor. About 49% consumers are looking for 2BHK units in the Rs
60-80 lakh bracket. In this corridor, the most preferred configurations is the 2BHK units. The demand distribution for buying and renting is also in the 2BHK category. The 3BHK is the second most preferred format but the demand
for it is spread across a wide budget range. Bulk (36%) of it is in the Rs 80 lakh-Rs 1 crore segment. The 3BHK also has the distribution of demand for renting. But, there is limited options for buying and renting in the 1BHK and 4BHK category.
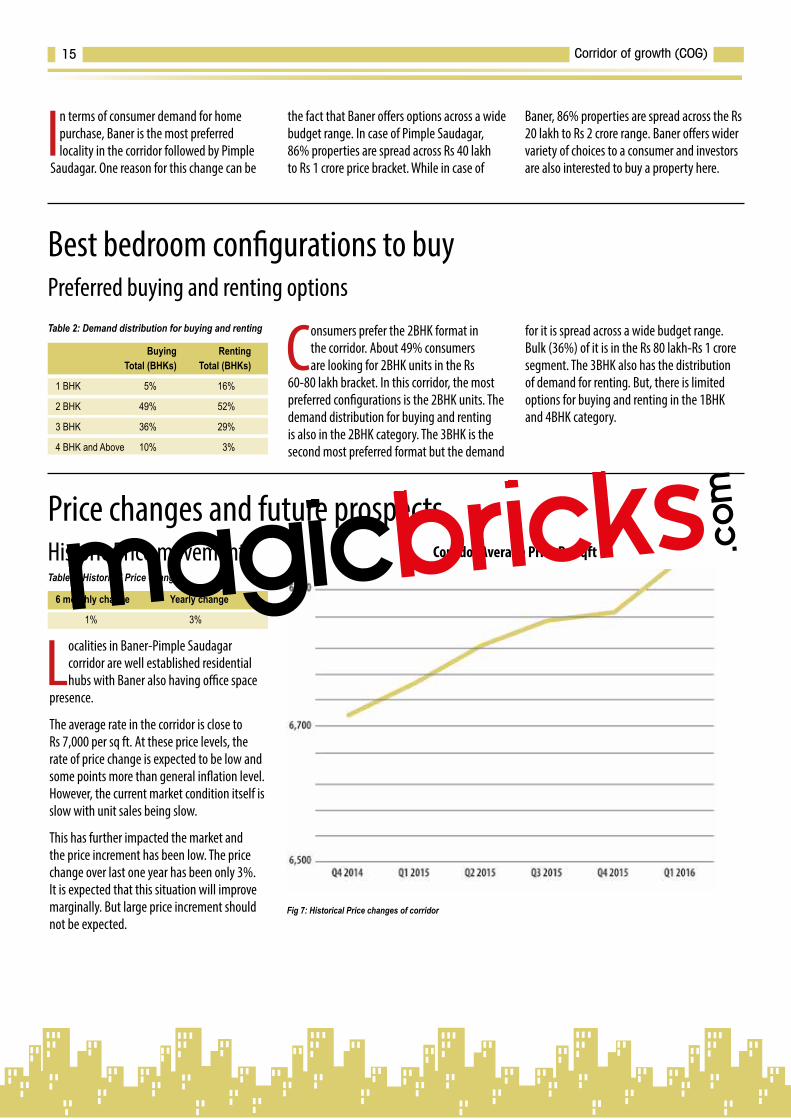
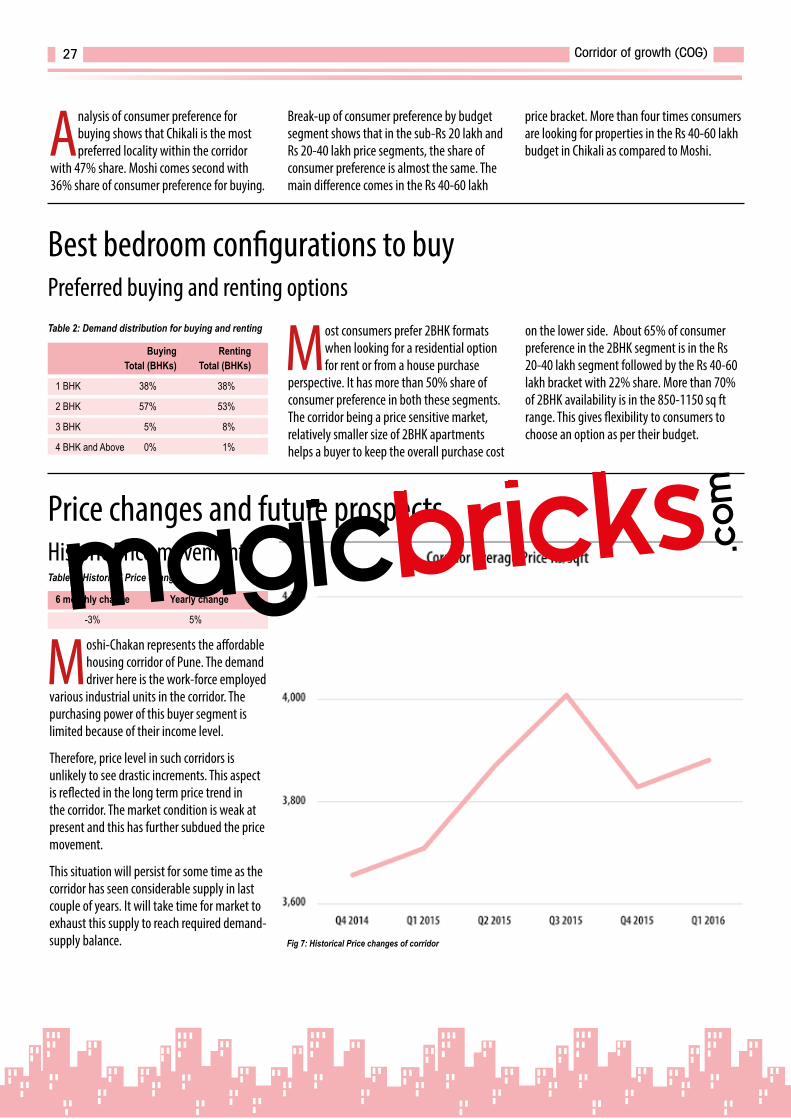
Price changes and future prospects Historic Price movement
6 monthly change Yearly change
1% 3%
Table 3: Historical Price changes
Localities in Baner-Pimple Saudagar corridor are well established residential hubs with Baner also having office space
presence.
The average rate in the corridor is close to Rs 7,000 per sq ft. At these price levels, the rate of price change is expected to be low and some points more than general inflation level. However, the current market condition itself is slow with unit sales being slow.
This has further impacted the market and the price increment has been low. The price change over last one year has been only 3%. It is expected that this situation will improve marginally. But large price increment should not be expected.
Fig 7: Historical Price changes of corridor
Corridor Average Price Rs/sqft
Corridor of growth (COG)15

Price movement for top localities by Consumer Preference
The quarterly price change in each of the localities in the corridor reflects the overall scenario in the corridor. The price change has happened over a narrow range from +2% to -2% with average
increment being 1%. Both localities along the Baner road (Baner and Balewadi) have seen a price drop while other two contiguous localities have seen price increment.
The quarterly price trend in Baner and Balewadi has either seen marginal increase or been stagnant. Drop in this quarter is likely to be temporary price adjustment. Similarly, in case of Pimple Nilakh and Pimple Saudagar, the price trend is in line with prior quarterly price movement. The marginal movement in prices is likely to persist in medium term.Fig 8: Price changes in top localities by consumer demand
Infrastructure UpdatesSmart City Project
Under the Smart City program, PMC has selected Aundh, Baner and parts of Balewadi for area based development and growth. PMC will re-develop the 1000-acre spread across these localities. The program calls for
investment of Rs 2,200 crore over a five year period, which will help in the growth of the corridor.
BRTS Corridor
Sangvi to Kiwale BRTS corridor has become
operational. This improves the north-south connectivity in the corridor. The Wakad-Nashik Phata BRTS is under construction and likely to become operational by 2016-17. This will improve connectivity between localities in the corridor to Wakad and Hinjewadi.
Master PlanBaner and Balewadi fall under the PMC limits while Pimple Saudagar and Pimple Nilakh fall under the PCMC limits. Mahalunge to the
west of Balewadi and across the Pune-Mumbai Highway is one of the 34 villages which have been proposed to be merged with PMC. Most
of the land area under Balewadi and Baner has been earmarked as a residential zone.
Pune’s Pimple Nilakh offers premium properties
Pimple Nilakh is one of the most premium localities situated in the Western side of Pune. Due to its proximity to Aundh, the locality is often called as the ‘New Aundh’. In this locality, the flats or apartments are the most preferred property type. In terms of connectivity, Pimple Nilakh offers easy access to the Mumbai-Pune Expressway and has moderate traffic. In fact, the area is well-connected to the other locations to the city, such as Wakad, Hinjewadi, Baner, Aundh, and Pimple Saudagar.
n Source: Magicbricks Bureau
Pune’s Baner Road is attracting home buyers
There is a potential opportunity in offer for home buyers in Pune’s Baner Road. The area has multiple housing demand drivers that include serenity of location, presence of good social infrastructure, and proximity to the Pune-Mumbai Expressway. The most thriving
IT hub Hinjewadi, and great accessibility to central Pune also helps to boost the housing demand on Baner Road. Buyers can expect new-age amenities in many projects that are being constructed in this locality, which can also a good options for home buyers.
n Source: Magicbricks Bureau
Pimple Saudagar investors rejoice price appreciation
Pimple Saudagar in Pimpri-Chinchwad has emerged to be one of the preferred residential localities. It is strategic location between Baner and Aundh and it is close proximity to the Rajiv Gandhi InfoTech Park located at Hinjewadi increases its demand amongst the IT professionals. Apart from buying, the professionals working nearby are also pushing up the demand for rented accommodation. he Pune International Airport is situated at a distance of 22 km which is easily accessible from the Aundh-Ravet Road.
n Source: Magicbricks Bureau
IN NEWS
Corridor of growth (COG)16
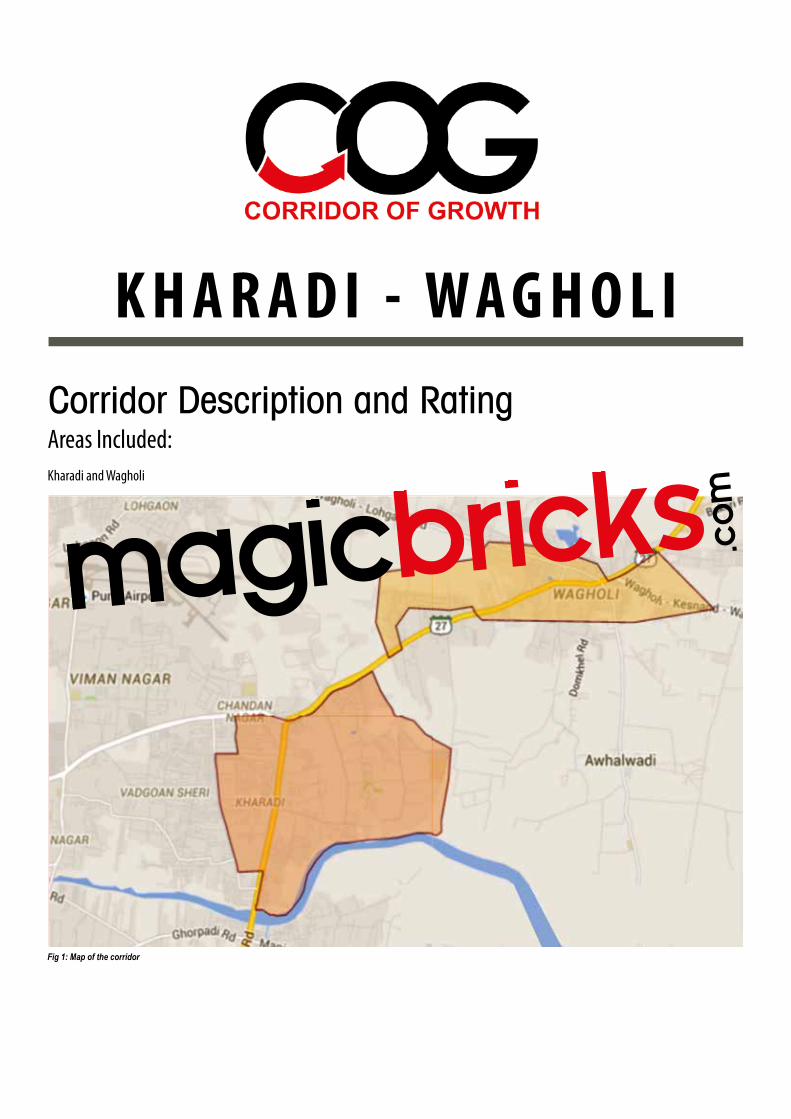
Corridor Description and RatingAreas Included: Kharadi and Wagholi
Fig 1: Map of the corridor
K H A R A D I - W A G H O L I
Corridor of growth (COG)18
The Kharadi-Wagholi Corridor represents the continued outward push of real estate development
along the Pune-Ahmednagar Road (Nagar Road). Kharadi and Wagholi are the two nodes of this corridor. Kharadi is located closer to the established areas along the Pune-Nagar Road while Wagholi is located further east at a distance of approximately 8-km.
The Pune-Nagar Road represents an important growth corridor in the city with substantial office, retail and residential developments. Initial development took place in localities like Yerawada and Kalyani Nagar which were close to established areas of the city. Kalyani Nagar especially benefitted from its proximity and connectivity to Koregaon Park. Over the years, development has moved further along the road with Kharadi and Wagholi emerging as major micro-markets.
In case of Kharadi, an important catalyst was the establishment of the EON Free Zone, which is an IT/ITES Sector Special Economic Zone (SEZ). It is spread across 45-acre land with leasing space of 4.5 million sq ft. Establishment of this SEZ gave the locality visibility and demand for residential and support retail spaces. Part of the World Trade Center, with total leasing capacity of 1.6 million sq ft, is also operational in this locality. Panchshil Realty, developers of EON Free Zone, will also be developing a new IT SEZ in the locality spread across 15-acre which will add further 2 million sq ft office space. Another deal has been recently signed between K Raheja Corp and Gera Developers to develop an IT SEZ under the Gera Commerzone Banner which will have 3.5 million sq ft of leasable space.
Today, Kharadi sits in the middle of the Nagar Road–Kharadi-Hadapsar IT/ITES Corridor which has considerable development in this segment.
Development Pattern KharadiKharadi is the last village along the Nagar Road which falls under the Pune Municipal Corporation (PMC) limits. Residential development in this locality runs in the north-south direction along three roads which run parallel to each other. All three roads connect to Nagar Road.
First is the Magarpatta Road which connects Kharadi to Mundhwa and Hadapsar in the south across the Mula-Mutha River. Hadapsar is one of the major IT/ITES office space clusters in Pune. There is considerable residential, retail and other commercial developments on both sides of this road. It is the main high street of the locality.
Other developments are along Fountain Road and Grant Road where currently, most of the development is along the former. There are large multi-storey apartment projects by various developers here. The World Trade Center and EON Free Zone and other office space projects are also situated at the southern end of the Fountain Road or off this road.
As per the Master Plan, most of the land in Kharadi has been marked as a residential zone. It also has land reserved for development of software parks as well as social amenities like schools and hospitals.
WagholiWith rising land prices, limited space for fresh development in Kharadi and land on the other side of the Nagar Road falling under the Defence or restricted development zone, the development has moved further along the Nagar Road to Wagholi. It has large land parcels available for new projects. However, Wagholi falls outside the PMC limits. Most projects rely on ground water as the PMC water connections are not available.
Development in Wagholi is taking place along three existing roads which emanate from it. These are the Wagholi-Lohgaon Road, Wagholi-Kesnand Road and Bakori Road. There are residential projects on either side of these roads. Except for Lohgaon-Wagholi Road, the other two are narrow though none of them have grade dividers.
Present ScenarioKharadi and Wagholi rank amongst the top 5 localities in Pune in terms of supply and demand for residential options. Wagholi is at the third place followed by Kharadi at the fifth spot.
Most (31%) of the supply in Kharadi is in the Rs 60-80 lakh budget segment followed by the Rs 80 lakh-Rs 1 crore segment (21%). The 2BHK is the dominant format and constitutes 50% of the supply with an average saleable area of 1130 sq ft. The average price in the area is Rs 6,475 per sq ft.
Supply of 1BHK apartments is low with only 7% share. Analysis of consumer preference shows that 34% consumers are looking for options in the Rs 60-80 lakh budget segment
About the Corridor
Corridor of growth (COG)19
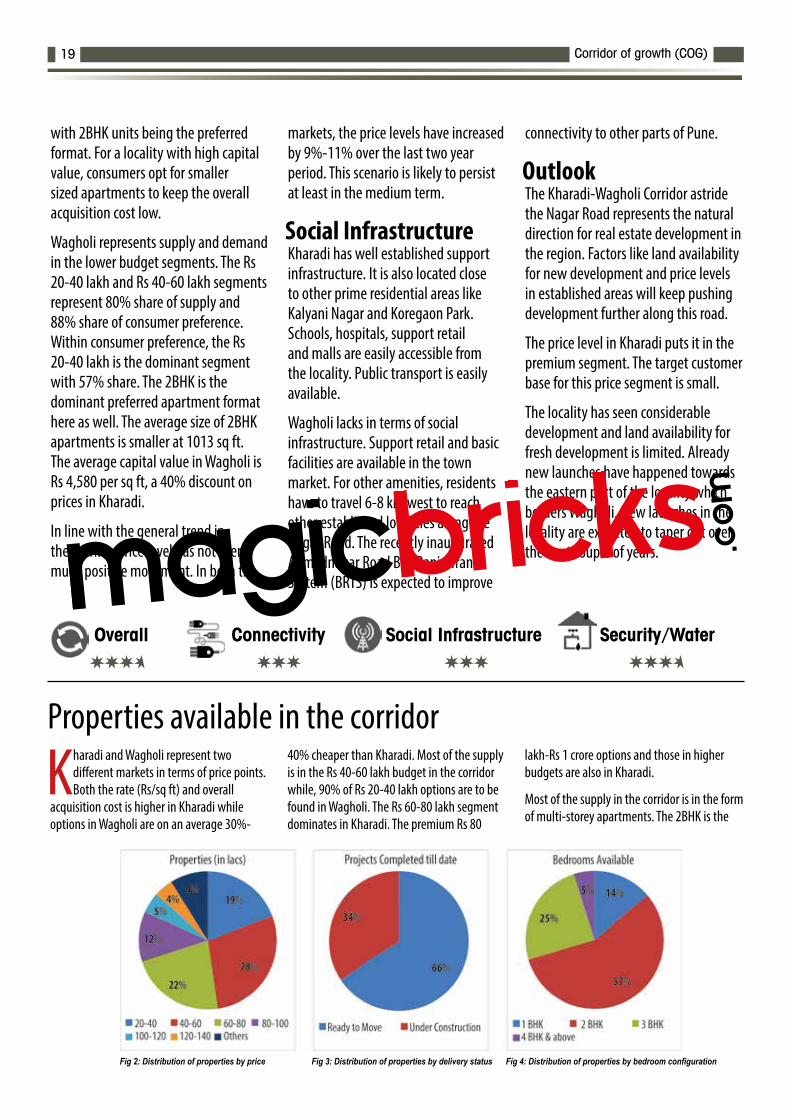
Properties available in the corridor
Kharadi and Wagholi represent two different markets in terms of price points. Both the rate (Rs/sq ft) and overall
acquisition cost is higher in Kharadi while options in Wagholi are on an average 30%-
40% cheaper than Kharadi. Most of the supply is in the Rs 40-60 lakh budget in the corridor while, 90% of Rs 20-40 lakh options are to be found in Wagholi. The Rs 60-80 lakh segment dominates in Kharadi. The premium Rs 80
lakh-Rs 1 crore options and those in higher budgets are also in Kharadi.
Most of the supply in the corridor is in the form of multi-storey apartments. The 2BHK is the
Overall Connectivity Social Infrastructure Security/Water
Fig 2: Distribution of properties by price Fig 3: Distribution of properties by delivery status Fig 4: Distribution of properties by bedroom configuration
with 2BHK units being the preferred format. For a locality with high capital value, consumers opt for smaller sized apartments to keep the overall acquisition cost low.
Wagholi represents supply and demand in the lower budget segments. The Rs 20-40 lakh and Rs 40-60 lakh segments represent 80% share of supply and 88% share of consumer preference. Within consumer preference, the Rs 20-40 lakh is the dominant segment with 57% share. The 2BHK is the dominant preferred apartment format here as well. The average size of 2BHK apartments is smaller at 1013 sq ft. The average capital value in Wagholi is Rs 4,580 per sq ft, a 40% discount on prices in Kharadi.
In line with the general trend in the market, price level has not seen much positive movement. In both the
markets, the price levels have increased by 9%-11% over the last two year period. This scenario is likely to persist at least in the medium term.
Social InfrastructureKharadi has well established support infrastructure. It is also located close to other prime residential areas like Kalyani Nagar and Koregaon Park. Schools, hospitals, support retail and malls are easily accessible from the locality. Public transport is easily available.
Wagholi lacks in terms of social infrastructure. Support retail and basic facilities are available in the town market. For other amenities, residents have to travel 6-8 km west to reach other established localities along the Nagar Road. The recently inaugurated Ahmednagar Road Bus Rapid Transit System (BRTS) is expected to improve
connectivity to other parts of Pune.
OutlookThe Kharadi-Wagholi Corridor astride the Nagar Road represents the natural direction for real estate development in the region. Factors like land availability for new development and price levels in established areas will keep pushing development further along this road.
The price level in Kharadi puts it in the premium segment. The target customer base for this price segment is small.
The locality has seen considerable development and land availability for fresh development is limited. Already new launches have happened towards the eastern part of the locality which borders Wagholi. New launches in the locality are expected to taper out over the next couple of years.
Corridor of growth (COG)20
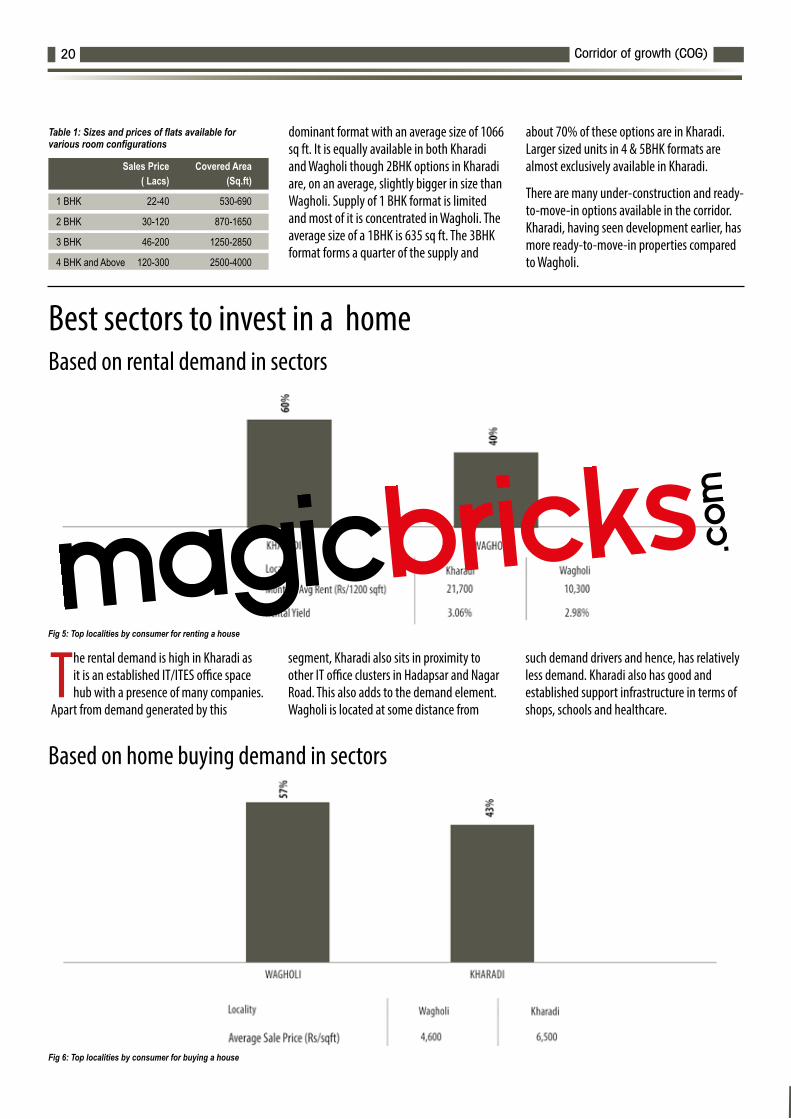
The rental demand is high in Kharadi as it is an established IT/ITES office space hub with a presence of many companies.
Apart from demand generated by this
segment, Kharadi also sits in proximity to other IT office clusters in Hadapsar and Nagar Road. This also adds to the demand element. Wagholi is located at some distance from
such demand drivers and hence, has relatively less demand. Kharadi also has good and established support infrastructure in terms of shops, schools and healthcare.
dominant format with an average size of 1066 sq ft. It is equally available in both Kharadi and Wagholi though 2BHK options in Kharadi are, on an average, slightly bigger in size than Wagholi. Supply of 1 BHK format is limited and most of it is concentrated in Wagholi. The average size of a 1BHK is 635 sq ft. The 3BHK format forms a quarter of the supply and
about 70% of these options are in Kharadi. Larger sized units in 4 & 5BHK formats are almost exclusively available in Kharadi.
There are many under-construction and ready-to-move-in options available in the corridor. Kharadi, having seen development earlier, has more ready-to-move-in properties compared to Wagholi.
Sales Price Covered Area ( Lacs) (Sq.ft)
1 BHK 22-40 530-690
2 BHK 30-120 870-1650
3 BHK 46-200 1250-2850
4 BHK and Above 120-300 2500-4000
Best sectors to invest in a home Based on rental demand in sectors
Table 1: Sizes and prices of flats available for various room configurations
Based on home buying demand in sectors
Fig 5: Top localities by consumer for renting a house
Fig 6: Top localities by consumer for buying a house
Best bedroom configurations to buy Preferred buying and renting options
Buying Renting Total (BHKs) Total (BHKs)
1 BHK 14% 20%
2 BHK 56% 55%
3 BHK 25% 22%
4 BHK and Above 5% 3%
Table 2: Demand distribution for buying and renting
Buying demand is inverse of rental demand in terms of price (Rs/sq ft) and total purchase price (Rs Lakh), Wagholi is
much cheaper than Kharadi. Wagholi attracts
demand from buyers looking for residential options on the Nagar Road but who cannot afford options in the more established localities along this road. Kharadi sits in the
middle of an IT/ITES office corridor comprising of Nagar Road-Kharadi-Hadapsar and offers good options to the work force employed in this corridor.
Both in terms of rent and house purchase perspective, 2BHK is the dominant segment. It has more than 50% share
of consumer preference as rent or purchase options. This can be explained by the fact that relatively smaller size of 2BHK apartments help a buyer to keep the overall purchase cost on the lower side. The average 2BHK
apartment in the corridor is 1066 sq ft in size while a 3BHK apartment is about 1700 sq ft. For the same price, a 3BHK apartment is 59% more expensive than the 2BHK option. Preference for 3BHK and higher formats is predominantly in Kharadi while more consumers are looking for 1BHK units in Wagholi.
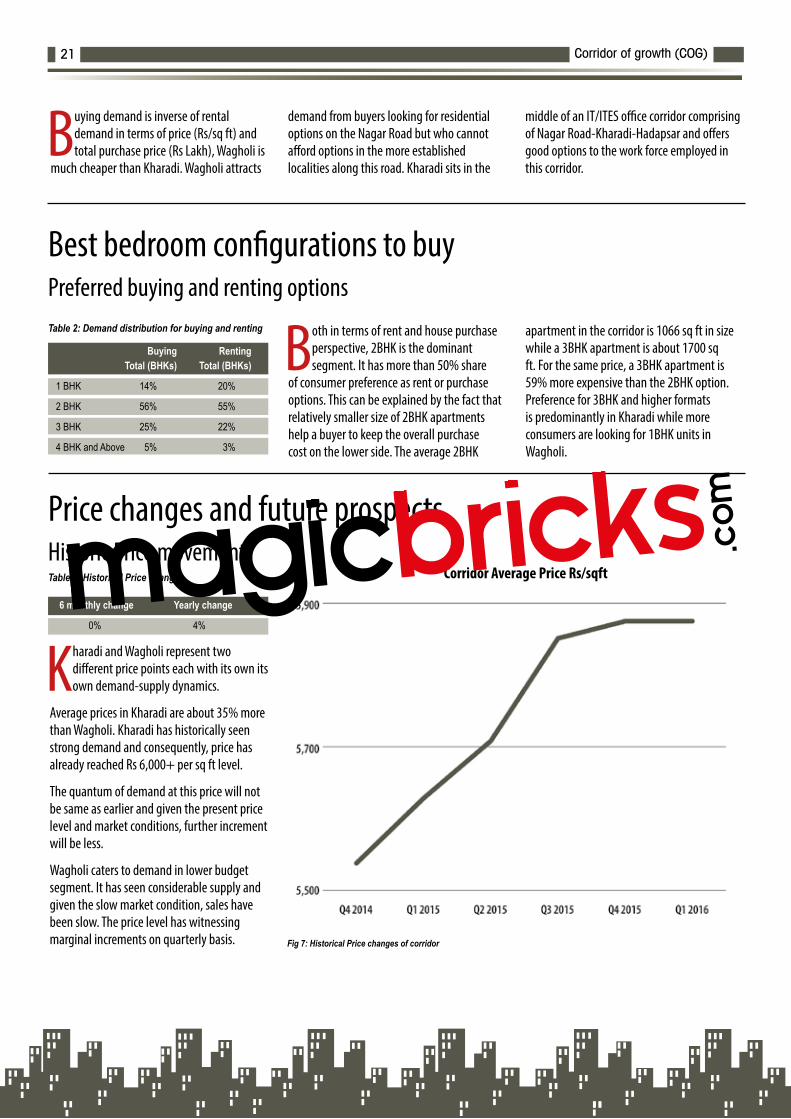
Price changes and future prospects Historic Price movement Table 3: Historical Price changes
Kharadi and Wagholi represent two different price points each with its own its own demand-supply dynamics.
Average prices in Kharadi are about 35% more than Wagholi. Kharadi has historically seen strong demand and consequently, price has already reached Rs 6,000+ per sq ft level.
The quantum of demand at this price will not be same as earlier and given the present price level and market conditions, further increment will be less.
Wagholi caters to demand in lower budget segment. It has seen considerable supply and given the slow market condition, sales have been slow. The price level has witnessing marginal increments on quarterly basis. Fig 7: Historical Price changes of corridor
6 monthly change Yearly change
0% 4%
Corridor Average Price Rs/sqft
Corridor of growth (COG)21

Price movement for top localities by Consumer Preference
The quarterly price change in each of the localities in the corridor reflects the overall scenario in the corridor. The price level in each locality has seen marginal increment over last quarter with both
localities witnessing price increase of under 2%.
This trend of marginal price increment has persisted over last few quarters. While high price level in Kharadi works impacts demand, the large inventory in Wagholi and price sensitivity of its target consumer base keeps the price level stable or with minimum movement. Both Kharadi and Wagholi today are buyers’ market where consumers can negotiate good discount or avail attractive incentives.
Fig 8: Price changes in top localities by consumer demand
Infrastructure UpdatesBus Rapid Transit System
Master PlanKharadi is the last village along the Nagar Road which falls under the PMC limits. Most of the land is reserved for residential
development with other land use being support infrastructure like schools, hospitals and public institutions. It also has area for
development of software parks. Wagholi falls outside the PMC limits and this impacts the development of infrastructure in the area.
Kharadi: A growth story
Kharadi is a preferred location for residential projects. It is a rapidly growing area, which is based on the eastern corridor of Pune with a steady growth over the last three to four years. The area has seen tremendous growth both in social and physical infrastructure. Many software professionals prefer to stay in the location due to quality home availability. The area has undergone a massive image makeover due to economic development along the Nagar Road belt. The neighbourhood of Kharadi comprises areas like Magarpatta City, Hadapsar, Wagholi, Viman Nagar, Kalyani Nagar and Koregaon Park.
n Source: The Times of India
Kharadi, IT professionals’ preferred choice for housing
Kharadi is one of those locations in Pune where IT professionals are working. The presence of several small IT parks has created a robust job market in this part of Pune and is providing potential employment opportunties here. Kharadi’s biggest drivers are its IT presence as well as good connectivity to the airport, railway station, Nagar Road,
the CBD nexus of Bund Garden Road, Koregaon Park, Dhole Patil Road, Kalyani Nagar and Sholapur Road. In addition, it is flanked by industrial zones of Sanaswadi, Ranjangaon and Hadapsar. People and professionals are choosing this location because it is providing housing at a reasonable price.
n Source: Magicbricks Bureau
Wagholi have good projects in its kitty
Wagholi has ample of ready-to-move-in properties available that suit every budget. The area is one of the fast developing localities and has a land bank for development as compared to other developed localities of East Pune. With IT hub located nearby in Kharadi, it is seeing a constant demand for property. Wagholi is strategically located on the Pune-Nagar Highway. The area offers good connectivity via Nagar Road, which has now been widened. Moreover, Khandala Loni Road connects the locality to other parts of the city. The area also has good connectivity and potential infrastructure for growth.
n Source: Magicbricks Bureau
IN NEWS
l A Bus Rapid Transit System (BRTS) has been established on the Nagar Road known as Ahmednagar Road BRTS
l The terminus for this BRTS is at Wagholi and it connects the locality to other localities in Pune
Corridor of growth (COG)22

Corridor Description and RatingAreas Included: Moshi, Chakan and Chikali
Fig 1: Map of the corridor
M O S H I - C H A K A N
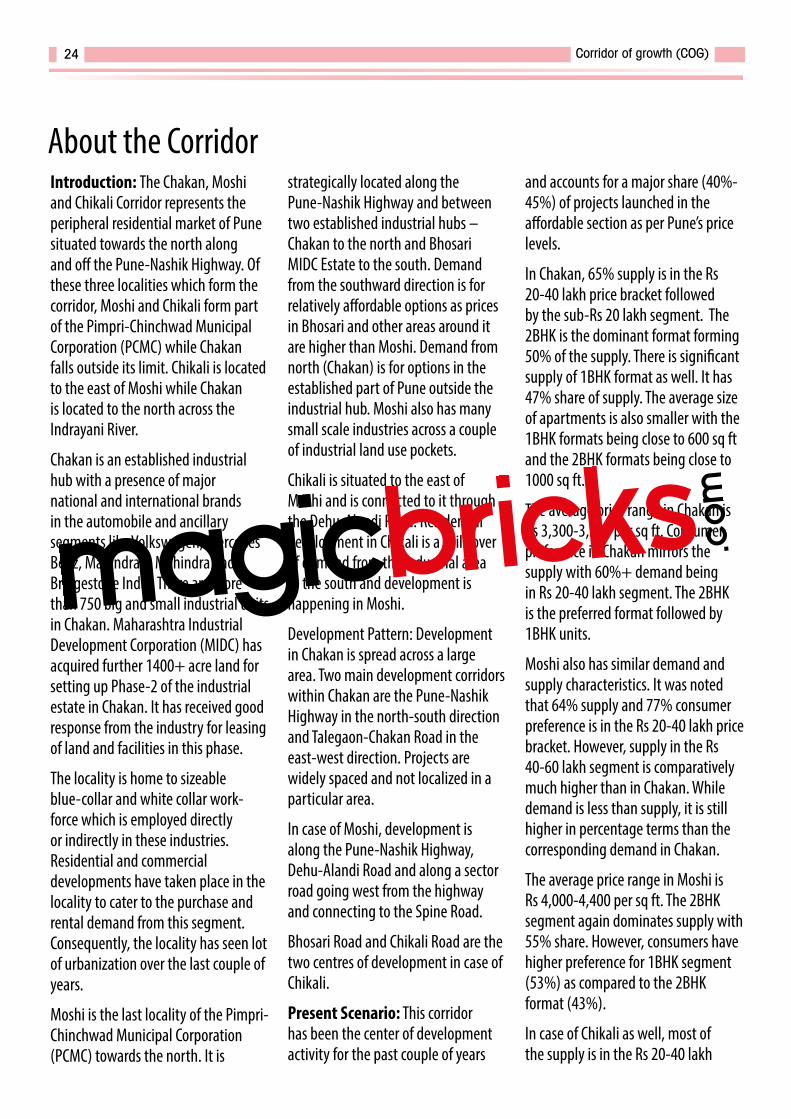
Introduction: The Chakan, Moshi and Chikali Corridor represents the peripheral residential market of Pune situated towards the north along and off the Pune-Nashik Highway. Of these three localities which form the corridor, Moshi and Chikali form part of the Pimpri-Chinchwad Municipal Corporation (PCMC) while Chakan falls outside its limit. Chikali is located to the east of Moshi while Chakan is located to the north across the Indrayani River.
Chakan is an established industrial hub with a presence of major national and international brands in the automobile and ancillary segments like Volkswagen, Mercedes Benz, Mahindra & Mahindra and Bridgestone India. There are more than 750 big and small industrial units in Chakan. Maharashtra Industrial Development Corporation (MIDC) has acquired further 1400+ acre land for setting up Phase-2 of the industrial estate in Chakan. It has received good response from the industry for leasing of land and facilities in this phase.
The locality is home to sizeable blue-collar and white collar work-force which is employed directly or indirectly in these industries. Residential and commercial developments have taken place in the locality to cater to the purchase and rental demand from this segment. Consequently, the locality has seen lot of urbanization over the last couple of years.
Moshi is the last locality of the Pimpri-Chinchwad Municipal Corporation (PCMC) towards the north. It is
strategically located along the Pune-Nashik Highway and between two established industrial hubs – Chakan to the north and Bhosari MIDC Estate to the south. Demand from the southward direction is for relatively affordable options as prices in Bhosari and other areas around it are higher than Moshi. Demand from north (Chakan) is for options in the established part of Pune outside the industrial hub. Moshi also has many small scale industries across a couple of industrial land use pockets.
Chikali is situated to the east of Moshi and is connected to it through the Dehu-Alandi Road. Residential development in Chikali is a spill-over of demand from the industrial area to the south and development is happening in Moshi.
Development Pattern: Development in Chakan is spread across a large area. Two main development corridors within Chakan are the Pune-Nashik Highway in the north-south direction and Talegaon-Chakan Road in the east-west direction. Projects are widely spaced and not localized in a particular area.
In case of Moshi, development is along the Pune-Nashik Highway, Dehu-Alandi Road and along a sector road going west from the highway and connecting to the Spine Road.
Bhosari Road and Chikali Road are the two centres of development in case of Chikali.
Present Scenario: This corridor has been the center of development activity for the past couple of years
and accounts for a major share (40%-45%) of projects launched in the affordable section as per Pune’s price levels.
In Chakan, 65% supply is in the Rs 20-40 lakh price bracket followed by the sub-Rs 20 lakh segment. The 2BHK is the dominant format forming 50% of the supply. There is significant supply of 1BHK format as well. It has 47% share of supply. The average size of apartments is also smaller with the 1BHK formats being close to 600 sq ft and the 2BHK formats being close to 1000 sq ft.
The average price range in Chakan is Rs 3,300-3,500 per sq ft. Consumer preference in Chakan mirrors the supply with 60%+ demand being in Rs 20-40 lakh segment. The 2BHK is the preferred format followed by 1BHK units.
Moshi also has similar demand and supply characteristics. It was noted that 64% supply and 77% consumer preference is in the Rs 20-40 lakh price bracket. However, supply in the Rs 40-60 lakh segment is comparatively much higher than in Chakan. While demand is less than supply, it is still higher in percentage terms than the corresponding demand in Chakan.
The average price range in Moshi is Rs 4,000-4,400 per sq ft. The 2BHK segment again dominates supply with 55% share. However, consumers have higher preference for 1BHK segment (53%) as compared to the 2BHK format (43%).
In case of Chikali as well, most of the supply is in the Rs 20-40 lakh
About the Corridor
Corridor of growth (COG)24

Properties available in the corridor
The corridor represents the affordable housing market of Pune and this is reflected in the distribution of supply
by budget segments. Most of the supply is in Rs 20-40 lakh segment followed by a much
smaller share of Rs 40-60 lakh price bracket. Chakan, Moshi and the area to the south of Moshi forms an industrial belt with a large number of industries. Employees working in the industries in this belt are the main
demand drivers for the residential segment. However, the purchasing power of these industrial employees is less as compared to those in the IT/ITES sector. This is the reason why most of the supply is in the lower budget
Fig 2: Distribution of properties by price Fig 3: Distribution of properties by delivery status Fig 4: Distribution of properties by bedroom configuration
Corridor of growth (COG)25
bracket. Supply and demand in terms of BHK format also follows the same pattern. Apartments of 2BHK form 69% of supply and 77% of consumer preference.
The average price range in Chikali is Rs 4,000-4,300 per sq ft.
Both supply and demand parameters highlight the affordable nature of the real estate in this locality of the corridor.
Amongst the three localities, Moshi has seen relatively better price gain of 17% over the last two years. Whereas, Chakan and Chikali witnessed an price increment of 5% and 9% respectively, between March 2014 to March 2016
Social Infrastructure: Social infrastructure in the form of support retail and primary healthcare facilities
exists in all the three localities of the corridor. Chakan is more self-sustaining than the other localities and has facilities required to meet the need of the socio-economic profile of its population, though schools are available in limited numbers.
Outlook: Considerable development activity has taken place in the corridor over the last two years. Given the slow market conditions, there is unsold stock in the market. This will take some time to clear. Further, the market has evolved against demand from blue-collar workforce. The purchasing power of white-collar workers employed in the industrial sector would also be on the lower side and cannot be compared with those in other sectors like IT/ITES or BFSI sectors (Banking, Financial Services or Insurance).
Therefore, this will remain a price sensitive market and scope of major price gains is low. Reason being, if the prices rise too high and too fast, the real estate will go out of the affordability of its main demand segment.
There is a possibility that the new International Airport in Pune might come up in a location towards the north-west of Chakan in the general area of the Bhama-Askhed Dam. Once in operation this will help in improving the connectivity.
If this happens, it will lead to up-gradation of infrastructure as connectivity to Pune city and airport is improved. However, there is no clarity on the way forward at present on this aspect.
Overall Connectivity Social Infrastructure Security/Water
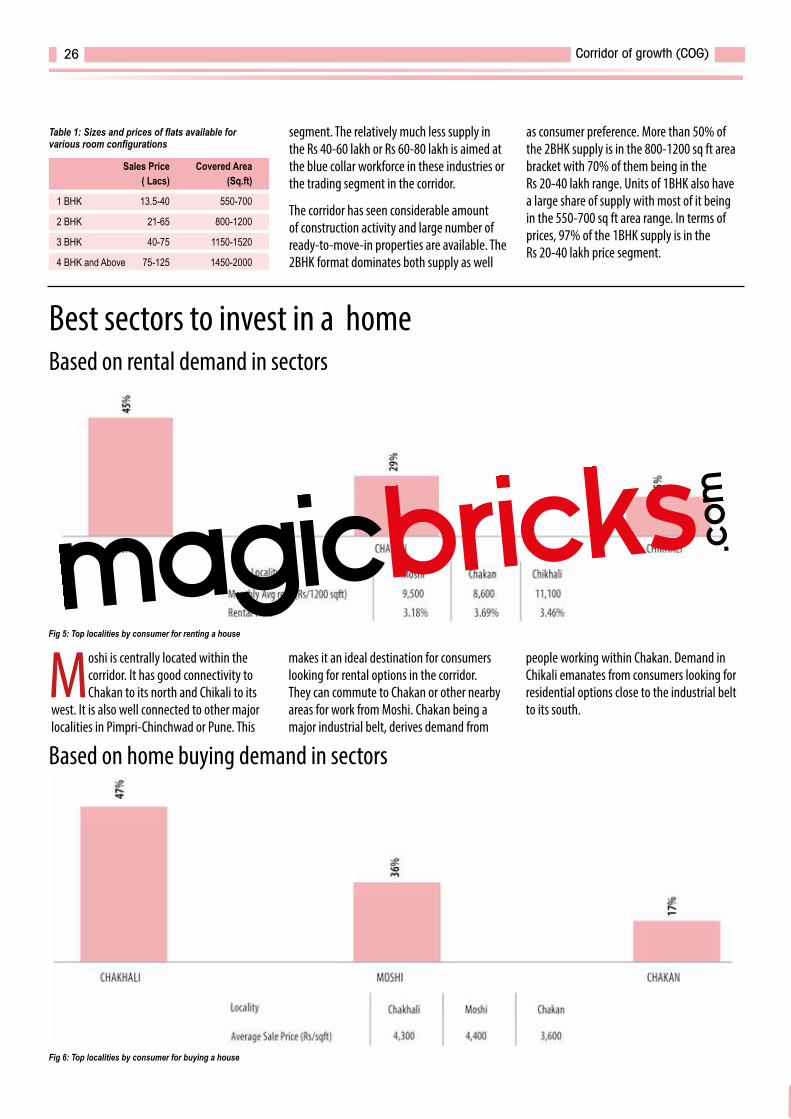
Moshi is centrally located within the corridor. It has good connectivity to Chakan to its north and Chikali to its
west. It is also well connected to other major localities in Pimpri-Chinchwad or Pune. This
makes it an ideal destination for consumers looking for rental options in the corridor. They can commute to Chakan or other nearby areas for work from Moshi. Chakan being a major industrial belt, derives demand from
people working within Chakan. Demand in Chikali emanates from consumers looking for residential options close to the industrial belt to its south.
segment. The relatively much less supply in the Rs 40-60 lakh or Rs 60-80 lakh is aimed at the blue collar workforce in these industries or the trading segment in the corridor.
The corridor has seen considerable amount of construction activity and large number of ready-to-move-in properties are available. The 2BHK format dominates both supply as well
as consumer preference. More than 50% of the 2BHK supply is in the 800-1200 sq ft area bracket with 70% of them being in the Rs 20-40 lakh range. Units of 1BHK also have a large share of supply with most of it being in the 550-700 sq ft area range. In terms of prices, 97% of the 1BHK supply is in the Rs 20-40 lakh price segment.
Sales Price Covered Area ( Lacs) (Sq.ft)
1 BHK 13.5-40 550-700
2 BHK 21-65 800-1200
3 BHK 40-75 1150-1520
4 BHK and Above 75-125 1450-2000
Best sectors to invest in a home Based on rental demand in sectors
Table 1: Sizes and prices of flats available for various room configurations
Based on home buying demand in sectors
Fig 5: Top localities by consumer for renting a house
Fig 6: Top localities by consumer for buying a house
Corridor of growth (COG)26
Best bedroom configurations to buy Preferred buying and renting options
Buying Renting Total (BHKs) Total (BHKs)
1 BHK 38% 38%
2 BHK 57% 53%
3 BHK 5% 8%
4 BHK and Above 0% 1%
Table 2: Demand distribution for buying and renting
Analysis of consumer preference for buying shows that Chikali is the most preferred locality within the corridor
with 47% share. Moshi comes second with 36% share of consumer preference for buying.
Break-up of consumer preference by budget segment shows that in the sub-Rs 20 lakh and Rs 20-40 lakh price segments, the share of consumer preference is almost the same. The main difference comes in the Rs 40-60 lakh
price bracket. More than four times consumers are looking for properties in the Rs 40-60 lakh budget in Chikali as compared to Moshi.
Most consumers prefer 2BHK formats when looking for a residential option for rent or from a house purchase
perspective. It has more than 50% share of consumer preference in both these segments. The corridor being a price sensitive market, relatively smaller size of 2BHK apartments helps a buyer to keep the overall purchase cost
on the lower side. About 65% of consumer preference in the 2BHK segment is in the Rs 20-40 lakh segment followed by the Rs 40-60 lakh bracket with 22% share. More than 70% of 2BHK availability is in the 850-1150 sq ft range. This gives flexibility to consumers to choose an option as per their budget.
Price changes and future prospects Historic Price movement Table 3: Historical Price changes
Moshi-Chakan represents the affordable housing corridor of Pune. The demand driver here is the work-force employed
various industrial units in the corridor. The purchasing power of this buyer segment is limited because of their income level.
Therefore, price level in such corridors is unlikely to see drastic increments. This aspect is reflected in the long term price trend in the corridor. The market condition is weak at present and this has further subdued the price movement.
This situation will persist for some time as the corridor has seen considerable supply in last couple of years. It will take time for market to exhaust this supply to reach required demand-supply balance. Fig 7: Historical Price changes of corridor
6 monthly change Yearly change
-3% 5%
Corridor of growth (COG)27
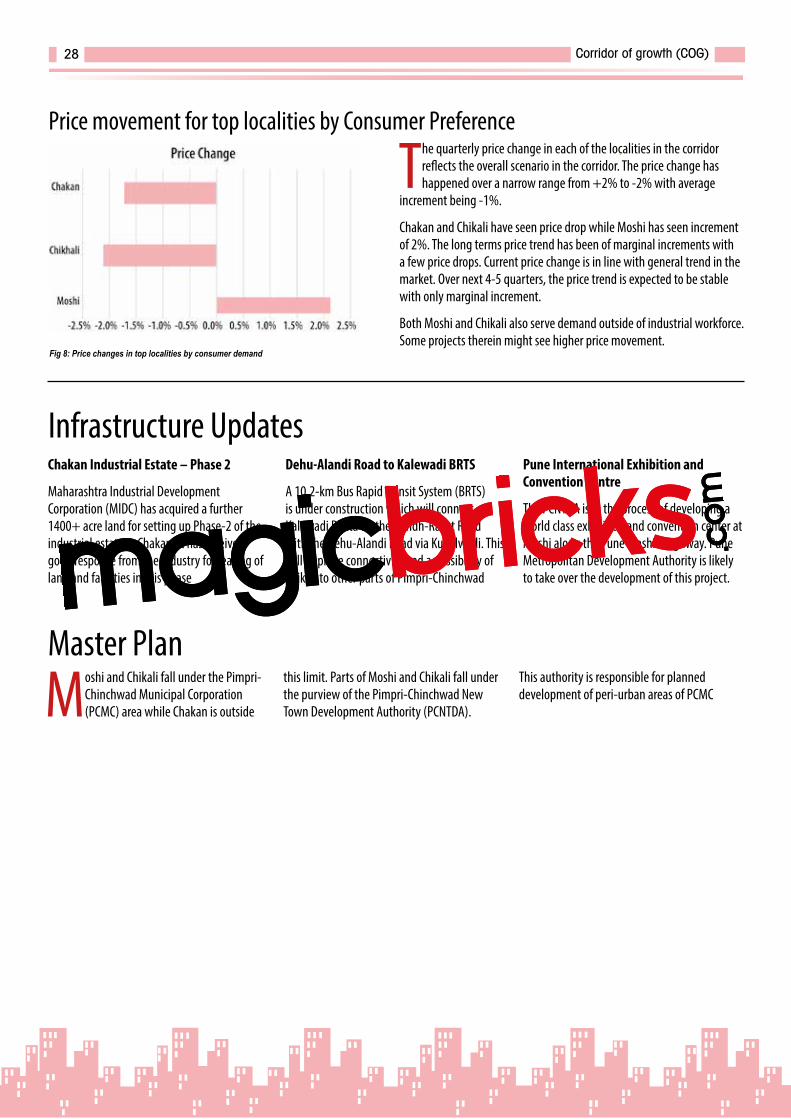
Price movement for top localities by Consumer Preference
The quarterly price change in each of the localities in the corridor reflects the overall scenario in the corridor. The price change has happened over a narrow range from +2% to -2% with average
increment being -1%.
Chakan and Chikali have seen price drop while Moshi has seen increment of 2%. The long terms price trend has been of marginal increments with a few price drops. Current price change is in line with general trend in the market. Over next 4-5 quarters, the price trend is expected to be stable with only marginal increment.
Both Moshi and Chikali also serve demand outside of industrial workforce. Some projects therein might see higher price movement.
Fig 8: Price changes in top localities by consumer demand
Infrastructure UpdatesChakan Industrial Estate – Phase 2
Maharashtra Industrial Development Corporation (MIDC) has acquired a further 1400+ acre land for setting up Phase-2 of the industrial estate in Chakan. It has received good response from the industry for leasing of land and facilities in this phase
Dehu-Alandi Road to Kalewadi BRTS
A 10.2-km Bus Rapid Transit System (BRTS) is under construction which will connect Kalewadi Phata on the Aundh-Ravet Road with the Dehu-Alandi Road via Kudalwadi. This will improve connectivity and accessibility of Chikali to other parts of Pimpri-Chinchwad
Pune International Exhibition and Convention Centre
The PCNTDA is in the process of developing a world class exhibition and convention center at Moshi along the Pune-Nashik Highway. Pune Metropolitan Development Authority is likely to take over the development of this project.
Moshi and Chikali fall under the Pimpri-Chinchwad Municipal Corporation (PCMC) area while Chakan is outside
this limit. Parts of Moshi and Chikali fall under the purview of the Pimpri-Chinchwad New Town Development Authority (PCNTDA).
This authority is responsible for planned development of peri-urban areas of PCMC
Master Plan
Corridor of growth (COG)28

Where to buy small, affordable apartments in Pune
Along with flourishing retail and hospitality segments, property market is witnessing an increased activity. Chikhali and Rahatni localities are witnessing maximum supply of smaller units. There is a maximum supply of 1BHK and 2BHK units in both the two localities. Rentals at both, Chikhali and Rahatni, are lower in comparison to some of the developed areas of Pune such as Hinjewadi and Koregaon Park. Most of the people buying apartments in the area are mid-level professionals. Obviously, they cannot avail home loans for larger sums. There is still scope for many developers to bring and launch their projects in Chikhali and Rahatni areas.
n Source: The Times of India
A 1BHK in Pune for Rs 5L? It’s possible!
The government has observed that there is a requirement of 25 lakh affordable houses across the state of Maharashtra. Of the 25 lakh, 11 lakh houses will be required in Mumbai city and suburbs. A total of 10,000 Smart 1 BHK flats will be built over a period of 3 years starting from May, 2016. These 10,000 Smart 1 BHK flats will be spread across 10 locations in Pune, namely Chakan Talegaon, Moshi Annex , Wagholi Annex- Shirswadi, Sanaswadi, Ranjangaon, Wai, Shirwal, Urali Kanchan, Kondhwa Annex- Bhopgaon and Paud New. It should be noted that as part of the ‘Housing for All’ initiative, formulated under the Pradhan Mantri Awas Yojana, the government has charted out four approaches to provide low-cost housing.
n Source: Magicbricks Bureau
Increased supply of independent houses in North Pune
The home buyers in Pune are more inclined towards luxury properties. There are consumers who prefer living in spacious and independent property types such as bungalows, independent houses, and villas. To meet these desires, several home buyers are selecting locations in North Pune such as Chinchwad, Akurdi and Talegaon Dabhade. These not only suit their budgets but also offer convenient access to the main city. Chinchwad is an established commercial area of Pune. With new companies setting their offices here, there is a scope for developing good business. The connectivity through the Mumbai-Pune Highway is an advantage. Such properties can be looked out in the areas like Chinchwad, Akrudi and Talegaon Dhabhade.
n Source: Magicbricks Bureau
Moshi offers many options for home buyers
Moshi has seen ample real estate development to fulfill the growing housing demand, raised because of the job opportunities at a close distance. The location is ideal for end users as there is an availability of large stock with options in multiple configurations. These attract the middle class buyers the most. Moshi sees maximum housing demand from the professionals working in the Bhosari and Chakan industrial belt. These are white-collar job generators where people from the middle and senior management work and look for housing as per their stature. Moshi is emerging as a potential real estate investment destination for end users. Reasons are availability of wide options in varied budget ranges and its economy, which contributes, majorly to housing demand.
n Source: Magicbricks Bureau
IN NEWS
Corridor of growth (COG)29
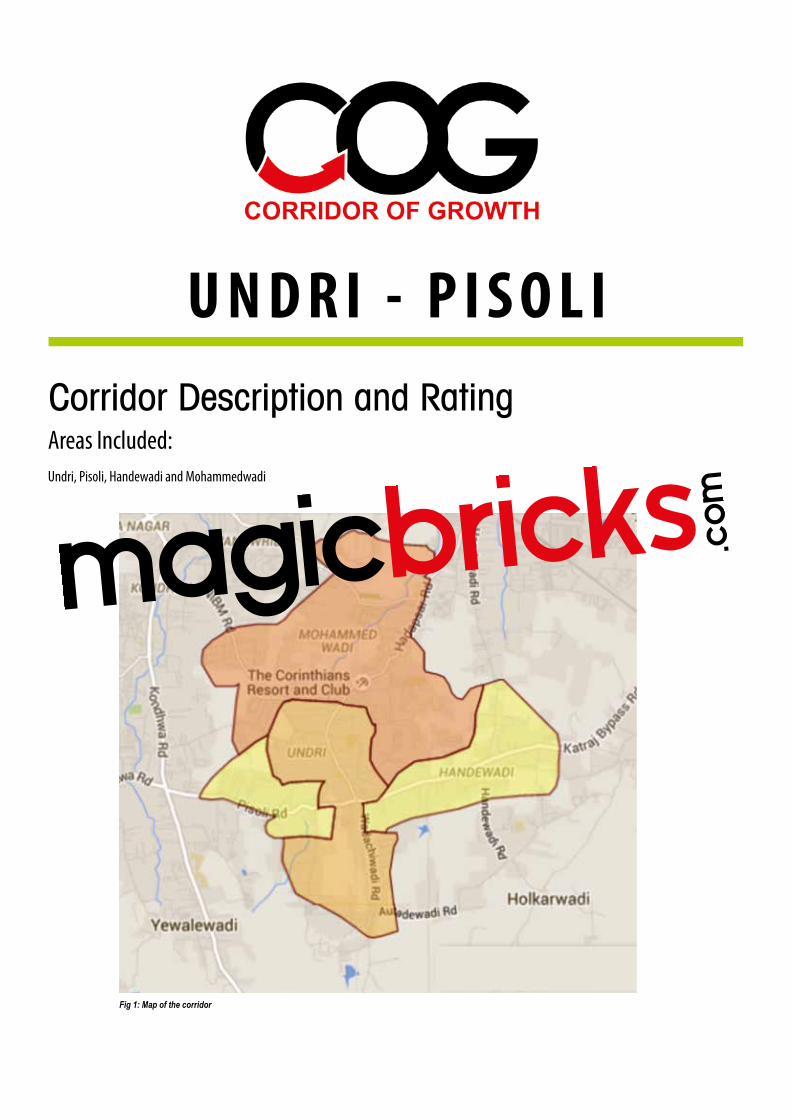
Corridor Description and RatingAreas Included: Undri, Pisoli, Handewadi and Mohammedwadi
Fig 1: Map of the corridor
U N D R I - P I S O L I
Introduction
The Undri Corridor covers the southern part of Pune and consists of upcoming localities like Undri, Pisoli, Handewadi and Mohammedwadi. This is primarily a residential corridor with associated support retail and infrastructure developments.
South Pune, comprising of localities like Wanowrie, has been a residential hub given its proximity to the Central Business District (CBD) of Pune and Pune Cantonment. In due course of time, the development moved to Kondhwa and along and off the NIBM Road. However, these localities have become saturated. The next phase of development has moved further south covering new localities which fall under this corridor.
Apart from being an extension of the existing residential areas, there are other newer demand drivers for this part of Pune. There is considerable IT/ITES development within a 10-km radius of the corridor at Magarpatta City in Hadapsar and SP Infocity at Phursungi. The capital value in the corridor is less as compared to other localities between the corridor and these IT/ITES office space clusters. Residential development in the corridor provides relatively affordable options to home
buyers. This is also an affordable destination for consumers working in the Camp/CBD area of Pune who find Kondhwa, Wanowrie and NIBM Road expensive.
Development in the corridor is along and off the existing roads. The Katraj-Undri-Hadapsar Bypass Road is a major development axis which has projects on either side. Development in Undri and Mohammedwadi localities fall mainly along this road. Another area in the corridor with large scale development is the Handewadi Road which lies to the east of the Katraj-Undri-Hadapsar Bypass Road. This road starts from the intersection of the Katraj Bypass Road in the south and connects with Hadapsar Road in the north. Here again, there are many projects on either side of the road.
Mohammedwadi and part of Undri are amongst the 23 villages lying on the outskirts of Pune which have already been absorbed into the Pune Municipal Corporation (PMC) limits.
The Master Plan for Mohammedwadi covers most of the development along the Handewadi Road as well. However, Pisoli and parts of Undri are amongst the 34 villages which have been proposed for absorption under the PMC limits. The timeline for this merger is not clear at present.
Present Scenario
The corridor offers properties in the price range of Rs 4,200-5,200 per sq ft in the re-sale market. The average rate in the market is Rs 4,800 per sq ft. Mohammedwadi is the most expensive locality in the corridor followed by Undri, Handewadi and Pisoli.
The 2BHK is the dominant format amongst the multi-storey apartments and forms 65% of the re-sale supply. In terms of overall acquisition cost, more than 50% options are in the Rs 40-60 lakh segment followed by smaller format options in the Rs 20-40 lakh price bracket. The average 2BHK saleable area is 1100 sq ft while that of a 3BHK is 1530 sq ft.
The long term price trend (4-5 years) in the area has been in the 25%-30% range. However, it must be appreciated that it was on a smaller base price. In line with the general market scenario, the price trend over the last two years has been subdued. Price appreciation has been in the 9%-12% range in the localities of the corridor.
The corridor has projects by various Tier-1 and Tier-2 developers. These vary in terms of land area as well as number of units per project.
Infrastructure
Infrastructure is still evolving in the corridor. Projects which are close to
Corridor of growth (COG)31
About the Corridor
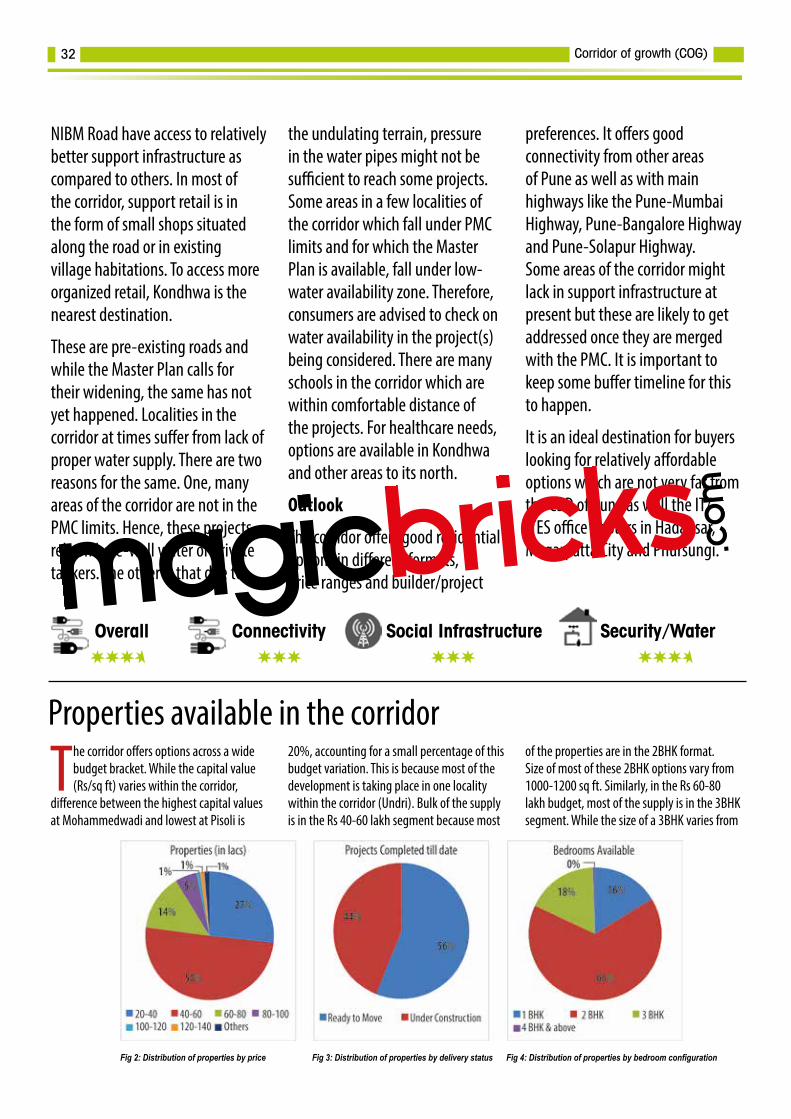
Properties available in the corridor
The corridor offers options across a wide budget bracket. While the capital value (Rs/sq ft) varies within the corridor,
difference between the highest capital values at Mohammedwadi and lowest at Pisoli is
20%, accounting for a small percentage of this budget variation. This is because most of the development is taking place in one locality within the corridor (Undri). Bulk of the supply is in the Rs 40-60 lakh segment because most
of the properties are in the 2BHK format. Size of most of these 2BHK options vary from 1000-1200 sq ft. Similarly, in the Rs 60-80 lakh budget, most of the supply is in the 3BHK segment. While the size of a 3BHK varies from
Overall Connectivity Social Infrastructure Security/Water
Fig 2: Distribution of properties by price Fig 3: Distribution of properties by delivery status Fig 4: Distribution of properties by bedroom configuration
Corridor of growth (COG)32
NIBM Road have access to relatively better support infrastructure as compared to others. In most of the corridor, support retail is in the form of small shops situated along the road or in existing village habitations. To access more organized retail, Kondhwa is the nearest destination.
These are pre-existing roads and while the Master Plan calls for their widening, the same has not yet happened. Localities in the corridor at times suffer from lack of proper water supply. There are two reasons for the same. One, many areas of the corridor are not in the PMC limits. Hence, these projects rely on bore-well water or private tankers. The other is that due to
the undulating terrain, pressure in the water pipes might not be sufficient to reach some projects. Some areas in a few localities of the corridor which fall under PMC limits and for which the Master Plan is available, fall under low-water availability zone. Therefore, consumers are advised to check on water availability in the project(s) being considered. There are many schools in the corridor which are within comfortable distance of the projects. For healthcare needs, options are available in Kondhwa and other areas to its north.
Outlook
The corridor offers good residential options in different formats, price ranges and builder/project
preferences. It offers good connectivity from other areas of Pune as well as with main highways like the Pune-Mumbai Highway, Pune-Bangalore Highway and Pune-Solapur Highway. Some areas of the corridor might lack in support infrastructure at present but these are likely to get addressed once they are merged with the PMC. It is important to keep some buffer timeline for this to happen.
It is an ideal destination for buyers looking for relatively affordable options which are not very far from the CBD of Pune as well the IT/ITES office clusters in Hadapsar, Magarpatta City and Phursungi.
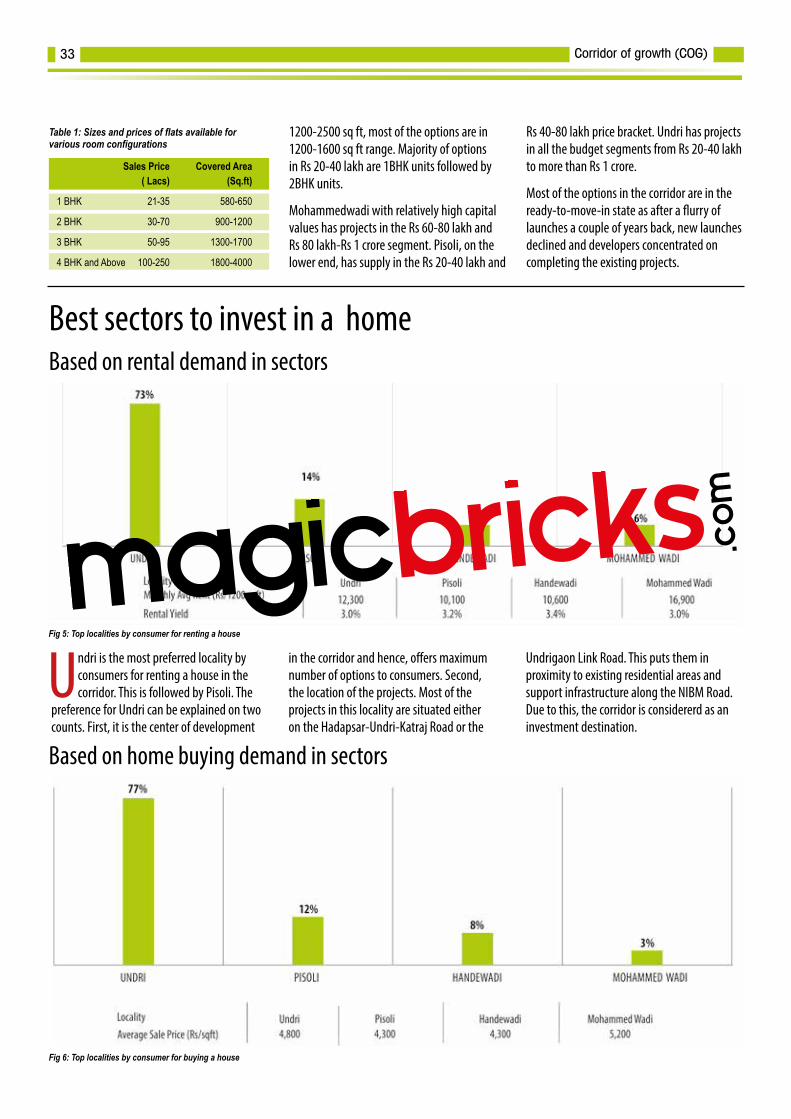
Undri is the most preferred locality by consumers for renting a house in the corridor. This is followed by Pisoli. The
preference for Undri can be explained on two counts. First, it is the center of development
in the corridor and hence, offers maximum number of options to consumers. Second, the location of the projects. Most of the projects in this locality are situated either on the Hadapsar-Undri-Katraj Road or the
Undrigaon Link Road. This puts them in proximity to existing residential areas and support infrastructure along the NIBM Road. Due to this, the corridor is considererd as an investment destination.
1200-2500 sq ft, most of the options are in 1200-1600 sq ft range. Majority of options in Rs 20-40 lakh are 1BHK units followed by 2BHK units.
Mohammedwadi with relatively high capital values has projects in the Rs 60-80 lakh and Rs 80 lakh-Rs 1 crore segment. Pisoli, on the lower end, has supply in the Rs 20-40 lakh and
Rs 40-80 lakh price bracket. Undri has projects in all the budget segments from Rs 20-40 lakh to more than Rs 1 crore.
Most of the options in the corridor are in the ready-to-move-in state as after a flurry of launches a couple of years back, new launches declined and developers concentrated on completing the existing projects.
Sales Price Covered Area ( Lacs) (Sq.ft)
1 BHK 21-35 580-650
2 BHK 30-70 900-1200
3 BHK 50-95 1300-1700
4 BHK and Above 100-250 1800-4000
Best sectors to invest in a home Based on rental demand in sectors
Table 1: Sizes and prices of flats available for various room configurations
Based on home buying demand in sectors
Fig 5: Top localities by consumer for renting a house
Fig 6: Top localities by consumer for buying a house
Corridor of growth (COG)33
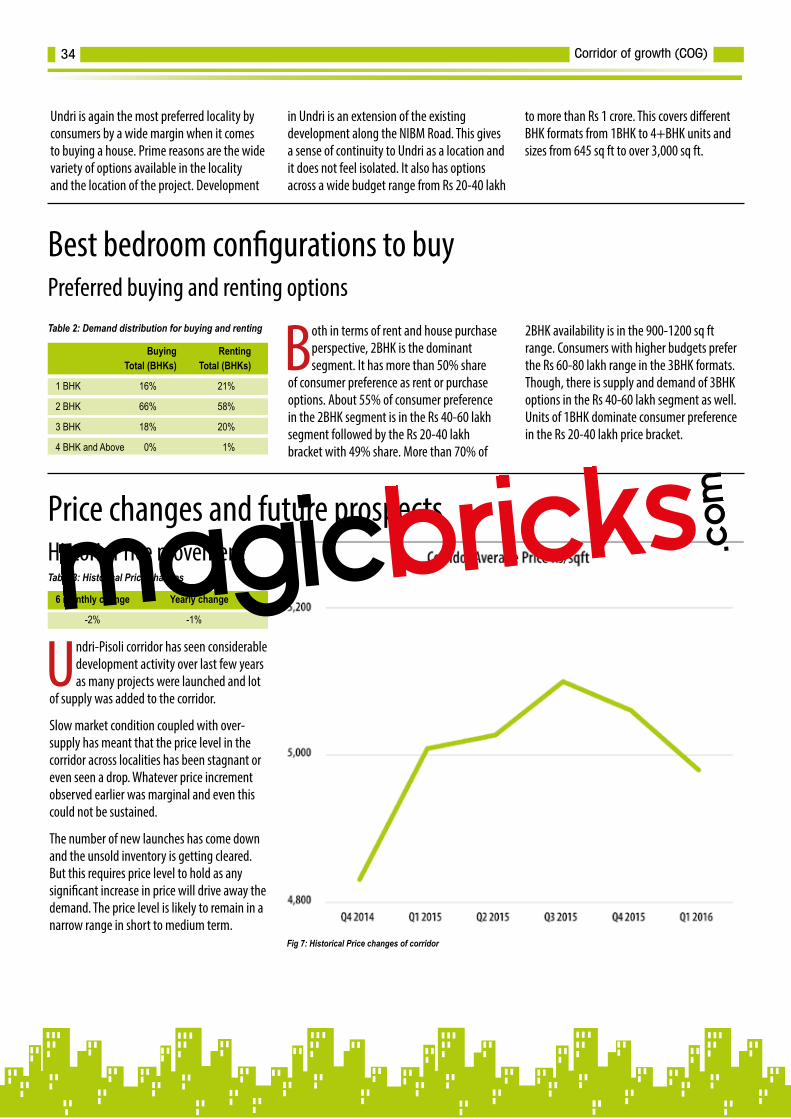
Best bedroom configurations to buy Preferred buying and renting options
Buying Renting Total (BHKs) Total (BHKs)
1 BHK 16% 21%
2 BHK 66% 58%
3 BHK 18% 20%
4 BHK and Above 0% 1%
Table 2: Demand distribution for buying and renting
Undri is again the most preferred locality by consumers by a wide margin when it comes to buying a house. Prime reasons are the wide variety of options available in the locality and the location of the project. Development
in Undri is an extension of the existing development along the NIBM Road. This gives a sense of continuity to Undri as a location and it does not feel isolated. It also has options across a wide budget range from Rs 20-40 lakh
to more than Rs 1 crore. This covers different BHK formats from 1BHK to 4+BHK units and sizes from 645 sq ft to over 3,000 sq ft.
Both in terms of rent and house purchase perspective, 2BHK is the dominant segment. It has more than 50% share
of consumer preference as rent or purchase options. About 55% of consumer preference in the 2BHK segment is in the Rs 40-60 lakh segment followed by the Rs 20-40 lakh bracket with 49% share. More than 70% of
2BHK availability is in the 900-1200 sq ft range. Consumers with higher budgets prefer the Rs 60-80 lakh range in the 3BHK formats. Though, there is supply and demand of 3BHK options in the Rs 40-60 lakh segment as well. Units of 1BHK dominate consumer preference in the Rs 20-40 lakh price bracket.
Price changes and future prospects Historic Price movement
6 monthly change Yearly change
-2% -1%
Table 3: Historical Price changes
Undri-Pisoli corridor has seen considerable development activity over last few years as many projects were launched and lot
of supply was added to the corridor.
Slow market condition coupled with over-supply has meant that the price level in the corridor across localities has been stagnant or even seen a drop. Whatever price increment observed earlier was marginal and even this could not be sustained.
The number of new launches has come down and the unsold inventory is getting cleared. But this requires price level to hold as any significant increase in price will drive away the demand. The price level is likely to remain in a narrow range in short to medium term.
Fig 7: Historical Price changes of corridor
Corridor of growth (COG)34
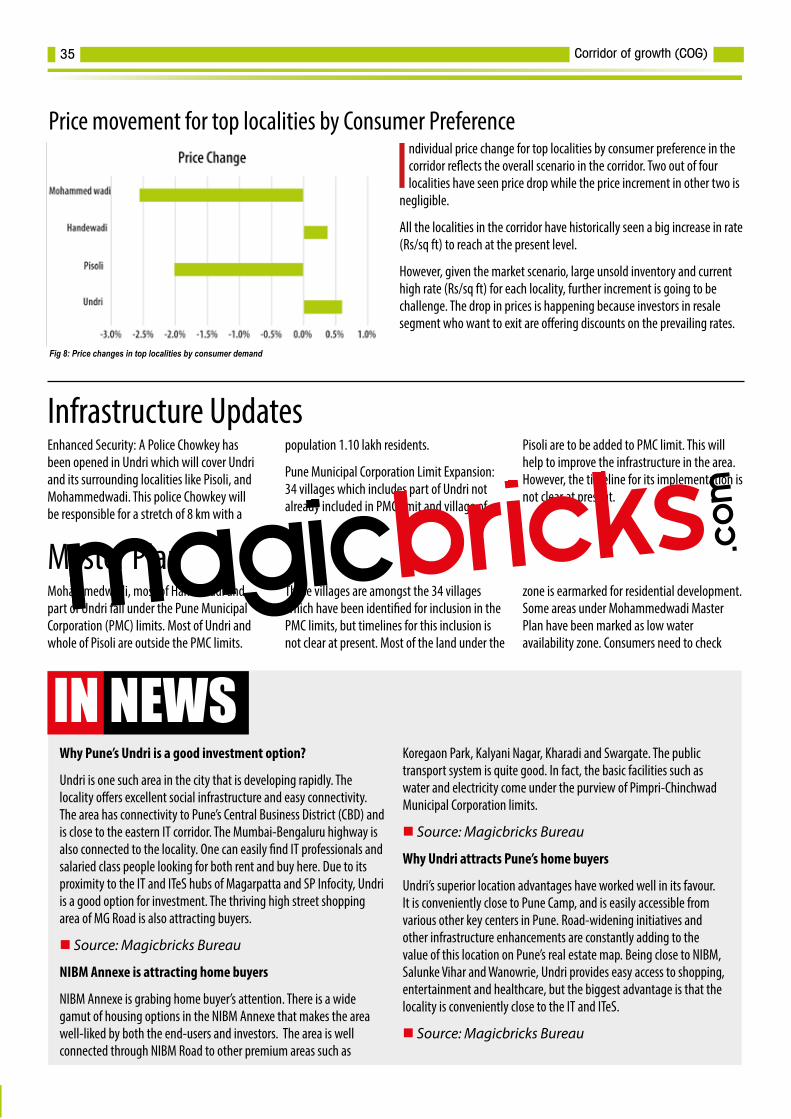
Price movement for top localities by Consumer Preference
Individual price change for top localities by consumer preference in the corridor reflects the overall scenario in the corridor. Two out of four localities have seen price drop while the price increment in other two is
negligible.
All the localities in the corridor have historically seen a big increase in rate (Rs/sq ft) to reach at the present level.
However, given the market scenario, large unsold inventory and current high rate (Rs/sq ft) for each locality, further increment is going to be challenge. The drop in prices is happening because investors in resale segment who want to exit are offering discounts on the prevailing rates.
Fig 8: Price changes in top localities by consumer demand
Why Pune’s Undri is a good investment option?
Undri is one such area in the city that is developing rapidly. The locality offers excellent social infrastructure and easy connectivity. The area has connectivity to Pune’s Central Business District (CBD) and is close to the eastern IT corridor. The Mumbai-Bengaluru highway is also connected to the locality. One can easily find IT professionals and salaried class people looking for both rent and buy here. Due to its proximity to the IT and ITeS hubs of Magarpatta and SP Infocity, Undri is a good option for investment. The thriving high street shopping area of MG Road is also attracting buyers.
n Source: Magicbricks Bureau
NIBM Annexe is attracting home buyers
NIBM Annexe is grabing home buyer’s attention. There is a wide gamut of housing options in the NIBM Annexe that makes the area well-liked by both the end-users and investors. The area is well connected through NIBM Road to other premium areas such as
Koregaon Park, Kalyani Nagar, Kharadi and Swargate. The public transport system is quite good. In fact, the basic facilities such as water and electricity come under the purview of Pimpri-Chinchwad Municipal Corporation limits.
n Source: Magicbricks Bureau
Why Undri attracts Pune’s home buyers
Undri’s superior location advantages have worked well in its favour. It is conveniently close to Pune Camp, and is easily accessible from various other key centers in Pune. Road-widening initiatives and other infrastructure enhancements are constantly adding to the value of this location on Pune’s real estate map. Being close to NIBM, Salunke Vihar and Wanowrie, Undri provides easy access to shopping, entertainment and healthcare, but the biggest advantage is that the locality is conveniently close to the IT and ITeS.
n Source: Magicbricks Bureau
IN NEWS
Infrastructure UpdatesEnhanced Security: A Police Chowkey has been opened in Undri which will cover Undri and its surrounding localities like Pisoli, and Mohammedwadi. This police Chowkey will be responsible for a stretch of 8 km with a
population 1.10 lakh residents.
Pune Municipal Corporation Limit Expansion: 34 villages which includes part of Undri not already included in PMC limit and village of
Pisoli are to be added to PMC limit. This will help to improve the infrastructure in the area. However, the timeline for its implementation is not clear at present.
Master PlanMohammedwadi, most of Handewadi and part of Undri fall under the Pune Municipal Corporation (PMC) limits. Most of Undri and whole of Pisoli are outside the PMC limits.
These villages are amongst the 34 villages which have been identified for inclusion in the PMC limits, but timelines for this inclusion is not clear at present. Most of the land under the
zone is earmarked for residential development. Some areas under Mohammedwadi Master Plan have been marked as low water availability zone. Consumers need to check
Corridor of growth (COG)35
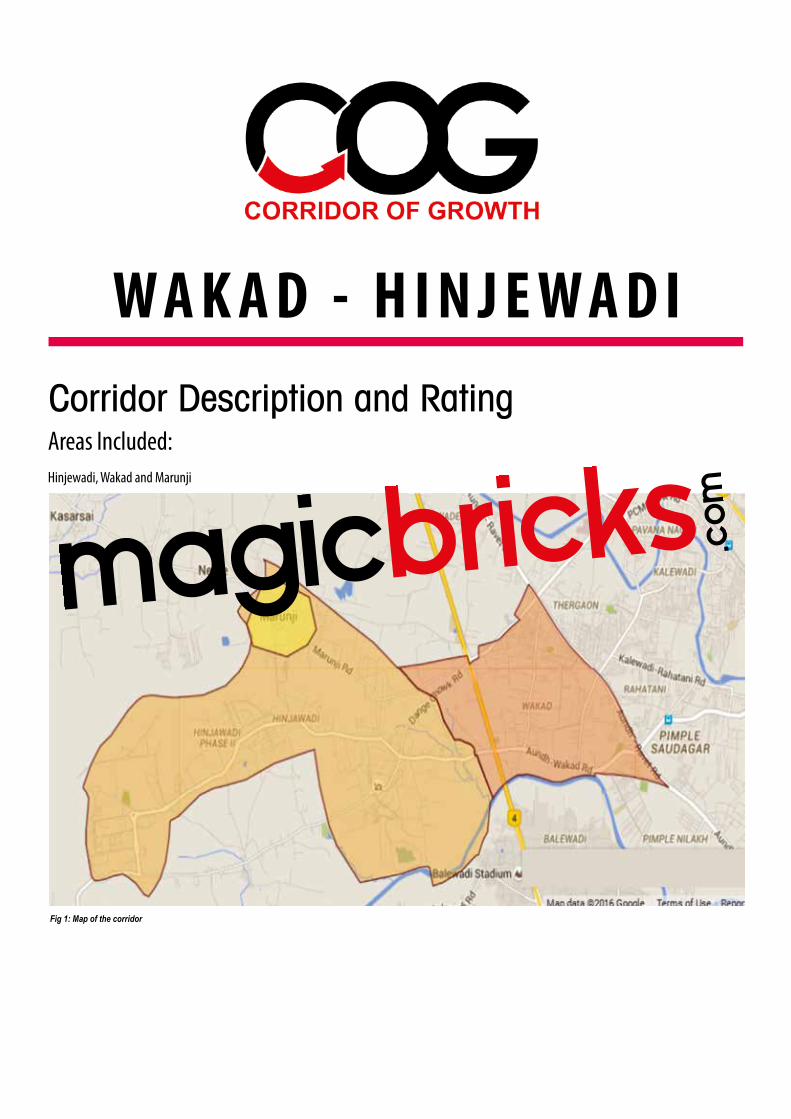
Corridor Description and RatingAreas Included: Hinjewadi, Wakad and Marunji
Fig 1: Map of the corridor
W A K A D - H I N J E W A D I
Introduction: The Hinjewadi-Wakad Corridor represents a mix of office space and residential development. Hinjewadi is predominantly an IT/ITES office space hub with residential development while Wakad is primarily a residential hub with associated support amenities.
The Rajiv Gandhi Infotech Park at Hinjewadi has been developed by the Maharashtra Industrial Development Corporation (MIDC) wherein three phases of the park are currently operational. Hinjewadi is one of the two major IT/ITES office clusters in Pune and accounts for almost 50% of all IT/ITES office space in the city. It continues to grow as more companies set-up their facilities and more phases are developed. Unlike other areas in the city where land supply is limited, there is ample land available for further expansion in this area. Employees working in various IT/ITES companies in this park are the demand drivers for residential development in many localities in the western part of the city. While choosing localities/projects, employees balance affordability, keeping commuting time to the minimum.
Residential development has taken shape in Hinjewadi through large township projects. These have been launched under the Special Township Policy which encourages development of self-sustaining townships away from the city to assist in dispersal of population. Minimum land area required is 40 hectare or about 100 acre. Five major projects in and around Hinjewadi are under-construction under this scheme. These are Blue Ridge (Paranjape Schemes), Life Republic (Kolte-Patil), KUL Ecoloch (Kumar Builders), Megapolis (Avinash Bhosale Infrastructure Ltd and Kumar Properties) and Xrbia Hinjewadi. The residential component in these projects is in various stages of construction.
Wakad is one of the major residential hubs in western Pune. This locality witnessed development as the city expanded westward as well as due to the demand emanating from people working in the IT Parks in Hinjewadi towards its east. As per the Master Plan for Wakad, it extends on both sides of the Pune-Mumbai Highway and is contiguous with Hinjewadi. However, most of the residential development
has taken place to the east of the Pune-Mumbai Highway. The southern part of the locality sits astride the main access road to Hinjewadi from the core areas of the city. The northern part of the locality touches the other smaller access road (Dange Chowk Road). This proximity to a major demand driver has made Wakad the most preferred locality by consumers for both home buying and renting in Pune.
Infrastructure: Apart from two smaller access roads, there is only one major access road to Hinjewadi from the east and this creates serious traffic congestion during peak hours. To solve this issue, a 6-lane road from Baner to Mahalunge, connecting further to the Phase-2 of the IT Park, has been proposed. However, land acquisition for this project is yet to begin. Another measure announced to address this issue is the widening of the road from Shivaji Chowk in Hinjewadi to Bhumkar Chowk. This will be further extended to Dange Chowk in Thergaon. It will be undertaken by the Pimpri-Chinchwad Municipal Corporation (PCMC). The work on this project is also yet to begin.
PCMC also plans to construct a
Corridor of growth (COG)37
About the Corridor
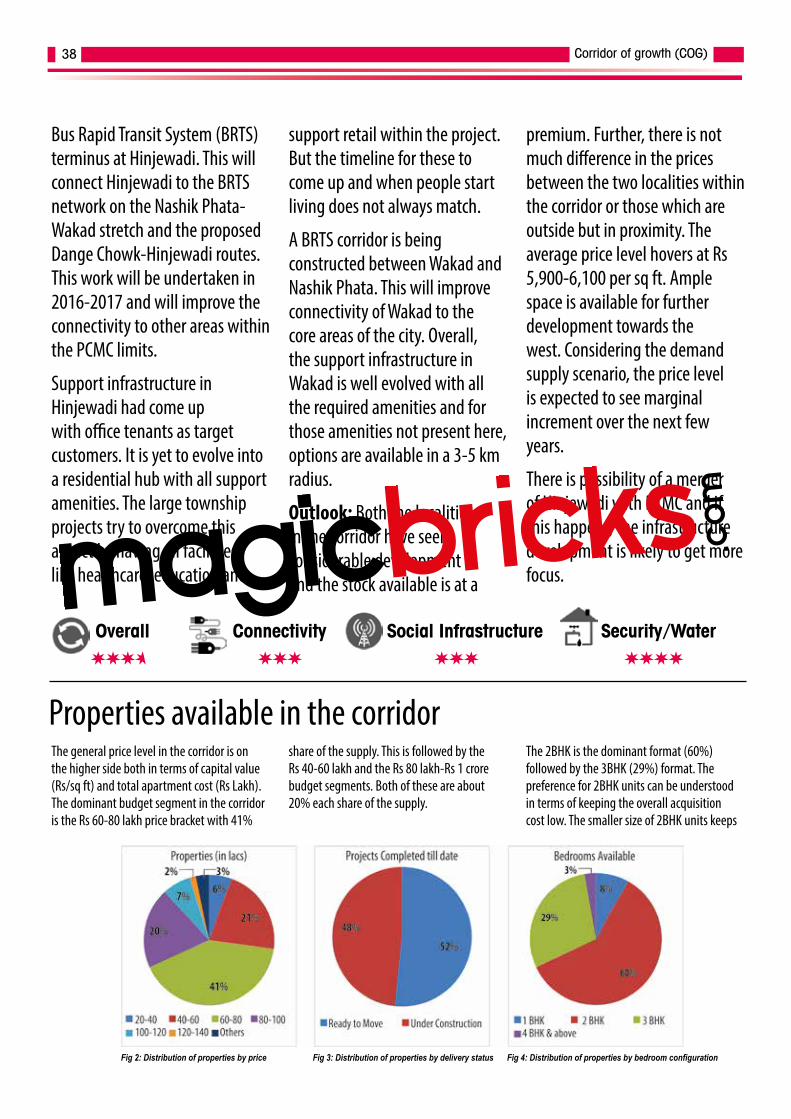
Properties available in the corridor The general price level in the corridor is on the higher side both in terms of capital value (Rs/sq ft) and total apartment cost (Rs Lakh). The dominant budget segment in the corridor is the Rs 60-80 lakh price bracket with 41%
share of the supply. This is followed by the Rs 40-60 lakh and the Rs 80 lakh-Rs 1 crore budget segments. Both of these are about 20% each share of the supply.
The 2BHK is the dominant format (60%) followed by the 3BHK (29%) format. The preference for 2BHK units can be understood in terms of keeping the overall acquisition cost low. The smaller size of 2BHK units keeps
Overall Connectivity Social Infrastructure Security/Water
Fig 2: Distribution of properties by price Fig 3: Distribution of properties by delivery status Fig 4: Distribution of properties by bedroom configuration
Bus Rapid Transit System (BRTS) terminus at Hinjewadi. This will connect Hinjewadi to the BRTS network on the Nashik Phata-Wakad stretch and the proposed Dange Chowk-Hinjewadi routes. This work will be undertaken in 2016-2017 and will improve the connectivity to other areas within the PCMC limits.
Support infrastructure in Hinjewadi had come up with office tenants as target customers. It is yet to evolve into a residential hub with all support amenities. The large township projects try to overcome this aspect by having all facilities like healthcare, education and
support retail within the project. But the timeline for these to come up and when people start living does not always match.
A BRTS corridor is being constructed between Wakad and Nashik Phata. This will improve connectivity of Wakad to the core areas of the city. Overall, the support infrastructure in Wakad is well evolved with all the required amenities and for those amenities not present here, options are available in a 3-5 km radius.
Outlook: Both the localities in the corridor have seen considerable development and the stock available is at a
premium. Further, there is not much difference in the prices between the two localities within the corridor or those which are outside but in proximity. The average price level hovers at Rs 5,900-6,100 per sq ft. Ample space is available for further development towards the west. Considering the demand supply scenario, the price level is expected to see marginal increment over the next few years.
There is possibility of a merger of Hinjewadi with PCMC and if this happens, the infrastructure development is likely to get more focus.
Corridor of growth (COG)38

Wakad has overwhelming consumer preference for rental housing in the corridor because of its location
and nature of development. It is now an established residential hub with required
support infrastructure for habitation. It is also well connected to main city areas towards east. Travel time from Wakad to Hinjewadi is under-30 minutes so, an employee working in Hinjewadi can take up residence in Wakad.
Hinjewadi is an office space hub and lacks the required infrastructure to support habitation. It also suffers from connectivity issues with other areas because of road infrastructure.
the total cost low and allows buyers to opt for their preferred locality where the per sq ft rate is high.
Surprisingly, for a market which caters to young and single IT/ITES professionals, the supply of 1BHK formats is very less even though this segment has 23% share of consumer preference in the market. Most
of the 2BHK supply is in the Rs 60-80 lakh segment while options of 3BHK are in the Rs 80 lakh-Rs 1 crore bracket. Bulk of the few 1BHK options are in the Rs 20-40 lakh price range. The corridor is witnessing considerable development activity and options are equally available in under-construction and ready-to-move-in projects.
Sales Price Covered Area ( Lacs) (Sq.ft)
1 BHK 25-50 550-700
2 BHK 30-92 900-1250
3 BHK 55-150 1320-2000
4 BHK and Above 120-200 2050-3000
Best sectors to invest in a home Based on rental demand in sectors
Table 1: Sizes and prices of flats available for various room configurations
Based on home buying demand in sectors
Fig 5: Top localities by consumer for renting a house
Fig 6: Top localities by consumer for buying a house
Corridor of growth (COG)39
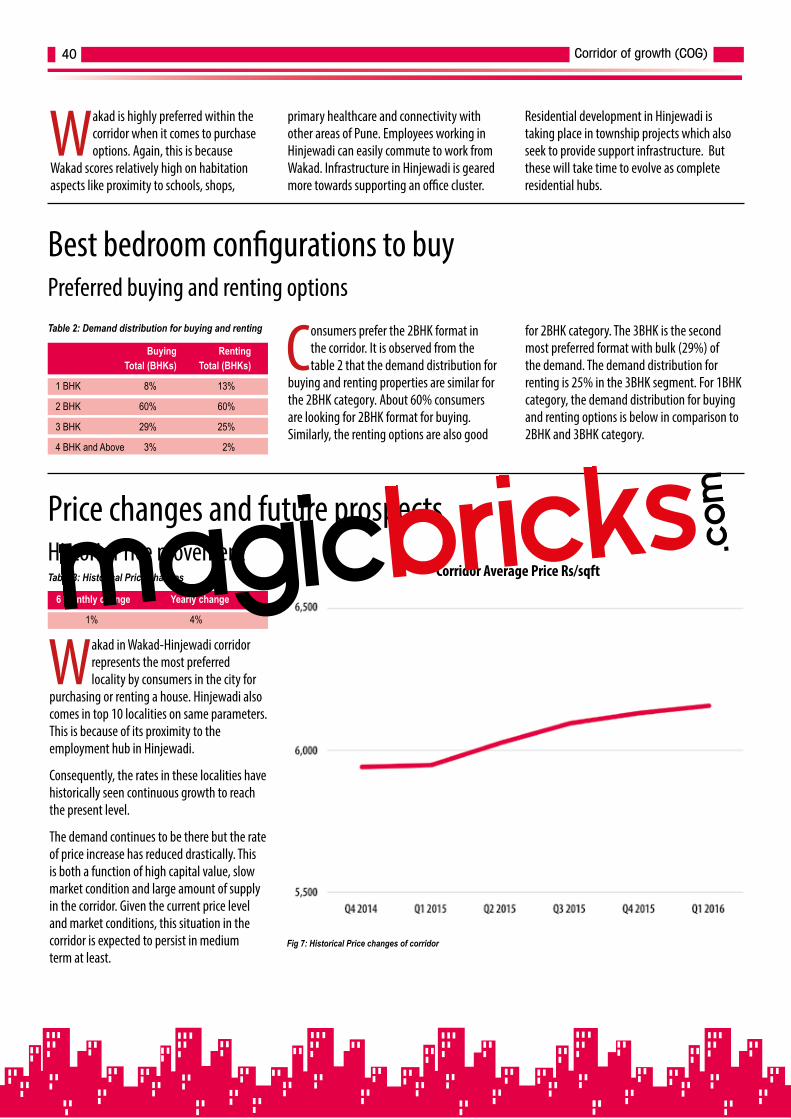
Best bedroom configurations to buy Preferred buying and renting options
Buying Renting Total (BHKs) Total (BHKs)
1 BHK 8% 13%
2 BHK 60% 60%
3 BHK 29% 25%
4 BHK and Above 3% 2%
Table 2: Demand distribution for buying and renting
Wakad is highly preferred within the corridor when it comes to purchase options. Again, this is because
Wakad scores relatively high on habitation aspects like proximity to schools, shops,
primary healthcare and connectivity with other areas of Pune. Employees working in Hinjewadi can easily commute to work from Wakad. Infrastructure in Hinjewadi is geared more towards supporting an office cluster.
Residential development in Hinjewadi is taking place in township projects which also seek to provide support infrastructure. But these will take time to evolve as complete residential hubs.
Consumers prefer the 2BHK format in the corridor. It is observed from the table 2 that the demand distribution for
buying and renting properties are similar for the 2BHK category. About 60% consumers are looking for 2BHK format for buying. Similarly, the renting options are also good
for 2BHK category. The 3BHK is the second most preferred format with bulk (29%) of the demand. The demand distribution for renting is 25% in the 3BHK segment. For 1BHK category, the demand distribution for buying and renting options is below in comparison to 2BHK and 3BHK category.
Price changes and future prospects Historic Price movement Table 3: Historical Price changes
Wakad in Wakad-Hinjewadi corridor represents the most preferred locality by consumers in the city for
purchasing or renting a house. Hinjewadi also comes in top 10 localities on same parameters. This is because of its proximity to the employment hub in Hinjewadi.
Consequently, the rates in these localities have historically seen continuous growth to reach the present level.
The demand continues to be there but the rate of price increase has reduced drastically. This is both a function of high capital value, slow market condition and large amount of supply in the corridor. Given the current price level and market conditions, this situation in the corridor is expected to persist in medium term at least.
Fig 7: Historical Price changes of corridor
6 monthly change Yearly change
1% 4%
Corridor Average Price Rs/sqft
Corridor of growth (COG)40
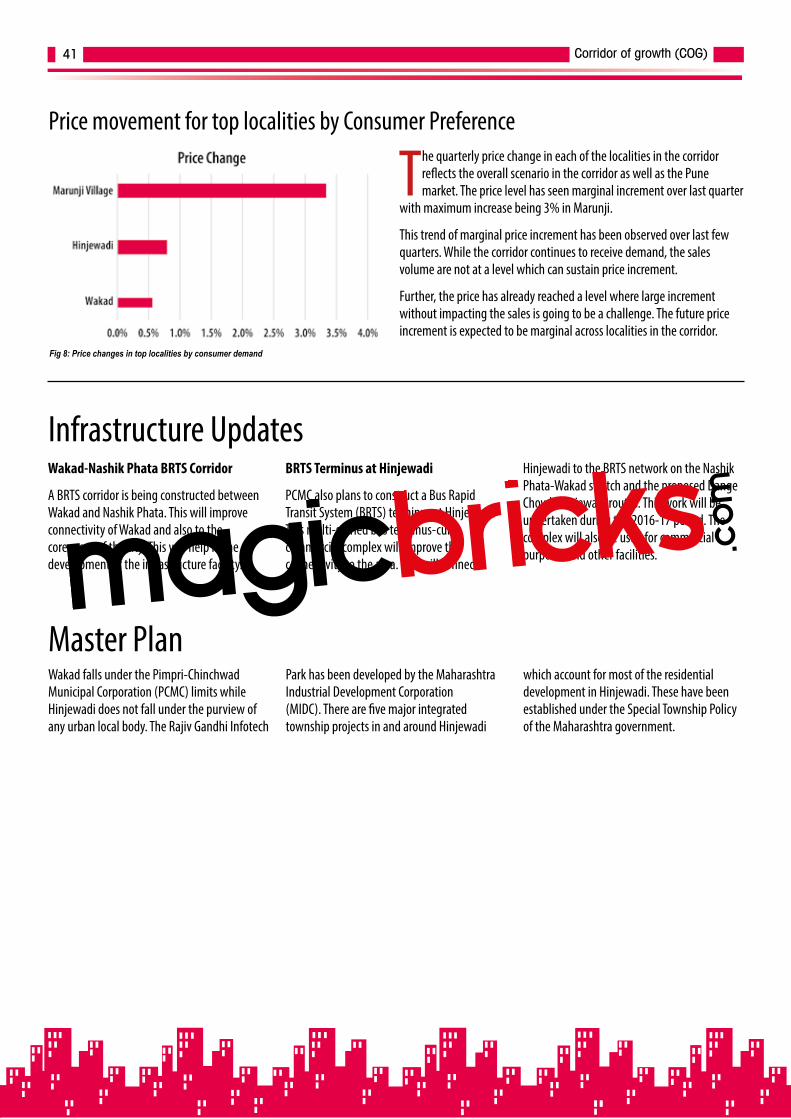
Price movement for top localities by Consumer Preference
The quarterly price change in each of the localities in the corridor reflects the overall scenario in the corridor as well as the Pune market. The price level has seen marginal increment over last quarter
with maximum increase being 3% in Marunji.
This trend of marginal price increment has been observed over last few quarters. While the corridor continues to receive demand, the sales volume are not at a level which can sustain price increment.
Further, the price has already reached a level where large increment without impacting the sales is going to be a challenge. The future price increment is expected to be marginal across localities in the corridor.
Fig 8: Price changes in top localities by consumer demand
Infrastructure UpdatesWakad-Nashik Phata BRTS Corridor
A BRTS corridor is being constructed between Wakad and Nashik Phata. This will improve connectivity of Wakad and also to the core areas of the city. This will help in the development of the infrastructure facility.
BRTS Terminus at Hinjewadi
PCMC also plans to construct a Bus Rapid Transit System (BRTS) terminus at Hinjewadi. This multi-storied bus terminus-cum-commercial complex will improve the connectivity to the area. This will connect
Hinjewadi to the BRTS network on the Nashik Phata-Wakad stretch and the proposed Dange Chowk-Hinjewadi routes. This work will be undertaken during the 2016-17 period. The complex will also be used for commercial purposes and other facilities.
Master PlanWakad falls under the Pimpri-Chinchwad Municipal Corporation (PCMC) limits while Hinjewadi does not fall under the purview of any urban local body. The Rajiv Gandhi Infotech
Park has been developed by the Maharashtra Industrial Development Corporation (MIDC). There are five major integrated township projects in and around Hinjewadi
which account for most of the residential development in Hinjewadi. These have been established under the Special Township Policy of the Maharashtra government.
Corridor of growth (COG)41
Why Wakad’s property market is popular in Pune
Wakad has good connectivity to different parts of the city. The area has emerged as a destination for consumers looking for multi-storey apartments. It is very close to nearby places such as schools, restaurants, shopping mart, etc. Other than its proximity to the Hinjewadi IT Park, the affordability and availability of multi-storey 2BHK apartments are factors that are contributing to Wakad’s popularity. Moreover, there are different options that are available in high rises than in housing villas.
n Source: Magicbricks Bureau
Wakad: Witnessing wide growth
Wakad is rapidly gaining prominence as a healthy micro market. It is due to its closeness to the Pune-Mumbai expressway, IT corridor and residential belts of Baner and Pimple Saudagar. Wakad is not only a residential hub; it is also seeing mixed land development and the emergence of high street shopping areas. The proximity to large IT/ITeS campuses and the business districts of the city has strengthened the investor sentiment here. Situated in the Pimpri-Chinchwad region, Wakad is catering to investors working in the manufacturing hubs around Chakan as well as the ITBT SEZ in Hinjewadi.
n Source: The Times of India
Wakad & Baner: Tale of two localities
Baner and Wakad have been declared highly preferred investment destinations. Proximity to the Pune-Mumbai expressway and IT corridors has caught the attention of buyers. It is located on the eastern side of Dehu-Katraj bypass on National Highway 4 in Pune. The main advantage is its nearness to the expressway, Hinjewadi IT Park, and the Pune-Mumbai highway, making it a favourable place. Both Baner and Wakad have huge potential for good future returns.
nSource: Magicbricks Bureau
Wakad, Pimple Saudagar are most popular in Pune
Wakad and Pimple Saudagar are two localities that witness majority of consumer preference in Pune. Wakad has more new properties and upcoming projects while Pimple Saudagar has relatively old societies and is dominated by age-old constructions. One thing that remains common in both the localities, apart from the same governing body of Pimpri-Chinchwad Municipal Corporation (PCMC), is that each of these has a majority of supply of 2BHK units. Since Pune is home to a large number of migrant populations, home seekers prefer their residences to be close to their office. The area is the chosen option as it offers easy connectivity to nearby industrial pockets.
n Source: Magicbricks Bureau
IN NEWSCorridor of growth (COG)42

Pune
San Mahu Complex, Opp. Poona Club,
5, Bund Garden Road, Pune 411 001
+91 20 26113701 / 02 / 03
Mumbai
Bombay Mutual Building, 3rd Floor,
148 P.M. Road, Fort, Mumbai 400 001
+91 22 22634590 / 91
www.goelgangadevelopments.com
Subhash S Goel


DON’T SPECULATE! CALCULATE ACCURATE PROPERTY PRICE.
I N T R O D U C I N G
PropWorth
1.8 Cr
78 Lac
70 Lac
85 Lac
80 Lac
52 Lac 65 Lac
75 Lac
90 Lac
To know your PropWorth, give a missed call on 92060-72848
For the �rst time in India, magicbricks brings to you a tool to calculate accurate property prices- Propworth! It uses smart algorithms and data science techniques, riding on the vast underlying data of magicbricks to estimate the property price. Thus, allowing you to determine the ongoing rates of apartments and localities across the country.

CONTACT USl Post your feedback to -
propindex @timesgroup.com
l Join our discussion forum at - openhouse.magicbricks.com
l For business enquiries - [email protected]
l You may also share your opinion with #PropIndex on our Twitter handle @magicbricks or connect with us on Facebook at www.facebook.com/magicbricksTOI
D I S C L A I M E R
Every effort has been made to make this Index as complete and as accurate as possible. MagicBricks accepts no responsibility for inaccuracies in the information/data contained in this book. It shall have neither liability nor responsibility to any person or entity with respect to any loss or damage
caused, or alleged to have been caused, directly or indirectly, by the information contained in this book. The information/data in this book is subject to change from time to time due to market condition.
PROPINDEX TEAMl Content & Research:
E Jayashree Kurup, Subodh Kumar, Rohit Vats, Devendra Lohmor, Bhawna Mongia, Namrata Ekka, Renu Arya, Preeti Sharma, Puneet Kukreja & Bikash Kumar
l Layout Design: Harsha Khattar

Related Documents