Target revaluation after failed takeover attempts: Cash versus stock $ Ulrike Malmendier a,b,n , Marcus M. Opp b , Farzad Saidi c a Department of Economics, University of California at Berkeley, 501 Evans Hall, Berkeley, CA 94720-3880, United States b Haas School of Business, University of California at Berkeley, 545 Student Services Building #1900, Berkeley, CA 94720-1900, United States c Judge Business School, University of Cambridge, Trumpington Street, Cambridge CB2 1AG, United Kingdom article info Article history: Received 28 December 2012 Received in revised form 19 February 2015 Accepted 20 February 2015 Available online 3 September 2015 JEL classification: G14 G34 D03 D82 Keywords: Mergers and acquisitions Synergies Revaluation Medium of exchange abstract Cash- and stock-financed takeover bids induce strikingly different target revaluations. We exploit detailed data on unsuccessful takeover bids between 1980 and 2008, and we show that targets of cash offers are revalued on average by þ15% after deal failure, whereas stock targets return to their pre-announcement levels. The differences in revaluation do not revert over longer horizons. We find no evidence that future takeover activities or operational changes explain these differences. While the targets of failed cash and stock offers are both more likely to be acquired over the following eight years than matched control firms, no differences exist between cash and stock targets, either in the timing or in the value of future offers. Similarly, we cannot detect differential operational policies following the failed bid. Our results are most consistent with cash bids revealing prior undervaluation of the target. We reconcile our findings with the opposite conclusion in earlier literature (Bradley, Desai, and Kim, 1983) by identifying a look-ahead bias built into their sample construction. & 2015 Elsevier B.V. All rights reserved. 1. Introduction Takeovers are among the largest and most disruptive events in a corporation's lifetime. The proper assessment of their value implications has been of foremost interest to policy makers and academic researchers alike. One set of stylized facts that the literature has been wrestling to explain is the large difference in returns of cash- and stock-financed takeovers, as well as the different motives of acquirers for choosing one type of payment over the other (see, e.g., Shleifer and Vishny, 2003; Rhodes-Kropf and Viswanathan, 2004; Fishman, 1989). Announcement returns of cash deals are consistently found to be higher than those of stock deals, both in the short run (Huang and Contents lists available at ScienceDirect journal homepage: www.elsevier.com/locate/jfec Journal of Financial Economics http://dx.doi.org/10.1016/j.jfineco.2015.08.013 0304-405X/& 2015 Elsevier B.V. All rights reserved. ☆ This paper benefited significantly from the comments of Harry DeAngelo, our referee, and discussions by Nihat Aktas, Audra Boone, Matthew Rhodes- Kropf, and Pavel Savor, as well as the detailed input from Javed Ahmed, Dirk Jenter, and Marlena Lee. We also acknowledge helpful comments by Yakov Amihud, Malcolm Baker, Xavier Gabaix, Gerard Hoberg, Boyan Jovanovic, Steven Kaplan, Alessandro Lizzeri, Atif Mian, Adair Morse, Stewart Myers, Terrance Odean, Andrei Shleifer, Jeremy Stein, Michael Weber, Jeffrey Wurgler, and David Yermack, as well as seminar participants at University of California at Berkeley, Princeton University, London School of Economics, New York University, Ohio State University, Harvard University, MIT, European School of Management and Technology, Columbia Business School, University of Houston, the Kellogg Junior Finance conference, the 2011 National Bureau of Economic Research Summer Institute, the 2012 European Finance Association Meeting, and the 2012 Western Finance Association Meeting. n Corresponding author at: Department of Economics, University of California at Berkeley, 501 Evans Hall, Berkeley, CA 94720-3880, United States. Tel.: þ1 510 642 5038; fax: þ1 510 642 6615. E-mail addresses: [email protected] (U. Malmendier), [email protected] (M.M. Opp), [email protected] (F. Saidi). Journal of Financial Economics 119 (2016) 92–106

Welcome message from author
This document is posted to help you gain knowledge. Please leave a comment to let me know what you think about it! Share it to your friends and learn new things together.
Transcript
Contents lists available at ScienceDirect
Journal of Financial Economics
Journal of Financial Economics 119 (2016) 92–106
http://d0304-40
☆ ThisKropf, aAmihudOdean,BerkeleManageEconom
n CorrTel.: þ1
E-m
journal homepage: www.elsevier.com/locate/jfec
Target revaluation after failed takeover attempts: Cash versusstock$
Ulrike Malmendier a,b,n, Marcus M. Opp b, Farzad Saidi c
a Department of Economics, University of California at Berkeley, 501 Evans Hall, Berkeley, CA 94720-3880, United Statesb Haas School of Business, University of California at Berkeley, 545 Student Services Building #1900, Berkeley, CA 94720-1900, United Statesc Judge Business School, University of Cambridge, Trumpington Street, Cambridge CB2 1AG, United Kingdom
a r t i c l e i n f o
Article history:Received 28 December 2012Received in revised form19 February 2015Accepted 20 February 2015Available online 3 September 2015
JEL classification:G14G34D03D82
Keywords:Mergers and acquisitionsSynergiesRevaluationMedium of exchange
x.doi.org/10.1016/j.jfineco.2015.08.0135X/& 2015 Elsevier B.V. All rights reserved.
paper benefited significantly from the commnd Pavel Savor, as well as the detailed input, Malcolm Baker, Xavier Gabaix, Gerard HobeAndrei Shleifer, Jeremy Stein, Michael Webey, Princeton University, London School of Ement and Technology, Columbia Business Sic Research Summer Institute, the 2012 Euroesponding author at: Department of Econo510 642 5038; fax: þ1 510 642 6615.ail addresses: [email protected] (U. M
a b s t r a c t
Cash- and stock-financed takeover bids induce strikingly different target revaluations. Weexploit detailed data on unsuccessful takeover bids between 1980 and 2008, and we show thattargets of cash offers are revalued on average by þ15% after deal failure, whereas stock targetsreturn to their pre-announcement levels. The differences in revaluation do not revert overlonger horizons. We find no evidence that future takeover activities or operational changesexplain these differences. While the targets of failed cash and stock offers are both more likelyto be acquired over the following eight years than matched control firms, no differences existbetween cash and stock targets, either in the timing or in the value of future offers. Similarly,we cannot detect differential operational policies following the failed bid. Our results are mostconsistent with cash bids revealing prior undervaluation of the target. We reconcile ourfindings with the opposite conclusion in earlier literature (Bradley, Desai, and Kim, 1983) byidentifying a look-ahead bias built into their sample construction.
& 2015 Elsevier B.V. All rights reserved.
1. Introduction
Takeovers are among the largest and most disruptiveevents in a corporation's lifetime. The proper assessmentof their value implications has been of foremost interest topolicy makers and academic researchers alike. One set ofstylized facts that the literature has been wrestling to
ents of Harry DeAngelo, oufrom Javed Ahmed, Dirk Jerg, Boyan Jovanovic, Steven Kr, Jeffrey Wurgler, and Daviconomics, New York Univerchool, University of Houstopean Finance Association Mmics, University of Californ
almendier), [email protected]
explain is the large difference in returns of cash- andstock-financed takeovers, as well as the different motivesof acquirers for choosing one type of payment over theother (see, e.g., Shleifer and Vishny, 2003; Rhodes-Kropfand Viswanathan, 2004; Fishman, 1989). Announcementreturns of cash deals are consistently found to be higherthan those of stock deals, both in the short run (Huang and
r referee, and discussions by Nihat Aktas, Audra Boone, Matthew Rhodes-nter, and Marlena Lee. We also acknowledge helpful comments by Yakovaplan, Alessandro Lizzeri, Atif Mian, Adair Morse, Stewart Myers, Terranced Yermack, as well as seminar participants at University of California atsity, Ohio State University, Harvard University, MIT, European School ofn, the Kellogg Junior Finance conference, the 2011 National Bureau ofeeting, and the 2012 Western Finance Association Meeting.ia at Berkeley, 501 Evans Hall, Berkeley, CA 94720-3880, United States.
rkeley.edu (M.M. Opp), [email protected] (F. Saidi).
U. Malmendier et al. / Journal of Financial Economics 119 (2016) 92–106 93
Walkling, 1987) and in the long run (Loughran and Vijh,1997) and not only for the acquirer but also for the target(Andrade, Mitchell, and Stafford, 2001).1
The correct interpretation of the return differencesbetween cash and stock bids depends on the underlyinginformation the market responds to (see, for instance, Brad-ley, Desai, and Kim, 1983). A bid could reveal informationabout the value implications of the takeover, e.g., match-specific synergies reaped by the acquirer or the size of thepremium paid to target shareholders. A bid could also revealinformation about value implications that are independent ofthe specific takeover, e.g., information about the parties'stand-alone values or about the target firm's general attrac-tiveness as a takeover target. As Bhagat, Dong, Hirshleifer, andNoah (2005) argue, disentangling these nonexclusive sourcesis a first-order building block in estimating the real valuecreated by mergers and acquisitions.
Our paper contributes to this debate by identifying andquantifying the economic relevance of the different channelsin the context of failed takeover attempts. The difference invaluations before bid announcement and after bid failureallows us to separate out the value implications of the take-over itself and to estimate the extent to which firms arerevalued in response to the bid, independent of the com-pletion of the takeover. Focusing on the target, we then goone step further and distinguish between revaluation due toexpected future takeover activity (i.e., the target firm's gen-eral attractiveness as a takeover target) and revaluation of thetarget's stand-alone value.
For our empirical analysis, we collect a detailed data seton unsuccessful merger bids and tender offers in the USbetween 1980 and 2008, including hand-collected infor-mation about the failure reasons. We show that, on average,targets of cash offers are revalued by þ15%, but there is norevaluation of stock targets.2 After an initial announcementeffect (including the 25 trading-day run-up) of þ25% forcash targets and þ15% for stock targets, the value of theaverage cash target remains at þ15% cumulative abnormalreturns (CAR) at the time of deal failure, relative to the pre-announcement level, while the CAR of stock targets is sta-tistically insignificant (with a slightly negative pointestimate).3 These results hold controlling for a host of deal-and firm-level characteristics, including target size, relativedeal size, offer premium, hostility, and deal form (tenderoffer versus merger). We also show that this differencepersists in the long run. Over the next five years after failureof the bid, targets of cash and stock offers do not exhibitabnormal stock market performance.
1 See also the overview paper by Betton, Eckbo, and Thorburn (2008).2 We also show that, consistent with previous studies, stock acquir-
ers trade on average at significantly lower prices post failure (�17.6%),while cash acquirers remain at their pre-announcement level. SeeRhodes-Kropf, Robinson, and Viswanathan (2005) and Dong, Hirshleifer,Richardson, and Teoh (2006) for similar findings on acquirers. Savor andLu (2009) compare unsuccessful and successful bids, and they find thatunsuccessful stock acquirers perform worse.
3 The announcement effect estimates are almost identical to thosefound by Huang and Walkling (1987) in their sample of successful andunsuccessful deals, þ29.3% for cash and þ14.4% for stock deals, sug-gesting that the market assesses (eventually) failed deals to be similarex ante.
Because deal failure is not exogenous, we cannot easilygeneralize our findings beyond the sample of failed deals.The issue is not that deals that ultimately fail are differentfrom deals that do not fail. Common deal-failure biaswould not affect the differential revaluation of cash andstock targets. If, hypothetically, revaluations were lower infailed than in completed transactions by a common per-centage for both cash and stock deals, the revaluationdifference between cash and stock deals in the sample offailed bids would be representative of that in the fullsample. Instead, the concern is a more subtle selectionbias, namely that selection into bid failure differs betweencash and stock targets.
We address the concern of differential sample-selectionbias following the approach of Savor and Lu (2009). Weclassify failure reasons for failed deals into categories suchas regulatory intervention, negative shocks to the bidder,or uncovering of new information about the target postannouncement of the bid. Based on our hand-collectednews-search analysis and detailed categorization of failurereasons, we replicate our analysis for each of the 12identified failure categories. We find that the cash–stockrevaluation difference for targets is positive in everycategory other than failure due to market-wide shocks,although the statistical significance naturally varies giventhe small subsamples.
Such categorization involves an inevitable amount ofjudgment, and none of the failure categories can be defi-nitely established as exogenous to target value as convin-cingly as in a randomized experiment. However, endo-geneity concerns (with respect to target value) should beless relevant for deals that failed due to regulatory inter-vention or negative shocks to the bidder compared withbids that failed because of negative shocks to the target,such as the uncovering of accounting fraud in the duediligence process. Based on the extent of such endogeneityconcerns, we then aggregate deal-failure categories intolarger subsamples. Our results are robust, regardless ofvariations in how exactly we form these subsamples.
To investigate the source of revaluation, we first testwhether future takeover bids explain our findings. Do targetsof (failed) cash bids receive significantly more or significantlyhigher future bids than stock targets? For each target of afailed deal, we measure the time from the date of deal failureuntil the arrival of a future successful offer (or the censoringevent determined by the data sample). Employing hazard-rate models, we find that both cash and stock targets aresignificantly more likely to be targeted in subsequent offers,compared with a sample of matched control firms. Forexample, after five years, 50% of the targets with failed bidshave received a successful bid, compared with 20% in thecontrol group. The abnormally high subsequent takeoveractivity persists until eight years after deal failure. However,comparing targets of unsuccessful cash and stock bids witheach other, we do not detect any differences in frequency.Similarly, we do not detect any differences in future takeoverpremia in the subsample of targets that receive a successfulfollow-up bid.
Another plausible explanation is that bids induce value-increasing operational policy changes. This catalyst chan-nel could explain our results if targets of failed cash bids
4 The monthly standard error of 1.952% (see Table 3 in Bradley, Desai,and Kim, 1983) implies that the standard error of the long-run CAR fromone month before the bid until 60 months after the bid is
62 1.952 % 15.37%· = .5 In the Online Appendix, we calculate long-run returns in the spirit
of Bradley, Desai, and Kim (1983) using our larger sample and employinga calendar-time portfolio approach. Our results are subject to noiseconcerns of similar magnitude.
6 Sullivan, Jensen, and Hudson (1994) is based on a very small sample(36 observations, 66 without controls), lacks essential control variables(such as hostility, offer premium, market-to-book ratio, or other valuationmeasures), and does not include tender offers.
U. Malmendier et al. / Journal of Financial Economics 119 (2016) 92–10694
responded more than targets of failed stock bids. However,employing operational outcome variables used by Safied-dine and Titman (1999), we do not find any robust evi-dence for differential post-failure policies.
In a nutshell, our paper, first, finds significant differentialrevaluation of cash and stock targets in failed takeover bids. Byconstruction, such revaluation is independent of the valuecreated by the intended takeover. Second, the differentialrevaluation is explained neither by future takeovers nor bycommon proxies of operational change. Our evidence is thusmost consistent with a differential reassessment of cash andstock targets, i.e., a pure informational channel. At the sametime, our results do not indicate the absence of synergies oroperational improvements as a result of takeover bids. Instead,our empirical approach of comparing cash and stock targets offailed bids is specifically designed to isolate information effects.We exploit that cash and stock targets are similar in that theyare both exposed to a failed takeover, allowing us to differenceout any associated real effects while identifying the differentialinformation content embedded in the medium of exchange.Thus, our empirical results should be interpreted as ruling inthe possibility of significant information effects, which con-trasts with the previous literature.
Contribution to literature: Our paper relates to an earlierliterature on mergers and acquisitions exploiting bid failure.Dodd and Ruback (1977) find a large revaluation of targetsafter failed tender offers. Dodd (1980) compares revaluationsof target firms that vetoed the bid with those that did not. Hefinds that only target firms with management that opposedthe bid are positively revalued. Bradley, Desai, and Kim (1983)analyze the role of future bids. They compare target firmsthat are taken over within five years following the initial(failed) tender offer with firms that are not. They report thatfirms without a subsequent takeover offer exhibit negativeabnormal returns after deal failure and return to pre-offervaluations. The CAR point estimate from one month prior toannouncement of the original bid until five years after theannouncement is virtually zero, namely �1.07%. They con-clude that “the gains to the stockholders of unsuccessfultargets stem from the anticipation of a future successfulacquisition and not simply from the revelation of new infor-mation regarding the ‘true’ value of the target resources.”
The conclusion of this seminal paper has remained thepresumed status quo in the literature (see Davidson, Dutia, andCheng, 1989; Fabozzi, Ferri, Fabozzi, and Tucker, 1988 for fol-low-up studies on merger bids and tender offers, respectively).Our findings suggest that the evidence in these studies needsto be reinterpreted. We argue that forward-looking sampleconstruction biases the returns of firms without future take-over activity downward. The magnitude of this bias is eco-nomically significant. We show that matched control firms aretaken over about 20% of the time in a span of five years. Thisamount of future takeover activity should also be priced in thestock market valuation of actual targets prior to theannouncement of the (initial) takeover offer. Conditioning onthe absence of takeover activity for five years after deal failuretherefore induces a negative look-ahead bias of about 20% ofthe typical takeover premium. Using the average historicalpremium of 46.2% (cf. Panel A of Table 1), a back-of-the-envelope calculation (ignoring discounting) suggests that themagnitude of this bias is roughly 46.2% 0.2 9%· ≈ . Because
Bradley, Desai, and Kim (1983) find that targets in their sample(almost exactly) return to pre-announcement levels despitethis bias, their empirical results are consistent with a positive(offsetting) informational effect of the failed bid. Therefore,their conclusion of ruling out information effects might not bewarranted based on their own evidence.
The issue of forward-looking sample selection implies thatthe point estimate of the long-run CAR is a (downward-)biased measure of the informational effect of a bid, as theestimation conditions on the absence of future bids. A sepa-rate, more general concern is the precision of long-run CARestimates, which affects all studies calculating long-runreturns. Because the standard error of the CAR grows withthe square root of the return horizon (e.g., Fama, 1998), a one-time event triggering a significant short-run effect in therange of 10–20% is unlikely to be detected over a five-yearhorizon. Concretely, in the sample of Bradley, Desai, and Kim(1983), the standard error of the CAR estimate for the win-dow from onemonth before the bid until 60 months after thebid is economically large at 15.37%.4 As a result, even aftercorrecting the CAR estimate of �1.07% for a look-ahead biasof 9%, a long-run returns analysis would not allow us to rejectthe existence of any informational effect of a takeover bidbetween [�22%, þ38%] at the 5% level. We conclude that thenoise inherent in long-run CARs clouds the ability to makeprecise quantitative assessments of the informational effect.5
The empirical approach proposed in this paper, i.e., thecomparison of cash and stock targets at announcement andfailure, addresses both issues. First, forming comparisongroups based on the medium of exchange does not introducea look-ahead bias, as the choice of cash versus stock is alreadypublicly known at the time of the announcement. Second, ourmain CAR estimates are orders of magnitude more precisethan above-mentioned long-run returns calculations, becausethe average time from announcement to failure is 60 days inour sample. Concerns about noise in long-run returns calcu-lations do affect our additional analysis of the value of futurebids due to the longer period between the initial bid and thesubsequent bid. However, in the complementary analysis ofthe likelihood of a future bid, a longer observation horizonallows us to estimate hazard rates more precisely.
The results in our paper are consistent with earlier evi-dence by Sullivan, Jensen, and Hudson (1994).6 Our paper isalso closely related to Savor and Lu (2009), whose classifi-cation of failure reasons we implement. Different from ourapproach, they use this classification to compare successfuland failed bids. In a similar spirit, Malmendier, Moretti, andPeters (2010) assess the long-run returns to takeovers bycomparing the returns of competing bidders in contested
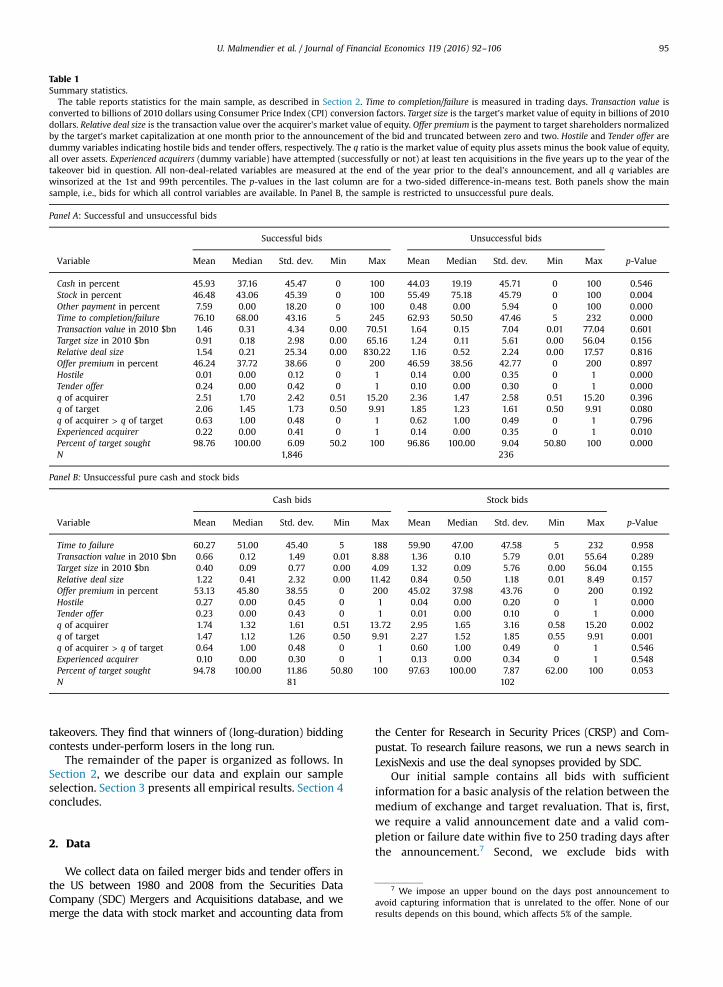
Table 1Summary statistics.
The table reports statistics for the main sample, as described in Section 2. Time to completion/failure is measured in trading days. Transaction value isconverted to billions of 2010 dollars using Consumer Price Index (CPI) conversion factors. Target size is the target's market value of equity in billions of 2010dollars. Relative deal size is the transaction value over the acquirer's market value of equity. Offer premium is the payment to target shareholders normalizedby the target's market capitalization at one month prior to the announcement of the bid and truncated between zero and two. Hostile and Tender offer aredummy variables indicating hostile bids and tender offers, respectively. The q ratio is the market value of equity plus assets minus the book value of equity,all over assets. Experienced acquirers (dummy variable) have attempted (successfully or not) at least ten acquisitions in the five years up to the year of thetakeover bid in question. All non-deal-related variables are measured at the end of the year prior to the deal's announcement, and all q variables arewinsorized at the 1st and 99th percentiles. The p-values in the last column are for a two-sided difference-in-means test. Both panels show the mainsample, i.e., bids for which all control variables are available. In Panel B, the sample is restricted to unsuccessful pure deals.
Panel A: Successful and unsuccessful bids
Successful bids Unsuccessful bids
Variable Mean Median Std. dev. Min Max Mean Median Std. dev. Min Max p-Value
Cash in percent 45.93 37.16 45.47 0 100 44.03 19.19 45.71 0 100 0.546Stock in percent 46.48 43.06 45.39 0 100 55.49 75.18 45.79 0 100 0.004Other payment in percent 7.59 0.00 18.20 0 100 0.48 0.00 5.94 0 100 0.000Time to completion/failure 76.10 68.00 43.16 5 245 62.93 50.50 47.46 5 232 0.000Transaction value in 2010 $bn 1.46 0.31 4.34 0.00 70.51 1.64 0.15 7.04 0.01 77.04 0.601Target size in 2010 $bn 0.91 0.18 2.98 0.00 65.16 1.24 0.11 5.61 0.00 56.04 0.156Relative deal size 1.54 0.21 25.34 0.00 830.22 1.16 0.52 2.24 0.00 17.57 0.816Offer premium in percent 46.24 37.72 38.66 0 200 46.59 38.56 42.77 0 200 0.897Hostile 0.01 0.00 0.12 0 1 0.14 0.00 0.35 0 1 0.000Tender offer 0.24 0.00 0.42 0 1 0.10 0.00 0.30 0 1 0.000q of acquirer 2.51 1.70 2.42 0.51 15.20 2.36 1.47 2.58 0.51 15.20 0.396q of target 2.06 1.45 1.73 0.50 9.91 1.85 1.23 1.61 0.50 9.91 0.080q of acquirer > q of target 0.63 1.00 0.48 0 1 0.62 1.00 0.49 0 1 0.796Experienced acquirer 0.22 0.00 0.41 0 1 0.14 0.00 0.35 0 1 0.010Percent of target sought 98.76 100.00 6.09 50.2 100 96.86 100.00 9.04 50.80 100 0.000N 1,846 236
Panel B: Unsuccessful pure cash and stock bids
Cash bids Stock bids
Variable Mean Median Std. dev. Min Max Mean Median Std. dev. Min Max p-Value
Time to failure 60.27 51.00 45.40 5 188 59.90 47.00 47.58 5 232 0.958Transaction value in 2010 $bn 0.66 0.12 1.49 0.01 8.88 1.36 0.10 5.79 0.01 55.64 0.289Target size in 2010 $bn 0.40 0.09 0.77 0.00 4.09 1.32 0.09 5.76 0.00 56.04 0.155Relative deal size 1.22 0.41 2.32 0.00 11.42 0.84 0.50 1.18 0.01 8.49 0.157Offer premium in percent 53.13 45.80 38.55 0 200 45.02 37.98 43.76 0 200 0.192Hostile 0.27 0.00 0.45 0 1 0.04 0.00 0.20 0 1 0.000Tender offer 0.23 0.00 0.43 0 1 0.01 0.00 0.10 0 1 0.000q of acquirer 1.74 1.32 1.61 0.51 13.72 2.95 1.65 3.16 0.58 15.20 0.002q of target 1.47 1.12 1.26 0.50 9.91 2.27 1.52 1.85 0.55 9.91 0.001q of acquirer > q of target 0.64 1.00 0.48 0 1 0.60 1.00 0.49 0 1 0.546Experienced acquirer 0.10 0.00 0.30 0 1 0.13 0.00 0.34 0 1 0.548Percent of target sought 94.78 100.00 11.86 50.80 100 97.63 100.00 7.87 62.00 100 0.053N 81 102
U. Malmendier et al. / Journal of Financial Economics 119 (2016) 92–106 95
takeovers. They find that winners of (long-duration) biddingcontests under-perform losers in the long run.
The remainder of the paper is organized as follows. InSection 2, we describe our data and explain our sampleselection. Section 3 presents all empirical results. Section 4concludes.
7 We impose an upper bound on the days post announcement toavoid capturing information that is unrelated to the offer. None of ourresults depends on this bound, which affects 5% of the sample.
2. Data
We collect data on failed merger bids and tender offers inthe US between 1980 and 2008 from the Securities DataCompany (SDC) Mergers and Acquisitions database, and wemerge the data with stock market and accounting data from
the Center for Research in Security Prices (CRSP) and Com-pustat. To research failure reasons, we run a news search inLexisNexis and use the deal synopses provided by SDC.
Our initial sample contains all bids with sufficientinformation for a basic analysis of the relation between themedium of exchange and target revaluation. That is, first,we require a valid announcement date and a valid com-pletion or failure date within five to 250 trading days afterthe announcement.7 Second, we exclude bids with
U. Malmendier et al. / Journal of Financial Economics 119 (2016) 92–10696
competing offers, i.e., offers that are announced beforefailure of the initial bid, to avoid capturing returns to thecompeting offer.8 Third, to ensure meaningful ownershipchanges, we drop targets of which less than 50% waspublicly traded before the takeover bid. Fourth, we requirea match in the merged CRSP/Compustat database.9 Fifth,our analysis requires information about the medium ofexchange (cash, stock, or other) and the deal premium. Weextrapolate missing deal premia by regressing the avail-able SDC premia on transaction values divided by thetarget's market capitalization 25 days prior to the bid, andwe predict out-of-sample premia based on transactionvalue and market capitalization (when available). Follow-ing Officer (2003), we truncate deal premia below zeroand above 200%. Sixth, target stock market data need to beavailable 25 days prior to announcement until 25 dayspost failure. The use of 25 days for the run-up period ismotivated by the finding of Schwert (1996) that run-upsdo not occur until 21 days before the announcement. Theresulting initial data set consists of 969 failed bids.
For our main analysis, we impose three further restric-tions. First, we eliminate leveraged buyouts (LBOs), mostnotably buyouts by target management, given that theinformation revealed naturally differs from transactions withthird-party bidders, leaving 809 deals.10 Second, to rule outother factors that are correlated with the choice of cash ver-sus stock, we require information about hostile bids, dealform (tender offer versus merger), market value of equity,and target q ratios (market value of equity plus assets minusthe book value of equity, all divided by assets). This reducesour sample to 675 deals of which 518 deals are pure-cash orpure-stock deals (henceforth pure deals). This constitutes ourlarge sample. Third, we account for the fact that only publicacquirers have a meaningful choice between cash and stockfinancing and, thus, restrict our sample to public-to-publictransactions, which allows us to control for the relative dealsize, i.e., the ratio of the transaction value over the marketvalue of the acquirer's equity, as well as the acquirer's q ratio.The resulting data set constitutes our main sample. It consistsof 236 unsuccessful takeover bids (183 pure deals). The cor-responding sample of successful bids amounts to 1,846observations (1,268 of which are pure), implying that roughlyone-eighth of all deals are unsuccessful. The restriction topublic-to-public transactions focuses our sample on largerand economically important acquisitions, similar to thesample of Healy, Palepu, and Ruback (1992), which is also aprerequisite for obtaining detailed information on failurereasons in our news-search analysis. However, our mainresults also hold in the large sample of 675 deals.11
Summary statistics: The summary statistics for the mainsample are in Panel A of Table 1, separately for successful and
8 We correct some of the competing-bid information in SDC based onour news search in LexisNexis. As a robustness check, we have includedtargets with competing bids in a previous version of the paper. Theresults with regard to the medium of exchange are robust.
9 We use the six-digit CUSIP provided in the SDC database to mergethe data. When matched with more than one CRSP CUSIP, we choose theCUSIP with the lowest seventh digit (typically 1).
10 We thank Harry DeAngelo, our referee, for pointing this out. Allresults are robust to including LBOs.
11 See, in particular, Appendix Table B3.
unsuccessful bids. Successful and unsuccessful deals in oursample are remarkably similar along many dimensions,including the percentage of cash payment offered, transactionvalue, relative deal size, and offer premium. They differ in thepercentage of stock and other payment offered, with lessstock and more other payments in successful deals. We alsosee that deals take longer to be completed than to be with-drawn or rejected. Successful bids are less likely to be hostile,and more likely to be tender offers, than unsuccessful bids.They also feature a higher fraction of experienced bidders.Finally, a marginally significant difference exists in the q ratioof the target, which is higher among successful bids. Thereare no significant differences, however, in the q ratio of theacquirer or in the proportion of bids for which the acquirer's qis greater than the target's q.
Panel B of Table 1 provides more details on pure dealswithin the subsample of unsuccessful bids.12 These dealsmake up roughly four-fifths of the main sample. There areonly few significant differences between cash and stocktransactions. Cash deals are more likely to be hostile or tenderoffers, and both bidders and targets have lower q ratios. Thereare no significant differences in the acquirer-to-target q ratios.
Failure reasons: We categorize the reasons for bid failurebased on a detailed news search in LexisNexis and on the dealsynopses in SDC. Table 2 shows the main categories. The firstfive categories summarize cases in which the deal failed dueto a negative response of the target to the bid or due to(typically negative) news about the target. “Price too low”
indicates that the parties could not agree on the transactionprice. “Management rejection” indicates that the target man-agement prevented the takeover, for example by adoptingpoison pills, by repurchasing shares from the bidder (green-mail), or by deliberately breaching merger covenants.“Shareholder rejection” indicates rejection by shareholders,e.g., leading to an insufficient number of shares being ten-dered. “Target news (public)” refers to failed deals associatedwith (typically bad) public news about the target.13 “Targetnews (private)” refers to failed deals in which the acquirerdiscovered (bad) information in the due diligence process.
The next two categories summarize reasons that likelyaffect both the target and the acquirer. “Market problems”summarizes failures due to market-wide downturns, mostlythe October 1987 crash, September 11, and the subprimecrisis. “Industry problems” are industry-wide shocks such asadverse oil price developments for oil companies.
The next four categories are all cases in which the endo-geneity of failure with respect to target value should be less ofa concern. “Regulator” refers to lack of regulatory approval asrevealed by our news search or the SDC data. For example,General Electric's proposed acquisition of Honeywell inOctober 2000 was blocked by the European Commission, in adecision that deviated from the US Department of Justice'sview. “Management terms” refers to cases in which targetmanagement and acquirer management could not agree onorganizational issues, such as the nomination of a Chief
12 For completeness, we also show the characteristics of successfulpure deals in Appendix Table B1.
13 One deal in our sample failed due to positive news about thetarget. In August 1996, US Diagnostic Labs called off the acquisition ofAlliance Imaging because of a run-up in Alliance's stock price.
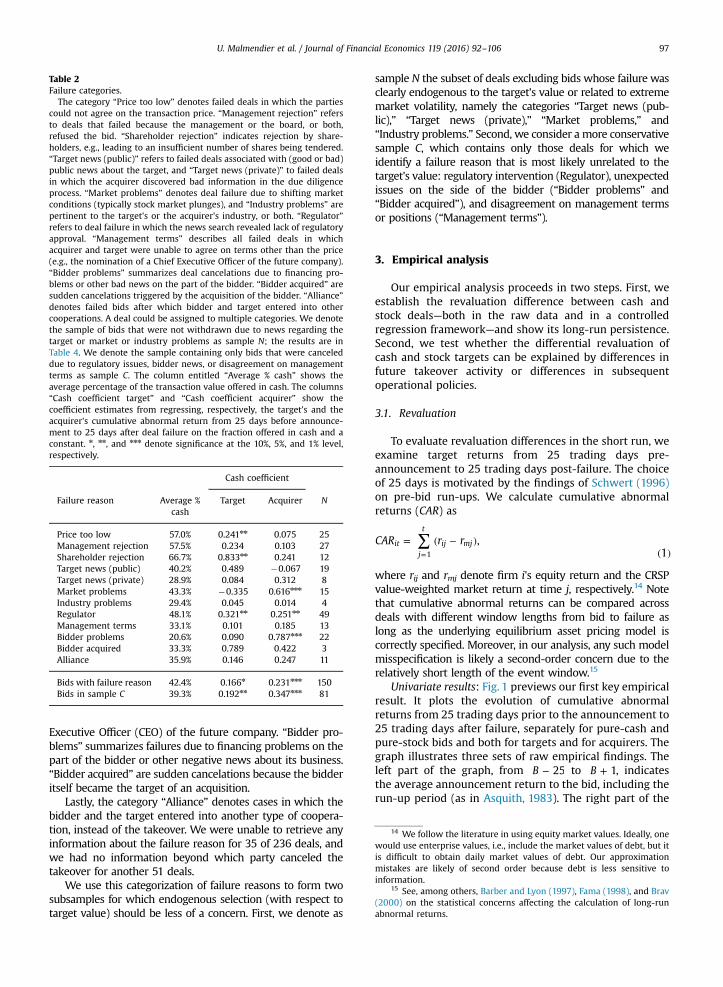
Table 2Failure categories.
The category “Price too low” denotes failed deals in which the partiescould not agree on the transaction price. “Management rejection” refersto deals that failed because the management or the board, or both,refused the bid. “Shareholder rejection” indicates rejection by share-holders, e.g., leading to an insufficient number of shares being tendered.“Target news (public)” refers to failed deals associated with (good or bad)public news about the target, and “Target news (private)” to failed dealsin which the acquirer discovered bad information in the due diligenceprocess. “Market problems” denotes deal failure due to shifting marketconditions (typically stock market plunges), and “Industry problems” arepertinent to the target's or the acquirer's industry, or both. “Regulator”refers to deal failure in which the news search revealed lack of regulatoryapproval. “Management terms” describes all failed deals in whichacquirer and target were unable to agree on terms other than the price(e.g., the nomination of a Chief Executive Officer of the future company).“Bidder problems” summarizes deal cancelations due to financing pro-blems or other bad news on the part of the bidder. “Bidder acquired” aresudden cancelations triggered by the acquisition of the bidder. “Alliance”denotes failed bids after which bidder and target entered into othercooperations. A deal could be assigned to multiple categories. We denotethe sample of bids that were not withdrawn due to news regarding thetarget or market or industry problems as sample N; the results are inTable 4. We denote the sample containing only bids that were canceleddue to regulatory issues, bidder news, or disagreement on managementterms as sample C. The column entitled “Average % cash” shows theaverage percentage of the transaction value offered in cash. The columns“Cash coefficient target” and “Cash coefficient acquirer” show thecoefficient estimates from regressing, respectively, the target's and theacquirer's cumulative abnormal return from 25 days before announce-ment to 25 days after deal failure on the fraction offered in cash and aconstant. n, nn, and nnn denote significance at the 10%, 5%, and 1% level,respectively.
Cash coefficient
Failure reason Average %cash
Target Acquirer N
Price too low 57.0% 0.241nn 0.075 25Management rejection 57.5% 0.234 0.103 27Shareholder rejection 66.7% 0.833nn 0.241 12Target news (public) 40.2% 0.489 �0.067 19Target news (private) 28.9% 0.084 0.312 8Market problems 43.3% �0.335 0.616nnn 15Industry problems 29.4% 0.045 0.014 4Regulator 48.1% 0.321nn 0.251nn 49Management terms 33.1% 0.101 0.185 13Bidder problems 20.6% 0.090 0.787nnn 22Bidder acquired 33.3% 0.789 0.422 3Alliance 35.9% 0.146 0.247 11
Bids with failure reason 42.4% 0.166n 0.231nnn 150Bids in sample C 39.3% 0.192nn 0.347nnn 81
14 We follow the literature in using equity market values. Ideally, onewould use enterprise values, i.e., include the market values of debt, but itis difficult to obtain daily market values of debt. Our approximationmistakes are likely of second order because debt is less sensitive toinformation.
15 See, among others, Barber and Lyon (1997), Fama (1998), and Brav(2000) on the statistical concerns affecting the calculation of long-runabnormal returns.
U. Malmendier et al. / Journal of Financial Economics 119 (2016) 92–106 97
Executive Officer (CEO) of the future company. “Bidder pro-blems” summarizes failures due to financing problems on thepart of the bidder or other negative news about its business.“Bidder acquired” are sudden cancelations because the bidderitself became the target of an acquisition.
Lastly, the category “Alliance” denotes cases in which thebidder and the target entered into another type of coopera-tion, instead of the takeover. We were unable to retrieve anyinformation about the failure reason for 35 of 236 deals, andwe had no information beyond which party canceled thetakeover for another 51 deals.
We use this categorization of failure reasons to form twosubsamples for which endogenous selection (with respect totarget value) should be less of a concern. First, we denote as
sample N the subset of deals excluding bids whose failure wasclearly endogenous to the target's value or related to extrememarket volatility, namely the categories “Target news (pub-lic),” “Target news (private),” “Market problems,” and“Industry problems.” Second, we consider a more conservativesample C, which contains only those deals for which weidentify a failure reason that is most likely unrelated to thetarget's value: regulatory intervention (Regulator), unexpectedissues on the side of the bidder (“Bidder problems” and“Bidder acquired”), and disagreement on management termsor positions (“Management terms”).
3. Empirical analysis
Our empirical analysis proceeds in two steps. First, weestablish the revaluation difference between cash andstock deals—both in the raw data and in a controlledregression framework—and show its long-run persistence.Second, we test whether the differential revaluation ofcash and stock targets can be explained by differences infuture takeover activity or differences in subsequentoperational policies.
3.1. Revaluation
To evaluate revaluation differences in the short run, weexamine target returns from 25 trading days pre-announcement to 25 trading days post-failure. The choiceof 25 days is motivated by the findings of Schwert (1996)on pre-bid run-ups. We calculate cumulative abnormalreturns (CAR) as
CAR r r ,1
itj
t
ij mj1
∑= ( − )( )=
where rij and rmj denote firm i's equity return and the CRSPvalue-weighted market return at time j, respectively.14 Notethat cumulative abnormal returns can be compared acrossdeals with different window lengths from bid to failure aslong as the underlying equilibrium asset pricing model iscorrectly specified. Moreover, in our analysis, any such modelmisspecification is likely a second-order concern due to therelatively short length of the event window.15
Univariate results: Fig. 1 previews our first key empiricalresult. It plots the evolution of cumulative abnormalreturns from 25 trading days prior to the announcement to25 trading days after failure, separately for pure-cash andpure-stock bids and both for targets and for acquirers. Thegraph illustrates three sets of raw empirical findings. Theleft part of the graph, from B 25− to B 1+ , indicatesthe average announcement return to the bid, including therun-up period (as in Asquith, 1983). The right part of the
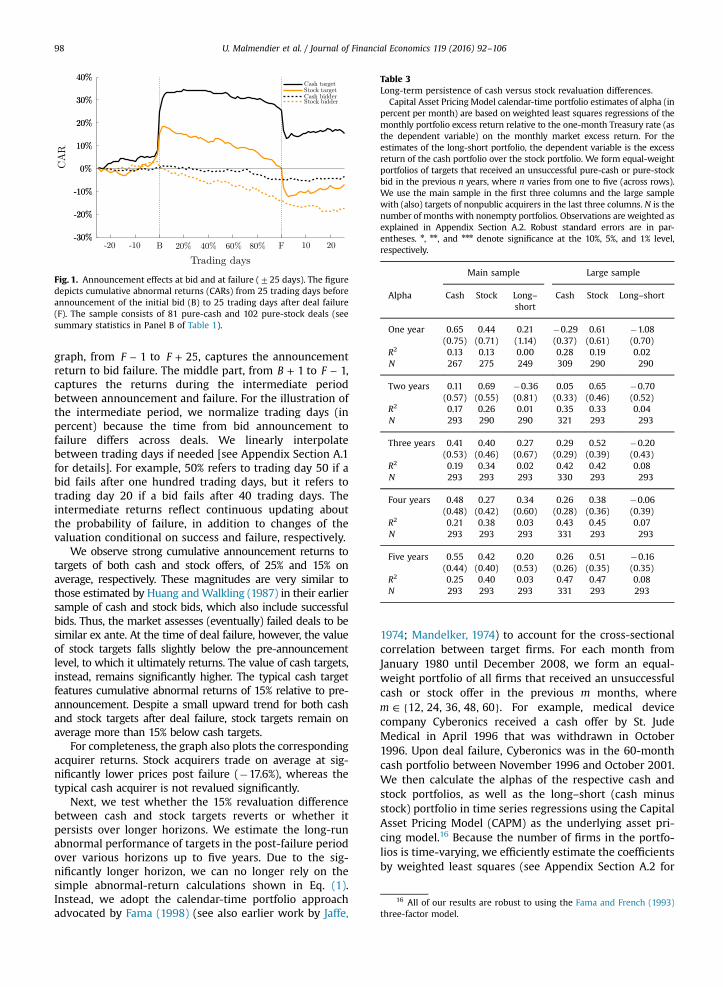
Fig. 1. Announcement effects at bid and at failure (725 days). The figuredepicts cumulative abnormal returns (CARs) from 25 trading days beforeannouncement of the initial bid (B) to 25 trading days after deal failure(F). The sample consists of 81 pure-cash and 102 pure-stock deals (seesummary statistics in Panel B of Table 1).
Table 3Long-term persistence of cash versus stock revaluation differences.
Capital Asset Pricing Model calendar-time portfolio estimates of alpha (inpercent per month) are based on weighted least squares regressions of themonthly portfolio excess return relative to the one-month Treasury rate (asthe dependent variable) on the monthly market excess return. For theestimates of the long-short portfolio, the dependent variable is the excessreturn of the cash portfolio over the stock portfolio. We form equal-weightportfolios of targets that received an unsuccessful pure-cash or pure-stockbid in the previous n years, where n varies from one to five (across rows).We use the main sample in the first three columns and the large samplewith (also) targets of nonpublic acquirers in the last three columns. N is thenumber of months with nonempty portfolios. Observations are weighted asexplained in Appendix Section A.2. Robust standard errors are in par-entheses. n, nn, and nnn denote significance at the 10%, 5%, and 1% level,respectively.
Main sample Large sample
Alpha Cash Stock Long–short
Cash Stock Long–short
One year 0.65 0.44 0.21 �0.29 0.61 �1.08(0.75) (0.71) (1.14) (0.37) (0.61) (0.70)
R2 0.13 0.13 0.00 0.28 0.19 0.02N 267 275 249 309 290 290
Two years 0.11 0.69 �0.36 0.05 0.65 �0.70(0.57) (0.55) (0.81) (0.33) (0.46) (0.52)
R2 0.17 0.26 0.01 0.35 0.33 0.04N 293 290 290 321 293 293
Three years 0.41 0.40 0.27 0.29 0.52 �0.20(0.53) (0.46) (0.67) (0.29) (0.39) (0.43)
R2 0.19 0.34 0.02 0.42 0.42 0.08N 293 293 293 330 293 293
Four years 0.48 0.27 0.34 0.26 0.38 �0.06(0.48) (0.42) (0.60) (0.28) (0.36) (0.39)
R2 0.21 0.38 0.03 0.43 0.45 0.07N 293 293 293 331 293 293
Five years 0.55 0.42 0.20 0.26 0.51 �0.16(0.44) (0.40) (0.53) (0.26) (0.35) (0.35)
R2 0.25 0.40 0.03 0.47 0.47 0.08N 293 293 293 331 293 293
16 All of our results are robust to using the Fama and French (1993)three-factor model.
U. Malmendier et al. / Journal of Financial Economics 119 (2016) 92–10698
graph, from F 1− to F 25+ , captures the announcementreturn to bid failure. The middle part, from B 1+ to F 1− ,captures the returns during the intermediate periodbetween announcement and failure. For the illustration ofthe intermediate period, we normalize trading days (inpercent) because the time from bid announcement tofailure differs across deals. We linearly interpolatebetween trading days if needed [see Appendix Section A.1for details]. For example, 50% refers to trading day 50 if abid fails after one hundred trading days, but it refers totrading day 20 if a bid fails after 40 trading days. Theintermediate returns reflect continuous updating aboutthe probability of failure, in addition to changes of thevaluation conditional on success and failure, respectively.
We observe strong cumulative announcement returns totargets of both cash and stock offers, of 25% and 15% onaverage, respectively. These magnitudes are very similar tothose estimated by Huang andWalkling (1987) in their earliersample of cash and stock bids, which also include successfulbids. Thus, the market assesses (eventually) failed deals to besimilar ex ante. At the time of deal failure, however, the valueof stock targets falls slightly below the pre-announcementlevel, to which it ultimately returns. The value of cash targets,instead, remains significantly higher. The typical cash targetfeatures cumulative abnormal returns of 15% relative to pre-announcement. Despite a small upward trend for both cashand stock targets after deal failure, stock targets remain onaverage more than 15% below cash targets.
For completeness, the graph also plots the correspondingacquirer returns. Stock acquirers trade on average at sig-nificantly lower prices post failure (�17.6%), whereas thetypical cash acquirer is not revalued significantly.
Next, we test whether the 15% revaluation differencebetween cash and stock targets reverts or whether itpersists over longer horizons. We estimate the long-runabnormal performance of targets in the post-failure periodover various horizons up to five years. Due to the sig-nificantly longer horizon, we can no longer rely on thesimple abnormal-return calculations shown in Eq. (1).Instead, we adopt the calendar-time portfolio approachadvocated by Fama (1998) (see also earlier work by Jaffe,
1974; Mandelker, 1974) to account for the cross-sectionalcorrelation between target firms. For each month fromJanuary 1980 until December 2008, we form an equal-weight portfolio of all firms that received an unsuccessfulcash or stock offer in the previous m months, wherem 12, 24, 36, 48, 60∈ { }. For example, medical devicecompany Cyberonics received a cash offer by St. JudeMedical in April 1996 that was withdrawn in October1996. Upon deal failure, Cyberonics was in the 60-monthcash portfolio between November 1996 and October 2001.We then calculate the alphas of the respective cash andstock portfolios, as well as the long–short (cash minusstock) portfolio in time series regressions using the CapitalAsset Pricing Model (CAPM) as the underlying asset pri-cing model.16 Because the number of firms in the portfo-lios is time-varying, we efficiently estimate the coefficientsby weighted least squares (see Appendix Section A.2 for
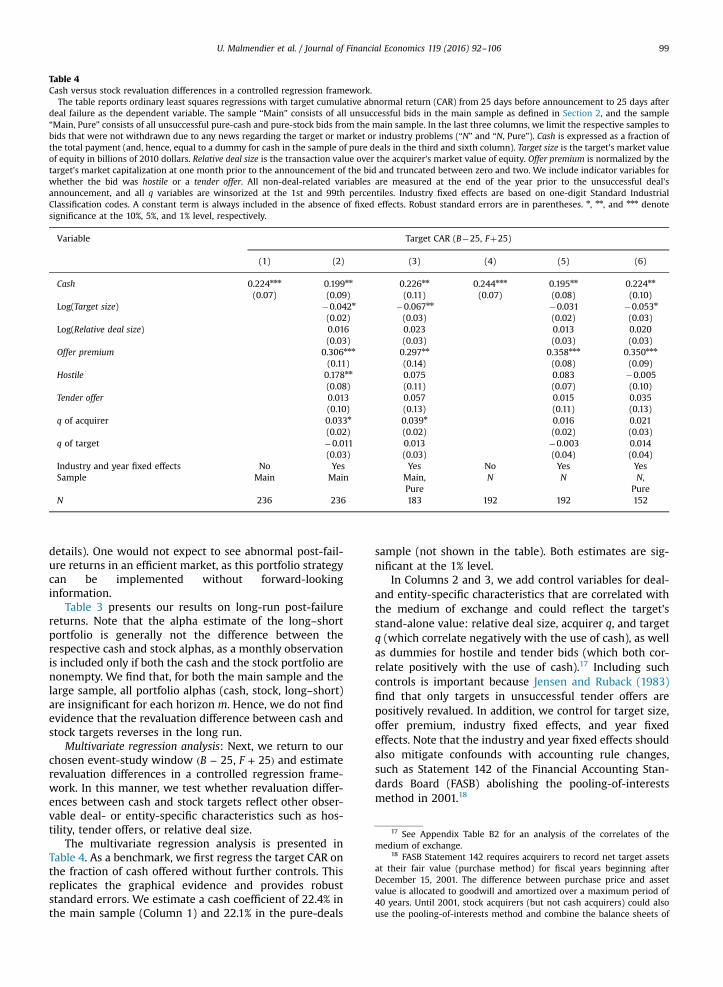
Table 4Cash versus stock revaluation differences in a controlled regression framework.
The table reports ordinary least squares regressions with target cumulative abnormal return (CAR) from 25 days before announcement to 25 days afterdeal failure as the dependent variable. The sample “Main” consists of all unsuccessful bids in the main sample as defined in Section 2, and the sample“Main, Pure” consists of all unsuccessful pure-cash and pure-stock bids from the main sample. In the last three columns, we limit the respective samples tobids that were not withdrawn due to any news regarding the target or market or industry problems (“N” and “N, Pure”). Cash is expressed as a fraction ofthe total payment (and, hence, equal to a dummy for cash in the sample of pure deals in the third and sixth column). Target size is the target's market valueof equity in billions of 2010 dollars. Relative deal size is the transaction value over the acquirer's market value of equity. Offer premium is normalized by thetarget's market capitalization at one month prior to the announcement of the bid and truncated between zero and two. We include indicator variables forwhether the bid was hostile or a tender offer. All non-deal-related variables are measured at the end of the year prior to the unsuccessful deal'sannouncement, and all q variables are winsorized at the 1st and 99th percentiles. Industry fixed effects are based on one-digit Standard IndustrialClassification codes. A constant term is always included in the absence of fixed effects. Robust standard errors are in parentheses. n, nn, and nnn denotesignificance at the 10%, 5%, and 1% level, respectively.
Variable Target CAR (B�25, Fþ25)
(1) (2) (3) (4) (5) (6)
Cash 0.224nnn 0.199nn 0.226nn 0.244nnn 0.195nn 0.224nn
(0.07) (0.09) (0.11) (0.07) (0.08) (0.10)Log(Target size) �0.042n �0.067nn �0.031 �0.053n
(0.02) (0.03) (0.02) (0.03)Log(Relative deal size) 0.016 0.023 0.013 0.020
(0.03) (0.03) (0.03) (0.03)Offer premium 0.306nnn 0.297nn 0.358nnn 0.350nnn
(0.11) (0.14) (0.08) (0.09)Hostile 0.178nn 0.075 0.083 �0.005
(0.08) (0.11) (0.07) (0.10)Tender offer 0.013 0.057 0.015 0.035
(0.10) (0.13) (0.11) (0.13)q of acquirer 0.033n 0.039n 0.016 0.021
(0.02) (0.02) (0.02) (0.03)q of target �0.011 0.013 �0.003 0.014
(0.03) (0.03) (0.04) (0.04)Industry and year fixed effects No Yes Yes No Yes YesSample Main Main Main, N N N,
Pure PureN 236 236 183 192 192 152
17 See Appendix Table B2 for an analysis of the correlates of themedium of exchange.
18 FASB Statement 142 requires acquirers to record net target assetsat their fair value (purchase method) for fiscal years beginning afterDecember 15, 2001. The difference between purchase price and assetvalue is allocated to goodwill and amortized over a maximum period of40 years. Until 2001, stock acquirers (but not cash acquirers) could alsouse the pooling-of-interests method and combine the balance sheets of
U. Malmendier et al. / Journal of Financial Economics 119 (2016) 92–106 99
details). One would not expect to see abnormal post-fail-ure returns in an efficient market, as this portfolio strategycan be implemented without forward-lookinginformation.
Table 3 presents our results on long-run post-failurereturns. Note that the alpha estimate of the long–shortportfolio is generally not the difference between therespective cash and stock alphas, as a monthly observationis included only if both the cash and the stock portfolio arenonempty. We find that, for both the main sample and thelarge sample, all portfolio alphas (cash, stock, long–short)are insignificant for each horizon m. Hence, we do not findevidence that the revaluation difference between cash andstock targets reverses in the long run.
Multivariate regression analysis: Next, we return to ourchosen event-study window B F25, 25( − + ) and estimaterevaluation differences in a controlled regression frame-work. In this manner, we test whether revaluation differ-ences between cash and stock targets reflect other obser-vable deal- or entity-specific characteristics such as hos-tility, tender offers, or relative deal size.
The multivariate regression analysis is presented inTable 4. As a benchmark, we first regress the target CAR onthe fraction of cash offered without further controls. Thisreplicates the graphical evidence and provides robuststandard errors. We estimate a cash coefficient of 22.4% inthe main sample (Column 1) and 22.1% in the pure-deals
sample (not shown in the table). Both estimates are sig-nificant at the 1% level.
In Columns 2 and 3, we add control variables for deal-and entity-specific characteristics that are correlated withthe medium of exchange and could reflect the target'sstand-alone value: relative deal size, acquirer q, and targetq (which correlate negatively with the use of cash), as wellas dummies for hostile and tender bids (which both cor-relate positively with the use of cash).17 Including suchcontrols is important because Jensen and Ruback (1983)find that only targets in unsuccessful tender offers arepositively revalued. In addition, we control for target size,offer premium, industry fixed effects, and year fixedeffects. Note that the industry and year fixed effects shouldalso mitigate confounds with accounting rule changes,such as Statement 142 of the Financial Accounting Stan-dards Board (FASB) abolishing the pooling-of-interestsmethod in 2001.18
U. Malmendier et al. / Journal of Financial Economics 119 (2016) 92–106100
After including these controls, the cash coefficientremains similar: 19.9% in the main sample (Column 2) and22.6% in the pure-deals sample (Column 3). The analysisalso reveals that, in addition to the medium of exchange,deal premia correlate strongly with target CARs. Intui-tively, the more the bidder is willing to pay, the higher isthe market revaluation. We also find that smaller targetsare revalued more, possibly reflecting that a bid conveysmore new information to the market if the target is small.
The cash effect is also present in the large sample of675 bids, which includes nonpublic acquirers (seeAppendix Table B3). The point estimates become some-what smaller but are still statistically and economicallysignificant. The smaller magnitudes may be explained bythe fact that private acquirers have less of a choicebetween cash and stock, making a cash offer a weakersignal of target value.
Endogenous selection into deal failure: So far, we haveshown that variables known at the time of dealannouncements do not explain the differential revaluationof cash targets. A different concern is selection into dealfailure, as the choice of cash versus stock payment couldbe correlated with deal failure. The summary statistics inPanel A of Table 1 reveal that the fraction of the totalpayment offered in cash does not correlate with dealfailure, i.e., the fraction of cash offered in successful deals(45.93%) is very similar to that in unsuccessful deals(44.03%). However, revaluation differences between cashand stock targets still could be driven by differentialsorting of cash and stock deals into failure. For example,good news about the target could make cash deals, but notstock deals, more likely to fail because a financially con-strained bidder is unable to increase the bid in cash,leading to overproportional failure of cash bids for targetswith high (re-)valuation.
We have addressed this specific concern in the exampleabove by controlling for financial constraints of theacquirer (as measured by the Kaplan and Zingales, 1997index). In all specifications based on Table 4, the coeffi-cients on the KZ index as well as its interactions with cashare insignificant.19 However, even if this specific concerndoes not apply, the more general argument remains andcan be illustrated as follows. Suppose that there are onlytwo failure reasons, A and B. Failure reason A is associatedwith targets that are revalued by 30%, and failure reason Bis associated with targets that are revalued by �10%,which holds for both cash and stock targets. If 75% of allcash deals, but only 25% of all stock deals, occur in
(footnote continued)the merging entities to a consolidated balance sheet. Acquirers oftenpreferred the pooling-of-interests method to avoid the amortization ofgoodwill and, thus, future reductions in reportable earnings (see Aboody,Kasznik, and Williams, 2000; Jennings, LeClere, and Thompson, 2001),possibly tilting the medium of exchange toward stock. Lys and Vincent(1995) describe an extreme case—AT&T's acquisition of NCR—of thebidder's interest in having the acquisition qualify as a pooling of interests.In additional regressions (unreported), we include an interaction termbetween cash and a dummy for the pre-2002 period but fail to find asignificant effect.
19 We omit these results, which are available upon request, for thesake of brevity.
category A, then one should observe an overall revaluationeffect of 20% for cash deals and 0% for stock deals, eventhough, within each category, there is no differentialrevaluation effect of cash and stock deals.
To address the concern that our differential revaluationestimates could be driven by specific deal-failure cate-gories, we make use of our hand-collected sample of fail-ure reasons. We reestimate the cash coefficient for thesample N, described in Section 2, which excludes bidswhose failure was endogenous to the target's value orcaused by market- or industry-wide problems, which(also) affect the target. The results are shown in Columns4 to 6 of Table 4. In all regression specifications, we con-tinue to estimate a positive cash coefficient, statisticallysignificant and very similar in size to those estimated forthe main sample in Columns 1 to 3.
We also reestimate the cash coefficient for the moreconservative sample C. As outlined in Section 2, sample Cconsists only of deals that failed due to regulatory inter-vention, news about the bidder, or disagreement onmanagement terms. The results are shown in the second-to-last row of Table 2. Here, the small sample size confinesus to a univariate regression, mirroring Columns 1 and 4 ofTable 4. We estimate a very similar cash coefficient of19.2%, which is significant at the 5% level. Moreover, asshown in the second column of Table 2, we also reestimatethe cash coefficient separately for every single failurecategory identified by our news search. We find a positivecash coefficient for all of the 12 categories except “Marketproblems,” which reflects that revaluation estimates forindividual companies during market crashes such as Sep-tember 11 or October 1987 are extremely volatile, evenafter adjusting for market returns.
Subject to the caveat that we can address selectionbased only on publicly available information, the robust-ness of our results across failure categories suggests thatselection into deal failure is unlikely to drive the (differ-ential) cash effect on target CARs.
3.2. Possible channels
To understand the source of the revaluation differencebetween cash and stock targets, we consider two channelsthat the literature has deemed important. First, a failed offeridentifies a firm as a likely target of further takeover bids, andthe anticipated future takeover premia lead to revaluation(see Bradley, Desai, and Kim, 1983 and, more recently,Edmans, Goldstein, and Jiang, 2012). Second, a failed takeoverbid could induce the target management to make operationalimprovements (see, e.g., Safieddine and Titman, 1999). Forour purposes, the relevant issue is whether cash and stockdeals are differentially exposed to these channels. Do failedcash bids induce higher future takeover premia than failedstock bids? Do they prompt better operational changes?
3.2.1. Future takeover activityTo assess the empirical significance of future takeovers
for the cash–stock revaluation difference, we test whetherthe likelihood and timing of subsequent offers as well astheir value are related to the medium of exchange used inthe prior (failed) takeover attempt. We benchmark the
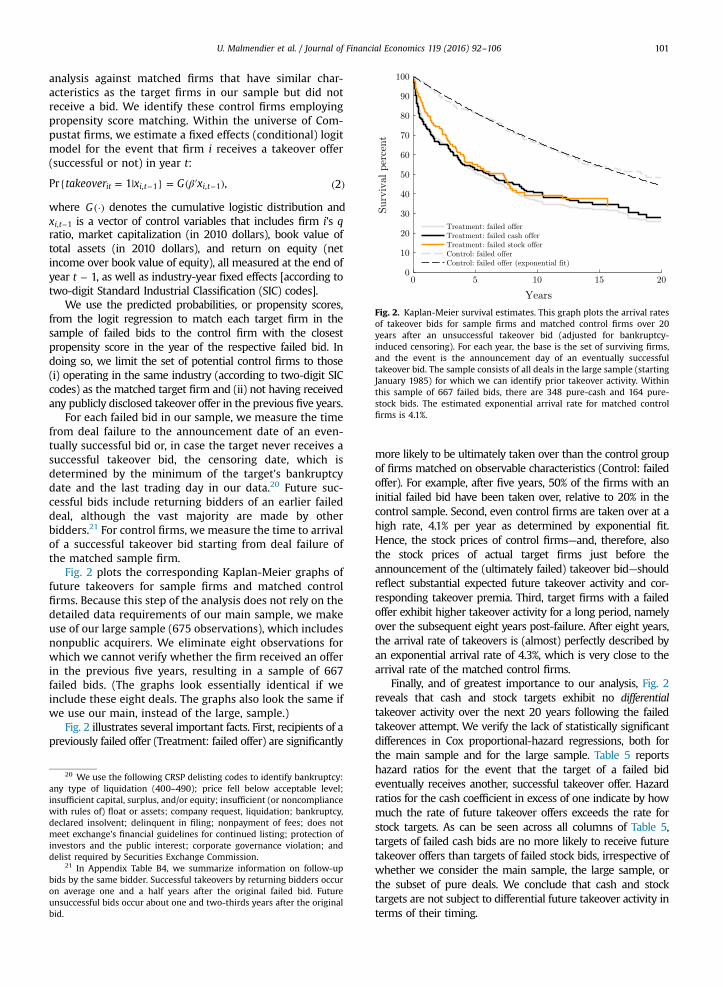
Fig. 2. Kaplan-Meier survival estimates. This graph plots the arrival ratesof takeover bids for sample firms and matched control firms over 20years after an unsuccessful takeover bid (adjusted for bankruptcy-induced censoring). For each year, the base is the set of surviving firms,and the event is the announcement day of an eventually successfultakeover bid. The sample consists of all deals in the large sample (startingJanuary 1985) for which we can identify prior takeover activity. Withinthis sample of 667 failed bids, there are 348 pure-cash and 164 pure-stock bids. The estimated exponential arrival rate for matched controlfirms is 4.1%.
U. Malmendier et al. / Journal of Financial Economics 119 (2016) 92–106 101
analysis against matched firms that have similar char-acteristics as the target firms in our sample but did notreceive a bid. We identify these control firms employingpropensity score matching. Within the universe of Com-pustat firms, we estimate a fixed effects (conditional) logitmodel for the event that firm i receives a takeover offer(successful or not) in year t:
takeover x G xPr 1 , 2it i t i t, 1 , 1β{ = | } = ( ′ ) ( )− −
where G (·) denotes the cumulative logistic distribution andxi t, 1− is a vector of control variables that includes firm i's qratio, market capitalization (in 2010 dollars), book value oftotal assets (in 2010 dollars), and return on equity (netincome over book value of equity), all measured at the end ofyear t 1− , as well as industry-year fixed effects [according totwo-digit Standard Industrial Classification (SIC) codes].
We use the predicted probabilities, or propensity scores,from the logit regression to match each target firm in thesample of failed bids to the control firm with the closestpropensity score in the year of the respective failed bid. Indoing so, we limit the set of potential control firms to those(i) operating in the same industry (according to two-digit SICcodes) as the matched target firm and (ii) not having receivedany publicly disclosed takeover offer in the previous five years.
For each failed bid in our sample, we measure the timefrom deal failure to the announcement date of an even-tually successful bid or, in case the target never receives asuccessful takeover bid, the censoring date, which isdetermined by the minimum of the target's bankruptcydate and the last trading day in our data.20 Future suc-cessful bids include returning bidders of an earlier faileddeal, although the vast majority are made by otherbidders.21 For control firms, we measure the time to arrivalof a successful takeover bid starting from deal failure ofthe matched sample firm.
Fig. 2 plots the corresponding Kaplan-Meier graphs offuture takeovers for sample firms and matched controlfirms. Because this step of the analysis does not rely on thedetailed data requirements of our main sample, we makeuse of our large sample (675 observations), which includesnonpublic acquirers. We eliminate eight observations forwhich we cannot verify whether the firm received an offerin the previous five years, resulting in a sample of 667failed bids. (The graphs look essentially identical if weinclude these eight deals. The graphs also look the same ifwe use our main, instead of the large, sample.)
Fig. 2 illustrates several important facts. First, recipients of apreviously failed offer (Treatment: failed offer) are significantly
20 We use the following CRSP delisting codes to identify bankruptcy:any type of liquidation (400–490); price fell below acceptable level;insufficient capital, surplus, and/or equity; insufficient (or noncompliancewith rules of) float or assets; company request, liquidation; bankruptcy,declared insolvent; delinquent in filing; nonpayment of fees; does notmeet exchange's financial guidelines for continued listing; protection ofinvestors and the public interest; corporate governance violation; anddelist required by Securities Exchange Commission.
21 In Appendix Table B4, we summarize information on follow-upbids by the same bidder. Successful takeovers by returning bidders occuron average one and a half years after the original failed bid. Futureunsuccessful bids occur about one and two-thirds years after the originalbid.
more likely to be ultimately taken over than the control groupof firms matched on observable characteristics (Control: failedoffer). For example, after five years, 50% of the firms with aninitial failed bid have been taken over, relative to 20% in thecontrol sample. Second, even control firms are taken over at ahigh rate, 4.1% per year as determined by exponential fit.Hence, the stock prices of control firms—and, therefore, alsothe stock prices of actual target firms just before theannouncement of the (ultimately failed) takeover bid—shouldreflect substantial expected future takeover activity and cor-responding takeover premia. Third, target firms with a failedoffer exhibit higher takeover activity for a long period, namelyover the subsequent eight years post-failure. After eight years,the arrival rate of takeovers is (almost) perfectly described byan exponential arrival rate of 4.3%, which is very close to thearrival rate of the matched control firms.
Finally, and of greatest importance to our analysis, Fig. 2reveals that cash and stock targets exhibit no differentialtakeover activity over the next 20 years following the failedtakeover attempt. We verify the lack of statistically significantdifferences in Cox proportional-hazard regressions, both forthe main sample and for the large sample. Table 5 reportshazard ratios for the event that the target of a failed bideventually receives another, successful takeover offer. Hazardratios for the cash coefficient in excess of one indicate by howmuch the rate of future takeover offers exceeds the rate forstock targets. As can be seen across all columns of Table 5,targets of failed cash bids are no more likely to receive futuretakeover offers than targets of failed stock bids, irrespective ofwhether we consider the main sample, the large sample, orthe subset of pure deals. We conclude that cash and stocktargets are not subject to differential future takeover activity interms of their timing.
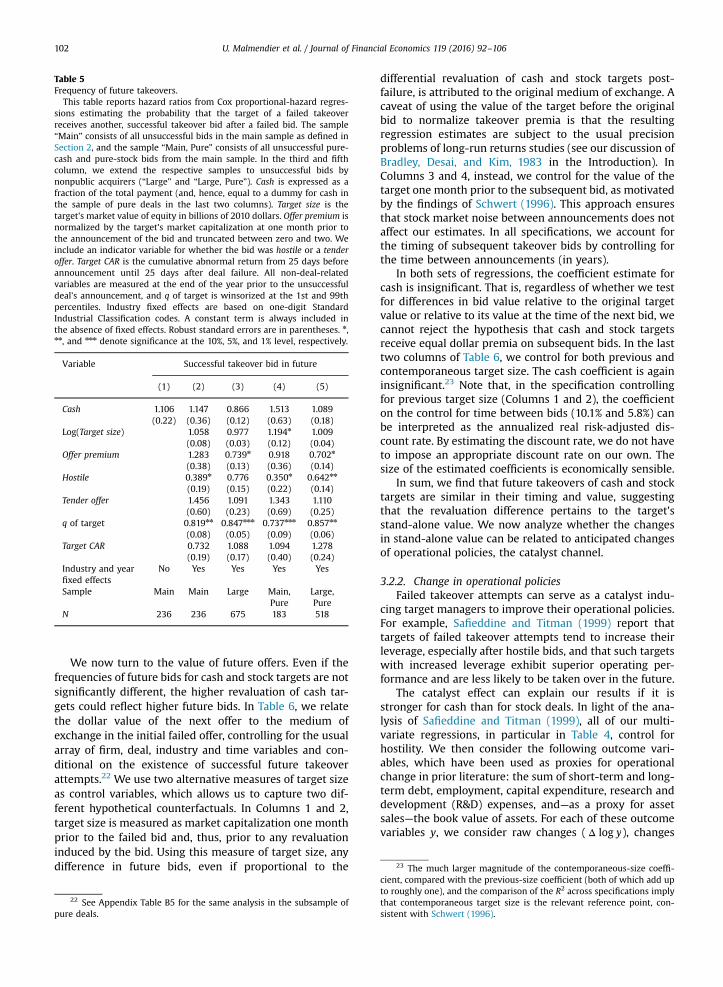
Table 5Frequency of future takeovers.
This table reports hazard ratios from Cox proportional-hazard regres-sions estimating the probability that the target of a failed takeoverreceives another, successful takeover bid after a failed bid. The sample“Main” consists of all unsuccessful bids in the main sample as defined inSection 2, and the sample “Main, Pure” consists of all unsuccessful pure-cash and pure-stock bids from the main sample. In the third and fifthcolumn, we extend the respective samples to unsuccessful bids bynonpublic acquirers (“Large” and “Large, Pure”). Cash is expressed as afraction of the total payment (and, hence, equal to a dummy for cash inthe sample of pure deals in the last two columns). Target size is thetarget's market value of equity in billions of 2010 dollars. Offer premium isnormalized by the target's market capitalization at one month prior tothe announcement of the bid and truncated between zero and two. Weinclude an indicator variable for whether the bid was hostile or a tenderoffer. Target CAR is the cumulative abnormal return from 25 days beforeannouncement until 25 days after deal failure. All non-deal-relatedvariables are measured at the end of the year prior to the unsuccessfuldeal's announcement, and q of target is winsorized at the 1st and 99thpercentiles. Industry fixed effects are based on one-digit StandardIndustrial Classification codes. A constant term is always included inthe absence of fixed effects. Robust standard errors are in parentheses. n,nn, and nnn denote significance at the 10%, 5%, and 1% level, respectively.
Variable Successful takeover bid in future
(1) (2) (3) (4) (5)
Cash 1.106 1.147 0.866 1.513 1.089(0.22) (0.36) (0.12) (0.63) (0.18)
Log(Target size) 1.058 0.977 1.194n 1.009(0.08) (0.03) (0.12) (0.04)
Offer premium 1.283 0.739n 0.918 0.702n
(0.38) (0.13) (0.36) (0.14)Hostile 0.389n 0.776 0.350n 0.642nn
(0.19) (0.15) (0.22) (0.14)Tender offer 1.456 1.091 1.343 1.110
(0.60) (0.23) (0.69) (0.25)q of target 0.819nn 0.847nnn 0.737nnn 0.857nn
(0.08) (0.05) (0.09) (0.06)Target CAR 0.732 1.088 1.094 1.278
(0.19) (0.17) (0.40) (0.24)Industry and year No Yes Yes Yes Yesfixed effectsSample Main Main Large Main, Large,
Pure PureN 236 236 675 183 518
23 The much larger magnitude of the contemporaneous-size coeffi-
U. Malmendier et al. / Journal of Financial Economics 119 (2016) 92–106102
We now turn to the value of future offers. Even if thefrequencies of future bids for cash and stock targets are notsignificantly different, the higher revaluation of cash tar-gets could reflect higher future bids. In Table 6, we relatethe dollar value of the next offer to the medium ofexchange in the initial failed offer, controlling for the usualarray of firm, deal, industry and time variables and con-ditional on the existence of successful future takeoverattempts.22 We use two alternative measures of target sizeas control variables, which allows us to capture two dif-ferent hypothetical counterfactuals. In Columns 1 and 2,target size is measured as market capitalization one monthprior to the failed bid and, thus, prior to any revaluationinduced by the bid. Using this measure of target size, anydifference in future bids, even if proportional to the
22 See Appendix Table B5 for the same analysis in the subsample ofpure deals.
differential revaluation of cash and stock targets post-failure, is attributed to the original medium of exchange. Acaveat of using the value of the target before the originalbid to normalize takeover premia is that the resultingregression estimates are subject to the usual precisionproblems of long-run returns studies (see our discussion ofBradley, Desai, and Kim, 1983 in the Introduction). InColumns 3 and 4, instead, we control for the value of thetarget one month prior to the subsequent bid, as motivatedby the findings of Schwert (1996). This approach ensuresthat stock market noise between announcements does notaffect our estimates. In all specifications, we account forthe timing of subsequent takeover bids by controlling forthe time between announcements (in years).
In both sets of regressions, the coefficient estimate forcash is insignificant. That is, regardless of whether we testfor differences in bid value relative to the original targetvalue or relative to its value at the time of the next bid, wecannot reject the hypothesis that cash and stock targetsreceive equal dollar premia on subsequent bids. In the lasttwo columns of Table 6, we control for both previous andcontemporaneous target size. The cash coefficient is againinsignificant.23 Note that, in the specification controllingfor previous target size (Columns 1 and 2), the coefficienton the control for time between bids (10.1% and 5.8%) canbe interpreted as the annualized real risk-adjusted dis-count rate. By estimating the discount rate, we do not haveto impose an appropriate discount rate on our own. Thesize of the estimated coefficients is economically sensible.
In sum, we find that future takeovers of cash and stocktargets are similar in their timing and value, suggestingthat the revaluation difference pertains to the target'sstand-alone value. We now analyze whether the changesin stand-alone value can be related to anticipated changesof operational policies, the catalyst channel.
3.2.2. Change in operational policiesFailed takeover attempts can serve as a catalyst indu-
cing target managers to improve their operational policies.For example, Safieddine and Titman (1999) report thattargets of failed takeover attempts tend to increase theirleverage, especially after hostile bids, and that such targetswith increased leverage exhibit superior operating per-formance and are less likely to be taken over in the future.
The catalyst effect can explain our results if it isstronger for cash than for stock deals. In light of the ana-lysis of Safieddine and Titman (1999), all of our multi-variate regressions, in particular in Table 4, control forhostility. We then consider the following outcome vari-ables, which have been used as proxies for operationalchange in prior literature: the sum of short-term and long-term debt, employment, capital expenditure, research anddevelopment (R&D) expenses, and—as a proxy for assetsales—the book value of assets. For each of these outcomevariables y, we consider raw changes ( ylogΔ ), changes
cient, compared with the previous-size coefficient (both of which add upto roughly one), and the comparison of the R2 across specifications implythat contemporaneous target size is the relevant reference point, con-sistent with Schwert (1996).
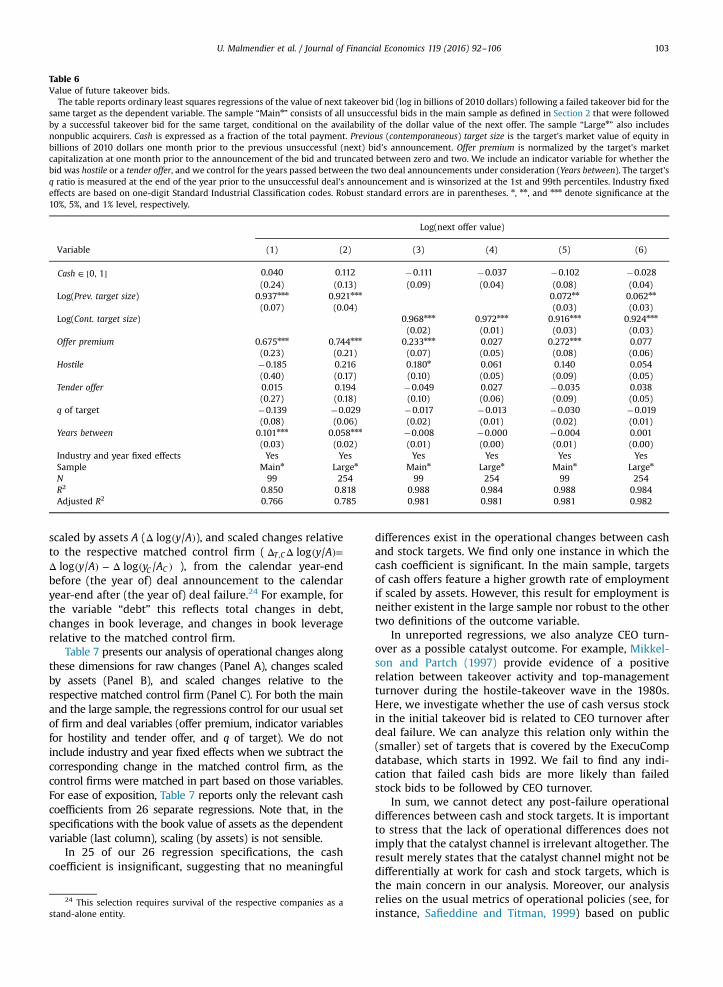
Table 6Value of future takeover bids.
The table reports ordinary least squares regressions of the value of next takeover bid (log in billions of 2010 dollars) following a failed takeover bid for thesame target as the dependent variable. The sample “Mainn” consists of all unsuccessful bids in the main sample as defined in Section 2 that were followedby a successful takeover bid for the same target, conditional on the availability of the dollar value of the next offer. The sample “Largen” also includesnonpublic acquirers. Cash is expressed as a fraction of the total payment. Previous (contemporaneous) target size is the target's market value of equity inbillions of 2010 dollars one month prior to the previous unsuccessful (next) bid's announcement. Offer premium is normalized by the target's marketcapitalization at one month prior to the announcement of the bid and truncated between zero and two. We include an indicator variable for whether thebid was hostile or a tender offer, and we control for the years passed between the two deal announcements under consideration (Years between). The target'sq ratio is measured at the end of the year prior to the unsuccessful deal's announcement and is winsorized at the 1st and 99th percentiles. Industry fixedeffects are based on one-digit Standard Industrial Classification codes. Robust standard errors are in parentheses. n, nn, and nnn denote significance at the10%, 5%, and 1% level, respectively.
Log(next offer value)
Variable (1) (2) (3) (4) (5) (6)
Cash 0, 1∈ [ ] 0.040 0.112 �0.111 �0.037 �0.102 �0.028(0.24) (0.13) (0.09) (0.04) (0.08) (0.04)
Log(Prev. target size) 0.937nnn 0.921nnn 0.072nn 0.062nn
(0.07) (0.04) (0.03) (0.03)Log(Cont. target size) 0.968nnn 0.972nnn 0.916nnn 0.924nnn
(0.02) (0.01) (0.03) (0.03)Offer premium 0.675nnn 0.744nnn 0.233nnn 0.027 0.272nnn 0.077
(0.23) (0.21) (0.07) (0.05) (0.08) (0.06)Hostile �0.185 0.216 0.180n 0.061 0.140 0.054
(0.40) (0.17) (0.10) (0.05) (0.09) (0.05)Tender offer 0.015 0.194 �0.049 0.027 �0.035 0.038
(0.27) (0.18) (0.10) (0.06) (0.09) (0.05)q of target �0.139 �0.029 �0.017 �0.013 �0.030 �0.019
(0.08) (0.06) (0.02) (0.01) (0.02) (0.01)Years between 0.101nnn 0.058nnn �0.008 �0.000 �0.004 0.001
(0.03) (0.02) (0.01) (0.00) (0.01) (0.00)Industry and year fixed effects Yes Yes Yes Yes Yes YesSample Mainn Largen Mainn Largen Mainn Largen
N 99 254 99 254 99 254R2 0.850 0.818 0.988 0.984 0.988 0.984Adjusted R2 0.766 0.785 0.981 0.981 0.981 0.982
U. Malmendier et al. / Journal of Financial Economics 119 (2016) 92–106 103
scaled by assets A ( y Alog /Δ ( )), and scaled changes relativeto the respective matched control firm ( y Alog /T C,Δ Δ ( )=
y A y Alog / log /C CΔ ( ) − Δ ( ) ), from the calendar year-endbefore (the year of) deal announcement to the calendaryear-end after (the year of) deal failure.24 For example, forthe variable “debt” this reflects total changes in debt,changes in book leverage, and changes in book leveragerelative to the matched control firm.
Table 7 presents our analysis of operational changes alongthese dimensions for raw changes (Panel A), changes scaledby assets (Panel B), and scaled changes relative to therespective matched control firm (Panel C). For both the mainand the large sample, the regressions control for our usual setof firm and deal variables (offer premium, indicator variablesfor hostility and tender offer, and q of target). We do notinclude industry and year fixed effects when we subtract thecorresponding change in the matched control firm, as thecontrol firms were matched in part based on those variables.For ease of exposition, Table 7 reports only the relevant cashcoefficients from 26 separate regressions. Note that, in thespecifications with the book value of assets as the dependentvariable (last column), scaling (by assets) is not sensible.
In 25 of our 26 regression specifications, the cashcoefficient is insignificant, suggesting that no meaningful
24 This selection requires survival of the respective companies as astand-alone entity.
differences exist in the operational changes between cashand stock targets. We find only one instance in which thecash coefficient is significant. In the main sample, targetsof cash offers feature a higher growth rate of employmentif scaled by assets. However, this result for employment isneither existent in the large sample nor robust to the othertwo definitions of the outcome variable.
In unreported regressions, we also analyze CEO turn-over as a possible catalyst outcome. For example, Mikkel-son and Partch (1997) provide evidence of a positiverelation between takeover activity and top-managementturnover during the hostile-takeover wave in the 1980s.Here, we investigate whether the use of cash versus stockin the initial takeover bid is related to CEO turnover afterdeal failure. We can analyze this relation only within the(smaller) set of targets that is covered by the ExecuCompdatabase, which starts in 1992. We fail to find any indi-cation that failed cash bids are more likely than failedstock bids to be followed by CEO turnover.
In sum, we cannot detect any post-failure operationaldifferences between cash and stock targets. It is importantto stress that the lack of operational differences does notimply that the catalyst channel is irrelevant altogether. Theresult merely states that the catalyst channel might not bedifferentially at work for cash and stock targets, which isthe main concern in our analysis. Moreover, our analysisrelies on the usual metrics of operational policies (see, forinstance, Safieddine and Titman, 1999) based on public
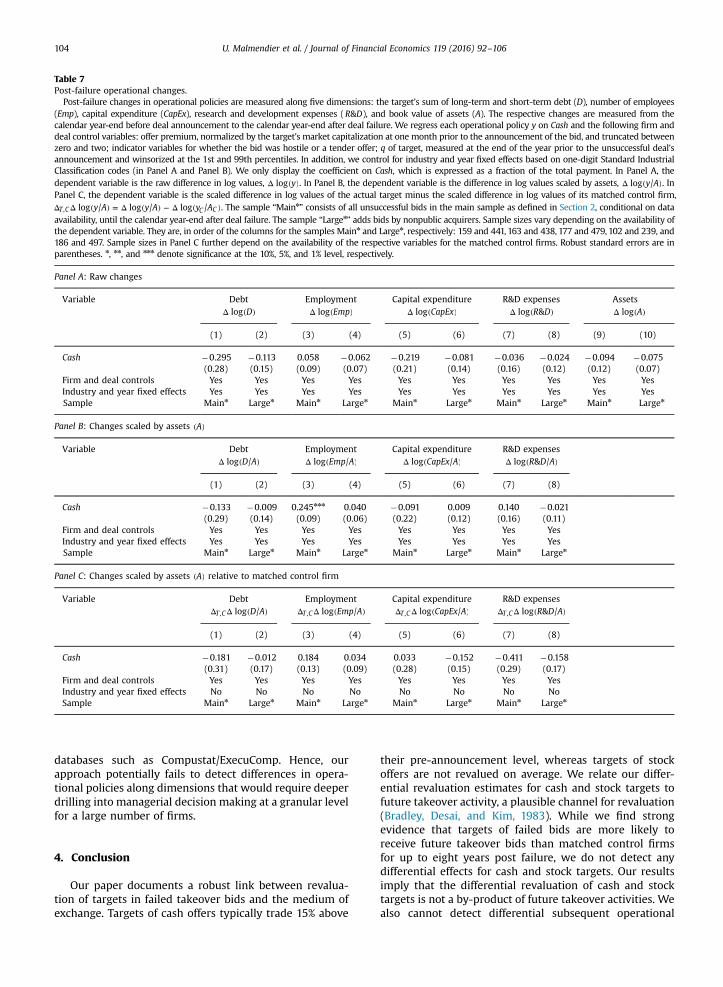
Table 7Post-failure operational changes.
Post-failure changes in operational policies are measured along five dimensions: the target's sum of long-term and short-term debt (D), number of employees(Emp), capital expenditure (CapEx), research and development expenses (R D& ), and book value of assets (A). The respective changes are measured from thecalendar year-end before deal announcement to the calendar year-end after deal failure. We regress each operational policy y on Cash and the following firm anddeal control variables: offer premium, normalized by the target's market capitalization at one month prior to the announcement of the bid, and truncated betweenzero and two; indicator variables for whether the bid was hostile or a tender offer; q of target, measured at the end of the year prior to the unsuccessful deal'sannouncement and winsorized at the 1st and 99th percentiles. In addition, we control for industry and year fixed effects based on one-digit Standard IndustrialClassification codes (in Panel A and Panel B). We only display the coefficient on Cash, which is expressed as a fraction of the total payment. In Panel A, thedependent variable is the raw difference in log values, ylogΔ ( ). In Panel B, the dependent variable is the difference in log values scaled by assets, y Alog /Δ ( ). InPanel C, the dependent variable is the scaled difference in log values of the actual target minus the scaled difference in log values of its matched control firm,
y A y A y Alog / log / log /T C C C,Δ Δ ( ) = Δ ( ) − Δ ( ). The sample “Mainn” consists of all unsuccessful bids in the main sample as defined in Section 2, conditional on dataavailability, until the calendar year-end after deal failure. The sample “Largen” adds bids by nonpublic acquirers. Sample sizes vary depending on the availability ofthe dependent variable. They are, in order of the columns for the samples Mainn and Largen, respectively: 159 and 441, 163 and 438, 177 and 479, 102 and 239, and186 and 497. Sample sizes in Panel C further depend on the availability of the respective variables for the matched control firms. Robust standard errors are inparentheses. n, nn, and nnn denote significance at the 10%, 5%, and 1% level, respectively.
Panel A: Raw changes
Variable Debt Employment Capital expenditure R&D expenses AssetsDlogΔ ( ) EmplogΔ ( ) CapExlogΔ ( ) R Dlog &Δ ( ) AlogΔ ( )
(1) (2) (3) (4) (5) (6) (7) (8) (9) (10)
Cash �0.295 �0.113 0.058 �0.062 �0.219 �0.081 �0.036 �0.024 �0.094 �0.075(0.28) (0.15) (0.09) (0.07) (0.21) (0.14) (0.16) (0.12) (0.12) (0.07)
Firm and deal controls Yes Yes Yes Yes Yes Yes Yes Yes Yes YesIndustry and year fixed effects Yes Yes Yes Yes Yes Yes Yes Yes Yes YesSample Mainn Largen Mainn Largen Mainn Largen Mainn Largen Mainn Largen
Panel B: Changes scaled by assets A( )
Variable Debt Employment Capital expenditure R&D expensesD Alog /Δ ( ) Emp Alog /Δ ( ) CapEx Alog /Δ ( ) R D Alog & /Δ ( )
(1) (2) (3) (4) (5) (6) (7) (8)
Cash �0.133 �0.009 0.245nnn 0.040 �0.091 0.009 0.140 �0.021(0.29) (0.14) (0.09) (0.06) (0.22) (0.12) (0.16) (0.11)
Firm and deal controls Yes Yes Yes Yes Yes Yes Yes YesIndustry and year fixed effects Yes Yes Yes Yes Yes Yes Yes YesSample Mainn Largen Mainn Largen Mainn Largen Mainn Largen
Panel C: Changes scaled by assets A( ) relative to matched control firm
Variable Debt Employment Capital expenditure R&D expensesD Alog /T C,Δ Δ ( ) Emp Alog /T C,Δ Δ ( ) CapEx Alog /T C,Δ Δ ( ) R D Alog & /T C,Δ Δ ( )
(1) (2) (3) (4) (5) (6) (7) (8)
Cash �0.181 �0.012 0.184 0.034 0.033 �0.152 �0.411 �0.158(0.31) (0.17) (0.13) (0.09) (0.28) (0.15) (0.29) (0.17)
Firm and deal controls Yes Yes Yes Yes Yes Yes Yes YesIndustry and year fixed effects No No No No No No No NoSample Mainn Largen Mainn Largen Mainn Largen Mainn Largen
U. Malmendier et al. / Journal of Financial Economics 119 (2016) 92–106104
databases such as Compustat/ExecuComp. Hence, ourapproach potentially fails to detect differences in opera-tional policies along dimensions that would require deeperdrilling into managerial decision making at a granular levelfor a large number of firms.
4. Conclusion
Our paper documents a robust link between revalua-tion of targets in failed takeover bids and the medium ofexchange. Targets of cash offers typically trade 15% above
their pre-announcement level, whereas targets of stockoffers are not revalued on average. We relate our differ-ential revaluation estimates for cash and stock targets tofuture takeover activity, a plausible channel for revaluation(Bradley, Desai, and Kim, 1983). While we find strongevidence that targets of failed bids are more likely toreceive future takeover bids than matched control firmsfor up to eight years post failure, we do not detect anydifferential effects for cash and stock targets. Our resultsimply that the differential revaluation of cash and stocktargets is not a by-product of future takeover activities. Wealso cannot detect differential subsequent operational
U. Malmendier et al. / Journal of Financial Economics 119 (2016) 92–106 105
policies between cash and stock targets. Hence, our find-ings are most consistent with papers such as Rhodes-Kropfand Viswanathan (2004), which suggest that the choice ofthe medium of exchange reveals information to the marketabout the stand-alone value of the entities involved.
By ruling in the possibility of information effects of take-over bids, in contrast to earlier literature, we hope that ourresults will help to rekindle the classical debate about therelative importance of information revelation about the targetvis-à-vis real effects induced by takeover bids. Our evidencesuggests that future work in this area ought to account for theinformational implications of the medium of exchange notjust on the bidder side (see Bhagat, Dong, Hirshleifer, andNoah, 2005), but also on the side of the target.
Appendix A. Methodology
A.1. Linear approximation
The time interval between announcement of the initialbid and failure of the deal varies across the sample. Wenormalize this window to relative time, i.e., between t 0R =and t 100%R = . Suppose a deal has 40 days betweenannouncement and failure, i.e., T 40i = . Then, the cumula-tive abnormal return after t 5%R = relative time, CAR 5%i ( ), isequal to the cumulative abnormal return after 40 5 % 2· =actual trading days, i.e., CAR t Ti R i( ). If t TR i is not an integernumber, we use linear interpolation between the actualtrading days, i.e.,
CAR t w CAR t T
w CAR t T
1
1 , 3
i R i t i R i
i t i R i
,
,
r
r
( )
( )
( ) = ( − ) (⌊ ⌋)
+ (⌊ ⌋ + ) ( )
where x⌊ ⌋ refers to the floor function and⎢⎣ ⎥⎦w t T t Ti t R i R i, r = −( ) . For example, if T 40i = days and
t 8%R = , then ⎢⎣ ⎥⎦w 40 8% 40 8% 0.2i t, r = · − · =( ) , so that thecumulative abnormal return after 8% relative time haspassed is given by CAR CAR CAR8% 0.8 3 0.2 4i i i( ) = ( ) + ( ).
A.2. Long-run abnormal returns
Denote the calendar-month return on our post-failuretarget portfolio by Rp t, . To calculate the correspondingabnormal returns, we use the capital asset pricing model(CAPM) and run the following regression:
R R R R , 4p t f t p p m t f t p t, , , , ,α β ε− = + ( − ) + ( )
where Rf t, is the one-month treasury bill rate, Rm t, is themonthly return on the CRSP value-weighted NYSE/AMEX/NASDAQ broad market index, and αp captures the monthlyabnormal return on the post-failure target portfolio.
We account for the fact that monthly returns with morefirms entering the respective portfolio are more preciselyestimated than months with few firms. The residual var-iance of portfolio p in month t with Np t, equally weightedfirms is given by
⎛⎝⎜⎜
⎞⎠⎟⎟Var Var
N
Var
NN
NVar
1
1,
5
p tp t
i t
i
p t
p t
p ti
,,
,
,
,
,
( ) ( )
∑ε ε
ερ ε
( ) =
= +−
¯( )
where Var iε( ) is the average residual variance of all stocksand ρ̄ is defined such that Var iρ ε¯ ( ) represents the averagecovariance across all stocks. (Target firms in a given monthare predominantly in similar industries, so that we expectresiduals to be positively correlated.) Because the mostimportant change from month to month concerns thenumber of firms, Np t, , variations in Var iε( ) and ρ̄ are secondorder, so that the variance of an equal-weight portfolio
scales withN
N
N1 1
p t
p t
p t,
,
,ρ+ ¯−. Based on the empirical results of
Campbell, Lettau, Malkiel, and Xu (2001), we choose0.1ρ̄ = . We then apply weighted least squares.For the long–short portfolio, the monthly variance is
given by
⎛⎝⎜
⎞⎠⎟
Var Var Var Cov
VarN N
2 ,
11 1
.6
C t S t C t S t C t S t
iC t S t
, , , , , ,
, ,( )
ε ε ε ε ε ε
ε ρ
( − ) = ( ) + ( ) − ( )
= ( − ¯) +( )
The second line follows from assuming that cash and stockfirms share average residual variances and average resi-dual covariances. For the long–short portfolio, we thusobtain that the variance scales with
N N1 1
C t S t, ,+ .
Appendix B. Supplementary data
Supplementary data associated with this article can befound in the online version at http://dx.doi.org/10.1016/j.jfineco.2015.08.013.
References
Aboody, D., Kasznik, R., Williams, M., 2000. Purchase versus pooling instock-for-stock acquisitions: Why do firms care? Journal of Account-ing and Economics 29, 261–286.
Andrade, G., Mitchell, M., Stafford, E., 2001. New evidence and perspec-tives on mergers. Journal of Economic Perspectives 15, 103–120.
Asquith, P., 1983. Merger bids, uncertainty, and stockholder returns.Journal of Financial Economics 11, 51–83.
Barber, B.M., Lyon, J.D., 1997. Detecting long-run abnormal stock returns:the empirical power and specification of test statistics. Journal ofFinancial Economics 43, 341–372.
Betton, S., Eckbo, B.E., Thorburn, K.S., 2008. Corporate takeovers. In:Eckbo, B.E. (Ed.), Handbook of Corporate Finance: Empirical Corpo-rate Finance, vol. 2. , Elsevier/North-Holland, Amsterdam,pp. 291–430.
Bhagat, S., Dong, M., Hirshleifer, D., Noah, R., 2005. Do tender offers createvalue? New methods and evidence. Journal of Financial Economics76, 3–60.
Bradley, M., Desai, A., Kim, E.H., 1983. The rationale behind interfirmtender offers: Information or synergy? Journal of Financial Economics11, 183–206.
Brav, A., 2000. Inference in long-horizon event studies: a Bayesianapproach with application to initial public offerings. Journal ofFinance 55, 1979–2016.
U. Malmendier et al. / Journal of Financial Economics 119 (2016) 92–106106
Campbell, J.Y., Lettau, M., Malkiel, B.G., Xu, Y., 2001. Have individualstocks become more volatile? An empirical exploration of idiosyn-cratic risk. Journal of Finance 56, 1–43.
Davidson, W.N., Dutia, D., Cheng, L., 1989. A re-examination of the marketreaction to failed mergers. Journal of Finance 44, 1077–1083.
Dodd, P., 1980. Merger proposals, management discretion, and stock-holder wealth. Journal of Financial Economics 8, 105–137.
Dodd, P., Ruback, R., 1977. Tender offers and stockholder returns: anempirical analysis. Journal of Financial Economics 5, 351–373.
Dong, M., Hirshleifer, D., Richardson, S., Teoh, S.H., 2006. Does investormisvaluation drive the takeover market? Journal of Finance 61,725–762.
Edmans, A., Goldstein, I., Jiang, W., 2012. The real effects of financialmarkets: the impact of prices on takeovers. Journal of Finance 67,933–971.
Fabozzi, F.J., Ferri, M.G., Fabozzi, T.D., Tucker, J., 1988. A note on unsuc-cessful tender offers and stockholder returns. Journal of Finance 43,1275–1283.
Fama, E.F., 1998. Market efficiency, long-term returns, and behavioralfinance. Journal of Financial Economics 49, 283–306.
Fama, E.F., French, K.R., 1993. Common risk factors in the returns onstocks and bonds. Journal of Financial Economics 33, 3–56.
Fishman, M.J., 1989. Preemptive bidding and the role of the medium ofexchange in acquisitions. Journal of Finance 44, 41–57.
Healy, P.M., Palepu, K.G., Ruback, R.S., 1992. Does corporate performanceimprove after mergers? Journal of Financial Economics 31, 135–175.
Huang, Y.S., Walkling, R.A., 1987. Target abnormal returns associated withacquisition announcements: payment, acquisition form, and man-agerial resistance. Journal of Financial Economics 19, 329–349.
Jaffe, J.F., 1974. Special information and insider trading. Journal of Busi-ness 47, 410–428.
Jennings, R., LeClere, M., Thompson, R.B., 2001. Goodwill amortizationand the usefulness of earnings. Financial Analysts Journal 57, 20–28.
Jensen, M.C., Ruback, R.S., 1983. The market for corporate control: thescientific evidence. Journal of Financial Economics 11, 5–50.
Kaplan, S.N., Zingales, L., 1997. Do investment-cash flow sensitivitiesprovide useful measures of financing constraints? Quarterly Journalof Economics 112, 169–215.
Loughran, T., Vijh, A.M., 1997. Do long-term shareholders benefit fromcorporate acquisitions? Journal of Finance 52, 1765–1790.
Lys, T., Vincent, L., 1995. An analysis of value destruction in AT&T'sacquisition of NCR. Journal of Financial Economics 39, 353–378.
Malmendier, U., Moretti, E., Peters, F., 2010. Winning by losing: evidenceon overbidding in mergers. Mimeo. University of California, Berkeley,CA.
Mandelker, G., 1974. Risk and return: the case of merging firms. Journal ofFinancial Economics 1, 303–335.
Mikkelson, W.H., Partch, M.M., 1997. The decline of takeovers and dis-ciplinary managerial turnover. Journal of Financial Economics 44,205–228.
Officer, M.S., 2003. Termination fees in mergers and acquisitions. Journalof Financial Economics 69, 431–467.
Rhodes-Kropf, M., Robinson, D.T., Viswanathan, S., 2005. Valuation wavesand merger activity: the empirical evidence. Journal of FinancialEconomics 77, 561–603.
Rhodes-Kropf, M., Viswanathan, S., 2004. Market valuation and mergerwaves. Journal of Finance 59, 2685–2718.
Safieddine, A., Titman, S., 1999. Leverage and corporate performance:evidence from unsuccessful takeovers. Journal of Finance 54,547–580.
Savor, P.G., Lu, Q., 2009. Do stock mergers create value for acquirers?Journal of Finance 64, 1061–1097.
Schwert, G.W., 1996. Markup pricing in mergers and acquisitions. Journalof Financial Economics 41, 153–192.
Shleifer, A., Vishny, R.W., 2003. Stock market driven acquisitions. Journalof Financial Economics 70, 295–311.
Sullivan, M.J., Jensen, M.R.H., Hudson, C.D., 1994. The role of medium ofexchange in merger offers: examination of terminated merger pro-posals. Financial Management 23, 51–62.
Related Documents