JOURNAL OF ENVIRONMENTAL HYDROLOGY The Electronic Journal of the International Association for Environmental Hydrology On the World Wide Web at http://www.hydroweb.com VOLUME 19 2011 Journal of Environmental Hydrology Volume 19 Paper 5 February 2011 1 The need for precipitation data and the importance of its duration in hydrological and climatic phenomena motivate investigators to develop reconstruction methods. Four methods are artificial neural network, normal ratio, inverse distance weighting, and geographical coordi- nate. These methods are compared in this study using monthly precipitation data of three stations, Dolat-Abad, Kabootar-Abad and Refinery plant around the city of Esfahan, Iran. Mean absolute error and coefficient of correlation of the results are compared to select the most appropriate method. The neural network approach shows the best performance com- pared with the other methods. NEURAL NETWORK APPLICATION FOR MONTHLY PRECIPITATION DATA RECONSTRUCTION 1 Department of Natural Resources, Science and Research Branch, Islamic Azad University, Tehran, Iran 2 Department of Natural Resources, Tehran University, Karaj, Iran 3 Department of Water Engineering, College of Agriculture, Isfahan University of Technology, Iran Zohre Khorsandi 1 Mohammad Mahdavi 2 Ali Salajeghe 2 Saeid Eslamian 3

Welcome message from author
This document is posted to help you gain knowledge. Please leave a comment to let me know what you think about it! Share it to your friends and learn new things together.
Transcript
JOURNAL OFENVIRONMENTAL HYDROLOGY
The Electronic Journal of the International Association for Environmental HydrologyOn the World Wide Web at http://www.hydroweb.com
VOLUME 19 2011
Journal of Environmental Hydrology Volume 19 Paper 5 February 20111
The need for precipitation data and the importance of its duration in hydrological and climaticphenomena motivate investigators to develop reconstruction methods. Four methods areartificial neural network, normal ratio, inverse distance weighting, and geographical coordi-nate. These methods are compared in this study using monthly precipitation data of threestations, Dolat-Abad, Kabootar-Abad and Refinery plant around the city of Esfahan, Iran.Mean absolute error and coefficient of correlation of the results are compared to select themost appropriate method. The neural network approach shows the best performance com-pared with the other methods.
NEURAL NETWORK APPLICATION FOR MONTHLYPRECIPITATION DATA RECONSTRUCTION
1Department of Natural Resources, Science and Research Branch,Islamic Azad University, Tehran, Iran2Department of Natural Resources, Tehran University, Karaj, Iran3Department of Water Engineering, College of Agriculture, IsfahanUniversity of Technology, Iran
Zohre Khorsandi1Mohammad Mahdavi2
Ali Salajeghe2
Saeid Eslamian3
Journal of Environmental Hydrology Volume 19 Paper 5 February 20112
Monthly Precipitation Data Reconstruction Khorsandi, Mahdavi, Salajeghe, and Eslamian
INTRODUCTION
Precipitation data are critical for hydrological analysis, design of water resources systems andmanagement programs, and investigation of drought periods. Missing data are one of the mostimportant problems in this field. Various methods are developed to solve this problem andreconstruct data interpolation methods such as regression methods, time series and artificialneural networks. McCuen (1998) recommended a simple method to estimate missing rainfallvalues. In his method, simple mean will be used as the estimated value to perform calculations ifthe difference of annual precipitation is less than 10% in neighbor stations. Otherwise if thedifference is more than 10%, the normal ratio method will be used.
Vicente-Serrano et al. (2010) used values from the nearest neighbor observations to reconstructa daily precipitation database for northeast Spain with field gaps of 3106 daily precipitationobservatories.
In applied hydrology literature, the inverse distance weighted method (IDWM) and normal ratiomethod are the most common approaches for estimation of missing values in hydrology sciences(ASCE 1996).
Abebe et al. (2000) compared fuzzy methods, neural network methods and statistical methodsefficiencies. Their results showed better performance of the neural network method in comparisonwith the other methods.
Nalder et al. (1998) used different approaches such as nearest neighbor, inverse distanceweighted and different types of kriging to interpolate climatic parameters. Their results showedthat the best method for calculating temperature and monthly precipitation is the inverse squaredistance method. They described this method as simple, applicable and more accurate with respectto other methods. Also Dirks et al. (1998) used the mean of stations, inverse distance weighted,Thiessen polygon and kriging methods in order to estimate precipitation, and the inverse distancesquare method showed the best performance for estimation of precipitation values. MCcuen(1998) proposed the inverse distance weighted method for complete precipitation data and hesuggested that the inverse distance can be used instead of geographical coordinates distance.
Goovaerts (2000) used three multivariate geostatistical algorithms incorporating a digitalelevation model into the spatial prediction of rainfall, and compared these methods with theordinary kriging, Thiessen polygon and inverse square distance. The results showed higher errorvalues for the Thiessen method and inverse square distance in prediction of precipitation values,and his results showed that the kriging method has better results than the linear regression methodwhen there is remarkable correlation between elevation and precipitation. Teegavarapu et al.(2005) compared commonly used spatial interpolation methods (IDWM and coefficient ofcorrelation weighted method), nearest neighbor, kriging and artificial neural networks inreconstruction of missing rainfall data. The results showed that the methods of coefficient ofcorrelation weighting, ANN and kriging have better results in comparison with IDWM.
The neural network method is suitable to find a relation among variables that have unknownhighly nonlinear relation. Regression models and time series are used commonly to completemissing precipitation data. All these methods require the numerical form of relation variables asa priori and this is the most important limitation of these methods (Teegavarapu et al., 2005). Theartificial neural network methods determine this relation function automatically. Therefore this
Journal of Environmental Hydrology Volume 19 Paper 5 February 20113
Monthly Precipitation Data Reconstruction Khorsandi, Mahdavi, Salajeghe, and Eslamian
method has found much popularity among investigators. Neural network is used in spatial andtemporal interpolation and in prediction of hydrological and climatically phenomena (Tolika et al.,2007; Malek et al., 2009).
Neural network has been used more in reconstruction and completion of time series. Althoughreconstruction of the monthly and daily time series of stream flows can be performed usingstatistical methods, this reconstruction and completion can not be carried out carefully by theother two methods because there are great changes in spatial and temporal behavior of precipitation.There are a limited number of studies about using this method to complete the precipitation timeseries (Coulibaly and Evora, 2007). Researchers that used ANN for reconstructing and interpolatingclimatic data agree on the accuracy of this method.
MATERIAL AND METHODS
Case study
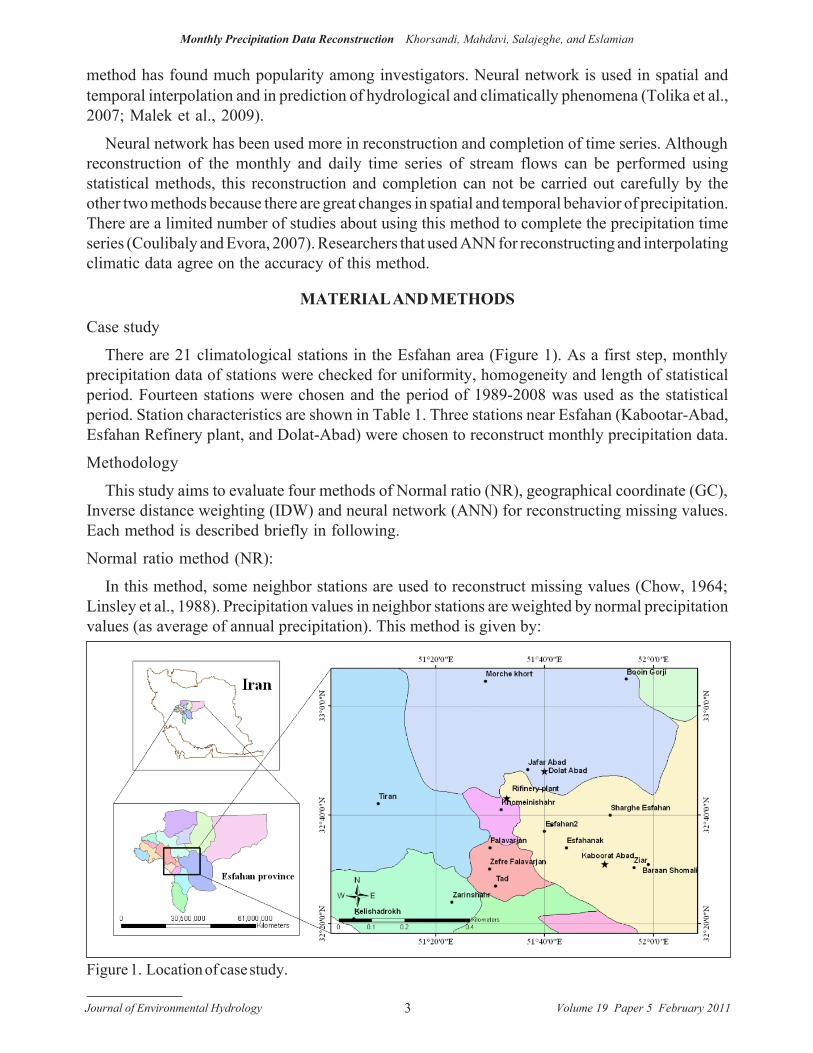
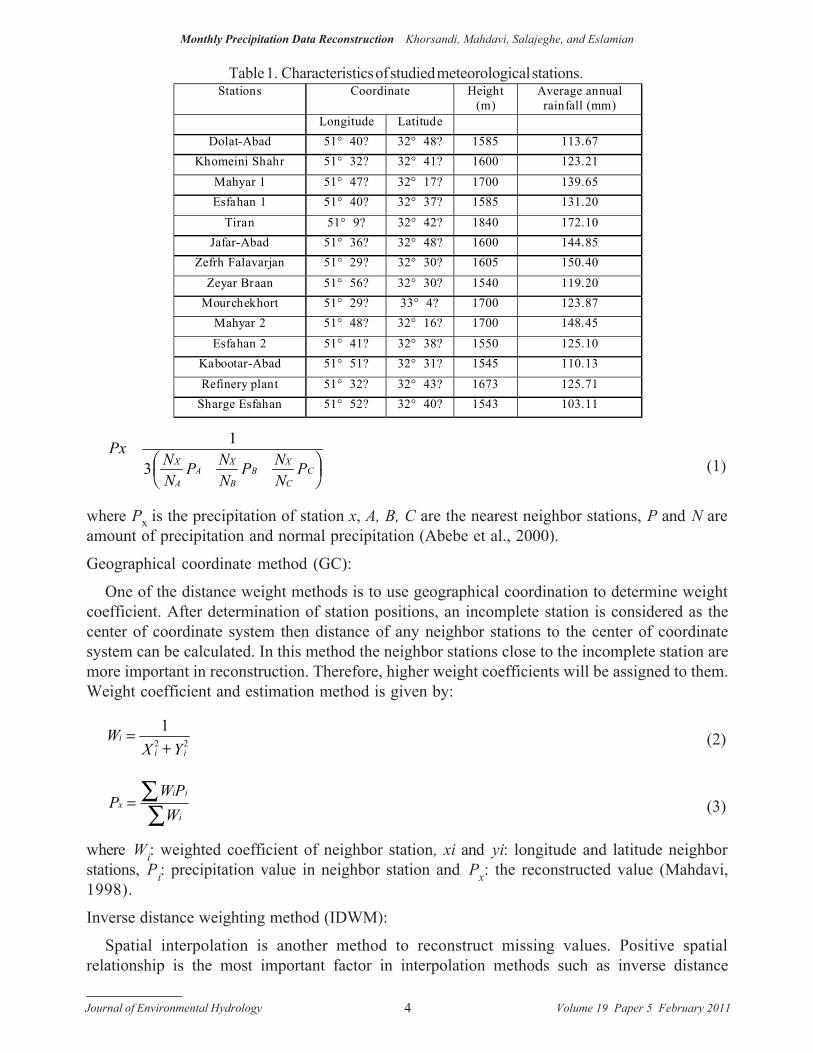
There are 21 climatological stations in the Esfahan area (Figure 1). As a first step, monthlyprecipitation data of stations were checked for uniformity, homogeneity and length of statisticalperiod. Fourteen stations were chosen and the period of 1989-2008 was used as the statisticalperiod. Station characteristics are shown in Table 1. Three stations near Esfahan (Kabootar-Abad,Esfahan Refinery plant, and Dolat-Abad) were chosen to reconstruct monthly precipitation data.
Methodology
This study aims to evaluate four methods of Normal ratio (NR), geographical coordinate (GC),Inverse distance weighting (IDW) and neural network (ANN) for reconstructing missing values.Each method is described briefly in following.
Normal ratio method (NR):
In this method, some neighbor stations are used to reconstruct missing values (Chow, 1964;Linsley et al., 1988). Precipitation values in neighbor stations are weighted by normal precipitationvalues (as average of annual precipitation). This method is given by:
Figure 1. Location of case study.
Journal of Environmental Hydrology Volume 19 Paper 5 February 20114
Monthly Precipitation Data Reconstruction Khorsandi, Mahdavi, Salajeghe, and Eslamian
PxNN
P NN
P NN
PX
AA
X
BB
X
CC
FHG
IKJ
1
3 (1)
where Px is the precipitation of station x, A, B, C are the nearest neighbor stations, P and N areamount of precipitation and normal precipitation (Abebe et al., 2000).
Geographical coordinate method (GC):
One of the distance weight methods is to use geographical coordination to determine weightcoefficient. After determination of station positions, an incomplete station is considered as thecenter of coordinate system then distance of any neighbor stations to the center of coordinatesystem can be calculated. In this method the neighbor stations close to the incomplete station aremore important in reconstruction. Therefore, higher weight coefficients will be assigned to them.Weight coefficient and estimation method is given by:
WX Y
ii i
=+1
2 2 (2)
PW PW
xi i
i= ∑
∑ (3)
where Wi: weighted coefficient of neighbor station, xi and yi: longitude and latitude neighborstations, Pi: precipitation value in neighbor station and Px: the reconstructed value (Mahdavi,1998).
Inverse distance weighting method (IDWM):
Spatial interpolation is another method to reconstruct missing values. Positive spatialrelationship is the most important factor in interpolation methods such as inverse distance
Stations Coordinate Height (m)
Average annual rainfall (mm)
Longitude Latitude Dolat-Abad 51° 40? 32° 48? 1585 113.67
Khomeini Shahr 51° 32? 32° 41? 1600 123.21 Mahyar 1 51° 47? 32° 17? 1700 139.65 Esfahan 1 51° 40? 32° 37? 1585 131.20
Tiran 51° 9? 32° 42? 1840 172.10 Jafar-Abad 51° 36? 32° 48? 1600 144.85
Zefrh Falavarjan 51° 29? 32° 30? 1605 150.40 Zeyar Braan 51° 56? 32° 30? 1540 119.20
Mourchekhort 51° 29? 33° 4? 1700 123.87 Mahyar 2 51° 48? 32° 16? 1700 148.45 Esfahan 2 51° 41? 32° 38? 1550 125.10
Kabootar-Abad 51° 51? 32° 31? 1545 110.13 Refinery plant 51° 32? 32° 43? 1673 125.71
Sharge Esfahan 51° 52? 32° 40? 1543 103.11
Table 1. Characteristics of studied meteorological stations.
Journal of Environmental Hydrology Volume 19 Paper 5 February 20115
Monthly Precipitation Data Reconstruction Khorsandi, Mahdavi, Salajeghe, and Eslamian
weighting method and stochastic interpolation method. It means that stations with similarnumerical values are closer to each other. Neighbor point values and spatial coefficients are usedto estimate missing data. The coefficient is calculated by different equations for differentmethods. This method is one of the most popular and applied methods in hydrology andgeomorphology. The success of inverse distance weighting method depends primarily on theexistence of positive spatial autocorrelation (Teegavarapu, 2005). Weighting coefficients andeffective neighbor selection are limitations of this approach. The following equation calculatesthe estimation of missing value in this method.
ZZi mi
k
i
n
mik
i
nd
d=
−
=−
=
∑∑
1
1
(4)
where Z is the observation at base station, n is number of stations, Zi is the observation at stationi, dmi is distance from the location of i to the station m, and k is referred to as friction distance thatranges from 1 to 6. The value of 2 is used more commonly for the k coefficient (Teegavarapu,2005).
Artificial neural network (ANN):
The artificial neural network is extensively parallel processers composed of simple units ofprocessor that have a natural tendency to preserve experimental knowledge and restore it asrequired. A neural network is similar to brain because of two reasons:
1- Network learns knowledge from the environment through a training process.
2- Strength of connections between neurons is used to store information (Haykin, 1999).
Neural networks have different structures but their components are similar. A neural networkis defined by its components, including neurons, type of neuron connections and neural networktraining algorithm.
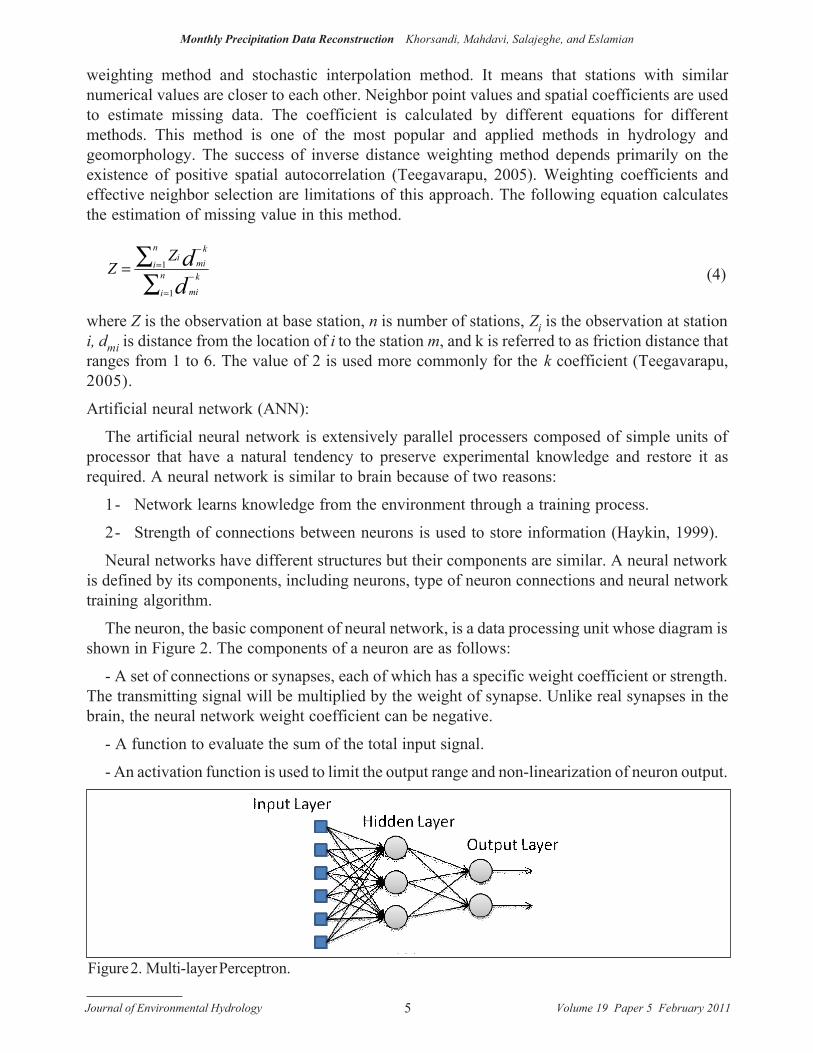
The neuron, the basic component of neural network, is a data processing unit whose diagram isshown in Figure 2. The components of a neuron are as follows:
- A set of connections or synapses, each of which has a specific weight coefficient or strength.The transmitting signal will be multiplied by the weight of synapse. Unlike real synapses in thebrain, the neural network weight coefficient can be negative.
- A function to evaluate the sum of the total input signal.
- An activation function is used to limit the output range and non-linearization of neuron output.
Figure 2. Multi-layer Perceptron.
Journal of Environmental Hydrology Volume 19 Paper 5 February 20116
Monthly Precipitation Data Reconstruction Khorsandi, Mahdavi, Salajeghe, and Eslamian
Neural network types:
Neural networks differ in type of neurons, connection types and the learning algorithms. Neuralnetwork structure is shown by graphs for simplicity. In this case, a neuron is shown as a solid circleand synapses by arrows. The arrows represent direction of information flow. Common neuralnetworks are: single-layer perceptron, multi-layer perceptron, general feed forward neuralnetwork, recursive neural networks and RBF neural networks. The multi-layer perceptron whichis used in this study is described in the following.
Multi-layer perceptron:
This type of neural network consists of a number of neurons located in different layers.Connections are forward and neuron values will be calculated layer by layer from input layer tooutput layer to calculate outputs of the network. This kind of neural network has been used invarious engineering applications.
Training Neural Network
The most important feature of neural networks is learning from their environment to increasetheir performance. Different processes are called “learning” processes and there are differentviews about the definition of the learning. Mendel and McClaren defined the learning process as:
“Learning is a process in which the free parameters of neural network will be adjusted throughthe network environment stimulation. The behaviour of adjustment of free parameters defines thetype of learning” (Mendel, 1970).
The collection of accurate and specific rules to solve the problem of learning is called thetraining algorithm. So far various algorithms for training of neural networks are presented,including the Levenberg–Marquardt algorithm, competitive adaptive learning, and learning.Coulibay et al. (2007) compared different neural networks for reconstruction of daily data andsuggested the multi-layer perceptron procedure as the most appropriate method for reconstructionof rainfall data. In this study the suggested method is used to reconstruct the data.
Application
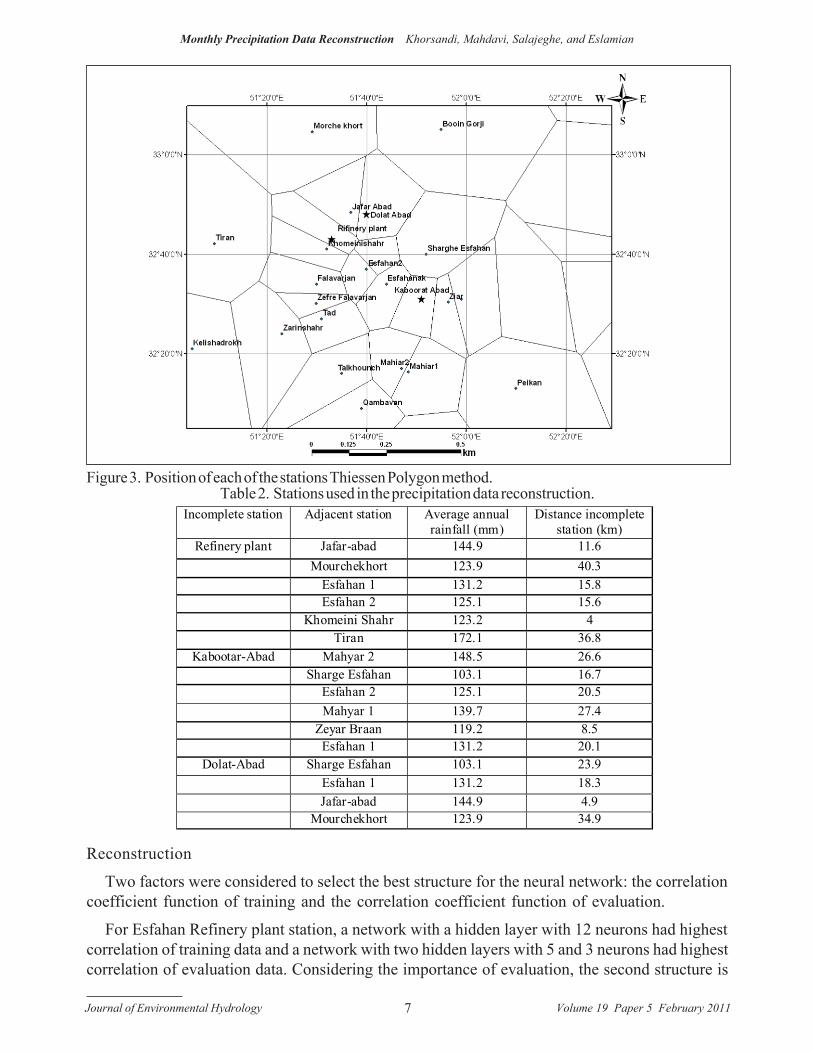
In all of the methods used in this study, selection of the neighbor stations is one of the mostimportant tasks. To select neighbor stations, first of all, the Thiessen Polygon method was usedto determine range of effect of each station then neighbor stations were determined (Figure 3).Then according to the length of statistical period and accuracy of the recorded data a number ofstations were selected (Table 2).
Monthly precipitation data and average annual rainfall from nearby stations were used in the NR.In the GC, the coordinates and Equations (2 and 3) are used, and in the IDWM, the distance betweenstations and the Equation (4) are used to calculate monthly precipitation values for the stations withmissing data.
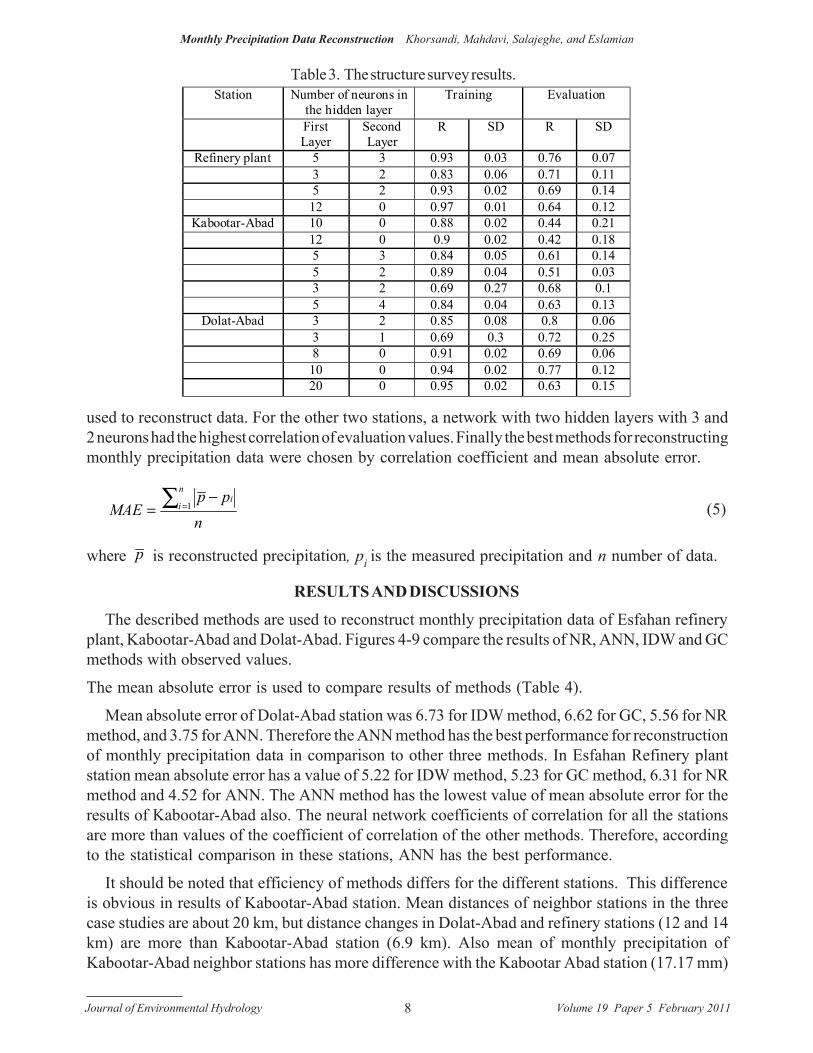
ANN input data are monthly rainfall of neighbor stations and the outputs are monthlyprecipitation of missing station. Multi-layer perceptron and Levenberg–Marquardt algorithm areused in this study. In order to select the best neural network structure for the reconstruction ofprecipitation data, different structures considering the number of inputs were evaluated, results ofthis evaluation are presented in Table 3.
Journal of Environmental Hydrology Volume 19 Paper 5 February 20117
Monthly Precipitation Data Reconstruction Khorsandi, Mahdavi, Salajeghe, and Eslamian
Reconstruction
Two factors were considered to select the best structure for the neural network: the correlationcoefficient function of training and the correlation coefficient function of evaluation.
For Esfahan Refinery plant station, a network with a hidden layer with 12 neurons had highestcorrelation of training data and a network with two hidden layers with 5 and 3 neurons had highestcorrelation of evaluation data. Considering the importance of evaluation, the second structure is
Figure 3. Position of each of the stations Thiessen Polygon method.Table 2. Stations used in the precipitation data reconstruction.
Incomplete station Adjacent station Average annual rainfall (mm)
Distance incomplete station (km)
Refinery plant Jafar-abad 144.9 11.6 Mourchekhort 123.9 40.3 Esfahan 1 131.2 15.8 Esfahan 2 125.1 15.6 Khomeini Shahr 123.2 4 Tiran 172.1 36.8
Kabootar-Abad Mahyar 2 148.5 26.6 Sharge Esfahan 103.1 16.7 Esfahan 2 125.1 20.5 Mahyar 1 139.7 27.4 Zeyar Braan 119.2 8.5 Esfahan 1 131.2 20.1
Dolat-Abad Sharge Esfahan 103.1 23.9 Esfahan 1 131.2 18.3 Jafar-abad 144.9 4.9 Mourchekhort 123.9 34.9
Journal of Environmental Hydrology Volume 19 Paper 5 February 20118
Monthly Precipitation Data Reconstruction Khorsandi, Mahdavi, Salajeghe, and Eslamian
used to reconstruct data. For the other two stations, a network with two hidden layers with 3 and2 neurons had the highest correlation of evaluation values. Finally the best methods for reconstructingmonthly precipitation data were chosen by correlation coefficient and mean absolute error.
MAEp pn
ii
n
=−
=∑ 1 (5)
where p is reconstructed precipitation, pi is the measured precipitation and n number of data.
RESULTS AND DISCUSSIONS
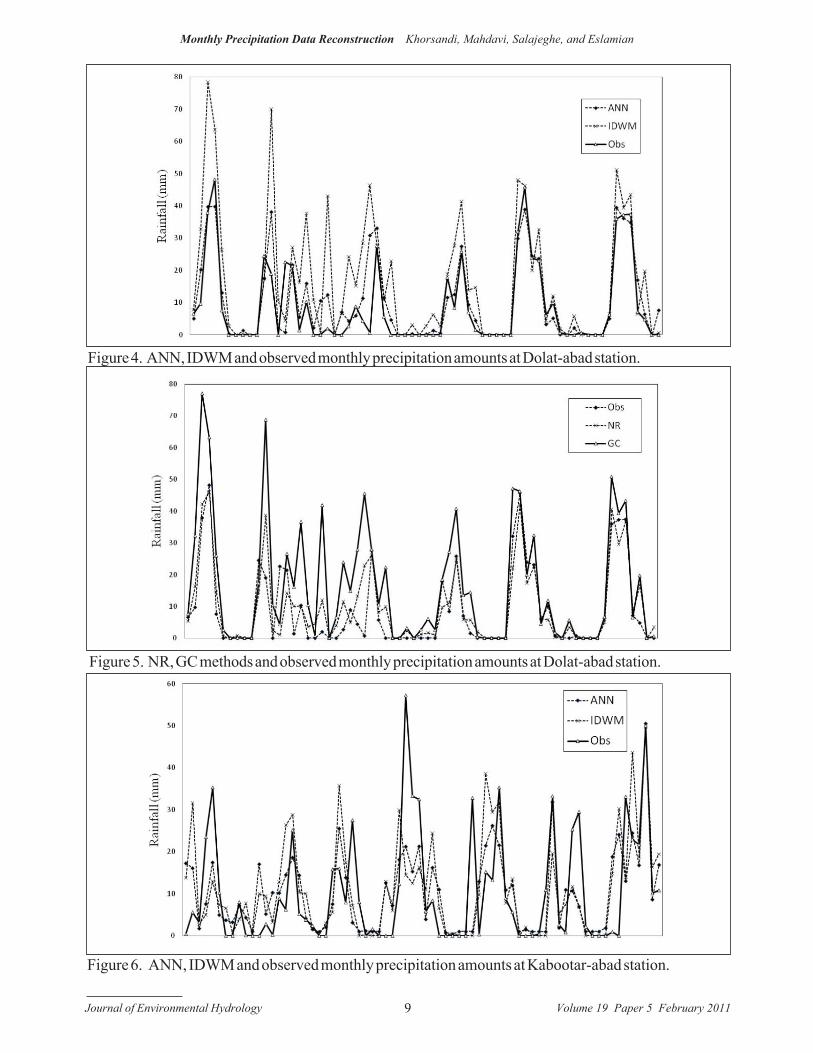
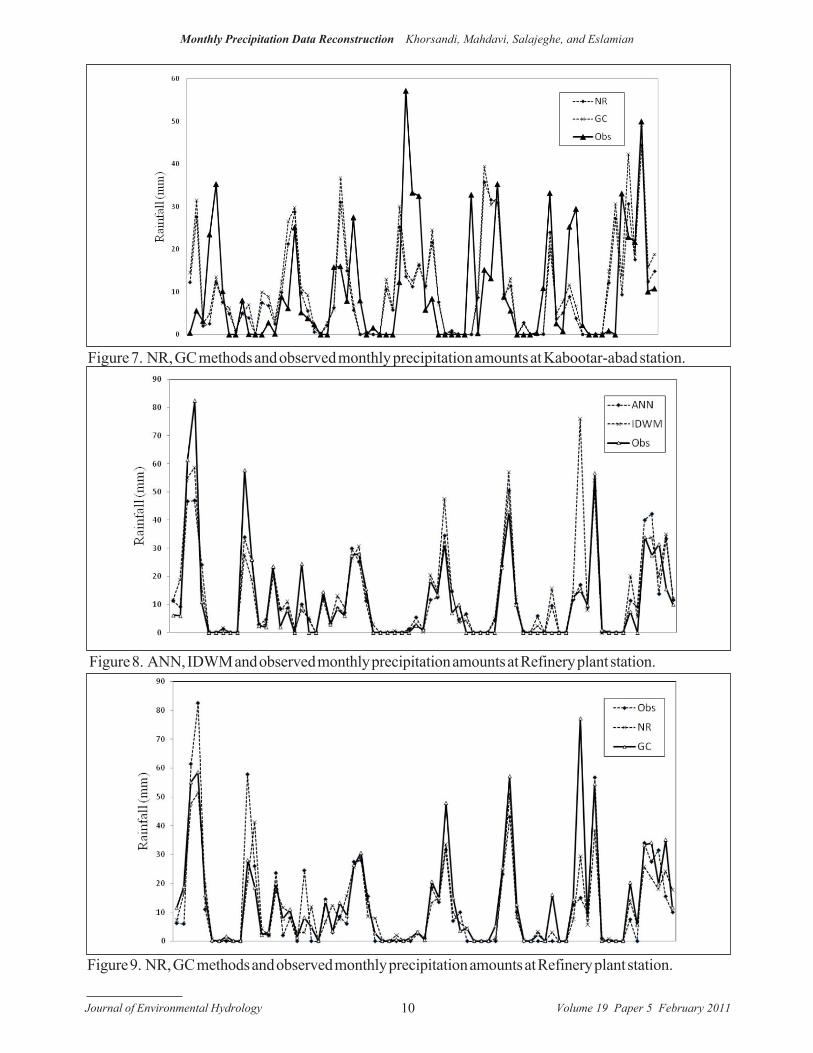
The described methods are used to reconstruct monthly precipitation data of Esfahan refineryplant, Kabootar-Abad and Dolat-Abad. Figures 4-9 compare the results of NR, ANN, IDW and GCmethods with observed values.
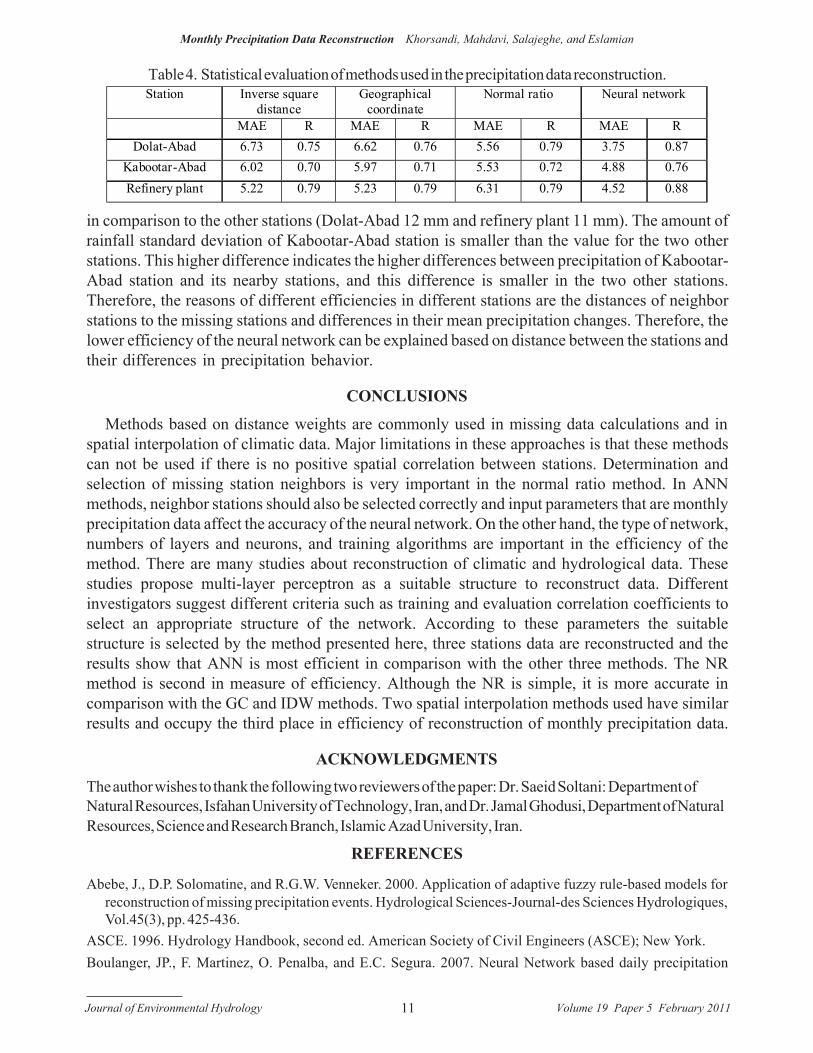
The mean absolute error is used to compare results of methods (Table 4).
Mean absolute error of Dolat-Abad station was 6.73 for IDW method, 6.62 for GC, 5.56 for NRmethod, and 3.75 for ANN. Therefore the ANN method has the best performance for reconstructionof monthly precipitation data in comparison to other three methods. In Esfahan Refinery plantstation mean absolute error has a value of 5.22 for IDW method, 5.23 for GC method, 6.31 for NRmethod and 4.52 for ANN. The ANN method has the lowest value of mean absolute error for theresults of Kabootar-Abad also. The neural network coefficients of correlation for all the stationsare more than values of the coefficient of correlation of the other methods. Therefore, accordingto the statistical comparison in these stations, ANN has the best performance.
It should be noted that efficiency of methods differs for the different stations. This differenceis obvious in results of Kabootar-Abad station. Mean distances of neighbor stations in the threecase studies are about 20 km, but distance changes in Dolat-Abad and refinery stations (12 and 14km) are more than Kabootar-Abad station (6.9 km). Also mean of monthly precipitation ofKabootar-Abad neighbor stations has more difference with the Kabootar Abad station (17.17 mm)
Table 3. The structure survey results.Station Number of neurons in
the hidden layer Training Evaluation
First Layer
Second Layer
R SD R SD
Refinery plant 5 3 0.93 0.03 0.76 0.07 3 2 0.83 0.06 0.71 0.11 5 2 0.93 0.02 0.69 0.14 12 0 0.97 0.01 0.64 0.12
Kabootar-Abad 10 0 0.88 0.02 0.44 0.21 12 0 0.9 0.02 0.42 0.18 5 3 0.84 0.05 0.61 0.14 5 2 0.89 0.04 0.51 0.03 3 2 0.69 0.27 0.68 0.1 5 4 0.84 0.04 0.63 0.13
Dolat-Abad 3 2 0.85 0.08 0.8 0.06 3 1 0.69 0.3 0.72 0.25 8 0 0.91 0.02 0.69 0.06 10 0 0.94 0.02 0.77 0.12 20 0 0.95 0.02 0.63 0.15
Journal of Environmental Hydrology Volume 19 Paper 5 February 20119
Monthly Precipitation Data Reconstruction Khorsandi, Mahdavi, Salajeghe, and Eslamian
Figure 6. ANN, IDWM and observed monthly precipitation amounts at Kabootar-abad station.
Figure 5. NR, GC methods and observed monthly precipitation amounts at Dolat-abad station.
Figure 4. ANN, IDWM and observed monthly precipitation amounts at Dolat-abad station.
Journal of Environmental Hydrology Volume 19 Paper 5 February 201110
Monthly Precipitation Data Reconstruction Khorsandi, Mahdavi, Salajeghe, and Eslamian
Figure 9. NR, GC methods and observed monthly precipitation amounts at Refinery plant station.
Figure 8. ANN, IDWM and observed monthly precipitation amounts at Refinery plant station.
Figure 7. NR, GC methods and observed monthly precipitation amounts at Kabootar-abad station.
Journal of Environmental Hydrology Volume 19 Paper 5 February 201111
Monthly Precipitation Data Reconstruction Khorsandi, Mahdavi, Salajeghe, and Eslamian
in comparison to the other stations (Dolat-Abad 12 mm and refinery plant 11 mm). The amount ofrainfall standard deviation of Kabootar-Abad station is smaller than the value for the two otherstations. This higher difference indicates the higher differences between precipitation of Kabootar-Abad station and its nearby stations, and this difference is smaller in the two other stations.Therefore, the reasons of different efficiencies in different stations are the distances of neighborstations to the missing stations and differences in their mean precipitation changes. Therefore, thelower efficiency of the neural network can be explained based on distance between the stations andtheir differences in precipitation behavior.
CONCLUSIONS
Methods based on distance weights are commonly used in missing data calculations and inspatial interpolation of climatic data. Major limitations in these approaches is that these methodscan not be used if there is no positive spatial correlation between stations. Determination andselection of missing station neighbors is very important in the normal ratio method. In ANNmethods, neighbor stations should also be selected correctly and input parameters that are monthlyprecipitation data affect the accuracy of the neural network. On the other hand, the type of network,numbers of layers and neurons, and training algorithms are important in the efficiency of themethod. There are many studies about reconstruction of climatic and hydrological data. Thesestudies propose multi-layer perceptron as a suitable structure to reconstruct data. Differentinvestigators suggest different criteria such as training and evaluation correlation coefficients toselect an appropriate structure of the network. According to these parameters the suitablestructure is selected by the method presented here, three stations data are reconstructed and theresults show that ANN is most efficient in comparison with the other three methods. The NRmethod is second in measure of efficiency. Although the NR is simple, it is more accurate incomparison with the GC and IDW methods. Two spatial interpolation methods used have similarresults and occupy the third place in efficiency of reconstruction of monthly precipitation data.
ACKNOWLEDGMENTSThe author wishes to thank the following two reviewers of the paper: Dr. Saeid Soltani: Department ofNatural Resources, Isfahan University of Technology, Iran, and Dr. Jamal Ghodusi, Department of NaturalResources, Science and Research Branch, Islamic Azad University, Iran.
REFERENCES
Abebe, J., D.P. Solomatine, and R.G.W. Venneker. 2000. Application of adaptive fuzzy rule-based models forreconstruction of missing precipitation events. Hydrological Sciences-Journal-des Sciences Hydrologiques,Vol.45(3), pp. 425-436.
ASCE. 1996. Hydrology Handbook, second ed. American Society of Civil Engineers (ASCE); New York.Boulanger, JP., F. Martinez, O. Penalba, and E.C. Segura. 2007. Neural Network based daily precipitation
Station Inverse square distance
Geographical coordinate
Normal ratio Neural network
MAE R MAE R MAE R MAE R Dolat-Abad 6.73 0.75 6.62 0.76 5.56 0.79 3.75 0.87
Kabootar-Abad 6.02 0.70 5.97 0.71 5.53 0.72 4.88 0.76 Refinery plant 5.22 0.79 5.23 0.79 6.31 0.79 4.52 0.88
Table 4. Statistical evaluation of methods used in the precipitation data reconstruction.

Journal of Environmental Hydrology Volume 19 Paper 5 February 201112
Monthly Precipitation Data Reconstruction Khorsandi, Mahdavi, Salajeghe, and Eslamian
generator (NNGEN-P). Climate Dynamics 28, pp. 307–324.Chow, V.T. 1964. Handbook of Applied Hydrology. McGraw-Hill; New York.Coulibaly, P., and N.D. Evora. 2007. Comparison of neural network methods for infilling missing daily weather
records. Journal of Hydrology, Vol. 341, pp. 27–41.Dirks, K.N., J.E. Hay, C.D. Stow, and D. Harris. 1998. High resolution studies of rainfall on Norfolk Island Part
II: interpolation of rainfall data. J. Hydrol., Vol. 208(3-4), pp. 187-193.Goovaerts, P. 2000. Geostatistical approaches for incorporating elevation into the spatial interpolation of rainfall.
J. hydrol, Vol. 228(2000), pp. 113-129.Haykin, S. 1999. Neural Networks, A Comprehensive Foundation, Prentice Hall Int; Englewood Cliffs, NJ.Nalder I.A., and R.W. Wein. 1998. Spatial interpolation of climatic Normal’s: test of a new method in the Canadian
boreal forest. Agricultural and Forest Meteorology, 92, pp. 211-225.Malek, M. A., S. Harun , S.M. Shamsuddin, and I. Mohammad. 2009. Reconstruction of Missing Daily Rainfall
Data Using Unsupervised Artificial Neural Network. International Journal of Computer Systems Science andEngineering, vol. 4(2), pp. 79-84.
Mahdavi, M. 1998. Applied Hydrology, vol 1, Tehran university publications; Tehran.McCuen, R.H. 1998. Hydrologic Analysis and Design. Prentice-Hall; Englewood Cliffs, NJ.Mendel, J.M., and R.W. McClarn. 1970. Reinforcement-Learning Control and Pattern Recognition System. In
Adaptive, Learning, and Pattern Recognition Systems: Theory and applications, 66.Linsley, R.K., M.A. Kohler, and J.L.H. Paulhus. 1988. Hydrology for Engineers. McGraw-Hill Co.; SingaporeDolling, O.R., and E.A. Varas. 2002. Artificial neural networks for stream flow prediction, Journal of Hydraulic
Research.Vol. 40(5), pp. 547-554.Lucio, P.S., F.C. Conde, I.F.A. Cavalcanti, A.I. Serrano, A.M. Ramos, and A.O. Cardoso. 2007. Spatiotemporal
monthly rainfall reconstruction via artificial neural network – case study: south of Brazil Adv. Geosci.,Vol. 10,pp. 67–76.
Teegavarapu, R.S.V., and V. Chandramouli. 2005. Improved weighting methods, deterministic and stochasticdata-driven models for estimation of missing precipitation records. Journal of Hydrology, Vol. 312, pp. 191–206.
Tolika, K., P. Maheras, M. Vafiadis, H.A. Flocas, and A. Arseni-Papadimitriou. 2007. Simulation of seasonalprecipitation and rain days over Greece: a statistical downscaling technique based on artificial neural networks(ANNs). International Journal of Climatology Vol. 27(7), pp. 861–881.
Vicente-Serrano, S.M., S. Beguería, J.I. López-Moreno, M.A. García-Vera, Petr Stepanek. 2010. A completedaily precipitation database for northeast Spain: reconstruction, quality control, and homogeneity. InternationalJournal of Climatology 30:8, 1146-1163
ADDRESS FOR CORRESPONDENCEZohre KhorsandiDepartment of Natural ResourcesScience and Research BranchIslamic Azad UniversityTehran, Iran
Email: [email protected]
Related Documents


![[hydrology] groundwater hydrology - david k. todd (2005).pdf](https://static.cupdf.com/doc/110x72/577c77961a28abe0548cb0b1/hydrology-groundwater-hydrology-david-k-todd-2005pdf.jpg)