JAGUAR LAND ROVER AUTOMOTIVE PLC HSBC HIGH YIELD CONFERENCE 2016 22 November 2016

Welcome message from author
This document is posted to help you gain knowledge. Please leave a comment to let me know what you think about it! Share it to your friends and learn new things together.
Transcript
Confidential ©2015
JAGUAR LAND R OVER AUTOMOTIVE PLCHSBC HIGH YIELD CONFERENCE 201622 November 2016
- 2 -
Statements in this presentation describing the objectives, projections, estimates and expectations of Jaguar Land Rover Automotive plc and its direct and indirect subsidiaries (the “Company”, “Group” or “JLR”) may be “forward-looking statements” within the meaning of applicable securities laws and regulations. These views are based on a number of assumptions and are subject to various known and unknown risks, uncertainties and other facts which in some cases are beyond our control. Such forward-looking statements are not guarantees of future performance and no assurance can be given that any future events will occur, that projections will be achieved or that the Company’s assumptions will prove to be correct. Actual results could differ materially from those expressed, implied or projected, and the Company does not undertake to revise any such forward-looking statements to reflect future events or circumstances. Important factors that could make a difference to the Company’s operations include, among others, economic conditions affecting demand / supply and price conditions in the domestic and overseas markets in which the Company operates, changes in Government regulations, tax laws and other statutes and incidental factors.
The information contained in this presentation is strictly confidential and is provided by Jaguar Land Rover Automotive plc (the “Company”) to you solely for your reference to allow you to make an evaluation of the Company. Any reproduction, dissemination or onward transmission of this presentation or the information contained herein is strictly prohibited. By accepting delivery of this presentation you acknowledge and agree to comply with the foregoing restrictions.
This presentation is only being provided to persons that are (i) “Qualified Institutional Buyers”, as defined in Rule 144A under the U.S. Securities Act of 1933, as amended (the “Securities Act”), or (ii) non-US persons outside the United States, in compliance with Regulation S under the Securities Act. By attending this presentation or by reading the presentation slides, you warrant and acknowledge that you fall within one of the categories (i) and (ii) above.
This presentation has not been approved by an authorised person in the United Kingdom and is for distribution only to persons who (i) have professional experience in matters relating to investments falling within the definition of “investment professionals” in Article 19(5) of the Financial Services and Markets Act 2000 (Financial Promotion) Order 2005, as amended (the “Order”), (ii) are persons falling within Article 49(2)(a) to (d) (“high net worth companies, unincorporated associations etc”) of the Order, or (iii) are outside the United Kingdom or (iv) are persons to whom an invitation or inducement to engage in investment activity (within the meaning of section 21 of the Financial Services and Markets Act 2000) in connection with the issue or sale of any securities may otherwise lawfully be communicated or caused to be communicated (all such persons together being referred to as “Relevant Persons”). This presentation is directed only at Relevant Persons and must not be acted on or relied on in the United Kingdom by persons who are not Relevant Persons. The distribution of this presentation in other jurisdictions may be restricted by law and you should inform yourself about, and observe, any such restriction. Any investment or investment activity to which this presentation relates is available only to persons eligible to invest and will be engaged in only with such persons.
The information contained in this presentation is subject to change without notice, its accuracy is not guaranteed and it may not contain all material information concerning the Company. Neither the Company nor any of the initial purchasers (the "Initial Purchasers") make any representation or warranty, express or implied, as to, and no reliance should be placed on, the fairness, accuracy, completeness or correctness of the information or opinions contained herein and nothing in this document or any related presentation is, or shall be relied upon as, a promise or representation by the Company or the Initial Purchasers. It is not the intention to provide, and you may not rely on these materials as providing, a complete or comprehensive analysis of the Company’s financial or trading position or prospects. The Information and opinions in these materials are provided as at the date of this presentation and are subject to change without notice. None of the Initial Purchasers, the Company nor any of their respective affiliates, advisors or representatives shall have any liability whatsoever (in negligence or otherwise) for any loss howsoever arising from any use of these materials or their contents or otherwise arising in connection with the materials, or any action taken by you or any of your officers, employees, agents or associates on the basis of this presentation.
DIS CLAIMER(1/2)
- 3 -
This presentation does not constitute or form part of any offer for sale or subscription of or solicitation or invitation of any offer to buy or subscribe for any securities, including in the United States, nor shall it or any part of it form the basis of or be relied on in connection with any contract or commitment whatsoever. Specifically, this presentation does not constitute a “prospectus” within the meaning of the Securities Act.Any decision to purchase securities in the context of a proposed offering, if any, should be made on the basis of information contained in the offering memorandum published in relation to such an offering. Any securities offered by the Company or any of its subsidiaries will not be registered under the Securities Act and may not be offered or sold in the United States absent registration under the Securities Act or an applicable exemption to registration, or in any other jurisdiction absent compliance with the securities laws of such jurisdiction. Neither this presentation nor any related presentation nor any copy thereof may be taken or transmitted or distributed, directly or indirectly, into the United States, other than to qualified institutional buyers under Rule 144A under the Securities Act or outside the United States other than to non-U.S. persons as defined in Regulation S under the Securities Act. • H1 FY17 represents the 6 month period from 1 April 2016 to 30 September 2016• Q2 FY17 represents the 3 month period from 1 July 2016 to 30 September 2016• Q2 FY16 represents the 3 month period from 1 July 2015 to 30 September 2015• Q2 FY17 LTM represents the 12 month period from 1 October 2015 to 30 September 2016• FY16 represents the 12 month period from 1 April 2015 to 31 March 2016• FY15 represents the 12 month period from 1 April 2014 to 31 March 2015• FY14 represents the 12 month period from 1 April 2013 to 31 March 2014• FY13 represents the 12 month period from 1 April 2012 to 31 March 2013• FY12 represents the 12 month period from 1 April 2011 to 31 March 2012
The consolidated financial information of Jaguar Land Rover Automotive plc and its subsidiaries contained in the presentation are prepared in accordance with IFRS as approved in the EU. Certain of this information is unaudited. Retail volume data includes and wholesale volume excludes sales from unconsolidated Chinese joint venture.
DIS CLAIMER(2/2)
- 4 -
Bennett Birgbauer
Treasurer, Jaguar Land Rover
PARTICIPANTS
- 5 -
Business Overview and Historical Performance 8
Recent Performance 13
Looking Ahead 17
Q&A 23
AGENDA

Confidential ©2015
BUSINESS OVERVIEW AND HISTORICAL PERFORMANCE

- 7 -
OUR PRODUCTSTWO ICONIC BRANDS
*Discontinued.
• Premium sports saloons, sports cars and luxury performance SUV’s• FY16 retail volumes: 94.5k units• FY17 H1 retail volumes: 73.5k units (including China JV Retails of 0.6k)
• Premium all-terrain vehicles• FY16 retail volumes: 427.1k units (including China JV Retails of 31.8k)• FY17 H1 retail volumes: 201.7k units (including China JV Retails of 26.9.5k)
XJ F-TYPEF-PACE DEFENDER*DISCOVERY*RANGE ROVER
XE
XF F-TYPE Convertible RANGE ROVER SPORTEVOQUE
ALL-NEW XFL ALL-NEW DISCOVERYNEW DISCOVERY SPORT
Luxury
XJ
LifestyleSport Dual-PurposeLeisure

- 8 -
CLEAR BUSINESS STRATEGY
Strong global brands
Substantial investment
Exciting new
products
Meet customer and
legislative requirements
Profitable volume growth
Maintain strong
liquidity
- 9 -
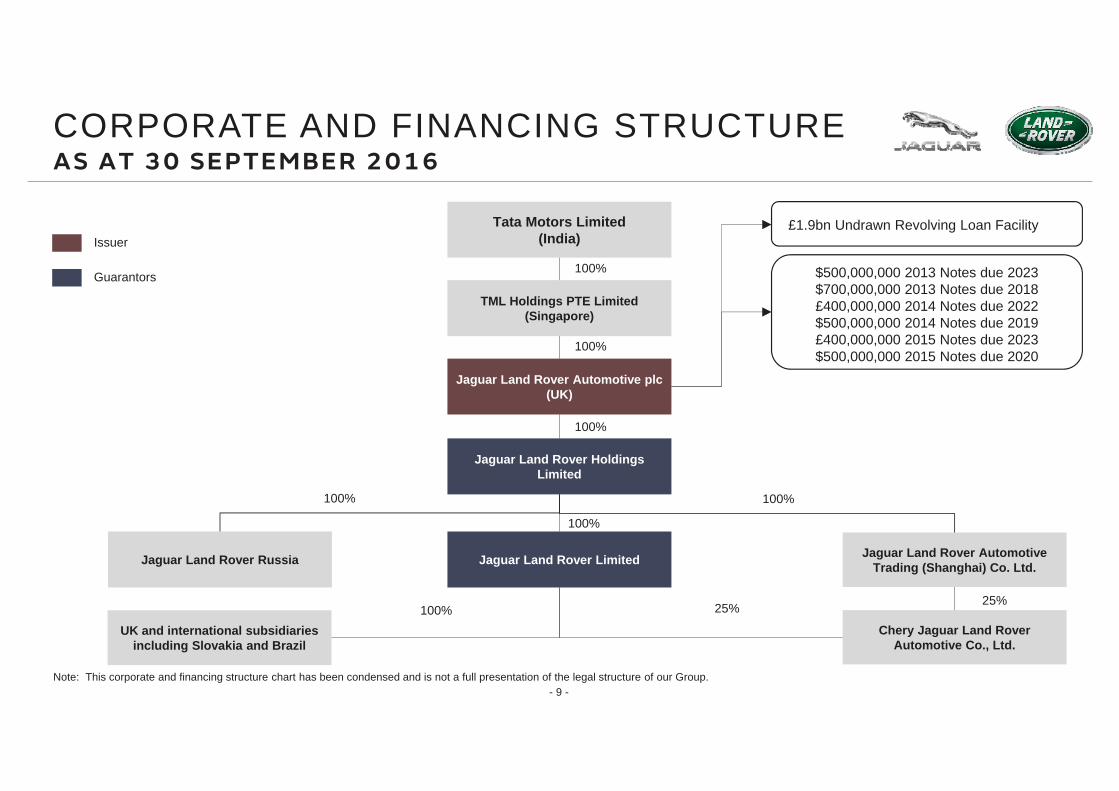
CORPORATE AND FINANCING STRUCTUREAS AT 30 SEPTEMBER 2016
Note: This corporate and financing structure chart has been condensed and is not a full presentation of the legal structure of our Group.
TML Holdings PTE Limited(Singapore)
Jaguar Land Rover Automotive plc (UK)
Jaguar Land Rover Holdings Limited
Jaguar Land Rover LimitedJaguar Land Rover Russia Jaguar Land Rover Automotive Trading (Shanghai) Co. Ltd.
UK and international subsidiaries including Slovakia and Brazil
Chery Jaguar Land Rover Automotive Co., Ltd.
£1.9bn Undrawn Revolving Loan FacilityIssuer
Guarantors
100%
100%
100%
100% 100%
100% 25% 25%
Tata Motors Limited(India)
100% $500,000,000 2013 Notes due 2023$700,000,000 2013 Notes due 2018£400,000,000 2014 Notes due 2022$500,000,000 2014 Notes due 2019£400,000,000 2015 Notes due 2023$500,000,000 2015 Notes due 2020
- 10 -
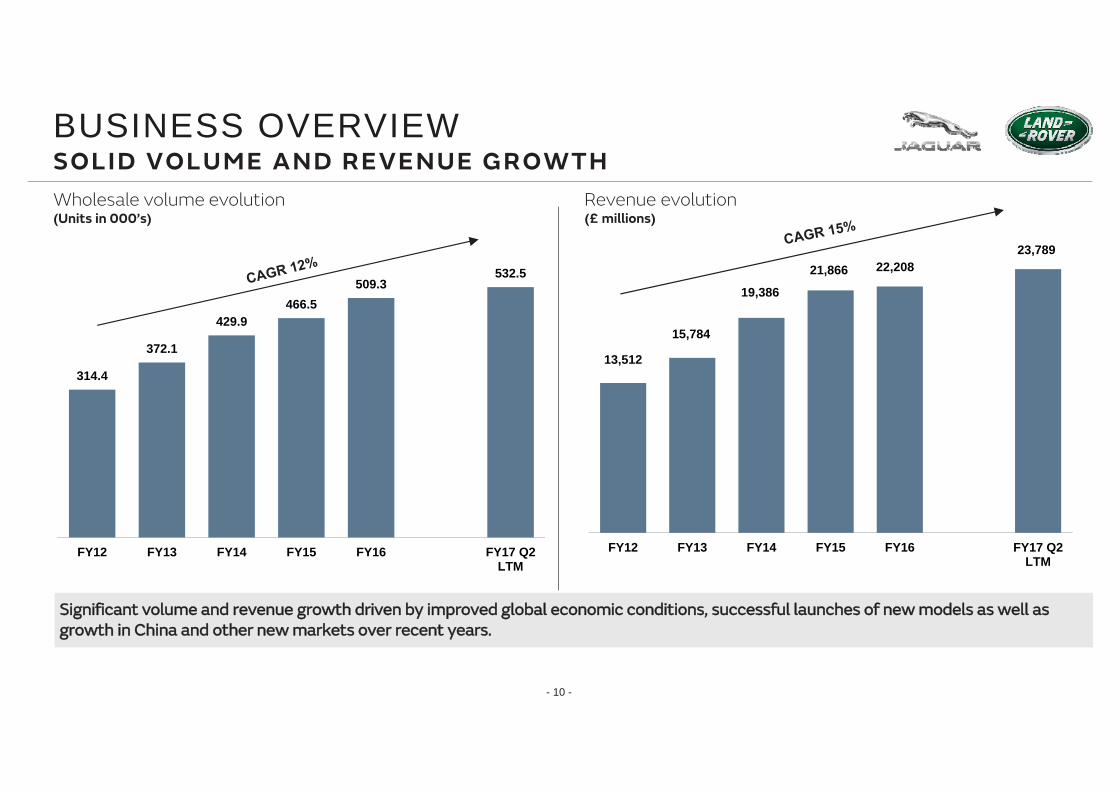
13,512
15,784
19,386
21,866 22,20823,789
FY12 FY13 FY14 FY15 FY16 FY17 Q2LTM
BUSINESS OVERVIEWSOLID VOLUME AND REVENUE GROWTH
314.4
372.1
429.9466.5
509.3532.5
FY12 FY13 FY14 FY15 FY16 FY17 Q2LTM
Significant volume and revenue growth driven by improved global economic conditions, successful launches of new models as well as growth in China and other new markets over recent years.
Wholesale volume evolution(Units in 000’s)
Revenue evolution(£ millions)
- 11 -
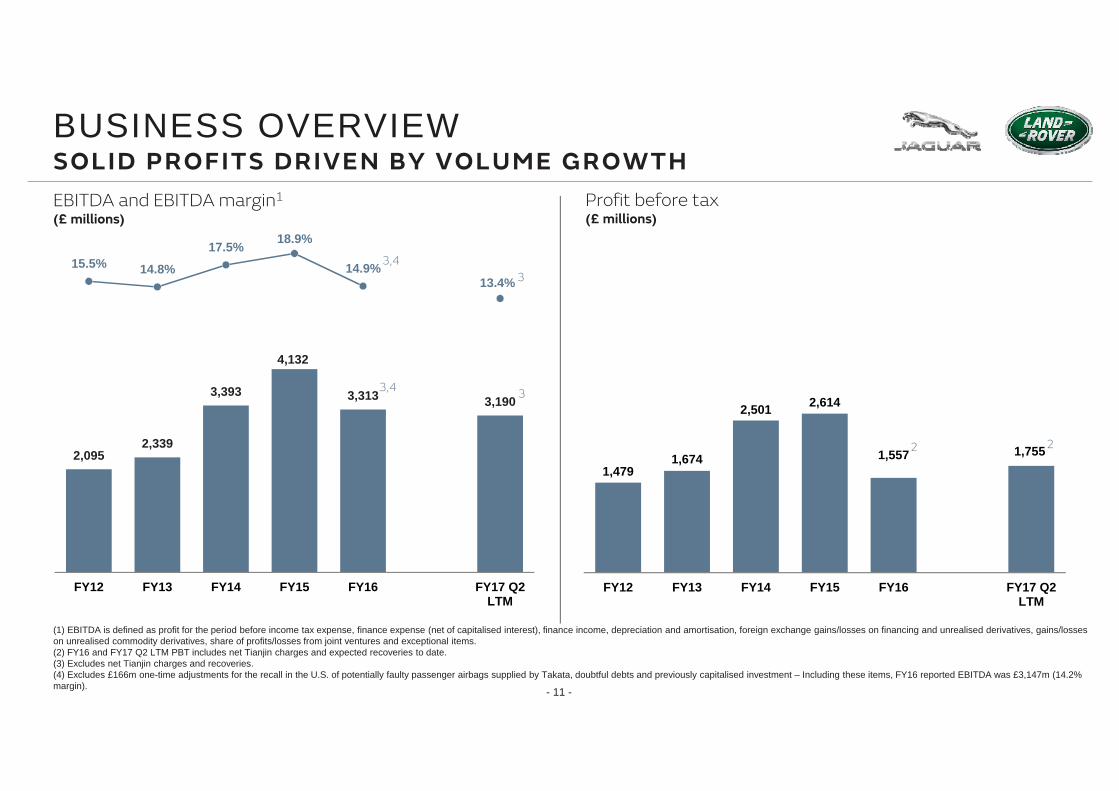
BUSINESS OVERVIEWSOLID PROFITS DRIVEN BY VOLUME GROWTH
2,0952,339
3,393
4,132
3,313 3,190
15.5% 14.8%
17.5% 18.9%
14.9% 13.4%
(20.0%)
(15.0%)
(10.0%)
(5.0%)
0.0%
5.0%
10.0%
15.0%
FY12 FY13 FY14 FY15 FY16 FY17 Q2LTM
1,4791,674
2,501 2,614
1,557 1,755
FY12 FY13 FY14 FY15 FY16 FY17 Q2LTM
(1) EBITDA is defined as profit for the period before income tax expense, finance expense (net of capitalised interest), finance income, depreciation and amortisation, foreign exchange gains/losses on financing and unrealised derivatives, gains/losses on unrealised commodity derivatives, share of profits/losses from joint ventures and exceptional items. (2) FY16 and FY17 Q2 LTM PBT includes net Tianjin charges and expected recoveries to date. (3) Excludes net Tianjin charges and recoveries. (4) Excludes £166m one-time adjustments for the recall in the U.S. of potentially faulty passenger airbags supplied by Takata, doubtful debts and previously capitalised investment – Including these items, FY16 reported EBITDA was £3,147m (14.2% margin).
EBITDA and EBITDA margin1
(£ millions)Profit before tax(£ millions)
3,43
3,4 3
2 2

- 12 -
958 595
1,109 842 791
1284
(400)
600
1,600
2,600
3,600
4,600
FY12 FY13 FY14 FY15 FY16 FY17Q2
LTM
CASH FLOW AND INVESTMENT SPENDINGSTRONG CASH FLOW FUNDING INCREASING INVESTMENT
2,518 2,713
3,793 3,989 3,926
4,344
FY12 FY13 FY14 FY15 FY16 FY17Q2 LTM
900 1,058 1,270 1,411 1,560 1,666
660
1,057
1,414 1,736 1,575 1,394
1,560
2,118
2,684
3,147 3,135 3,060
11.5%13.4% 13.8% 14.4% 14.1%
12.9%
-12.0%
-7.0%
-2.0%
3.0%
8.0%
13.0%
18.0%
FY12 FY13 FY14 FY15 FY16 FY17Q2 LTM
CFI
Investment in tangible and other intangible assets
R&D
CAPEX Ratio (Capital investment/Revenue)
Cash Flow Before Product Investment(£ millions)
Product Investment*
(£ millions)Free Cash Flow Before Financing**
(£ millions)
*Total product and other investment reflects net cash used in investing activities and expensed R&D (not included in net cash used in investing activities) but excluding movements in other restricted deposits, movements in short-term deposits, finance income received and proceeds from sale of property, plant and equipment.** Free cash flow reflects net cash generated from operating activities less net cash used in investing activities (excluding investments in short-term deposits) and including foreign exchange gains/losses on short-term deposits.
Confidential ©2015
RECENT PERFORMANCE

- 14 -- 14 -
H1 FY17 RETAIL SALES OF 275.2k UP 22% RECORD SALES -- ALL REGIONS UP
Up 28% Up 23% Up 33%
Up 23% Up 4%
Europe Overseas 6M FY16
225,105 Units
UKNorth America China* 6M FY17
275,212 Units
13.0 17.7
33.9 40.2
46.9 57.9
6M FY16 6M FY17
UK, 21%
China Region,
20%
Overseas, 16%
Europe (ex. Russia),
23%
North America,
20%
UK, 21%
China Region, 18%
Overseas, 19%
Europe (ex. Russia),
23%
North America,
19%
7.6 17.0
35.1 37.8
42.7 54.8
6M FY16 6M FY175.7 9.6 25.3 18.1
10.4 27.5 41.4
55.2
6M FY16 6M FY17
5.7 10.0
36.3 33.6
42.1 43.6
6M FY16 6M FY178.7 18.6
43.2 45.1
52.0 63.7
6M FY16 6M FY17* Total volumes includes sales from Chery Jaguar Land Rover – 6M FY17 27,531 units (Discovery Sport: 18,450, Evoque: 8,487, XF: 594); 6M FY16 10,388 (Evoque only)
Units in ‘000
Land RoverJaguarCJLR

- 15 -- 15 -
H1 FY17 RETAIL SALES OF 275.2k UP 22%LEAD BY STRONG F-PACE, XE AND DISCOVERY SPORT
Up 80% Up 9%
Jaguar ‐ 6M FY17 vs 6M FY16 Land Rover ‐ 6M FY17 vs 6M FY16
0.2 12.2 20.4 16.4 15.8 5.8 5.3 -26.6
6.1
5.3 40.8
73.5
6M FY16 6M FY17
F‐TYPEF‐PACEXJXF*XEXK 11.0 1.1
0.2 35.0 57.4
49.2 51.8
21.5 25.7
40.3 40.8
27.2 24.9 184.4
201.7
6M FY16 6M FY17
Range Rover
Range RoverSportDiscovery
Range RoverEvoque*DiscoverySport*Freelander
Defender
Units in ‘000
* Total volumes includes sales from Chery Jaguar Land Rover – 6M FY17 27,531 units (Discovery Sport: 18,450, Evoque: 8,487, XF: 594); 6M FY16 10,388 (Evoque only)
- 16 -
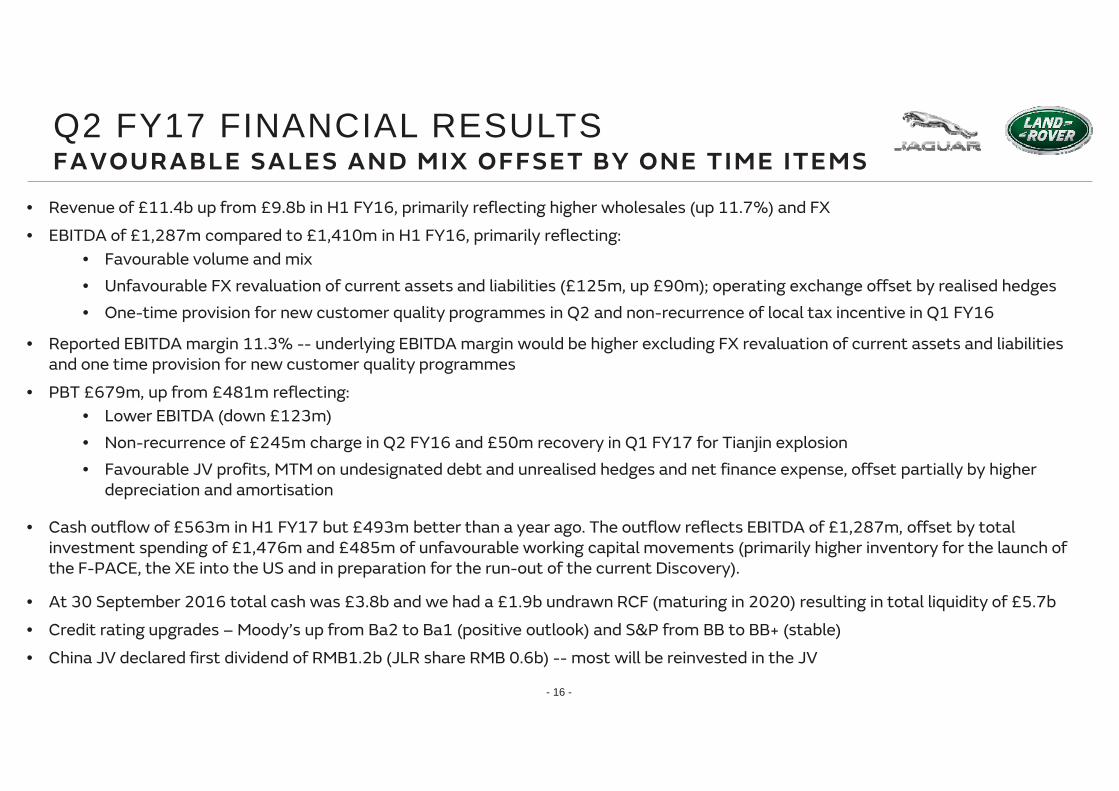
Q2 FY17 FINANCIAL RESULTSFAVOURABLE SALES AND MIX OFFSET BY ONE TIME ITEMS
• Revenue of £11.4b up from £9.8b in H1 FY16, primarily reflecting higher wholesales (up 11.7%) and FX• EBITDA of £1,287m compared to £1,410m in H1 FY16, primarily reflecting:
• Favourable volume and mix• Unfavourable FX revaluation of current assets and liabilities (£125m, up £90m); operating exchange offset by realised hedges • One-time provision for new customer quality programmes in Q2 and non-recurrence of local tax incentive in Q1 FY16
• Reported EBITDA margin 11.3% -- underlying EBITDA margin would be higher excluding FX revaluation of current assets and liabilities and one time provision for new customer quality programmes
• PBT £679m, up from £481m reflecting:• Lower EBITDA (down £123m)• Non-recurrence of £245m charge in Q2 FY16 and £50m recovery in Q1 FY17 for Tianjin explosion• Favourable JV profits, MTM on undesignated debt and unrealised hedges and net finance expense, offset partially by higher
depreciation and amortisation
• Cash outflow of £563m in H1 FY17 but £493m better than a year ago. The outflow reflects EBITDA of £1,287m, offset by total investment spending of £1,476m and £485m of unfavourable working capital movements (primarily higher inventory for the launch of the F-PACE, the XE into the US and in preparation for the run-out of the current Discovery).
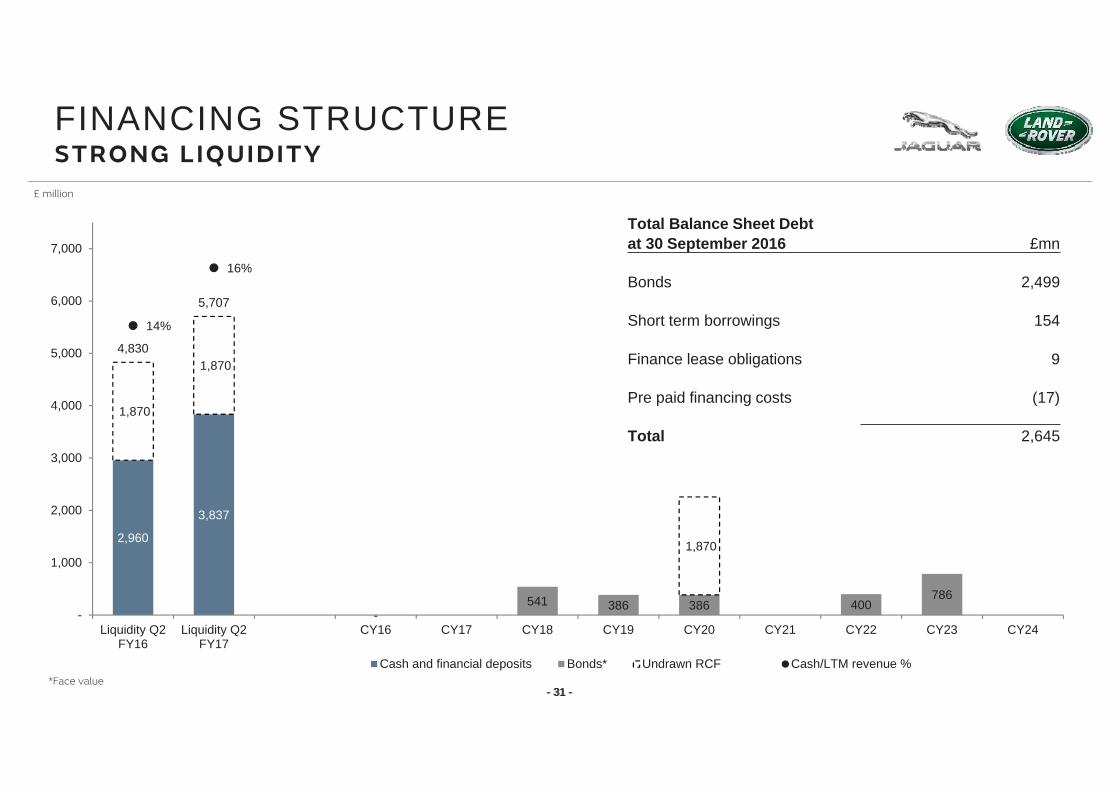
• At 30 September 2016 total cash was £3.8b and we had a £1.9b undrawn RCF (maturing in 2020) resulting in total liquidity of £5.7b
• Credit rating upgrades – Moody’s up from Ba2 to Ba1 (positive outlook) and S&P from BB to BB+ (stable)
• China JV declared first dividend of RMB1.2b (JLR share RMB 0.6b) -- most will be reinvested in the JV

Confidential ©2015
LOOKING AHEAD
- 18 -
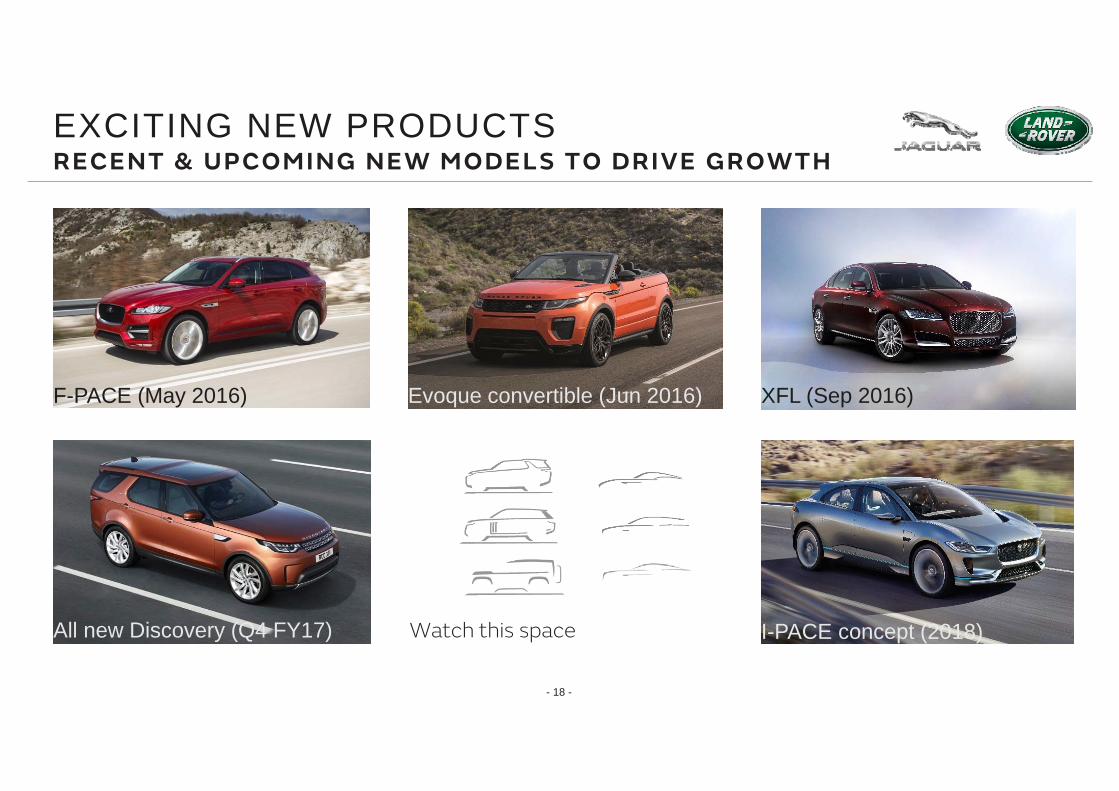
EXCITING NEW PRODUCTSRECENT & UPCOMING NEW MODELS TO DRIVE GROWTH
Watch this space
F-PACE (May 2016) Evoque convertible (Jun 2016) XFL (Sep 2016)
All new Discovery (Q4 FY17) I-PACE concept (2018)
- 19 -
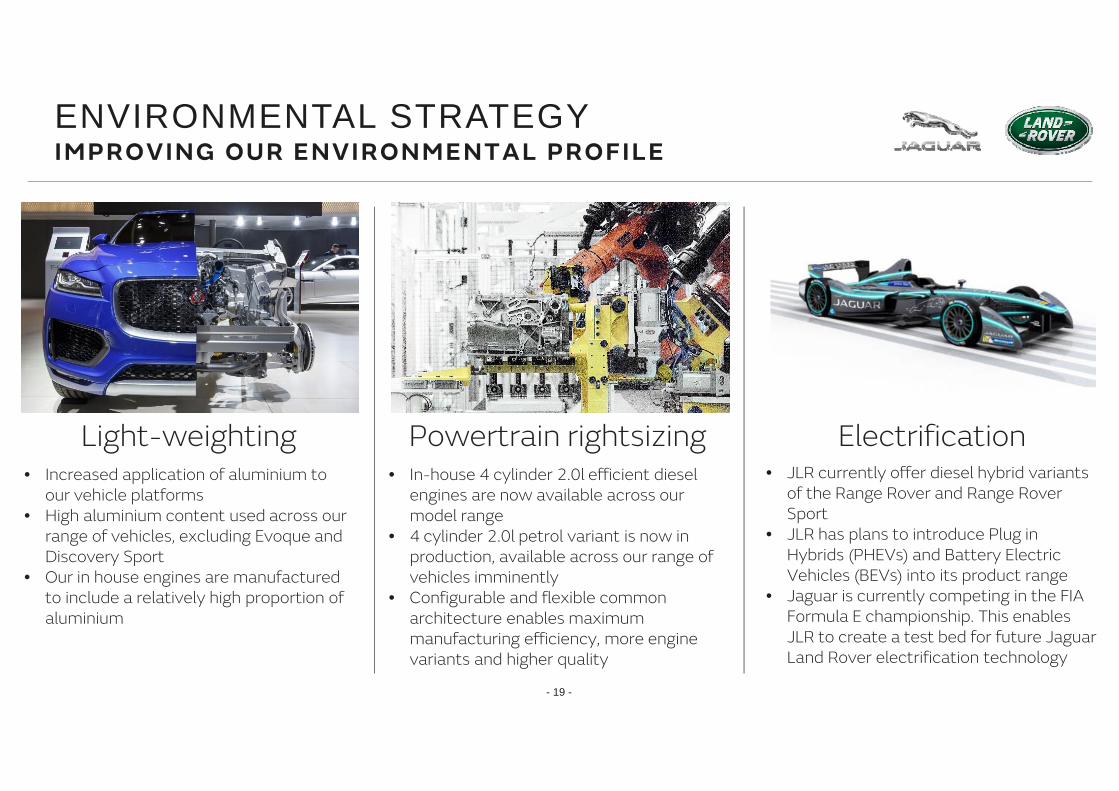
ENVIRONMENTAL STRATEGYIMPROVING OUR ENVIRONMENTAL PROFILE
Electrification• JLR currently offer diesel hybrid variants
of the Range Rover and Range Rover Sport
• JLR has plans to introduce Plug in Hybrids (PHEVs) and Battery Electric Vehicles (BEVs) into its product range
• Jaguar is currently competing in the FIA Formula E championship. This enables JLR to create a test bed for future Jaguar Land Rover electrification technology
Light-weighting• Increased application of aluminium to
our vehicle platforms • High aluminium content used across our
range of vehicles, excluding Evoque and Discovery Sport
• Our in house engines are manufactured to include a relatively high proportion of aluminium
Powertrain rightsizing• In-house 4 cylinder 2.0l efficient diesel
engines are now available across our model range
• 4 cylinder 2.0l petrol variant is now in production, available across our range of vehicles imminently
• Configurable and flexible common architecture enables maximum manufacturing efficiency, more engine variants and higher quality

- 20 -
I-PACE CONCEPT
I-PACE concept• All-wheel-drive from twin
electric motors
• 500km range (NEDC cycle)
• 0-60mph in 4 seconds
• 90kWh lithium-ion battery
• Rapid charging takes 2 hours
• On the road in 2018

- 21 -
OTHER STRATEGIC DEVELOPMENTSFUTURE TECHNOLOGICAL AND BUSINESS INITIATIVES
Connected Cars• JLR have already deployed intelligent
navigation and information systems, smartphone integration (including remote control of climate settings and security) and in-car Wi-Fi connectivity into various vehicles
• JLR recently announced the expansion of the usability of its remote functions app to include smart-watch technology
Autonomous Vehicles• JLR demonstrated highly autonomous
vehicle technologies to EU Transport Ministers, including 'hands free' driving in April 2016
• JLR is investing in the UK’s first “connected corridor”, a 41 mile 'living laboratory' project on UK roads to develop new Connected and Autonomous Vehicle technologies
InMotion• Jaguar Land Rover has launched
InMotion, a business unit to develop innovative solutions aimed at overcoming future travel and transport challenges
• Focused on building apps and on-demand services
• Current initiatives include car sharing and ownership solutions
- 22 -
• JLR’s strategy continues to be to invest in new products, technology and manufacturing capacity to grow profitably – in FY17 investment spending is likely to be somewhat lower than the prior indication of about £3.75b
• Jaguar Land Rover plans to continue to build on recent successful product launches with the continued sales ramp up of the Jaguar F-PACE , XF long wheel base in China, the Evoque Convertible and future new models including the all new Land Rover Discovery and others to be announced
• Increasing sales of these new products and the planned start of new Discovery wholesales in Q4 FY17 are expected to drive profitable growth and support a solid second half of the year
• JLR continues to have a balanced sales profile and will continue to closely monitor and assess market conditions in key regions
LOOKING AHEADCONTINUING TO INVEST TO DRIVE PROFITABLE GROWTH
Confidential ©2015
Q&A
- 23 -

Confidential ©2015
ADDITIONAL SLIDES
- 24 -

- 25 -- 25 -
Up 28% Up 6% Down (9)%
Up 24% Down (7)%
Europe Overseas 6M FY16
221,810 Units
UKNorth America China* 6M FY17
244,960 Units
14.7 15.6
34.0 36.1
48.7 51.6
6M FY16 6M FY17
UK, 21%
China Region,
11%
Overseas, 17%
Europe (ex. Russia),
26%
North America,
25%
UK, 22%
China Region, 13%
Overseas, 20%
Europe (ex. Russia),
24%
North America,
21%
7.0 21.3
40.5 39.5
47.5 60.8
6M FY16 6M FY175.0 10.1
24.9 17.1
29.9 27.2
6M FY16 6M FY17
5.8 10.1
37.8 30.6
43.6 40.7
6M FY16 6M FY1710.3 19.5
41.8 45.2
52.1 64.7
6M FY16 6M FY17
H1 FY17 WHOLESALES OF 245.0k UP 10%NORTH AMERICA, UK AND EUROPE UP
* Total volumes excludes sales from Chery Jaguar Land Rover – 6M FY17 28,601 units. 6M FY16 9,389
Units in ‘000
Land RoverJaguar

- 26 -- 26 -
Up 78% Down (6)%
Jaguar ‐ 6M FY17 vs 6M FY16 Land Rover ‐ 6M FY17 vs 6M FY16
0.1 0.0 17.6 20.9 13.8 13.6 4.8 4.4
31.9 6.6
5.6 42.9
76.5
6M FY16 6M FY17
F‐TYPEF‐PACEXJXF*XEXK 11.3 0.3
1.1 0.2 36.7
36.9
40.1 43.1
21.7 22.8
40.7 39.8
27.4 25.4
178.9 168.5
6M FY16 6M FY17
Range Rover
Range RoverSportDiscovery
Range RoverEvoque*DiscoverySport*Freelander
Defender
Units in ‘000
H1 FY17 WHOLESALES OF 245.0k UP 10%STRONG SALES OF F-PACE, XE, EVOQUE AND DISCOVERY
* Total volumes excludes sales from Chery Jaguar Land Rover – 6M FY17 28,601 units. 6M FY16 9,389
- 27 -
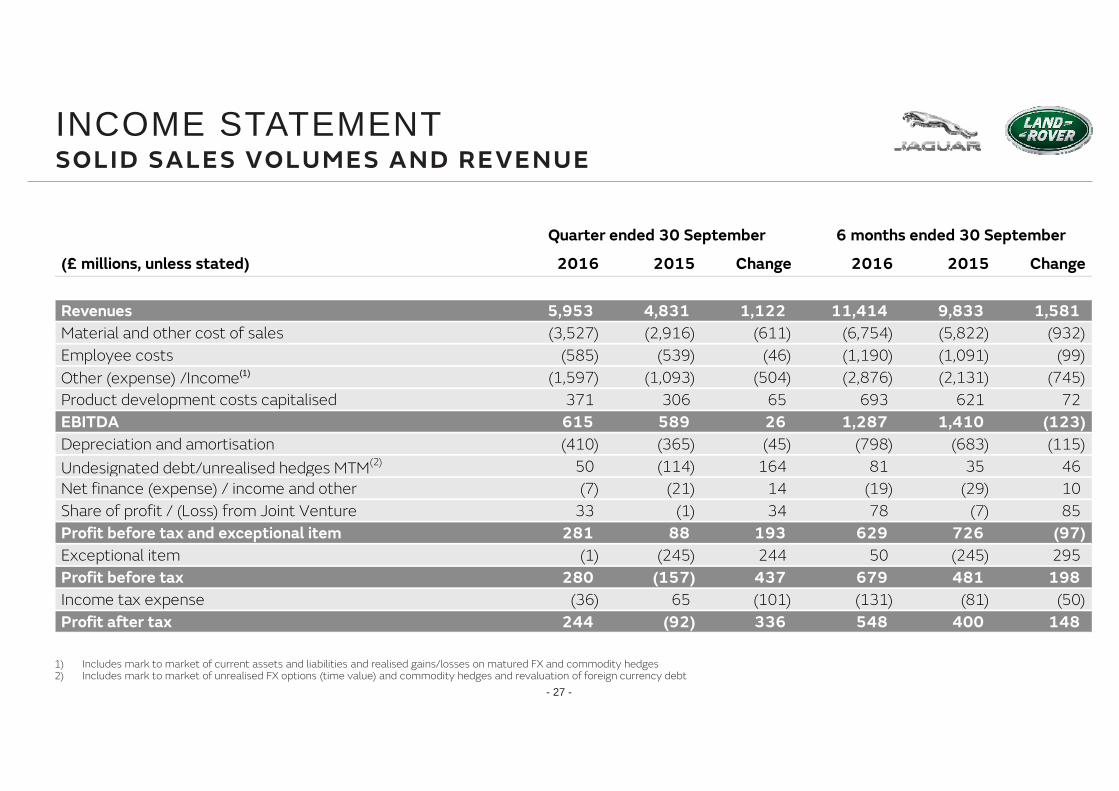
INCOME STATEMENTSOLID SALES VOLUMES AND REVENUE
Consolidated income statement - IFRS
1) Includes mark to market of current assets and liabilities and realised gains/losses on matured FX and commodity hedges2) Includes mark to market of unrealised FX options (time value) and commodity hedges and revaluation of foreign currency debt
(£ millions, unless stated) 2016 2015 Change 2016 2015 Change31 23 34 26
Revenues 5,953 4,831 1,122 11,414 9,833 1,581 Material and other cost of sales (3,527) (2,916) (611) (6,754) (5,822) (932) Employee costs (585) (539) (46) (1,190) (1,091) (99) Other (expense) /Income(1) (1,597) (1,093) (504) (2,876) (2,131) (745) Product development costs capitalised 371 306 65 693 621 72 EBITDA 615 589 26 1,287 1,410 (123) Depreciation and amortisation (410) (365) (45) (798) (683) (115) Undesignated debt/unrealised hedges MTM(2) 50 (114) 164 81 35 46 Net finance (expense) / income and other (7) (21) 14 (19) (29) 10 Share of profit / (Loss) from Joint Venture 33 (1) 34 78 (7) 85 Profit before tax and exceptional item 281 88 193 629 726 (97) Exceptional item (1) (245) 244 50 (245) 295 Profit before tax 280 (157) 437 679 481 198 Income tax expense (36) 65 (101) (131) (81) (50) Profit after tax 244 (92) 336 548 400 148
Quarter ended 30 September 6 months ended 30 September
- 28 -
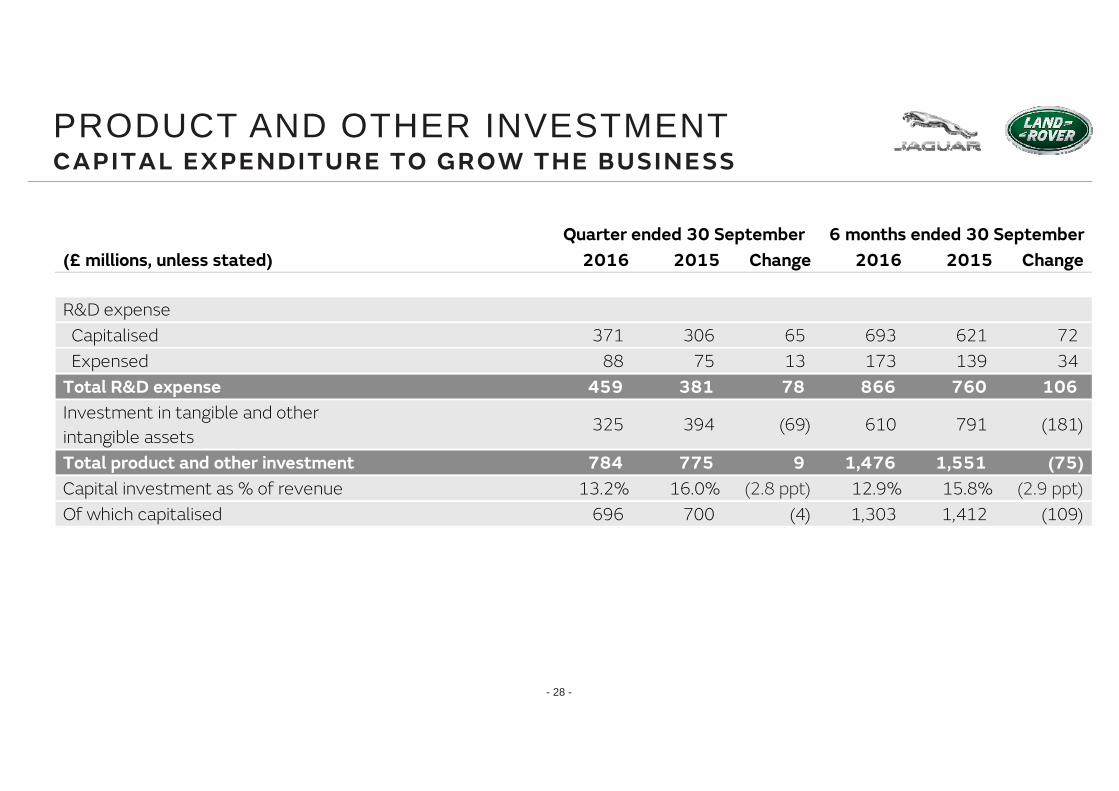
PRODUCT AND OTHER INVESTMENTCAPITAL EXPENDITURE TO GROW THE BUSINESS
(£ millions, unless stated) 2016 2015 Change 2016 2015 Change31 23 34 26
R&D expense Capitalised 371 306 65 693 621 72 Expensed 88 75 13 173 139 34 Total R&D expense 459 381 78 866 760 106 Investment in tangible and other intangible assets
325 394 (69) 610 791 (181)
Total product and other investment 784 775 9 1,476 1,551 (75) Capital investment as % of revenue 13.2% 16.0% (2.8 ppt) 12.9% 15.8% (2.9 ppt)Of which capitalised 696 700 (4) 1,303 1,412 (109)
Quarter ended 30 September 6 months ended 30 September

- 29 -
FOREIGN EXCHANGEIMPACT ON PROFITABILITY
(£ millions, unless stated) 2016 2015 Change
Operational exchange1 n/a n/a 255
Realized FX Hedges and other2 (391) (120) (271)
Revaluation of Current Assets/Liabilities3 (125) (35) (90) Total FX impacting EBITDA n/a n/a (106) 0
Revaluation of Undesignated Debt3 (60) 40 (100)
Unrealised FX Hedges3 74 52 22 Total FX below EBITDA 15 92 (77) 0Total FX impact on PBT n/a n/a (183)
Total FX Revaluation (included above) (110) 56 (166)
End of Period Exchange Rates 30-Sep-16 Q-o-Q 30-Sep-15 Q-o-Q
GBP:USD 1.295 3.8% 1.514 3.6%
GBP:EUR 1.158 4.4% 1.349 4.1%
GBP:CNY 8.650 3.5% 9.614 1.3%
Memo: 1 The year‐on‐year operational excahnge is an analytical estimate, which may differ from the actual impact2 Realised hedge gains/(losses) are driven by the difference between executed hedging exchange rates compared to accounting exchange rates3 Exchange revaluation gains/(losses) reflects the estimated impact of the change in end of period exchange rates as applied to relevant balances
6 months ended 30 September

- 30 -- 30 -
CASH FLOWINVESTMENT FUNDED BY EBITDA AND WORKING CAPITAL
Consolidated cash flow - IFRS
(£ millions, unless stated) 2016 2015 Change 2016 2015 Change
31 23 34 26EBITDA 615 589 26 1,287 1,410 (123)
Working capital (incl. non cash accruals) 182 (75) 257 (485) (960) 475
Tax paid (41) (48) 7 (100) (105) 5
Cash flow from operations 756 466 290 702 345 357
Investment in fixed and intangible assets (696) (700) 4 (1,303) (1,412) 109
Finance income and other (includes FX revaluation) 10 14 (4) 38 11 27
Free cash flow (before financing) 70 (220) 290 (563) (1,056) 493
Changes in debt 60 (27) 87 (32) (22) (10)
Finance expenses and fees (42) (50) 8 (69) (75) 6
Dividends paid - - - (150) (150) -
Net change in cash & financial deposits 88 (297) 385 (814) (1,303) 489
Quarter ended 30 September 6 months ended 30 September
- 31 -- 31 -
2,960
3,837
-541 386 386 400
786
1,870
1,870
1,870
4,830
5,707
14%
16%
2%
4%
6%
8%
10%
12%
14%
16%
18%
-
1,000
2,000
3,000
4,000
5,000
6,000
7,000
Liquidity Q2FY16
Liquidity Q2FY17
CY16 CY17 CY18 CY19 CY20 CY21 CY22 CY23 CY24
Cash and financial deposits Bonds* Undrawn RCF Cash/LTM revenue %
FINANCING STRUCTURESTRONG LIQUIDITY
£ million
Total Balance Sheet Debtat 30 September 2016 £mn
Bonds 2,499
Short term borrowings 154
Finance lease obligations 9
Pre paid financing costs (17)
Total 2,645
*Face value

- 32 -
The implications for JLR of BREXIT include: • The extent to which the Pound remains weaker• Any incremental tariffs that might result following exit from the EU• Any impact on economic growth and consumer confidence in the UK and the EU, recognizing over 50% of sales are to
other markets and JLR’s strong and growing model line up
Currency implications• JLR sells about 80% of vehicles outside the UK (24% Europe, 19% China, 19% US, 18% other)• JLR sources over 40% of components from the EU with the UK accounting for the majority of other material and operating
costs• JLR would benefit from a continued weaker Pound exchange rates as a result of Brexit (offset partially in the case of the
Euro), however, in the nearer term this will largely be offset by hedges executed when the Pound was stronger
Tariff implications• UK vehicle exports into the EU (c. 24%) could become subject to tariffs depending on trade agreements to be negotiated
with the EU. Similarly, vehicles manufactured in the EU and imported into the UK in the future could also be affected• Components sourced from the EU could also become subject to tariffs, however, these would be recoverable on vehicles
subsequently exported out of the UK (presently c. 80%)
JUNE 23 BREXIT REFERENDUMIMPLICATIONS FOR JLR
Related Documents