0 IS THERE A “WORKABLE” RACE-NEUTRAL ALTERNATIVE TO AFFIRMATIVE ACTION IN COLLEGE ADMISSIONS? * MARK C. LONG University of Washington [email protected] The 2013 decision by the U.S. Supreme Court in the Fisher v. University of Texas at Austin case clarified when and how it is legally permissible for universities to use an applicant’s race-ethnicity in its admissions decisions. The court concluded that such use is permissible when “no workable race-neutral alternatives would produce the educational benefits of diversity.” This paper shows that replacing traditional affirmative action with a system that uses an applicant’s predicted likelihood of being an underrepresented racial minority as a proxy for the applicant’s actual minority status can yield an admitted class that has a lower predicted grade point average and likelihood of graduating than the class that would have been admitted using traditional affirmative action. This result suggests that race-neutral alternatives may not be “workable” from the university’s perspective. JEL Codes: I23, I24, J24, H52, K39. Keywords: Human Capital; College Admission; Affirmative Action; Racial Discrimination. * I am grateful for the excellent research assistance provided by Mariam Zameer and for helpful comments and discussions with Liliana Garces, Gary Orfield, and Judith Winston. This research uses data from the Texas Higher Education Opportunity Project (THEOP) and acknowledges the following agencies that made THEOP data available through grants and support: Ford Foundation, The Andrew W. Mellon Foundation, The William and Flora Hewlett Foundation, The Spencer Foundation, National Science Foundation (NSF Grant # SES- 0350990), The National Institute of Child Health & Human Development (NICHD Grant # R24 H0047879) and The Office of Population Research at Princeton University.

Welcome message from author
This document is posted to help you gain knowledge. Please leave a comment to let me know what you think about it! Share it to your friends and learn new things together.
Transcript
0
IS THERE A “WORKABLE” RACE-NEUTRAL ALTERNATIVE TO
AFFIRMATIVE ACTION IN COLLEGE ADMISSIONS?*
MARK C. LONG
University of Washington
The 2013 decision by the U.S. Supreme Court in the Fisher v. University of Texas at
Austin case clarified when and how it is legally permissible for universities to use an applicant’s
race-ethnicity in its admissions decisions. The court concluded that such use is permissible when
“no workable race-neutral alternatives would produce the educational benefits of diversity.”
This paper shows that replacing traditional affirmative action with a system that uses an
applicant’s predicted likelihood of being an underrepresented racial minority as a proxy for the
applicant’s actual minority status can yield an admitted class that has a lower predicted grade
point average and likelihood of graduating than the class that would have been admitted using
traditional affirmative action. This result suggests that race-neutral alternatives may not be
“workable” from the university’s perspective.
JEL Codes: I23, I24, J24, H52, K39.
Keywords: Human Capital; College Admission; Affirmative Action; Racial Discrimination.
* I am grateful for the excellent research assistance provided by Mariam Zameer and for
helpful comments and discussions with Liliana Garces, Gary Orfield, and Judith Winston. This
research uses data from the Texas Higher Education Opportunity Project (THEOP) and
acknowledges the following agencies that made THEOP data available through grants and
support: Ford Foundation, The Andrew W. Mellon Foundation, The William and Flora Hewlett
Foundation, The Spencer Foundation, National Science Foundation (NSF Grant # SES-
0350990), The National Institute of Child Health & Human Development (NICHD Grant # R24
H0047879) and The Office of Population Research at Princeton University.
1
I. INTRODUCTION
I.A. Legal Context
Affirmative Action in college admissions has always been controversial and its legality
has been under constant challenge for over 40 years. The 1978 decision by the U.S. Supreme
Court in the Regents of the University of California v. Bakke case was a split decision. Four
justices voted for reversal of the lower court’s ruling that the admissions system used by the
Medical School at UC-Davis (which reserved a set number of admissions slots for minority
applicants) violated the 14th Amendment of the U.S. Constitution and the Federal Civil Rights
Act, four voted for affirmance of the lower court ruling, and Justice Powell voted to affirm the
part of the decision that stated that UC-Davis’s two-track admission system was unconstitutional,
but rejected the part that enjoined UC-Davis from taking race into account. Rather, Powell
concluded that “the goal of achieving a diverse student body is sufficiently compelling to justify
consideration of race in admissions decisions under some circumstances” (p. 267). This ruling
prompted “diversity” to be the only compelling argument that most universities could use to
justify their use of affirmative action, disallowed the use of separate admissions systems for
minority applicants, and limited universities to use race as only one factor among many in
comparing applicants.
The 4-4-1 split decision in Bakke left the legality of college affirmative action on shaky
ground. In 1992, Cheryl Hopwood and three other plaintiffs sued after being denied admittance
to the University of Texas Law School. In the Hopwood v. Texas case, the Fifth Circuit Court of
Appeals effectively rejected the Bakke opinion of Justice Powell. They concluded that:
“…any consideration of race or ethnicity by the law school for the purpose of achieving a
diverse student body is not a compelling interest under the Fourteenth Amendment.
2
Justice Powell's argument in Bakke garnered only his own vote and has never represented
the view of a majority of the Court in Bakke or any other case” (p. 25).
The U.S. Supreme Court decided not to hear the case. Subsequently, the Attorney General of
Texas interpreted the Hopwood decision as a ban on race-based admissions, financial aid, and
recruiting policies at both public and private institutions in the state. The first freshman class to
be affected by the ban enrolled in the fall of 1997.
The ambiguities left by the divergence of decisions in the Bakke and Hopwood cases
were resolved by the Supreme Court's 2003 decisions regarding the University of Michigan's
undergraduate and law school admissions in Gratz v. Bollinger and Grutter v. Bollinger. The
Court's decisions, found that
“…diversity is a compelling interest in higher education, and that race is one of a number
of factors that can be taken into account to achieve the educational benefits of a diverse
student body. The Court found that the individualized, whole-file review used in the
University of Michigan Law School's admissions process is narrowly tailored to achieve
the educational benefits of diversity… while race is one of a number of factors that can
be considered in undergraduate admissions, the automatic distribution of [a fixed number
of points] to students from underrepresented minority groups is not narrowly tailored” (p.
1, Alger, 2003).
These decisions essentially allowed for race and ethnicity to be taken account of in
admissions, so long as that consideration was not mechanical and was part of a full
review of the applicant’s file.
Furthermore, the Grutter decision outlined steps that universities must take prior to using
race/ethnicity in their admission decisions. Justice O’Connor’s Opinion of the Court noted that:
3
Narrow tailoring does not require exhaustion of every conceivable race-neutral
alternative. Nor does it require a university to choose between maintaining a reputation
for excellence or fulfilling a commitment to provide educational opportunities to
members of all racial groups. … Narrow tailoring does, however, require serious, good
faith consideration of workable race-neutral alternatives that will achieve the diversity the
university seeks” (p. 27).
Finally, the Grutter decision concluded that “race conscious admissions policies must be
limited in time” (p. 30) and included O’Connor’s note that:
“It has been 25 years since Justice Powell first approved the use of race to further an
interest in student body diversity in the context of public higher education. … We expect
that 25 years from now, the use of racial preferences will no longer be necessary to
further the interest approved today” (p. 31).1
To some critics of affirmative action, this stated expectation appeared to establish an expiration
date for affirmative action, and created an invitation to continue to legally challenge university
policies.
Following the Grutter decision, the University of Texas at Austin (UT) announced their
return to using affirmative action in 2005 (Faulkner, 2005). UT’s decision prompted a court
challenge, Fisher v. the University of Texas at Austin, which was decided by the U.S. Supreme
1 Krueger, Rothstein, and Turner (2006) concluded that this expectation is too optimistic;
“Economic progress alone is unlikely to narrow the achievement gap enough in 25 years to
produce today’s racial diversity levels with race-blind admissions” (p. 282). For a sample of
other recent empirical analyses of affirmative action in college admissions, see Holzer and
Neumark (2000, 2006), Long (2004), Arcidiacono (2005), Howell (2010), and Hinrichs (2012).
4
Court in June of 2013. The Supreme Court invalidated the decision by Fifth Circuit Court of
Appeals regarding the Fisher case. The Court determined that “the Fifth Circuit did not hold the
University to the demanding burden of strict scrutiny articulated” in the Grutter and Bakke cases
(Fisher, 2013a, p. 1). In remanding the case, they ruled that “the Fifth Circuit must assess
whether the University has offered sufficient evidence to prove that its admissions program is
narrowly tailored to obtain the educational benefits of diversity” (Fisher, 2013a, p. 3).
“University must prove [to the reviewing court] that the means it chose to attain that diversity are
narrowly tailored to its goal. On this point, the University receives no deference….The reviewing
court must ultimately be satisfied that no workable race-neutral alternatives would produce
the educational benefits of diversity” (Fisher, 2013b, p. 10) [emphasis added].
The Fisher decision, which surprised many who expected a more conservative set of
justices to overturn the Grutter decision and strike down affirmative action in admissions, has
yielded a greater degree of legal stability. However, the term “workable” remains vague.
Workable seems to mean that the race-neutral alternative would not have too great of an adverse
effect on other university objectives (such as in maintaining the “quality” of its admitted
students). If challenged, a university would need to convince a court that race-neutral
alternatives are not workable because the costs of such policies would be too great. The
Supreme Court’s decisions are likewise vague regarding what “race-neutral” means. The
Grutter decision obliquely makes the following reference:
“Universities in California, Florida, and Washington State, where racial preferences in
admissions are prohibited by state law, are currently engaged in experimenting with a
wide variety of alternative approaches. Universities in other States can and should draw
on the most promising aspects of these race-neutral alternatives as they develop” (p. 31).
5
A more cogent discussion of legal “race-neutral” alternatives can be found in Coleman, Palmer,
and Winnick (2008), who conclude that “facially race-neutral policies are subject to strict
scrutiny (and qualify as legally ‘race-conscious’) only if they are motivated by a racially
discriminatory purpose and result in a racially discriminatory effect” (p. 5). They caution
universities that their policies may be deemed “race-conscious” if the policy “would not have
been promulgated but for the motivation for achieving segregation or racial impact”, “race is the
predominant motivating factor behind the policy”, or “there is a deliberate use of race-neutral
criteria as a proxy for race” (p. 5). It would therefore seem that any policy that attempted to give
weight in admissions decisions to any other factors aside from race (e.g., socioeconomic status)
with the goal of boosting minority admissions would be deemed to be not “race-neutral” and
would instead be deemed “race-conscious” and face the strict scrutiny test. Thus, there is an
inherent tension in the terms “race-neutral” and “alternative” – if one seeks an “alternative”
policy to race-based affirmative action that serves the same goal, then such a policy cannot be
deemed “race-neutral.” As an example, after the Hopwood decision, the Texas Legislature
passed H.B. 588, which gave state institutions a list of 18 socioeconomic indicators that they
could use in making first-time freshman admissions decisions. To the extent that the use of such
indicators was intended to serve the purpose of replacing race-based affirmative action, such use
would not be “race-neutral.” This tension was recognized in Justice Ginsburg’s dissent in the
Fisher case:
“I have said before and reiterate here that only an ostrich could regard the supposedly
neutral alternatives as race unconscious… As Justice Souter observed, the vaunted
alternatives suffer from ‘the disadvantage of deliberate obfuscation’” (Fisher, 2013c, p.
2).
6
I.B. Research Questions
This paper evaluates the effects of replacing “traditional affirmative action” (which
places direct weight on the applicant’s race/ethnicity in the university’s admissions decision)
with “proxy-based affirmative action” (which places weight on the applicant’s predicted
likelihood of being an underrepresented minority). Nakedly and deliberately engaging in such
“proxy-based affirmative action” would not qualify as a “race-neutral alternative.” Yet, such a
direct alternate policy yields the upper-bound impact for other less transparent alternative
policies, such as giving added weight to socioeconomic status or utilizing de facto high school
segregation to help boost minority admissions by admitting all students who graduate in the top-
X% of their high school classes.2
Using administrative admissions data from the University of Texas at Austin, I answer
the following research questions. First, if UT used all of the information that they had obtained
on an applicant (aside from the student’s race) to predict the student’s race and then used proxy-
based affirmative action rather than traditional affirmative action, what effects would that policy
change yield in terms of the academic qualities of the admitted student body? Second what share
of minority and non-minority students would be “displaced” (i.e., admitted under one regime but
not the other) when using the proxy-based system rather than race-based affirmative action?
2 Another race-neutral alternative would be for universities to attempt to boost minority
application rates by, for example, doing more recruiting visits to high schools with large minority
enrollments. The theoretical potential for such an application-based strategy to be efficacious is
established in Brown and Hirschman (2006). Yet, there is scant empirical evidence to document
the effectiveness of such recruiting strategies, and there are inferences that such alternative
strategies have been ineffective (Long, 2007).
7
This paper builds off the theoretical work of Chan and Eyster (2003) who predicted that
universities would respond to affirmative action bans by shifting the weights placed on applicant
characteristics in ways to favor minority applicants, and the empirical work of Long and Tienda
(2008), who used the same administrative data and found “some evidence that universities
changed the weights they placed on applicant characteristics in ways that aided underrepresented
minority applicants…these changes were insufficient to restore Black and Hispanic applicants’
share of admitted students” (p. 255). That is, while UT and Texas A&M University did respond
to the Hopwood decision by implicitly using correlated indicators for race, their efforts were not
sufficient to restore the racial composition of the admitted students. Long and Tienda focused on
actual changes enacted by UT, Texas A&M, and Texas Tech University in the years following
the Hopwood decision. In contrast, this paper estimates hypothetical changes that UT could have
taken so as to evaluate the implications of fully restoring minority representation using correlated
indicators of the student’s race/ethnicity.
As shown below, I find that UT had limited ability to predict a student’s race-ethnicity
just based on the information it collected on applicants during these years. Consequently, if they
sought to restore the representation of these minority groups, they would need to place more
weight on the applicant’s predicted likelihood of being an underrepresented minority than they
previously placed directly on the applicant’s minority status. Doing so, however, comes at the
cost of yielding an admitted class that has a lower predicted grade point average and likelihood
of graduating than the class that would have been admitted using traditional affirmative action.
This result suggests that race-neutral alternatives may not be “workable” from the university’s
perspective.
8
II. METHODS
I begin by estimating the parameters of UT’s “Traditional Race-Based Affirmative
Action” admissions system. I estimate the following probit regression using data on UT’s
applicants in 1996, which was the last year in which UT could use race-based affirmative action
prior to enforcement of the Hopwood ruling:
(1) Prob(Admittedi = 1) = Φ(β0 + β1URMi + Xi'β2 + εi)
URMi equals one if the student is an “underrepresented minority”, which is inclusive of Black,
Hispanic, and American Indian/Alaskan Native students3, and X is a vector of other
characteristics that the university considers in their admissions decision.
In the remainder of the analysis, I utilize data on UT’s applicants in 1998, 1999, and
2000. Using these data, I evaluate the efficacy of alternative policies in the years immediately
following the Hopwood decision.
As salient measures of the educational quality and desirability of each applicant, I
estimate the cumulative grade point average (GPA) and likelihood of graduating within 6 years4
3 Affirmative action practices at colleges and universities in the United States have historically
not given preference to Asian American students (Bowen & Bok, 1998). Long (2004) and Long
and Tienda (2008) found no significant advantage or disadvantage given to Asian applicants
relative to White applicants using, respectively, national college admissions data from 1992 and
institutional admissions data from the UT in pre-Hopwood years. As the data I use only record
race as “Asian,” I cannot determine any greater level of racial or ethnic specificity beyond this
category.
9
using data on students who enrolled at UT in 1998, as shown in Equation 2a and 2b (which uses j
subscripts to denote enrollees)5:
(2a) GPAj = γ0 + γ1URMj + Zj'γ2 + εj
(2b) Prob(Graduatej=1) = Φ(δ0 + δ1URMj + Zj'δ2 + εj)
Z includes characteristics that are observable to the university for its applicants.6 Equation 2a is
estimated using a tobit specification with lower and upper bounds of 0.0 and 4.0, respectively. I
assume that these parameters, which are estimated based on enrollees, would roughly hold for all
applicants, and apply the resulting coefficients to estimate the applicant’s “Quality” from the
perspective of the university:
(3a) Quality1i = Predicted GPAi = 4×Φ(-(4-Ai)/) + [Φ((4-Ai)/) - Φ((0-Ai)/)] ×
{Ai + ×[ϕ((0-Ai)/) - ϕ((4-Ai)/ )] / [Φ((4-Ai)/ ) - Φ((0-Ai)/)]},
where Ai = ̂0 + ̂1URMi + Zi' ̂2/
(3b) Quality2i = Predicted Likelihood of Graduationi = Φ( ̂0 + ̂1URMi + Zi' ̂2)
4 There are strong reasons why universities care about these measures as indicators of student
quality (e.g., see Geiser and Santelices (2007), and Bowen, Chingos, and McPherson (2011)).
There is political pressure being exerted on colleges to raise graduation rates; President Obama
launched the College Scorecard in 2013, which rates colleges on a variety of dimensions
including their 6-year graduation rates.
5 This analysis is restricted to 1998 enrollees because 6 years of transcript data are not available
for 1999 and 2000 enrollees.
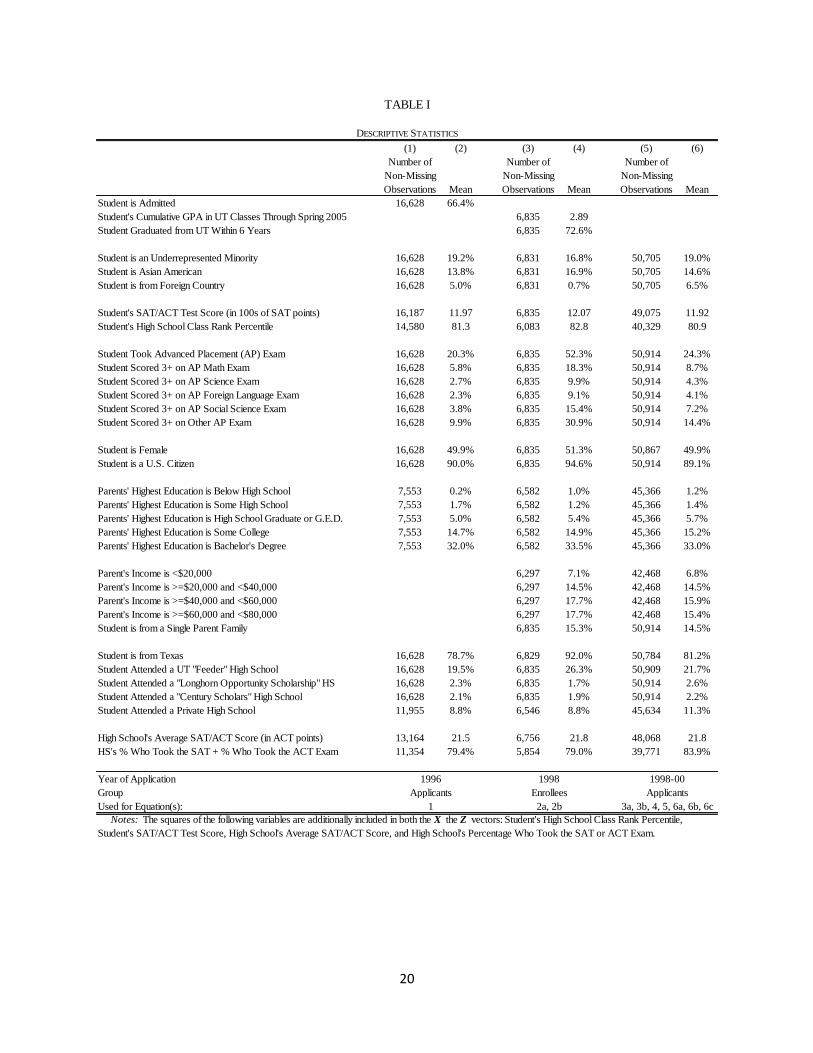
6 As shown later in Table I, Z is a vector of applicant characteristics that is inclusive of X.
10
Next, using data from 1998-2000 applicants, I estimate the probability that the applicant
is an underrepresented minority based on observable applicant characteristics using the probit
regression shown in Equation 4:
(4) Prob(URMi=1) = Φ(η0 + Zi'η1 + εi)
I then compute the probability that applicant i is an underrepresented minority, which is
subsequently used as the proxy indicator for the student’s race:
(5) Proxyi = Φ( ̂0 + Zi' ̂1)
Finally, I simulate the racial composition and Quality of admitted students under three
admissions systems as follows7:
(6a) “Traditional Race-Based Affirmative Action”:
AdmissionsIndexi = Φ( ̂0 + ̂1URMi + Xi' ̂2 + vi)
(6b) “Passive Affirmative Action Ban”:
AdmissionsIndexi = Φ( ̂0 + 0×URMi + Xi' ̂2 + vi)
(6c) “Proxy-Based Affirmative Action”:
AdmissionsIndexi = Φ( ̂0 + θ×Proxyi + Xi' ̂2 + vi)
The beta parameters in Equations 6a-6c are derived from the estimation of Equation 1. Equation
6a is used to simulate the class that UT would have admitted had they maintained their pre-
Hopwood admission system. The second admission system, which I label “Passive Affirmative
Action Ban”, holds the weights on X characteristics constant at ̂2, yet sets the weight on URM
( ̂1) to zero. The idea here is that the university accommodates the affirmative action ban, but
7 vi is a random variable which (consistent with a probit model) is distributed N(0,1). Since a
random variable is included in the computation of the student’s AdmissionIndex, I repeat the
simulation ten times and report the mean of the ten simulations.
11
makes no other changes to its admissions formula in order to boost minority enrollment. The
third admission system, which I label “Proxy-Based Affirmative Action”, gives positive weight
to the likelihood that the student is an underrepresented minority in the university’s admissions
decisions. By slowly increasing the value of θ in Equation 6c, I demonstrate how (a) using a
proxy can increase minority representation among the admitted class, and (b) how doing so has
distortionary effects on the set of admitted students and potentially has impacts on the academic
quality of the admitted set. For these simulations, I assume that UT would sort applicants based
on their AdmissionsIndex scores and admit the top-N applicants, where N is actual number of
students who were admitted during these three years.8
III. DATA
Administrative data for the analysis was compiled by the Texas Higher Education
Opportunity Project at Princeton University (http://opr.princeton.edu/archive/theop). Table I
contains the descriptive statistics. The online appendix contains additional information on the
variables and their construction. Since some variables are missing in the applicant files (most
notably for parent’s education in 1996), I use multiple imputation by chained equations, creating
five imputed datasets, and combine the results using Rubin’s (1987) method.
[Insert Table I here]
8 Note that I am assuming that the university would not adjust N or the parameters in Equation 6
to address variation across students in their likelihood of enrolling conditional on being admitted.
12
IV. RESULTS
IV.A. Regression Results
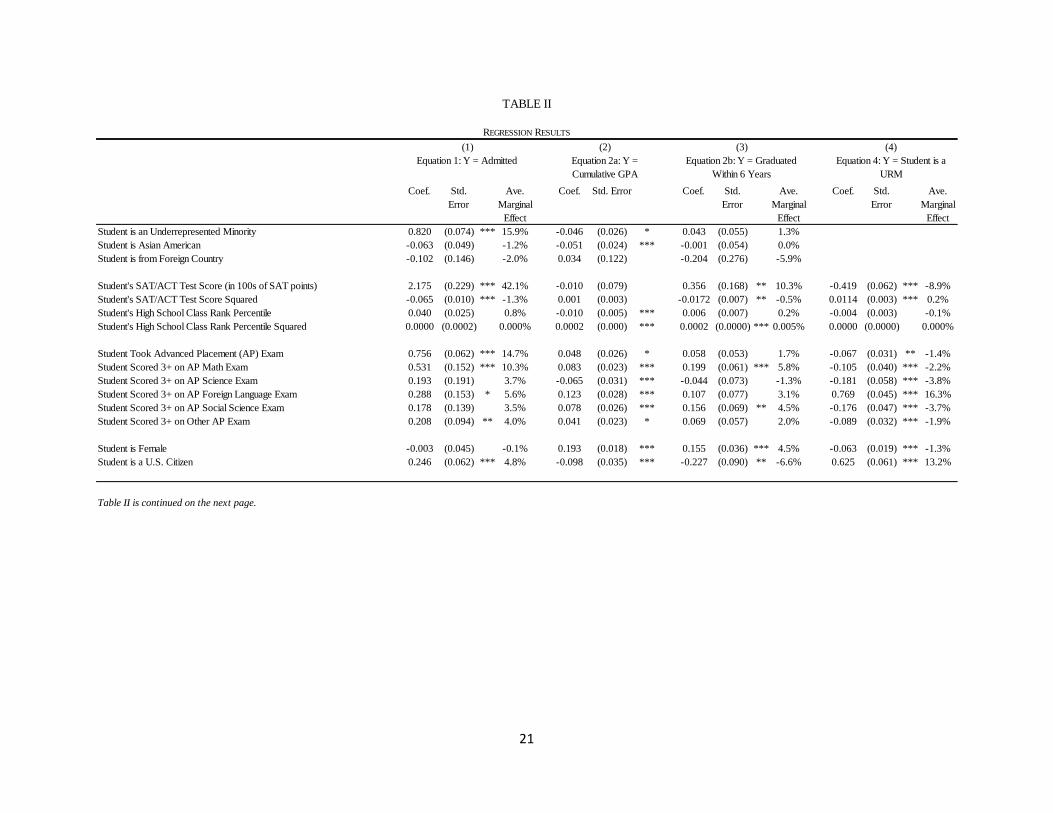
Column 1 of Table II contains the parameter estimates reflecting UT’s pre-Hopwood
admission system (i.e., Equation 1). Consistent with prior research, underrepresented minorities
are substantially more likely to be admitted than observably similar non-URMs. The average
marginal effect of being a URM on the likelihood of admittance is 15.9 percentage points. The
university also gave positive (but declining) weight to students with higher SAT/ACT test scores,
and was more likely to admit students who took and scored 3 or higher on Advanced Placement
(AP) exams and who are from Texas and are U.S. citizens. Notably, there is no evidence that UT
attempted to use socioeconomic characteristics in their pre-Hopwood admissions decisions as
there was no significant weight placed on parent’s highest education level or the characteristics
of the high schools the student attended.
[Insert Table II here]
Columns 2 and 3 of Table II contains the parameter estimates for Equations 2a and 2b,
which show the relationship of student characteristics to future academic success.
Underrepresented minority and Asian American enrollees had lower cumulative GPAs than their
white counterparts, but there were no significant racial differences in 6-year graduation rates.
Test scores and high school class rank were both positively associated with likelihood of
graduation (in their relevant ranges), and class rank (but not test scores) was positively
associated with cumulative GPA. Taking and “passing” AP exams were positively associated
with both collegiate success measures. Female students, non-U.S. citizens, those who graduated
from a UT “feeder” high school, had a parent with a graduate degree, and whose parents’ income
was over $80,000 earned higher college GPAs and were more likely to graduate. Finally,
13
students from Texas earned lower GPAs, but were more likely to gradate from UT. When these
coefficients are applied to all applicants in the years 1998-2000 using Equations 3a and 3b, the
predicted cumulative GPA has a mean (s.d.) of 2.80 (0.44), while the predicted likelihood of
graduation has a mean (s.d.) of 68.5% (17.7%).
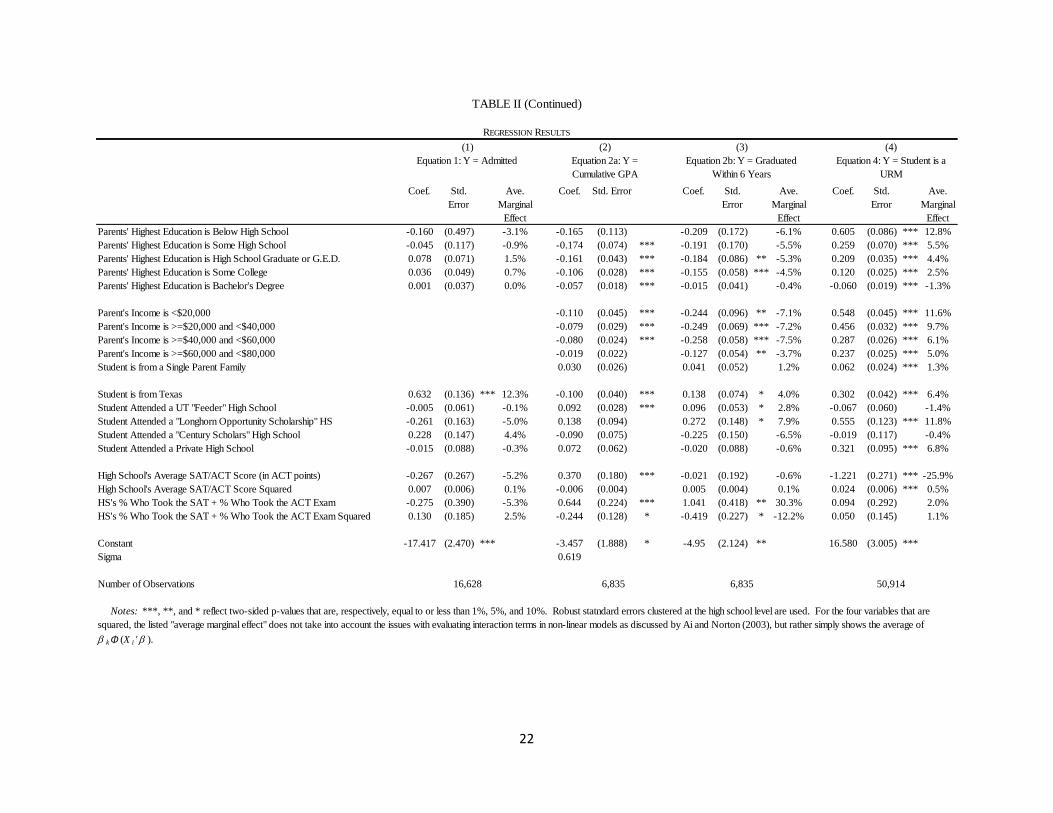
Column 4 of Table II contains the parameter estimates for Equation 4, which predicts the
applicant’s likelihood of being an underrepresented minority. URM applicants have lower
SAT/ACT scores, are less likely to have taken and passed an AP exam (except in AP foreign
languages), are less likely to be female, more likely to be a U.S. citizen, and have parents with
lower education and lower income. All of these factors are positively associated with future
academic success (as shown in columns 2 and 3). Thus, as the university places more weight on
any of these factors in an effort to boost minority admissions, they will obtain an admitted class
with lower “quality”.
IV.B. Simulation Results
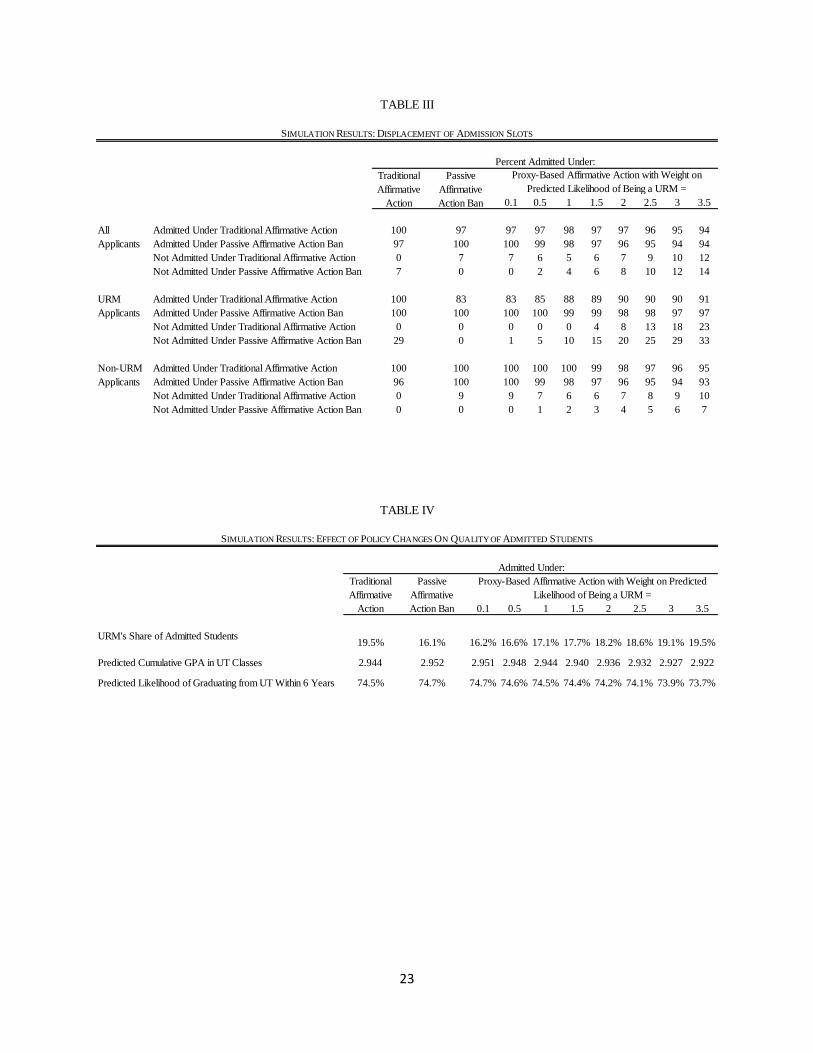
Table III shows the extent to which alternative admissions policies displace students from
the available slots. Starting with the middle panel, among the URM students who are admitted
using the traditional race-based affirmative action admissions policy, only 83% are admitted
under the passive affirmative action ban system (i.e., 17% are “displaced” by the ban). Moving
to a proxy-based system would only somewhat offset this displacement. Even when the weight
placed on the Proxyi in Equation 6c (i.e. θ) is 3.5 (which is more than 4 times as large as the
estimated coefficient on URMi in Equation 6a), there are still 9% of those who would be
admitted under traditional affirmative action admissions policy who are not admitted. Moreover,
among URMs who are not admitted under the traditional affirmative action admissions policy,
23% would be admitted under the proxy-based system when θ = 3.5. Thus, the proxy system
14
leads to admission of lower-“quality” URMs. Finally, as seen in the last two rows of Table III,
the proxy-based affirmative action policy brings in non-URMs who would not be admitted under
either the traditional affirmative action or passive ban systems. These rows reveal an
inefficiency in the proxy-based system as these newly admitted non-URMs are only admitted in
order to improve URMs’ share of admitted students.
[Insert Table III here]
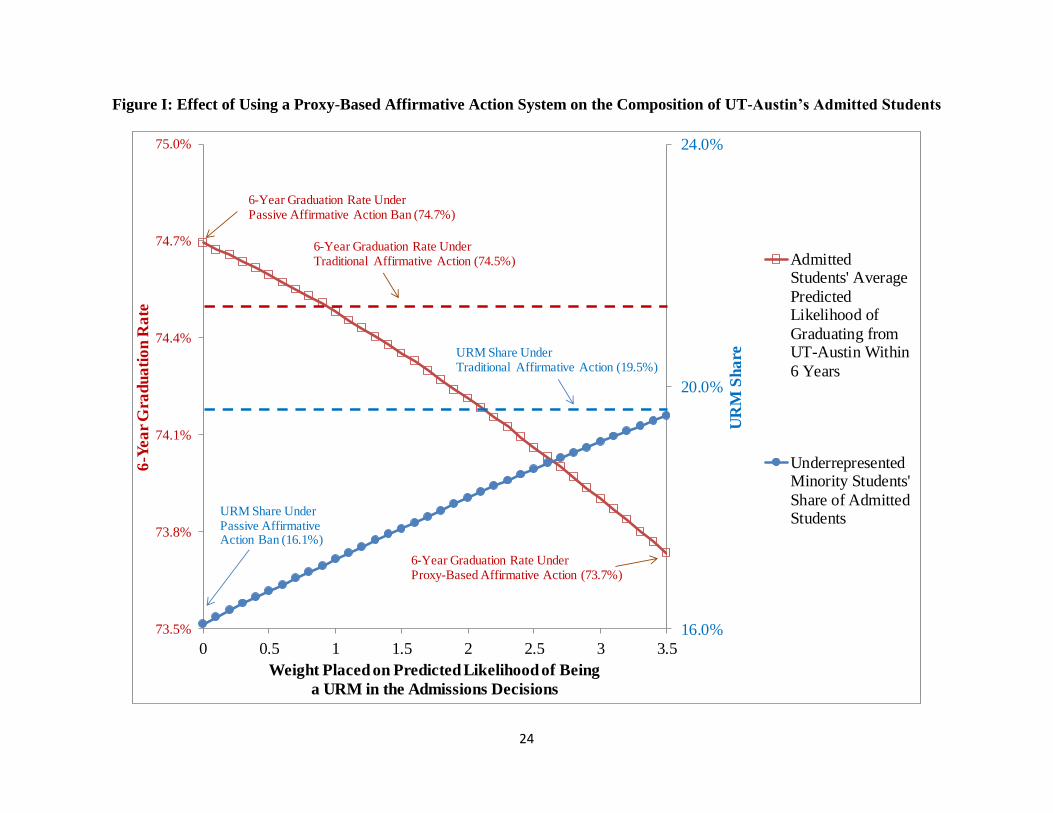
Table IV shows the effect of the alternate admission systems on the composition and
quality of the admitted students. Moving from traditional affirmative action to a passive
affirmative action ban system lowers URMs’ share of admitted students from 19.5% to 16.1%.
If the university wanted to restore this URM share using the proxy system, they would need to
set θ = 3.5. As the next two rows show, doing so comes as the cost of lowering student quality.
First note that implementing the banning affirmative action only mildly raises quality, increasing
average predicted GPAs from 2.944 to 2.952 and predicted likelihood of graduating from UT
within 6 years from 74.5% to 74.7%. Subsequently implementing a proxy-based affirmative
action system completely undoes this improvement. If such a proxy-based system were
implemented such as to fully restore URMs’ share, it would lower average predicted GPAs down
to 2.922 and predicted likelihood of graduating from UT within 6 years down to 73.7%. Figure I
graphically shows the effects of the proxy system on graduation rates. To put these changes in
perspective, moving from the passive affirmative action ban system to the fully-implemented
proxy-based system would lower the average admitted student from the 61st to 59
th percentile of
the distribution of applicants based on predicted cumulative GPA, and from 57th
to 55th
percentile based on predicted likelihood of graduating from UT within 6 years. Or, for every
15
10,000 enrollees, UT should expect nearly 100 fewer graduates. And, among all 4-year
institutions nationally, UT’s 6-year graduation rate would fall from the 88th
to 87th
percentile.9
[Insert Table IV here]
[Insert Figure I here]
V. CONCLUSION
The Grutter and Fisher decisions have created a clear mandate that universities must first
show that “workable race-neutral” alternatives are insufficient to produce the benefits of having
a diverse class of enrollees before these universities are permitted to use race-based affirmative
action. All alternative admission systems that attempt to boost minority enrollment by giving
weight to other non-race applicant characteristics that are correlated with race (e.g., systems that
give advantage to lower socioeconomic status applicants for this purpose) are in essence attempts
to create “proxies” for minority status. In this paper, I investigate what would happen if a
university directly gave weight to the applicant’s predicted likelihood of being an
underrepresented minority applicant (rather than placing arbitrary weights on correlated
indicators). I show that while such a system can be used to restore minority’s share of admitted
students, doing so can result in a class that has modestly lower predicted likelihood of collegiate
academic success. Furthermore, utilizing such a proxy-based admission system is inefficient; in
the simulation, I find that it required the university to place over four times as much weight on
predicted minority status as the weight it previously placed directly on actual minority status,
resulting in non-minority applicants being admitted who would not have been otherwise
admitted.
9 Calculated using 2012 data from the Integrated Postsecondary Education Data System.
16
If a university attempted to utilize a proxy-based admission system, they would encounter
a variety of dilemmas. First, to reduce the inefficiencies discussed above, they may be tempted
to seek out additional information that is correlated with minority status. In a report I was
commissioned to produce for the Educational Testing Service (Long, Forthcoming), I show how
the collection of additional information could improve the prediction of minority status. For
example, using 195 characteristics of 10th
graders in the Education Longitudinal Study of 2002, I
was able to correctly predict underrepresented minority status for 82% of the students. The top-3
most predictive characteristics were the minority status of the student’s 1st, 2
nd, and 3
rd best
friends – such information would be difficult for a university to reliably obtain. I note that
“(w)hile the universities may want to go down this path, they may be thwarted by the monetary
cost of purchasing such information, the political challenge that would be likely to follow from
such privacy invasion, and the distaste it would engender in applicants” (p. 8). Furthermore, a
naked and direct use of racial proxies is sure to invite legal challenge as such a policy would not
be deemed “race neutral” as discussed in the introduction. On the other hand, the use of less
direct proxy systems (such as arbitrary weighting of correlated indicators) is likely to produce
even more inefficiency, distorting the set of admitted students, and further lowering academic
quality. The second challenge universities would face is the extent to which they attempted to
restore minority students’ share of admitted students via the proxy-based system. If they sought
to exactly offset the decline in minority students’ share of admitted students brought about by the
elimination of traditional race-based affirmative action (as was done in the simulation in this
paper), they could be deemed guilty of having a quota for minority students, which would violate
the Bakke decision. A lower-court ruling which went against the University of Michigan Law
School in the Grutter case cited the university’s target of 10-12% minority students as
17
unconstitutional; “by using race to ensure the enrollment of a certain minimum percentage of
underrepresented minority students, the law school has made the current admissions policy
practically indistinguishable from a quota system” (Grutter v. Bollinger, 137 F. Supp. 2d 851
(E.D. Mich. 2001)).
Setting aside these challenges, whether such alternative admissions systems are
“workable” is in the eye of the beholder. I find that a proxy-based system (using the information
currently available to universities) would modestly lower the predicted collegiate success of
admitted students. In the simulation in this paper, the admitted students’ predicted GPAs are
found to fall from 2.95 to 2.92, and predicted likelihood of graduating from 74.7% to 73.7%.
Whether this is a large enough cost to the university to be deemed not “workable” is unclear, and
would likely vary from university-to-university and court-to-court.
18
REFERENCES
Ai, C. R., & Norton, E.C. (2003). Interaction terms in logit and probit models. Economics
Letters, 80(1), 123–129.
Alger, J. (2003). "Summary of Supreme Court Decisions in Admissions Cases." University of
Michigan Assistant General Counsel,
http://www.umich.edu/~urel/admissions/overview/cases-summary.html, accessed
December 9, 2013.
Arcidiacono, P. (2005). Affirmative action in higher education: How do admission and financial
aid rules affect future earnings? Econometrica, 73, 1477–1524.
Bowen, W., & Bok, D. (1998). The shape of the river: Long-term consequences of considering
race in college and university admissions. Princeton, NJ: Princeton University Press.
Bowen, W., Chingos, M. M., & McPherson, M. S. (2011). Crossing the finish line: Completing
college at America's public universities. Princeton, NJ: Princeton University Press.
Brown, S. K., & Hirschman, C. (2006). The end of affirmative action in Washington State and its
impact on the transition from high school to college. Sociology of Education, 79, 106-
130.
Chan, J., & Eyster, E. (2003). Does banning affirmative action lower college student quality?
The American Economic Review, 93, 858–872.
Coleman, A. L., Palmer, S. R., & Winnick, S.Y.. (2008). “Race-Neutral Policies in Higher
Education: From Theory to Action.” The College Board, June, accessed on September
12, 2013 at http://advocacy.collegeboard.org/sites/default/files/Race-
Neutral_Policies_in_Higher_Education.pdf
Faulkner, L. R. (2005). Address on the state of the University. September 14,
http://theop.princeton.edu/publicity/general/UTFaulkerSpeech.pdf, accessed December
10, 2013.
Fisher v. University of Texas, 570 U.S. [Syllabus] (2013a).
Fisher v. University of Texas, 570 U.S. [Opinion of the Court] (2013b).
Fisher v. University of Texas, 570 U.S. [GINSBURG, J., dissenting] (2013c).
Geiser, S., & Santelices, M. V. (2007). Validity of high-school grades in predicting student
success beyond the freshman year: High-school record vs. standardized tests as indicators
of four-year college outcomes. UC Berkeley: Center for Studies in Higher Education.
Retrieved on December 20, 2013 from: http://escholarship.org/uc/item/7306z0zf
Gratz v. Bollinger, 539 U.S. 244 (2003).
19
Grutter v. Bollinger, 539 U.S. 306 (2003).
Hinrichs, P. (2012). The effects of affirmative action bans on college enrollment, educational
attainment, and the demographic composition of universities. Review of Economics and
Statistics, 94, 712–722.
Holzer, H., & Neumark, D. (2000). Assessing affirmative action. Journal of Economic
Literature, 38(3), 483-568.
_____ (2006). Affirmative action: What do we know? Journal of Policy Analysis and
Management, 25, 463–490.
Hopwood v. Texas, 78 F.3d 932 (5th Cir. 1996), cert. denied, 518 U.S. 1033 (1996).
Howell, J. S. (2010). Assessing the impact of eliminating affirmative action in higher education.
Journal of Labor Economics, 28, 113–166.
Krueger, A., Rothstein, J., & Turner, S. (2006). Race, income, and college in 25 years:
Evaluating Justice O'Connor's conjecture. American Law and Economics Review, 8(2),
282-311.
Long, M. C. (2004). Race and college admission: An alternative to affirmative action? Review of
Economics and Statistics, 86, 1020–1033.
_____ (2007). Affirmative action and its alternatives in public universities: What do we know?
Public Administration Review, 67(1), 311-325.
_____ (Forthcoming). The promise and peril for universities using correlates of race in
admissions in response to the Grutter and Fisher decisions. Educational Testing Service.
Long, M. C., & Tienda, M. (2008). Winners and losers: Changes in Texas university admissions
post-Hopwood. Educational Evaluation and Policy Analysis, 30, 255–280.
Regents of the University of California v. Bakke, 438 U.S. 265 (1978).
Rubin, D.B. (1987). Multiple Imputation for Nonresponse in Surveys. J. Wiley & Sons, New
York.
20
(1) (2) (3) (4) (5) (6)
Number of
Non-Missing
Observations Mean
Number of
Non-Missing
Observations Mean
Number of
Non-Missing
Observations Mean
Student is Admitted 16,628 66.4%
Student's Cumulative GPA in UT Classes Through Spring 2005 6,835 2.89
Student Graduated from UT Within 6 Years 6,835 72.6%
Student is an Underrepresented Minority 16,628 19.2% 6,831 16.8% 50,705 19.0%
Student is Asian American 16,628 13.8% 6,831 16.9% 50,705 14.6%
Student is from Foreign Country 16,628 5.0% 6,831 0.7% 50,705 6.5%
Student's SAT/ACT Test Score (in 100s of SAT points) 16,187 11.97 6,835 12.07 49,075 11.92
Student's High School Class Rank Percentile 14,580 81.3 6,083 82.8 40,329 80.9
Student Took Advanced Placement (AP) Exam 16,628 20.3% 6,835 52.3% 50,914 24.3%
Student Scored 3+ on AP Math Exam 16,628 5.8% 6,835 18.3% 50,914 8.7%
Student Scored 3+ on AP Science Exam 16,628 2.7% 6,835 9.9% 50,914 4.3%
Student Scored 3+ on AP Foreign Language Exam 16,628 2.3% 6,835 9.1% 50,914 4.1%
Student Scored 3+ on AP Social Science Exam 16,628 3.8% 6,835 15.4% 50,914 7.2%
Student Scored 3+ on Other AP Exam 16,628 9.9% 6,835 30.9% 50,914 14.4%
Student is Female 16,628 49.9% 6,835 51.3% 50,867 49.9%
Student is a U.S. Citizen 16,628 90.0% 6,835 94.6% 50,914 89.1%
Parents' Highest Education is Below High School 7,553 0.2% 6,582 1.0% 45,366 1.2%
Parents' Highest Education is Some High School 7,553 1.7% 6,582 1.2% 45,366 1.4%
Parents' Highest Education is High School Graduate or G.E.D. 7,553 5.0% 6,582 5.4% 45,366 5.7%
Parents' Highest Education is Some College 7,553 14.7% 6,582 14.9% 45,366 15.2%
Parents' Highest Education is Bachelor's Degree 7,553 32.0% 6,582 33.5% 45,366 33.0%
Parent's Income is <$20,000 6,297 7.1% 42,468 6.8%
Parent's Income is >=$20,000 and <$40,000 6,297 14.5% 42,468 14.5%
Parent's Income is >=$40,000 and <$60,000 6,297 17.7% 42,468 15.9%
Parent's Income is >=$60,000 and <$80,000 6,297 17.7% 42,468 15.4%
Student is from a Single Parent Family 6,835 15.3% 50,914 14.5%
Student is from Texas 16,628 78.7% 6,829 92.0% 50,784 81.2%
Student Attended a UT "Feeder" High School 16,628 19.5% 6,835 26.3% 50,909 21.7%
Student Attended a "Longhorn Opportunity Scholarship" HS 16,628 2.3% 6,835 1.7% 50,914 2.6%
Student Attended a "Century Scholars" High School 16,628 2.1% 6,835 1.9% 50,914 2.2%
Student Attended a Private High School 11,955 8.8% 6,546 8.8% 45,634 11.3%
High School's Average SAT/ACT Score (in ACT points) 13,164 21.5 6,756 21.8 48,068 21.8
HS's % Who Took the SAT + % Who Took the ACT Exam 11,354 79.4% 5,854 79.0% 39,771 83.9%
Year of Application
Group
Used for Equation(s):
TABLE I
DESCRIPTIVE STATISTICS
Notes: The squares of the following variables are additionally included in both the X the Z vectors: Student's High School Class Rank Percentile,
Student's SAT/ACT Test Score, High School's Average SAT/ACT Score, and High School's Percentage Who Took the SAT or ACT Exam.
1996
Applicants
1
1998
Enrollees
2a, 2b
1998-00
Applicants
3a, 3b, 4, 5, 6a, 6b, 6c
21
Coef. Std.
Error
Ave.
Marginal
Effect
Coef. Std. Error Coef. Std.
Error
Ave.
Marginal
Effect
Coef. Std.
Error
Ave.
Marginal
Effect
Student is an Underrepresented Minority 0.820 (0.074) *** 15.9% -0.046 (0.026) * 0.043 (0.055) 1.3%
Student is Asian American -0.063 (0.049) -1.2% -0.051 (0.024) *** -0.001 (0.054) 0.0%
Student is from Foreign Country -0.102 (0.146) -2.0% 0.034 (0.122) -0.204 (0.276) -5.9%
Student's SAT/ACT Test Score (in 100s of SAT points) 2.175 (0.229) *** 42.1% -0.010 (0.079) 0.356 (0.168) ** 10.3% -0.419 (0.062) *** -8.9%
Student's SAT/ACT Test Score Squared -0.065 (0.010) *** -1.3% 0.001 (0.003) -0.0172 (0.007) ** -0.5% 0.0114 (0.003) *** 0.2%
Student's High School Class Rank Percentile 0.040 (0.025) 0.8% -0.010 (0.005) *** 0.006 (0.007) 0.2% -0.004 (0.003) -0.1%
Student's High School Class Rank Percentile Squared 0.0000 (0.0002) 0.000% 0.0002 (0.000) *** 0.0002 (0.0000) *** 0.005% 0.0000 (0.0000) 0.000%
Student Took Advanced Placement (AP) Exam 0.756 (0.062) *** 14.7% 0.048 (0.026) * 0.058 (0.053) 1.7% -0.067 (0.031) ** -1.4%
Student Scored 3+ on AP Math Exam 0.531 (0.152) *** 10.3% 0.083 (0.023) *** 0.199 (0.061) *** 5.8% -0.105 (0.040) *** -2.2%
Student Scored 3+ on AP Science Exam 0.193 (0.191) 3.7% -0.065 (0.031) *** -0.044 (0.073) -1.3% -0.181 (0.058) *** -3.8%
Student Scored 3+ on AP Foreign Language Exam 0.288 (0.153) * 5.6% 0.123 (0.028) *** 0.107 (0.077) 3.1% 0.769 (0.045) *** 16.3%
Student Scored 3+ on AP Social Science Exam 0.178 (0.139) 3.5% 0.078 (0.026) *** 0.156 (0.069) ** 4.5% -0.176 (0.047) *** -3.7%
Student Scored 3+ on Other AP Exam 0.208 (0.094) ** 4.0% 0.041 (0.023) * 0.069 (0.057) 2.0% -0.089 (0.032) *** -1.9%
Student is Female -0.003 (0.045) -0.1% 0.193 (0.018) *** 0.155 (0.036) *** 4.5% -0.063 (0.019) *** -1.3%
Student is a U.S. Citizen 0.246 (0.062) *** 4.8% -0.098 (0.035) *** -0.227 (0.090) ** -6.6% 0.625 (0.061) *** 13.2%
Table II is continued on the next page.
Equation 4: Y = Student is a
URM
REGRESSION RESULTS
TABLE II
Equation 2a: Y =
Cumulative GPA
(2)
Equation 1: Y = Admitted
(1) (3)
Equation 2b: Y = Graduated
Within 6 Years
(4)
22
Coef. Std.
Error
Ave.
Marginal
Effect
Coef. Std. Error Coef. Std.
Error
Ave.
Marginal
Effect
Coef. Std.
Error
Ave.
Marginal
Effect
Parents' Highest Education is Below High School -0.160 (0.497) -3.1% -0.165 (0.113) -0.209 (0.172) -6.1% 0.605 (0.086) *** 12.8%
Parents' Highest Education is Some High School -0.045 (0.117) -0.9% -0.174 (0.074) *** -0.191 (0.170) -5.5% 0.259 (0.070) *** 5.5%
Parents' Highest Education is High School Graduate or G.E.D. 0.078 (0.071) 1.5% -0.161 (0.043) *** -0.184 (0.086) ** -5.3% 0.209 (0.035) *** 4.4%
Parents' Highest Education is Some College 0.036 (0.049) 0.7% -0.106 (0.028) *** -0.155 (0.058) *** -4.5% 0.120 (0.025) *** 2.5%
Parents' Highest Education is Bachelor's Degree 0.001 (0.037) 0.0% -0.057 (0.018) *** -0.015 (0.041) -0.4% -0.060 (0.019) *** -1.3%
Parent's Income is <$20,000 -0.110 (0.045) *** -0.244 (0.096) ** -7.1% 0.548 (0.045) *** 11.6%
Parent's Income is >=$20,000 and <$40,000 -0.079 (0.029) *** -0.249 (0.069) *** -7.2% 0.456 (0.032) *** 9.7%
Parent's Income is >=$40,000 and <$60,000 -0.080 (0.024) *** -0.258 (0.058) *** -7.5% 0.287 (0.026) *** 6.1%
Parent's Income is >=$60,000 and <$80,000 -0.019 (0.022) -0.127 (0.054) ** -3.7% 0.237 (0.025) *** 5.0%
Student is from a Single Parent Family 0.030 (0.026) 0.041 (0.052) 1.2% 0.062 (0.024) *** 1.3%
Student is from Texas 0.632 (0.136) *** 12.3% -0.100 (0.040) *** 0.138 (0.074) * 4.0% 0.302 (0.042) *** 6.4%
Student Attended a UT "Feeder" High School -0.005 (0.061) -0.1% 0.092 (0.028) *** 0.096 (0.053) * 2.8% -0.067 (0.060) -1.4%
Student Attended a "Longhorn Opportunity Scholarship" HS -0.261 (0.163) -5.0% 0.138 (0.094) 0.272 (0.148) * 7.9% 0.555 (0.123) *** 11.8%
Student Attended a "Century Scholars" High School 0.228 (0.147) 4.4% -0.090 (0.075) -0.225 (0.150) -6.5% -0.019 (0.117) -0.4%
Student Attended a Private High School -0.015 (0.088) -0.3% 0.072 (0.062) -0.020 (0.088) -0.6% 0.321 (0.095) *** 6.8%
High School's Average SAT/ACT Score (in ACT points) -0.267 (0.267) -5.2% 0.370 (0.180) *** -0.021 (0.192) -0.6% -1.221 (0.271) *** -25.9%
High School's Average SAT/ACT Score Squared 0.007 (0.006) 0.1% -0.006 (0.004) 0.005 (0.004) 0.1% 0.024 (0.006) *** 0.5%
HS's % Who Took the SAT + % Who Took the ACT Exam -0.275 (0.390) -5.3% 0.644 (0.224) *** 1.041 (0.418) ** 30.3% 0.094 (0.292) 2.0%
HS's % Who Took the SAT + % Who Took the ACT Exam Squared 0.130 (0.185) 2.5% -0.244 (0.128) * -0.419 (0.227) * -12.2% 0.050 (0.145) 1.1%
Constant -17.417 (2.470) *** -3.457 (1.888) * -4.95 (2.124) ** 16.580 (3.005) ***
Sigma 0.619
Number of Observations
Equation 1: Y = Admitted Equation 2a: Y =
Cumulative GPA
Equation 2b: Y = Graduated
Within 6 Years
Equation 4: Y = Student is a
URM
(1) (2) (3) (4)
Notes: ***, **, and * reflect two-sided p-values that are, respectively, equal to or less than 1%, 5%, and 10%. Robust statndard errors clustered at the high school level are used. For the four variables that are
squared, the listed "average marginal effect" does not take into account the issues with evaluating interaction terms in non-linear models as discussed by Ai and Norton (2003), but rather simply shows the average of
b kΦ (X i 'b ).
16,628 6,835 6,835 50,914
TABLE II (Continued)
REGRESSION RESULTS
23
0.1 0.5 1 1.5 2 2.5 3 3.5
Admitted Under Traditional Affirmative Action 100 97 97 97 98 97 97 96 95 94
Admitted Under Passive Affirmative Action Ban 97 100 100 99 98 97 96 95 94 94
Not Admitted Under Traditional Affirmative Action 0 7 7 6 5 6 7 9 10 12
Not Admitted Under Passive Affirmative Action Ban 7 0 0 2 4 6 8 10 12 14
Admitted Under Traditional Affirmative Action 100 83 83 85 88 89 90 90 90 91
Admitted Under Passive Affirmative Action Ban 100 100 100 100 99 99 98 98 97 97
Not Admitted Under Traditional Affirmative Action 0 0 0 0 0 4 8 13 18 23
Not Admitted Under Passive Affirmative Action Ban 29 0 1 5 10 15 20 25 29 33
Admitted Under Traditional Affirmative Action 100 100 100 100 100 99 98 97 96 95
Admitted Under Passive Affirmative Action Ban 96 100 100 99 98 97 96 95 94 93
Not Admitted Under Traditional Affirmative Action 0 9 9 7 6 6 7 8 9 10
Not Admitted Under Passive Affirmative Action Ban 0 0 0 1 2 3 4 5 6 7
Non-URM
Applicants
TABLE III
SIMULATION RESULTS: DISPLACEMENT OF ADMISSION SLOTS
Percent Admitted Under:
Proxy-Based Affirmative Action with Weight on
Predicted Likelihood of Being a URM =
Traditional
Affirmative
Action
Passive
Affirmative
Action Ban
All
Applicants
URM
Applicants
0.1 0.5 1 1.5 2 2.5 3 3.5
URM's Share of Admitted Students19.5% 16.1% 16.2% 16.6% 17.1% 17.7% 18.2% 18.6% 19.1% 19.5%
Predicted Cumulative GPA in UT Classes 2.944 2.952 2.951 2.948 2.944 2.940 2.936 2.932 2.927 2.922
Predicted Likelihood of Graduating from UT Within 6 Years 74.5% 74.7% 74.7% 74.6% 74.5% 74.4% 74.2% 74.1% 73.9% 73.7%
Admitted Under:
TABLE IV
SIMULATION RESULTS: EFFECT OF POLICY CHANGES ON QUALITY OF ADMITTED STUDENTS
Traditional
Affirmative
Action
Passive
Affirmative
Action Ban
Proxy-Based Affirmative Action with Weight on Predicted
Likelihood of Being a URM =
24
Figure I: Effect of Using a Proxy-Based Affirmative Action System on the Composition of UT-Austin’s Admitted Students
16.0%
20.0%
24.0%
73.5%
73.8%
74.1%
74.4%
74.7%
75.0%
0 0.5 1 1.5 2 2.5 3 3.5
UR
M S
ha
re
6-Y
ea
r G
rad
ua
tio
n R
ate
Weight Placed on Predicted Likelihood of Being
a URM in the Admissions Decisions
AdmittedStudents' Average
PredictedLikelihood of
Graduating fromUT-Austin Within
6 Years
UnderrepresentedMinority Students'
Share of AdmittedStudents
6-Year Graduation Rate Under Traditional Affirmative Action (74.5%)
URM Share Under Traditional Affirmative Action (19.5%)
6-Year Graduation Rate Under Passive Affirmative Action Ban (74.7%)
URM Share Under Passive Affirmative Action Ban (16.1%)
6-Year Graduation Rate Under Proxy-Based Affirmative Action (73.7%)
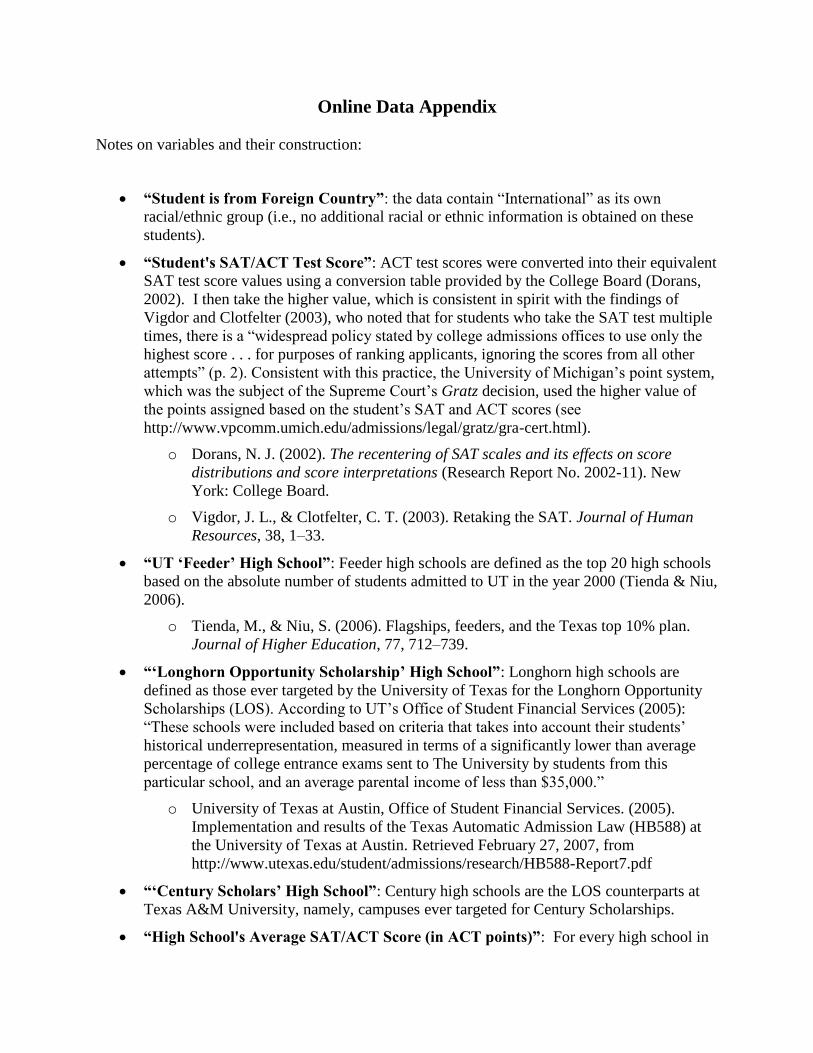
Online Data Appendix
Notes on variables and their construction:
“Student is from Foreign Country”: the data contain “International” as its own
racial/ethnic group (i.e., no additional racial or ethnic information is obtained on these
students).
“Student's SAT/ACT Test Score”: ACT test scores were converted into their equivalent
SAT test score values using a conversion table provided by the College Board (Dorans,
2002). I then take the higher value, which is consistent in spirit with the findings of
Vigdor and Clotfelter (2003), who noted that for students who take the SAT test multiple
times, there is a “widespread policy stated by college admissions offices to use only the
highest score . . . for purposes of ranking applicants, ignoring the scores from all other
attempts” (p. 2). Consistent with this practice, the University of Michigan’s point system,
which was the subject of the Supreme Court’s Gratz decision, used the higher value of
the points assigned based on the student’s SAT and ACT scores (see
http://www.vpcomm.umich.edu/admissions/legal/gratz/gra-cert.html).
o Dorans, N. J. (2002). The recentering of SAT scales and its effects on score
distributions and score interpretations (Research Report No. 2002-11). New
York: College Board.
o Vigdor, J. L., & Clotfelter, C. T. (2003). Retaking the SAT. Journal of Human
Resources, 38, 1–33.
“UT ‘Feeder’ High School”: Feeder high schools are defined as the top 20 high schools
based on the absolute number of students admitted to UT in the year 2000 (Tienda & Niu,
2006).
o Tienda, M., & Niu, S. (2006). Flagships, feeders, and the Texas top 10% plan.
Journal of Higher Education, 77, 712–739.
“‘Longhorn Opportunity Scholarship’ High School”: Longhorn high schools are
defined as those ever targeted by the University of Texas for the Longhorn Opportunity
Scholarships (LOS). According to UT’s Office of Student Financial Services (2005):
“These schools were included based on criteria that takes into account their students’
historical underrepresentation, measured in terms of a significantly lower than average
percentage of college entrance exams sent to The University by students from this
particular school, and an average parental income of less than $35,000.”
o University of Texas at Austin, Office of Student Financial Services. (2005).
Implementation and results of the Texas Automatic Admission Law (HB588) at
the University of Texas at Austin. Retrieved February 27, 2007, from
http://www.utexas.edu/student/admissions/research/HB588-Report7.pdf
“‘Century Scholars’ High School”: Century high schools are the LOS counterparts at
Texas A&M University, namely, campuses ever targeted for Century Scholarships.
“High School's Average SAT/ACT Score (in ACT points)”: For every high school in
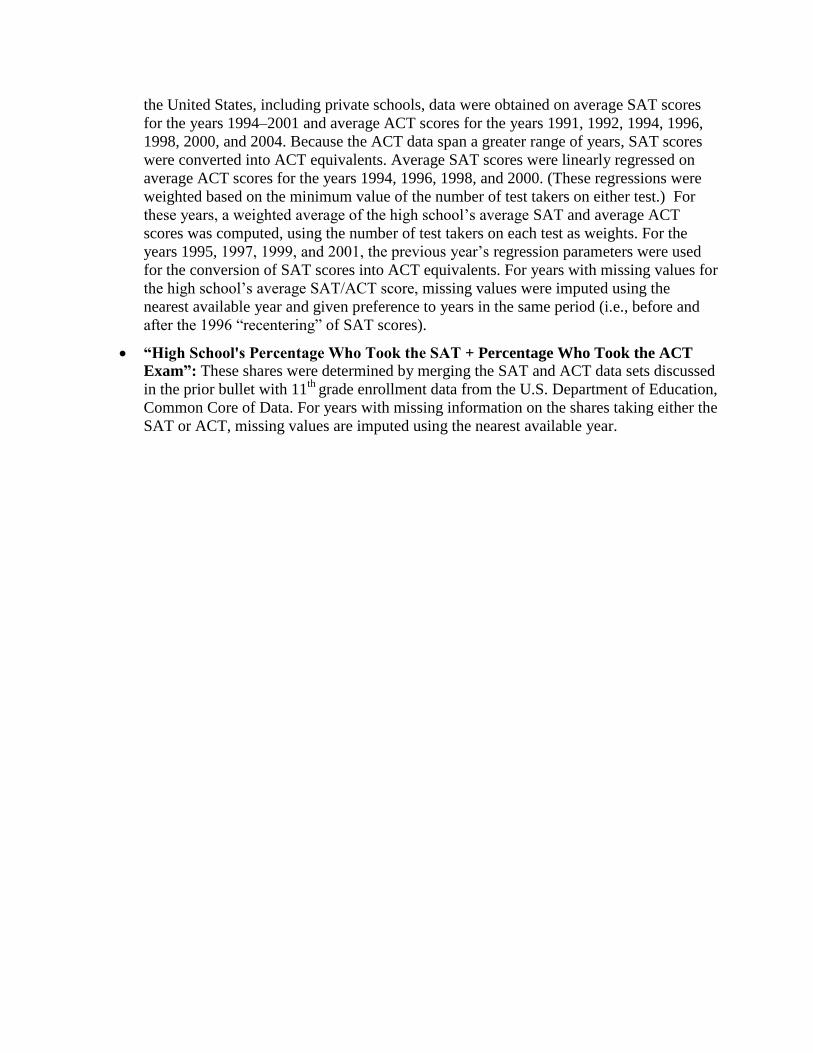
the United States, including private schools, data were obtained on average SAT scores
for the years 1994–2001 and average ACT scores for the years 1991, 1992, 1994, 1996,
1998, 2000, and 2004. Because the ACT data span a greater range of years, SAT scores
were converted into ACT equivalents. Average SAT scores were linearly regressed on
average ACT scores for the years 1994, 1996, 1998, and 2000. (These regressions were
weighted based on the minimum value of the number of test takers on either test.) For
these years, a weighted average of the high school’s average SAT and average ACT
scores was computed, using the number of test takers on each test as weights. For the
years 1995, 1997, 1999, and 2001, the previous year’s regression parameters were used
for the conversion of SAT scores into ACT equivalents. For years with missing values for
the high school’s average SAT/ACT score, missing values were imputed using the
nearest available year and given preference to years in the same period (i.e., before and
after the 1996 “recentering” of SAT scores).
“High School's Percentage Who Took the SAT + Percentage Who Took the ACT
Exam”: These shares were determined by merging the SAT and ACT data sets discussed
in the prior bullet with 11th
grade enrollment data from the U.S. Department of Education,
Common Core of Data. For years with missing information on the shares taking either the
SAT or ACT, missing values are imputed using the nearest available year.
Related Documents