Is Soy Milk? The Economics of the Soy Milk Market 1 Tirtha Dhar 2 Jeremy D. Foltz 3 Abstract This study uses revealed preferences of consumers to study the consumer benefits from soy milk. The study specifies and estimates structural demand and reduced form models of competition for different milk types using US supermarket scanner data. The introduction of soy milk is used to estimate consumer benefits and valuations. We decompose benefits into two components, competitive and variety effects. Results show relatively small consumer benefits from soy milk. Keywords: Demand Systems, Q-AIDS, Milk markets, Biotechnology, Soy Milk, Food Labeling JEL Codes: Q130, C300, D120, D400 Presented at the UW Food Systems Research Group Conference, Madison, WI, June 17-18, 2005 This draft: June 15, 2005 1 The project was partially funded by the Food Systems Research Group, University of Wisconsin- Madison. We are grateful to Kyle Stiegert for providing us the funds and access to the scanner data and Nethra Palaniswamy for diligent tracking of soy milk brands. Any errors and omissions are the sole responsibility of the authors. 2 Assistant Professor of Marketing, Sauder School of Business, University of British Columbia. E-mail: [email protected] 3 Assistant Professor, Department of Agricultural Applied Economics, University of Wisconsin-Madison. E-mail: [email protected] (corresponding author; senior authorship is not assigned)

Welcome message from author
This document is posted to help you gain knowledge. Please leave a comment to let me know what you think about it! Share it to your friends and learn new things together.
Transcript

Is Soy Milk?
The Economics of the Soy Milk Market1
Tirtha Dhar2
Jeremy D. Foltz3
Abstract
This study uses revealed preferences of consumers to study the consumer benefits from soy milk. The study specifies and estimates structural demand and reduced form models of competition for different milk types using US supermarket scanner data. The introduction of soy milk is used to estimate consumer benefits and valuations. We decompose benefits into two components, competitive and variety effects. Results show relatively small consumer benefits from soy milk. Keywords: Demand Systems, Q-AIDS, Milk markets, Biotechnology, Soy Milk, Food
Labeling
JEL Codes: Q130, C300, D120, D400
Presented at the UW Food Systems Research Group Conference,
Madison, WI, June 17-18, 2005
This draft: June 15, 2005
1 The project was partially funded by the Food Systems Research Group, University of Wisconsin-Madison. We are grateful to Kyle Stiegert for providing us the funds and access to the scanner data and Nethra Palaniswamy for diligent tracking of soy milk brands. Any errors and omissions are the sole responsibility of the authors. 2 Assistant Professor of Marketing, Sauder School of Business, University of British Columbia. E-mail: [email protected] 3 Assistant Professor, Department of Agricultural Applied Economics, University of Wisconsin-Madison. E-mail: [email protected] (corresponding author; senior authorship is not assigned)

1
Is Soy Milk? The Economics of the Soy Milk Market
The U.S. food sector is going through rapid transformations in terms of new
product introduction and innovations. New soy based food products are leading the way
in changing the landscape of available choices to consumers. This rapid expansion of
product spaces has taken place concomitantly with an increase in public policy concerns
on issues of standardization, labeling, and associated consumer welfare. In this paper we
explore these broader issues in the context of a specific product introduction, the
introduction of soy milk in the U.S. market.
Soy milk is fast emerging as a potential competitor for cow’s milk in the U.S.
market. The debate and fight over soy milk pits dairy producers and their associations
against their counterparts in the crop/grain world. Stories on the controversies related to
the competition between soy and dairy milk have been in the major news outlets for quite
some time. For example, in 2003 one of ABC’s 20/20 news shows devoted half an hour
to discussing the politics of the soy and dairy milk war.
The purpose of the research is to analyze the economics of a major recent
innovation in the U.S. fluid milk market: the introduction of soy milk. Are consumers
willing to pay extra for soy milk? If so, how much are they willing to pay? Are soy and
cows milk substitutes or complements in the market?
Among the key policy relevant issues to be addressed in this research are:
1. Market separability between soy and animal milks: There is a key labeling issue
for policy makers as to whether soy milk should be labeled as “milk” or whether

2
the milk designation should be reserved for animal’s milk or not. Many of the
major US dairy producer organizations have lobbied to have soy beverages
banned from using the moniker “milk”. Much of the relevance of this debate
hinges on whether soy milk competes against cow’s milk or serves a separate
consumer market.
2. Market structure in the soy and cows’ milk markets. The soy milk retail market
contains both large integrated agribusiness firms, such as Archer Daniels Midland
and Cargill, and a significant number of small specialized firms, such as Eden
Soy, focusing only on the soy milk market. In addition a major competitor in the
cows’ milk market, Suiza/Dean Foods, has significant market shares in both the
cows’ and soy milk markets. Understanding the interactions between these milk
types will improve our ability to determine of whether trade in both milk markets
exhibits the hallmarks of anti-competitive behavior.
The present study uses revealed preferences of consumers to study the consumer
valuations of and associated benefits from soy milk, basing its analysis on scanner data of
fluid milk purchases in 12 key US metropolitan markets from IRI Inc.4 Of the 12 cities, 4
are in the West census region, 4 in the South census region, 3 in the Midwest, and 1 in the
Northeast region. Due to disclosure agreements with IRI we cannot mention the cities or
brands included in our analysis. Instead these cities are identified by US census regions
as: West census region cities (WT_1,.., WT_4); South census region cities (SO_1,..,
SO_4); Midwest region cities (MW_1,.., MW_3); and Northeast region city (NE_1). The
database provides detailed brand level information on volume sold, total revenue
4 A Chicago based marketing research firm specializing in archiving and analyzing store and household level scanner data.

3
generated, number of units sold, and the extent of merchandising and price reduction.
This data allows a simultaneous exploration of consumer willingness to pay, market
structure, and the conduct of firms in these markets. As a result we are able to provide a
comprehensive analysis of the U.S. retail fluid milk market by types (i.e., skim, whole,
flavored, milkshakes and soy milk).
The use of revealed preference data has a number of obvious advantages over the
previous survey and experimental based literature on food labeling and marketing of
specialty products (see e.g., Armand-Balmat, Teisel et al., Huffman et al.). First and
foremost it relies on consumer’s actual behavior rather than their behavior in
experimental or survey settings. Second data is available for 12 major metropolitan cities
spanning U.S. regions and the different types of cities: old industrial city, mainstream
fast-growing city, counterculture fast-growing city, etc. Thus one can make some
reasonable inferences about the population as a whole from this data. A third advantage
is we observe consumer responses both at the time they are introduced to a product and
their subsequent purchase pattern once they are used to the product in the market.
Having this time series avoids potential biases inherent in the experimental and survey
literature when consumers are faced with a product they have never seen or tasted before.
The goals of this paper are to:
- Identify empirically the extent of market penetration of soy milk products.
- Estimate price premiums and market shares of soy milk in each of the 12 markets.
- Estimate benefits to consumers from improved choice sets (e.g., from having only
cows milk to having soy milk) using highly flexible quadratic almost ideal demand
system (Q-AIDS) framework as in Banks, Blundell and Lewbel (1997). We use
4
full information maximum likelihood estimation techniques to estimate the demand
systems for four regionally and geographically representative markets after
controlling for price and expenditure endogeneity as in Dhar, Chavas and Gould
(2002).
The paper is organized as follows. First, we describe the data and present a
descriptive analysis of the milk products we analyze: skim/lowfat, whole, flavored, and
soy milks and milkshakes as well as the 12 markets. The reduced form analysis of this
section provides insights and guidelines for the structural demand analysis in the section
that follows. In Section 2 we provide a detailed demand system specification and our
estimation methods to generate consistent parameter estimates. In Section 3, we present
our empirical specification of the demand, price and expenditure systems. Econometric
results and post estimation measures such as price and expenditure elasticities, and
welfare impacts of different types of milk are then presented in Section 4. A conclusion
drawing policy implications for USDA labeling and regulation policy follows.
1. Data and Descriptive Statistics:
We use retail scanner data from Information Resources Inc. (IRI) to conduct
exploratory market analyses and estimate our demand system. Our scanner database,
which was collected so as to be representative of the markets in our 12 cities, provides
brand level weekly milk price and sales data starting from 3/9/1997 to the week ending
2/24/2002. We augment this database with milk input price data from the Federal Milk
Marketing Order (FMMO) as well as wholesale prices of organic soybeans from Organic

5
Marketing News (2005). The demographic variables come from the U.S. Census. The
descriptive statistics of the variables used in our analysis are summarized below.
Investigating retail price differentials and market shares provides the simplest
method for understanding for how soy milk fits into the overall milk market. Tables 1
and 2 present the average prices and market shares for the five milk types in our study by
city of sale and overall. On average, price differences between soy and skim or whole
milk are about $5.00 per gallon. There are relatively few apparent differences between
cities in terms of prices, however market shares do differ by an order of magnitude. A
western city, WT_1, has the lowest prices for soy milk, but it does not have the highest
market penetration for soy milk which occurs in NE_1 where nearly 1% of the market is
soy milk.
Over the 5 years from 1997 to 2002 prices for soy milk dropped 20% which is in
contrast to an increase of 16% in skim milk, 14% for whole milk, 21% for flavored milk,
and 35% for milkshakes. This asymmetric pattern of price inflation dropped the price
differential between soy milk and skim milk from $5.80 to $3.73 per gallon (122% of the
skim milk price). Such price differentials show significant willingness-to-pay among
certain consumers for the attributes of soy milk. These averages, however, represent
premiums consumers who bought these types of milk paid but do not identify either the
effect of competition between unlabeled and newly labeled milk or the effects on
consumers from having broader choice sets of labeled milk. These issues are analyzed in
the next section.
2. A Consumer Demand System for Multiple Milk Types

6
In this section we first describe our choice of demand system. Then we derive the
analytical form of the post estimation measures: elasticities and welfare effects. We
specify the demand system at the level of weekly milk purchases in each of the study
cities over the study period. Since we are constrained by the available data, this method
implicitly assumes a multi-stage household budgeting process in which milk expenditures
are weakly separable from other purchases. We believe this is a reasonable assumption
given that milk is a necessity and there exists no close substitute of fluid milk.5 In
estimating disaggregate demand systems such an assumption of weak separability is a
necessity at some level, since it is almost impossible to estimate a full demand system
that includes all products with disaggregated product level data. For example, even
studies in the literature that test for weak separabilty implicitly assume that weak
separabilty holds at some stage of the consumer budgeting process (see e.g., Eales and
Unnevehr, Nayga and Capps). Thus like the rest of the demand system literature, we are
constrained by the completeness of disaggregated data necessary to make interesting
inferences at the product level and need to assume weak separability at the level of milk
versus all other household purchases.
2a. Quadratic Almost Ideal Demand System:
To specify demand for different types of milk we use the quadratic almost ideal
demand system (Q-AIDS). A non-parametric analysis of Engel curves in Dhar and Foltz
suggests that the relationship between per capita expenditure on any milk type and total
5For detailed discussion on weak separability and estimation of disaggregated product or brand level demand systems please refer to Dhar, Chavas, and Gould. They reject weak separability in the context of carbonated beverages but they find that controlling for the endogeneity of prices and expenditures as done

7
per capita expenditure on milk is non-linear. Banks, Blundell and Lewbel (1997) have
shown that in the presence of such non-linear Engel curves use of a rank 2 demand
system such as the standard AIDS model is inappropriate. The Q-AIDS is the best
available exactly aggregable demand system to capture any non-linear impacts of price
and expenditure changes on demand. The demand system underlying the Q-AIDS is of
rank 3, which, as proved in Gorman, is the maximum possible rank for any demand
system that is linear in functions of income. Unlike the AIDS model (Deaton and
Muelbauer, 1980a,b) and the exactly aggregable Translog model of Jorgenson, Lau, and
Stoker, the Q-AIDS model permits goods to be luxuries at some income level and
necessities at others.
In order to derive a Q-AIDS demand system let e(p, u) be the household
expenditure function, where nRp ++∈ is the (n×1) price vector of the (n×1) vector of
consumption goods nRq +∈ . Under the almost ideal class of demand systems,
[ ] 11)()()(ln),(ln −−++= updpcpaupe , where:
)(ln)(ln5.0ln)(ln 0 ppppa TT Γ++= αα , ppc T ln)( β= , and ppd T ln)( τ= .
Denoting by kn the (n×1) vector ⎥⎥⎥
⎦
⎤
⎢⎢⎢
⎣
⎡
k
k, the parameters (α, β, τ, Γ) satisfy the restrictions:
αT 1n = 1, βT1n = 0, τT 1n = 0, Γ 1n = 0n (homogeneity/adding up), and ΓT = Γ (symmetry).
Letting x> 0 be household expenditure, the Marshallian demand specification (with
q1,…,qn quantity demanded ) in terms of expenditures shares w ≡ (p1 q1*/x, …, pn qn
*/x)T
are
in this application affects the test for weak separability such that null hypothesis of weak separabilty can in

8
(1) w= α + Γ ln p + β [ln x – ln a(p)] + τ [ln x – ln a(p)]2/c(p).
In order to facilitate the empirical implementation one can also specify this
demand specification in summation notation as:
(2) 2
1
1lnln)ln( ⎥⎦
⎤⎢⎣⎡
⎟⎠⎞⎜
⎝⎛+⎟
⎠⎞⎜
⎝⎛++=
∏∑
=
= lt
ltN
iilt
iN
j lt
ltijltijiilt P
x
pP
xpwiβ
τβγα
where p = (p1, …, pN)’ is a (N×1) vector of prices for q, and wilt = (pilt qilt/xlt) is the budget
share for the ith commodity consumed in the lth city at time t. The term Plt , the price
index can be expressed as:
ln(Plt) = δ + ∑ =
N
1mαm ln(pmlt) + 0.5 ∑ =
N
1m ∑ =
N
1jγmj ln(pmlt) ln(pjlt).
The above Q-AIDS specification (equation 2) can be modified to incorporate the
effects of socio-demographic variables (Z1lt, …, ZKlt) on consumption behavior, where Zklt
is the kth socio-demographic variable in the lth city at time t, k = 1, …, K. This method,
demographic translating, allows demographic differences to shift both the intercept and
elasticity parameters. Under demographic translating, αi is assumed to take the following
form: αilt = α0i+ ∑ =
K
1kλik Zklt, i = 1, …, N.
2b. Using Q-AIDS to analyze substitution between milk types:
From estimating a Q-AIDS model, one can recover detailed compensated and un-
compensated own and cross price elasticities, expenditure elasticities, and measures of
consumer welfare. The own and cross price elasticities allow us to analyze the
substitution behavior of consumers between the different types of milk as a way of
some cases be accepted.
9
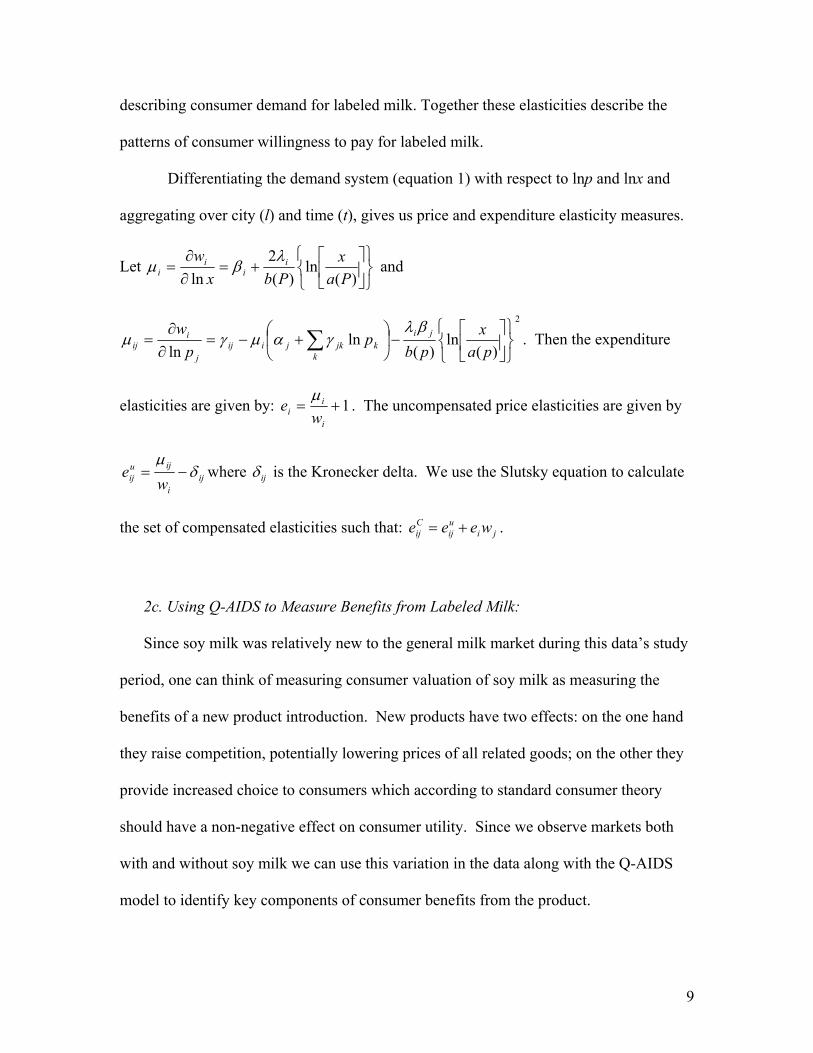
describing consumer demand for labeled milk. Together these elasticities describe the
patterns of consumer willingness to pay for labeled milk.
Differentiating the demand system (equation 1) with respect to lnp and lnx and
aggregating over city (l) and time (t), gives us price and expenditure elasticity measures.
Let ⎭⎬⎫
⎩⎨⎧
⎥⎦
⎤⎢⎣
⎡+=
∂∂
=)(
ln)(
2ln Pa
xPbx
w ii
ii
λβμ and
2
)(ln
)(ln
ln ⎭⎬⎫
⎩⎨⎧
⎥⎦
⎤⎢⎣
⎡−⎟
⎠
⎞⎜⎝
⎛+−=
∂∂
= ∑ pax
pbp
pw ji
kkjkjiij
j
iij
βλγαμγμ . Then the expenditure
elasticities are given by: 1+=i
ii w
eμ
. The uncompensated price elasticities are given by
iji
ijuij w
e δμ
−= where ijδ is the Kronecker delta. We use the Slutsky equation to calculate
the set of compensated elasticities such that: jiuij
Cij weee += .
2c. Using Q-AIDS to Measure Benefits from Labeled Milk:
Since soy milk was relatively new to the general milk market during this data’s study
period, one can think of measuring consumer valuation of soy milk as measuring the
benefits of a new product introduction. New products have two effects: on the one hand
they raise competition, potentially lowering prices of all related goods; on the other they
provide increased choice to consumers which according to standard consumer theory
should have a non-negative effect on consumer utility. Since we observe markets both
with and without soy milk we can use this variation in the data along with the Q-AIDS
model to identify key components of consumer benefits from the product.
10
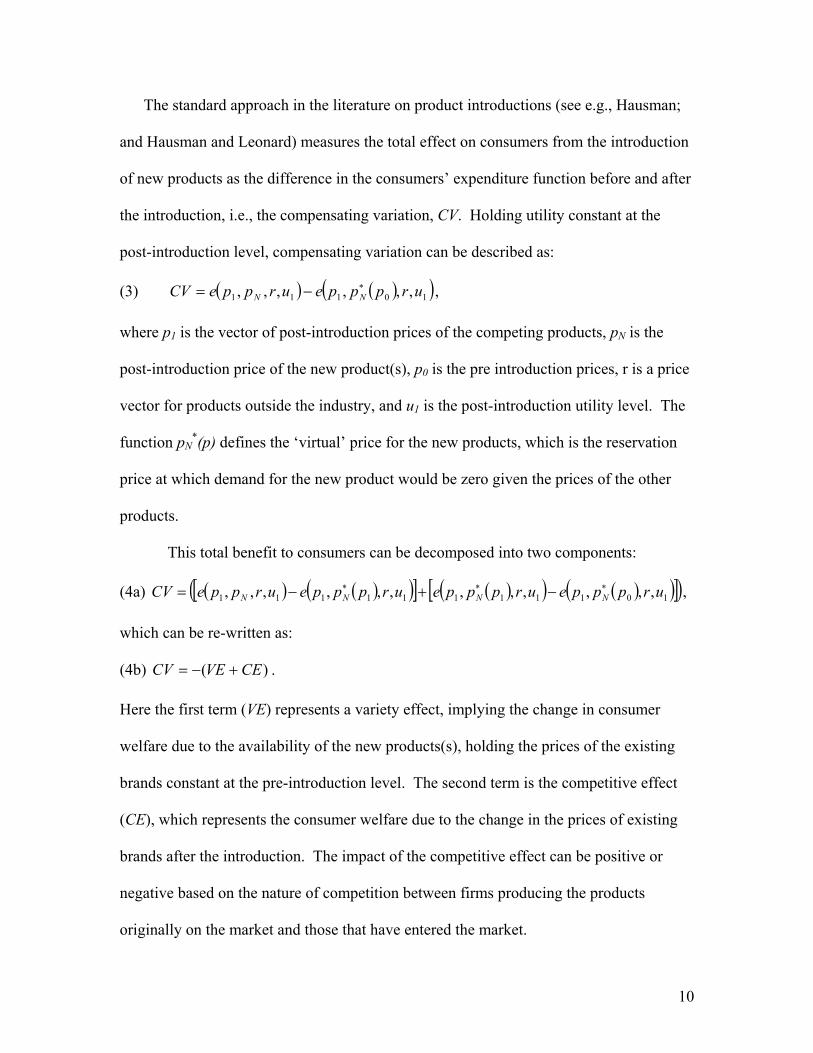
The standard approach in the literature on product introductions (see e.g., Hausman;
and Hausman and Leonard) measures the total effect on consumers from the introduction
of new products as the difference in the consumers’ expenditure function before and after
the introduction, i.e., the compensating variation, CV. Holding utility constant at the
post-introduction level, compensating variation can be described as:
(3) ( ) ( )( )10111 ,,,,,, urpppeurppeCV NN∗−= ,
where p1 is the vector of post-introduction prices of the competing products, pN is the
post-introduction price of the new product(s), p0 is the pre introduction prices, r is a price
vector for products outside the industry, and u1 is the post-introduction utility level. The
function pN*(p) defines the ‘virtual’ price for the new products, which is the reservation
price at which demand for the new product would be zero given the prices of the other
products.
This total benefit to consumers can be decomposed into two components:
(4a) ( ) ( )( )[ ] ( )( ) ( )( )[ ]( )10111111111 ,,,,,,,,,,,, urpppeurpppeurpppeurppeCV NNNN∗∗∗ −+−= ,
which can be re-written as:
(4b) )( CEVECV +−= .
Here the first term (VE) represents a variety effect, implying the change in consumer
welfare due to the availability of the new products(s), holding the prices of the existing
brands constant at the pre-introduction level. The second term is the competitive effect
(CE), which represents the consumer welfare due to the change in the prices of existing
brands after the introduction. The impact of the competitive effect can be positive or
negative based on the nature of competition between firms producing the products
originally on the market and those that have entered the market.

11
The variety effect can be estimated indirectly out of the parameters of the Q-AIDS
demand system as the area under the estimated demand curve between actual
price/consumption points and the price that sets consumption equal to zero. The
competitive effect can be estimated indirectly from the milk price series using the effects
of adding new soy milk brands as a proxy for the introduction effect.6 The empirical
techniques for estimating these effects are described below.
3. Estimation Procedures for the Demand System
A number of previous studies have found problems of endogeneity of price and
expenditure in estimating demand systems using aggregate scanner data such as those
used in this study (see e.g., Dhar, Chavas and Gould, 2003). In order to account for
potential price and expenditure endogeneity, our estimation procedure for the Q-AIDS
demand system, equation (2), includes an additional set of equations that simultaneously
estimate the determinants of milk prices and milk expenditures as functions of exogenous
variables. We estimate our demand equations, reduced form price equations, and
expenditure equation using a full information maximum likelihood (FIML) estimation
method.7 Due to adding up restrictions of the Q-AIDS demand system we drop one
demand equation and estimate a system with 4 demand equations, 5 reduced form price
equations, and 1 expenditure equation.
6 Note that it is also possible to generate indirect estimates of the competitive effect from the Q-AIDS system if one is willing to assume that the milk processors are engaged in a Bertrand competition game. Since part of the purpose of this paper is to evaluate whether or not there is any competition between soy and cows milk it would be counter productive to assume a specific type of competition. 7 An alternative is the GMM framework developed by Banks, Blundell, and Lewbell.

12
The reduced form price equations used to control for price endogeneity for each
milk type (skim/lowfat, whole, flavored, milkshake, and soy milks) are specified to
capture the supply side of the price formation mechanism. The price equation for the ith
commodity in the lth city at time t is:
(5) pilt = f(supply/demand shifters).
In equation (5) supply/demand shifters would include variables to describe raw material,
product manufacturing, and packaging costs. Following Blundell and Robin we specify a
reduced form expenditure equation where household expenditure in the lth city at time t is
a function of median household income and a time trend:
(6) Mlt = f(time trend, income).
Given these reduced form specifications for the price and expenditure equations, we
estimate jointly (2), (5) and (6) by FIML. The resulting parameter estimates have
desirable asymptotic properties (Amemiya).
To control for city specific variations, we modify the Q-AIDS specification with
demographic translating variables (Z1lt, …, ZKlt). Our AIDS model also incorporates a set
of four seasonal dummy variables for each city along with socio-demographic variables.
In order to maintain theoretical consistency of the AIDS model, the following restrictions
are applied to the demographic translating parameter α0i:
(7) α0i = ∑ =
4
1r rir Dd , 14
1=∑ =r ird , i = 1,…, N,
where dir is the parameter for the ith brand associated with the seasonal dummy variable
Dr for the rth season. Note that as a result, our demand equations do not have intercept
terms.

13
4. Empirical Specifications
4a. Price Specification
Most recent studies of differentiated products have modeled price as a function of
supply and demand shifters, assuming these shifters are exogenous to the price formation
mechanism (e.g., Cotterill, Franklin and Ma; Cotterill, Putsis and Dhar; and Kadiyali,
Vilcassim and Chintagunta). For cows’ milk products, raw milk prices account for 62%
of the retail milk price and thus can be used as a reasonable proxy for a large part of the
variability in manufacturing costs (U.S. G.A.O.). For soy milk, the major ingredients are
soybeans and water, with the major cost being in the soybeans themselves. Other
important retailing and processing costs we include in the price formation equation
provide proxies for labor, merchandising, and packaging costs. We therefore specify the
retail price functions, equation (5), with raw milk/soybean prices, marketing and other
product characteristics as explanatory variables:
(8)
[ ] iltiiltiiltiltiiltiiltiiilt UPVPRDpwagepCpCp 651432
210 )ln()ln()_ln()_ln()ln( θθθθθθθ ++++++= −
where pilt is the retail price of milk type i, in city l and at time t. As a measure of milk
costs, C_plt is the price of announced cooperative class 1 milk price in city l at time t for
cows’ milk products and the wholesale organic soybean price for soy milk products.8
Similarly, wagelt is the wage rate in city l at time t and pilt-1 is the lagged retail price. As a
measure of the average size of purchases UPVilt is the unit volume of the ith product in the
lth city at time t. For example, if a consumer purchases only one gallon bottles of a brand,
8 The soybean price in bushels was adjusted to be equivalent to the cows’ milk price which is reported in 100 lbs of milk.

14
then unit volume for that brand will be just one. Conversely, if this consumer buys a
half-gallon bottle then the unit volume will be 2. This variable is used to capture
packaging-related cost variations, as smaller package size per volume implies higher
costs to produce, distribute, and shelve. The variable PRDilt is the percent price reduction
of brand i and is used to capture any costs associated with specific price reductions such
as aisle end displays or freestanding newspaper inserts.
4b. Expenditure Specification
Similarly the reduced form expenditure function in (6) is specified as:
(9) ltltlttlt idxCwagexTRx _)ln()ln()ln( 431210 ψψψψψ ++++= − ,
where t = 1,…, 260 and ψ0 is the intercept term. TRt is a linear trend, capturing any
unobservable time specific effects on consumer milk expenditures. The variable wagelt is
the average wage rate in city l and is used as a proxy to capture the effect of income
differences on milk purchases. xlt-1 is lagged expenditure by one period. C_idxlt is the
city level consumer price index; this variable captures any city level overall supply
shocks to consumers.
In general the reduced form specifications, equations (8) and (9), are always
identified, although the issue of parameter identification is rather complex in such non-
linear structural models.9 We checked the order conditions for identification that would
apply to a linearized version of the demand equations (2) and found them to be satisfied.
Finally, we did not uncover numerical difficulties in implementing the FIML estimation.
9 For a detailed discussion please refer to Mittelhammer, Judge and Miller (p.474-475).
15
As pointed out by Mittelhammer, Judge and Miller (p.474-475) we interpret this as
evidence that each of the demand equations is identified.10
4c. Translating
Our translating specification (e.g. αilt = α0i+ ∑ =
K
1kλik Zklt) has four quarterly
dummies and two continuous variables. These two variables are: the monthly wage rate
in the city and the consumer price index. The seasonal dummies will be able to capture
any seasonal variations in a given city. The wage rate variable captures any impact of
changes in income on milk consumption. And lastly the consumer price index can capture
any exogenous shocks in other markets on the consumption of milk.
5. Q-AIDS Model Estimation Results
Table 3 provides parameter estimates for the demand system, reduced form price and
expenditure equations. The system is estimated with soy milk as the default equation so
no parameters are shown for soy milk. In total we estimate 86 parameters, 70 of them are
significant at a 5% or better level of significance. Among our estimated β parameters
measuring how consumption of each milk type changes with expenditure, three of four
are significant at a 5% level of significance with whole milk insignificant. Of the four
estimated τ parameters, which describe the quadratic term on expenditure, three of them
are significant at the 5% level, while the τ parameter for flavored milk is insignificant.
The significance of parameters (τ) associated with the quadratic part of the demand
system validates the choice of a Q-AIDS formulation for demand.
10 Due to space limitations, we report only related econometric results. More complete reports of the results

16
5a. Analysis of Elasticity Estimates:
Table 4 presents expenditure elasticity estimates and associated standard errors
while Tables 5(a) and 5(b) present uncompensated and compensated price elasticity
estimates and associated standard errors. The un-compensated price elasticities are not
significantly different from the compensated ones. Since this implies that the overall
impact of per capita expenditure on milk consumption is minimal, the analysis of price
elasticities uses un-compensated price elasticities.
We estimate elasticities at the mean of the variables and for cows’ milk products
find all except one of them to be significantly different from zero at a 5% level or less.
Soy milk, which has a significant own price elasticity, only shows a significant cross-
price elasticity with flavored milks. That suggests that soy milk is primarily related to
flavored milk rather than to standard milk varieties in consumers’ minds. This also
suggests that grocers, who typically place soy milk next to flavored milks in the dairy
case, have the correct marketing strategy.11
All types of milk show, as expected, negative uncompensated own-price
elasticities. Of the own price effects whole milk has the highest own price elasticity (-
2.44) followed by soy milk (-1.83) and skim/lowfat milk (-1.73), with flavored milk (-
1.29) and milk shakes (-0.88) having much lower elasticities. The key finding out of the
price elasticity matrix is that all of the cross price effects between soy milk and other
milk types except one (flavored milk) are less than unity, suggesting that there is
relatively little relationship between these markets. In contrast many of the other milk
are available from the authors on request.
17
varieties have elastic price relationships with each other. This suggests that purchasing
patterns do not show consumers treating soy milk as an equivalent type of milk with
cows milk.
In terms of signs, soy milk has a negative cross price elasticity with whole milk,
implying they are complements to each other. In contrast the positive cross price
elasticity between soy milk and all other types of milk implies that soy milk is a
substitute for them. This substitution pattern is, however, asymmetric suggesting greater
movement to other milk types than back to soy milk. For example, a 1% change in the
price of skim/lowfat milk leads to a statistically insignificant 0.001% switch to soy milk
suggesting little substitutability between these two products. On the other hand, a 1%
price change in soy milk leads to only a statistically significant and similar sized 0.72%
change in skim/lowfat milk demand and a 1.18% change in demand for flavored milk.
This implies that consumers who have switched to the higher priced soy milk
product are likely to switch back to cows milk. Such fluidity in consumer behavior may
suggest that once consumers choose soy milk they do not perceive a quality difference in
comparison to cows milk as would be the case in a vertically differentiated product
market. Consumers in vertically differentiated markets do not tend to switch back to a
lower quality product once they switch to a higher quality product.12 This contrasts with
results reported in Dhar and Foltz that consumers who switch to organic milk are unlikely
to switch back.
11 Note, though, that such placement of soy milks and flavored milks in the same section could be the cause of our findings, which is a subject that deserves further study. 12 A classic example of vertically differentiated market is the computer chip market. Once consumers switch to Pentium 4 chips they prefer not to switch back to Pentium 3 or lower quality chips.
18
Among the expenditure elasticities shown in Table 4, flavored milk (2.52) and
milk shakes (3.77) had the highest while soy milk has the lowest, with a non-significant
(0.32) elasticity. Skim/lowfat milk, which is the dominant milk in all these markets, has,
as expected, an expenditure elasticity just above unity suggesting a necessity. The low
expenditure elasticity for soy milk is perhaps surprising given that the soy milk is
commonly perceived to be associated with higher income groups of the population. But
the relationship between income and milk expenditure may not be positively correlated.
It is commonly known that large families with children tend to have higher per capita
expenditure on milk. In that case our result suggests that smaller families with no
children would tend to consume more soy milk. Another possible explanation is that we
are only estimating a partial demand system and we have not fully accounted for cross
expenditure effects. Estimates that test household and income effects as well as this
work’s assumption of weak separability would best be done with household level data,
which presents an important avenue for future research.
6. Estimating Consumer Benefits
As demonstrated above, consumer willingness to pay for different types of milk
can be estimated by the compensating variation. This compensating variation has two
elements a competitive effect and a variety effect. The estimation procedure and results
for each of these elements are described below.
6a. Competitive Effects:

19
The ideal strategy for identifying the competitive effects of soy milk is to
compare prices in markets and times in which they are sold with those where and when
they are not offered for sale (see e.g., Hausman and Leonard). This method provides a
way to value consumer surplus from soy milk by observing the effects of the product
introduction on prices of cows’ milk, which is the competition effect (CE). If the
introduction of soy milk reduces the price of cows’ milk, then consumers benefit from the
competition even if they do not purchase soy milk. This competition effect would be
over and above the benefit, utility, gained by those who consume soy milk which is
described by the variety effect.
Unfortunately, the data set does not include sufficient observations of markets
with no soy milk sales to capture product introductions. We instead use the introduction
of additional soy milk brands as a proxy for this product introduction effect. Since the
effect of a product introduction should normally be larger than the effect of a brand
introduction into an existing product category, these estimates should be seen as lower
bounds on the effects of soy milk being in the market. For the competitive effects
analysis we use data from all 12 cities over 260 weeks in order to capture the maximum
level of variation in the sample. Overall there were an average of 8 soy milk brands in
each city, with a maximum of 19 and a minimum during a 40 week period in the second
year of our data, 1998, when the So_2 city had no soy milk brands in the market. In
contrast there were an average of 17 skim/lowfat milk brands and 11 whole milk brands.
We estimate the price equation searching for price effects in the dominant type of
milk, skim milk which represents an average of at least 58% of the market share in all

20
cities. Following Hausman and Leonard let the pricing equation for skim milk be
described in the following manner:
(10) itiit
itititittit
whereCBAWp
μνεεδδδ
+=++++= 321 .
The dependent variable is the price of milk in city i during week t. The time specific
effects in the market are captured by the 0-1 indicator variables for each of 260 weeks,
Wt. In order to account for fixed effects in each market, the error structure is assumed to
include a city specific effect νi and a mean zero error term μit. The variable Iit is a count
of the number of soy brands in the market as a way of capturing the effects of an
introduction of soy milk. Thus, the coefficient δ1 represents the lower bound on the
competitive effect (CE), the change in price with the introduction of soy milk having
controlled for city and time specific effects. The variable Bit represents the number of
skim milk brands in a city during a particular week while Cit counts the number of other,
non-skim and non-soy, brands in the market. These latter two variables control for the
general effects of brand introduction in the estimation.
The equation is estimated using weekly prices per gallon of skim milk across each
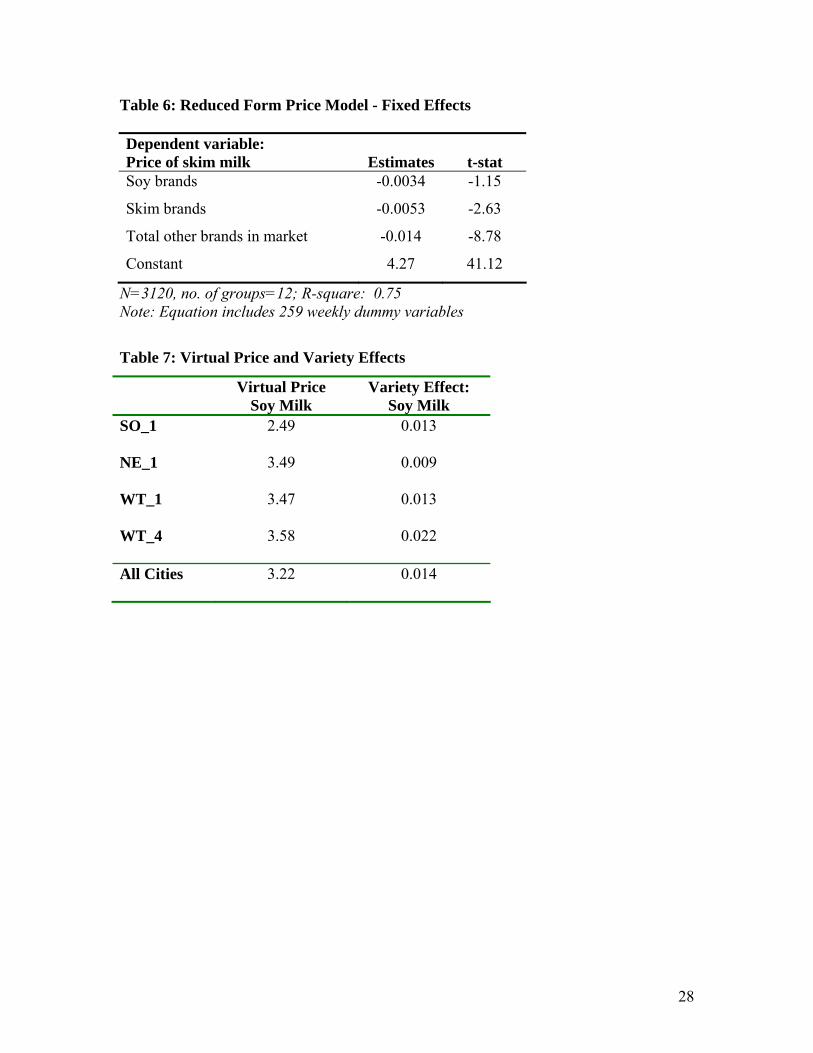
of 12 cities as the dependent variable. Results for the key parameters of interest are
presented in Table 6. The estimated competition effect is strong with skim milk prices
shown to be decreasing in the total number of brands, as well as the number of skim milk
brands. In contrast the estimated effect of soy milk on skim milk prices is negligible, less
than 1/3 of a penny per gallon, and statistically insignificant. We find no evidence of
there being a strong effect of soy milk brand introductions on the prices of skim milk.13
13 Estimates with whole milk showed a significant coefficient equivalent to 1.3 cents per gallon from the introduction of soy milk brands. The results are available from the authors on request.

21
6b. Variety effect:
As mentioned above we use our demand system parameter estimates to measure
variety effects for the existence of soy milk in the market. Table 7 presents estimates of
the virtual prices, which are the prices at which quantity purchased would be driven to
zero, and the variety effects consumers receive from having soy milk in the market. We
estimate the virtual price of a milk type by solving our estimated Q-AIDS setting the
budget share of the milk type to zero. They are presented in relative terms to the
product’s average price, so that a virtual price of 3.22 for soy milk says that at 3.22 times
the average whole milk price of $8.03, or $25.86, the demand for soy milk would go to
zero. The virtual prices show relatively high willingness to pay for having soy milk in
the market
From the virtual prices and the estimated demand surface curvatures one can
calculate the variety effect from having soy milk in the market, which, averaged across
the four cities, is 1.3 cents per capita per gallon per week. This implies a representative
consumer across these four cities receives 1.3 cents worth of benefit per week just from
the option of having soy milk in his/her choice set. There are, however, significant
variations at the city level. The highest per capita variety effect is in a western city,
WT_4, (2.2 cents per week), and the lowest is in a northeastern city, NE_1, (0.9 cents per
week). These estimates from the variety effect are very small, especially when compared
to results reported in Dhar and Foltz that show a variety effect from organic and rBST-
free milk that at 17 cents is an order of magnitude higher.

22
7. Conclusions and Policy Implications
In this paper we investigated consumer benefits from having soy milk in the
market using retail price differentials and a quadratic version of the almost ideal demand
system in a revealed preference analysis. This work finds consumers pay significantly
more for soy milk but the average consumer derives relatively little benefit from having
soy milk in the market. While the results show that nationally consumers benefit both
from the competition induced by soy milk and by the benefits of an increased choice set,
these effects are fairly small.
These results shed some light on whether dairy farmers and processors should be
concerned about the in-roads that soy milk is making in the milk market. While it seems
clear that consumers derive benefits from being able to buy soy milk it does not seem to
be a major competitor for cows’ milk. This presents a cautionary tale to policy makers
considering creating barriers to soy milk market entry such as denying soy milk access to
dairy case shelf space: these efforts may not be worth the consumer benefits.
A number of productive avenues for future research remain for investigation. It
would be useful to investigate the demand for soy milk in the context of the demand for
organic and rBST-free cows’ milk since the soy milk market is dominated by organic and
genetically modified soy-free soy milk brands. In addition organic soy milk has a much
higher market share than organic cows’ milk. Finally the market for soy milk has
significant scope for non-competitive behaviors with its concentration of market share
held by a few major food and dairy companies. This is a line of research we plan to
investigate in the future.

23
References:
Amemiya, T. Advanced Econometrics. Cambridge, Mass: Harvard University Press., 1985.
Armand-Balmat, C. “Comportement du Consommateur et Produits Biologiques” Typescript, INRA, Paris, December, 2000.
Banks, J. R. Blundell, and A. Lewbel, “Quadratic Engel Curves and Consumer Demand”, The Review of Economics and Statistics, 79(November, 1997):527-539.
Blundell R. and J.M. Robin. "Latent Separability: Grouping Goods Without Weak
Separability." Econometrica. 68 (2000): 53-84.
Cotterill, R. W., A. W. Franklin and L. Y. Ma. “Measuring Market Power Effects in
Differentiated Product Industries: An Application to the Soft Drink Industry.” Research Report, Food Marketing Policy Center, University of Connecticut, Storrs, CT, 1996.
Cotterill, R. W., W. P. Putsis Jr. and R. Dhar. “Assessing the Competitive Interaction
between Private Labels and National Brands”. Journal of Business 73 (January 2000): 109-37.
Deaton, A. S. and J. Muellbauer. “An Almost Ideal Demand System.” American
Economic Review 70(1980a): 312-26.
Deaton, A. S. and J. Muellbauer. Economics and Consumer Behavior. New York:
Cambridge University Press, 1980b.
Dhar, T., J.P. Chavas, and B.W. Gould. "An Empirical Assessment of Endogeneity Issues
in Demand Analysis for Differentiated Products." Forthcoming American Journal of Agricultural Economics 85(3) (Aug, 2003):605-617.
Dhar, T. and J.D. Foltz. “Milk by Any Other Name…Consumer Benefits from Labeled Milk”. University of Wisconsin, Food System Research Group Working paper No. 2003-2, August, 2003.
Eales, J. and L. Unnevehr. "Demand for Beef and Chicken Products: Separability and Structural Change.” American Journal of Agricultural Economics 70(3): 521-532.

24
Gorman, W.M., “Some Engel Curves,” in Angus Deaton ed. Essays in the Theory of Consumer Behaviour in Honor of Sir Richard Stone, Cambridge: Cambridge University Press, 1981.
Hausman, J. ‘Exact Consumer’s Surplus and Deadweight Loss’, American Economics
Review, 71(1981) 662-676. Hausman, J. and G. Leonard, “The Competitive Effects of A New Product Introduction:
A Case Study”, The Journal of Industrial Economics, (September, 2002):237-263. Huffman, W., M. Rousu, J. Shogren, A. Tegene. “Consumers’ Resistance to GM-foods:
The Role of Information in an Uncertain Environment.” Working Paper. Iowa State University. September, 2002.
Jorgenson, D.W., L.J. Lau, and T.M. Stoker, “The Transcedental Logarithmic
Model of Aggregate Consumer Behavior,” in R. Basman and G. Rodes. eds. Advances in Econometrics, Greenwich: JAI Press, 1980.
Kadiyali, V., N. J. Vilcassim and P. K. Chintagunta. “Empirical Analysis of Competitive
Product Line Pricing Decisions: Lead, Follow, or Move Together?” Journal of Business 69(1996): 459-87.
Mittelhammer, R.C., G.G. Judge and D.J. Miller. Econometric Foundations. 1st Edition.
Cambridge University Press: UK, 2000.
Nayga, R. M. Jr. and O. Capps. “Tests of Weak Separability in Disaggregated Meat Products.” American Journal of Agricultural Economics 76(November 1994): 800-808.
Organic Marketing News, “Organic Soybean Wholesale Prices” Excel spreadsheets of data, 2005.
Tegene, A., W. Huffman, M. Rousu, and J. Shogren, “The Effects of Information on
Consumer Demand for Biotech Foods” USDA Technical Bulletin TB#1903, April 2003.
Teisl, M. F., N. E. Bockstael and A. Levy. "Measuring The Welfare Effects of Nutrition
Information." American Journal of Agricultural Economics 83(2001): 133-149.
Tirole, J. The Theory of Industrial Organization. The MIT Press, Cambridge: 1988.
U.S. G.A.O. “Dairy Industry: Information on Milk Prices and Changing Market Structure.” U.S. G.A.O Report, January, 2001.

25
Table 1: Average Milk Price and Market Share
Price Market Share Mean std. Dev Mean std. Dev Skim/Low Fat Milk 3.0864 0.3318 0.6478 0.0745
Whole Milk 3.1468 0.3372 0.2878 0.0764
Flavored Milk 5.1425 1.0438 0.053 0.0326
Milk Shakes 8.9359 6.5389 0.003 0.0018
Soy Milk 8.0293 1.4225 0.0084 0.0078
Table 2: Average Milk Price and Market Share by City
Price Market Share Mean std. Dev Mean std. Dev SO_1
Skim/Low Fat Milk 3.1626 0.3292 0.5903 0.023
Whole Milk 3.1251 0.3007 0.3256 0.0099
Flavored Milk 4.3853 0.5107 0.0747 0.0227
Milk Shakes 2.4245 0.3065 0.0033 0.0017
Soy Milk 8.3633 2.0716 0.0061 0.0068 NE_1 Skim/Low Fat Milk 2.8981 0.2844 0.6581 0.0305
Whole Milk 2.897 0.2285 0.292 0.0125
Flavored Milk 5.1546 0.8829 0.0406 0.0386
Milk Shakes 11.261 2.1056 0.0009 0.0004
Soy Milk 7.9602 1.2069 0.0084 0.009 WT_1 Skim/Low Fat Milk 3.2764 0.1453 0.5854 0.0183
Whole Milk 3.0771 0.2043 0.3675 0.0172
Flavored Milk 6.406 0.5794 0.0322 0.0173
Milk Shakes 4.2938 0.2562 0.0048 0.0008
Soy Milk 7.2289 0.2672 0.0101 0.0075 WT_4 Skim/Low Fat Milk 3.0086 0.3841 0.7573 0.0334
Whole Milk 3.488 0.2947 0.1662 0.0147
Flavored Milk 4.6242 0.7395 0.0647 0.0275
Milk Shakes 17.7645 4.3661 0.0029 0.0011
Soy Milk 8.5647 1.1182 0.0089 0.0072

26
Table 3: Regression Results
Demand Equations Estimates t-stat Price and Expenditure Equation
Estimates t-stat
Quarterly Binary 1 in S/L Milk 0.97 6.49 Intercept: S/L -0.64 -8.81 Quarterly Binary 2 in S/L Milk 0.98 6.52 Intercept: W -0.41 -5.62 Quarterly Binary 3 in S/L Milk 0.98 6.52 Intercept: FL -0.45 -5.05 Quarterly Binary 4 in S/L Milk 0.96 6.37 Intercept: MS -0.95 -4.89 Wage in S/L Milk -0.90 -12.11 Intercept: Soy 0.33 5.20 CPI in S/L Milk 0.58 3.16 Coop Milk Price: S/L 0.00 -0.03 Quarterly Binary 1 in W Milk 2.04 15.39 Coop Milk Price: W -0.05 -0.77 Quarterly Binary 2 in W Milk 2.03 15.35 Coop Milk Price: FL -0.07 -0.65 Quarterly Binary 3 in W Milk 2.03 15.31 Coop Milk Price: MS -0.17 -1.09 Quarterly Binary 4 in W Milk 2.03 15.29 Coop Milk Price: Soy 0.02 0.26 Wage in W Milk 0.87 12.80 Wage Rate: S/L Milk 0.19 11.39 CPI in W Milk -2.64 -15.72 Wage Rate: W Milk 0.13 7.58 Quarterly Binary 1 in FL Milk -1.24 -10.49 Wage Rate: FL Milk 0.17 8.02 Quarterly Binary 2 in FL Milk -1.23 -10.50 Wage Rate: MS Milk 0.27 5.87 Quarterly Binary 3 in FL Milk -1.23 -10.51 Wage Rate: Soy Milk -0.02 -1.16 Quarterly Binary 4 in FL Milk -1.21 -10.27 1 period lagged Price: S/L 0.73 68.56 Wage in FL Milk 0.13 2.92 1 period lagged Price: W 0.78 91.15 CPI in FL Milk 1.17 8.99 1 period lagged Price: FL 0.77 60.66 Quarterly Binary 1 in MS Milk -0.03 -2.89 1 period lagged Price: MS 0.86 124.87 Quarterly Binary 2 in MS Milk -0.03 -2.83 1 period lagged Price: Soy 0.72 87.52 Quarterly Binary 3 in MS Milk -0.03 -2.82 Percentage Price Reduction: S/L -0.02 -17.43 Quarterly Binary 4 in MS Milk -0.03 -2.91 Percentage Price Reduction: W -0.01 -11.89 Wage in MS Milk 0.02 3.40 Percentage Price Reduction: FL -0.04 -12.41 CPI in MS Milk 0.02 1.11 Percentage Price Reduction: MS -0.02 -6.04 β in S/L Milk -0.07 -2.93 Percentage Price Reduction: Soy -0.02 -8.70 β in W Milk -0.01 -0.30 Unit per Volume: S/L -0.18 -9.29 β in FL Milk 0.06 3.98 Unit per Volume: W -0.15 -13.61 β in MS Milk 0.02 10.38 Unit per Volume: FL -0.24 -12.41 τ in S/L Milk -0.26 -5.26 Unit per Volume: MS -0.22 -19.01 τ in W Milk 0.27 7.15 Unit per Volume: Soy -0.25 -24.56 τ in FL Milk -0.04 -1.30 Coop Milk Price2: S/L 0.06 0.65 τ in MS Milk 0.02 4.74 Coop Milk Price2: W 0.10 1.05 Γ11 -0.44 -14.10 Coop Milk Price2: FL 0.16 1.13
Γ21 0.44 16.19 Coop Milk Price2: MS 0.19 0.85 Γ22 -0.44 -16.53 Coop Milk Price2: Soy -0.03 -0.30 Γ31 -0.03 -2.63 Expenditure Function Γ32 0.03 3.31 Intercept -4.05 -4.47 Γ33 -0.01 -1.32 Time trend -0.03 -3.30 Γ41 0.02 12.43 1 period lagged expenditure 1.07 55.26 Γ42 -0.02 -14.43 wage rate 0.00 0.01 Γ43 0.00 3.36 CPI 0.58 2.85 Γ44 0.00 2.43

27
Table 4: Expenditure Elasticities* Product Elasticity Skim/Low Fat Milk 1.08 49.74Whole Milk 0.54 12.21Flavored Milk 2.52 14.33Milk Shakes 3.77 13.65Soy Milk 0.32 1.81
* Italicized numbers below the estimates are t-stats.
Table 5a: Price Elasticities (Un-Compensated)* Product Skim/Low
Fat Milk Whole Milk
Flavored Milk
Milk Shakes
Soy Milk
Skim/Low Fat Milk -1.73 0.67 -0.05 0.02 0.00
-40.41 14.84 -3.19 12.02 0.94 Whole Milk 1.86 -2.44 0.12 -0.06 -0.02
23.90 -24.34 4.76 -13.77 -1.64 Flavored Milk -1.53 0.08 -1.29 0.03 0.16
-6.95 0.50 -9.16 2.51 9.50 Milk Shakes 2.70 -6.62 0.49 -0.88 0.19
5.69 -15.06 2.86 -13.30 1.93 Soy Milk 0.72 -0.59 1.18 0.08 -1.83
1.94 -1.40 11.35 2.22 -19.44 * Italicized numbers below the estimates are t-stats.
Table 5b: Price Elasticities (Compensated)*Product Skim/Low
Fat Milk Whole Milk
Flavored Milk
Milk Shakes
Soy Milk
Skim/Low Fat Milk -1.70 0.69 -0.04 0.02 0.01 -37.13 16.12 -3.00 12.12 1.02
Whole Milk 1.77 -2.48 0.12 -0.06 -0.02 21.82 -25.44 4.48 -13.86 -1.73
Flavored Milk -1.47 0.11 -1.28 0.03 0.16 -6.81 0.65 -9.11 2.53 9.55
Milk Shakes 2.71 -6.62 0.49 -0.88 0.19 5.71 -15.06 2.86 -13.30 1.93
Soy Milk 0.72 -0.59 1.18 0.08 -1.83 1.93 -1.41 11.35 2.22 -19.44 * Italicized numbers below the estimates are t-stats.
28
Table 6: Reduced Form Price Model - Fixed Effects Dependent variable: Price of skim milk Estimates t-stat Soy brands -0.0034 -1.15
Skim brands -0.0053 -2.63
Total other brands in market -0.014 -8.78
Constant 4.27 41.12
N=3120, no. of groups=12; R-square: 0.75 Note: Equation includes 259 weekly dummy variables
Table 7: Virtual Price and Variety Effects
Virtual Price Soy Milk
Variety Effect: Soy Milk
SO_1 2.49
0.013
NE_1 3.49
0.009
WT_1 3.47
0.013
WT_4 3.58
0.022
All Cities 3.22
0.014
Related Documents