MARCH 2013

Welcome message from author
This document is posted to help you gain knowledge. Please leave a comment to let me know what you think about it! Share it to your friends and learn new things together.
Transcript
MARCH 2013
Market Leader in High-Yield Pre-Owned CV Financing
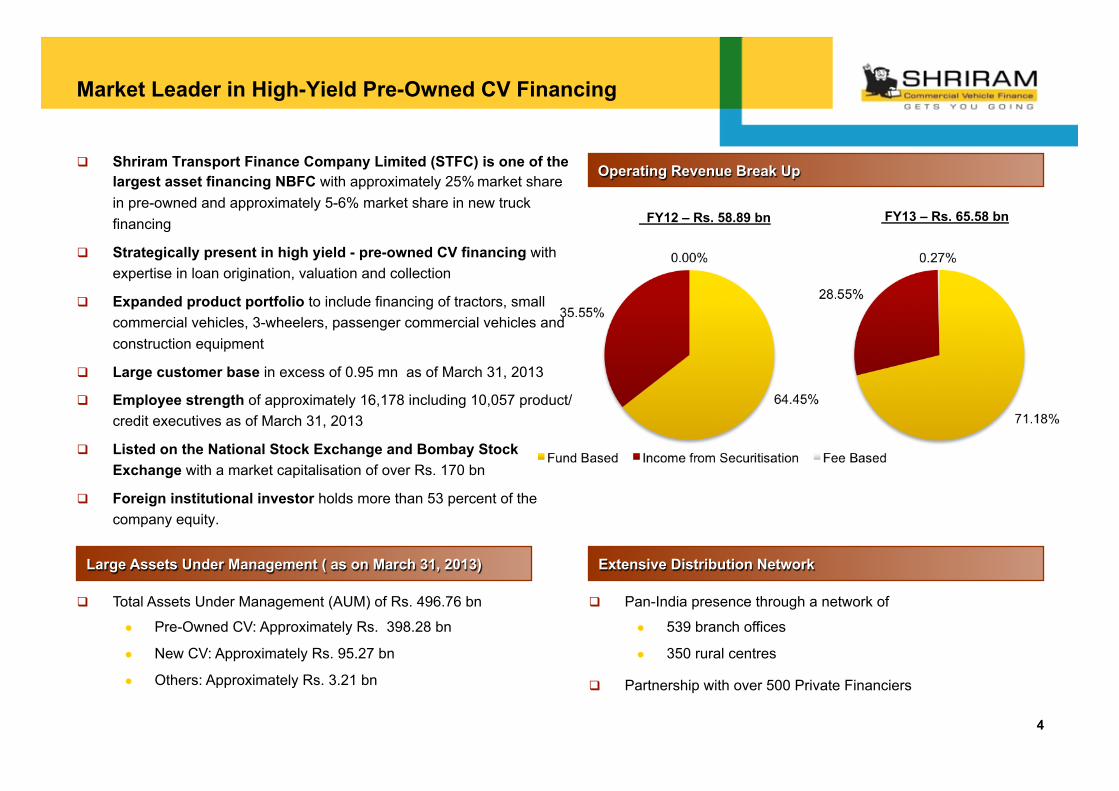
q Shriram Transport Finance Company Limited (STFC) is one of the largest asset financing NBFC with approximately 25% market share in pre-owned and approximately 5-6% market share in new truck financing
q Strategically present in high yield - pre-owned CV financing with expertise in loan origination, valuation and collection
q Expanded product portfolio to include financing of tractors, small commercial vehicles, 3-wheelers, passenger commercial vehicles and construction equipment
q Large customer base in excess of 0.95 mn as of March 31, 2013
q Employee strength of approximately 16,178 including 10,057 product/credit executives as of March 31, 2013
q Listed on the National Stock Exchange and Bombay Stock Exchange with a market capitalisation of over Rs. 170 bn
q Foreign institutional investor holds more than 53 percent of the company equity.
4
Operating Revenue Break Up
FY12 – Rs. 58.89 bn
Extensive Distribution Network Large Assets Under Management ( as on March 31, 2013)
q Total Assets Under Management (AUM) of Rs. 496.76 bn
● Pre-Owned CV: Approximately Rs. 398.28 bn
● New CV: Approximately Rs. 95.27 bn
● Others: Approximately Rs. 3.21 bn
q Pan-India presence through a network of
● 539 branch offices
● 350 rural centres
q Partnership with over 500 Private Financiers
FY13 – Rs. 65.58 bn
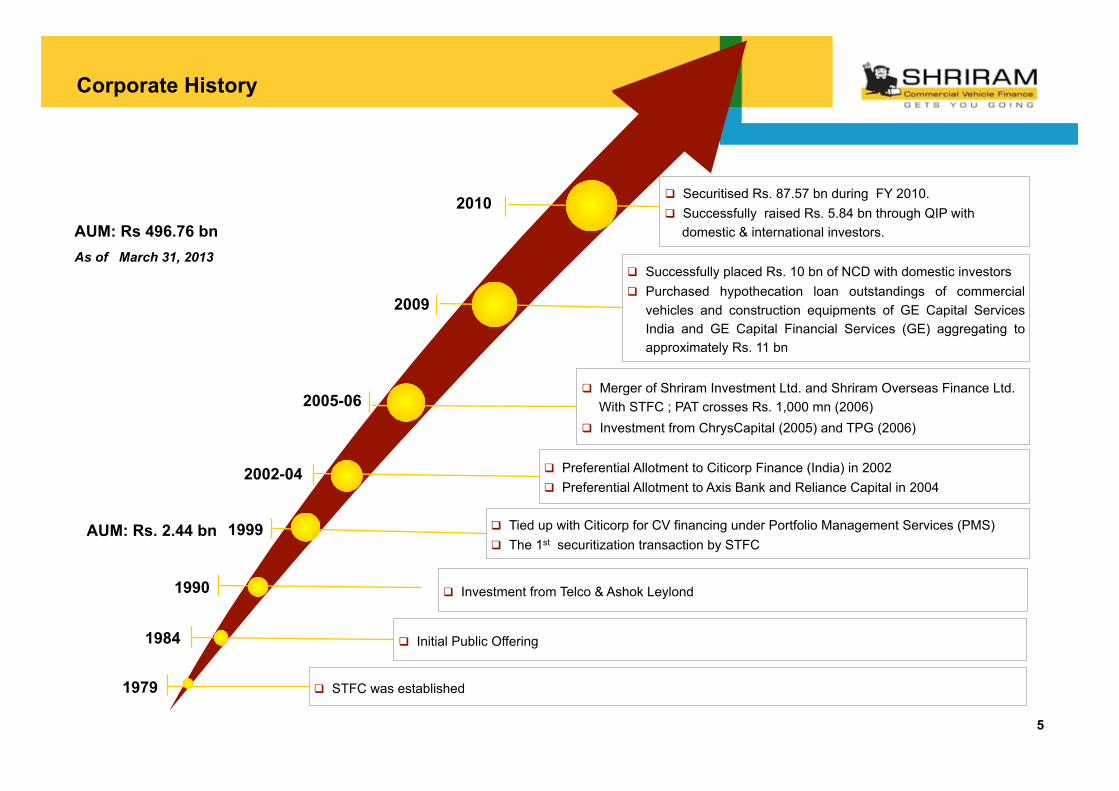
Corporate History
5
2009
2005-06
2002-04
1999
1984
1979
q Successfully placed Rs. 10 bn of NCD with domestic investors q Purchased hypothecation loan outstandings of commercial
vehicles and construction equipments of GE Capital Services India and GE Capital Financial Services (GE) aggregating to approximately Rs. 11 bn
q Merger of Shriram Investment Ltd. and Shriram Overseas Finance Ltd. With STFC ; PAT crosses Rs. 1,000 mn (2006)
q Investment from ChrysCapital (2005) and TPG (2006)
q Preferential Allotment to Citicorp Finance (India) in 2002 q Preferential Allotment to Axis Bank and Reliance Capital in 2004
q Tied up with Citicorp for CV financing under Portfolio Management Services (PMS) q The 1st securitization transaction by STFC
q Initial Public Offering
q STFC was established
AUM: Rs. 2.44 bn
AUM: Rs 496.76 bn As of March 31, 2013
1990 q Investment from Telco & Ashok Leylond
q Securitised Rs. 87.57 bn during FY 2010. q Successfully raised Rs. 5.84 bn through QIP with
domestic & international investors.
2010
Unique Business Model
6
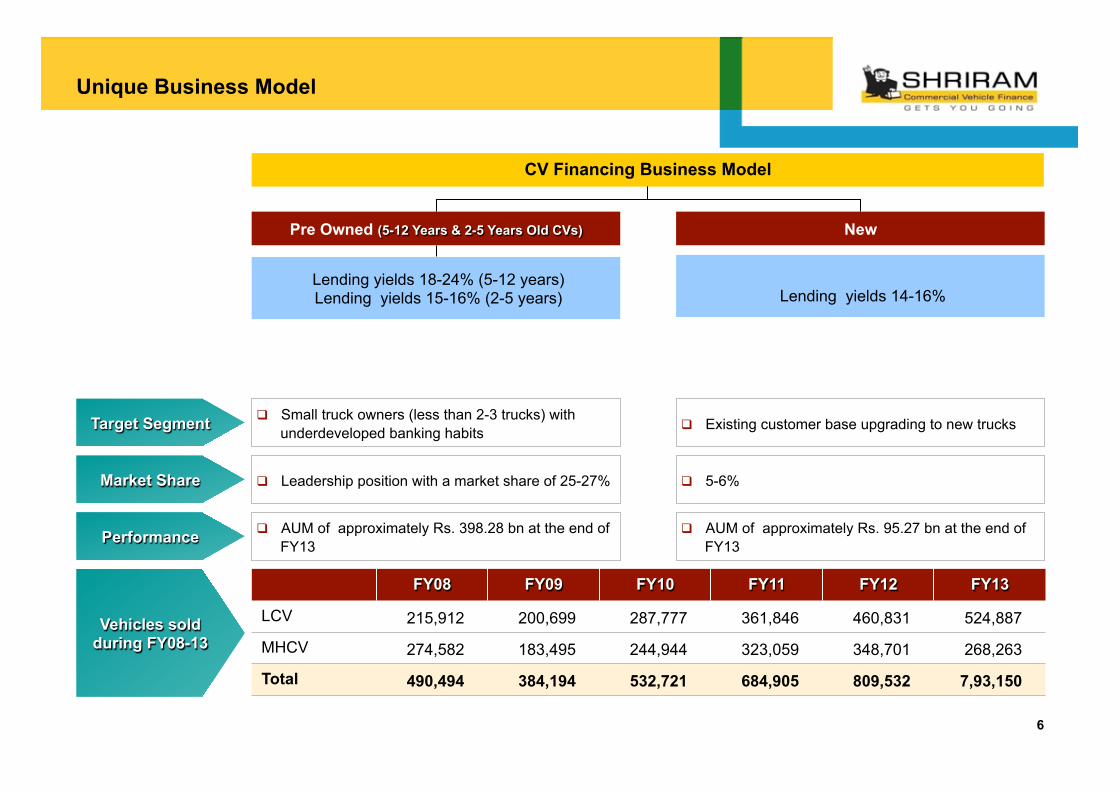
CV Financing Business Model
Pre Owned (5-12 Years & 2-5 Years Old CVs) New
Lending yields 18-24% (5-12 years) Lending yields 15-16% (2-5 years)
Lending yields 14-16%
Target Segment q Small truck owners (less than 2-3 trucks) with underdeveloped banking habits
Market Share q Leadership position with a market share of 25-27%
Performance q AUM of approximately Rs. 398.28 bn at the end of FY13
q Existing customer base upgrading to new trucks
q 5-6%
q AUM of approximately Rs. 95.27 bn at the end of FY13
FY08 FY09 FY10 FY11 FY12 FY13
LCV 215,912 200,699 287,777 361,846 460,831 524,887
MHCV 274,582 183,495 244,944 323,059 348,701 268,263
Total 490,494 384,194 532,721 684,905 809,532 7,93,150
Vehicles sold during FY08-13
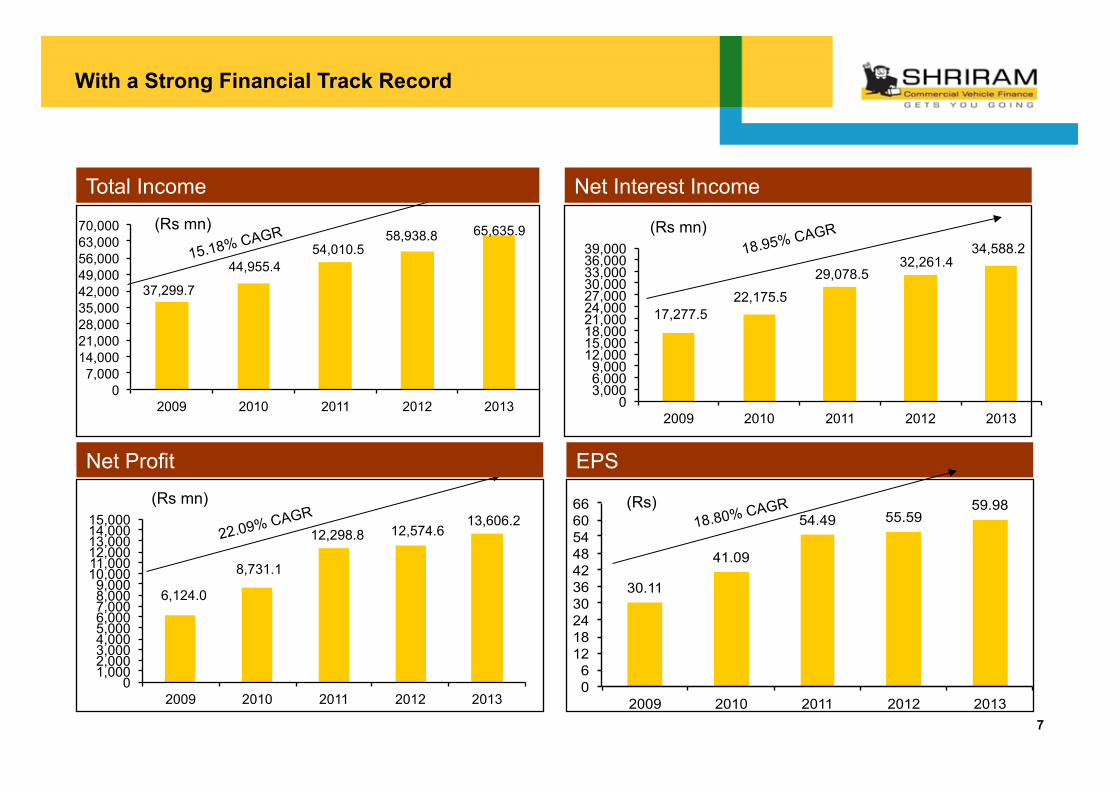
With a Strong Financial Track Record
17,277.5 22,175.5
29,078.5 32,261.4
34,588.2
0 3,000 6,000 9,000
12,000 15,000 18,000 21,000 24,000 27,000 30,000 33,000 36,000 39,000
2009 2010 2011 2012 2013
18.95% CAGR
Net Interest Income
(Rs mn)
6,124.0
8,731.1
12,298.8 12,574.6 13,606.2
0 1,000 2,000 3,000 4,000 5,000 6,000 7,000 8,000 9,000
10,000 11,000 12,000 13,000 14,000 15,000
2009 2010 2011 2012 2013
22.09% CAGR
Net Profit
(Rs mn)
30.11
41.09
54.49 55.59 59.98
0 6
12 18 24 30 36 42 48 54 60 66
2009 2010 2011 2012 2013
EPS
(Rs) 18.80% CAGR
37,299.7
44,955.4 54,010.5
58,938.8 65,635.9
0 7,000
14,000 21,000 28,000 35,000 42,000 49,000 56,000 63,000 70,000
2009 2010 2011 2012 2013
15.18% CAGR
Total Income
(Rs mn)
7
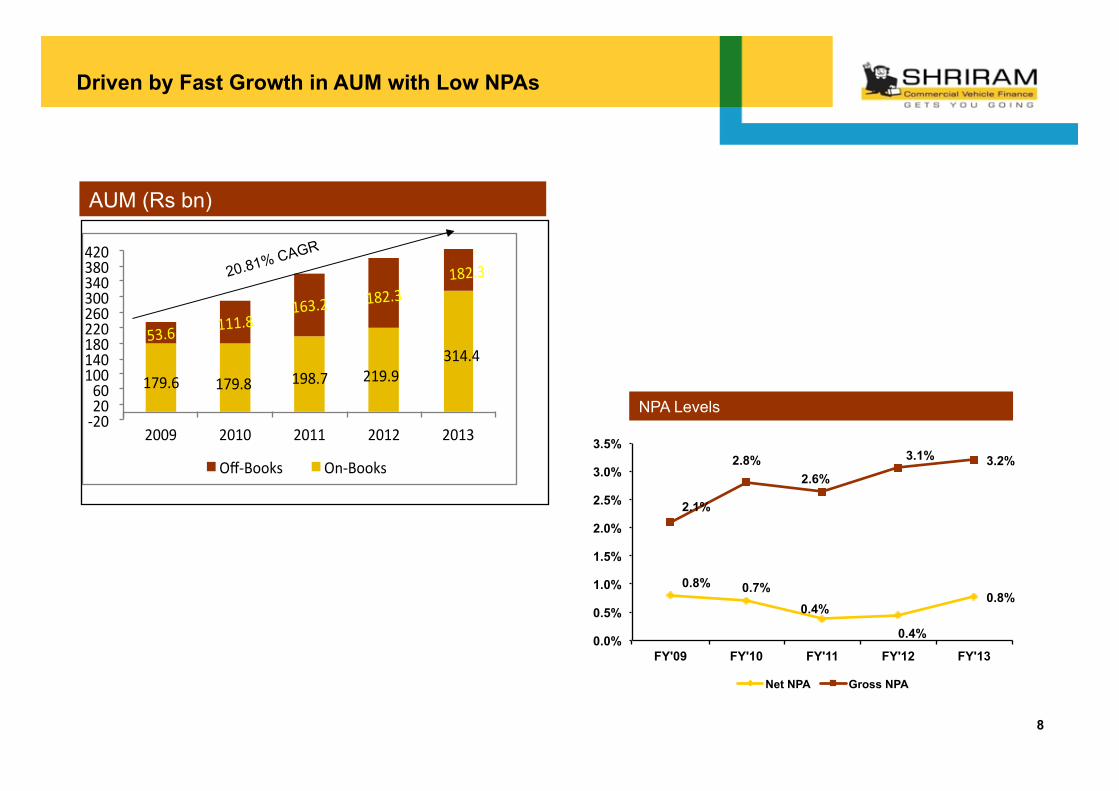
Driven by Fast Growth in AUM with Low NPAs
0.8% 0.7%
0.4%
0.4%
0.8%
2.1%
2.8% 2.6%
3.1% 3.2%
0.0%
0.5%
1.0%
1.5%
2.0%
2.5%
3.0%
3.5%
FY'09 FY'10 FY'11 FY'12 FY'13
Net NPA Gross NPA
NPA Levels 179.6& 179.8& 198.7& 219.9&
314.4&53.6&
111.8&163.2& 182.3&
182.3&
,20&20&60&
100&140&180&220&260&300&340&380&420&
2009& 2010& 2011& 2012& 2013&
Off,Books& On,Books&
20.81% CAGR
AUM (Rs bn)
8
Strengths
10
1 Widespread Geographical Reach
2 Valuation Skills & Recovery/Collection Operation
3 Strong Balance Sheet
4 Strong Management Team
5 Organizational Structure: Credit Risk Focus
6 Strengthening Presence and Expanding Reach
11
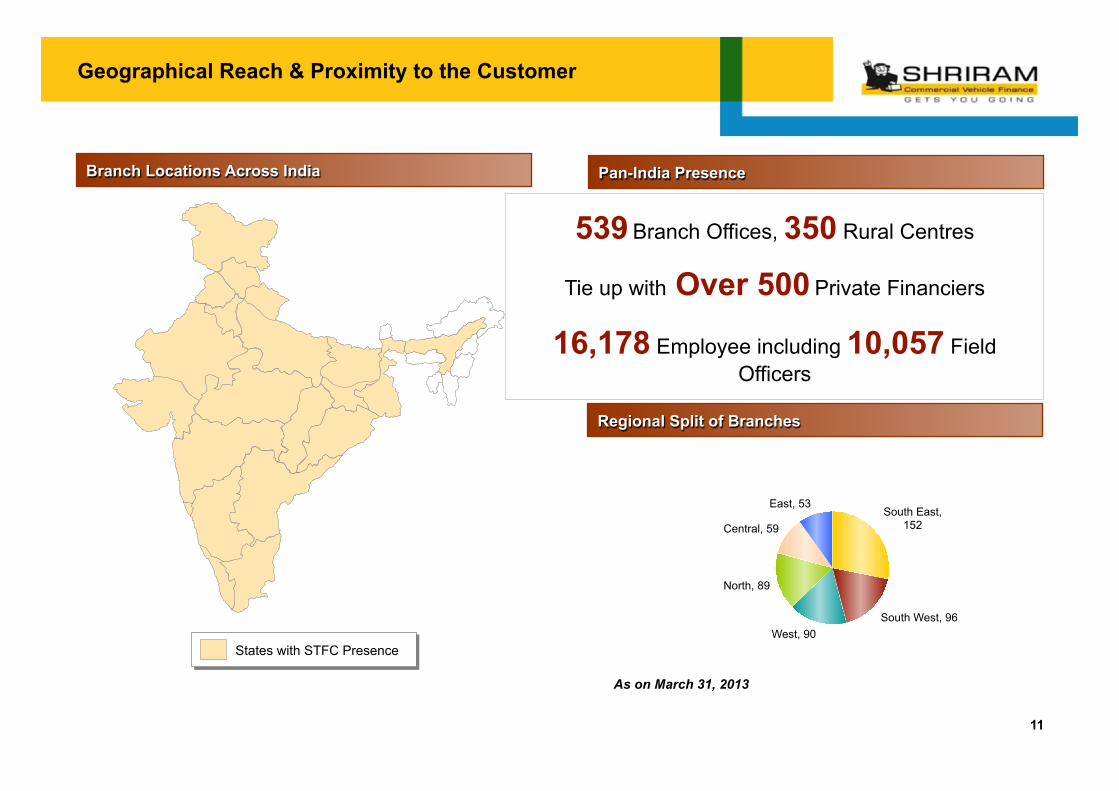
Branch Locations Across India
States with STFC Presence
539 Branch Offices, 350 Rural Centres
Tie up with Over 500 Private Financiers
16,178 Employee including 10,057 Field Officers
Pan-India Presence
As on March 31, 2013
Regional Split of Branches
South East, 152
South West, 96 West, 90
North, 89
Central, 59
East, 53
Geographical Reach & Proximity to the Customer
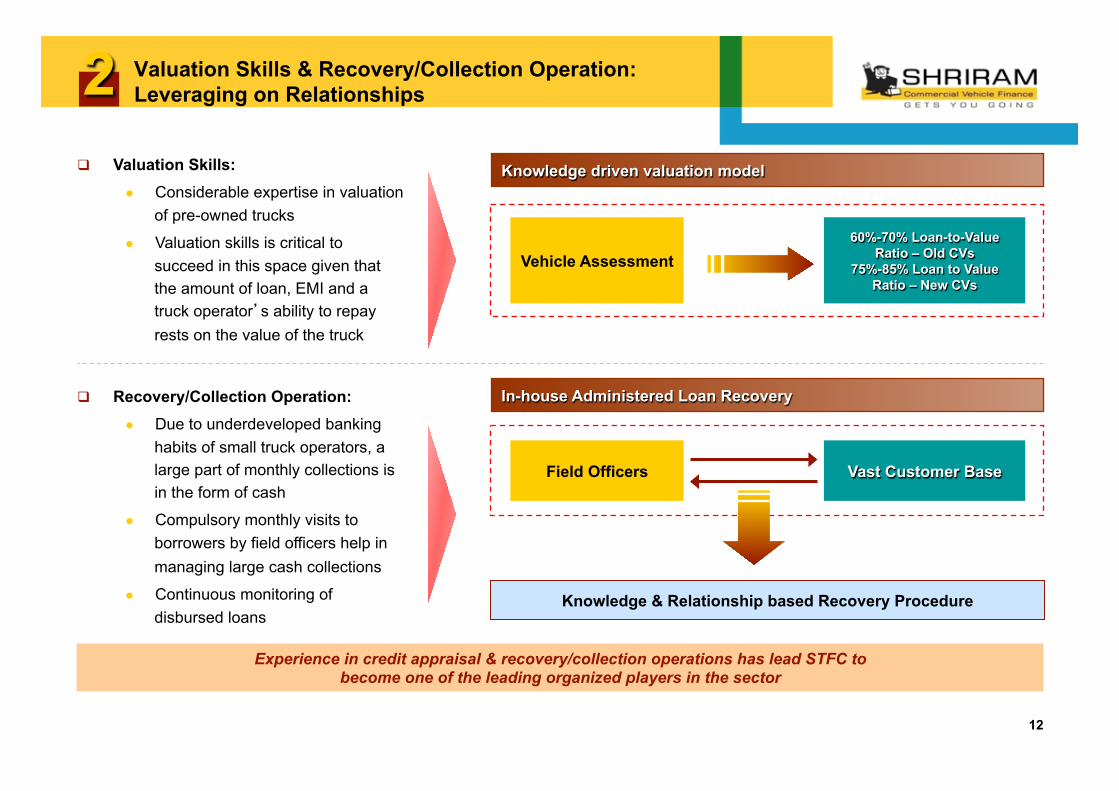
Valuation Skills & Recovery/Collection Operation: Leveraging on Relationships
12
q Valuation Skills: ● Considerable expertise in valuation
of pre-owned trucks
● Valuation skills is critical to succeed in this space given that the amount of loan, EMI and a truck operator’s ability to repay rests on the value of the truck
q Recovery/Collection Operation: ● Due to underdeveloped banking
habits of small truck operators, a large part of monthly collections is in the form of cash
● Compulsory monthly visits to borrowers by field officers help in managing large cash collections
● Continuous monitoring of disbursed loans
Field Officers Vast Customer Base
Knowledge & Relationship based Recovery Procedure
In-house Administered Loan Recovery
2 Knowledge driven valuation model
Experience in credit appraisal & recovery/collection operations has lead STFC to become one of the leading organized players in the sector
Vehicle Assessment 60%-70% Loan-to-Value
Ratio – Old CVs 75%-85% Loan to Value
Ratio – New CVs
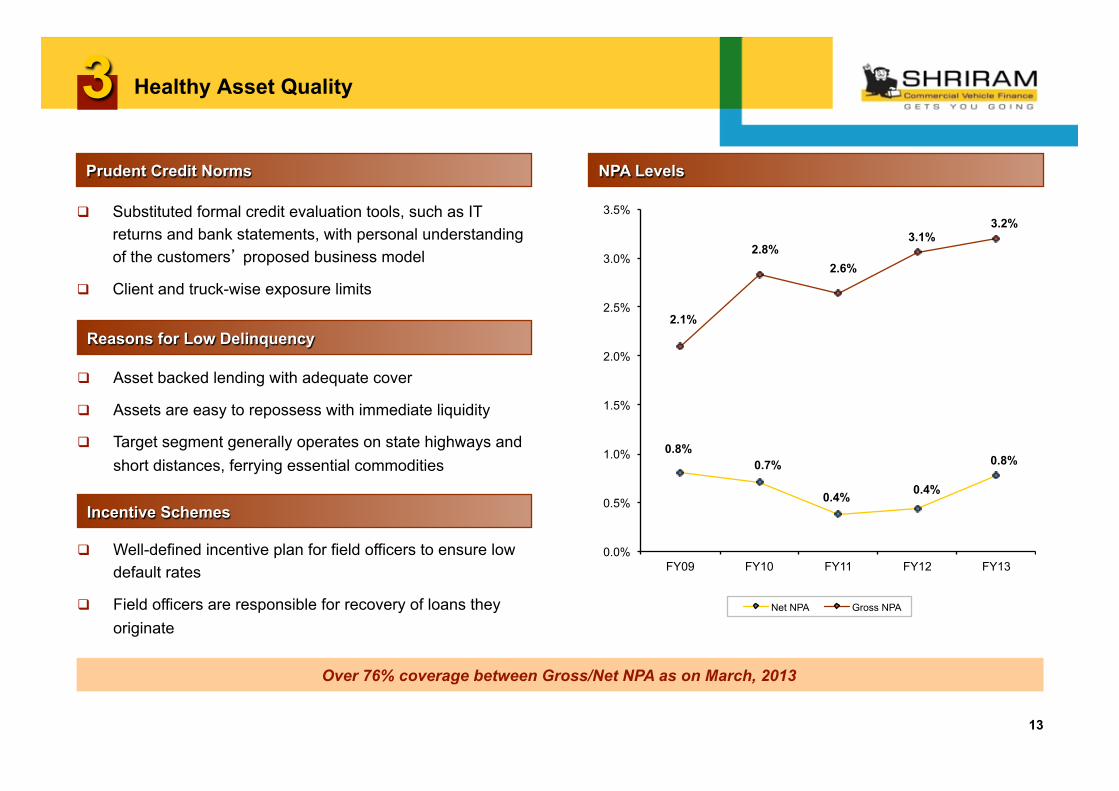
Healthy Asset Quality
q Substituted formal credit evaluation tools, such as IT returns and bank statements, with personal understanding of the customers’ proposed business model
q Client and truck-wise exposure limits
13
Prudent Credit Norms NPA Levels
Reasons for Low Delinquency
q Asset backed lending with adequate cover
q Assets are easy to repossess with immediate liquidity
q Target segment generally operates on state highways and short distances, ferrying essential commodities
0.8% 0.7%
0.4% 0.4%
0.8%
2.1%
2.8% 2.6%
3.1% 3.2%
0.0%
0.5%
1.0%
1.5%
2.0%
2.5%
3.0%
3.5%
FY09 FY10 FY11 FY12 FY13
Net NPA Gross NPA
3
Incentive Schemes
q Well-defined incentive plan for field officers to ensure low default rates
q Field officers are responsible for recovery of loans they originate
Over 76% coverage between Gross/Net NPA as on March, 2013
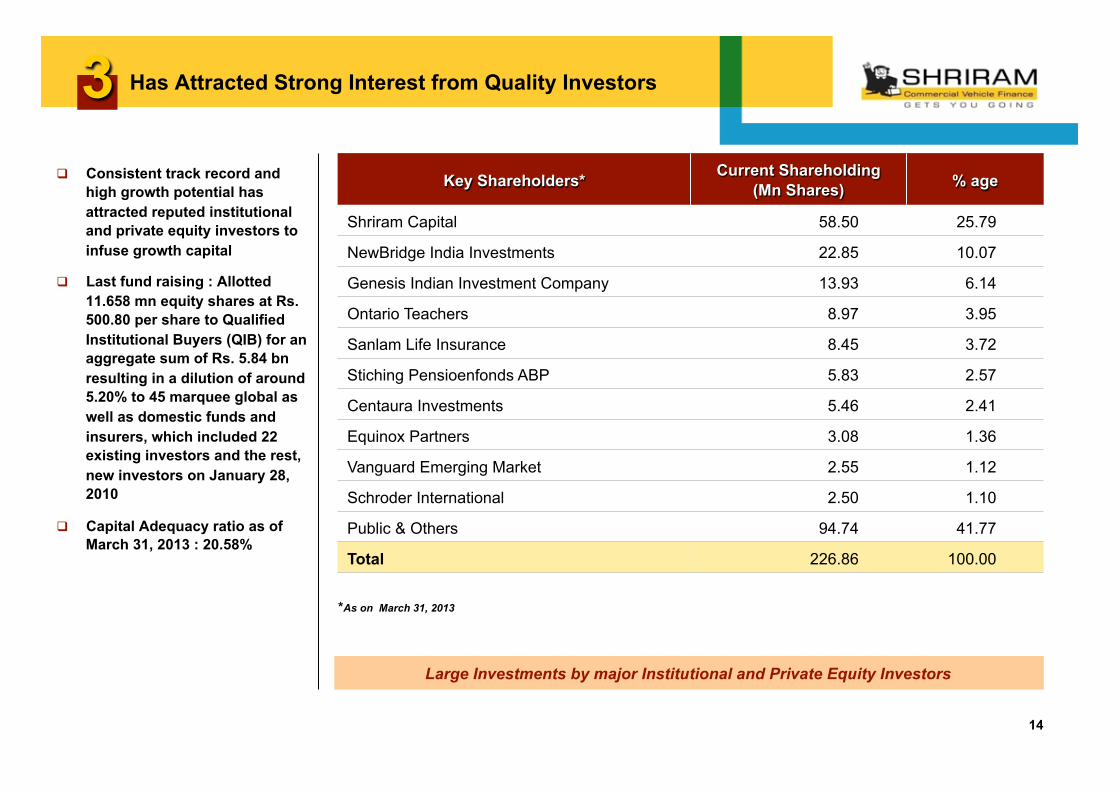
Has Attracted Strong Interest from Quality Investors
q Consistent track record and high growth potential has attracted reputed institutional and private equity investors to infuse growth capital
q Last fund raising : Allotted 11.658 mn equity shares at Rs. 500.80 per share to Qualified Institutional Buyers (QIB) for an aggregate sum of Rs. 5.84 bn resulting in a dilution of around 5.20% to 45 marquee global as well as domestic funds and insurers, which included 22 existing investors and the rest, new investors on January 28, 2010
q Capital Adequacy ratio as of March 31, 2013 : 20.58%
14
Large Investments by major Institutional and Private Equity Investors
Key Shareholders* Current Shareholding (Mn Shares) % age
Shriram Capital 58.50 25.79
NewBridge India Investments 22.85 10.07
Genesis Indian Investment Company 13.93 6.14
Ontario Teachers 8.97 3.95
Sanlam Life Insurance 8.45 3.72
Stiching Pensioenfonds ABP 5.83 2.57
Centaura Investments 5.46 2.41
Equinox Partners 3.08 1.36
Vanguard Emerging Market 2.55 1.12
Schroder International 2.50 1.10
Public & Others 94.74 41.77
Total 226.86 100.00
3
*As on March 31, 2013
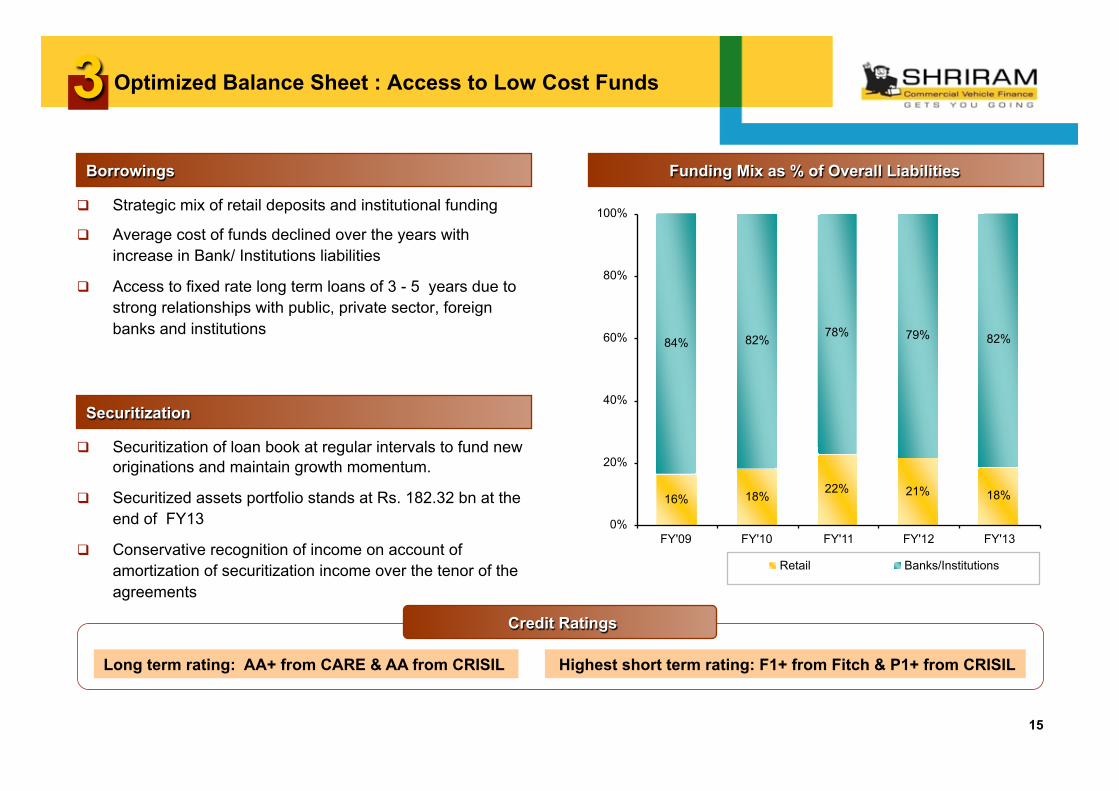
Optimized Balance Sheet : Access to Low Cost Funds
q Strategic mix of retail deposits and institutional funding
q Average cost of funds declined over the years with increase in Bank/ Institutions liabilities
q Access to fixed rate long term loans of 3 - 5 years due to strong relationships with public, private sector, foreign banks and institutions
15
Borrowings
Securitization
q Securitization of loan book at regular intervals to fund new originations and maintain growth momentum.
q Securitized assets portfolio stands at Rs. 182.32 bn at the end of FY13
q Conservative recognition of income on account of amortization of securitization income over the tenor of the agreements
Funding Mix as % of Overall Liabilities
16% 18%22% 21% 18%
84% 82%78% 79% 82%
0%
20%
40%
60%
80%
100%
FY'09 FY'10 FY'11 FY'12 FY'13
Retail Banks/Institutions
Long term rating: AA+ from CARE & AA from CRISIL
Credit Ratings
Highest short term rating: F1+ from Fitch & P1+ from CRISIL
3
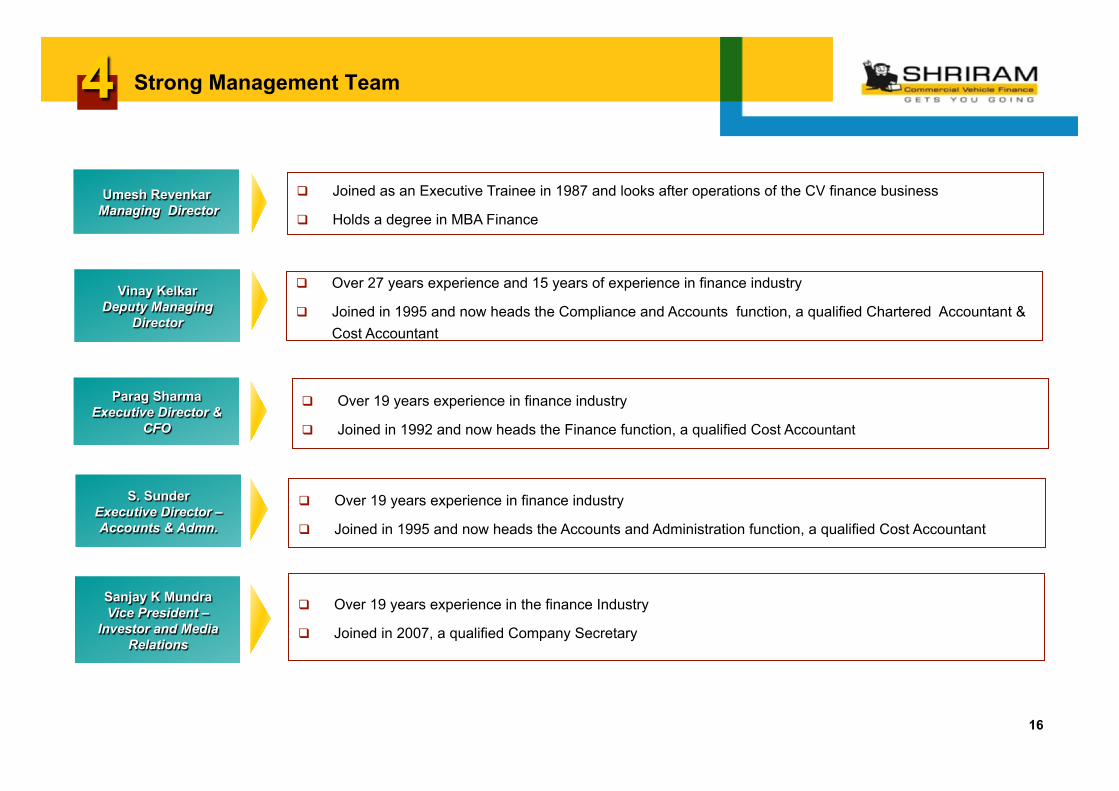
Strong Management Team
16
4 Umesh Revenkar
Managing Director q Joined as an Executive Trainee in 1987 and looks after operations of the CV finance business
q Holds a degree in MBA Finance
Sanjay K Mundra Vice President –
Investor and Media Relations
q Over 19 years experience in the finance Industry
q Joined in 2007, a qualified Company Secretary
Vinay Kelkar Deputy Managing
Director
q Over 27 years experience and 15 years of experience in finance industry
q Joined in 1995 and now heads the Compliance and Accounts function, a qualified Chartered Accountant & Cost Accountant
S. Sunder Executive Director – Accounts & Admn.
q Over 19 years experience in finance industry
q Joined in 1995 and now heads the Accounts and Administration function, a qualified Cost Accountant
Parag Sharma Executive Director &
CFO
q Over 19 years experience in finance industry
q Joined in 1992 and now heads the Finance function, a qualified Cost Accountant
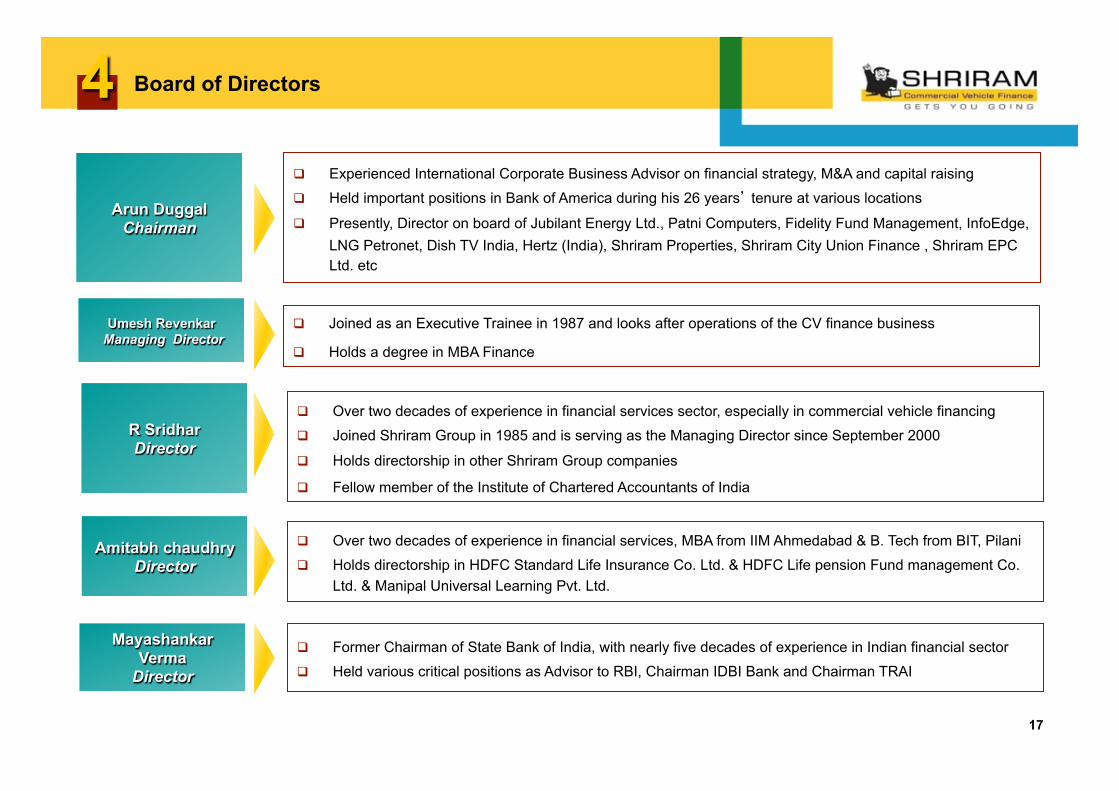
Board of Directors
17
4
Arun Duggal Chairman
q Experienced International Corporate Business Advisor on financial strategy, M&A and capital raising q Held important positions in Bank of America during his 26 years’ tenure at various locations
q Presently, Director on board of Jubilant Energy Ltd., Patni Computers, Fidelity Fund Management, InfoEdge, LNG Petronet, Dish TV India, Hertz (India), Shriram Properties, Shriram City Union Finance , Shriram EPC Ltd. etc
R Sridhar Director
q Over two decades of experience in financial services sector, especially in commercial vehicle financing q Joined Shriram Group in 1985 and is serving as the Managing Director since September 2000
q Holds directorship in other Shriram Group companies
q Fellow member of the Institute of Chartered Accountants of India
Amitabh chaudhry Director
q Over two decades of experience in financial services, MBA from IIM Ahmedabad & B. Tech from BIT, Pilani q Holds directorship in HDFC Standard Life Insurance Co. Ltd. & HDFC Life pension Fund management Co.
Ltd. & Manipal Universal Learning Pvt. Ltd.
Mayashankar Verma
Director
q Former Chairman of State Bank of India, with nearly five decades of experience in Indian financial sector q Held various critical positions as Advisor to RBI, Chairman IDBI Bank and Chairman TRAI
Umesh Revenkar Managing Director
q Joined as an Executive Trainee in 1987 and looks after operations of the CV finance business
q Holds a degree in MBA Finance
Board of Directors (Contd.)
18
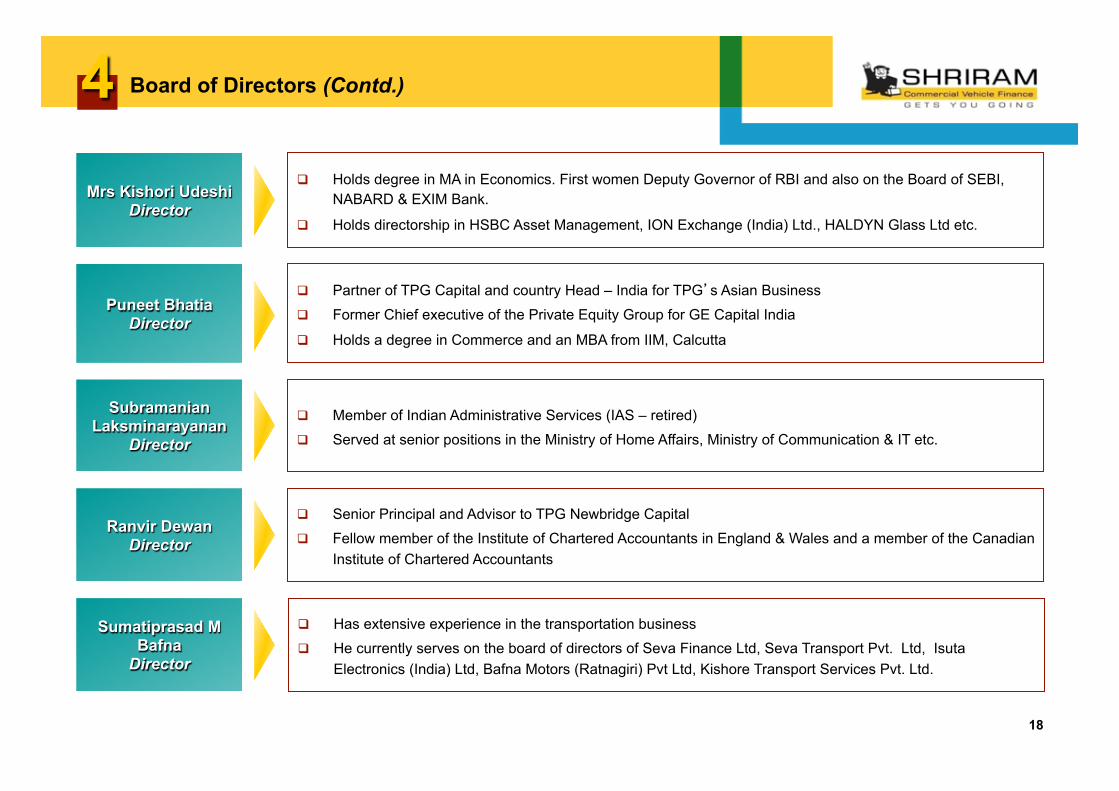
4 Mrs Kishori Udeshi
Director
q Holds degree in MA in Economics. First women Deputy Governor of RBI and also on the Board of SEBI, NABARD & EXIM Bank.
q Holds directorship in HSBC Asset Management, ION Exchange (India) Ltd., HALDYN Glass Ltd etc.
Puneet Bhatia Director
q Partner of TPG Capital and country Head – India for TPG’s Asian Business q Former Chief executive of the Private Equity Group for GE Capital India
q Holds a degree in Commerce and an MBA from IIM, Calcutta
Subramanian Laksminarayanan
Director
q Member of Indian Administrative Services (IAS – retired) q Served at senior positions in the Ministry of Home Affairs, Ministry of Communication & IT etc.
Ranvir Dewan Director
q Senior Principal and Advisor to TPG Newbridge Capital q Fellow member of the Institute of Chartered Accountants in England & Wales and a member of the Canadian
Institute of Chartered Accountants
Sumatiprasad M Bafna
Director
q Has extensive experience in the transportation business q He currently serves on the board of directors of Seva Finance Ltd, Seva Transport Pvt. Ltd, Isuta
Electronics (India) Ltd, Bafna Motors (Ratnagiri) Pvt Ltd, Kishore Transport Services Pvt. Ltd.
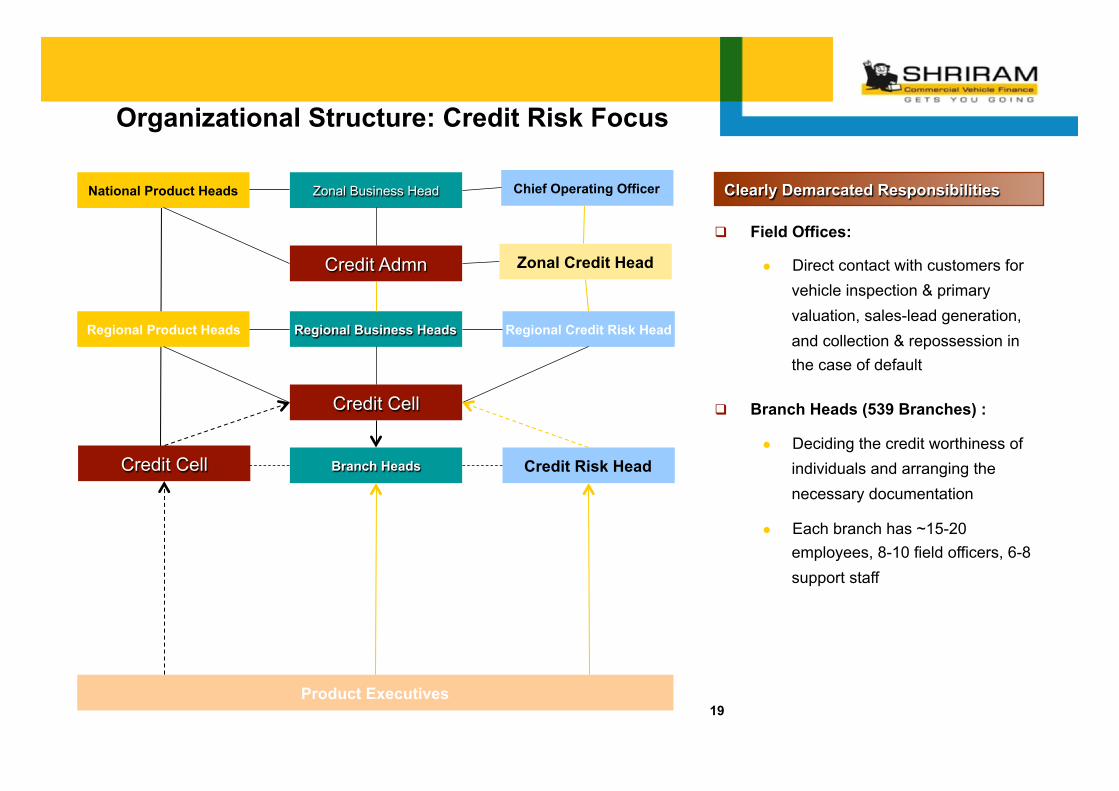
Organizational Structure: Credit Risk Focus
19
National Product Heads Zonal Business Head Chief Operating Officer
Credit Admn
Regional Product Heads Regional Business Heads Regional Credit Risk Head
Credit Cell
Branch Heads Credit Risk Head Credit Cell
Product Executives
Zonal Credit Head
Clearly Demarcated Responsibilities
q Field Offices:
● Direct contact with customers for vehicle inspection & primary valuation, sales-lead generation, and collection & repossession in the case of default
q Branch Heads (539 Branches) :
● Deciding the credit worthiness of individuals and arranging the necessary documentation
● Each branch has ~15-20 employees, 8-10 field officers, 6-8 support staff
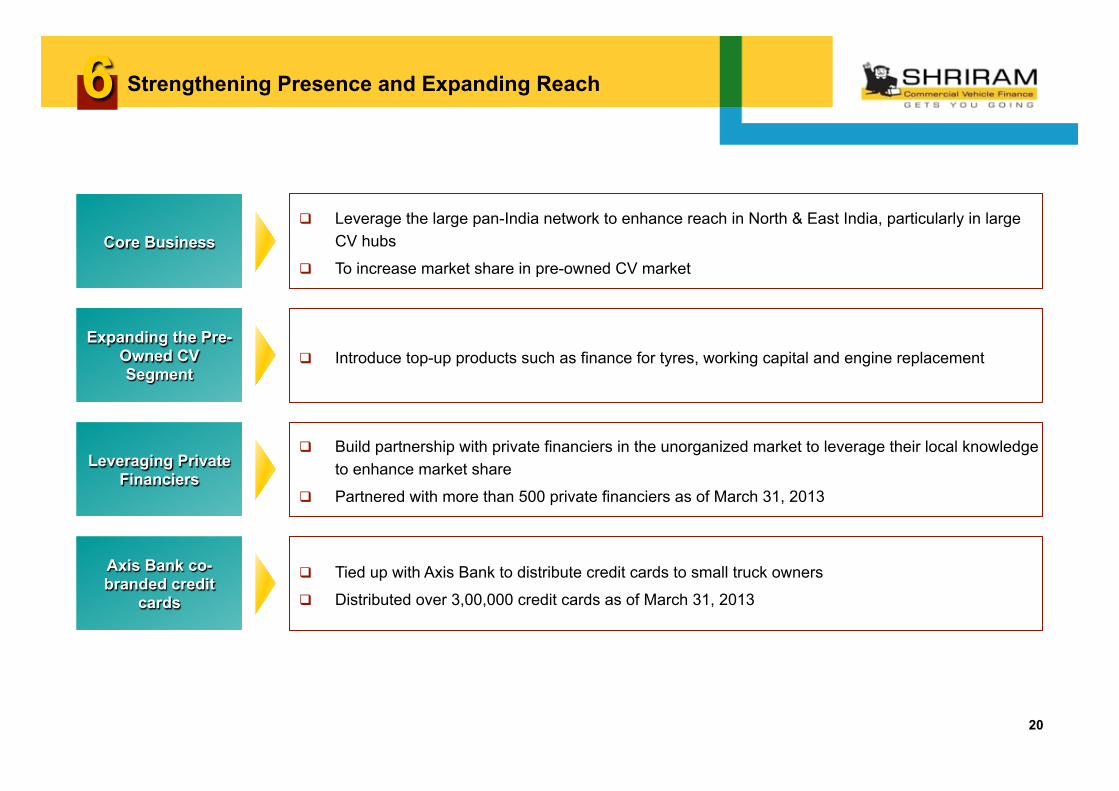
Strengthening Presence and Expanding Reach
20
6
Core Business q Leverage the large pan-India network to enhance reach in North & East India, particularly in large
CV hubs
q To increase market share in pre-owned CV market
Expanding the Pre-Owned CV Segment
q Introduce top-up products such as finance for tyres, working capital and engine replacement
Leveraging Private Financiers
q Build partnership with private financiers in the unorganized market to leverage their local knowledge to enhance market share
q Partnered with more than 500 private financiers as of March 31, 2013
Axis Bank co-branded credit
cards
q Tied up with Axis Bank to distribute credit cards to small truck owners
q Distributed over 3,00,000 credit cards as of March 31, 2013
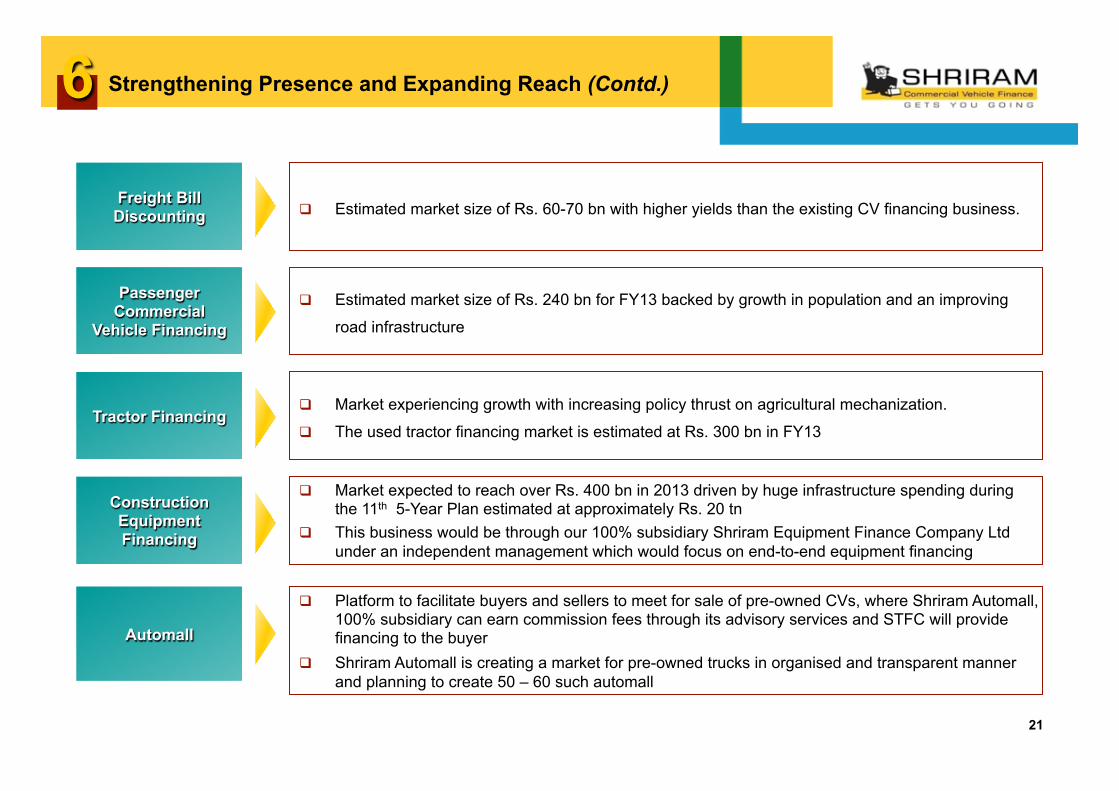
Strengthening Presence and Expanding Reach (Contd.)
21
6
Freight Bill Discounting q Estimated market size of Rs. 60-70 bn with higher yields than the existing CV financing business.
Passenger Commercial
Vehicle Financing
q Estimated market size of Rs. 240 bn for FY13 backed by growth in population and an improving
road infrastructure
Tractor Financing q Market experiencing growth with increasing policy thrust on agricultural mechanization.
q The used tractor financing market is estimated at Rs. 300 bn in FY13
Construction Equipment Financing
q Market expected to reach over Rs. 400 bn in 2013 driven by huge infrastructure spending during the 11th 5-Year Plan estimated at approximately Rs. 20 tn
q This business would be through our 100% subsidiary Shriram Equipment Finance Company Ltd under an independent management which would focus on end-to-end equipment financing
Automall
q Platform to facilitate buyers and sellers to meet for sale of pre-owned CVs, where Shriram Automall, 100% subsidiary can earn commission fees through its advisory services and STFC will provide financing to the buyer
q Shriram Automall is creating a market for pre-owned trucks in organised and transparent manner and planning to create 50 – 60 such automall
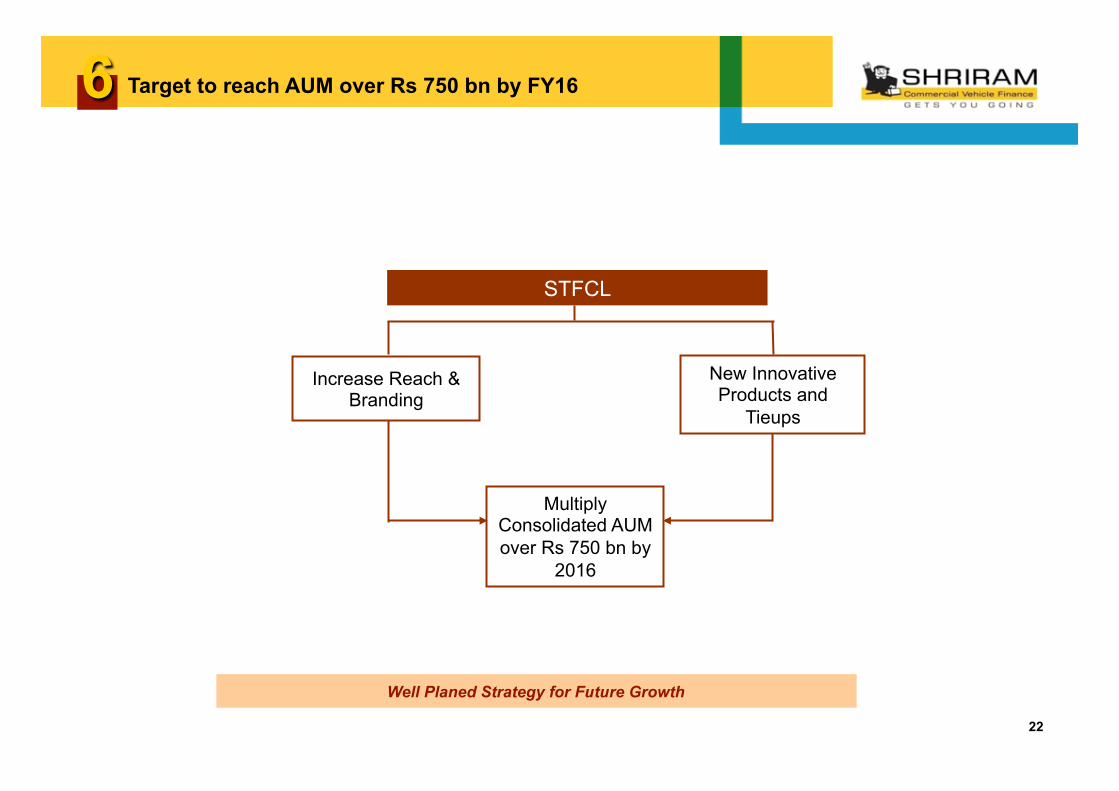
STFCL
Increase Reach & Branding
New Innovative Products and
Tieups
Multiply Consolidated AUM over Rs 750 bn by
2016
Target to reach AUM over Rs 750 bn by FY16 6
Well Planed Strategy for Future Growth
22
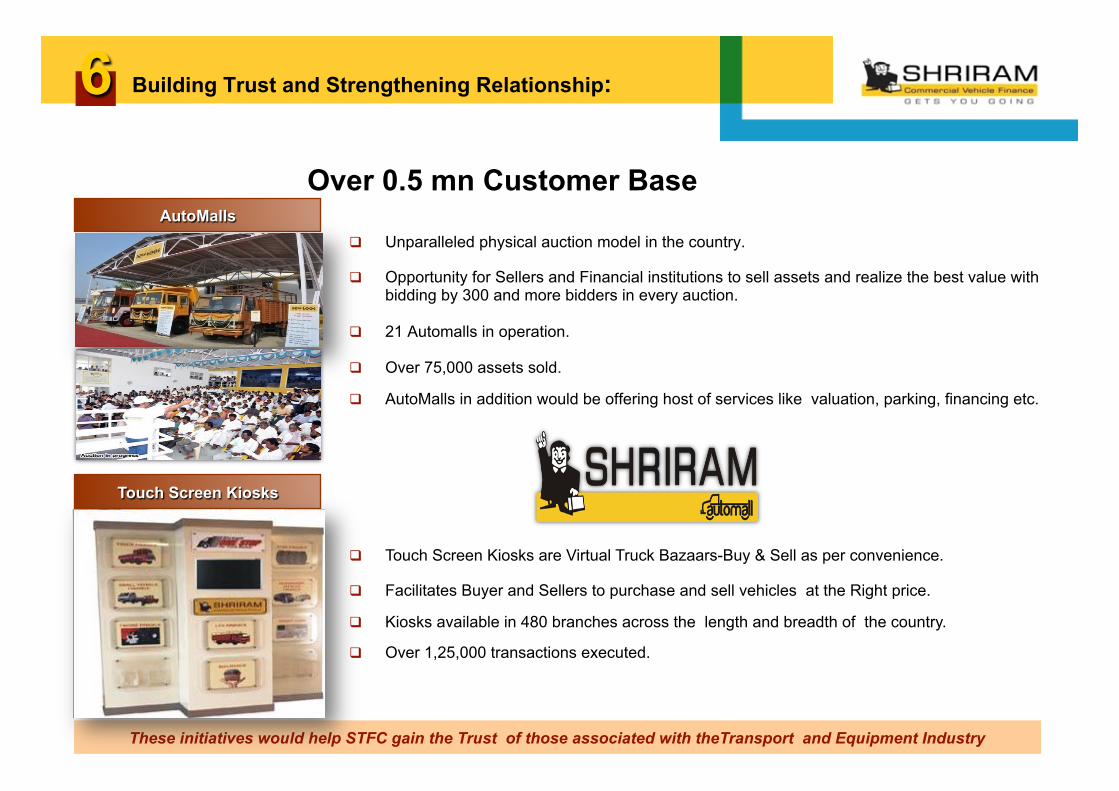
Building Trust and Strengthening Relationship:
q Unparalleled physical auction model in the country.
q Opportunity for Sellers and Financial institutions to sell assets and realize the best value with bidding by 300 and more bidders in every auction.
q 21 Automalls in operation.
q Over 75,000 assets sold.
q AutoMalls in addition would be offering host of services like valuation, parking, financing etc.
23
q Touch Screen Kiosks are Virtual Truck Bazaars-Buy & Sell as per convenience.
q Facilitates Buyer and Sellers to purchase and sell vehicles at the Right price.
q Kiosks available in 480 branches across the length and breadth of the country.
q Over 1,25,000 transactions executed.
AutoMalls
Touch Screen Kiosks
These initiatives would help STFC gain the Trust of those associated with theTransport and Equipment Industry
6
Over 0.5 mn Customer Base
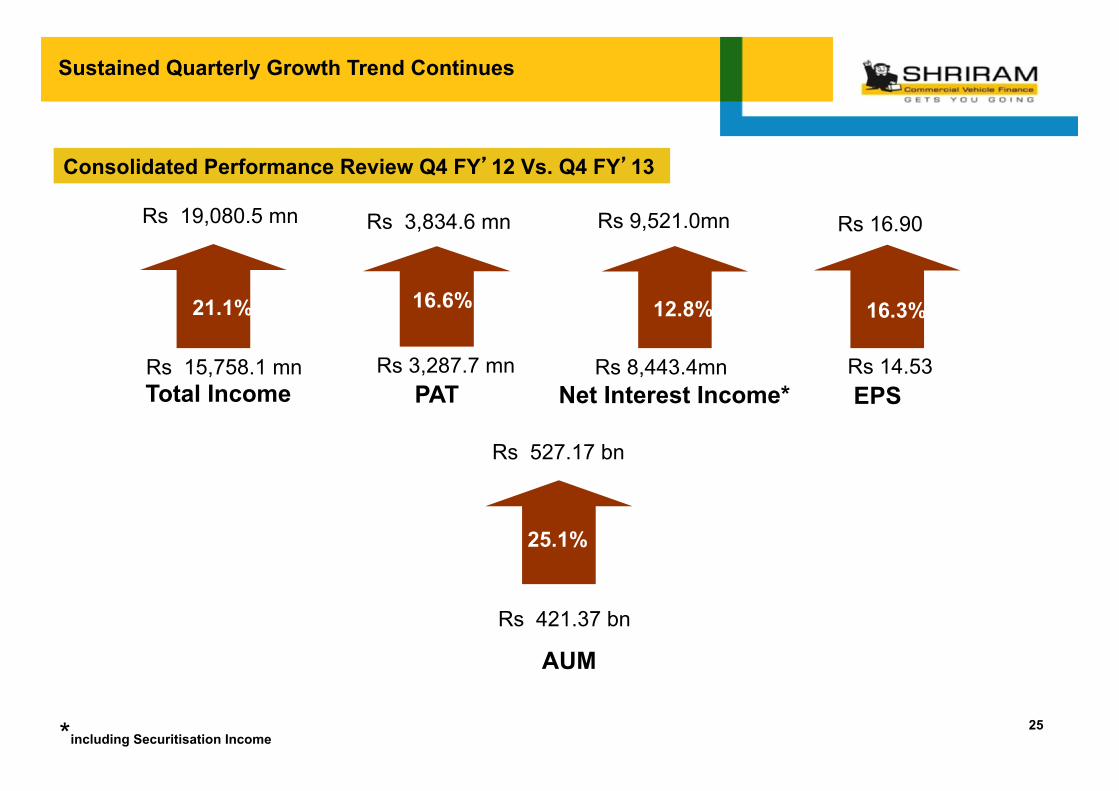
Sustained Quarterly Growth Trend Continues
Consolidated Performance Review Q4 FY’12 Vs. Q4 FY’13
Total Income Net Interest Income* EPS
21.1%
Rs 19,080.5 mn Rs 9,521.0mn
16.3%
Rs 16.90
Rs 15,758.1 mn Rs 8,443.4mn Rs 14.53
*including Securitisation Income
Rs 3,834.6 mn
PAT
12.8%
Rs 3,287.7 mn
16.6%
25
Rs 527.17 bn
Rs 421.37 bn
AUM
25.1% 72.6%
Sustained Quarterly Growth Trend Continues
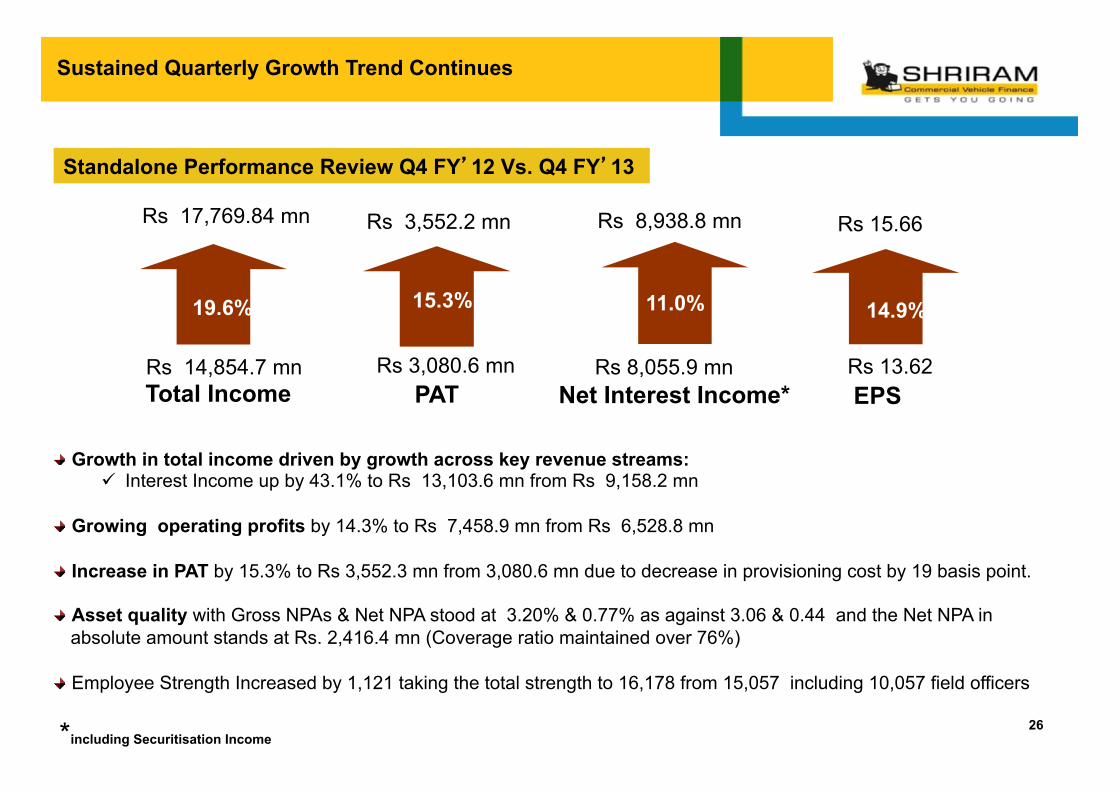
" Growth in total income driven by growth across key revenue streams: ü Interest Income up by 43.1% to Rs 13,103.6 mn from Rs 9,158.2 mn
" Growing operating profits by 14.3% to Rs 7,458.9 mn from Rs 6,528.8 mn " Increase in PAT by 15.3% to Rs 3,552.3 mn from 3,080.6 mn due to decrease in provisioning cost by 19 basis point.
" Asset quality with Gross NPAs & Net NPA stood at 3.20% & 0.77% as against 3.06 & 0.44 and the Net NPA in absolute amount stands at Rs. 2,416.4 mn (Coverage ratio maintained over 76%)
" Employee Strength Increased by 1,121 taking the total strength to 16,178 from 15,057 including 10,057 field officers
Standalone Performance Review Q4 FY’12 Vs. Q4 FY’13
Total Income Net Interest Income* EPS
19.6%
Rs 17,769.84 mn Rs 8,938.8 mn
14.9%
Rs 15.66
Rs 14,854.7 mn Rs 8,055.9 mn Rs 13.62
*including Securitisation Income
Rs 3,552.2 mn
PAT
11.0%
Rs 3,080.6 mn
15.3%
26
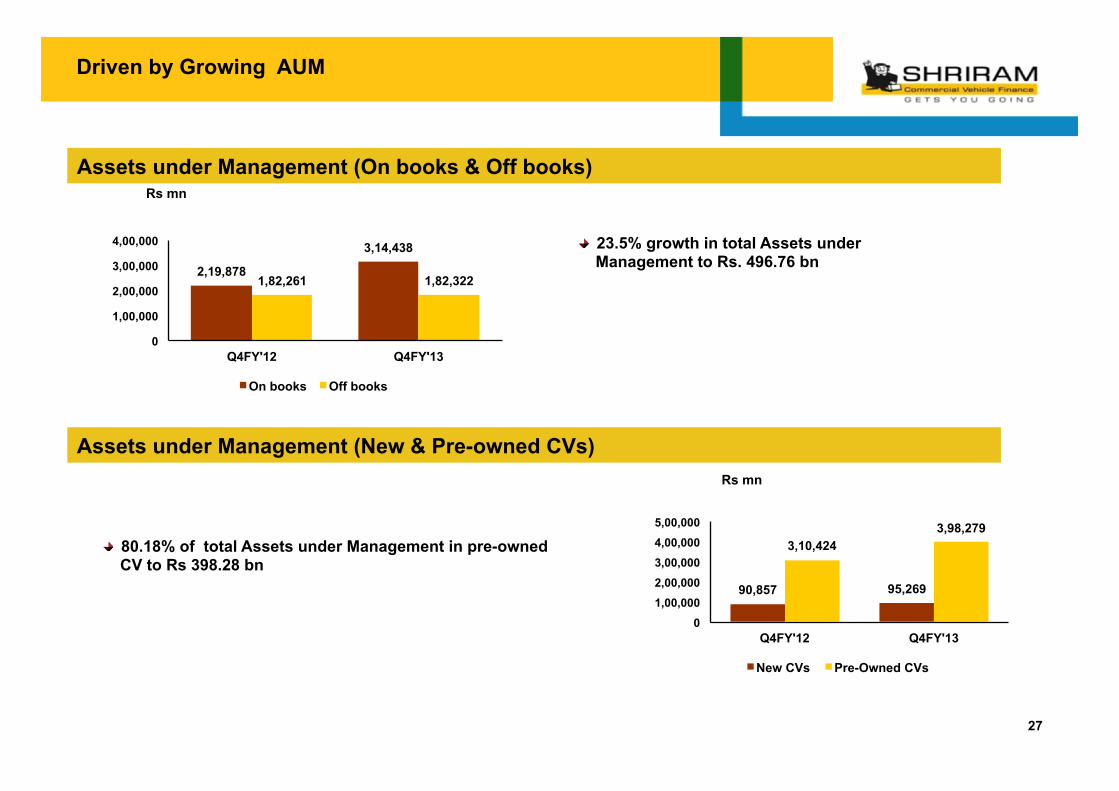
Driven by Growing AUM
Assets under Management (On books & Off books)
" 23.5% growth in total Assets under Management to Rs. 496.76 bn
Assets under Management (New & Pre-owned CVs)
" 80.18% of total Assets under Management in pre-owned CV to Rs 398.28 bn
2,19,878
3,14,438
1,82,261 1,82,322
0
1,00,000
2,00,000
3,00,000
4,00,000
Q4FY'12 Q4FY'13
On books Off books
Rs mn
90,857 95,269
3,10,424 3,98,279
0
1,00,000
2,00,000
3,00,000
4,00,000
5,00,000
Q4FY'12 Q4FY'13
New CVs Pre-Owned CVs
Rs mn
27
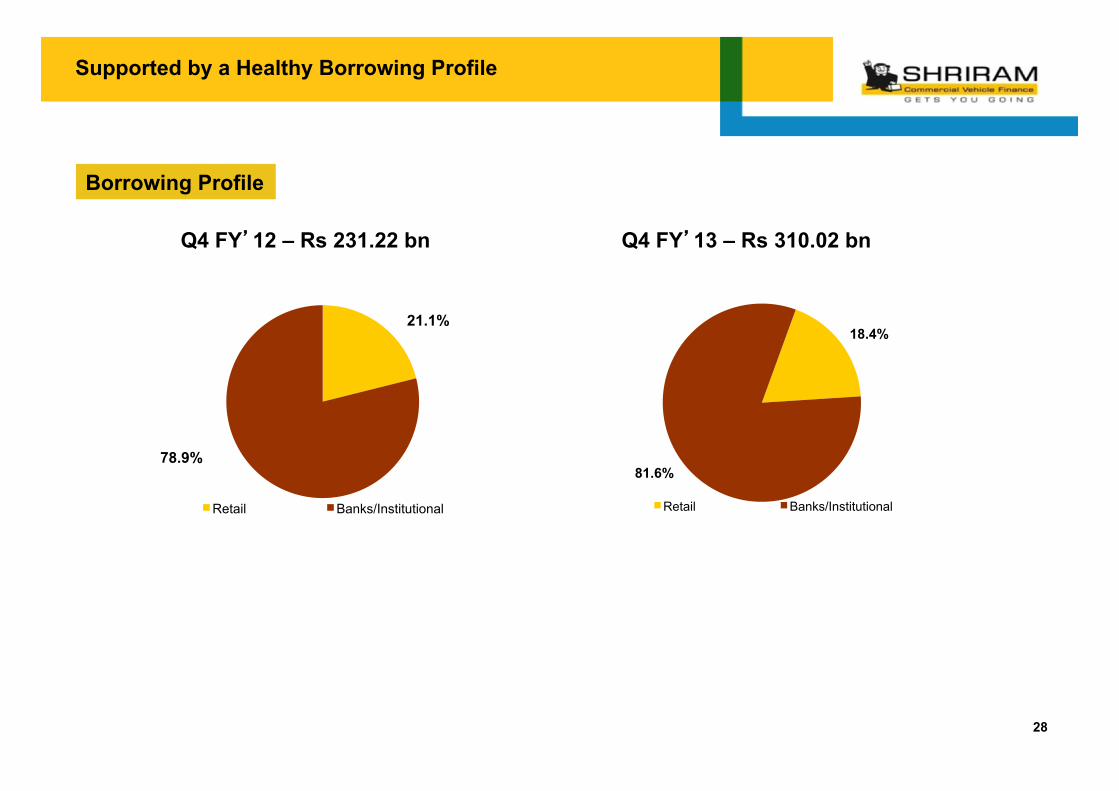
Supported by a Healthy Borrowing Profile
Borrowing Profile
Q4 FY’12 – Rs 231.22 bn Q4 FY’13 – Rs 310.02 bn
21.1%
78.9%
Retail Banks/Institutional
18.4%
81.6%
Retail Banks/Institutional
28
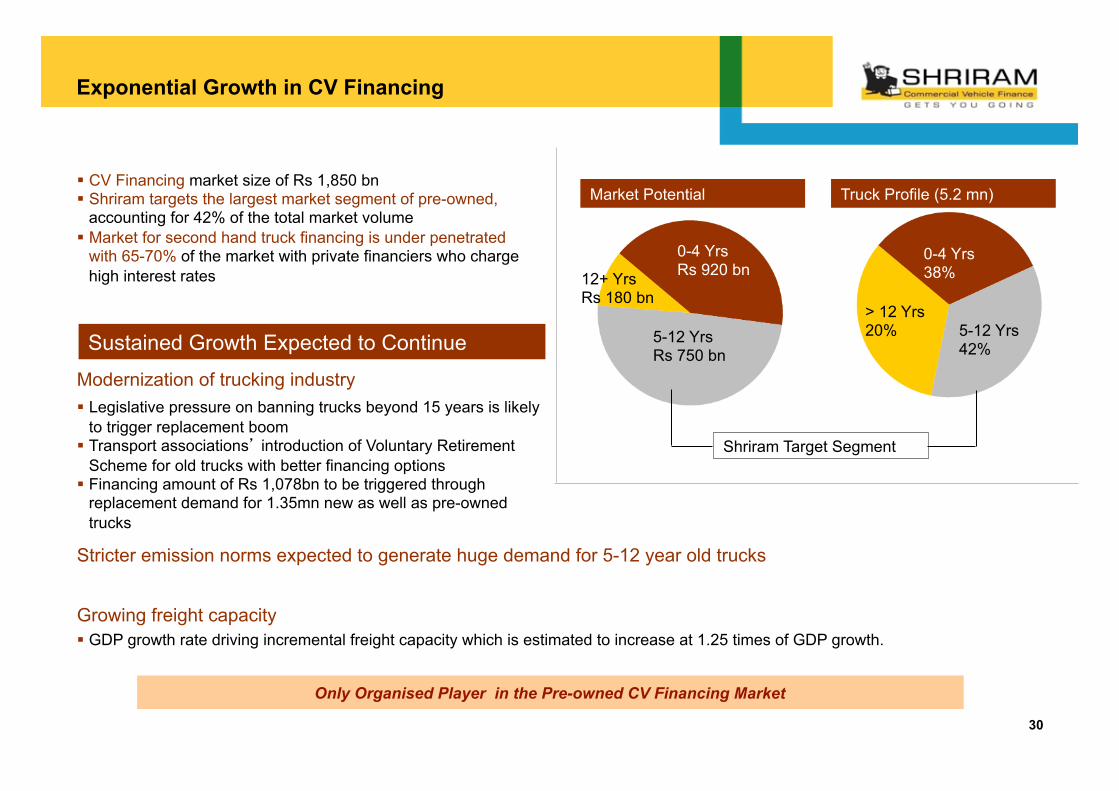
Modernization of trucking industry § Legislative pressure on banning trucks beyond 15 years is likely
to trigger replacement boom § Transport associations’ introduction of Voluntary Retirement
Scheme for old trucks with better financing options § Financing amount of Rs 1,078bn to be triggered through
replacement demand for 1.35mn new as well as pre-owned trucks
Sustained Growth Expected to Continue
§ CV Financing market size of Rs 1,850 bn § Shriram targets the largest market segment of pre-owned,
accounting for 42% of the total market volume § Market for second hand truck financing is under penetrated
with 65-70% of the market with private financiers who charge high interest rates
Shriram Target Segment
Market Potential
12+ Yrs Rs 180 bn
5-12 Yrs Rs 750 bn
0-4 Yrs Rs 920 bn
Truck Profile (5.2 mn)
0-4 Yrs 38%
5-12 Yrs 42%
> 12 Yrs 20%
Stricter emission norms expected to generate huge demand for 5-12 year old trucks Growing freight capacity § GDP growth rate driving incremental freight capacity which is estimated to increase at 1.25 times of GDP growth.
Exponential Growth in CV Financing
Only Organised Player in the Pre-owned CV Financing Market
30
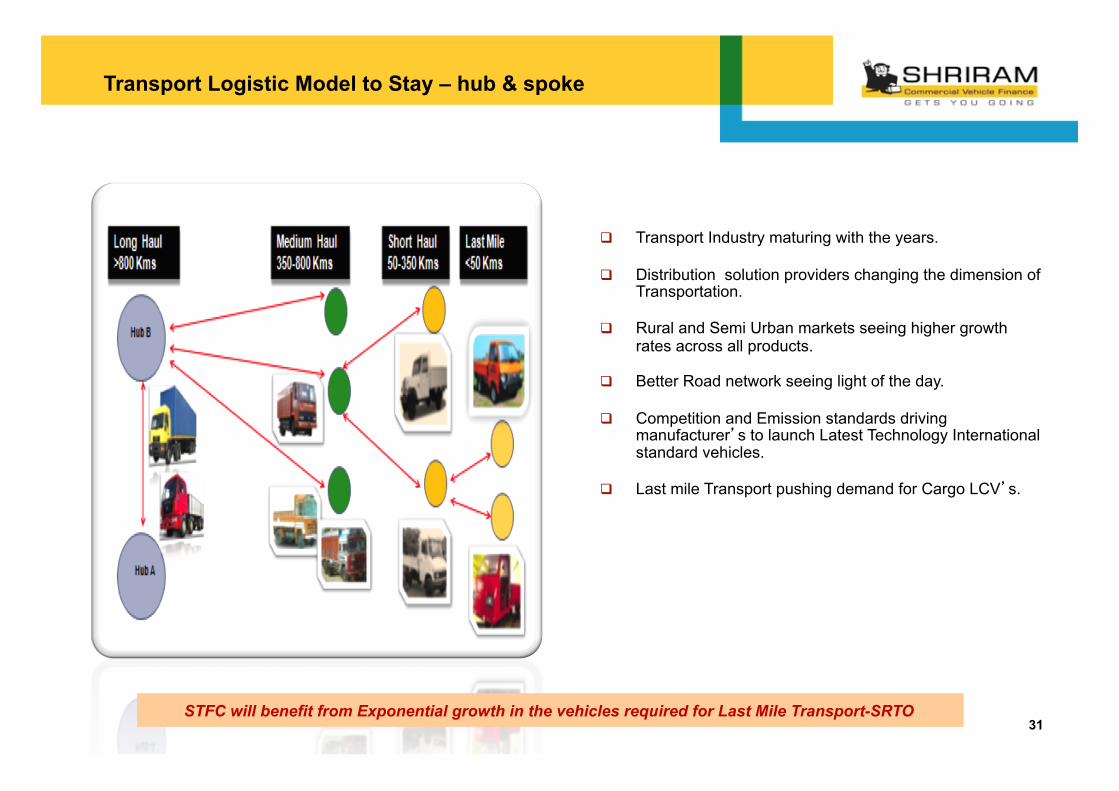
Transport Logistic Model to Stay – hub & spoke
STFC will benefit from Exponential growth in the vehicles required for Last Mile Transport-SRTO
q Transport Industry maturing with the years.
q Distribution solution providers changing the dimension of Transportation.
q Rural and Semi Urban markets seeing higher growth rates across all products.
q Better Road network seeing light of the day.
q Competition and Emission standards driving manufacturer’s to launch Latest Technology International standard vehicles.
q Last mile Transport pushing demand for Cargo LCV’s.
31
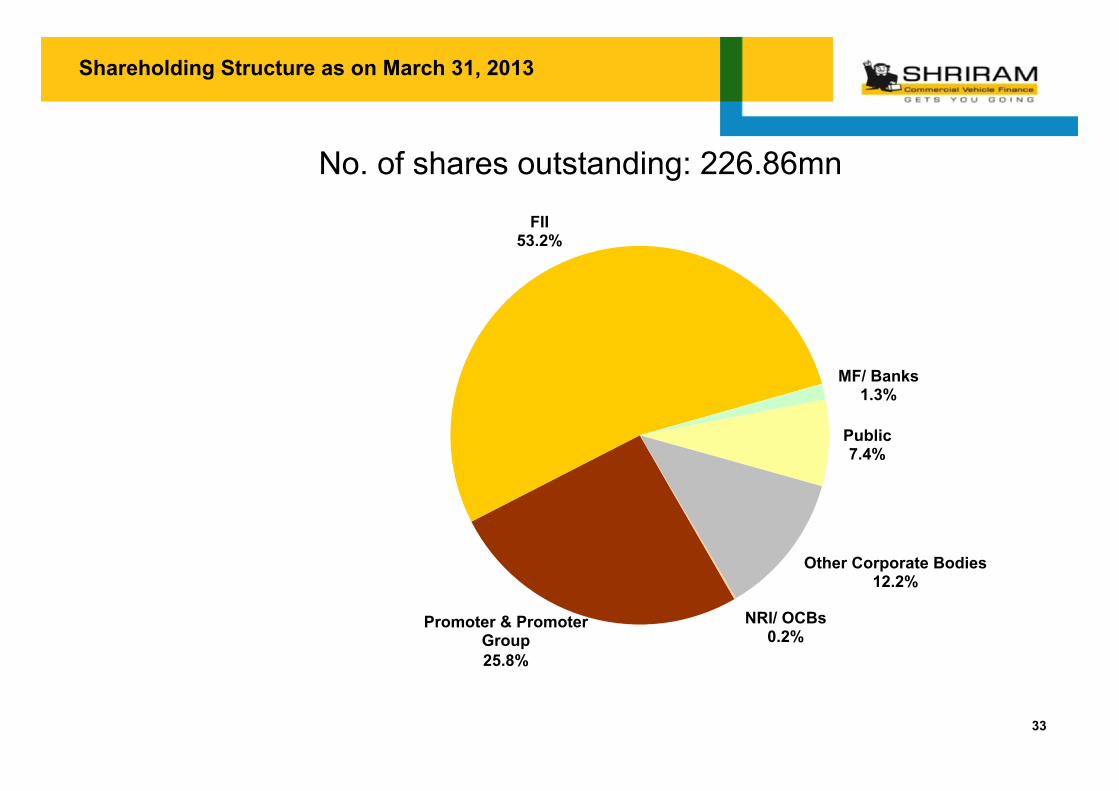
Shareholding Structure as on March 31, 2013
No. of shares outstanding: 226.86mn
Promoter & Promoter Group 25.8%
FII 53.2%
MF/ Banks 1.3%
Public 7.4%
Other Corporate Bodies 12.2%
NRI/ OCBs 0.2%
33
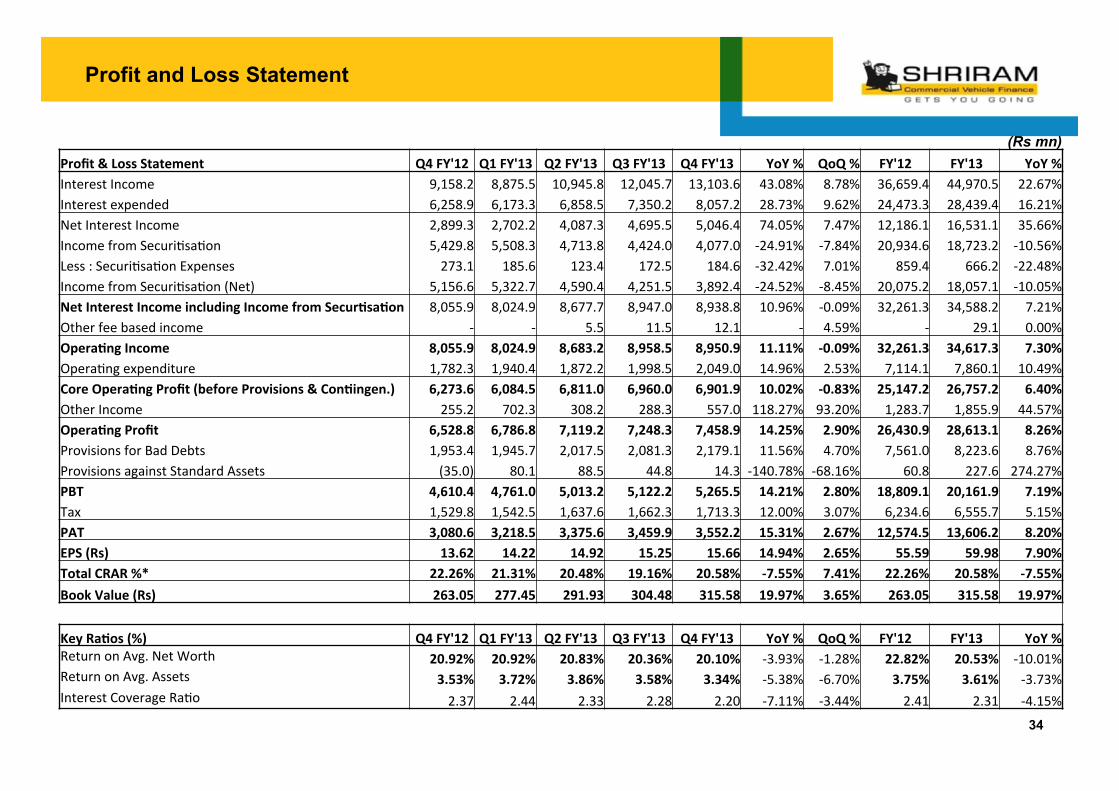
Profit and Loss Statement
34
(Rs mn) Profit & Loss Statement Q4 FY'12 Q1 FY'13 Q2 FY'13 Q3 FY'13 Q4 FY'13 YoY % QoQ % FY'12 FY'13 YoY % Interest Income 9,158.2 8,875.5 10,945.8 12,045.7 13,103.6 43.08% 8.78% 36,659.4 44,970.5 22.67% Interest expended 6,258.9 6,173.3 6,858.5 7,350.2 8,057.2 28.73% 9.62% 24,473.3 28,439.4 16.21% Net Interest Income 2,899.3 2,702.2 4,087.3 4,695.5 5,046.4 74.05% 7.47% 12,186.1 16,531.1 35.66% Income from Securi@sa@on 5,429.8 5,508.3 4,713.8 4,424.0 4,077.0 -‐24.91% -‐7.84% 20,934.6 18,723.2 -‐10.56% Less : Securi@sa@on Expenses 273.1 185.6 123.4 172.5 184.6 -‐32.42% 7.01% 859.4 666.2 -‐22.48% Income from Securi@sa@on (Net) 5,156.6 5,322.7 4,590.4 4,251.5 3,892.4 -‐24.52% -‐8.45% 20,075.2 18,057.1 -‐10.05% Net Interest Income including Income from SecurAsaAon 8,055.9 8,024.9 8,677.7 8,947.0 8,938.8 10.96% -‐0.09% 32,261.3 34,588.2 7.21% Other fee based income -‐ -‐ 5.5 11.5 12.1 -‐ 4.59% -‐ 29.1 0.00% OperaAng Income 8,055.9 8,024.9 8,683.2 8,958.5 8,950.9 11.11% -‐0.09% 32,261.3 34,617.3 7.30% Opera@ng expenditure 1,782.3 1,940.4 1,872.2 1,998.5 2,049.0 14.96% 2.53% 7,114.1 7,860.1 10.49% Core OperaAng Profit (before Provisions & ConAingen.) 6,273.6 6,084.5 6,811.0 6,960.0 6,901.9 10.02% -‐0.83% 25,147.2 26,757.2 6.40% Other Income 255.2 702.3 308.2 288.3 557.0 118.27% 93.20% 1,283.7 1,855.9 44.57% OperaAng Profit 6,528.8 6,786.8 7,119.2 7,248.3 7,458.9 14.25% 2.90% 26,430.9 28,613.1 8.26% Provisions for Bad Debts 1,953.4 1,945.7 2,017.5 2,081.3 2,179.1 11.56% 4.70% 7,561.0 8,223.6 8.76% Provisions against Standard Assets (35.0) 80.1 88.5 44.8 14.3 -‐140.78% -‐68.16% 60.8 227.6 274.27% PBT 4,610.4 4,761.0 5,013.2 5,122.2 5,265.5 14.21% 2.80% 18,809.1 20,161.9 7.19% Tax 1,529.8 1,542.5 1,637.6 1,662.3 1,713.3 12.00% 3.07% 6,234.6 6,555.7 5.15% PAT 3,080.6 3,218.5 3,375.6 3,459.9 3,552.2 15.31% 2.67% 12,574.5 13,606.2 8.20% EPS (Rs) 13.62 14.22 14.92 15.25 15.66 14.94% 2.65% 55.59 59.98 7.90% Total CRAR %* 22.26% 21.31% 20.48% 19.16% 20.58% -‐7.55% 7.41% 22.26% 20.58% -‐7.55% Book Value (Rs) 263.05 277.45 291.93 304.48 315.58 19.97% 3.65% 263.05 315.58 19.97%
Key RaAos (%) Q4 FY'12 Q1 FY'13 Q2 FY'13 Q3 FY'13 Q4 FY'13 YoY % QoQ % FY'12 FY'13 YoY % Return on Avg. Net Worth 20.92% 20.92% 20.83% 20.36% 20.10% -‐3.93% -‐1.28% 22.82% 20.53% -‐10.01% Return on Avg. Assets 3.53% 3.72% 3.86% 3.58% 3.34% -‐5.38% -‐6.70% 3.75% 3.61% -‐3.73% Interest Coverage Ra@o 2.37 2.44 2.33 2.28 2.20 -‐7.11% -‐3.44% 2.41 2.31 -‐4.15%
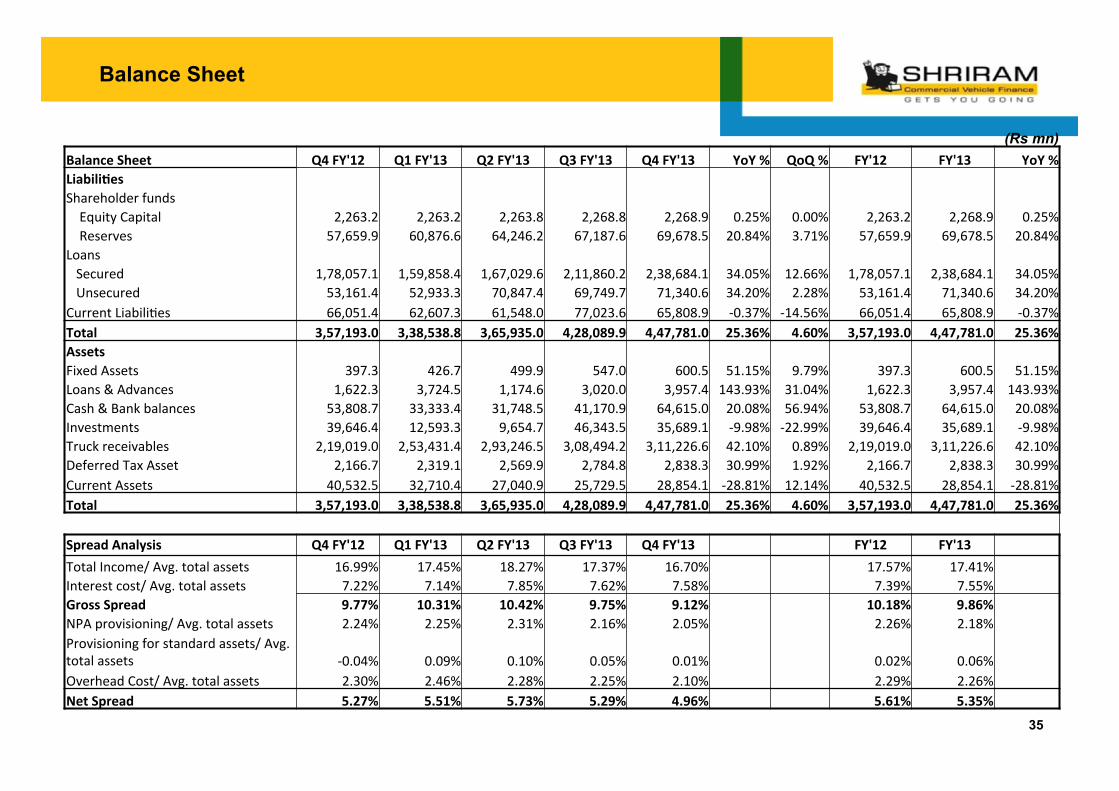
Balance Sheet
35
(Rs mn) Balance Sheet Q4 FY'12 Q1 FY'13 Q2 FY'13 Q3 FY'13 Q4 FY'13 YoY % QoQ % FY'12 FY'13 YoY % LiabiliAes Shareholder funds Equity Capital 2,263.2 2,263.2 2,263.8 2,268.8 2,268.9 0.25% 0.00% 2,263.2 2,268.9 0.25% Reserves 57,659.9 60,876.6 64,246.2 67,187.6 69,678.5 20.84% 3.71% 57,659.9 69,678.5 20.84% Loans Secured 1,78,057.1 1,59,858.4 1,67,029.6 2,11,860.2 2,38,684.1 34.05% 12.66% 1,78,057.1 2,38,684.1 34.05% Unsecured 53,161.4 52,933.3 70,847.4 69,749.7 71,340.6 34.20% 2.28% 53,161.4 71,340.6 34.20% Current Liabili@es 66,051.4 62,607.3 61,548.0 77,023.6 65,808.9 -‐0.37% -‐14.56% 66,051.4 65,808.9 -‐0.37% Total 3,57,193.0 3,38,538.8 3,65,935.0 4,28,089.9 4,47,781.0 25.36% 4.60% 3,57,193.0 4,47,781.0 25.36% Assets Fixed Assets 397.3 426.7 499.9 547.0 600.5 51.15% 9.79% 397.3 600.5 51.15% Loans & Advances 1,622.3 3,724.5 1,174.6 3,020.0 3,957.4 143.93% 31.04% 1,622.3 3,957.4 143.93% Cash & Bank balances 53,808.7 33,333.4 31,748.5 41,170.9 64,615.0 20.08% 56.94% 53,808.7 64,615.0 20.08% Investments 39,646.4 12,593.3 9,654.7 46,343.5 35,689.1 -‐9.98% -‐22.99% 39,646.4 35,689.1 -‐9.98% Truck receivables 2,19,019.0 2,53,431.4 2,93,246.5 3,08,494.2 3,11,226.6 42.10% 0.89% 2,19,019.0 3,11,226.6 42.10% Deferred Tax Asset 2,166.7 2,319.1 2,569.9 2,784.8 2,838.3 30.99% 1.92% 2,166.7 2,838.3 30.99% Current Assets 40,532.5 32,710.4 27,040.9 25,729.5 28,854.1 -‐28.81% 12.14% 40,532.5 28,854.1 -‐28.81% Total 3,57,193.0 3,38,538.8 3,65,935.0 4,28,089.9 4,47,781.0 25.36% 4.60% 3,57,193.0 4,47,781.0 25.36%
Spread Analysis Q4 FY'12 Q1 FY'13 Q2 FY'13 Q3 FY'13 Q4 FY'13 FY'12 FY'13 Total Income/ Avg. total assets 16.99% 17.45% 18.27% 17.37% 16.70% 17.57% 17.41% Interest cost/ Avg. total assets 7.22% 7.14% 7.85% 7.62% 7.58% 7.39% 7.55% Gross Spread 9.77% 10.31% 10.42% 9.75% 9.12% 10.18% 9.86% NPA provisioning/ Avg. total assets 2.24% 2.25% 2.31% 2.16% 2.05% 2.26% 2.18% Provisioning for standard assets/ Avg. total assets -‐0.04% 0.09% 0.10% 0.05% 0.01% 0.02% 0.06% Overhead Cost/ Avg. total assets 2.30% 2.46% 2.28% 2.25% 2.10% 2.29% 2.26% Net Spread 5.27% 5.51% 5.73% 5.29% 4.96% 5.61% 5.35%
36
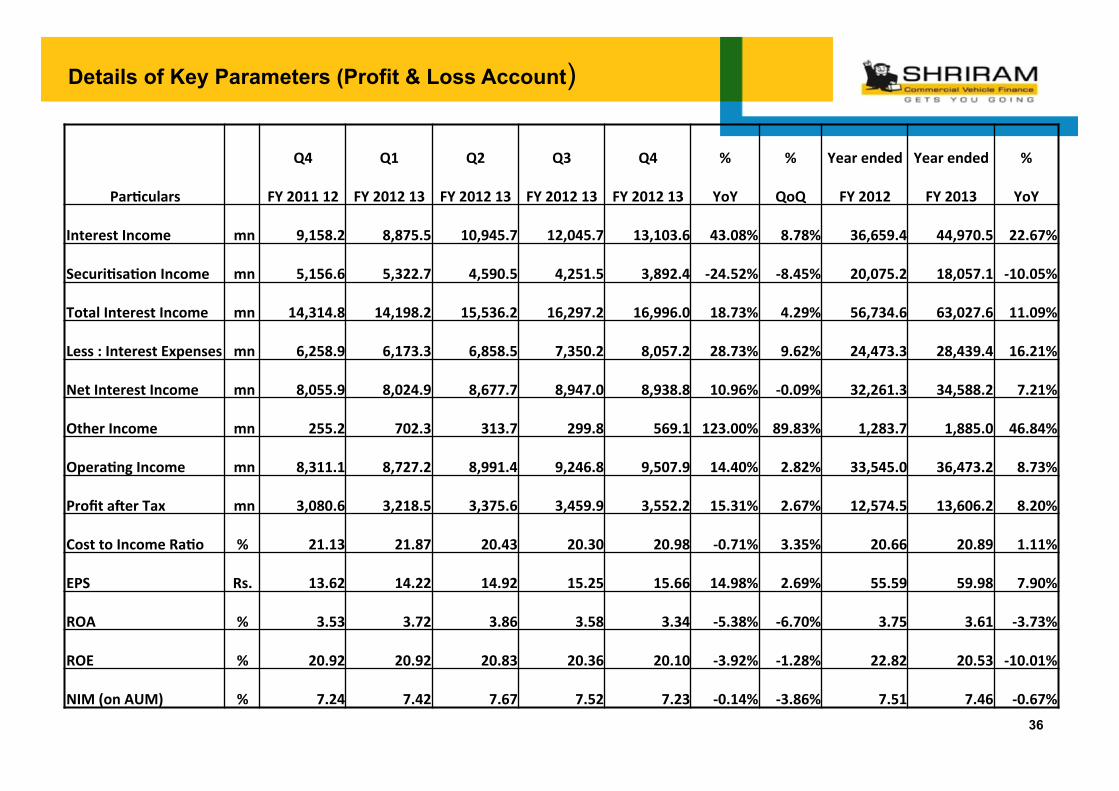
Details of Key Parameters (Profit & Loss Account)
ParAculars
Q4 Q1 Q2 Q3 Q4 % % Year ended Year ended %
FY 2011 12 FY 2012 13 FY 2012 13 FY 2012 13 FY 2012 13 YoY QoQ FY 2012 FY 2013 YoY
Interest Income mn 9,158.2 8,875.5 10,945.7 12,045.7 13,103.6 43.08% 8.78% 36,659.4 44,970.5 22.67%
SecuriAsaAon Income mn 5,156.6 5,322.7 4,590.5 4,251.5 3,892.4 -‐24.52% -‐8.45% 20,075.2 18,057.1 -‐10.05%
Total Interest Income mn 14,314.8 14,198.2 15,536.2 16,297.2 16,996.0 18.73% 4.29% 56,734.6 63,027.6 11.09%
Less : Interest Expenses mn 6,258.9 6,173.3 6,858.5 7,350.2 8,057.2 28.73% 9.62% 24,473.3 28,439.4 16.21%
Net Interest Income mn 8,055.9 8,024.9 8,677.7 8,947.0 8,938.8 10.96% -‐0.09% 32,261.3 34,588.2 7.21%
Other Income mn 255.2 702.3 313.7 299.8 569.1 123.00% 89.83% 1,283.7 1,885.0 46.84%
OperaAng Income mn 8,311.1 8,727.2 8,991.4 9,246.8 9,507.9 14.40% 2.82% 33,545.0 36,473.2 8.73%
Profit a`er Tax mn 3,080.6 3,218.5 3,375.6 3,459.9 3,552.2 15.31% 2.67% 12,574.5 13,606.2 8.20%
Cost to Income RaAo % 21.13 21.87 20.43 20.30 20.98 -‐0.71% 3.35% 20.66 20.89 1.11%
EPS Rs. 13.62 14.22 14.92 15.25 15.66 14.98% 2.69% 55.59 59.98 7.90%
ROA % 3.53 3.72 3.86 3.58 3.34 -‐5.38% -‐6.70% 3.75 3.61 -‐3.73%
ROE % 20.92 20.92 20.83 20.36 20.10 -‐3.92% -‐1.28% 22.82 20.53 -‐10.01%
NIM (on AUM) % 7.24 7.42 7.67 7.52 7.23 -‐0.14% -‐3.86% 7.51 7.46 -‐0.67%
37
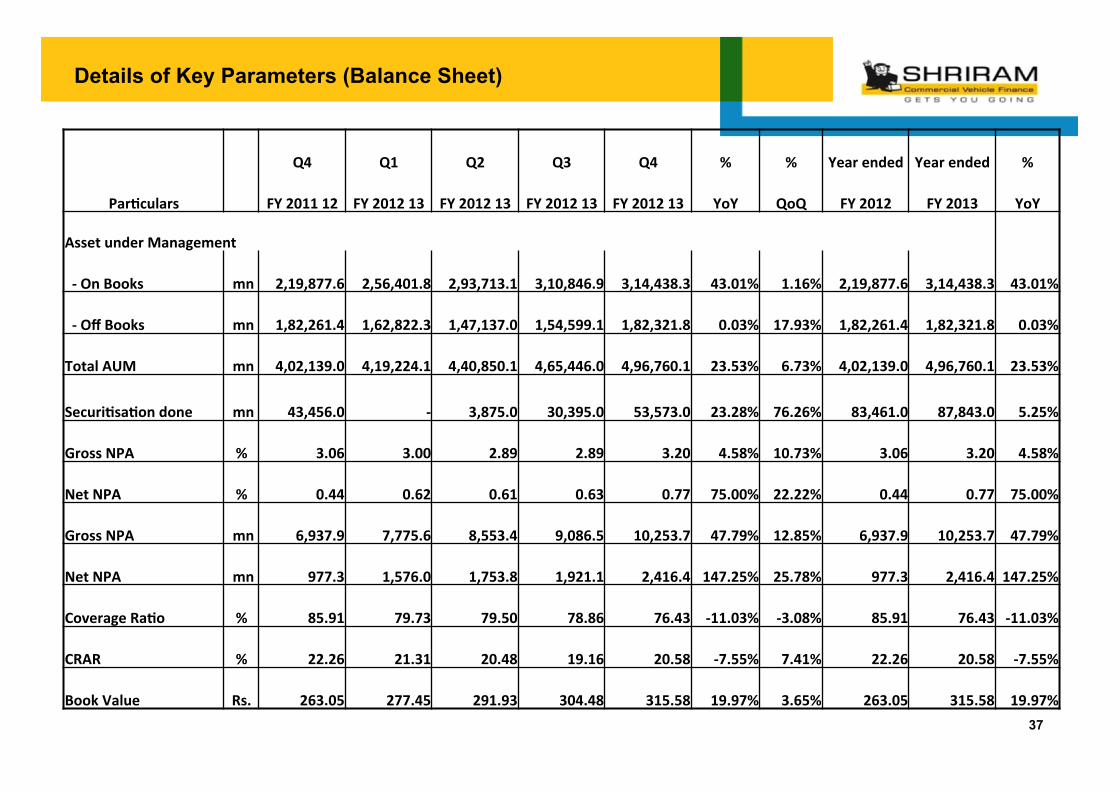
Details of Key Parameters (Balance Sheet)
ParAculars
Q4 Q1 Q2 Q3 Q4 % % Year ended Year ended %
FY 2011 12 FY 2012 13 FY 2012 13 FY 2012 13 FY 2012 13 YoY QoQ FY 2012 FY 2013 YoY
Asset under Management
-‐ On Books mn 2,19,877.6 2,56,401.8 2,93,713.1 3,10,846.9 3,14,438.3 43.01% 1.16% 2,19,877.6 3,14,438.3 43.01%
-‐ Off Books mn 1,82,261.4 1,62,822.3 1,47,137.0 1,54,599.1 1,82,321.8 0.03% 17.93% 1,82,261.4 1,82,321.8 0.03%
Total AUM mn 4,02,139.0 4,19,224.1 4,40,850.1 4,65,446.0 4,96,760.1 23.53% 6.73% 4,02,139.0 4,96,760.1 23.53%
SecuriAsaAon done mn 43,456.0 -‐ 3,875.0 30,395.0 53,573.0 23.28% 76.26% 83,461.0 87,843.0 5.25%
Gross NPA % 3.06 3.00 2.89 2.89 3.20 4.58% 10.73% 3.06 3.20 4.58%
Net NPA % 0.44 0.62 0.61 0.63 0.77 75.00% 22.22% 0.44 0.77 75.00%
Gross NPA mn 6,937.9 7,775.6 8,553.4 9,086.5 10,253.7 47.79% 12.85% 6,937.9 10,253.7 47.79%
Net NPA mn 977.3 1,576.0 1,753.8 1,921.1 2,416.4 147.25% 25.78% 977.3 2,416.4 147.25%
Coverage RaAo % 85.91 79.73 79.50 78.86 76.43 -‐11.03% -‐3.08% 85.91 76.43 -‐11.03%
CRAR % 22.26 21.31 20.48 19.16 20.58 -‐7.55% 7.41% 22.26 20.58 -‐7.55%
Book Value Rs. 263.05 277.45 291.93 304.48 315.58 19.97% 3.65% 263.05 315.58 19.97%
38
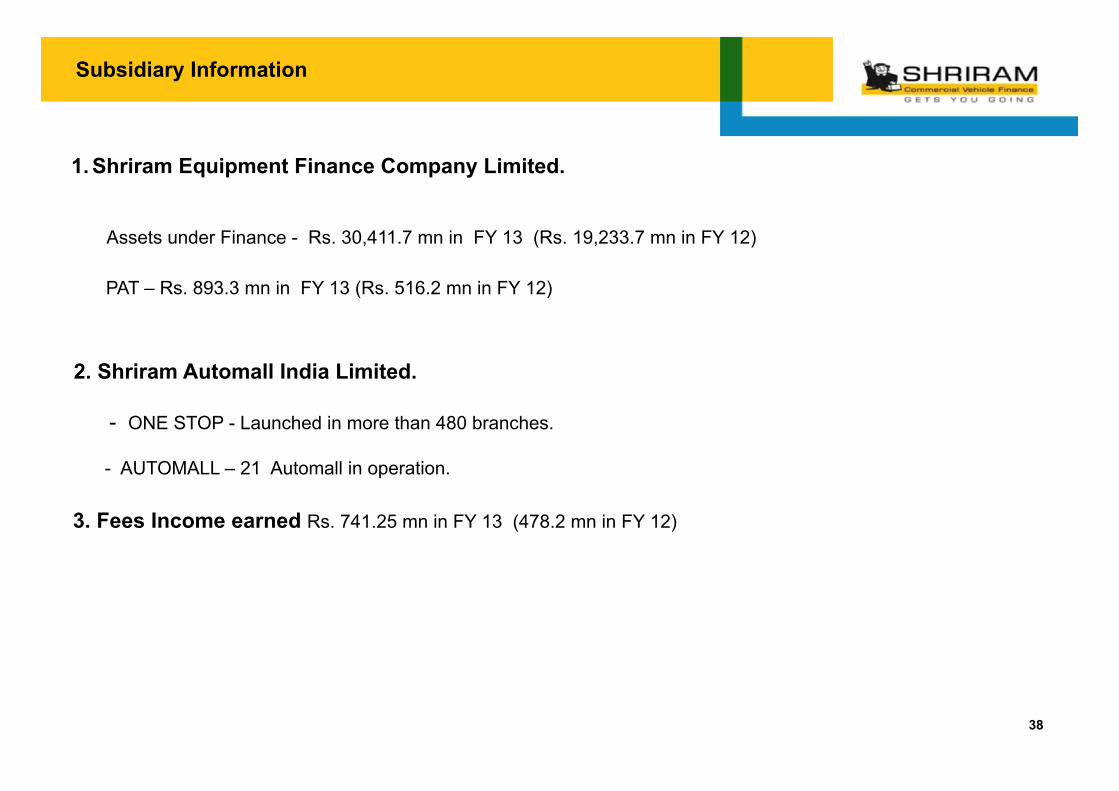
Subsidiary Information
1. Shriram Equipment Finance Company Limited. Assets under Finance - Rs. 30,411.7 mn in FY 13 (Rs. 19,233.7 mn in FY 12) PAT – Rs. 893.3 mn in FY 13 (Rs. 516.2 mn in FY 12)
2. Shriram Automall India Limited. - ONE STOP - Launched in more than 480 branches. - AUTOMALL – 21 Automall in operation.
3. Fees Income earned Rs. 741.25 mn in FY 13 (478.2 mn in FY 12)
Profit and Loss Statement
39
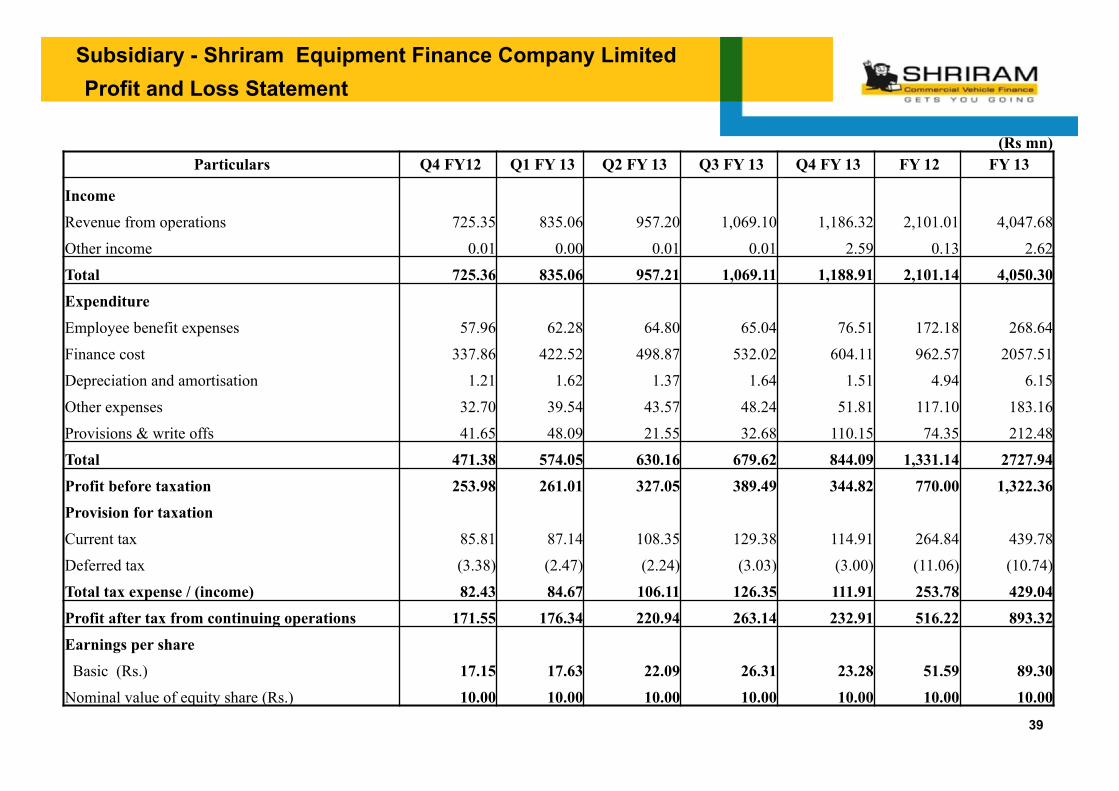
Subsidiary - Shriram Equipment Finance Company Limited
(Rs mn) Particulars Q4 FY12 Q1 FY 13 Q2 FY 13 Q3 FY 13 Q4 FY 13 FY 12 FY 13
Income
Revenue from operations 725.35 835.06 957.20 1,069.10 1,186.32 2,101.01 4,047.68
Other income 0.01 0.00 0.01 0.01 2.59 0.13 2.62
Total 725.36 835.06 957.21 1,069.11 1,188.91 2,101.14 4,050.30 Expenditure
Employee benefit expenses 57.96 62.28 64.80 65.04 76.51 172.18 268.64
Finance cost 337.86 422.52 498.87 532.02 604.11 962.57 2057.51
Depreciation and amortisation 1.21 1.62 1.37 1.64 1.51 4.94 6.15
Other expenses 32.70 39.54 43.57 48.24 51.81 117.10 183.16
Provisions & write offs 41.65 48.09 21.55 32.68 110.15 74.35 212.48
Total 471.38 574.05 630.16 679.62 844.09 1,331.14 2727.94 Profit before taxation 253.98 261.01 327.05 389.49 344.82 770.00 1,322.36 Provision for taxation Current tax 85.81 87.14 108.35 129.38 114.91 264.84 439.78
Deferred tax (3.38) (2.47) (2.24) (3.03) (3.00) (11.06) (10.74)
Total tax expense / (income) 82.43 84.67 106.11 126.35 111.91 253.78 429.04 Profit after tax from continuing operations 171.55 176.34 220.94 263.14 232.91 516.22 893.32 Earnings per share Basic (Rs.) 17.15 17.63 22.09 26.31 23.28 51.59 89.30 Nominal value of equity share (Rs.) 10.00 10.00 10.00 10.00 10.00 10.00 10.00
Balance Sheet
40
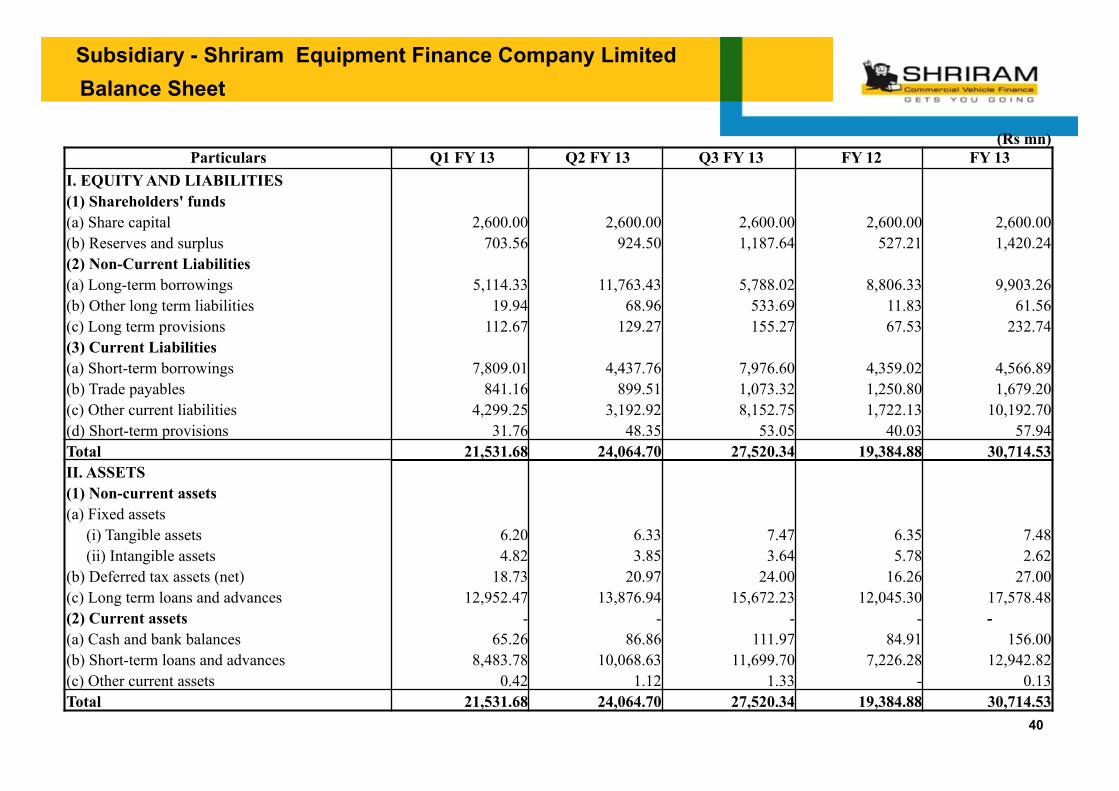
Subsidiary - Shriram Equipment Finance Company Limited
(Rs mn) Particulars Q1 FY 13 Q2 FY 13 Q3 FY 13 FY 12 FY 13
I. EQUITY AND LIABILITIES (1) Shareholders' funds (a) Share capital 2,600.00 2,600.00 2,600.00 2,600.00 2,600.00 (b) Reserves and surplus 703.56 924.50 1,187.64 527.21 1,420.24 (2) Non-Current Liabilities (a) Long-term borrowings 5,114.33 11,763.43 5,788.02 8,806.33 9,903.26 (b) Other long term liabilities 19.94 68.96 533.69 11.83 61.56 (c) Long term provisions 112.67 129.27 155.27 67.53 232.74 (3) Current Liabilities (a) Short-term borrowings 7,809.01 4,437.76 7,976.60 4,359.02 4,566.89 (b) Trade payables 841.16 899.51 1,073.32 1,250.80 1,679.20 (c) Other current liabilities 4,299.25 3,192.92 8,152.75 1,722.13 10,192.70 (d) Short-term provisions 31.76 48.35 53.05 40.03 57.94 Total 21,531.68 24,064.70 27,520.34 19,384.88 30,714.53 II. ASSETS (1) Non-current assets (a) Fixed assets (i) Tangible assets 6.20 6.33 7.47 6.35 7.48 (ii) Intangible assets 4.82 3.85 3.64 5.78 2.62 (b) Deferred tax assets (net) 18.73 20.97 24.00 16.26 27.00 (c) Long term loans and advances 12,952.47 13,876.94 15,672.23 12,045.30 17,578.48 (2) Current assets - - - - - (a) Cash and bank balances 65.26 86.86 111.97 84.91 156.00 (b) Short-term loans and advances 8,483.78 10,068.63 11,699.70 7,226.28 12,942.82 (c) Other current assets 0.42 1.12 1.33 - 0.13 Total 21,531.68 24,064.70 27,520.34 19,384.88 30,714.53
41
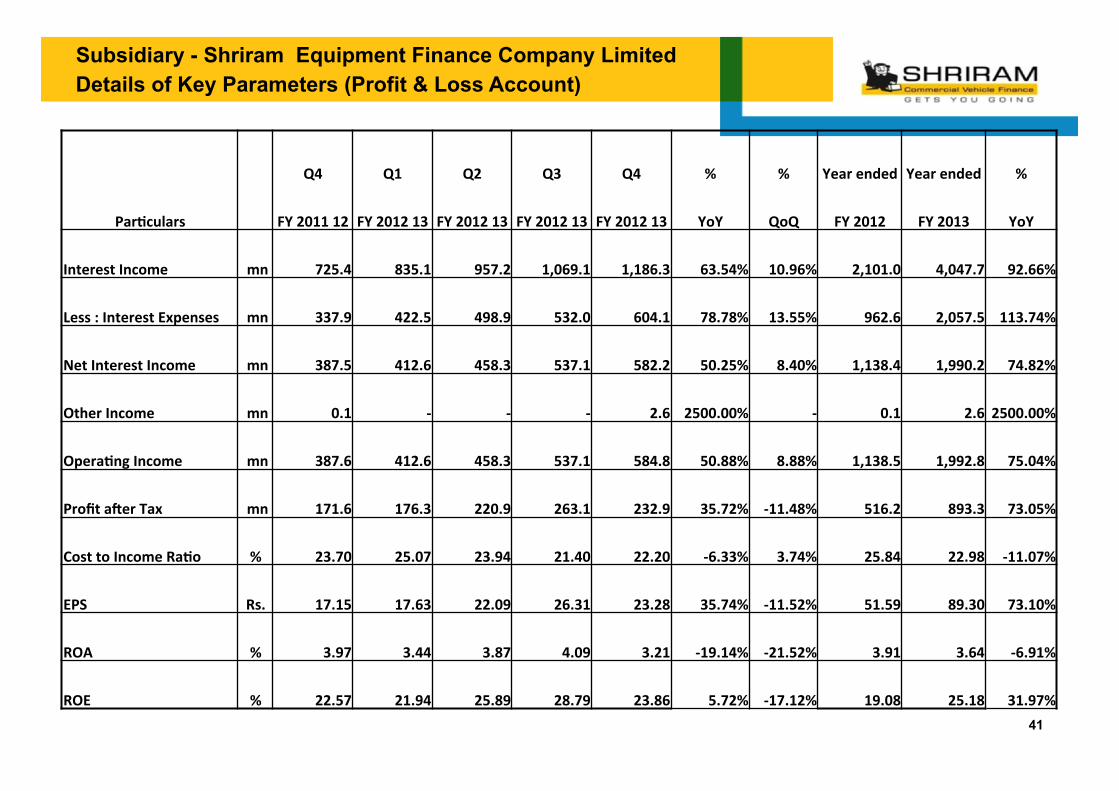
Subsidiary - Shriram Equipment Finance Company Limited Details of Key Parameters (Profit & Loss Account)
ParAculars
Q4 Q1 Q2 Q3 Q4 % % Year ended Year ended %
FY 2011 12 FY 2012 13 FY 2012 13 FY 2012 13 FY 2012 13 YoY QoQ FY 2012 FY 2013 YoY
Interest Income mn 725.4 835.1 957.2 1,069.1 1,186.3 63.54% 10.96% 2,101.0 4,047.7 92.66%
Less : Interest Expenses mn 337.9 422.5 498.9 532.0 604.1 78.78% 13.55% 962.6 2,057.5 113.74%
Net Interest Income mn 387.5 412.6 458.3 537.1 582.2 50.25% 8.40% 1,138.4 1,990.2 74.82%
Other Income mn 0.1 -‐ -‐ -‐ 2.6 2500.00% -‐ 0.1 2.6 2500.00%
OperaAng Income mn 387.6 412.6 458.3 537.1 584.8 50.88% 8.88% 1,138.5 1,992.8 75.04%
Profit a`er Tax mn 171.6 176.3 220.9 263.1 232.9 35.72% -‐11.48% 516.2 893.3 73.05%
Cost to Income RaAo % 23.70 25.07 23.94 21.40 22.20 -‐6.33% 3.74% 25.84 22.98 -‐11.07%
EPS Rs. 17.15 17.63 22.09 26.31 23.28 35.74% -‐11.52% 51.59 89.30 73.10%
ROA % 3.97 3.44 3.87 4.09 3.21 -‐19.14% -‐21.52% 3.91 3.64 -‐6.91%
ROE % 22.57 21.94 25.89 28.79 23.86 5.72% -‐17.12% 19.08 25.18 31.97%
42
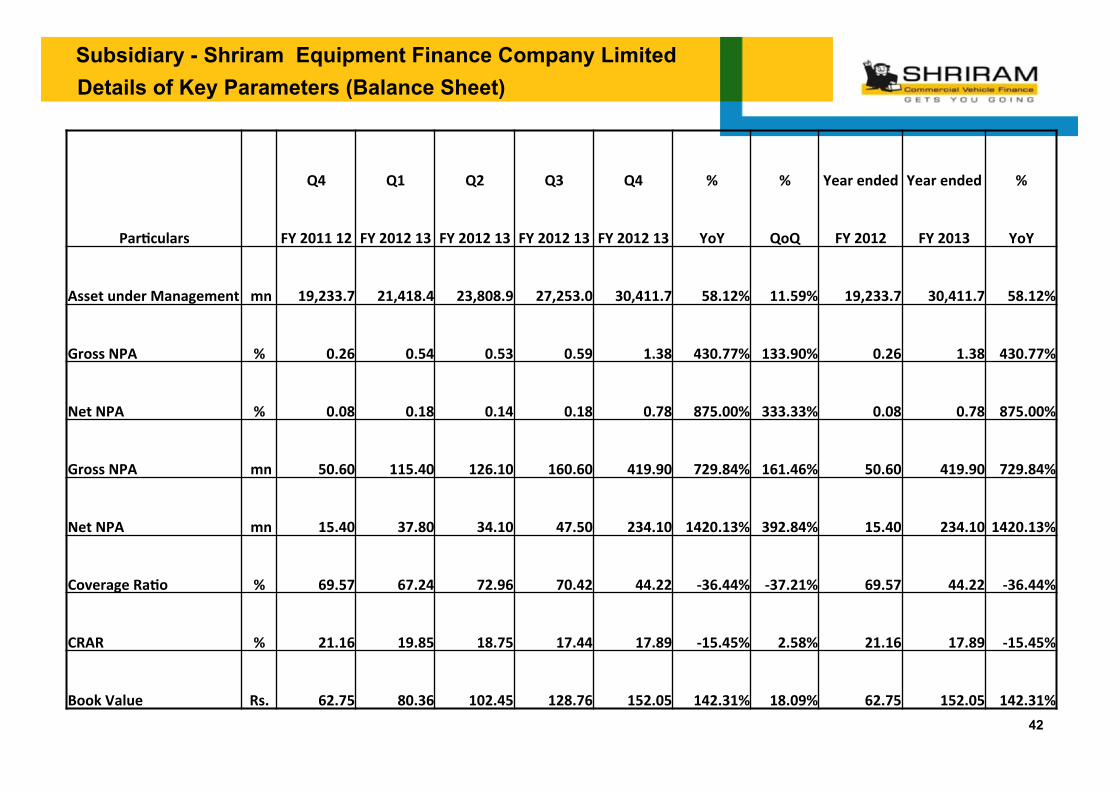
Subsidiary - Shriram Equipment Finance Company Limited Details of Key Parameters (Balance Sheet)
ParAculars
Q4 Q1 Q2 Q3 Q4 % % Year ended Year ended %
FY 2011 12 FY 2012 13 FY 2012 13 FY 2012 13 FY 2012 13 YoY QoQ FY 2012 FY 2013 YoY
Asset under Management mn 19,233.7 21,418.4 23,808.9 27,253.0 30,411.7 58.12% 11.59% 19,233.7 30,411.7 58.12%
Gross NPA % 0.26 0.54 0.53 0.59 1.38 430.77% 133.90% 0.26 1.38 430.77%
Net NPA % 0.08 0.18 0.14 0.18 0.78 875.00% 333.33% 0.08 0.78 875.00%
Gross NPA mn 50.60 115.40 126.10 160.60 419.90 729.84% 161.46% 50.60 419.90 729.84%
Net NPA mn 15.40 37.80 34.10 47.50 234.10 1420.13% 392.84% 15.40 234.10 1420.13%
Coverage RaAo % 69.57 67.24 72.96 70.42 44.22 -‐36.44% -‐37.21% 69.57 44.22 -‐36.44%
CRAR % 21.16 19.85 18.75 17.44 17.89 -‐15.45% 2.58% 21.16 17.89 -‐15.45%
Book Value Rs. 62.75 80.36 102.45 128.76 152.05 142.31% 18.09% 62.75 152.05 142.31%
Profit and Loss Statement
43
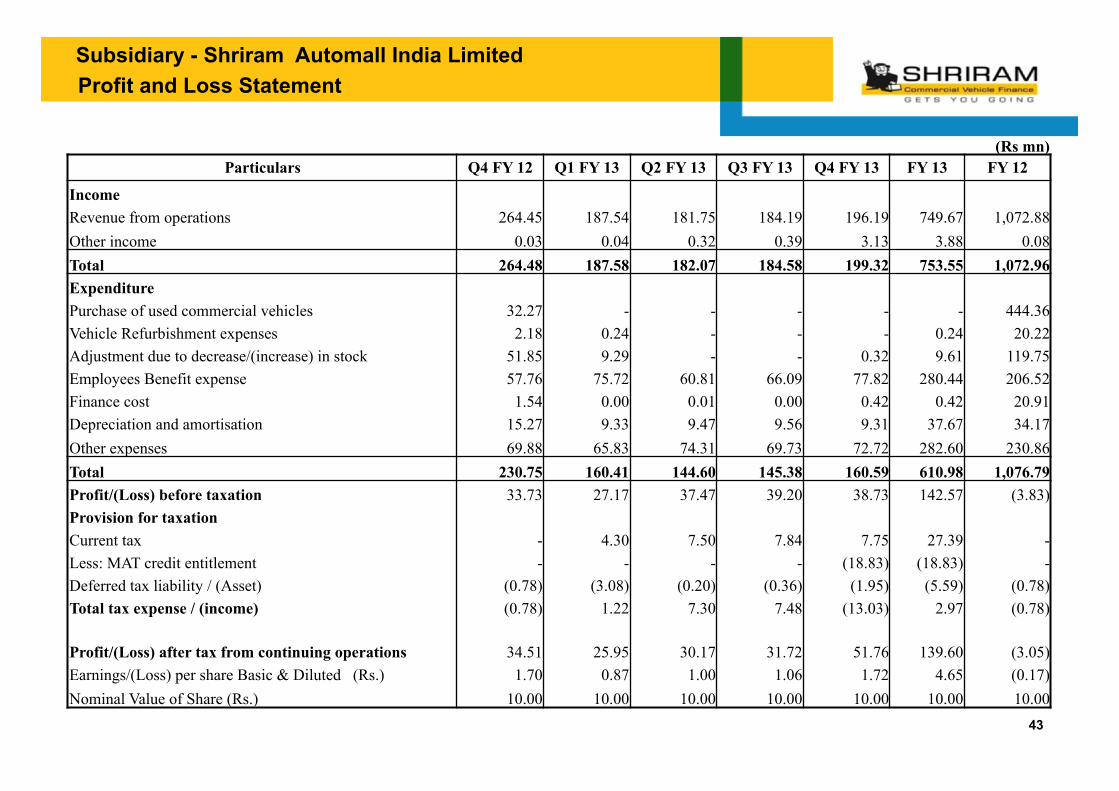
Subsidiary - Shriram Automall India Limited
(Rs mn) Particulars Q4 FY 12 Q1 FY 13 Q2 FY 13 Q3 FY 13 Q4 FY 13 FY 13 FY 12
Income Revenue from operations 264.45 187.54 181.75 184.19 196.19 749.67 1,072.88 Other income 0.03 0.04 0.32 0.39 3.13 3.88 0.08 Total 264.48 187.58 182.07 184.58 199.32 753.55 1,072.96 Expenditure Purchase of used commercial vehicles 32.27 - - - - - 444.36 Vehicle Refurbishment expenses 2.18 0.24 - - - 0.24 20.22 Adjustment due to decrease/(increase) in stock 51.85 9.29 - - 0.32 9.61 119.75 Employees Benefit expense 57.76 75.72 60.81 66.09 77.82 280.44 206.52 Finance cost 1.54 0.00 0.01 0.00 0.42 0.42 20.91 Depreciation and amortisation 15.27 9.33 9.47 9.56 9.31 37.67 34.17 Other expenses 69.88 65.83 74.31 69.73 72.72 282.60 230.86 Total 230.75 160.41 144.60 145.38 160.59 610.98 1,076.79 Profit/(Loss) before taxation 33.73 27.17 37.47 39.20 38.73 142.57 (3.83) Provision for taxation Current tax - 4.30 7.50 7.84 7.75 27.39 - Less: MAT credit entitlement - - - - (18.83) (18.83) - Deferred tax liability / (Asset) (0.78) (3.08) (0.20) (0.36) (1.95) (5.59) (0.78) Total tax expense / (income) (0.78) 1.22 7.30 7.48 (13.03) 2.97 (0.78)
Profit/(Loss) after tax from continuing operations 34.51 25.95 30.17 31.72 51.76 139.60 (3.05) Earnings/(Loss) per share Basic & Diluted (Rs.) 1.70 0.87 1.00 1.06 1.72 4.65 (0.17) Nominal Value of Share (Rs.) 10.00 10.00 10.00 10.00 10.00 10.00 10.00
Balance Sheet
44
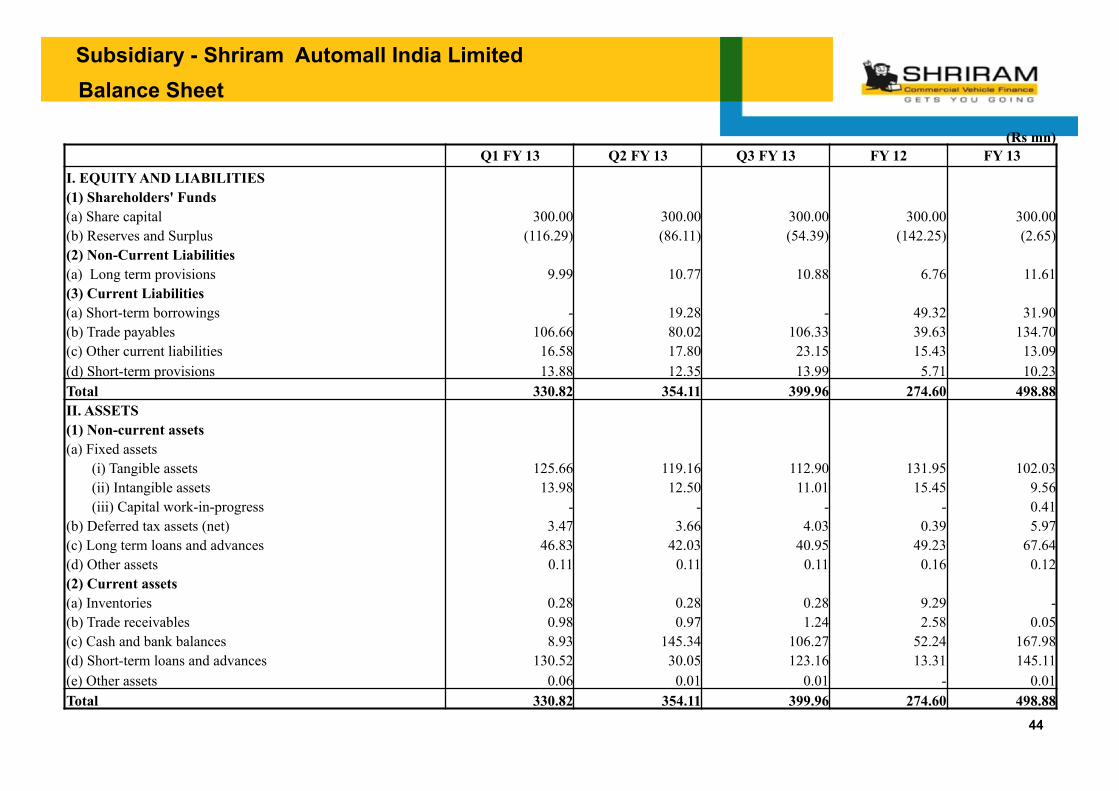
Subsidiary - Shriram Automall India Limited
(Rs mn) Q1 FY 13 Q2 FY 13 Q3 FY 13 FY 12 FY 13
I. EQUITY AND LIABILITIES (1) Shareholders' Funds (a) Share capital 300.00 300.00 300.00 300.00 300.00 (b) Reserves and Surplus (116.29) (86.11) (54.39) (142.25) (2.65) (2) Non-Current Liabilities (a) Long term provisions 9.99 10.77 10.88 6.76 11.61 (3) Current Liabilities (a) Short-term borrowings - 19.28 - 49.32 31.90 (b) Trade payables 106.66 80.02 106.33 39.63 134.70 (c) Other current liabilities 16.58 17.80 23.15 15.43 13.09 (d) Short-term provisions 13.88 12.35 13.99 5.71 10.23 Total 330.82 354.11 399.96 274.60 498.88 II. ASSETS (1) Non-current assets (a) Fixed assets (i) Tangible assets 125.66 119.16 112.90 131.95 102.03 (ii) Intangible assets 13.98 12.50 11.01 15.45 9.56 (iii) Capital work-in-progress - - - - 0.41 (b) Deferred tax assets (net) 3.47 3.66 4.03 0.39 5.97 (c) Long term loans and advances 46.83 42.03 40.95 49.23 67.64 (d) Other assets 0.11 0.11 0.11 0.16 0.12 (2) Current assets (a) Inventories 0.28 0.28 0.28 9.29 - (b) Trade receivables 0.98 0.97 1.24 2.58 0.05 (c) Cash and bank balances 8.93 145.34 106.27 52.24 167.98 (d) Short-term loans and advances 130.52 30.05 123.16 13.31 145.11 (e) Other assets 0.06 0.01 0.01 - 0.01 Total 330.82 354.11 399.96 274.60 498.88
Contact Us
For any Investor Relations queries please contact
Sanjay K. Mundra Shriram Transport Finance Co. Ltd
Email: [email protected] Tel. No. +91-22-40959507
Forward Looking Statement Certain statements in this document with words or phrases such as “will”, “should”, etc., and similar expressions or variation of these expressions or those concerning our future prospects are forward looking statements. Actual results may differ materially from those suggested by the forward looking statements due to a number of risks or uncertainties associated with the expectations. These risks and uncertainties include, but are not limited to, our ability to successfully implement our strategy and changes in government policies. The company may, from time to time, make additional written and oral forward looking statements, including statements contained in the company’s filings with the stock exchanges and our reports to shareholders. The company does not undertake to update any forward-looking statements that may be made from time to time by or on behalf of the company.
About Shriram Transport Finance Co. Ltd. Shriram Transport Finance Co Ltd. is the largest asset financing NBFC with assets under management of Rs 496.76 bn. The company is a leader in organized financing of pre-owned trucks with strategic presence in 5-12 year old trucks and a market share of around 25%. It has a pan-India presence with a network of 539 branches, and employs 16,178 employees including 10,057 field officers. The company has built a strong customer base of over 0.95 mn. Over the past 35 years, it has developed strong competencies in the areas of loan origination, valuation of pre-owned trucks and collection. It has a vertically integrated business model and offers a number of products which include: Pre-owned CV financing, New CV financing and other loans like accidental repair loans, tyre loans and working capital finance, etc. For more information please visit www.stfc.in
Thank You
Related Documents