Introduction to Purchase to Pay Software 11/29/2012 1

Introduction to Purchase to Pay Software 11/29/2012 1.
Mar 26, 2015
Welcome message from author
This document is posted to help you gain knowledge. Please leave a comment to let me know what you think about it! Share it to your friends and learn new things together.
Transcript
Introduction to Purchase to Pay Software
11/29/2012
1
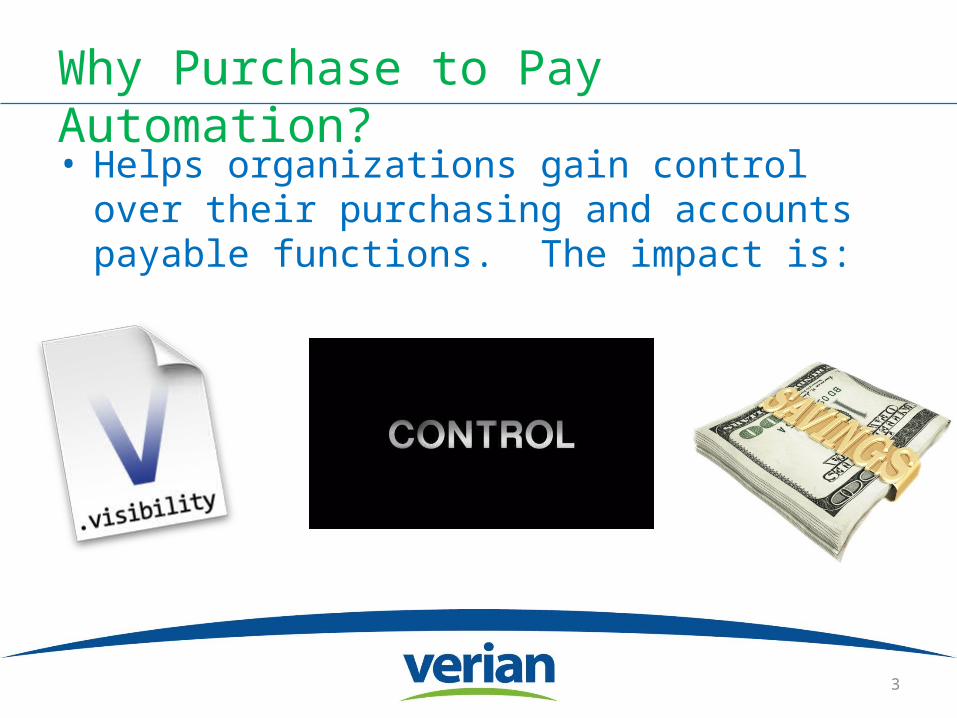
Why Purchase to Pay Automation?
• Helps organizations gain control over their purchasing and accounts payable functions. The impact is:
3

Problem
4
Paper-based Purchasing & Invoice processing rob CFO’s of the clear visibility and control needed to manage cash and reduce indirect spending.
Source: Purchase Insight and Forrester
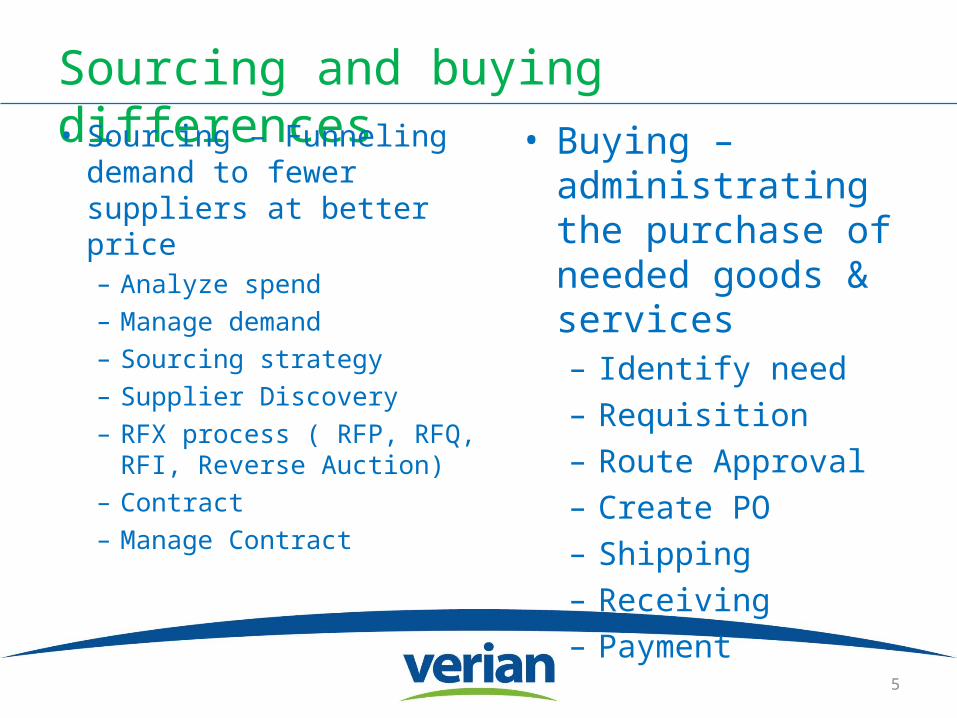
Sourcing and buying differences• Sourcing – Funneling
demand to fewer suppliers at better price – Analyze spend– Manage demand– Sourcing strategy– Supplier Discovery– RFX process ( RFP, RFQ,
RFI, Reverse Auction)– Contract– Manage Contract
5
• Buying – administrating the purchase of needed goods & services– Identify need– Requisition– Route Approval– Create PO– Shipping – Receiving– Payment
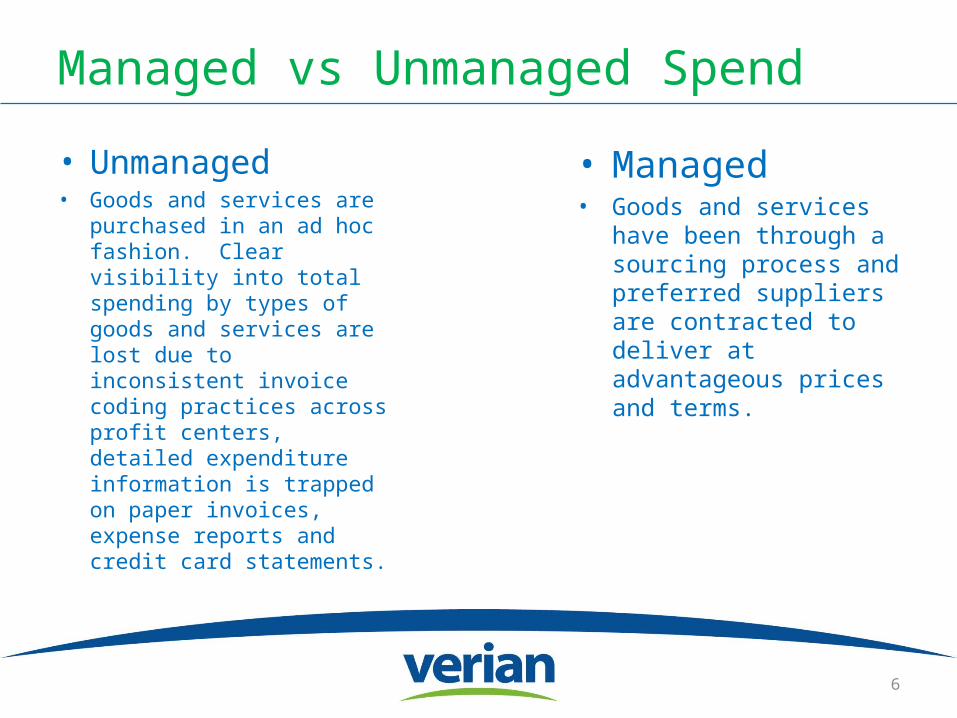
Managed vs Unmanaged Spend
• Unmanaged• Goods and services are
purchased in an ad hoc fashion. Clear visibility into total spending by types of goods and services are lost due to inconsistent invoice coding practices across profit centers, detailed expenditure information is trapped on paper invoices, expense reports and credit card statements.
6
• Managed• Goods and services
have been through a sourcing process and preferred suppliers are contracted to deliver at advantageous prices and terms.
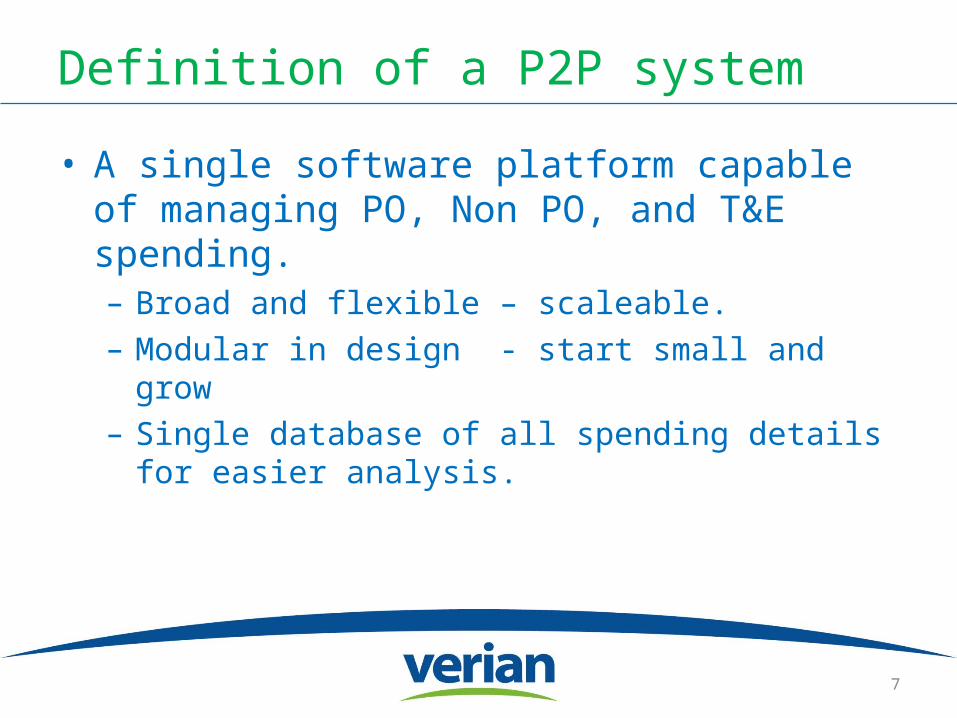
Definition of a P2P system
• A single software platform capable of managing PO, Non PO, and T&E spending. – Broad and flexible – scaleable. – Modular in design - start small and grow– Single database of all spending details for
easier analysis.
7

Requisitions
• Punch out – High volume, low price items from technologically sophisticated supplier
• Catalog – Higher volume categories; where supplier can provide you with spreadsheet
• Free form – unusual purchases where the supplier may be unknown
• Requisitioner should code requisition to profit center
8

Setting up Catalogs
• Unique to each company• Want to start earmarking spending into
sourceable categories• Look at 20 % of suppliers that represent
80% of spending• Use them to create 5-7 broad categories of
spending• Break the larger spend categories into
subcomponents overtime
9
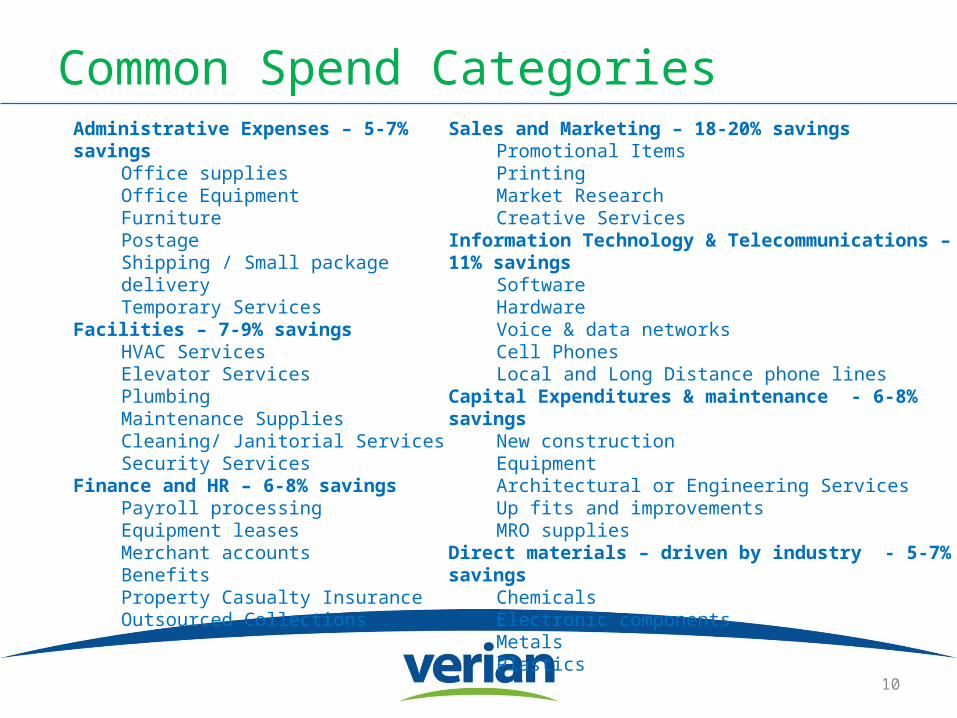
Common Spend Categories
10
Administrative Expenses – 5-7% savingsOffice suppliesOffice EquipmentFurniturePostageShipping / Small package deliveryTemporary Services
Facilities – 7-9% savingsHVAC ServicesElevator ServicesPlumbingMaintenance SuppliesCleaning/ Janitorial ServicesSecurity Services
Finance and HR – 6-8% savingsPayroll processingEquipment leasesMerchant accountsBenefitsProperty Casualty InsuranceOutsourced Collections
Sales and Marketing – 18-20% savingsPromotional ItemsPrinting Market ResearchCreative Services
Information Technology & Telecommunications – 9-11% savingsSoftwareHardwareVoice & data networksCell PhonesLocal and Long Distance phone lines
Capital Expenditures & maintenance - 6-8% savingsNew constructionEquipmentArchitectural or Engineering ServicesUp fits and improvementsMRO supplies
Direct materials – driven by industry - 5-7% savingsChemicalsElectronic componentsMetalsPlastics

Approval Routing
• Financial & Hierarchical• Special commodities• Ad Hoc• Budget visibility• Smart phone – mobile approvals• Line item• Full audit trail
11
Buying
• Support centralized or decentralized purchasing
• Consolidate requisitions to single PO• Po with multiple ship to addresses• Easy 3 bids and a buy functionality for the
“free form” buying
12
Receiving
• One of the most difficult parts of the P2P process
• Need to make it easy• Simple entry of the packing slip info into
browser• Support 2 step receiving - quantity &
quality
13
PO Payment
• Automated 3 way match• Discrepancy identification
– Financial– Quantity
• Discrepancy management workflow depending on type of discrepancy
14
Non PO Payment
• Input invoice info from outsourced service, KFI, EDI, portal or network
• Accurate account coding • Should code invoice to commodity
categories that are consistent with catalog – help identify number of suppliers per commodity category
• Speedy approvals via mobile• Identify suppliers with contracts and sample
non-po invoices to ensure pricing compliance
15

Travel & Expense
• Goal is efficiency & demand management• Lessen the time it takes to complete an expense
report• Speed the approval time• Use the system to educate users on company
travel & entertainment policies• Capture savings opportunities on hotel, flights &
car rentals• Big savings come from identifying unusual
spending habits, educating & avoiding in the future
16
Visibility & Reports
• Gain increased accuracy into accruals because system replaces paper shuffling– Analyze by user– By supplier– By commodity – By cost center
17
Verian Value Proposition
18
See - Save- Manage
Confidential
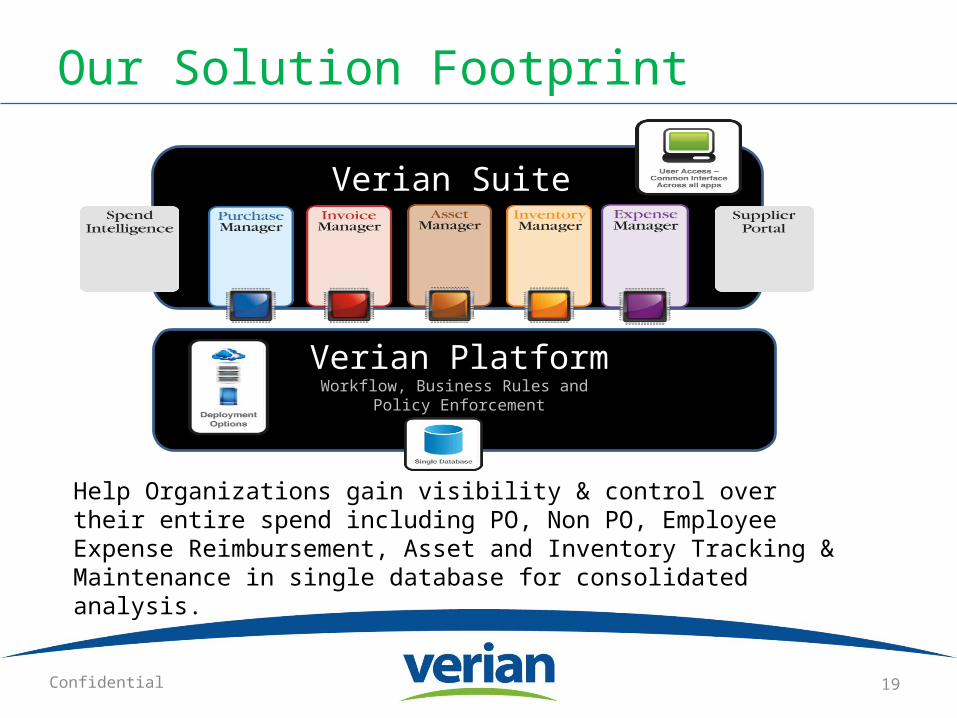
Our Solution Footprint
19
Verian PlatformWorkflow, Business Rules and
Policy Enforcement
Verian Suite
Help Organizations gain visibility & control over their entire spend including PO, Non PO, Employee Expense Reimbursement, Asset and Inventory Tracking & Maintenance in single database for consolidated analysis.
Confidential
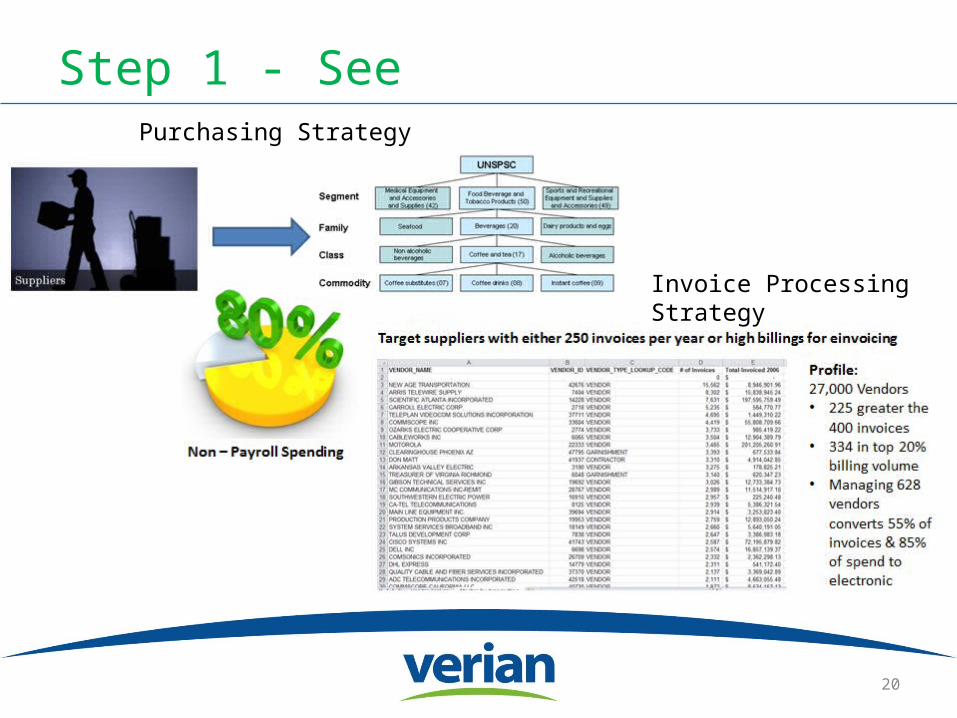
Step 1 - See
20
Purchasing Strategy
Invoice Processing Strategy
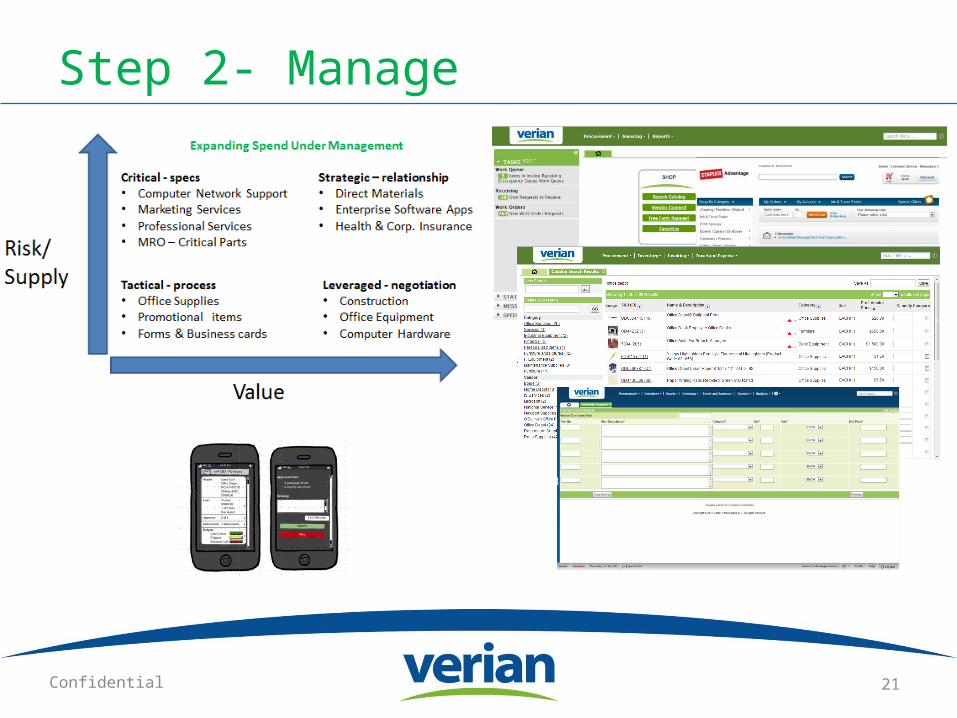
Step 2- Manage
21Confidential
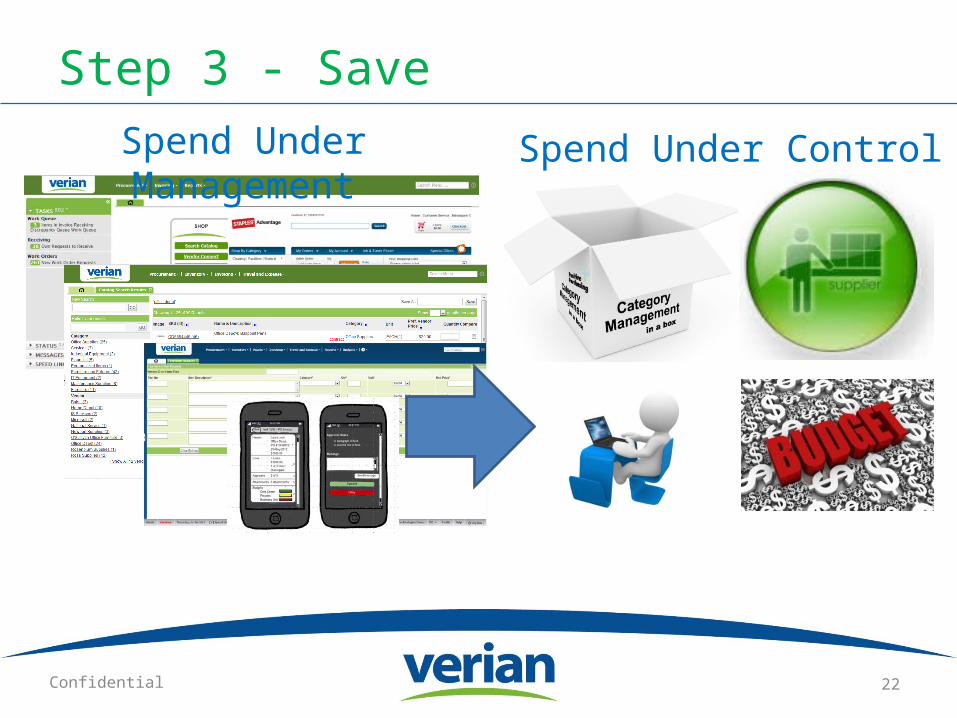
Step 3 - Save
22
Spend Under Management
Spend Under Control
Confidential

ROI
23
3 Years After Implementing Verian100 Buying Categories Managed - $110M in Spend in PM
• Better visibility into what was purchased from whom• basic contracting process in place• Change in behavior to question process and look for product substitutions.
•Result in Purchasing• Faster approvals and focus on using less expensive substitutions (i.e. switching from color
forms to b/w)• Better transaction data allowed them to generate 10% savings/year on $110 million in PO
based spend. Plan to address $220 million in non-PO spend next year•Accounts Payable
• Because of PO process catching $1M in invoicing errors per year. Catching $120k/yr in late fees
• Scrutinizing expense reports allowed them to reduce expenses by $1.8M/over 5 years
Regional Financial Institution
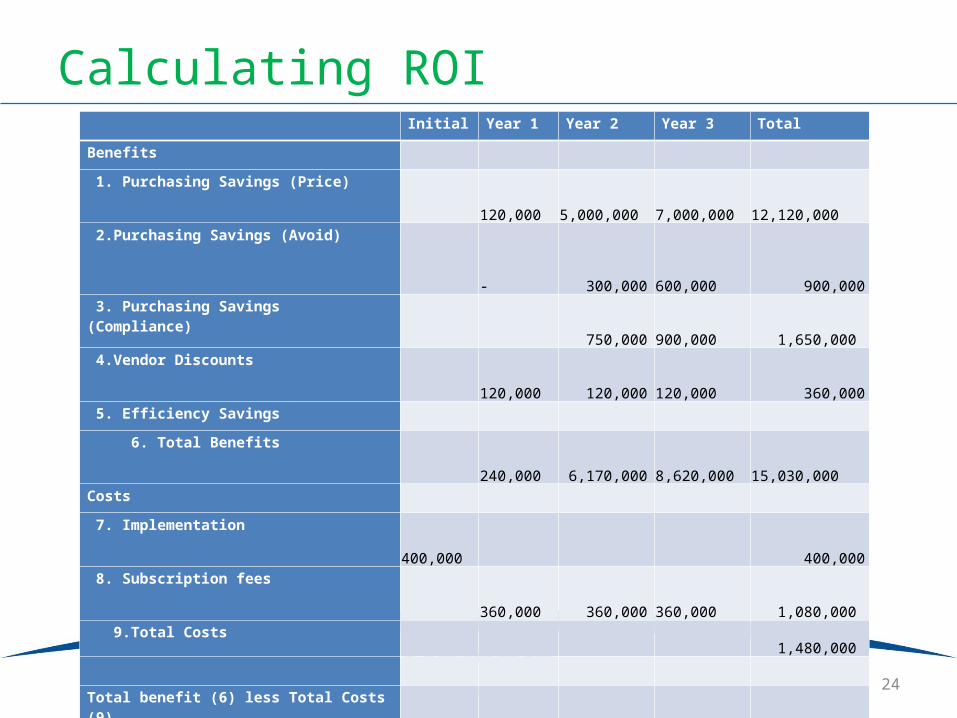
Calculating ROI Initial Year 1 Year 2 Year 3 Total
Benefits
1. Purchasing Savings (Price) 120,000 5,000,000
7,000,000 12,120,000
2.Purchasing Savings (Avoid) -
300,000
600,000 900,000
3. Purchasing Savings (Compliance) 750,000
900,000 1,650,000
4.Vendor Discounts 120,000
120,000
120,000 360,000
5. Efficiency Savings
6. Total Benefits 240,000 6,170,000
8,620,000 15,030,000
Costs
7. Implementation 400,000 400,000
8. Subscription fees 360,000
360,000
360,000 1,080,000
9.Total Costs 1,480,000
Total benefit (6) less Total Costs (9) (400,000)
(120,000) 5,810,000
8,260,000 13,550,000
Project IRR 325%
24
ROI
25
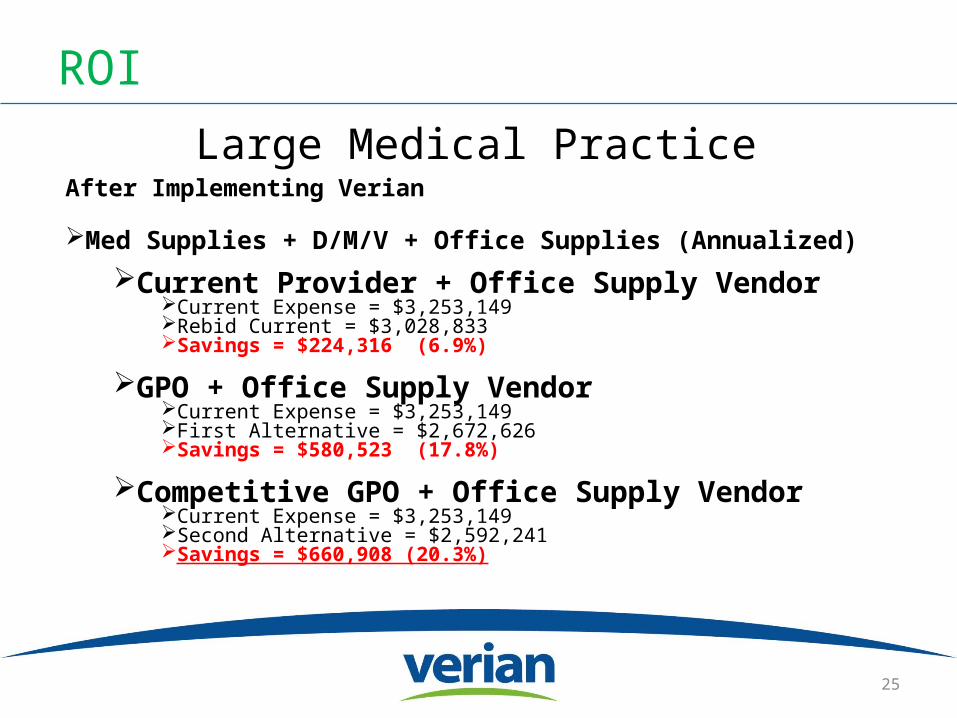
After Implementing Verian
Med Supplies + D/M/V + Office Supplies (Annualized)
Current Provider + Office Supply VendorCurrent Expense = $3,253,149Rebid Current = $3,028,833 Savings = $224,316 (6.9%)
GPO + Office Supply Vendor Current Expense = $3,253,149First Alternative = $2,672,626Savings = $580,523 (17.8%)
Competitive GPO + Office Supply Vendor Current Expense = $3,253,149Second Alternative = $2,592,241Savings = $660,908 (20.3%)
Large Medical Practice
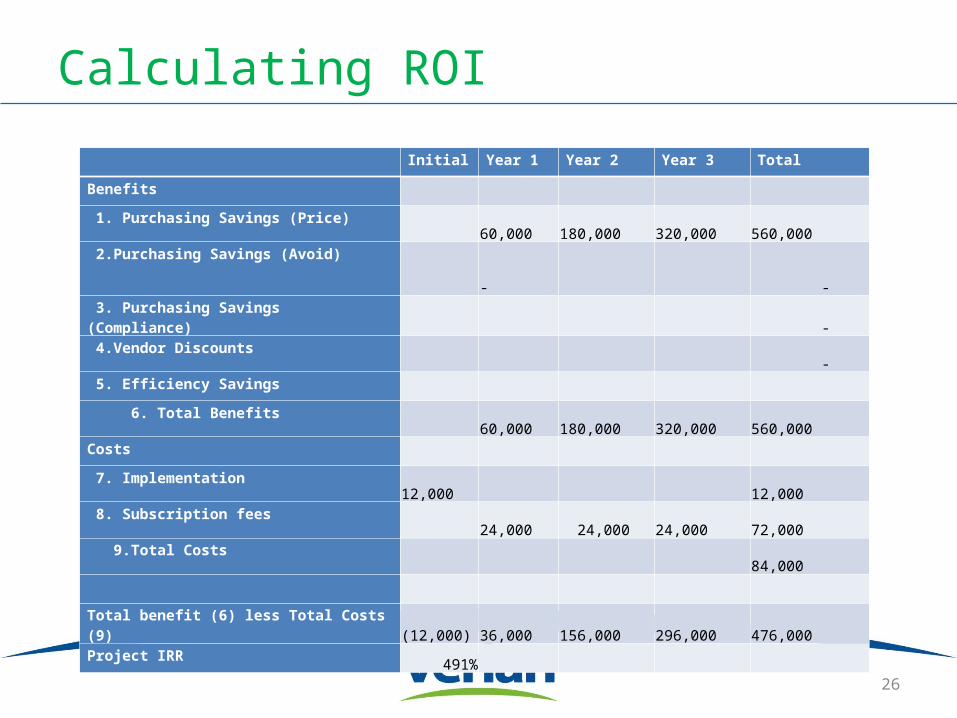
Calculating ROI
Initial Year 1 Year 2 Year 3 Total
Benefits
1. Purchasing Savings (Price) 60,000 180,000 320,000 560,000
2.Purchasing Savings (Avoid) - - 3. Purchasing Savings (Compliance) - 4.Vendor Discounts - 5. Efficiency Savings
6. Total Benefits 60,000 180,000 320,000 560,000
Costs
7. Implementation 12,000 12,000 8. Subscription fees 24,000 24,000 24,000 72,000 9.Total Costs 84,000
Total benefit (6) less Total Costs (9) (12,000) 36,000 156,000 296,000 476,000 Project IRR 491%
26
Additional Resources
27
Verian blog (verian.com/blog)•Useful articles and commentary on ways to increase efficiency using automated purchasing and invoice processing systemsInstitute for Supply Management – ISM (ism.ws)•An association that exists to educate, develop, and advance the purchasing and supply management professionBuyers Meeting Point blog (buyersmeetingpoint.com/blogs)•A helpful online knowledge and professional development resource for supply management and procurement professionalsInstitute of Finance Management – IOFM (iofm.com)•Valuable tools, best practices, benchmarks, research and resources that will improve your accounts payable processThe Accounts Payable Network – TAPN (theaccountspayablenetwork.com)•A comprehensive knowledge base for executives and managers who oversee accounts payable
Related Documents