Introduction to Environment and Natural Resources 27-8-2008

Introduction to Environment and Natural Resources 27-8-2008.
Dec 25, 2015
Welcome message from author
This document is posted to help you gain knowledge. Please leave a comment to let me know what you think about it! Share it to your friends and learn new things together.
Transcript
Introduction to Environment and Natural Resources
27-8-2008
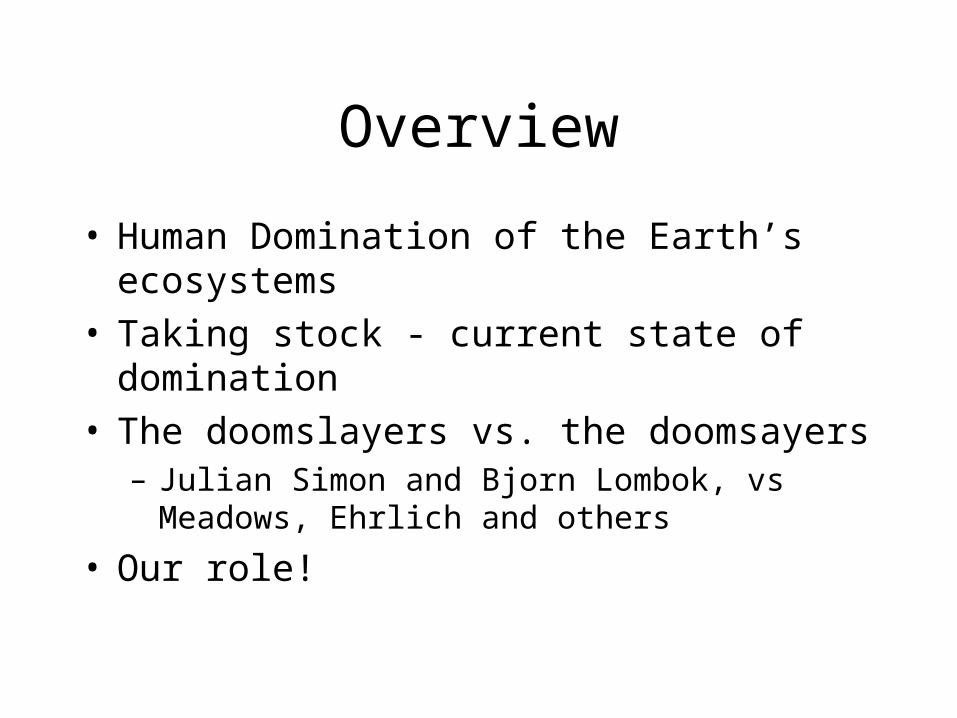
Overview
• Human Domination of the Earth’s ecosystems• Taking stock - current state of domination• The doomslayers vs. the doomsayers
– Julian Simon and Bjorn Lombok, vs Meadows, Ehrlich and others
• Our role!
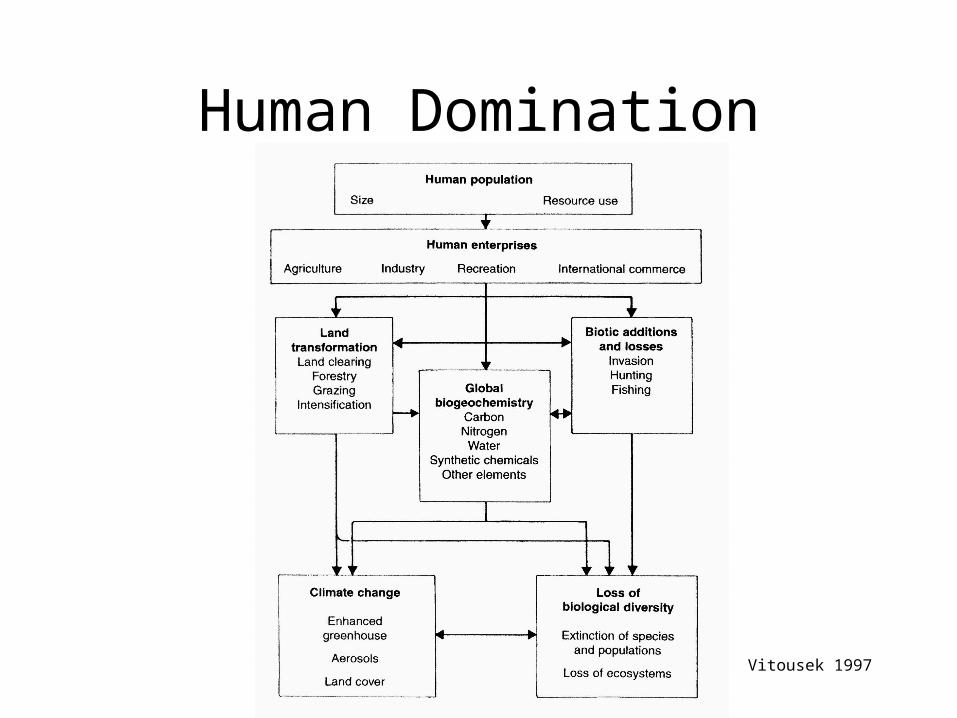
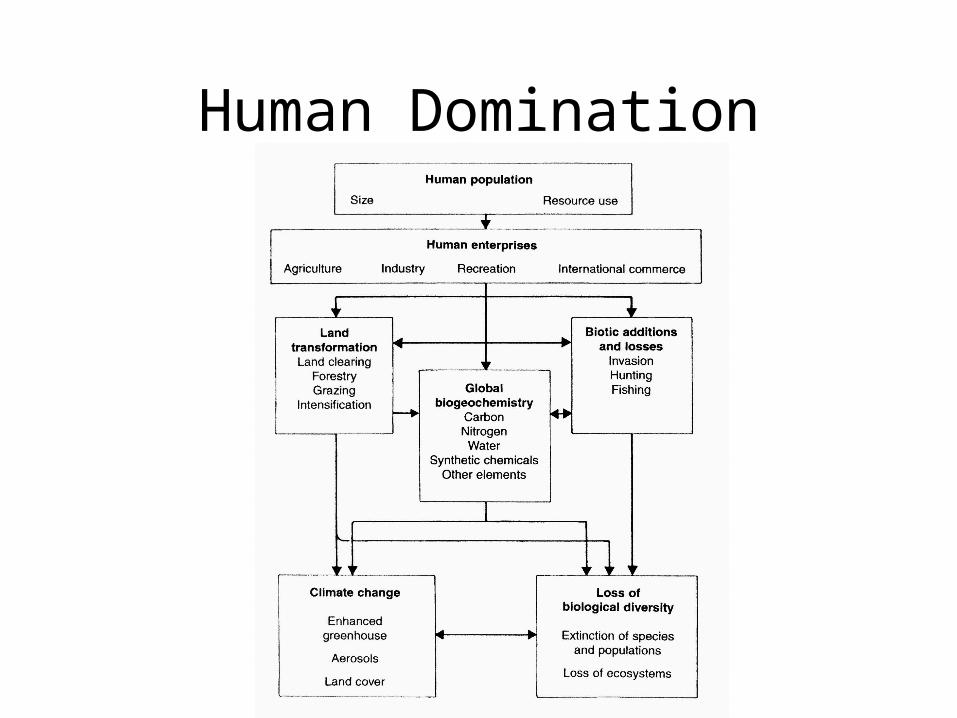
Human Domination
Vitousek 1997
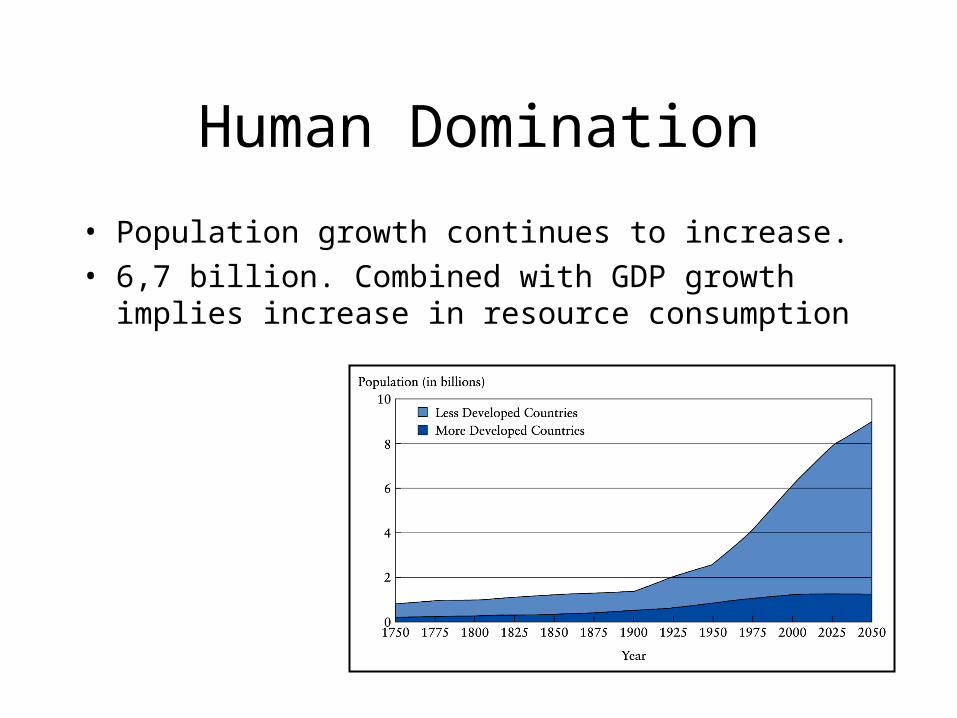
Human Domination
• Population growth continues to increase. • 6,7 billion. Combined with GDP growth implies
increase in resource consumption
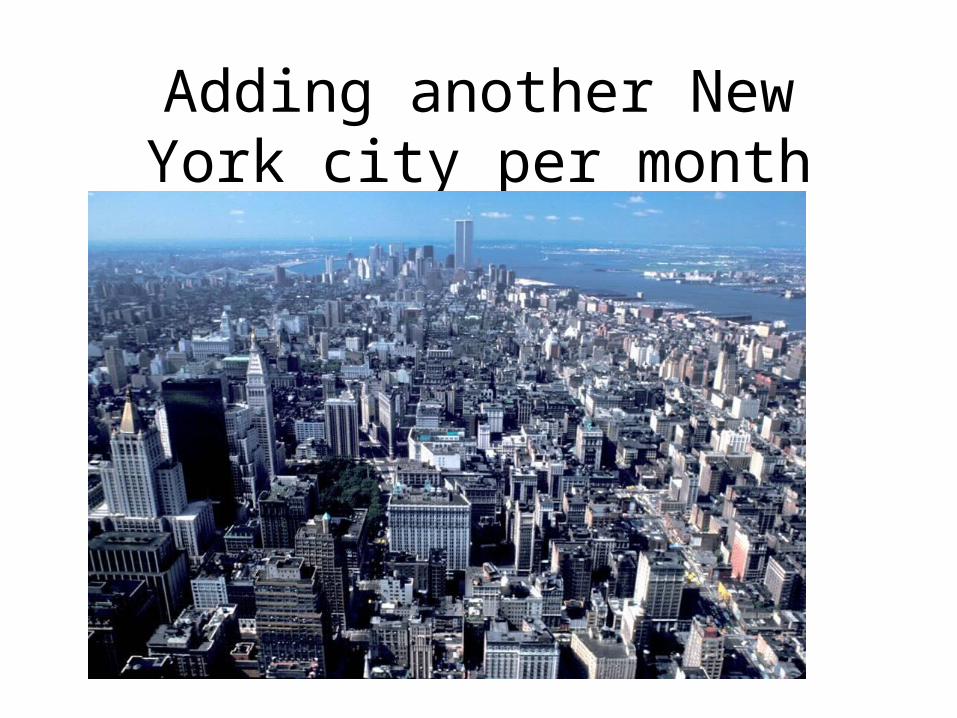
Adding another New York city per monthQuickTime™ and aTIFF (Uncompressed) decompressorare needed to see this picture.
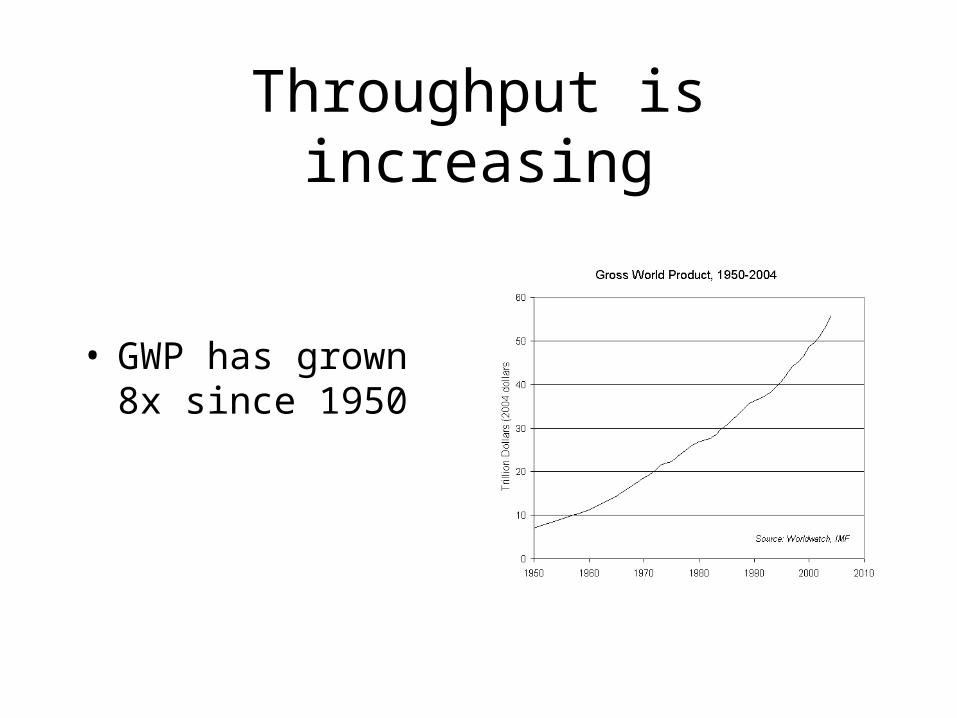
Throughput is increasing
• GWP has grown 8x since 1950QuickTime™ and aTIFF (Uncompressed) decompressorare needed to see this picture.
Millennium Ecosystem Assessment
• Largest assessment of the health of the world’s ecosystems
Overview of Findings– Over the past 50 years, humans have changed ecosystems more
rapidly and extensively than in any comparable period of time in human history, largely to meet rapidly growing demands for food, fresh water, timber, fiber and fuel
– The changes that have been made to ecosystems have contributed to substantial net gains in human well-being and economic development, but these gains have been achieved at growing costs in the form of the degradation of many ecosystem services, increased risks of nonlinear changes, and the exacerbation of poverty for some groups of people
– The degradation of ecosystem services could grow significantly worse during the first half of this century and is a barrier to achieving the Millennium Development Goals
Largest assessment of the health of Earth’s ecosystems
• Experts and Review Process– Prepared by 1360 experts from 95 countries– 80-person independent board of review editors– Review comments from 850 experts and governments
• Governance– Called for by UN Secretary General in 2000– Authorized by governments through 4 conventions – Partnership of UN agencies, conventions, business, non-
governmental organizations with a multi-stakeholder board of directors
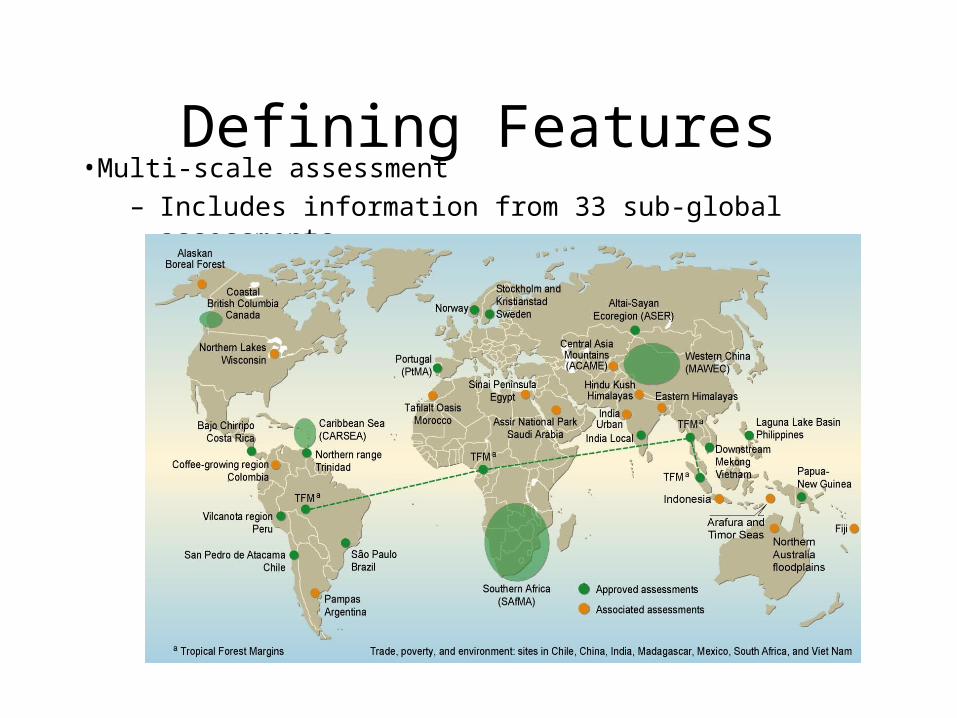
Defining Features•Multi-scale assessment
– Includes information from 33 sub-global assessments
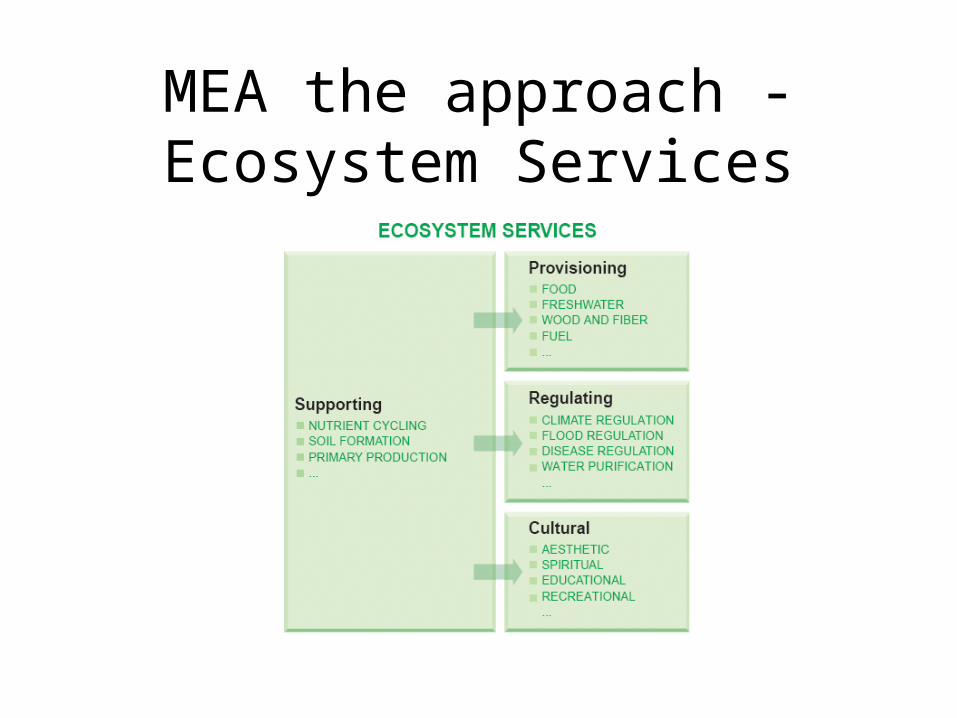
MEA the approach - Ecosystem Services
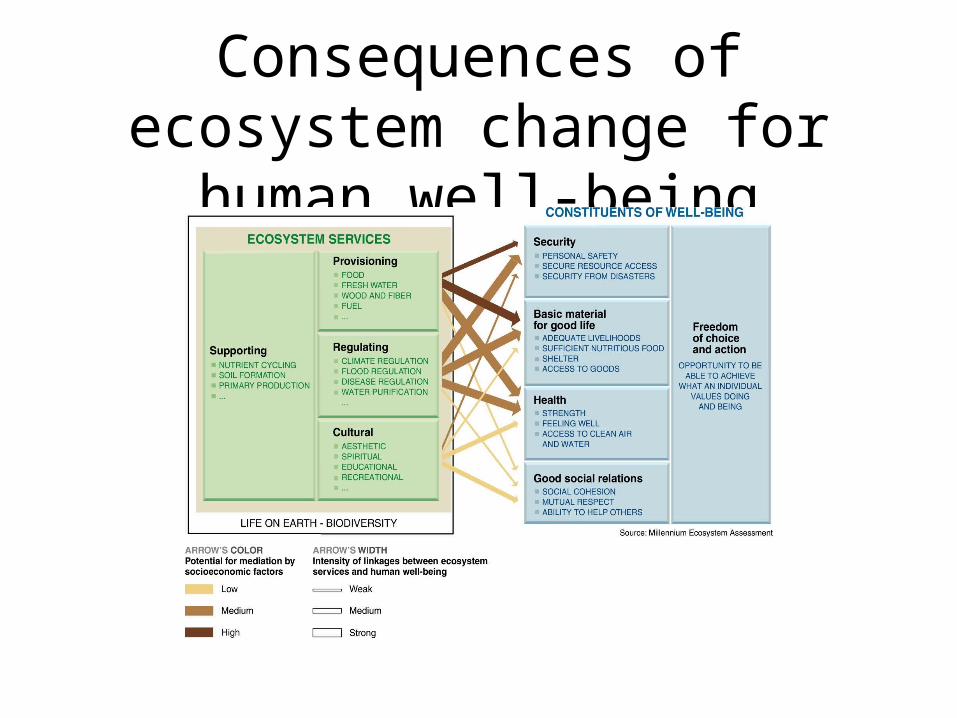
Consequences of ecosystem change for human well-being
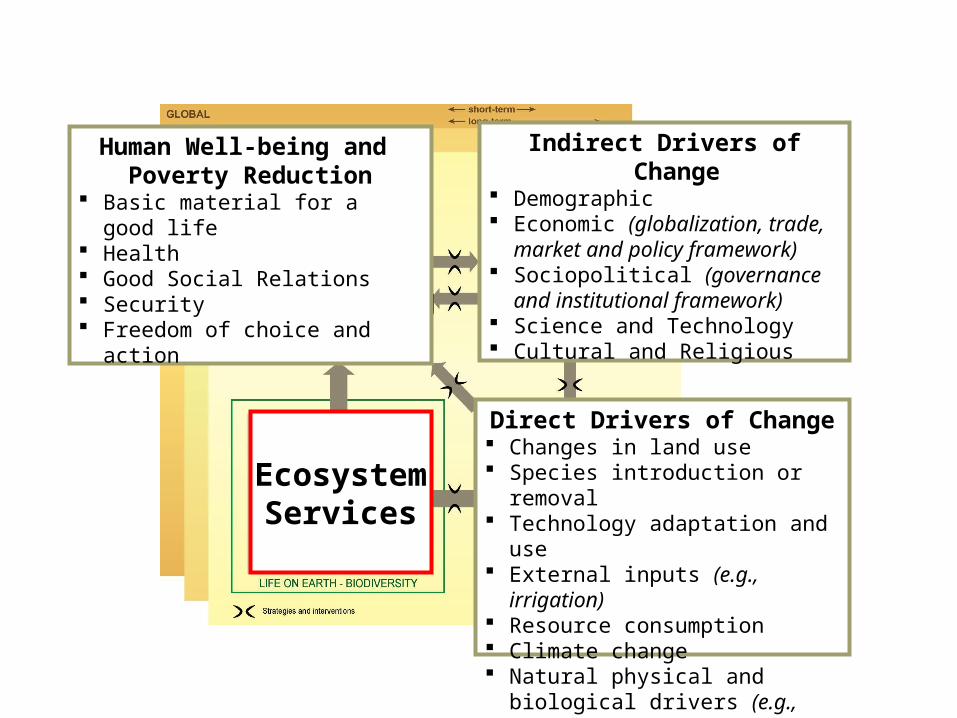
Direct Drivers
Indirect Drivers
EcosystemServices
Human Well-being
Direct Drivers of Change Changes in land use Species introduction or
removal Technology adaptation and
use External inputs (e.g.,
irrigation) Resource consumption Climate change Natural physical and
biological drivers (e.g., volcanoes)
Indirect Drivers of Change Demographic Economic (globalization,
trade, market and policy framework)
Sociopolitical (governance and institutional framework)
Science and Technology Cultural and Religious
Human Well-being and Poverty Reduction
Basic material for a good life Health Good Social Relations Security Freedom of choice and
action
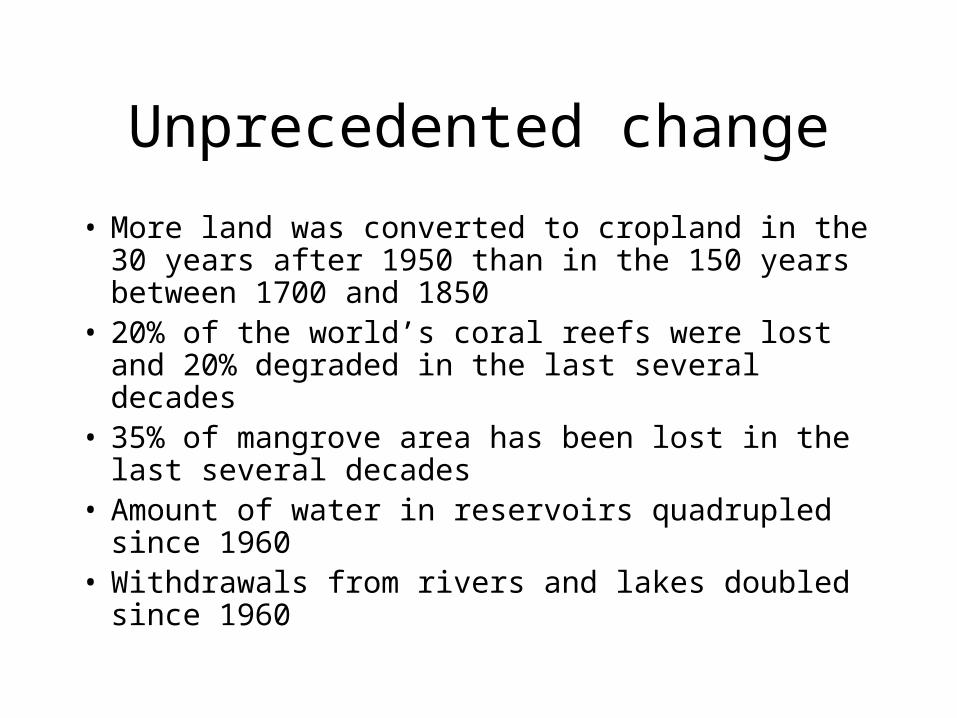
Unprecedented change
• More land was converted to cropland in the 30 years after 1950 than in the 150 years between 1700 and 1850
• 20% of the world’s coral reefs were lost and 20% degraded in the last several decades
• 35% of mangrove area has been lost in the last several decades
• Amount of water in reservoirs quadrupled since 1960
• Withdrawals from rivers and lakes doubled since 1960
Finding #1
– Over the past 50 years, humans have changed ecosystems more rapidly and extensively than in any comparable period of time in human history
– This has resulted in a substantial and largely irreversible loss in the diversity of life on Earth

Human Domination
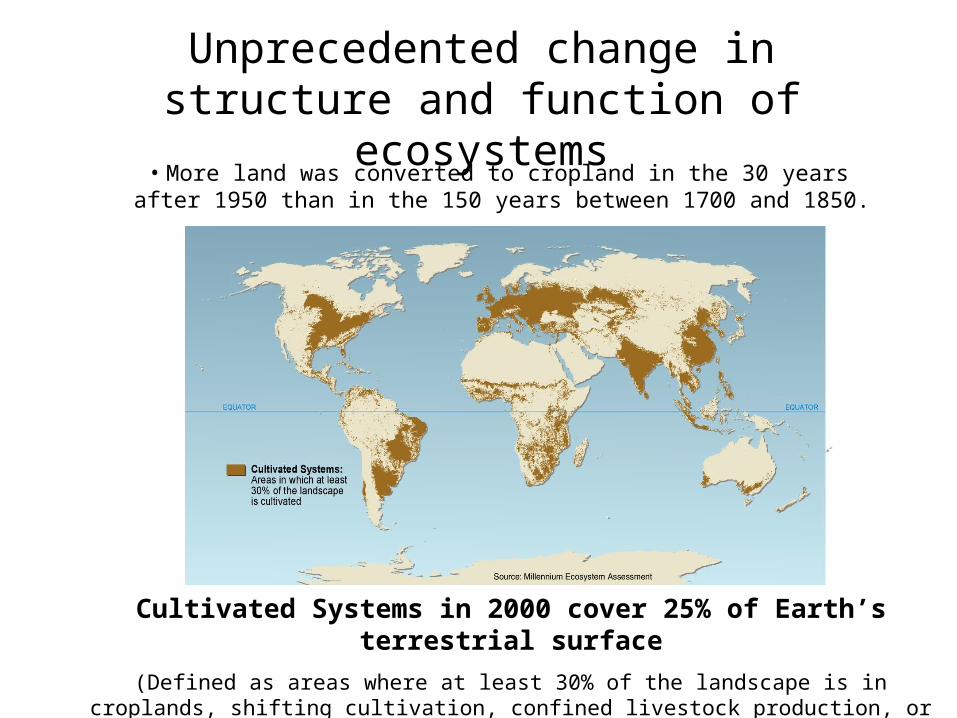
Unprecedented change in structure and function of ecosystems
•More land was converted to cropland in the 30 years after 1950 than in the 150 years between 1700 and 1850.
Cultivated Systems in 2000 cover 25% of Earth’s terrestrial surface
(Defined as areas where at least 30% of the landscape is in croplands, shifting cultivation, confined livestock production, or freshwater aquaculture)
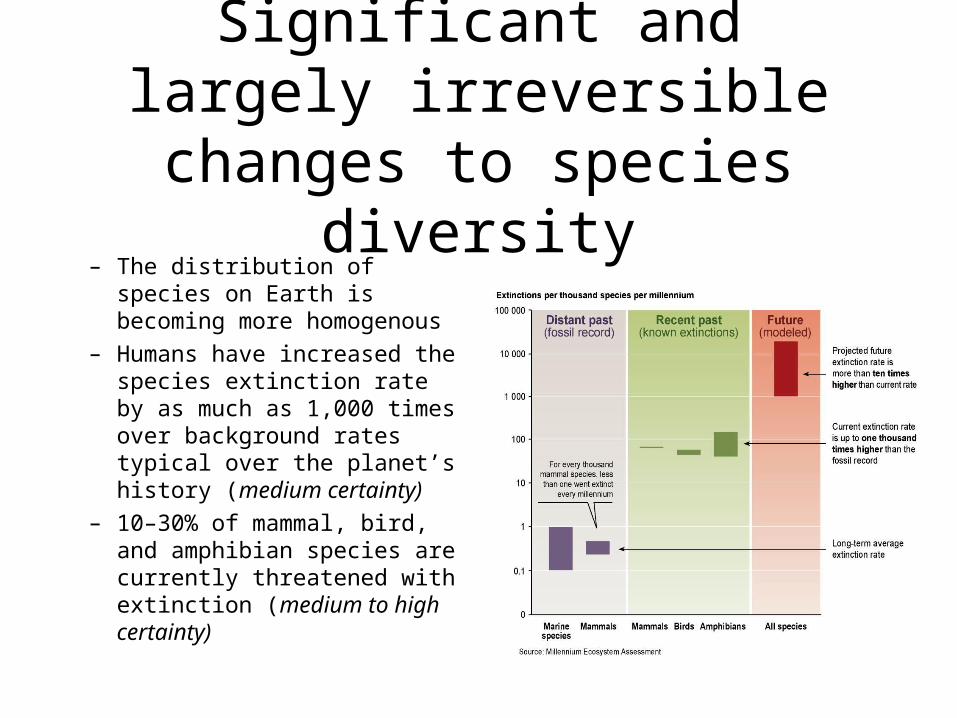
Significant and largely irreversible changes to
species diversity– The distribution of species on
Earth is becoming more homogenous
– Humans have increased the species extinction rate by as much as 1,000 times over background rates typical over the planet’s history (medium certainty)
– 10–30% of mammal, bird, and amphibian species are currently threatened with extinction (medium to high certainty)
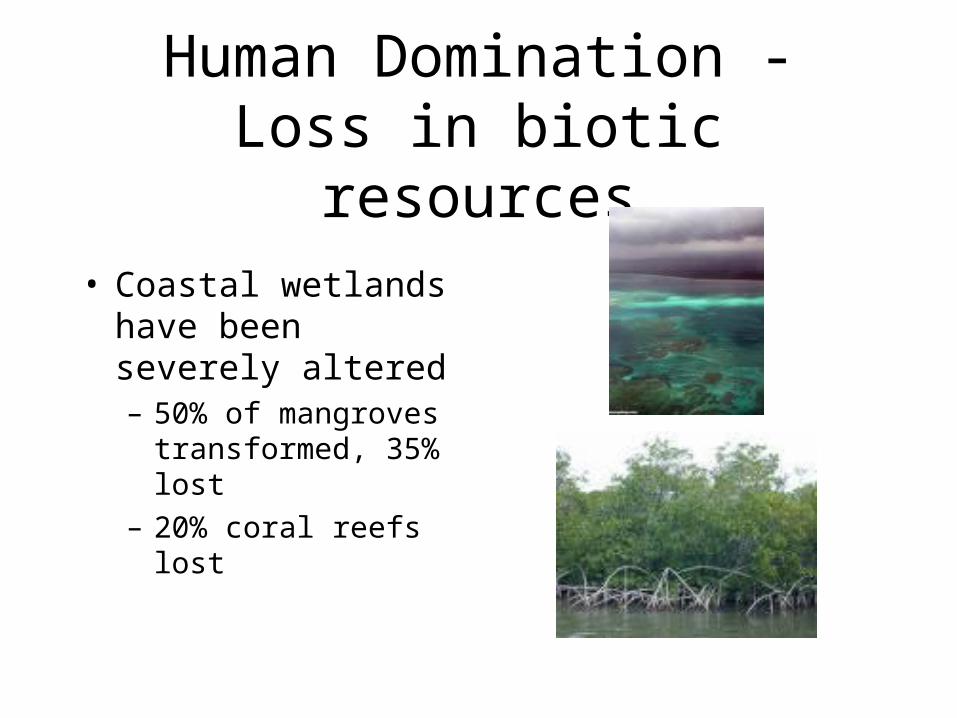
Human Domination - Loss in biotic resources
• Coastal wetlands have been severely altered– 50% of mangroves
transformed, 35% lost
– 20% coral reefs lost
The Oceans
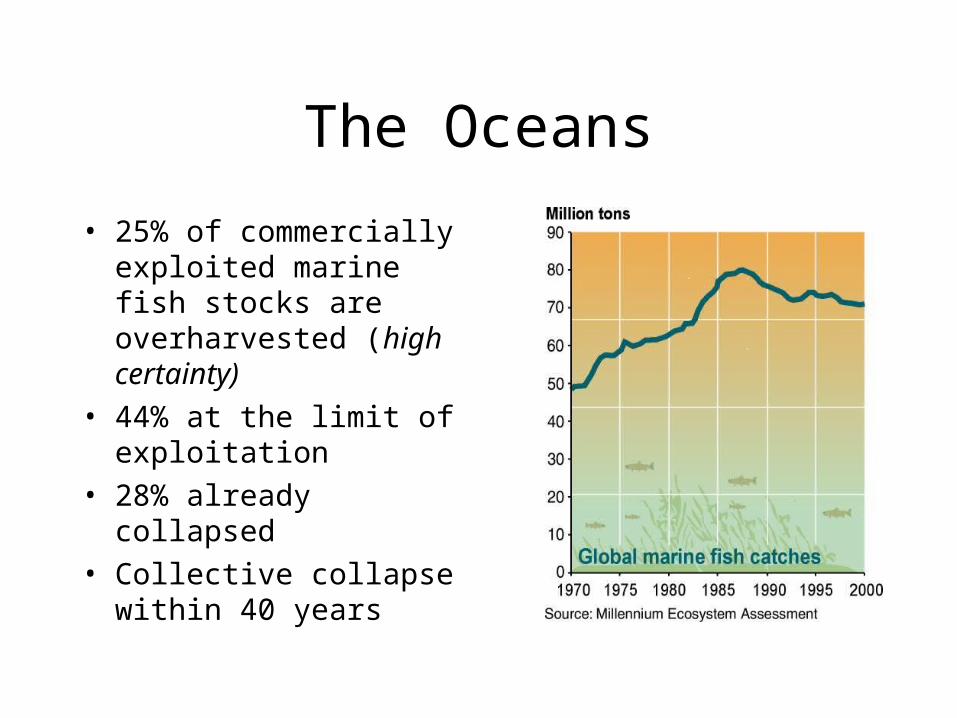
• 25% of commercially exploited marine fish stocks are overharvested (high certainty)
• 44% at the limit of exploitation
• 28% already collapsed• Collective collapse
within 40 years
The Oceans
• Serious impact from fishing gear
• Implications from discards
• Increase in the frequency of algal blooms– Temperature, nutrients, salinity
• Changes in the distribution of species– Possibly due to climate change
Human Domination
Human Domination
• Biogeochemical Cycles– Carbon– Nitrogen– Sulfur– Water cycle
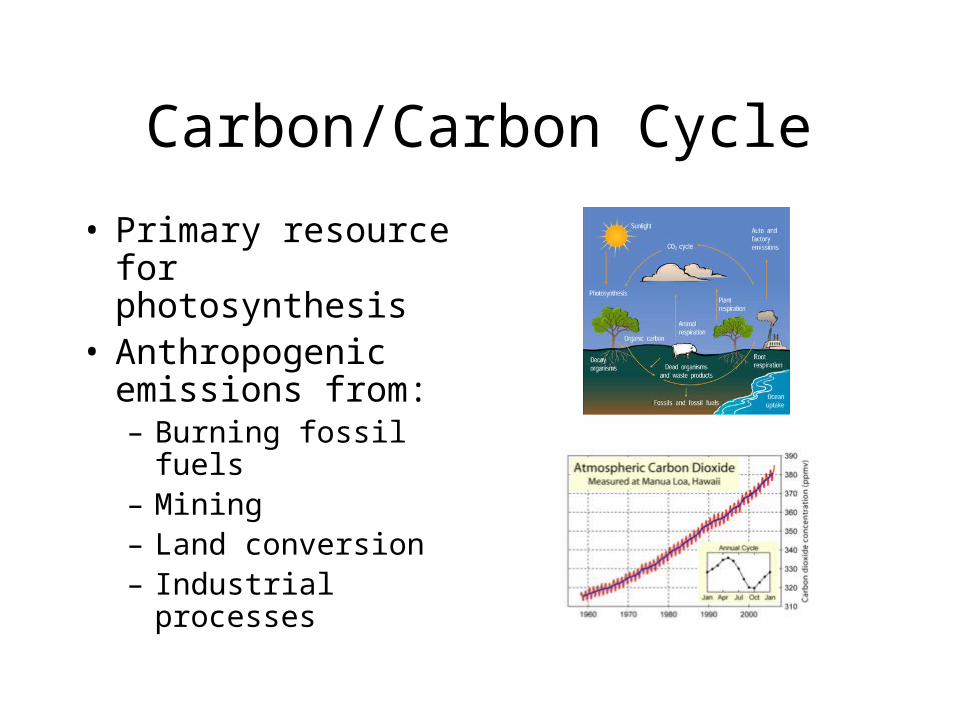
Carbon/Carbon Cycle
• Primary resource for photosynthesis
• Anthropogenic emissions from:– Burning fossil fuels– Mining– Land conversion– Industrial processes
Do we have a problem?
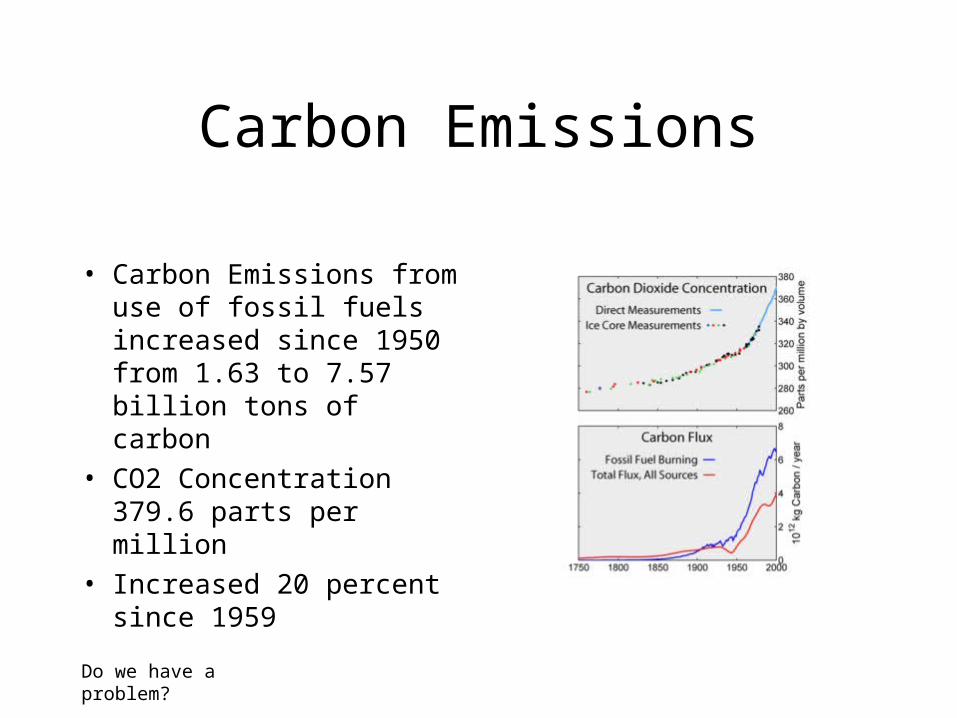
Carbon Emissions
• Carbon Emissions from use of fossil fuels increased since 1950 from 1.63 to 7.57 billion tons of carbon
• CO2 Concentration 379.6 parts per million
• Increased 20 percent since 1959
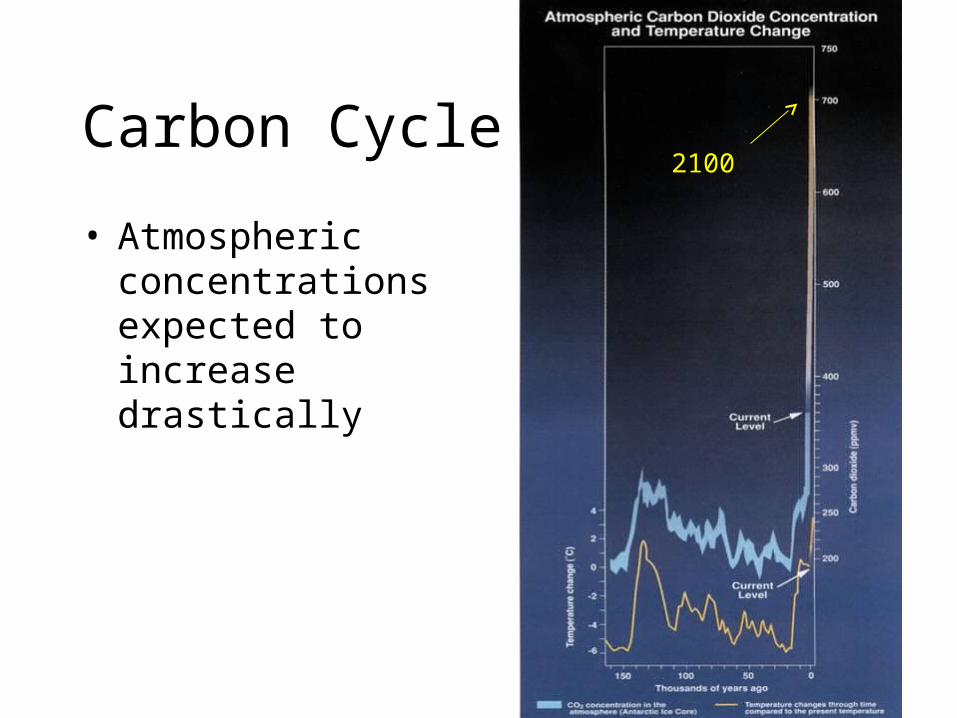
Carbon Cycle
• Atmospheric concentrations expected to increase drastically
2100
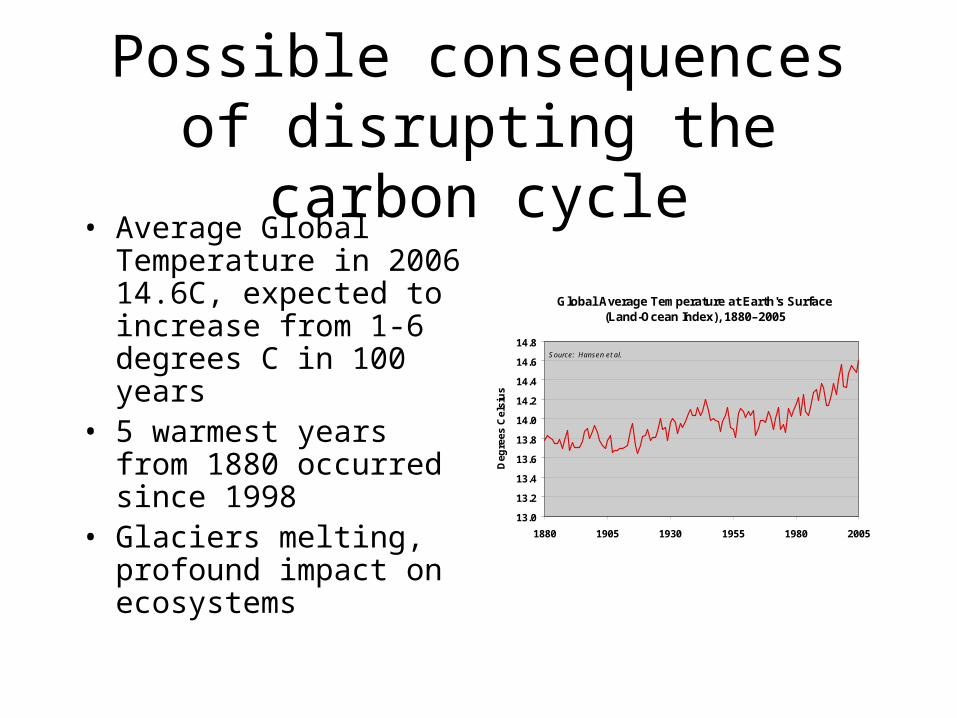
Possible consequences of disrupting the carbon cycle
• Average Global Temperature in 2006 14.6C, expected to increase from 1-6 degrees C in 100 years
• 5 warmest years from 1880 occurred since 1998
• Glaciers melting, profound impact on ecosystems
Global Average Temperature at Earth's Surface(Land-Ocean Index), 1880–2005
13.0
13.2
13.4
13.6
13.8
14.0
14.2
14.4
14.6
14.8
1880 1905 1930 1955 1980 2005
Source: Hansen et al.
Deg
rees
Cel
siu
s
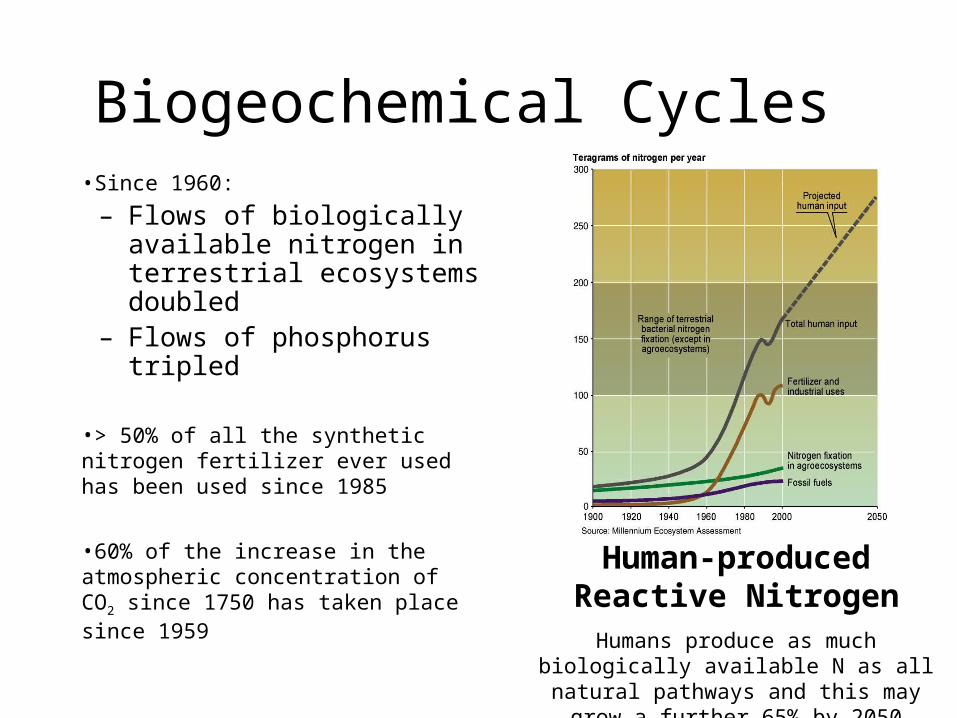
Biogeochemical Cycles•Since 1960:
– Flows of biologically available nitrogen in terrestrial ecosystems doubled
– Flows of phosphorus tripled
•> 50% of all the synthetic nitrogen fertilizer ever used has been used since 1985
•60% of the increase in the atmospheric concentration of CO2 since 1750 has taken place since 1959 Human-produced Reactive
NitrogenHumans produce as much biologically
available N as all natural pathways and this may grow a further 65% by
2050
Fresh Water
• To meet increasing demand:– Altered river systems, 2% of rivers in USA
run unimpeded– Withdrawal so extensive in many rivers
little water reaches the ocean– Depletion of aquifers (groundwater)
• Serious impact from dams• Dilution of waste - transportation
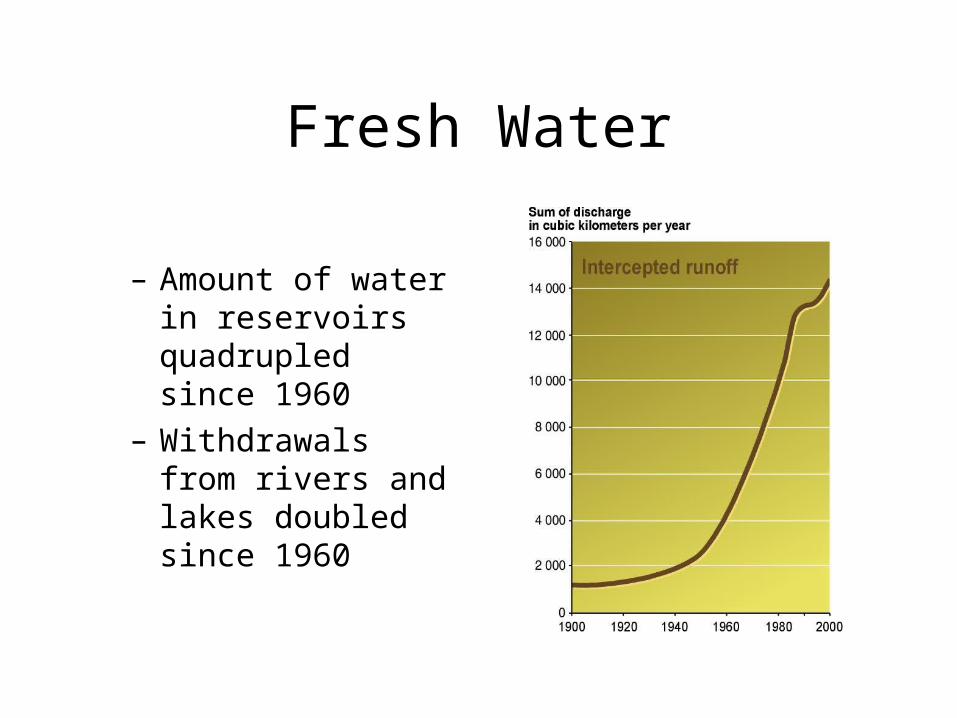
Fresh Water
– Amount of water in reservoirs quadrupled since 1960
– Withdrawals from rivers and lakes doubled since 1960
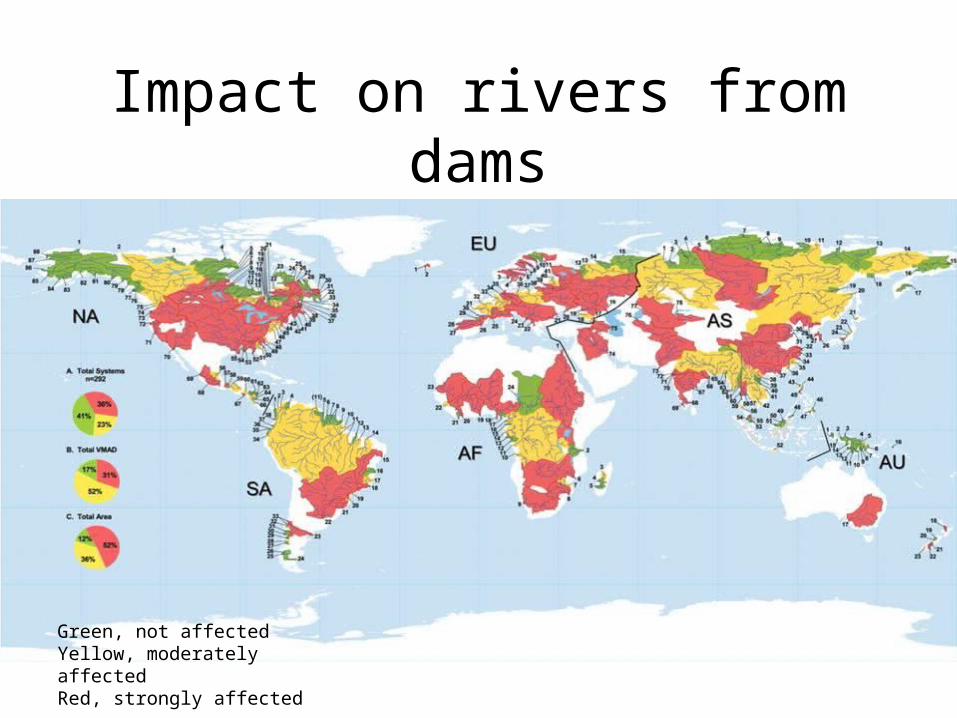
Impact on rivers from dams
Green, not affectedYellow, moderately affectedRed, strongly affected
A closer look 1Human appropriation of the products of
photosynthesis
• Vitousek et al. 1986
• Examined the impact on the biosphere by calculating the NPP (Net primary production) that humans have appropriated
• Seminal study
Human appropriation of the products of photosynthesis
• NPP: is the amount of energy left after subtracting the respiration of primary producers from the total amount of energy that is fixed biologically through photosynthesis
• Total food resource on the earth
Human appropriation of the Products of Photosynthesis
Conclusion=>40% of terrestrial NPP, 25% of global
NPP
A closer look 2Human Appropriation of the products of
freshwater• Objective:
• Assess how much of the Earth’s renewable freshwater is realistically accessible to humans
• Assess how much humans use directly
Human Appropriation of the Products of Freshwater
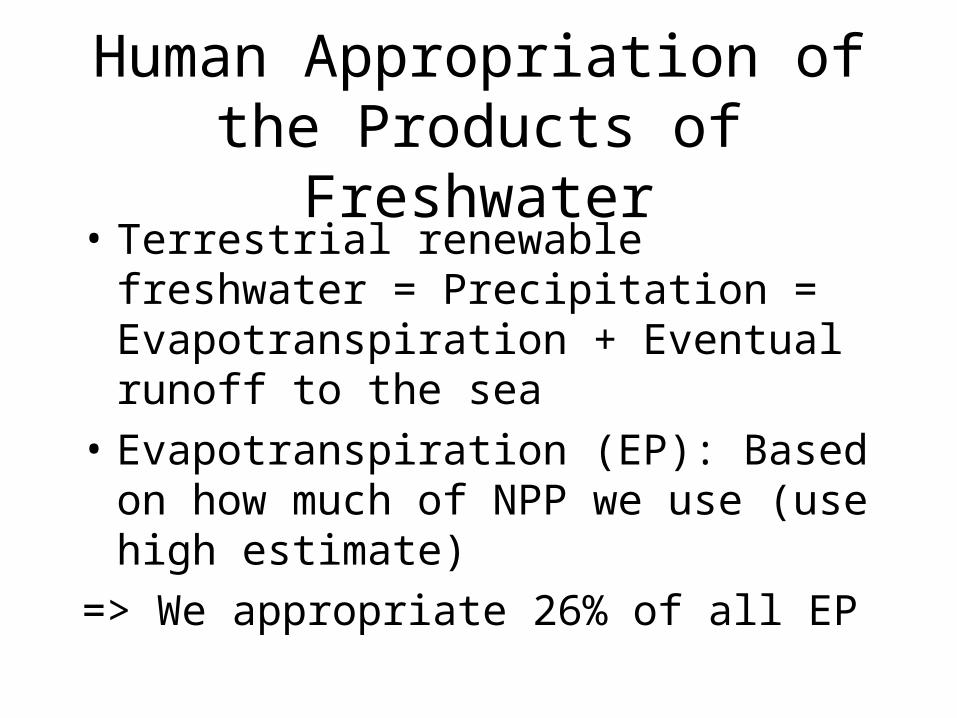
• Terrestrial renewable freshwater = Precipitation = Evapotranspiration + Eventual runoff to the sea
• Evapotranspiration (EP): Based on how much of NPP we use (use high estimate)
=> We appropriate 26% of all EP
Human Appropriation of the Products of Freshwater
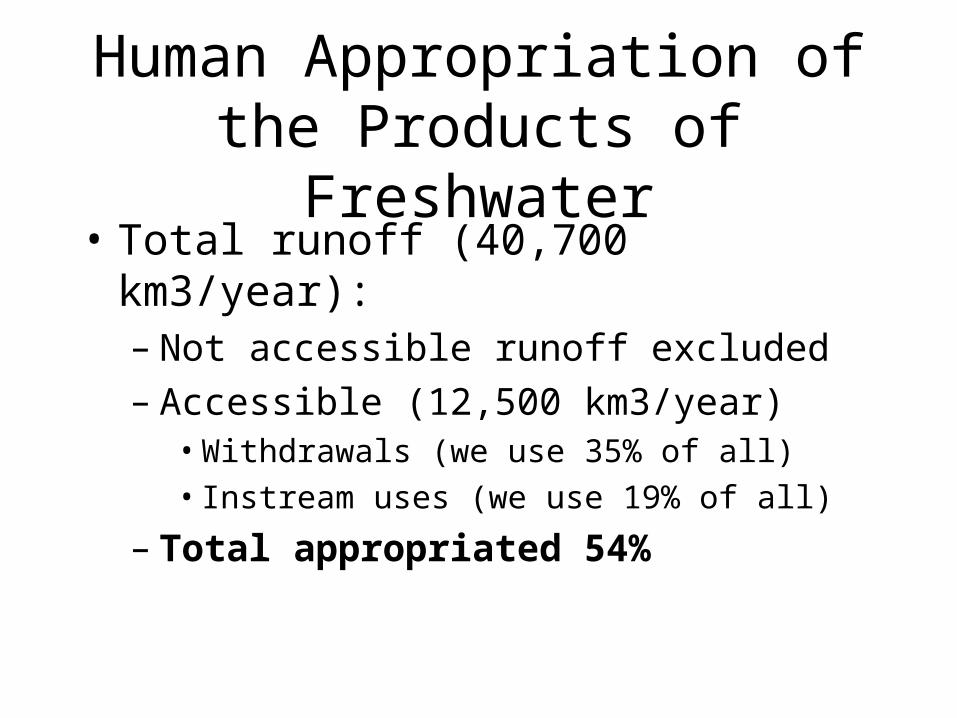
• Total runoff (40,700 km3/year):– Not accessible runoff excluded– Accessible (12,500 km3/year)
• Withdrawals (we use 35% of all)• Instream uses (we use 19% of all)
– Total appropriated 54%
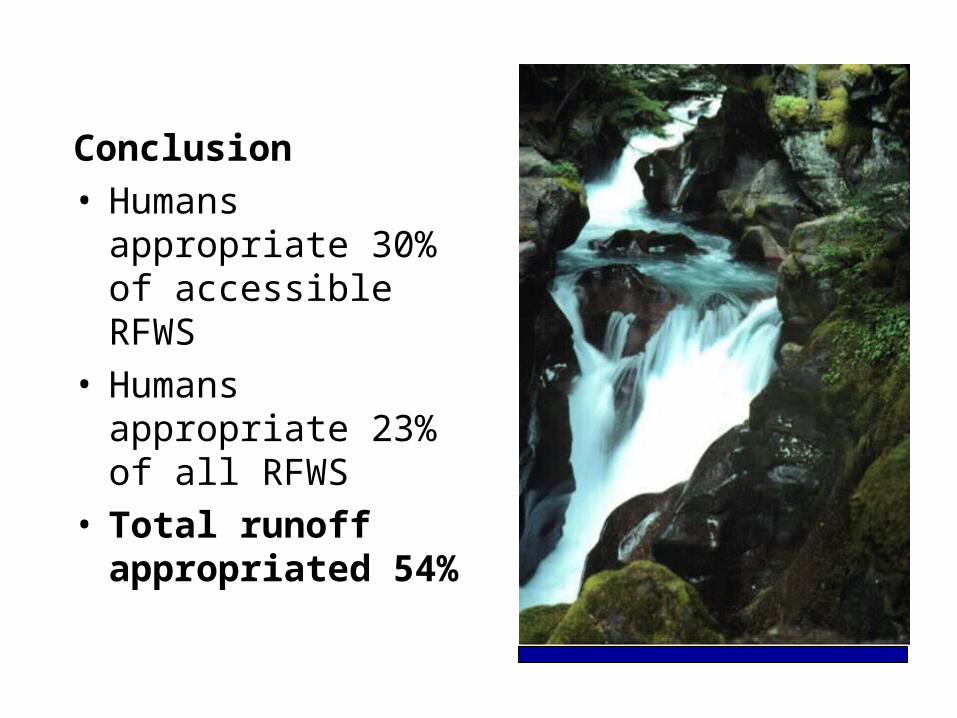
Conclusion• Humans appropriate
30% of accessible RFWS
• Humans appropriate 23% of all RFWS
• Total runoff appropriated 54%
The Debate - is this a problem?
• The Doomsayers– The environment is going to hell and
human life is doomed to only get worse.– Malthus in Principles of Population– Ehrlich and Ehrlich in the Population Bomb– Yes - we are running out of resources, the
air is bad,the water worse……
The Debate - is this a problem?
• The Doomslayers:– Julian Simon and Bjorn Lombok - the claims of the
doomsayers are false, based on faulty data– Humans are better off than before– Resources are not running out - people create
resources and will simply shift to something new– New technologies will continue to reduce pollution
etc. – The world is not coming to an end!
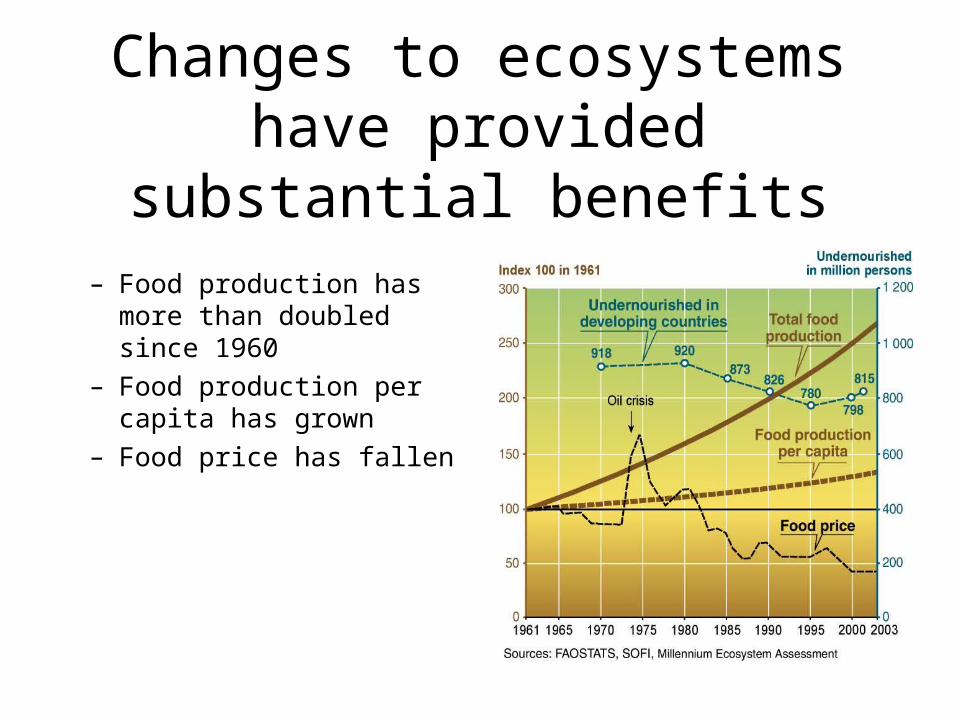
Changes to ecosystems have provided substantial benefits
– Food production has more than doubled since 1960
– Food production per capita has grown
– Food price has fallen
Industries based on ecosystem services still the
mainstay of many economies• Contributions of agriculture
– Agricultural labor force accounts for 22% of the world’s population and half the world’s total labor force
– Agriculture accounts for 24% of GDP in low income developing countries
• Market value of ecosystem-service industries– Food production: $980 billion per year– Timber industry: $400 billion per year– Marine fisheries: $80 billion per year– Marine aquaculture: $57 billion per year– Recreational hunting and fishing: >$75 billion per year in the
United States alone
Degradation and unsustainable use of ecosystem services
– Approximately 60% (15 out of 24) of the ecosystem services evaluated in the MEA assessment are being degraded or used unsustainably
– The degradation of ecosystem services often causes significant harm to human well-being and represents a loss of a natural asset or wealth of a country
– Not to mention impact on poverty
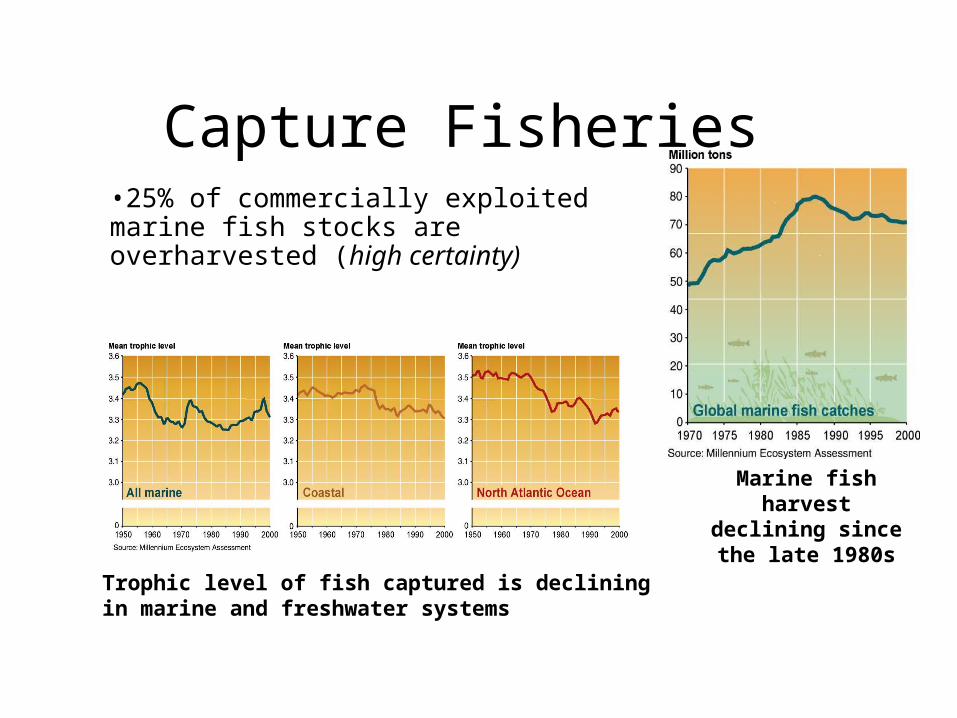
Capture Fisheries •25% of commercially exploited marine fish stocks are overharvested (high certainty)
Trophic level of fish captured is declining in marine and freshwater systems
Marine fish harvest declining since the
late 1980s
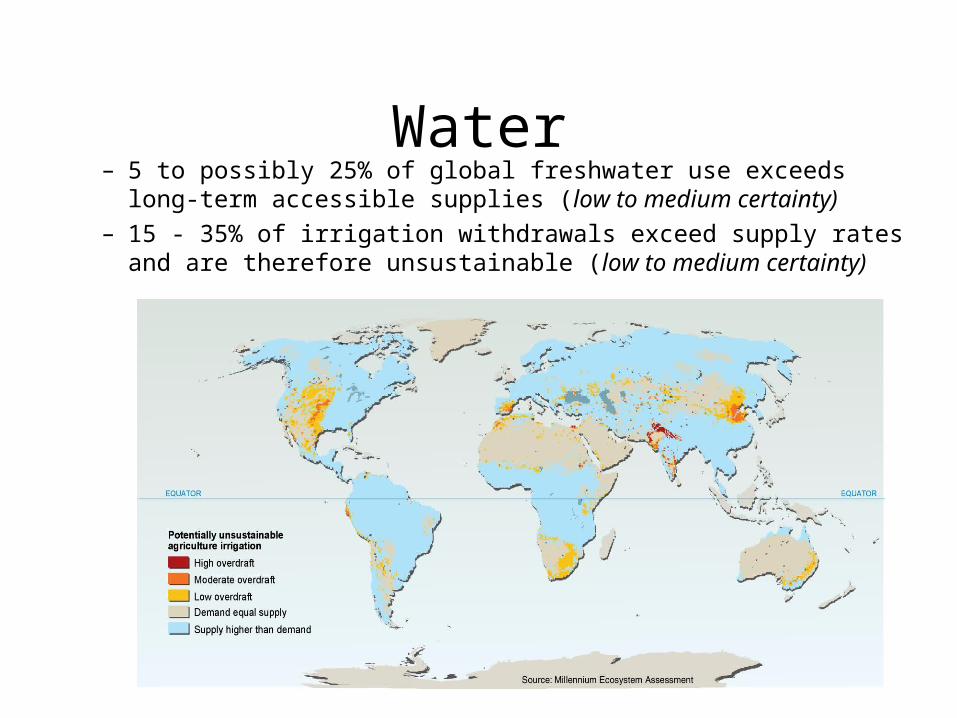
Water– 5 to possibly 25% of global freshwater use exceeds long-term
accessible supplies (low to medium certainty)– 15 - 35% of irrigation withdrawals exceed supply rates and are
therefore unsustainable (low to medium certainty)
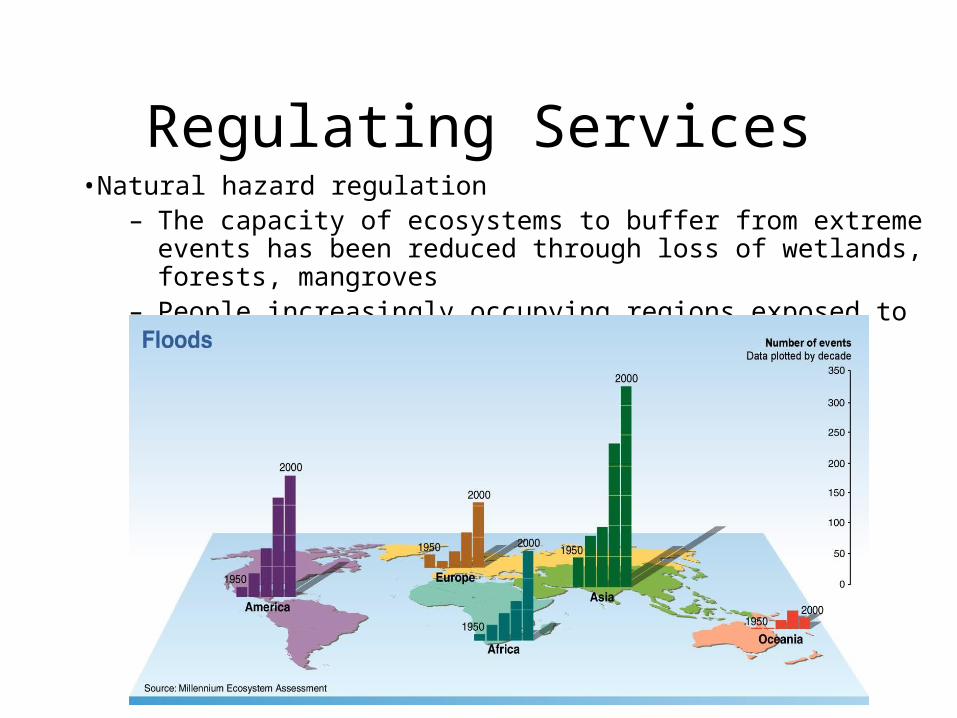
Regulating Services•Natural hazard regulation
– The capacity of ecosystems to buffer from extreme events has been reduced through loss of wetlands, forests, mangroves
– People increasingly occupying regions exposed to extreme events
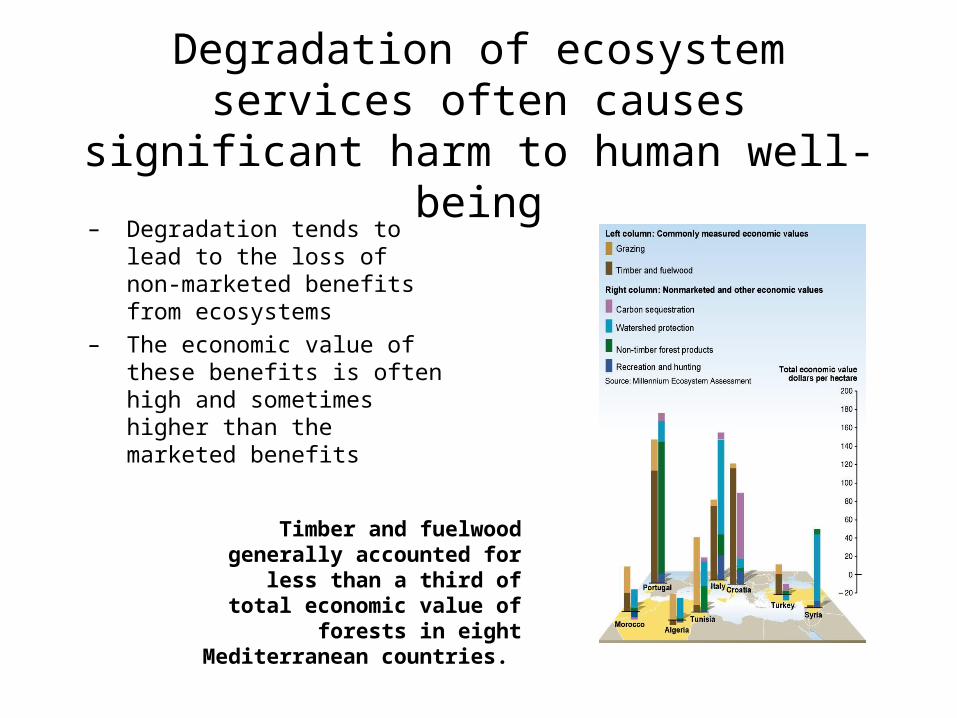
Degradation of ecosystem services often causes significant harm to human well-
being– Degradation tends to lead
to the loss of non-marketed benefits from ecosystems
– The economic value of these benefits is often high and sometimes higher than the marketed benefits
Timber and fuelwood generally accounted for less than a third
of total economic value of forests in eight Mediterranean
countries.
The Debate - is this a problem?
• Truth somewhere in between
• Your role to prevent the doomsayers predictions! – to do so we need to know the extent and nature of the degradation and what is causing the degradation.
Related Documents