Two-stage data driven filtering for local damage detection in presence of time varying signal to noise ratio Jakub Obuchowski 1 *, Agnieszka Wylomanska 2 , Radoslaw Zimroz 1,3 1 Diagnostics and Vibro-Acoustics Science Laboratory, Na Grobli 15, 50-421 Wroclaw, Wroclaw University of Technology, Poland 2 Hugo Steinhaus Center, Institute of Mathematics and Computer Science, Janiszewskiego 14a, 50-370 Wroclaw, Wroclaw University of Technology, Poland 3 KGHM Cuprum Ltd., Research & Development Centre, Sikorskiego 2-8, 53-659 Wroclaw, Poland Email:[email protected] , [email protected] , [email protected] . Abstract Local damage detection in rotating machinery can be a very difficult issue due to time-varying load or presence of another damage reflected in amplitude modulation of the raw vibration signal. In this paper a two-stage filtering method is presented to deal with this problem. The first stage is based on autoregressive (AR) modeling. It is incorporated to remove high-energy components that mask an informative signal. High-energy amplitudes of mesh harmonics modulated by other damage or load variation can affect optimal frequency band selectors as well, so they have to be removed. The second stage relies on filtering the AR-residual signal using a linear filter based on an informative frequency band selector. Here as a selector we propose to use the average horizontal distance on quantile-quantile plot. We compare the result of the second stage with the spectral kurtosis. The procedure is illustrated by real data analysis of two-stage gearbox used in a driving system for belt conveyor in an open-pit mine. Key words Local damage, Time varying conditions, Autoregression, Frequency band selector. 1.0 Introduction Local damage detection in rotating machinery operating in industrial conditions is a challenging problem. Inconveniences might be related to uncontrolled load and

Welcome message from author
This document is posted to help you gain knowledge. Please leave a comment to let me know what you think about it! Share it to your friends and learn new things together.
Transcript
Two-stage data driven filtering for local damage detection in presence of time varying signal to noise ratio
Jakub Obuchowski1*, Agnieszka Wylomanska2, Radoslaw Zimroz1,3
1 Diagnostics and Vibro-Acoustics Science Laboratory, Na Grobli 15, 50-421 Wroclaw, Wroclaw University of Technology, Poland2 Hugo Steinhaus Center, Institute of Mathematics and Computer Science, Janiszewskiego
14a, 50-370 Wroclaw, Wroclaw University of Technology, Poland3 KGHM Cuprum Ltd., Research & Development Centre, Sikorskiego 2-8, 53-659 Wroclaw,
Poland
Email:[email protected], [email protected], [email protected].
Abstract Local damage detection in rotating machinery can be a very difficult issue due to time-varying load or presence of another damage reflected in ampli-tude modulation of the raw vibration signal. In this paper a two-stage filtering method is presented to deal with this problem. The first stage is based on autore-gressive (AR) modeling. It is incorporated to remove high-energy components that mask an informative signal. High-energy amplitudes of mesh harmonics modu-lated by other damage or load variation can affect optimal frequency band selec-tors as well, so they have to be removed. The second stage relies on filtering the AR-residual signal using a linear filter based on an informative frequency band se-lector. Here as a selector we propose to use the average horizontal distance on quantile-quantile plot. We compare the result of the second stage with the spectral kurtosis. The procedure is illustrated by real data analysis of two-stage gearbox used in a driving system for belt conveyor in an open-pit mine.
Key words Local damage, Time varying conditions, Autoregression, Frequency band selector.
1.0 Introduction
Local damage detection in rotating machinery operating in industrial conditions is a challenging problem. Inconveniences might be related to uncontrolled load and speed changes, unknown condition of a diagnosed machine, transmission of vibra-tions from other machines, acquisition of vibrations not related to operation of the
machine, lack of data due to temporary failure of a signal acquisition system, etc. On the other hand, such problems lead to development of novel signal processing methods that substitute those which does not work properly in case of diagnostics in industrial conditions. In the paper we present a data driven method inspired by a vibration signal acquired during operation of a two stage gearbox operating in an open-pit mine. Both stages of the gearbox are damaged, thus the signal contains modulations related to two shaft frequencies. In this case, the signal of interest (SOI) related to local damage of the first stage gear-pair is mixed with amplitude modulated signal due to damage of the second stage. Thus, a time varying signal to noise ratio occurs which makes diagnostics more difficult. The method pro-posed in this paper is an extension of the method presented in [1,2,3].The method presented therein incorporates the idea of both decreasing power of narrowband spectral components by an autoregressive (AR) model and selection of an infor-mative frequency band using the spectral kurtosis. We propose to extend this method by using another criterion of AR model goodness-of-fit and another mea-sure of impulsiveness. It is worth mentioning that the AR model with constant co-efficients might be used only in the case of constant speed of the machine. In other cases the model should be extended, e.g. for cyclic changes of rotational speed a periodic autoregressive model (PAR) might be used [4,5]. If the speed is changing not in a cyclic way one can benefit from application of an adaptive AR filter (i.e. filter with coefficient varying in time) [6,7,8].The second step of the method is de-signed especially for industrial conditions. Instead of classical kurtosis, we pro-pose to use another measure which is as good as the kurtosis in standard case and more effective in case of single excitation occurred during signal acquisition. Such excitation might be not related to operation of the machine. Since the kurtosis is very sensitive to such single artifacts, one can benefit from other measures of im-pulsiveness, especially those based on quantiles or empirical cumulative distribu-tion function [9,10].
2.0 Methodology
The proposed two-stage procedure is based on signal filtering. Here we use both autoregressive modeling and optimal frequency band selection. Sometimes, the raw vibration signal contains a strong deterministic contamination which is highly amplitude modulated. In such case of time varying signal-to-noise ratio the signal of interest is invisible in both time series and envelope spectrum. Then, signal fil-tering based on measures of dispersion (e.g. the spectral kurtosis) may indicate wrong frequency band as informative. We propose to filter out the deterministic signal using autoregressive filtering. The next step is based on linear filtering us-ing frequency characteristics of the filter obtained by measures of impulsiveness. We compare filters driven by the spectral kurtosis and one of informative fre-quency band selectors presented in [9,10].
3
As it was mentioned, we use autoregressive model to filter out highly amplitude modulated mesh harmonics. The AR model of order p is defined as follows:
∑i=0
p
ϕ ( i ) X ( t−i )=ε (t ) (1)
where ¿and {ε ( t ) }( t> 0) stands for noise.It is known, the that AR time series model is able to model noisy sinusoidal pat -tern if its characteristic polynomial has complex roots. In the case of a large num-ber of harmonics a high-order AR model is expected with at least two complex roots for corresponding to one mesh harmonic. As an optimal order detector we use the highest Kolmogorov-Smirnov criterion, i.e. AR(p) is said to be optimal if the Kolmogorov-Smirnov (KS) test statistic of residuals is the highest [11]. Ac-cording to the fact that the residual signal in case of local damage should be im-pulsive, it is expected that the distance between empirical distribution and Gauss-ian one is high – the highest KS statistic, the more impulsive signal. Recall the KS statistic for signal X(t) is defined as follows [12]:
KS=supx|F̂ ( x )−F (x )|, (2)
where F̂ ( x ) is the empirical cumulative distribution function for given signal while F (x) is the cumulative distribution function of Gaussian distribution with parameters estimated form the signal.Moreover, the results of AR filtering are also checked by comparing time-fre-quency maps of the residual signal with the raw signal. Parameters of AR model are obtained by using Yule-Walker equations [13].
4
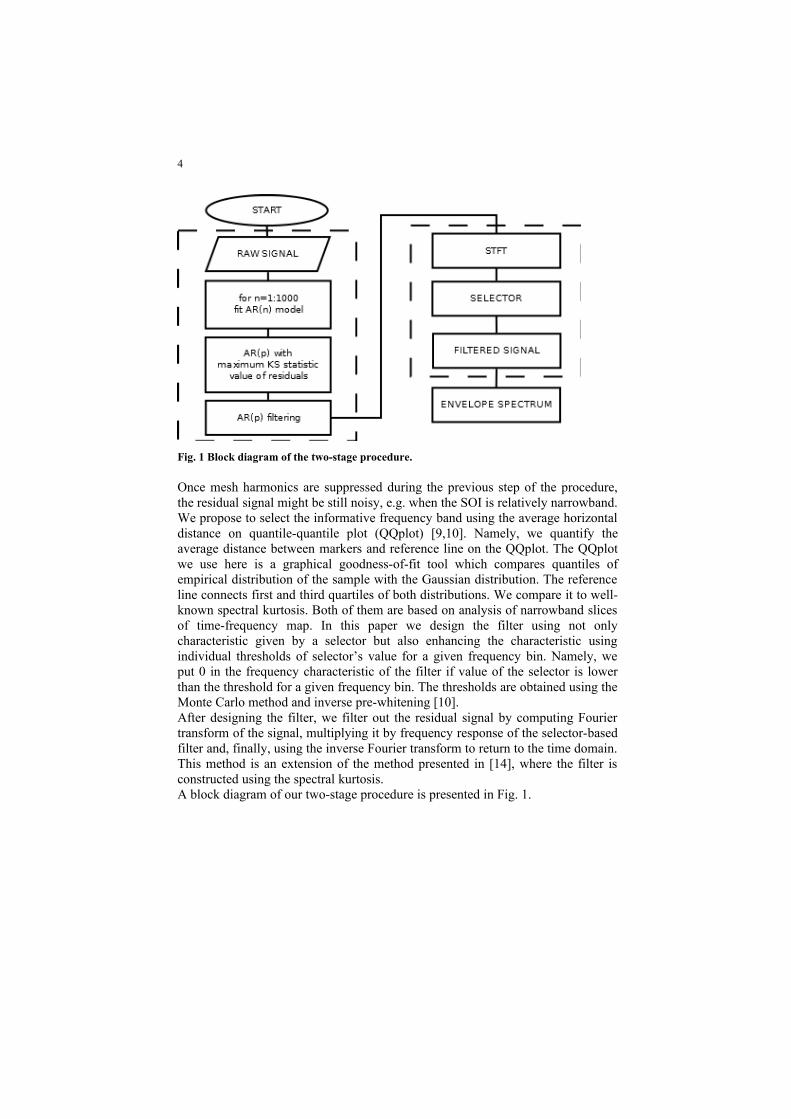
Fig. 1 Block diagram of the two-stage procedure.
Once mesh harmonics are suppressed during the previous step of the procedure, the residual signal might be still noisy, e.g. when the SOI is relatively narrowband. We propose to select the informative frequency band using the average horizontal distance on quantile-quantile plot (QQplot) [9,10]. Namely, we quantify the aver-age distance between markers and reference line on the QQplot. The QQplot we use here is a graphical goodness-of-fit tool which compares quantiles of empirical distribution of the sample with the Gaussian distribution. The reference line con-nects first and third quartiles of both distributions. We compare it to well-known spectral kurtosis. Both of them are based on analysis of narrowband slices of time-frequency map. In this paper we design the filter using not only characteristic given by a selector but also enhancing the characteristic using individual thresh-olds of selector’s value for a given frequency bin. Namely, we put 0 in the fre-quency characteristic of the filter if value of the selector is lower than the thresh-old for a given frequency bin. The thresholds are obtained using the Monte Carlo method and inverse pre-whitening [10].After designing the filter, we filter out the residual signal by computing Fourier transform of the signal, multiplying it by frequency response of the selector-based filter and, finally, using the inverse Fourier transform to return to the time domain. This method is an extension of the method presented in [14], where the filter is constructed using the spectral kurtosis.A block diagram of our two-stage procedure is presented in Fig. 1.
3.0 Real data analysis
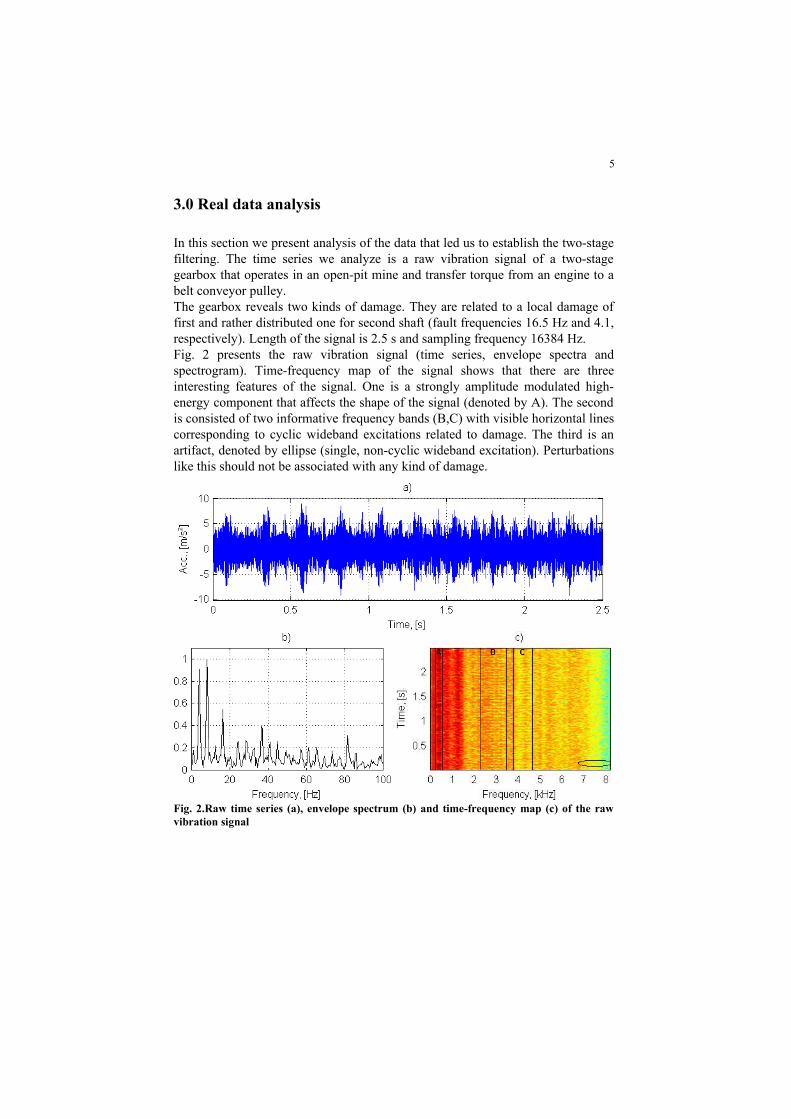
In this section we present analysis of the data that led us to establish the two-stage filtering. The time series we analyze is a raw vibration signal of a two-stage gear-box that operates in an open-pit mine and transfer torque from an engine to a belt conveyor pulley.The gearbox reveals two kinds of damage. They are related to a local damage of first and rather distributed one for second shaft (fault frequencies 16.5 Hz and 4.1, respectively). Length of the signal is 2.5 s and sampling frequency 16384 Hz.Fig. 2 presents the raw vibration signal (time series, envelope spectra and spectro-gram). Time-frequency map of the signal shows that there are three interesting features of the signal. One is a strongly amplitude modulated high-energy compo-nent that affects the shape of the signal (denoted by A). The second is consisted of two informative frequency bands (B,C) with visible horizontal lines corresponding to cyclic wideband excitations related to damage. The third is an artifact, denoted by ellipse (single, non-cyclic wideband excitation). Perturbations like this should not be associated with any kind of damage.
5
Fig. 2.Raw time series (a), envelope spectrum (b) and time-frequency map (c) of the raw vi -bration signal
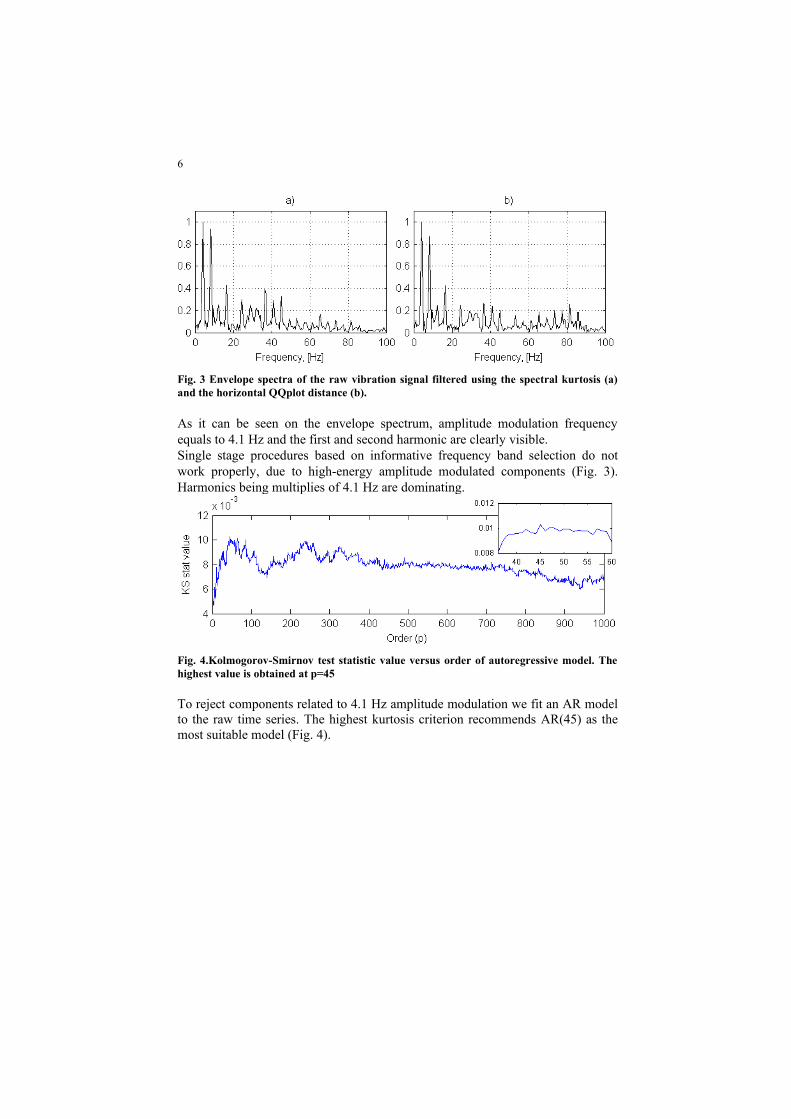
Fig. 3 Envelope spectra of the raw vibration signal filtered using the spectral kurtosis (a) and the horizontal QQplot distance (b).
As it can be seen on the envelope spectrum, amplitude modulation frequency equals to 4.1 Hz and the first and second harmonic are clearly visible. Single stage procedures based on informative frequency band selection do not work properly, due to high-energy amplitude modulated components (Fig. 3). Har-monics being multiplies of 4.1 Hz are dominating.
6
Fig. 4.Kolmogorov-Smirnov test statistic value versus order of autoregressive model. The highest value is obtained at p=45
To reject components related to 4.1 Hz amplitude modulation we fit an AR model to the raw time series. The highest kurtosis criterion recommends AR(45) as the most suitable model (Fig. 4).
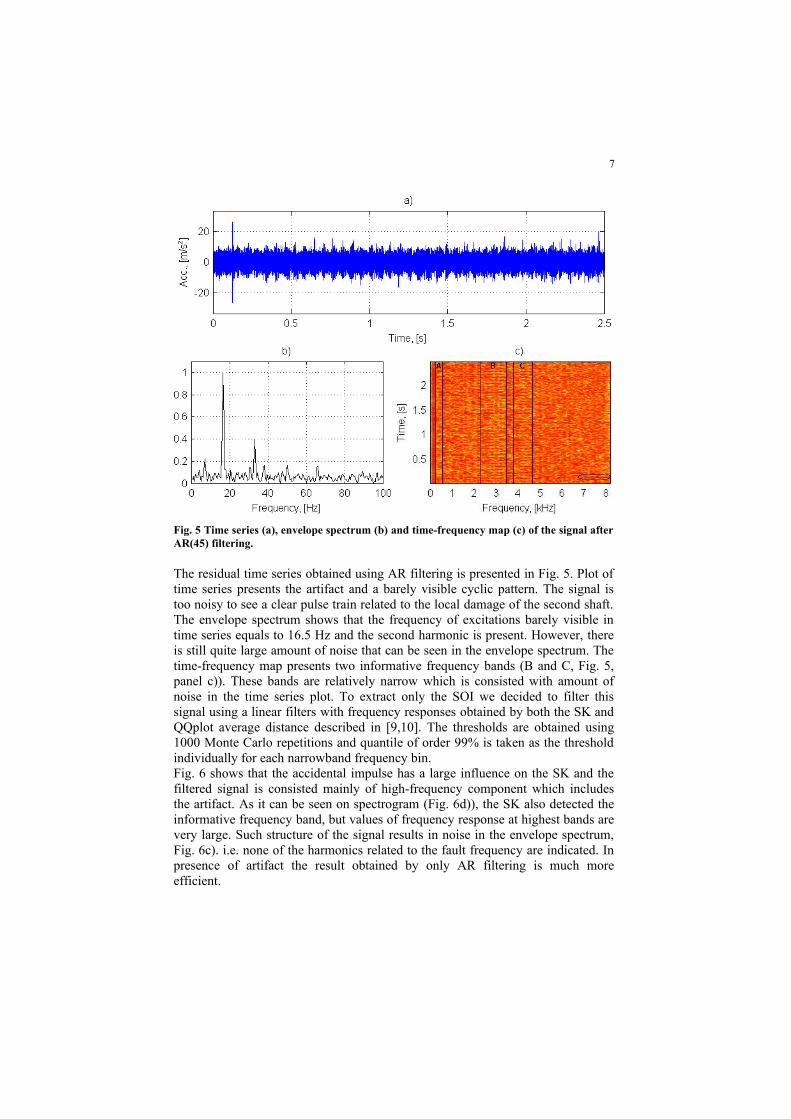
Fig. 5 Time series (a), envelope spectrum (b) and time-frequency map (c) of the signal after AR(45) filtering.
The residual time series obtained using AR filtering is presented in Fig. 5. Plot of time series presents the artifact and a barely visible cyclic pattern. The signal is too noisy to see a clear pulse train related to the local damage of the second shaft. The envelope spectrum shows that the frequency of excitations barely visible in time series equals to 16.5 Hz and the second harmonic is present. However, there
7
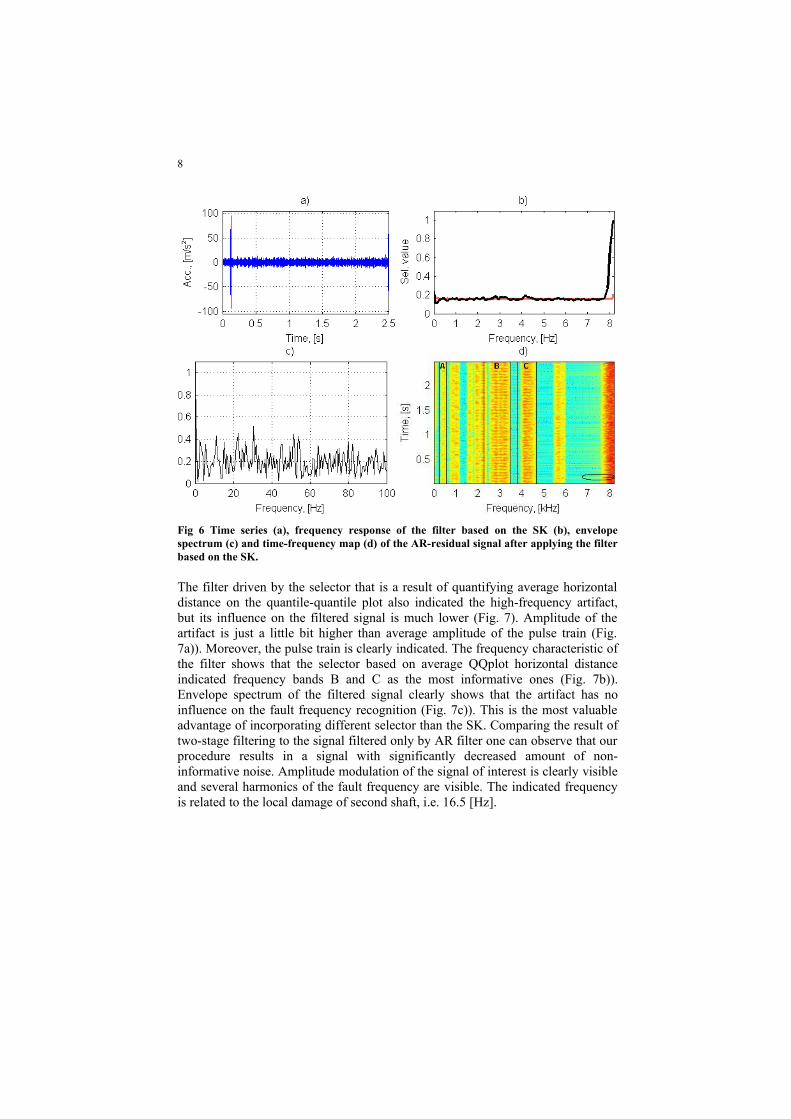
is still quite large amount of noise that can be seen in the envelope spectrum. The time-frequency map presents two informative frequency bands (B and C, Fig. 5, panel c)). These bands are relatively narrow which is consisted with amount of noise in the time series plot. To extract only the SOI we decided to filter this sig-nal using a linear filters with frequency responses obtained by both the SK and QQplot average distance described in [9,10]. The thresholds are obtained using 1000 Monte Carlo repetitions and quantile of order 99% is taken as the threshold individually for each narrowband frequency bin.Fig. 6 shows that the accidental impulse has a large influence on the SK and the filtered signal is consisted mainly of high-frequency component which includes the artifact. As it can be seen on spectrogram (Fig. 6d)), the SK also detected the informative frequency band, but values of frequency response at highest bands are very large. Such structure of the signal results in noise in the envelope spectrum, Fig. 6c). i.e. none of the harmonics related to the fault frequency are indicated. In presence of artifact the result obtained by only AR filtering is much more effi -cient.
Fig 6 Time series (a), frequency response of the filter based on the SK (b), envelope spec -trum (c) and time-frequency map (d) of the AR-residual signal after applying the filter based on the SK.
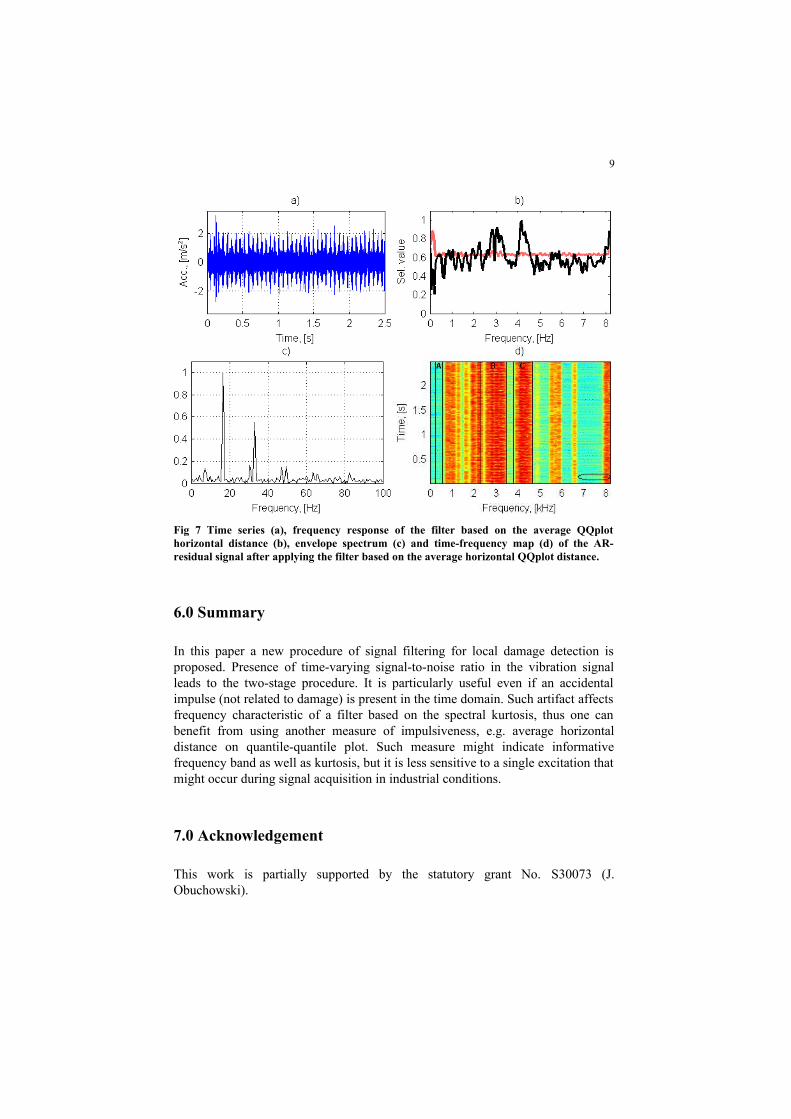
The filter driven by the selector that is a result of quantifying average horizontal distance on the quantile-quantile plot also indicated the high-frequency artifact, but its influence on the filtered signal is much lower (Fig. 7). Amplitude of the ar -tifact is just a little bit higher than average amplitude of the pulse train (Fig. 7a)). Moreover, the pulse train is clearly indicated. The frequency characteristic of the
8
filter shows that the selector based on average QQplot horizontal distance indi-cated frequency bands B and C as the most informative ones (Fig. 7b)). Envelope spectrum of the filtered signal clearly shows that the artifact has no influence on the fault frequency recognition (Fig. 7c)). This is the most valuable advantage of incorporating different selector than the SK. Comparing the result of two-stage fil-tering to the signal filtered only by AR filter one can observe that our procedure results in a signal with significantly decreased amount of non-informative noise. Amplitude modulation of the signal of interest is clearly visible and several har-monics of the fault frequency are visible. The indicated frequency is related to the local damage of second shaft, i.e. 16.5 [Hz].
Fig 7 Time series (a), frequency response of the filter based on the average QQplot horizon -tal distance (b), envelope spectrum (c) and time-frequency map (d) of the AR-residual sig -nal after applying the filter based on the average horizontal QQplot distance.
6.0 Summary
In this paper a new procedure of signal filtering for local damage detection is pro-posed. Presence of time-varying signal-to-noise ratio in the vibration signal leads to the two-stage procedure. It is particularly useful even if an accidental impulse (not related to damage) is present in the time domain. Such artifact affects fre-quency characteristic of a filter based on the spectral kurtosis, thus one can benefit from using another measure of impulsiveness, e.g. average horizontal distance on
9
quantile-quantile plot. Such measure might indicate informative frequency band as well as kurtosis, but it is less sensitive to a single excitation that might occur dur-ing signal acquisition in industrial conditions.
7.0 Acknowledgement
This work is partially supported by the statutory grant No. S30073 (J. Obuchowski).
References
[1] Sawalhi, N., Randall, R.B., 2005. Spectral kurtosis enhancement using autoregressive mod-els. 4th Australasian Congress on Applied Mechanics, pp. 231-236.
[2] Sawalhi, N., Randall, R.B., 2011. Signal Pre-whitening for fault detection enhancement and surveillance in rolling element bearings. Paper presented at the Eighth International Confer-ence on Condition Monitoring and Machinery Failure Prevention Technologies, St David’s Hotel, , June 20-22, Cardiff, UK.
[3] Sawalhi, N., Randall, R.B., 2011. Vibration response of spalled rolling element bearings: Ob-servations, simulations and signal processing techniques to track the spall size. Mechanical Systems and Signal Processing, 25(3), pp. 846-870.
[4] Wyłomańska, A., Obuchowski, J., Zimroz, R., Hurd, H., 2014. Periodic autoregressive mod-eling of vibration time series from planetary gearbox used in bucket wheel excavator, in Cy-clostationarity: Theory and Methods Lecture Notes in Mechanical Engineering, Fakher Chaari et al. (eds.), pp. 171-186.
[5] Broszkiewicz-Suwaj, E., Makagon, A., Weron, R., Wyłomańska, A., 2004. On detecting and modeling periodic correlation in financial data, Physica A 336, pp. 196-205.
[6] Makowski, R., Zimroz, R., 2014. New techniques of local damage detection in machinery based on stochastic modelling using adaptive Schur filter, Applied Acoustics 77, pp. 130-137.
[7] Makowski, R.A., Zimroz, R., 2011. Adaptive bearings vibration modelling for diagnosis, Lecture Notes in Computer Science (including subseries Lecture Notes in Artificial Intelli -gence and Lecture Notes in Bioinformatics) 6943 LNAI , pp. 248-259.
[8] Makowski, R., Zimroz, R., 2013. A procedure for weighted summation of the derivatives of reflection coefficients in adaptive Schur filter with application to fault detection in rolling el -ement bearings, Mechanical Systems and Signal Processing 38 (1), pp. 65-77.
[9] Obuchowski, J., Wylomanska, A., Zimroz, R., 2013. Stochastic modelling of time series with application to local damage detection in rotating machinery, Key Engineering Materials, 569-570, pp. 441-449.
[10] Obuchowski, J., Wylomanska, A., Zimroz, R.,2013. Novel enhancement techniques for noisy vibration signals applied to local damage detection in rotating machines, Proceedings of International conference Surveillance 7, October 29-31, Chartres, France.
[11] Zhan, Y., Mechefske, C.K., 2007. Robust detection of gearbox deterioration using compro-mised autoregressive modeling and Kolmogorov–Smirnov test statistic - Part I: Compromised autoregressive modeling with the aid of hypothesis tests and simulation analysis, Mechanical Systems and Signal Processing 21 (5), pp. 1953-1982.
[12] Justel, A., Pen, D., Zamar, R., 1997. A multivariate Kolmogorov–Smirnov test of goodness of fit, Statistics & Probability Letters 35(3), pp. 251–259.
10
[13] Brockwell, P.J., Davis, R.A., 2006. Time Series: Theory and Methods. Springer Series in Sta-tistics.
[14] Combet, F., Gelman, L., 2009. Optimal filtering of gear signals for early damage detection based on the spectral kurtosis, Mechanical Systems and Signal Processing 23(3), pp. 652-668.
Related Documents