September 26, 2007 INTRA-REGIONAL TRADE OF REGIONAL TRADING BLOCS: THE CASE OF THE GULF COOPERATION COUNCIL by Adham Al Said* UWA Business School The University of Western Australia Abstract This paper adapts a framework to measure the effects of Regional Trade Agreements on international trade flows. It applies a two-step empirical model to analyse international and regional trade flows. The first step uses a gravity approach to determine trade flows between 145 countries over the last decade. The second step deals with intra-regional trade in the Gulf Cooperation Council (GCC) consisting of Bahrain, Kuwait, Oman, Qatar, Saudi Arabia, and UAE. Findings suggest that the GCC does not have a substantial impact on its members’ intra-regional trade. Moreover, the paper finds no distinct patterns of trade within the region. *I would like to thank Professor Ken Clements and Dr Abu Siddique for their continuous support and feedback while developing this paper. Errors and omission are my own.

Welcome message from author
This document is posted to help you gain knowledge. Please leave a comment to let me know what you think about it! Share it to your friends and learn new things together.
Transcript
September 26, 2007
INTRA-REGIONAL TRADE OF REGIONAL TRADING BLOCS: THE CASE OF THE GULF COOPERATION COUNCIL
by
Adham Al Said* UWA Business School
The University of Western Australia
Abstract This paper adapts a framework to measure the effects of Regional Trade Agreements
on international trade flows. It applies a two-step empirical model to analyse international
and regional trade flows. The first step uses a gravity approach to determine trade flows
between 145 countries over the last decade. The second step deals with intra-regional trade in
the Gulf Cooperation Council (GCC) consisting of Bahrain, Kuwait, Oman, Qatar, Saudi
Arabia, and UAE. Findings suggest that the GCC does not have a substantial impact on its
members’ intra-regional trade. Moreover, the paper finds no distinct patterns of trade within
the region.
*I would like to thank Professor Ken Clements and Dr Abu Siddique for their continuous support and feedback while developing this paper. Errors and omission are my own.
ii
PREFACE
Thesis title: Economic Aspects of the Gulf Cooperation Council’s Integration Supervisors: Professor Ken Clements, Dr Abu Siddique Multilateral trade liberalisation is a central objective of the international community in the form of agreements such as the General Agreement on Tariffs and Trade, and currently the World Trade Organization. Although multiple negotiation rounds were conducted on the multilateral level, countries continue to depend on regional arrangements to promote trade and development. Examples include the European Union, North American Free Trade Area, and the Association of Southeast Asian Nations. As a result, effects of regional trading blocs on international trade are open to question. It is the aim of my thesis to investigate the specific effects of the Gulf Cooperation Council (GCC), comprising of Bahrain, Kuwait, Oman, Qatar, Saudi Arabia, and Qatar, as a regional trade agreement on its members’ trade and development. The thesis will analyse a number of key issues within the above context:
1. The GCC’s Performance as a Regional Trading Bloc Understanding the background of the founding of the GCC and its development will assist comparisons with other well-established blocs. Such analyses will yield important insights into the process of economic integration in resource-rich developing countries.
2. Intra-regional Trade of the GCC Understanding trade patterns within the GCC will reveal the effect of the trade bloc as an operational entity. Recent developments within the region promise to promote trade liberalisation. Empirical analysis will explore the potential benefits in terms of bilateral trade volumes and patterns.
3. Economic Integration of the GCC The justification for the founding of the GCC is the creation of a long-term
economic integration process. This process involves multiple liberalisation and standardisation procedures. To ensure success it is important that the economies involved be sufficiently comparable in their macroeconomic structures and patterns. Therefore, it is essential to study the fundamentals of the GCC’s economic integration process and its development. Such a study will yield a greater comprehension of the degree of the region’s success in integrating its economies.
The thesis will take the following structure: Chapter I: Introduction Chapter II: Regionalism, Trade, and Economic Development Chapter III: GCC Inception, Development, and Challenges Chapter IV: GCC Intra-regional Trade: A Gravity Model Approach Chapter V: Monetary and Macroeconomic Developments in the GCC Chapter VI: Conclusions This paper is based on a broader analysis of major RTAs in operation today and the GCC as posited in Chapter IV.
1
1 Introduction
The regionalisation of world trade is not a new phenomenon. In fact, it has gained
strength over the past few decades. Regional trade agreements (RTAs) reported to the World
Trade Organization have increased rapidly in both developed and developing countries.
However, not every RTA has been successful in improving the fortunes of its members. None
the less, RTAs continue to exist and regenerate themselves. The reason behind this is that the
underlying goals of typical RTAs are not merely based on trade perspectives. Their formation
and evolution are based on a number of goals and objectives which include i) gains from
trade, ii) strengthening domestic policy reform, iii) increasing multilateral bargaining power,
iv) guaranteeing access to markets and concessions, v) strategic linkages and alliances, and
vi) influencing multilateral negotiations through regional interplay (Whalley 1998). This
paper is concerned with the first of these objectives, the traditional gains from trade. In this
context, the analysis will investigate the effects of RTAs on their members’ intra-regional
trade. A consequence of this analysis is the determination of the trade creation and diversion
effects first introduced by Viner (1950). Arguing that customs unions may have negative
welfare implications by diverting trade, Viner (1950) showed that not all trade agreements
are necessarily welfare enhancing. Thus, RTAs can have profound effects on trade flows and
welfare.
This paper has two main aims. First, to measure the effect of RTAs on international
trade flows using empirical tools for the period 1995 to 2006. Second, to apply a
disaggregated analysis to the Gulf Cooperation Council (GCC) region on a longer time
period, from 1980 to 2006. The GCC consists six developing countries—Bahrain, Kuwait,
Oman, Qatar, Saudi Arabia, and UAE—undergoing a long-term economic integration.
Significant developments of the integration process in recent years justify a closer attention to
this region.
The paper proceeds as follows: the next section (2) provides a brief background of an
empirical model commonly used to examine bilateral trade flows, the gravity model. A two-
step methodological framework of the traditional gravity model in Step 1, and GCC’s intra-
regional trade in step 2 will be presented. Section 3 discusses the data used to estimate the
traditional gravity model and its empirical results. Section 4 compares these results with other
2
relevant studies of RTAs. Section 5 discusses the disaggregated trade patterns within the Gulf
Cooperation Council (GCC). Finally, the paper concludes with a summary of findings and
recommendations.
2 Modelling World Trade Flows International trade flows are traditionally modelled using the gravity model. The
model is borrowed from physics, and in particular, from Newton’s work on gravity that led to
the Law of Universal Gravitation. The law explains that the attractive force between two
objects is the product of a constant, their masses, and distance squared. This concept has been
applied to studies of migration, tourism, and commodity shipping (Bergstrand 1985). Gravity
models are extensively used in economic analyses to predict trade flows (Anderson 1979,
Bergsrand 1985, Feenstra 2004).
Earlier applications of the model to trade flows were tested by Tingbergen (1962),
Poyhonen (1963), and Linnemann (1966). Its use has proved successful in determining trade
flows between trading partners with a great degree of accuracy. However, the model did not
have theoretical justification originally (Anderson 1979). Several attempts at linking the
model to theory were made. Anderson (1979) used an expenditure approach to link the
gravity model to an aggregate spending two-country model. Bergstrand (1985) approached
the problem from a microeconomic perspective where he used a general equilibrium model to
achieve a ‘generalised’ gravity equation. More recently, Frankel et al. (1995) applied the
gravity model to a cross-section of countries to determine the trade flows and welfare
implications of regional trading blocs. Their emphasis was the effect trade blocs had on trade
flows and thus included several dummy variables in an attempt to capture the effect. This
paper follows this literature to find the trade bloc’s effects on its members.
Other applications of the gravity model involved measuring border effects on trade.
These studies include McCallum (1995), Feenstra (2002), Anderson and van Wincoop
(2003). In this literature, attempts were made to explain the border effect on trade while
‘correctly’ specifying the model. A number of these studies, such as McCallum (1995)
concentrated on the border effect between Canada and the U.S. McCallum (1995) tested the
border effects between Canadian provinces and some American states using a dummy for
intra-provincial trade. He found substantial border effects between Canada and the US.
Anderson and van Wincoop (2003) take the analysis a step further and develop what they
3
called ‘multilateral resistance’ to explain McCallum’s (1995) results and their deviation from
theory. Anderson and van Wincoop (2003) suggest that the McCallum results were
exaggerated and biased due to variable omission and the specification of his model. Their
model suggests a theoretically correct specification using ‘multilateral resistance’ to explain
the border effects. They found relatively smaller border effects between Canada and the U.S.
By contrast, Feenstra (2002) differs from both studies above by using fixed effect methods.
This method isolates effects of importers and exporters as fixed in the model. The gravity
model was also used to explain the effects of currency unions on trade. Such studies include
Frankel and Rose (2002) and Rose (2000).
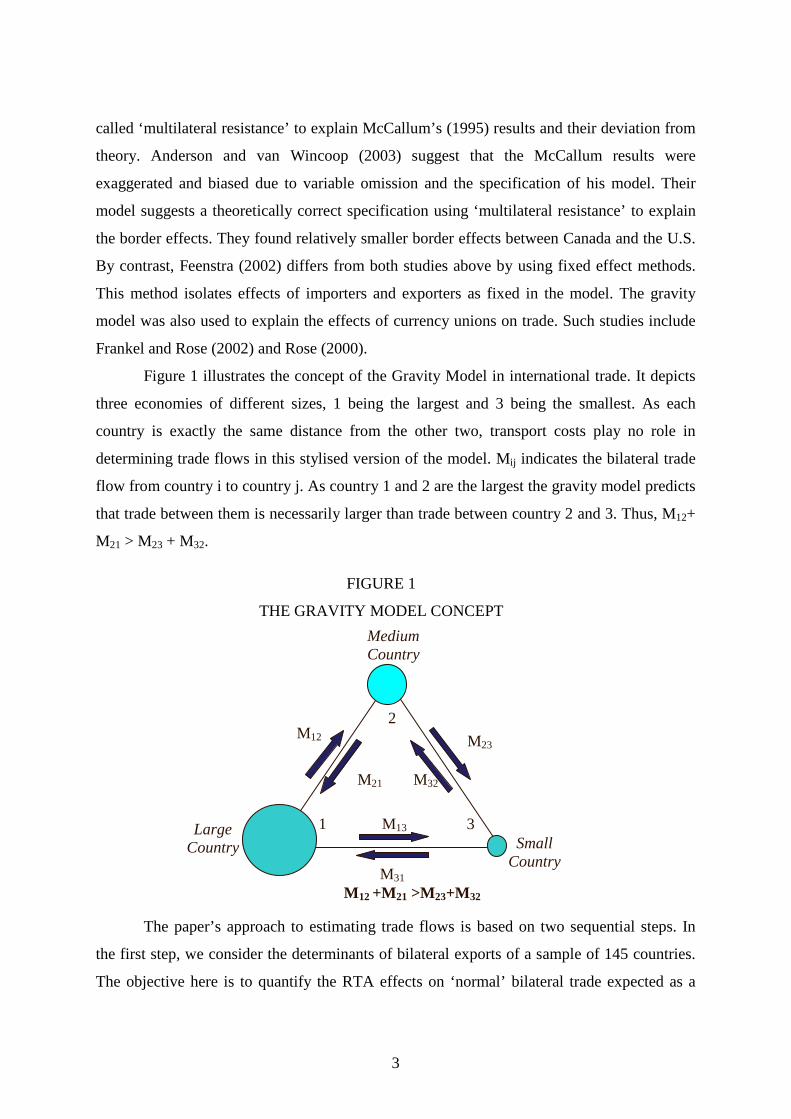
Figure 1 illustrates the concept of the Gravity Model in international trade. It depicts
three economies of different sizes, 1 being the largest and 3 being the smallest. As each
country is exactly the same distance from the other two, transport costs play no role in
determining trade flows in this stylised version of the model. Mij indicates the bilateral trade
flow from country i to country j. As country 1 and 2 are the largest the gravity model predicts
that trade between them is necessarily larger than trade between country 2 and 3. Thus, M12+
M21 > M23 + M32.
The paper’s approach to estimating trade flows is based on two sequential steps. In
the first step, we consider the determinants of bilateral exports of a sample of 145 countries.
The objective here is to quantify the RTA effects on ‘normal’ bilateral trade expected as a
M12
M21
M23
M32
M13
M31
Large Country
Medium Country
Small Country
2
3 1
M12 +M21 >M23+M32
FIGURE 1
THE GRAVITY MODEL CONCEPT
4
result of fundamental economic variables such as GDP and per capita GDP. In the second
step, we consider commodity-specific bilateral exports among the GCC countries based on
trade within the region. The second step permits more detailed examination of trade within
the GCC. Details of the two steps follow.
2.1 Step1: The Traditional Gravity Approach to Determining Total Trade
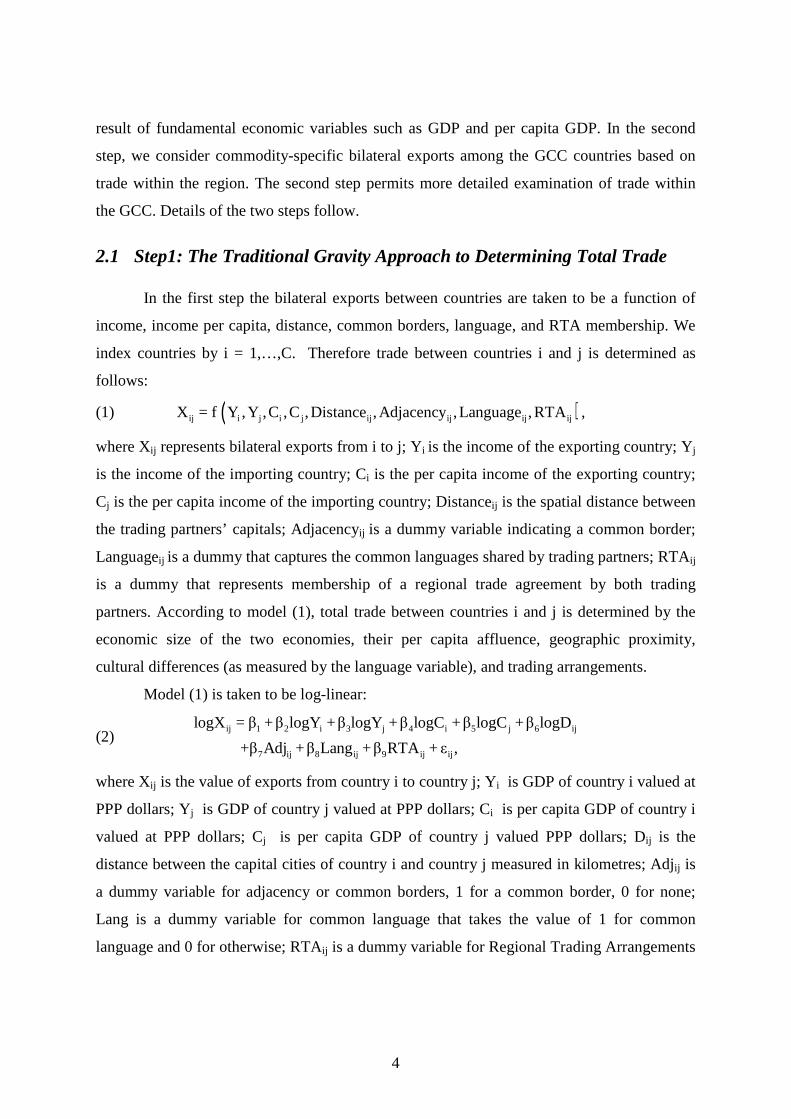
In the first step the bilateral exports between countries are taken to be a function of
income, income per capita, distance, common borders, language, and RTA membership. We
index countries by i = 1,…,C. Therefore trade between countries i and j is determined as
follows:
(1) ( )ij i j i j ij ij ij ijX = f Y ,Y ,C ,C ,Distance ,Adjacency ,Language ,RTA ,
where Xij represents bilateral exports from i to j; Yi is the income of the exporting country; Yj
is the income of the importing country; Ci is the per capita income of the exporting country;
Cj is the per capita income of the importing country; Distanceij is the spatial distance between
the trading partners’ capitals; Adjacencyij is a dummy variable indicating a common border;
Languageij is a dummy that captures the common languages shared by trading partners; RTAij
is a dummy that represents membership of a regional trade agreement by both trading
partners. According to model (1), total trade between countries i and j is determined by the
economic size of the two economies, their per capita affluence, geographic proximity,
cultural differences (as measured by the language variable), and trading arrangements.
Model (1) is taken to be log-linear:
(2) ij 1 2 i 3 j 4 i 5 j 6 ij
7 ij 8 ij 9 ij ij
logX = β +β logY +β logY +β logC +β logC +β logD
+β Adj + β Lang +β RTA + ε ,
where Xij is the value of exports from country i to country j; Y i is GDP of country i valued at
PPP dollars; Yj is GDP of country j valued at PPP dollars; Ci is per capita GDP of country i
valued at PPP dollars; Cj is per capita GDP of country j valued PPP dollars; Dij is the
distance between the capital cities of country i and country j measured in kilometres; Adjij is
a dummy variable for adjacency or common borders, 1 for a common border, 0 for none;
Lang is a dummy variable for common language that takes the value of 1 for common
language and 0 for otherwise; RTAij is a dummy variable for Regional Trading Arrangements
5
that takes the value 1 when both i and j are members of the same agreement, 0 otherwise; and
εij is a disturbance term.
This specification of Step 1 is similar to that of other studies in the literature such as
Anderson (1979), Bergstrand (1985) and Frankel (1997) for example. The coefficients can be
interpreted as follows: β1 and β2 represent the income elasticities of the exporting country and
importing country; these are expected to be positive as larger economies are expected to trade
more with each other. The coefficients β3 and β4 are elasticities relating to the wealth of
countries as measured by GDP per capita. The use of GDP per capita instead of population is
justified by Frankel (1997, pp 57-59). The distance coefficient β5 represents the distance
elasticity. As transport costs are difficult to measure, distance is used as a proxy is expected
to take a negative value. The coefficients β6 and β7 reflect the effects of adjacency and
common languages on bilateral trade. It is expected that if countries have common borders,
greater trade is facilitated, so the coefficient β6 is expected to be positive. Countries with
common languages may find it easier to trade with one another, so the coefficient β7 is
expected to be positive. Finally, the RTA coefficient β8 represents the trade bloc effect on
bilateral trade. This value may be positive or negative.
2.2 Step 2: Trade within the GCC Countries
The second step deals with trade among members of the GCC, with trade
disaggregated by product group. Total trade, as determined by Step 1, is split by product
group and we then identify those members whose trade is systematically above or below
expectation. The expected value of trade is estimated based on socio-geo-economic variables,
similar to those used in Step 1.
Suppose total trade is made up of n product groups, which we index by 1p , ,n= K , so
that pnp=1ij ijX = X∑ , where p
ijX is the exports of product group p from country i to country j. If
we write S for the set of countries that are members of the GCC, total exports by country
i∈S are then j Si ijX = X∈∑ . Thus
(3) n p
i ijj S p=1
X = X∈∑ ∑ i∈S .
Disaggregated trade within the GCC is determined by total trade of the two countries
concerned, i jX ,X , together with the economic/geographic/cultural variables of model
6
(4) pij i j ij ij ijX =g(X ,X ,Adjacency ,Distance ,Country/Commodity Dummy ).
Model (3) is taken to be log-linear:
(5) ( )
pij 1 2 i 3 j 3 ij
l4 ij k ijk
k
logX = α +α logX +α logX +α logD
+α Adj + γ Country/Commodity dummies +ε , i, j ,∑ ∈S
where p
ijX is export value from country i to country j of product group p; Xi total exports of
country i; Xj total exports of country j; Distanceij is the distance between the capital cities of
country i and country j measured in kilometres; Adjij is a dummy variable for adjacency or
common borders, 1 for a common border, 0 for none; γk is Country/Commodity dummy takes
a value of 1 if country i exports commodity p, 0 otherwise; and lijε is a disturbance term.
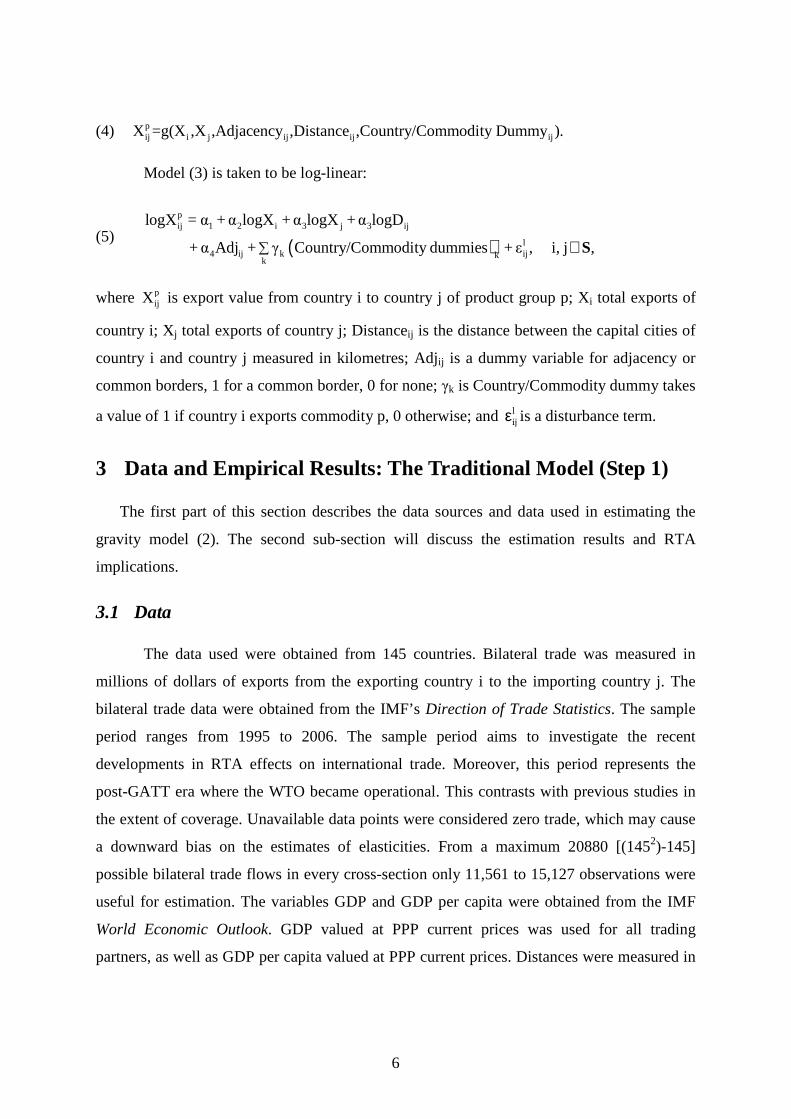
3 Data and Empirical Results: The Traditional Model (Step 1)
The first part of this section describes the data sources and data used in estimating the
gravity model (2). The second sub-section will discuss the estimation results and RTA
implications.
3.1 Data
The data used were obtained from 145 countries. Bilateral trade was measured in
millions of dollars of exports from the exporting country i to the importing country j. The
bilateral trade data were obtained from the IMF’s Direction of Trade Statistics. The sample
period ranges from 1995 to 2006. The sample period aims to investigate the recent
developments in RTA effects on international trade. Moreover, this period represents the
post-GATT era where the WTO became operational. This contrasts with previous studies in
the extent of coverage. Unavailable data points were considered zero trade, which may cause
a downward bias on the estimates of elasticities. From a maximum 20880 [(1452)-145]
possible bilateral trade flows in every cross-section only 11,561 to 15,127 observations were
useful for estimation. The variables GDP and GDP per capita were obtained from the IMF
World Economic Outlook. GDP valued at PPP current prices was used for all trading
partners, as well as GDP per capita valued at PPP current prices. Distances were measured in
7
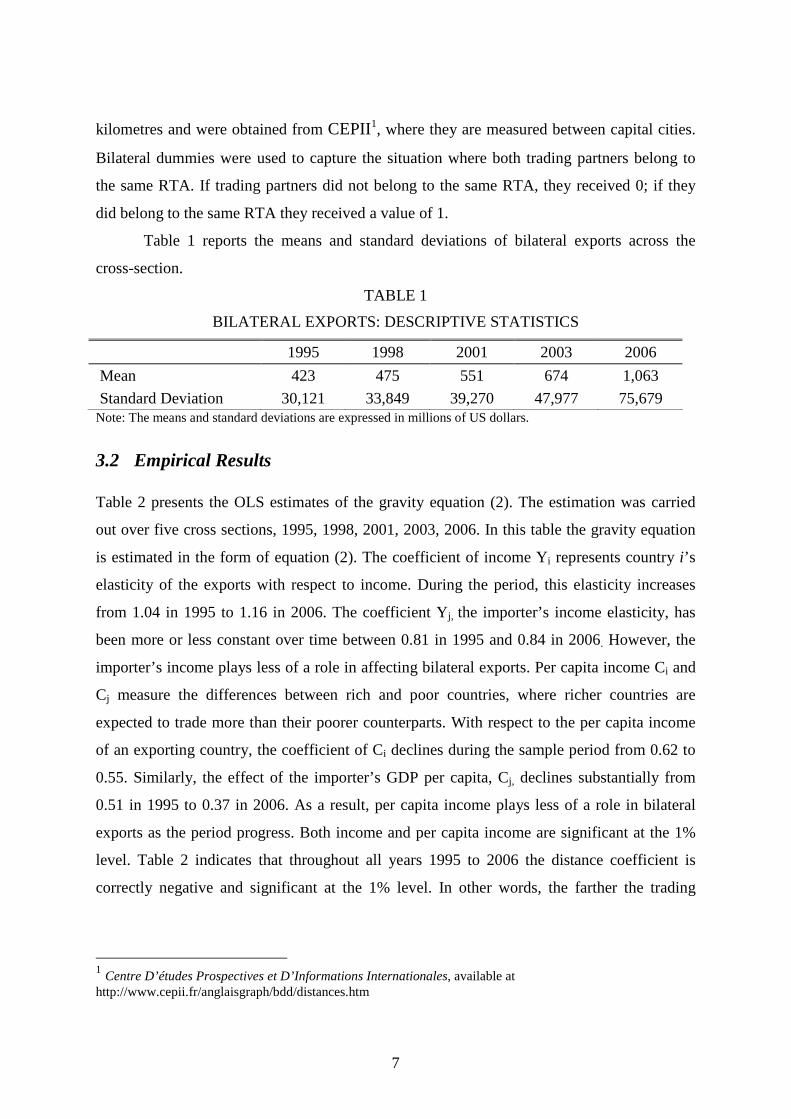
kilometres and were obtained from CEPII1, where they are measured between capital cities.
Bilateral dummies were used to capture the situation where both trading partners belong to
the same RTA. If trading partners did not belong to the same RTA, they received 0; if they
did belong to the same RTA they received a value of 1.
Table 1 reports the means and standard deviations of bilateral exports across the
cross-section.
TABLE 1
BILATERAL EXPORTS: DESCRIPTIVE STATISTICS
1995 1998 2001 2003 2006
Mean 423 475 551 674 1,063
Standard Deviation 30,121 33,849 39,270 47,977 75,679 Note: The means and standard deviations are expressed in millions of US dollars.
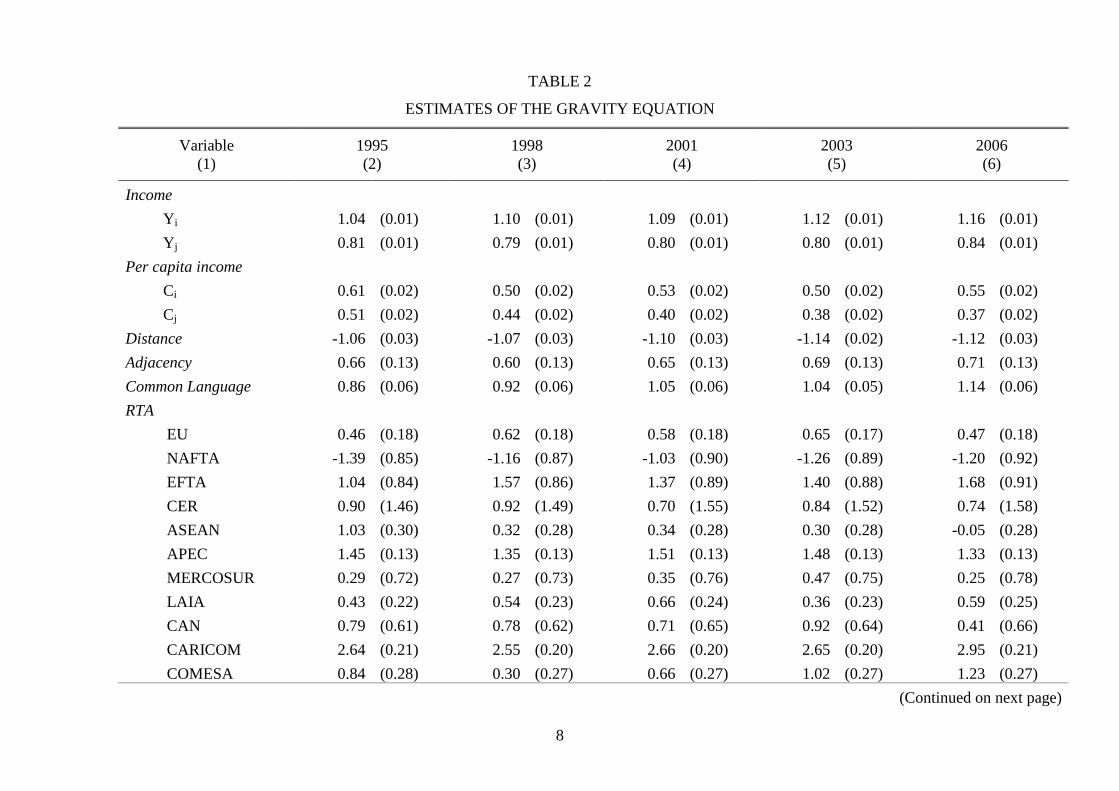
3.2 Empirical Results Table 2 presents the OLS estimates of the gravity equation (2). The estimation was carried
out over five cross sections, 1995, 1998, 2001, 2003, 2006. In this table the gravity equation
is estimated in the form of equation (2). The coefficient of income Yi represents country i ’s
elasticity of the exports with respect to income. During the period, this elasticity increases
from 1.04 in 1995 to 1.16 in 2006. The coefficient Y j, the importer’s income elasticity, has
been more or less constant over time between 0.81 in 1995 and 0.84 in 2006. However, the
importer’s income plays less of a role in affecting bilateral exports. Per capita income Ci and
Cj measure the differences between rich and poor countries, where richer countries are
expected to trade more than their poorer counterparts. With respect to the per capita income
of an exporting country, the coefficient of Ci declines during the sample period from 0.62 to
0.55. Similarly, the effect of the importer’s GDP per capita, Cj, declines substantially from
0.51 in 1995 to 0.37 in 2006. As a result, per capita income plays less of a role in bilateral
exports as the period progress. Both income and per capita income are significant at the 1%
level. Table 2 indicates that throughout all years 1995 to 2006 the distance coefficient is
correctly negative and significant at the 1% level. In other words, the farther the trading
1 Centre D’études Prospectives et D’Informations Internationales, available at http://www.cepii.fr/anglaisgraph/bdd/distances.htm
8
TABLE 2
ESTIMATES OF THE GRAVITY EQUATION
Variable (1)
1995 (2)
1998 (3)
2001 (4)
2003 (5)
2006 (6)
Income
Y i 1.04 (0.01) 1.10 (0.01) 1.09 (0.01) 1.12 (0.01) 1.16 (0.01)
Y j 0.81 (0.01) 0.79 (0.01) 0.80 (0.01) 0.80 (0.01) 0.84 (0.01)
Per capita income
Ci 0.61 (0.02) 0.50 (0.02) 0.53 (0.02) 0.50 (0.02) 0.55 (0.02)
Cj 0.51 (0.02) 0.44 (0.02) 0.40 (0.02) 0.38 (0.02) 0.37 (0.02)
Distance -1.06 (0.03) -1.07 (0.03) -1.10 (0.03) -1.14 (0.02) -1.12 (0.03)
Adjacency 0.66 (0.13) 0.60 (0.13) 0.65 (0.13) 0.69 (0.13) 0.71 (0.13)
Common Language 0.86 (0.06) 0.92 (0.06) 1.05 (0.06) 1.04 (0.05) 1.14 (0.06)
RTA
EU 0.46 (0.18) 0.62 (0.18) 0.58 (0.18) 0.65 (0.17) 0.47 (0.18)
NAFTA -1.39 (0.85) -1.16 (0.87) -1.03 (0.90) -1.26 (0.89) -1.20 (0.92)
EFTA 1.04 (0.84) 1.57 (0.86) 1.37 (0.89) 1.40 (0.88) 1.68 (0.91)
CER 0.90 (1.46) 0.92 (1.49) 0.70 (1.55) 0.84 (1.52) 0.74 (1.58)
ASEAN 1.03 (0.30) 0.32 (0.28) 0.34 (0.28) 0.30 (0.28) -0.05 (0.28)
APEC 1.45 (0.13) 1.35 (0.13) 1.51 (0.13) 1.48 (0.13) 1.33 (0.13)
MERCOSUR 0.29 (0.72) 0.27 (0.73) 0.35 (0.76) 0.47 (0.75) 0.25 (0.78)
LAIA 0.43 (0.22) 0.54 (0.23) 0.66 (0.24) 0.36 (0.23) 0.59 (0.25)
CAN 0.79 (0.61) 0.78 (0.62) 0.71 (0.65) 0.92 (0.64) 0.41 (0.66)
CARICOM 2.64 (0.21) 2.55 (0.20) 2.66 (0.20) 2.65 (0.20) 2.95 (0.21)
COMESA 0.84 (0.28) 0.30 (0.27) 0.66 (0.27) 1.02 (0.27) 1.23 (0.27)
(Continued on next page)
9
TABLE 2
ESTIMATES OF THE GRAVITY EQUATION (Continued)
Variable (1)
1995 (2)
1998 (3)
2001 (4)
2003 (5)
2006 (6)
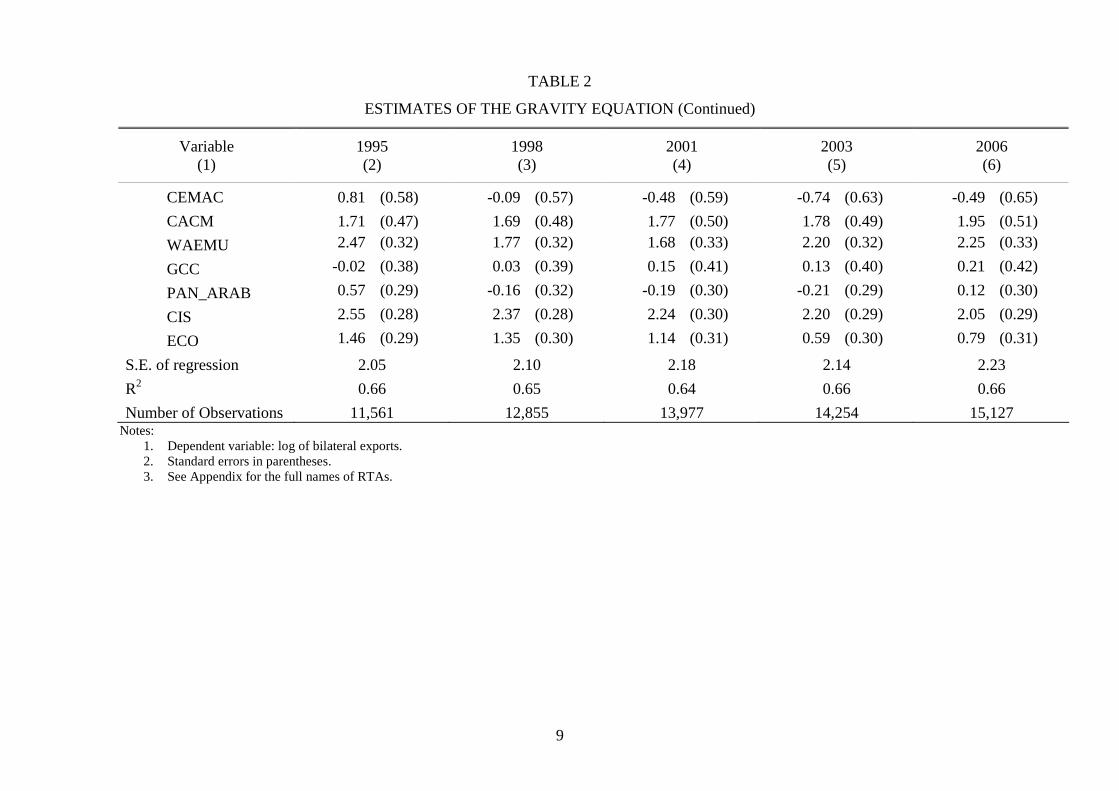
CEMAC 0.81 (0.58) -0.09 (0.57) -0.48 (0.59) -0.74 (0.63) -0.49 (0.65)
CACM 1.71 (0.47) 1.69 (0.48) 1.77 (0.50) 1.78 (0.49) 1.95 (0.51)
WAEMU 2.47 (0.32) 1.77 (0.32) 1.68 (0.33) 2.20 (0.32) 2.25 (0.33)
GCC -0.02 (0.38) 0.03 (0.39) 0.15 (0.41) 0.13 (0.40) 0.21 (0.42)
PAN_ARAB 0.57 (0.29) -0.16 (0.32) -0.19 (0.30) -0.21 (0.29) 0.12 (0.30)
CIS 2.55 (0.28) 2.37 (0.28) 2.24 (0.30) 2.20 (0.29) 2.05 (0.29)
ECO 1.46 (0.29) 1.35 (0.30) 1.14 (0.31) 0.59 (0.30) 0.79 (0.31)
S.E. of regression 2.05 2.10 2.18 2.14 2.23
R2 0.66 0.65 0.64 0.66 0.66
Number of Observations 11,561 12,855 13,977 14,254 15,127 Notes:
1. Dependent variable: log of bilateral exports. 2. Standard errors in parentheses. 3. See Appendix for the full names of RTAs.
10
partners are from each other, the greater the cost of transportation. The elasticity of bilateral trade
with respect to distance increases during the period from -1.06 to -1.12. Bilateral exports are
more sensitive to distance in 2006 compared to 1995. A possible explanation may be the
continuous increase in the cost of energy during the last few years of the sample period.
The gravity equation estimated in Table 2 includes a number of dummy variables. These
are divided into two categories: first the dummy variables of common borders ‘adjacency’ and
common language, and second RTA membership indicators. The adjacency dummy is significant
at the 1% level in all years. It also shows an upward trend from 0.67 to 0.71, or 95% [=(e0.67 -
1)*100] to 103% effect above ‘normal’ trade explained by economic factors. Common language
also plays a statistically significant role, at the 1% level, in affecting bilateral exports. In fact, its
coefficient increased during the sample period. The language dummy increased from 0.86 to
1.14, or 136% to 213% effect above normal trade. This result confirms that language plays an
important role in facilitating bilateral trade.
The second category of dummy variables is used to represent membership in RTAs
described earlier. In the industrialised countries, the sample includes the European Union (EU),
North American Free Trade Area (NAFTA), Closer Economic Relation (CER), and European
Free Trade Area (EFTA). The EU, one of the oldest existing RTAs in the form of a customs
union, shows stronger effect during the period. The EU dummy coefficient increased from 0.46
to 0.47. This translates into 58% to 60% effect of EU membership on bilateral exports of
countries involved. The EU dummy is significant at the 1% level in all years. This value should
be considered with caution. The sample does not include the enlargement of the EU to the
twenty-five current members. Elsewhere in Europe, EFTA shows fluctuating effects during the
period. In 1995, the EFTA RTA has a coefficient of 1.04 or 182% effect on bilateral trade within
the region. This, however, is not significant. In 2006, a coefficient of 0.38 is reported, which
translates to 46% effect on bilateral trade. In all cross-section years, EFTA coefficients are not
significant. In North America NAFTA’s dummy shows consistent negative effects during the
period, declining between -1.03 to -1.39. or -65% to -75%. NAFTA’s bilateral exports are not
affected positively by the RTA the model suggests.This result, however strong, is not significant.
On the other side of the globe, CER with its two members shows substantial effects of the RTA
on its members’ bilateral exports. This effect declines over the period, from 0.90 to 0.74, or
150% to 101%. This result is statistically insignificant in all cross-section years. Although these
11
values are very large, they may be explained by CER’s remoteness and close proximity of its
members, Australia and New Zealand.
In South East Asia, the Association of South East Asian Nations (ASEAN) and
Association of Pacific Economic Cooperation (APEC) represent the major RTAs. APEC also
includes other Pacific Rim countries included in earlier-mentioned RTAs such as the United
States and Canada from NAFTA. Moreover, though APEC is not an official RTA, it is
considered instrumental in fostering greater trade between its members. APEC exhibits
consistent and statistically significant RTA effects in all cross-section years. Coefficients
between 1.33 or 267% to 1.51 278 or 353% show strong APEC effects on its members’ normal
bilateral exports. This result is significant in all cross-section years. The ASEAN dummy shows
a decline on its members’ bilateral exports. Only in 1995 and 1998 are the coefficients of 1.03
and 0.32 significant at the 1% level. These coefficients translate into 180% and 37% effect of
ASEAN on its members’ normal trade. During the rest of the period ASEAN’s smaller
coefficients are not significant.
In Latin America and the Caribbean the Andean Community (CAN), Central American
Common Market (CACM), Southern Common Market (MERCOSUR), Latin American
Integration Association (LAIA), and the Caribbean Community and Common Market
(CARICOM) represent the major operational RTAs. CAN’s RTA dummy coefficients range
between 0.71 and 0.92 or 103% to 150%. None of the cross-section years are statistically
significant. Thus, it is not clear if the lower values towards the end of the period are truly useful
for further analysis. CACM also shows strong and consistent effects on its members‘ bilateral
trade flows where its coefficients range between 1.71 and 1.95, or 453% to 603% effect above
normal trade. These results are significant at the 1% level in all years. MERCOSUR’s dummy
shows relatively weaker effects during the sample period, its coefficients ranging between 0.25
and 0.47, or 28% to 60%. None of the coefficents of MERCOSUR are significant in any one
year. LAIA’s dummy reports a consistent effect of the RTA on its members’ values ranging
between 0.36 or 43% and 0.66 or 93% effect on bilateral trade. Unlike MERCOSUR, LAIA’s
coefficients are significant at the 5% and 10% level in most years except in 2003 where it is not
significant. In the Caribbean, CARICOM’s dummy takes large values that range between 2.55 or
1181% and 2.95 or 1810%. The significance of these results at the 1% level suggests that
CARICOM plays an important rule in bilateral trade of the region.
12
The sample includes three African RTAs: Common Market for Eastern and Southern
Africa (COMESA), Economic and Monetary Community of Central Africa (CEMAC), and West
African Economic and Monetary Union (WAEMU). COMESA’s dummy coefficients increase
from 0.84 to 1.23, or 132% and 242% effect on its members’ intra-regional trade. In most years
COMESA’s dummy is significant at 1% except in 2001 where it is significant at the 5% level.
CEMAC’s dummy coefficient in comparison falls drastically from 0.81 to -0.49 during the
period. However, between 125% and -39% effects on bilateral exports within that region are
statistically insignificant in all years. WAEMU exhibits strong effects of 2.47 or 1082% in 1995,
and 2.25 or 849% in 2006. WAEMU’s dummy is significant in all years. WAEMU has a
substantial effect on its members’ bilateral trade flows within the region.
In the Middle East and North Africa, a number of RTAs are found. These include Gulf
Cooperation Council (GCC), and Pan-Arab Free Trade Agreement (PAN-ARAB). The GCC is
exhibits declining effect from 1995 to 2006. Its dummy coefficients reflect small RTA effects, its
coefficients range between -0.02 and 0.21, or -2% and 23%. The GCC dummy is not significant
during the sample period. PAN-ARAB also has a small effect on bilateral exports of -0.21 or
19% and 0.57 or 76%. These values are significant at the 5% level only in 1995 and 1998.
In Central Asia and the former USSR, two main RTAs are included in this sample,
Commonwealth of Independent States (CIS) and Economic Cooperation Organization (ECO).
CIS form the majority of former USSR states and exhibit substantial effects from 2.05 to 2.55 or
678% to 1181%. CIS is significant at the 1% level in all cross-section years. Finally, ECO shows
declining effects on its members’ bilateral trade. Its coefficient fell from 1.46 or 326% to 0.79 or
120%. In 1995, 1998, and 2001 coefficients are significant at the 1% level and at 5% level in
2003 and 2006.
The results of the first step of this framework suggest that RTAs play an important role in
determining bilateral trade flows between countries. The findings also suggest RTAs in some
developing countries are effective and may have significant impact on regional trade flows.
4 Comparison with other studies
The main results in the previous section conform with trade theory with respect to economic
parameters. However, it is worth noting similar studies to verify the results presented above. This
section will compare the results of the first step of the model with other relevant studies. Table 3
13
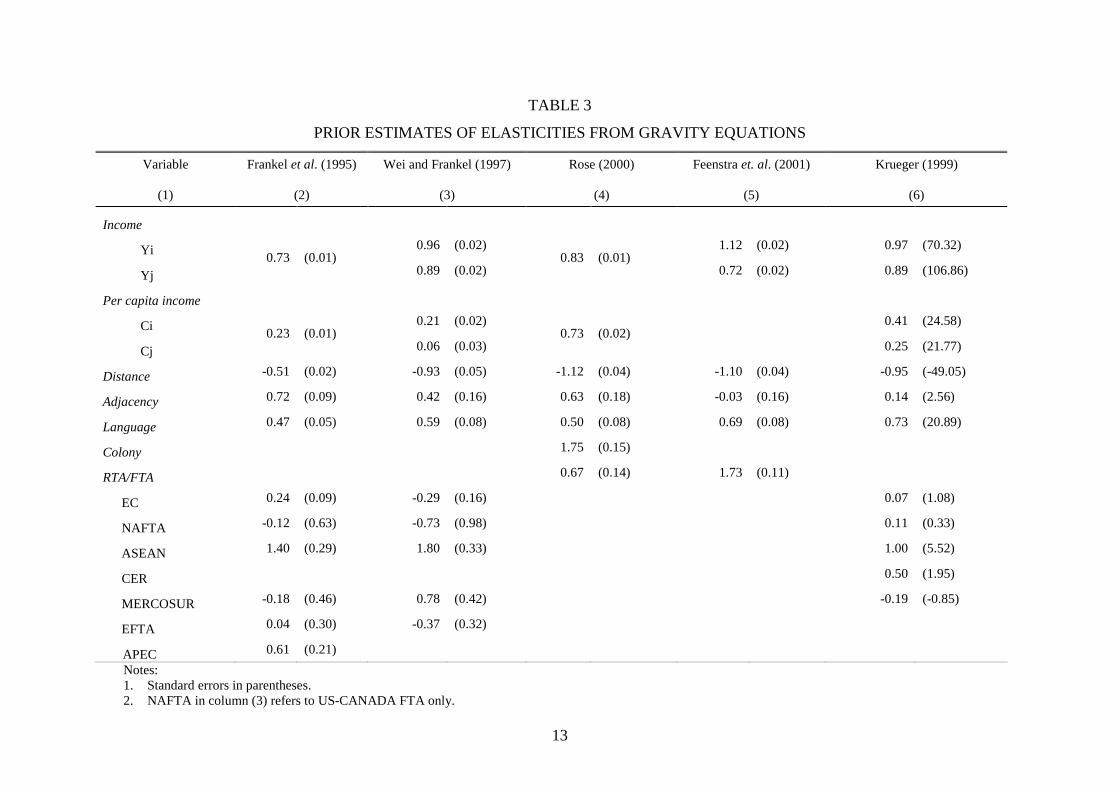
TABLE 3
PRIOR ESTIMATES OF ELASTICITIES FROM GRAVITY EQUATIONS
Variable
(1)
Frankel et al. (1995)
(2)
Wei and Frankel (1997)
(3)
Rose (2000)
(4)
Feenstra et. al. (2001)
(5)
Krueger (1999)
(6)
Income
Yi 0.96 (0.02) 1.12 (0.02) 0.97 (70.32)
Yj 0.73 (0.01)
0.89 (0.02) 0.83 (0.01)
0.72 (0.02) 0.89 (106.86)
Per capita income
Ci 0.21 (0.02) 0.41 (24.58)
Cj 0.23 (0.01)
0.06 (0.03) 0.73 (0.02)
0.25 (21.77)
Distance -0.51 (0.02) -0.93 (0.05) -1.12 (0.04) -1.10 (0.04) -0.95 (-49.05)
Adjacency 0.72 (0.09) 0.42 (0.16) 0.63 (0.18) -0.03 (0.16) 0.14 (2.56)
Language 0.47 (0.05) 0.59 (0.08) 0.50 (0.08) 0.69 (0.08) 0.73 (20.89)
Colony 1.75 (0.15)
RTA/FTA 0.67 (0.14) 1.73 (0.11)
EC 0.24 (0.09) -0.29 (0.16) 0.07 (1.08)
NAFTA -0.12 (0.63) -0.73 (0.98) 0.11 (0.33)
ASEAN 1.40 (0.29) 1.80 (0.33) 1.00 (5.52)
CER 0.50 (1.95)
MERCOSUR -0.18 (0.46) 0.78 (0.42) -0.19 (-0.85)
EFTA 0.04 (0.30) -0.37 (0.32)
APEC 0.61 (0.21)
Notes: 1. Standard errors in parentheses. 2. NAFTA in column (3) refers to US-CANADA FTA only.
14
presents some comparable studies that considered RTAs’ effects on bilateral trade. In the
case of the economic variables, the model estimated in Table 2 complies with the correct
signs. However, this study finds stronger size effects in terms of GDP on bilateral trade
compared to Wei and Frankel (1997), for example. Income effects in Table 2 range
between 1.04 and 1.16, compared to 0.96 for exporting countries. The difference is not
substantial nevertheless. In the case of the income of the importing country the results of
this paper come close to a number of the studies listed in Table 3. Values between 0.79
and 0.84 reported in this paper are close to the values of 0.89 and 0.72 reported by Wei
and Frankel (1997), Feenstra et al. (2001), and Krueger (1999). The variation in per capita
income is larger, however, in comparable specifications. Wei and Frankel (1997) report
0.21 and 0.06 for the exporter and importer countries respectively. This paper finds values
between 0.50 and 0.61 for exporters, and 0.37 and 0.51 for importers. The values reported
here are closer to Krueger’s (1999) results, which report 0.41 and 0.25 for the exporter and
importer countries’ per capita income.
The distance, adjacency, and common language dummies are similar in most cases
to other studies. In the case of distance, this study reports values as low as -1.14. This is
marginally different from the -1.12 reported by Rose (200), or the -0.93 reported by Wei
and Frankel (1997) for example. Other studies report mixed results with respect to
adjacency. However the values from Table 2 come close to the 0.72 reported by Frankel et
al. (1995), or the 0.63 reported by Rose (2000). In the case of common language, this
paper finds stronger than usual effects compared to other studies. Table 2 reports values as
high as 1.14 for language, other studies such as Krueger (1999) report 0.73.
The estimates of RTA dummies’ coefficients vary substantially from the literature. For
the EU or European Community (EC), the coefficient ranges between -0.29 to 0.24 in the
studies referred to in Table 3. Table 2 reports values between 0.46 and 0.65, a higher than
usual effect. This study, however, shows similar negative or weak RTA effects with
respect to NAFTA. However, the study reports coefficients for NAFTA smaller than other
related studies—as low as -1.39. These results are not significant in any one case. For
CER, Krueger (1999) reports a 0.50 dummy coefficient; this study reports values between
0.70 and 0.94, suggesting a larger effect on bilateral trade within that region compared to
other studies. For MERCOSUR, the literature reports different values, from -0.19 to 0.78.
Table 2 reports values between 0.27 and 0.47, well in line with other studies. The results
15
reported for ASEAN are considerably different compared to those included in Table 3.
Frankel et. al. (1995), and Wei and Frankel (1997) find values of 1.4 and 1.8, compared to
values between -0.05 and 1.03 found in this study. In the case of EFTA the results of this
study are very different from the literature with coefficients larger than other studies
reported here. Values between 1.04 and 1.68 are larger than the 0.04 and -0.37 reported by
Frankel et. al. (1995) and Wei and Frankel (1997). This study also reports larger
coefficients for APEC, where values ranging from 1.33 to 1.51 are greater than the 0.61
reported by Frankel et. al. (1995), for example. Yet although the results differ in a number
of cases from other studies in the literature, there are commonalities that verify the results
of this study. Other RTAs are less commonly tested. However, the interest of this paper is
the GCC and the following section will discuss the GCC’s trade patterns.
All in all, this study’s findings largely verify previous studies’ results, implying that
gravity model (2) captures RTA effects reasonably well, comparable to the literature.
5 Trade within the GCC Countries (Step 2)
The GCC was created in the early 1980s. It has been operational for the past two
decades. The GCC has been undergoing significant economic integration progress recently
that warrants attention. Trade liberalisation has gone hand in hand with capital and labour
mobility enhancement efforts. What makes the GCC interesting is the political
commitment towards economic integration. The GCC follows a standard approach to
economic integration in its four main phases of Free Trade Area, Common Market,
Customs Union, Monetary and Economic Union. The GCC possesses many potential
success factors that may not be readily present elsewhere, such as common language,
historical and social ties and a common religion. Moreover, the GCC economies are
similar in their oil dependency and rapid economic development progress in the past three
decades. The six member countries, Bahrain, Kuwait, Oman, Qatar, Saudi Arabia, and
UAE, are considered middle-income or high-income countries based on their GDP per
capita. The region is also strategically important since a large portion of the world’s
proved oil reserves are located within its borders. In the light of these considerations, two
questions need to be answered. First, is the GCC an effective RTA? Second, what effect
does it have on its trade patterns with the rest of the world? The answer to the first
question lies in the previous empirical analysis. Referring to Table 2, the RTA dummy of
16
the GCC indicates how much of a contribution the arrangement makes to intra-regional
trade. The gravity equation implies weak effects between -2% and 23%. The observed,
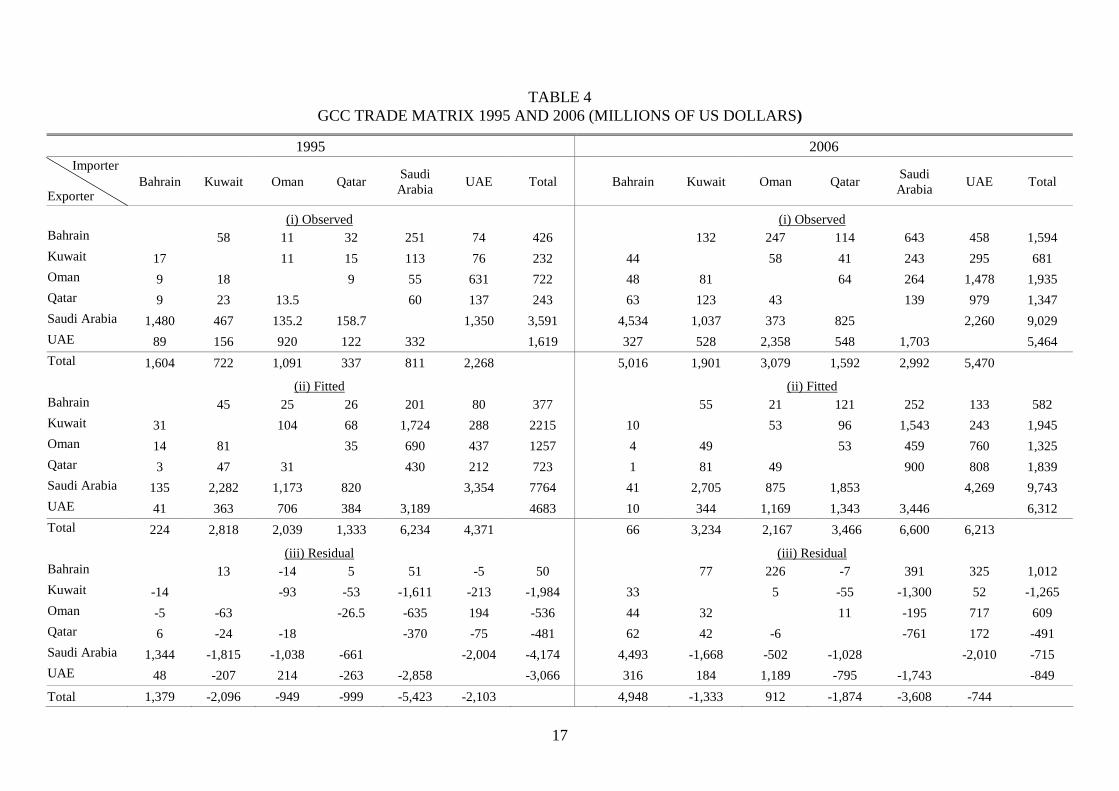
fitted, and residuals matrices of the GCC’s intra-regional trade are reported in Table 4 for
the years 1995 and 2006. The model estimates of the intra-GCC trade flows are presented
in section (ii) of Panels I and II. The model overstates the actual trade flow values in
section (i) of Panels I and II. This is indicated in the bottom section (iii). Section (iii)
represents the residuals of the model with respect to the GCC intra-regional trade. Table 4
indicates that the gravity model does not fit the GCC bilateral trade very well.
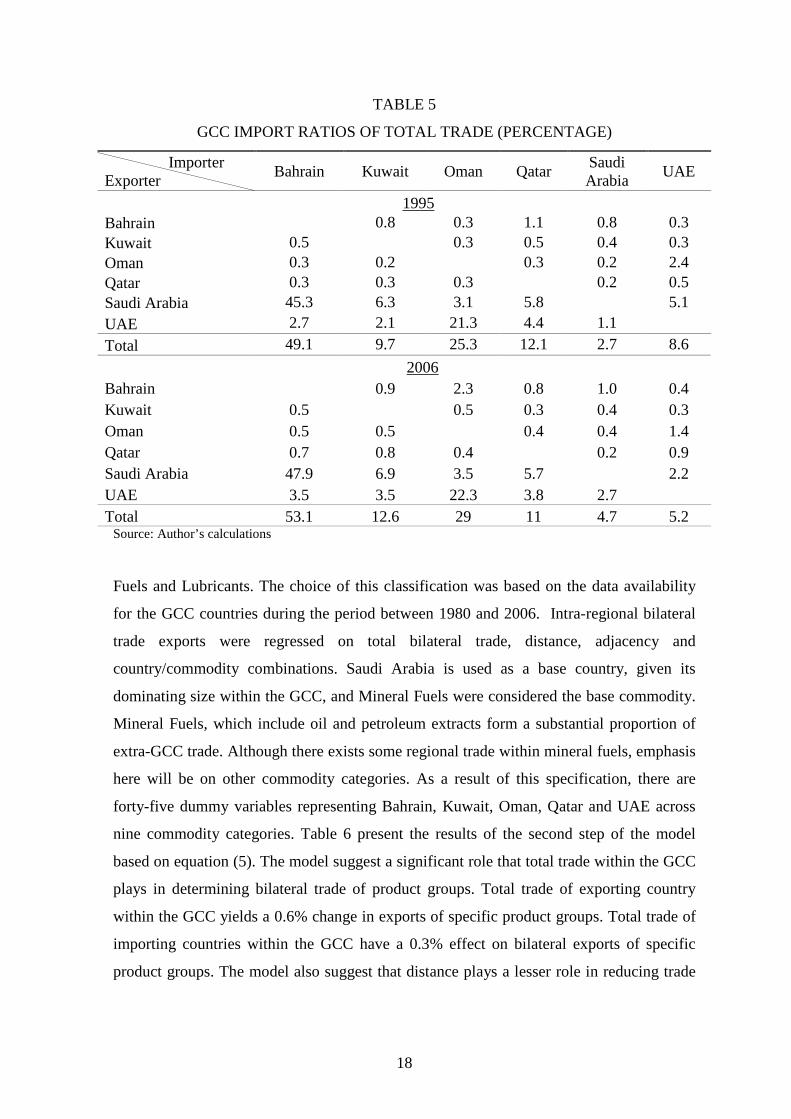
Table 5 reports the 1995 and 2006 intra-GCC trade matrices expressed in the form
of percentages of total. Table 5 gives a vivid picture of who trades more with their GCC
counterparts. Bahrain and Oman trade the most within the GCC. Overall, the GCC region
appears to trade less within itself over the sample period. What can explain the stagnation
in trade flows within the region? Transportation cost cannot be expected to produce such
lower overall trade proportions and sub-regional concentrated trade. Distance within the
region is not so prohibitive that it should reduce trade substantially between GCC; in most
cases, it barely exceeds one thousand kilometres between the capital cities. The answer
may lie in the similarity of the economic structures of these economies. Dependence on oil
mentioned earlier for developmental purposes and large government sectors may indicate a
potential effect on low intra-regional trade. Moreover, these six countries are traditionally
open economies. They import most of their consumer and capital needs from outside the
GCC region. Thus to better understand the intra-regional trade patterns of the GCC region,
disaggregated commodity trade analysis is more useful to contrast the patterns suggested
by Table 5.
This is the second step in the model’s analysis, where the first was involved in
estimating bilateral trade determinants using GDP and GDP per capita as proxies for size
and economic development. This step involves estimating bilateral trade within the GCC
conditional on total intra-regional trade. Consequently, the GCC’s total trade is divided
into ten 1-digit categories according to SITC revision 1 obtained from the UN Comtrade
database. These categories are: (1) Animal and Vegetable Oils and Fats, (2) Beverages and
Tobacco, (3) Chemicals, (4) Crude Materials Except Fuels, (5) Food and Live Animals, (6)
Machinery and Transport Equipment, (7) Manufactured Goods, (8) Miscellaneous
Manufactured Articles, (9) Commodities and Transactions Not Classified, (10) Mineral
17
TABLE 4 GCC TRADE MATRIX 1995 AND 2006 (MILLIONS OF US DOLLARS)
1995 2006 Importer
Exporter
Bahrain Kuwait Oman Qatar Saudi Arabia
UAE Total
Bahrain
Kuwait Oman Qatar Saudi Arabia
UAE Total
(i) Observed (i) Observed Bahrain 58 11 32 251 74 426 132 247 114 643 458 1,594
Kuwait 17 11 15 113 76 232 44 58 41 243 295 681
Oman 9 18 9 55 631 722 48 81 64 264 1,478 1,935
Qatar 9 23 13.5 60 137 243 63 123 43 139 979 1,347
Saudi Arabia 1,480 467 135.2 158.7 1,350 3,591 4,534 1,037 373 825 2,260 9,029
UAE 89 156 920 122 332 1,619 327 528 2,358 548 1,703 5,464
Total 1,604 722 1,091 337 811 2,268 5,016 1,901 3,079 1,592 2,992 5,470 (ii) Fitted (ii) Fitted Bahrain 45 25 26 201 80 377 55 21 121 252 133 582
Kuwait 31 104 68 1,724 288 2215 10 53 96 1,543 243 1,945
Oman 14 81 35 690 437 1257 4 49 53 459 760 1,325
Qatar 3 47 31 430 212 723 1 81 49 900 808 1,839
Saudi Arabia 135 2,282 1,173 820 3,354 7764 41 2,705 875 1,853 4,269 9,743
UAE 41 363 706 384 3,189 4683 10 344 1,169 1,343 3,446 6,312
Total 224 2,818 2,039 1,333 6,234 4,371 66 3,234 2,167 3,466 6,600 6,213
(iii) Residual (iii) Residual Bahrain 13 -14 5 51 -5 50 77 226 -7 391 325 1,012
Kuwait -14 -93 -53 -1,611 -213 -1,984 33 5 -55 -1,300 52 -1,265
Oman -5 -63 -26.5 -635 194 -536 44 32 11 -195 717 609
Qatar 6 -24 -18 -370 -75 -481 62 42 -6 -761 172 -491
Saudi Arabia 1,344 -1,815 -1,038 -661 -2,004 -4,174 4,493 -1,668 -502 -1,028 -2,010 -715
UAE 48 -207 214 -263 -2,858 -3,066 316 184 1,189 -795 -1,743 -849
Total 1,379 -2,096 -949 -999 -5,423 -2,103 4,948 -1,333 912 -1,874 -3,608 -744
18
TABLE 5
GCC IMPORT RATIOS OF TOTAL TRADE (PERCENTAGE)
Importer Exporter
Bahrain Kuwait Oman Qatar Saudi Arabia
UAE
1995 Bahrain 0.8 0.3 1.1 0.8 0.3 Kuwait 0.5 0.3 0.5 0.4 0.3 Oman 0.3 0.2 0.3 0.2 2.4 Qatar 0.3 0.3 0.3 0.2 0.5 Saudi Arabia 45.3 6.3 3.1 5.8 5.1 UAE 2.7 2.1 21.3 4.4 1.1
Total 49.1 9.7 25.3 12.1 2.7 8.6
2006 Bahrain 0.9 2.3 0.8 1.0 0.4 Kuwait 0.5 0.5 0.3 0.4 0.3 Oman 0.5 0.5 0.4 0.4 1.4 Qatar 0.7 0.8 0.4 0.2 0.9 Saudi Arabia 47.9 6.9 3.5 5.7 2.2 UAE 3.5 3.5 22.3 3.8 2.7 Total 53.1 12.6 29 11 4.7 5.2
Source: Author’s calculations
Fuels and Lubricants. The choice of this classification was based on the data availability
for the GCC countries during the period between 1980 and 2006. Intra-regional bilateral
trade exports were regressed on total bilateral trade, distance, adjacency and
country/commodity combinations. Saudi Arabia is used as a base country, given its
dominating size within the GCC, and Mineral Fuels were considered the base commodity.
Mineral Fuels, which include oil and petroleum extracts form a substantial proportion of
extra-GCC trade. Although there exists some regional trade within mineral fuels, emphasis
here will be on other commodity categories. As a result of this specification, there are
forty-five dummy variables representing Bahrain, Kuwait, Oman, Qatar and UAE across
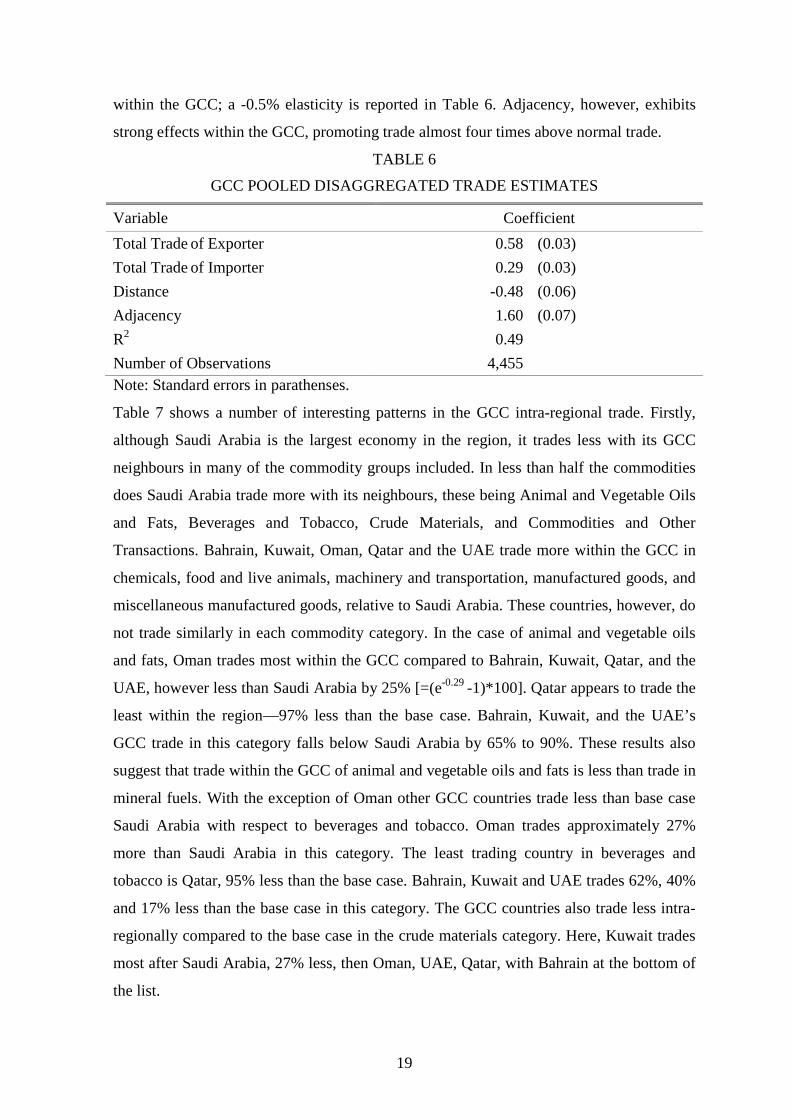
nine commodity categories. Table 6 present the results of the second step of the model
based on equation (5). The model suggest a significant role that total trade within the GCC
plays in determining bilateral trade of product groups. Total trade of exporting country
within the GCC yields a 0.6% change in exports of specific product groups. Total trade of
importing countries within the GCC have a 0.3% effect on bilateral exports of specific
product groups. The model also suggest that distance plays a lesser role in reducing trade
19
within the GCC; a -0.5% elasticity is reported in Table 6. Adjacency, however, exhibits
strong effects within the GCC, promoting trade almost four times above normal trade.
TABLE 6
GCC POOLED DISAGGREGATED TRADE ESTIMATES
Variable Coefficient
Total Trade of Exporter 0.58 (0.03)
Total Trade of Importer 0.29 (0.03)
Distance -0.48 (0.06)
Adjacency 1.60 (0.07)
R2 0.49
Number of Observations 4,455 Note: Standard errors in parathenses.
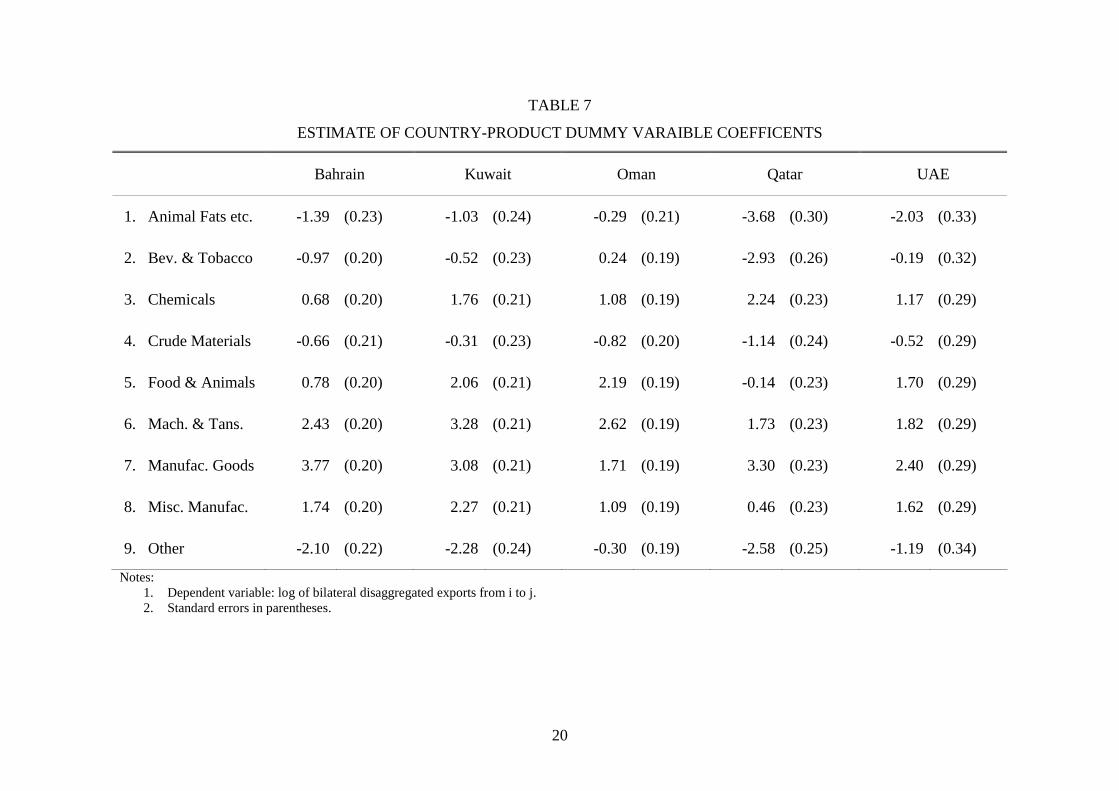
Table 7 shows a number of interesting patterns in the GCC intra-regional trade. Firstly,
although Saudi Arabia is the largest economy in the region, it trades less with its GCC
neighbours in many of the commodity groups included. In less than half the commodities
does Saudi Arabia trade more with its neighbours, these being Animal and Vegetable Oils
and Fats, Beverages and Tobacco, Crude Materials, and Commodities and Other
Transactions. Bahrain, Kuwait, Oman, Qatar and the UAE trade more within the GCC in
chemicals, food and live animals, machinery and transportation, manufactured goods, and
miscellaneous manufactured goods, relative to Saudi Arabia. These countries, however, do
not trade similarly in each commodity category. In the case of animal and vegetable oils
and fats, Oman trades most within the GCC compared to Bahrain, Kuwait, Qatar, and the
UAE, however less than Saudi Arabia by 25% [=(e-0.29 -1)*100]. Qatar appears to trade the
least within the region—97% less than the base case. Bahrain, Kuwait, and the UAE’s
GCC trade in this category falls below Saudi Arabia by 65% to 90%. These results also
suggest that trade within the GCC of animal and vegetable oils and fats is less than trade in
mineral fuels. With the exception of Oman other GCC countries trade less than base case
Saudi Arabia with respect to beverages and tobacco. Oman trades approximately 27%
more than Saudi Arabia in this category. The least trading country in beverages and
tobacco is Qatar, 95% less than the base case. Bahrain, Kuwait and UAE trades 62%, 40%
and 17% less than the base case in this category. The GCC countries also trade less intra-
regionally compared to the base case in the crude materials category. Here, Kuwait trades
most after Saudi Arabia, 27% less, then Oman, UAE, Qatar, with Bahrain at the bottom of
the list.
20
TABLE 7
ESTIMATE OF COUNTRY-PRODUCT DUMMY VARAIBLE COEFFICENTS
Bahrain Kuwait Oman Qatar UAE
1. Animal Fats etc. -1.39 (0.23) -1.03 (0.24) -0.29 (0.21) -3.68 (0.30) -2.03 (0.33)
2. Bev. & Tobacco -0.97 (0.20) -0.52 (0.23) 0.24 (0.19) -2.93 (0.26) -0.19 (0.32)
3. Chemicals 0.68 (0.20) 1.76 (0.21) 1.08 (0.19) 2.24 (0.23) 1.17 (0.29)
4. Crude Materials -0.66 (0.21) -0.31 (0.23) -0.82 (0.20) -1.14 (0.24) -0.52 (0.29)
5. Food & Animals 0.78 (0.20) 2.06 (0.21) 2.19 (0.19) -0.14 (0.23) 1.70 (0.29)
6. Mach. & Tans. 2.43 (0.20) 3.28 (0.21) 2.62 (0.19) 1.73 (0.23) 1.82 (0.29)
7. Manufac. Goods 3.77 (0.20) 3.08 (0.21) 1.71 (0.19) 3.30 (0.23) 2.40 (0.29)
8. Misc. Manufac. 1.74 (0.20) 2.27 (0.21) 1.09 (0.19) 0.46 (0.23) 1.62 (0.29)
9. Other -2.10 (0.22) -2.28 (0.24) -0.30 (0.19) -2.58 (0.25) -1.19 (0.34)
Notes: 1. Dependent variable: log of bilateral disaggregated exports from i to j. 2. Standard errors in parentheses.
21
Other categories where the GCC countries trade relatively more than Saudi
Arabia are chemicals, food and live animals, machinery and transportation, manufactured
goods and miscellaneous manufactured goods. In chemicals, Qatar trades most within the
GCC relative to Saudi Arabia. The magnitude of trade within the GCC of Qatar is in the
order of 840% more compared to the base case. Qatar is followed closely by Kuwait, then
Oman, UAE, and finally Bahrain. Saudi Arabia trades the least in chemicals within the
region. Trade in food and live animals is primarily led by Oman, followed closely by
Kuwait, then UAE, Bahrain, and Saudi Arabia. Oman trades 794%, or eight times more
than the base case, while Bahrain trades about 118% more than Saudi Arabia. In the
category of machinery and transportation, Kuwait leads the GCC countries in intra-
regional trade, while Oman and Bahrain come close after. Qatar and UAE fall within the
bottom half, however, above the base case. Manufactured goods trade patterns shift in
favour of Qatar, trading the most in the region relative to the base case. Its trade flows are
mirrored by Bahrain and Kuwait to make up the top half of the GCC in this category.
UAE exceeds Oman relative to the base case. All five countries trade relatively more than
the base case. In the miscellaneous manufactured goods category, Kuwait trades most
within the region; followed by UAE, Bahrain, and then Oman. Qatar completes the top
five countries. Again, Saudi Arabia trades the least within the GCC in this category.
Finally, Saudi Arabia exceeds other GCC countries in intra-regional trade in the
commodity and other transactions category. After Saudi Arabia, Oman trades most in this
category, followed by the UAE. Bahrain, Kuwait, and Qatar trade similarly in these
commodities relative to the base case. These results also suggest that the above categories
are traded more than mineral fuels within the region.
The results of this analysis indicate there is no clear pattern within the region
where one country dominates intra-regional trade completely within the GCC. The
second step of the model used here explains the trade patterns within the GCC, and has
shown that there are substantial differences between the largest economy, Saudi Arabia,
and other countries in intra-regional trade. Saudi Arabia trades more in animal and
vegetable oils and fats, beverages and tobacco, crude materials, and commodity and other
transactions. However, it trades less in chemicals, food and live animals, machinery and
transportation, manufactured goods, and miscellaneous manufactured goods. In these
22
particular categories there is no clear leader in intra-regional trade. This position is
switched between Bahrain, Kuwait, Oman, Qatar, and UAE.
6 Conclusions
Using a two-step framework, the gravity model was utilised to analyse the trade
flow patterns between different countries in the world. The aim in the first step was to
measure the effect of RTAs on bilateral trade flows. Comparing a significant portion of
existing RTAs in the world today, the model suggests that a number of RTAs in
developing countries explain a large portion of bilateral trade flow once economic factors
were accounted for. RTAs play a significant role in the determination of trade flow
between countries. Findings suggest that geographical proximity, shared borders and
language influence bilateral trade flows significantly. Such results are congruent with
previous literature. However, RTAs are substantially influential in determining trade
patterns. Although traditional trade blocs such as in developed countries maintain similar
effects found elsewhere in the literature, a number of these results are statistically
insignificant to draw additional conclusions about them. It is in developing countries’
RTAs where this paper finds large and significant effects on bilateral trade flows. Trade
blocs in the Caribbean, Africa and Central Asia show strong RTA effects on their trade
patterns. Latin American, Middle East, and Northern Africa’s RTAs remain less effective
on bilateral trade flows.
As seen from Step 1 in the model, the GCC appears to have no significant effect
on its members’ bilateral trade. This is confirmed by examining the import ratios of these
six countries as illustrated in Table 5. GCC intra-regional import ratios are substantially
low for most of the countries at the beginning and at the end of the period 1995 and 2006.
The second step of the framework used in this paper identified the intra-regional trade
patterns of the GCC region. In Step 2 the model quantifies commodity-specific
interactions between the GCC intra-regional trade. The largest economy in the region,
Saudi Arabia, dominates less than half of the sectors. The other five countries, Bahrain,
Kuwait, Oman, Qatar and UAE exceed Saudi Arabia’s intra-regional trade in more than
half of the cases. However, there is no clear trend where the other five countries exceed
the base case. Step 2 in the model also suggests that there is some degree of mineral fuel
23
trade within the region despite the similarities of these oil dependent economies. This
may indicate some intra-industry trade at some level.
Although the GCC countries have been undergoing economic integration for the
past two decades, the RTA has not intensified intra-regional trade during the sample
period. New development in the region such as the launch of a customs union and
movement towards a common market may not yield the effects desired yet. This may be
attributable to the similar economic structures of these six economies, and their
dependence on natural resources. Despite small trade volumes within the region, a
number of countries such as Bahrain and Oman maintain a significant portion of their
total trade within the region. The model suggests that a common border between these
countries and other GCC countries plays an important role.
References Anderson, James. "A Theoretical Foundation of the Gravity Equation." The American
Economic Review 69, no. 1 (1979): 106-16. Anderson, James, and Eric van Wincoop. "Gravity with Gravitas: A Solution to the
Border Puzzle." The American Economic Review 93, no. 1 (2003): 170-92. Bergstrand, Jeffery. "The Gravity Equation International Trade: Some Microeconomic
Foundations and Empirical Evidence." The Review of Economics and Statistics 67, no. 3 (1985): 474-81.
Centre D’études Prospectives et D’Informations Internationales. Distances, 2007 [cited June 2007]. Available from http://www.cepii.fr/anglaisgraph/bdd/distances.htm
Feenstra, Robert C. Advanced International Trade: Theory and Evidence. New Jersey: Princeton University Press, 2004.
———. "Border Effects and the Gravity Equation: Consistent Methods for Estimation." Scottish Journal of Political Economy 49, no. 5 (2002): 491-506.
Feenstra, Robert C., James R. Markusen, and Andrew K. Rose. "Using the Gravity Equation to Differentiate among Alternative Theories of Trade." The Canadian Journal of Economics 34, no. 2 (2001): 430-47.
Frankel, Jeffrey. Regional Trading Blocs: In the World Economic System: Institute for International Economics, 1997.
———, ed. The Regionalization of the World Economy, National Bureau of Economic Research Project Report: The University of Chicago Press, 1998.
Frankel, Jeffrey, and Stein, Ernesto, and Wei, Shang-jin. "Trading Blocs and the Americas: The Natural, the Unnatural, and the Super-Natural." Journal of Development Economics 47 (1995): 61-95.
ibid, no. 1 (1995): 61-95. International Monetary Fund. World Economic Outlook IMF, 2006 [cited April 2007].
Available from http://www.imf.org/external/pubs/ft/weo/2006/02/pdf/c2.pdf. International Monetary Fund. Direction of Trade Statistics International Monetary Fund,
2007 [cited June 2007]. Available from www.imfstatistics.org/DOTS.
24
Linnemann, Hans, An Econometric Study of International Trade Flows. Amsterdam: North-Holland, 1966.
McCallum, James. "National Borders Matter: Canada-U.S. Regional Trade Patterns." The American Economic Review 85, no. 3 (1995): 615-23.
Pöyhönen, Peutti, “A Tentative Model for the Volume of Trade Between Countries.” Weltwirtschaftliches Archiv. 90, no. 1 (1963).
Rose, Andrew K. "One Money, One Market: The Effect of Common Currencies on Trade." Economic Policy 15, no. 30 (2000): 7-45.
Tinbergen, Jan, Shaping the World Economy: Suggestions for an International Economic Policy: New York, The Twentieth Century Fund, 1962.
Viner, Jacob. The Customs Union Issue. New York: Garland Publishing, 1950. Whalley, John, “Why Do Countries Seek Regional Trade Agreements?" NBER Working
Papers no. 5552 (1996).
25
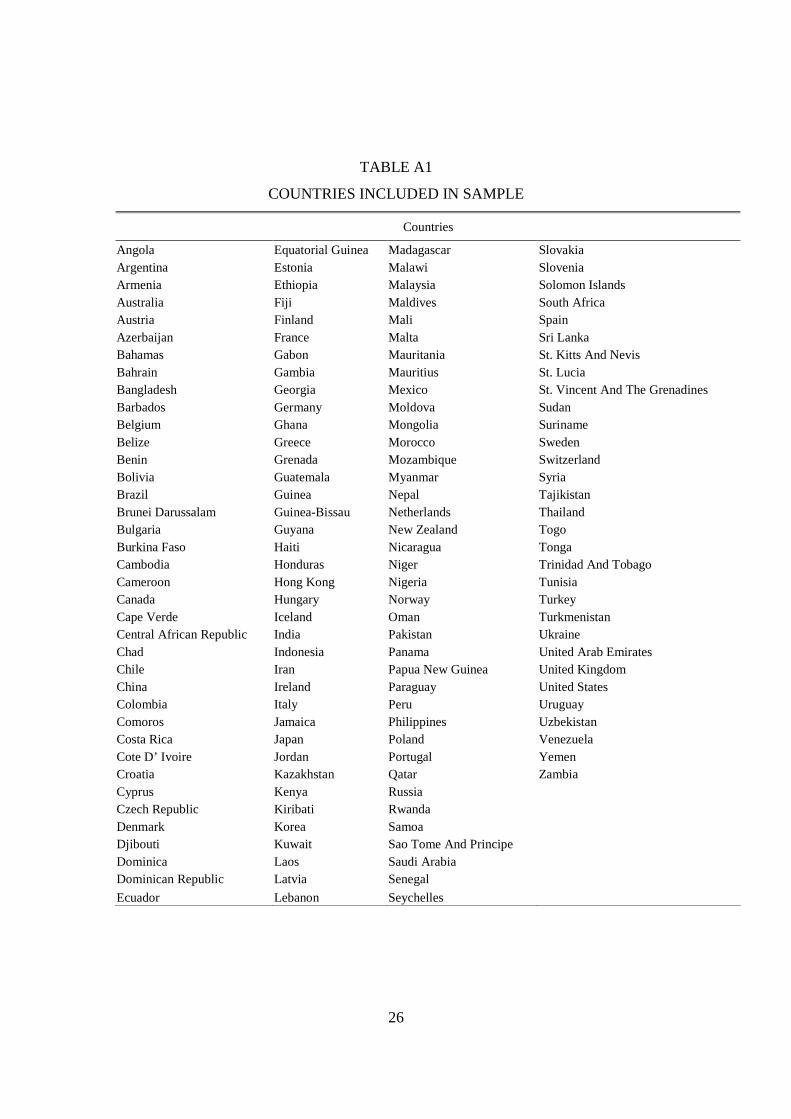
Appendix - Data
The gravity model included thirty-one countries that form major trading partners of the
GCC countries. The sample includes both developed and developing countries from
most continents except South America where no significant trade takes place with the
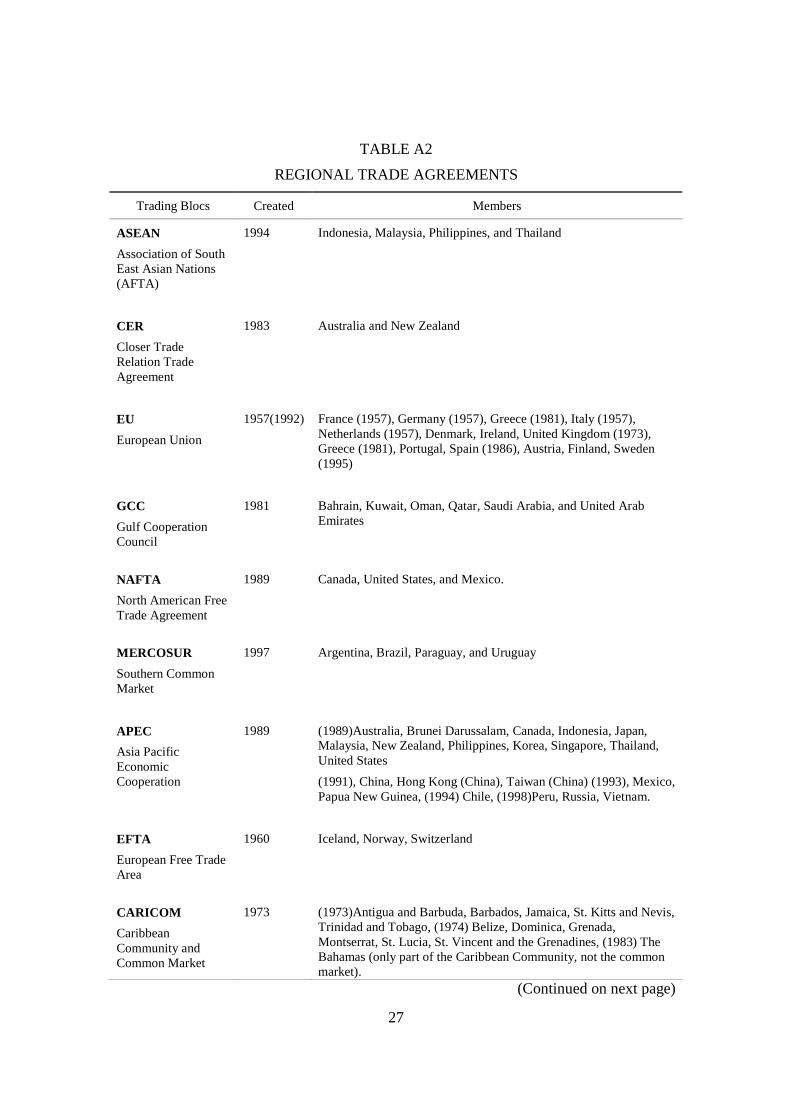
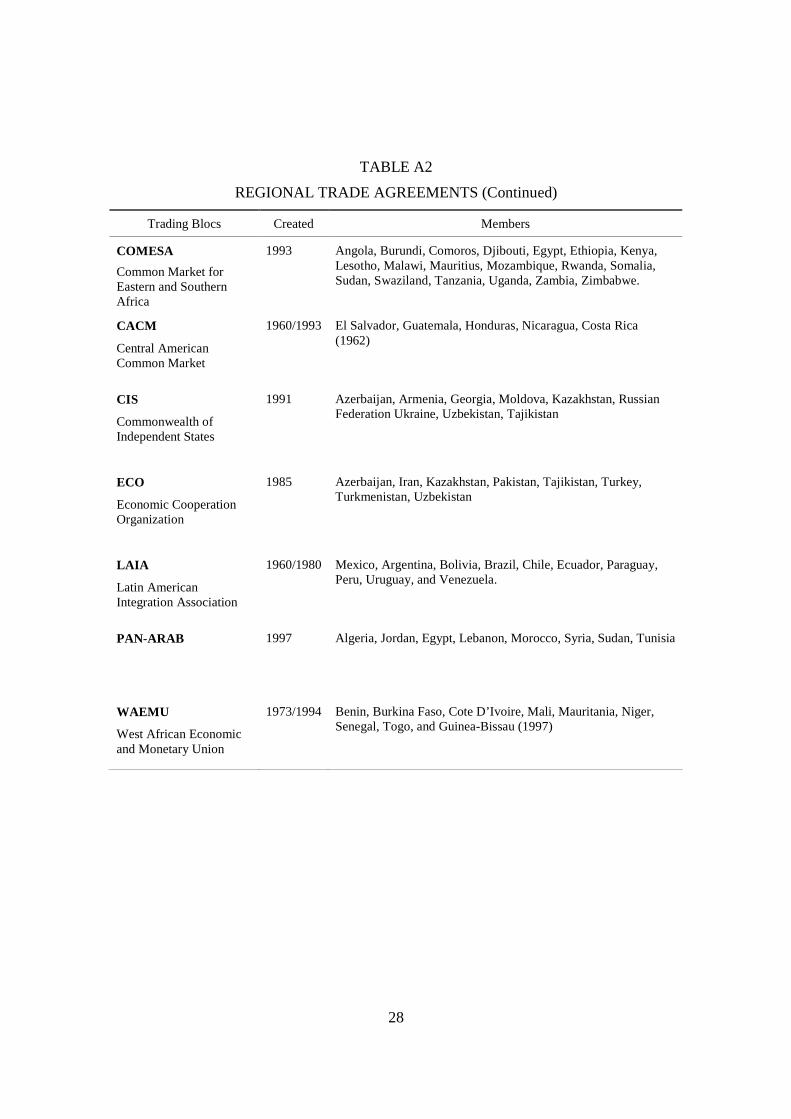
GCC. These countries are listed in Table A1. The above-listed countries are members of
several trading blocs. These are listed in Table A2. The Gravity Model’s data included a
number of economic parameters. These are listed in Table A3.
26
TABLE A1
COUNTRIES INCLUDED IN SAMPLE
Countries
Angola Equatorial Guinea Madagascar Slovakia Argentina Estonia Malawi Slovenia Armenia Ethiopia Malaysia Solomon Islands Australia Fiji Maldives South Africa Austria Finland Mali Spain Azerbaijan France Malta Sri Lanka Bahamas Gabon Mauritania St. Kitts And Nevis Bahrain Gambia Mauritius St. Lucia Bangladesh Georgia Mexico St. Vincent And The Grenadines Barbados Germany Moldova Sudan Belgium Ghana Mongolia Suriname Belize Greece Morocco Sweden Benin Grenada Mozambique Switzerland Bolivia Guatemala Myanmar Syria Brazil Guinea Nepal Tajikistan Brunei Darussalam Guinea-Bissau Netherlands Thailand Bulgaria Guyana New Zealand Togo Burkina Faso Haiti Nicaragua Tonga Cambodia Honduras Niger Trinidad And Tobago Cameroon Hong Kong Nigeria Tunisia Canada Hungary Norway Turkey Cape Verde Iceland Oman Turkmenistan Central African Republic India Pakistan Ukraine Chad Indonesia Panama United Arab Emirates Chile Iran Papua New Guinea United Kingdom China Ireland Paraguay United States Colombia Italy Peru Uruguay Comoros Jamaica Philippines Uzbekistan Costa Rica Japan Poland Venezuela Cote D’ Ivoire Jordan Portugal Yemen Croatia Kazakhstan Qatar Zambia Cyprus Kenya Russia Czech Republic Kiribati Rwanda Denmark Korea Samoa Djibouti Kuwait Sao Tome And Principe Dominica Laos Saudi Arabia Dominican Republic Latvia Senegal
Ecuador Lebanon Seychelles
27
TABLE A2
REGIONAL TRADE AGREEMENTS
Trading Blocs Created Members
ASEAN
Association of South East Asian Nations (AFTA)
1994 Indonesia, Malaysia, Philippines, and Thailand
CER
Closer Trade Relation Trade Agreement
1983 Australia and New Zealand
EU
European Union
1957(1992) France (1957), Germany (1957), Greece (1981), Italy (1957), Netherlands (1957), Denmark, Ireland, United Kingdom (1973), Greece (1981), Portugal, Spain (1986), Austria, Finland, Sweden (1995)
GCC
Gulf Cooperation Council
1981 Bahrain, Kuwait, Oman, Qatar, Saudi Arabia, and United Arab Emirates
NAFTA
North American Free Trade Agreement
1989 Canada, United States, and Mexico.
MERCOSUR
Southern Common Market
1997 Argentina, Brazil, Paraguay, and Uruguay
APEC
Asia Pacific Economic Cooperation
1989 (1989)Australia, Brunei Darussalam, Canada, Indonesia, Japan, Malaysia, New Zealand, Philippines, Korea, Singapore, Thailand, United States
(1991), China, Hong Kong (China), Taiwan (China) (1993), Mexico, Papua New Guinea, (1994) Chile, (1998)Peru, Russia, Vietnam.
EFTA
European Free Trade Area
1960 Iceland, Norway, Switzerland
CARICOM
Caribbean Community and Common Market
1973 (1973)Antigua and Barbuda, Barbados, Jamaica, St. Kitts and Nevis, Trinidad and Tobago, (1974) Belize, Dominica, Grenada, Montserrat, St. Lucia, St. Vincent and the Grenadines, (1983) The Bahamas (only part of the Caribbean Community, not the common market).
(Continued on next page)
28
TABLE A2
REGIONAL TRADE AGREEMENTS (Continued)
Trading Blocs Created Members
COMESA
Common Market for Eastern and Southern Africa
1993 Angola, Burundi, Comoros, Djibouti, Egypt, Ethiopia, Kenya, Lesotho, Malawi, Mauritius, Mozambique, Rwanda, Somalia, Sudan, Swaziland, Tanzania, Uganda, Zambia, Zimbabwe.
CACM
Central American Common Market
1960/1993 El Salvador, Guatemala, Honduras, Nicaragua, Costa Rica (1962)
CIS
Commonwealth of Independent States
1991 Azerbaijan, Armenia, Georgia, Moldova, Kazakhstan, Russian Federation Ukraine, Uzbekistan, Tajikistan
ECO
Economic Cooperation Organization
1985 Azerbaijan, Iran, Kazakhstan, Pakistan, Tajikistan, Turkey, Turkmenistan, Uzbekistan
LAIA
Latin American Integration Association
1960/1980 Mexico, Argentina, Bolivia, Brazil, Chile, Ecuador, Paraguay, Peru, Uruguay, and Venezuela.
PAN-ARAB 1997 Algeria, Jordan, Egypt, Lebanon, Morocco, Syria, Sudan, Tunisia
WAEMU
West African Economic and Monetary Union
1973/1994 Benin, Burkina Faso, Cote D’Ivoire, Mali, Mauritania, Niger, Senegal, Togo, and Guinea-Bissau (1997)
29
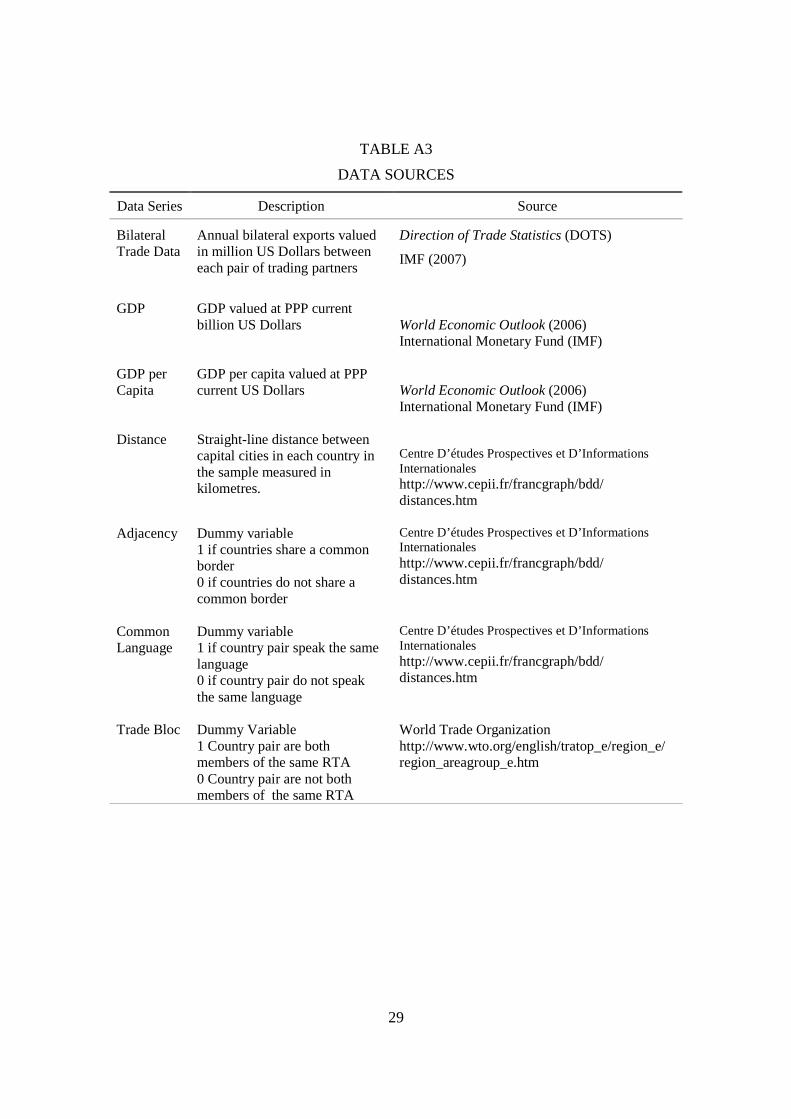
TABLE A3
DATA SOURCES
Data Series Description Source
Bilateral Trade Data
Annual bilateral exports valued in million US Dollars between each pair of trading partners
Direction of Trade Statistics (DOTS)
IMF (2007)
GDP GDP valued at PPP current billion US Dollars
World Economic Outlook (2006) International Monetary Fund (IMF)
GDP per Capita
GDP per capita valued at PPP current US Dollars
World Economic Outlook (2006) International Monetary Fund (IMF)
Distance Straight-line distance between capital cities in each country in the sample measured in kilometres.
Centre D’études Prospectives et D’Informations Internationales http://www.cepii.fr/francgraph/bdd/ distances.htm
Adjacency Dummy variable 1 if countries share a common border 0 if countries do not share a common border
Centre D’études Prospectives et D’Informations Internationales http://www.cepii.fr/francgraph/bdd/ distances.htm
Common Language
Dummy variable 1 if country pair speak the same language 0 if country pair do not speak the same language
Centre D’études Prospectives et D’Informations Internationales http://www.cepii.fr/francgraph/bdd/ distances.htm
Trade Bloc Dummy Variable 1 Country pair are both members of the same RTA 0 Country pair are not both members of the same RTA
World Trade Organization http://www.wto.org/english/tratop_e/region_e/ region_areagroup_e.htm
Related Documents