ACTA UNIVERSITATIS UPSALIENSIS UPPSALA 2014 Digital Comprehensive Summaries of Uppsala Dissertations from the Faculty of Science and Technology 1188 Interaction of Lightning Flashes with Wireless Communication Networks Special Attention to Narrow Bipolar Pulses MOHD RIDUAN AHMAD ISSN 1651-6214 ISBN 978-91-554-9067-6 urn:nbn:se:uu:diva-233673

Welcome message from author
This document is posted to help you gain knowledge. Please leave a comment to let me know what you think about it! Share it to your friends and learn new things together.
Transcript
ACTAUNIVERSITATIS
UPSALIENSISUPPSALA
2014
Digital Comprehensive Summaries of Uppsala Dissertationsfrom the Faculty of Science and Technology 1188
Interaction of Lightning Flasheswith Wireless CommunicationNetworks
Special Attention to Narrow Bipolar Pulses
MOHD RIDUAN AHMAD
ISSN 1651-6214ISBN 978-91-554-9067-6urn:nbn:se:uu:diva-233673
Dissertation presented at Uppsala University to be publicly examined in Polhemsalen,Ångströmlaboratoriet, Lägerhyddsvägen 1, Uppsala, Monday, 1 December 2014 at 14:00 forthe degree of Doctor of Philosophy. The examination will be conducted in English. Facultyexaminer: Professor Rajeev Thottappillil (KTH).
AbstractAhmad, M. R. 2014. Interaction of Lightning Flashes with Wireless CommunicationNetworks. Special Attention to Narrow Bipolar Pulses. Digital Comprehensive Summariesof Uppsala Dissertations from the Faculty of Science and Technology 1188. 70 pp. Uppsala:Acta Universitatis Upsaliensis. ISBN 978-91-554-9067-6.
In this thesis, the features of electric field signatures of narrow bipolar pulses (NBPs) generatedby cloud flashes are investigated and their effects on wireless communication systems arestudied. A handful amount of NBPs (14.5%) have been observed to occur as part of cloud-to-ground flashes in South Malaysia. Occurrence of NBPs in Sweden has been reported for thefirst time in this thesis. The electric field waveform characteristics of NBPs as part of cloud-to-ground flashes were similar to isolated NBPs found in Sweden and South Malaysia and alsoto those isolated NBPs reported by previous studies from various geographical areas. This isa strong indication that their breakdown mechanisms are similar at any latitudes regardless ofgeographical areas.
A comparative study on the occurrence of NBPs and other forms of lightning flashes acrossvarious geographical areas ranging from northern regions to the tropics is presented. As thelatitude decreased from Uppsala, Sweden (59.8°N) to South Malaysia (1.5°N), the percentageof NBP emissions relative to the total number of lightning flashes increased significantly from0.13% to 12%. Occurrences of positive NBPs were more common than negative NBPs at allobserved latitudes. However, as latitudes decreased, the negative NBP emissions increasedsignificantly from 20% (Sweden) to 45% (South Malaysia). Factors involving mixed-phaseregion elevations and vertical extents of thundercloud tops are invoked to explain the observedresults. These factors are fundamentally latitude dependent.
In this thesis, the interaction between microwave radiations emitted by cloud-to-groundand cloud flashes events and bits transmission in wireless communication networks are alsopresented. To the best of our knowledge, this is the first time such effects are investigated inthe literature. Narrow bipolar pulses were found to be the strongest source of interference thatinterfered with the bits transmission.
Keywords: Latitude, Lightning, Narrow bipolar pulse, Wireless network.
Mohd Riduan Ahmad, Department of Engineering Sciences, Electricity, Box 534, UppsalaUniversity, SE-75121 Uppsala, Sweden.
© Mohd Riduan Ahmad 2014
ISSN 1651-6214ISBN 978-91-554-9067-6urn:nbn:se:uu:diva-233673 (http://urn.kb.se/resolve?urn=urn:nbn:se:uu:diva-233673)

This thesis is dedicated tomy love, Mona
my superhero, Huzaifahmy angels, Fatiha and Ilham Linnaeus
my passionate parents, Zaliha and Ahmadand my supportive mother-in-law, Rosminah

Have you not seen how God makes the clouds move gently then joins them together
then makes them into a stack and then you see the rain come out of it
and He sends down hail from mountains of clouds in the sky and He strikes with it (lightning) whomever He wills
and turns it from whomever He wills. The vivid flash of its lightning nearly blinds the sight.
[Nobel Quran, 24:43]

Acknowledgements
First and foremost, I would like to thank Professor Gerald Vernon Cooray, my supervisor, my Guru, and my friend, who, apart from supervising and guiding my studies, has always comforted me with good advices and philosophical discussion. You are the best teacher I ever had. I will miss your lectures on electromagnetism.
My thank also goes to Professor Eryk Dutkiewicz at Macquarie University in Australia and Professor Kamal Rahim at Universiti Teknologi Malaysia (UTM) in Malaysia, who, have always supported me even though I’m not your student anymore. Your support, passion and sincere advises will be remem-bered always my best friends.
Also, I would like to take this opportunity to thank Professor Earle Wil-liams at Massachusetts Institute of Technology (MIT) for fruitful and very interesting discussion on the role of runaway electrons and the origin of NBPs.
This work would not been possible without the support from the members of lightning research group in Uppsala. I would like to thank Dr. Mahbubur, Dr. Sharma, Dr. Liliana, Dr. Azlinda, Dr. Zikri, Pasan, Oscar, Muzafar, and Dalina for their friendships throughout my study here. My special thanks also dedicated to Mr. Thomas and Mr. Ulf for the technical supports. To Gunnel, Maria, Ingrid and Anna for helping me concerning the administration issues. To all my friends in the Division of Electricity, thank you for the friendships and memories.
I would like to extend the gratitude to lightning research teams in Malaysia especially UTM team headed by Associate Professor Dr. Zul and his students Behnam, Kamyar, and Zaini and Universiti Putra Malaysia (UPM) team headed by Professor Zainal and Professor Gomes. To Dr. Zoinol from UTeM, special thanks for helping with the microwave measurement and for being my best friend always.
My special thank also goes to the proof read team, Professor Eryk, Mr. Muzafar, Dr. Saman Majdi, Dr. Mahbubur, Dr. Liliana and her boyfriend, and Dr. Mona. Your willingness to spend some of precious time to read the man-uscript is really appreciated.
To my wife, Dr. Mona, who, has been extremely passionate with my skep-tical and critical attitudes. I’m really appreciate that. Four years of working together will be a great experience to us for the coming years to excel in light-ning research in Malaysia. To my kids, Fatiha, Huzaifah, and Ilham Linnaeus, whom, have taught me to be a better father and researcher. Also to my mother-
in-law, who, has willing to travel many times to Sweden to be our babysitter and chef. Thank you very much mamatok!. Also to my parents, my brother Dr. Zubir and sister-in-law Dr. Husna in Egypt, my sisters Yana, Uji, and Syafiqah, my brother-in-law Padli, thank you for your prayers.
To Uppsalanians former and current, Kak Ami, Rahim, Kak Linda, Zikri, Kak Sas, Muz, Salman, Fadli, Maisarah, Jesmin, Shan, Shahar, Tok Janggut, Mimi and Dana, our moments together will be remembered always.
Financial support is always important. In this respect, I would like to acknowledge my gratitude to Malaysian Ministry of Education and Universiti Teknikal Malaysia Melaka (UTeM). Without them, I would not have oppor-tunity to further my study in Sweden.
Last but not least, to all my families and friends in Sweden, Malaysia and Egypt, which are not mention here, thank you very much for the supports, prayers, friendships and memories.
May this journey is blessed by God.
List of Papers
This thesis is based on the following papers, which are referred to in the text by their Roman numerals.
I *Esa, M. R. M., Ahmad, M. R., Cooray, V. Signatures of narrow bi-
polar pulses as part of cloud-to-ground flashes in tropical thunder-storms. Submitted to Journal of Atmospheric and Solar-Terrestrial Physics, September 2014.
II Ahmad, M. R., Esa, M. R. M., Cooray, V., (2013). Narrow bipolar pulses and associated microwave radiation. In: Proceeding of the Pro-gress in Electromagnetics Research Symposium, pp. 1087–1090.
III Ahmad, M. R., Esa, M. R. M., Cooray, V, Hettiarachchi, P, Ba-
harudin, Z. A. Electric field signature of narrow bipolar pulse ob-served in Sweden. Submitted to Atmospheric Research, September 2014.
IV Ahmad, M. R., Esa, M. R. M., Cooray, V., Baharudin, Z. A., Het-
tiarachchi, P. Latitude dependence of narrow bipolar pulse emissions. Submitted to Journal of Atmospheric and Solar-Terrestrial Physics, September 2014.
V Ahmad, M. R., Esa, M. R. M., Cooray, V., (2014). Similarity be-
tween the initial breakdown pulses of negative ground flash and nar-row bipolar pulses. In: Proceeding of the 32nd International Confer-ence on Lightning Protection (ICLP), Shanghai, China.
VI Ahmad, M. R., Esa, M. R. M., Cooray, V., Rahman, M., Dutkiewicz,
E., (2012). Lightning interference in multiple antennas wireless com-munication systems. Journal of Lightning Research, (4):155–165.
VII Ahmad, M.R., Esa, M. R. M., Cooray, V., Dutkiewicz, E., (2014). In-
terference from cloud-to-ground and cloud flashes in wireless commu-nication system. Electric Power Systems Research, (113):237–246.
Reprints were made with permission from the respective publishers. *Equal contribution between the first author and second author.
Other contributions of the author, not included in the thesis.
VIII Ahmad, M. R., Esa, M. R. M., Johari, D., Ismail, M. M., Cooray, V.,
(2014). Chaotic pulse train in cloud-to-ground and cloud flashes of tropical thunderstorms. In: Proceeding of the 32nd International Con-ference on Lightning Protection (ICLP), Shanghai, China.
IX Esa, M. R. M., Ahmad, M. R., Cooray, V., (2014). Occurrence of
narrow bipolar pulses between negative return strokes in tropical thun-derstorms. In: Proceeding of the 32nd International Conference on Lightning Protection (ICLP), Shanghai, China.
X Esa, M. R. M., Ahmad, M. R., Cooray, V., (2014). Time-frequency
profile of discharge processes prior to the first return stroke. In: Pro-ceeding of the 32nd International Conference on Lightning Protection (ICLP), Shanghai, China.
XI Ahmad, M. R., Esa, M. R. M., (2014). Angular momentum of a rotat-ing dipole. Journal of Telecommunication Electronic and Computer Engineering, (6): 17–20.
XII Esa, M. R. M., Ahmad, M. R., Rahman, M., Cooray, V., (2014). Dis-
tinctive features of radiation pulses in the very first moment of light-ning events. Journal of Atmospheric and Solar-Terrestrial Physics, (109): 22–28.
XIII Esa, M. R. M., Ahmad, M. R., Cooray, V., (2014). Wavelet analysis of
the first electric field pulse of lightning flashes in Sweden. Atmospheric Research, (138): 253–267.
XIV Esa, M. R. M., Ahmad, M. R., Cooray, V. Wavelet profile of initial
breakdown process accompanied by narrow bipolar pulses. Submitted to Journal of Atmospheric and Solar-Terrestrial Physics, October 2014.
XV Ahmad, M. R., Esa, M. R. M., Cooray, V., (2014). Occurrence of nar-
row bipolar event as part of cloud-to-ground flash in tropical thunder-storms”, In: Preprint of the 15th International Conference in Atmos-pheric Electricity (ICAE), Oklahoma, USA.
XVI Esa, M. R. M., Ahmad, M. R., Cooray, V., (2013). Wavelet analysis
of the first pulse of initial breakdown process in lightning discharges. In: Proceeding of the Progress in Electromagnetics Research Sympo-sium, pp. 1377–1380.
XVII Ahmad, M. R., Esa, M. R. M., Rahman, M., Cooray, V., (2012). Meas-urement of bit error rate at 2.4 GHz due to lightning interference. In: Proceeding of the 31st International Conference on Lightning Protec-tion (ICLP), Vienna, Austria.
XVIII Ahmad, M. R., Esa, M. R. M., Cooray, V., Dutkiewicz, E., (2012).
Performance analysis of audio streaming over lightning-interfered MIMOchannels. In: Proceeding of International Symposium on Communications and Information Technologies (ISCIT), Gold Coast, Australia, pp. 513–518.
XIX Esa, M. R. M., Ahmad, M. R., Cooray, V. Rahman, M., (2012). Dis-tinctive features of initial breakdown process between ground and cloud discharges. In: Proceeding of Asian Conference of Electrical Dis-charges (ACED), Johor Bahru, Malaysia.
XX Ahmad, M. R., Esa, M. R. M., Hettiarachchi, P., Cooray, V., (2012).
Preliminary observations of lightning signature at 2400 MHz in Swe-den thunderstorm. In: Proceeding of IEEE Asia-Pacific Conference of Applied Electromagnetics (APACE), Malacca, Malaysia, pp. 88–91.
XXI Ahmad, M. R., Rashid, M., Aziz, M. H. A. Esa, M. R. M., Cooray,
V., Rahman, M., Dutkiewicz, E., (2011). Analysis of Lightning-in-duced Transient in 2.4 GHz Wireless Communication System. In: Proceeding of IEEE International Conference on Space Science and Communication (IconSpace), Penang, Malaysia, pp. 225–230.
XXII Ahmad, M. R., Dutkiewicz, E., Huang, X., (2011). Energy efficient cooperative MAC protocols in wireless sensor networks. In: Wireless sensor network, Ed. Suraiya Tarannum, InTech, Croatia, pp. 91–114.
XXIII Ahmad, M. R., Dutkiewicz, E., Huang, X., (2011). A Survey of low duty cycle MAC protocols in wireless sensor networks. In: Emerging communications for wireless sensor networks, Ed. Anna Foerster and Alexander Foerster, InTech, Croatia, pp. 69–90.

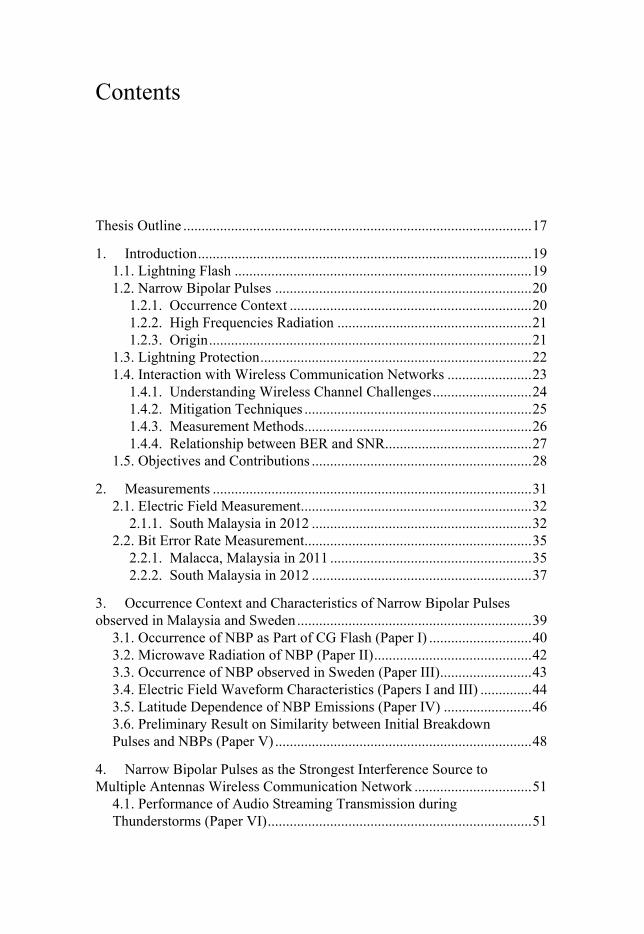
Contents
Thesis Outline ............................................................................................... 17
1. Introduction ........................................................................................... 19 1.1. Lightning Flash ................................................................................. 19 1.2. Narrow Bipolar Pulses ...................................................................... 20
1.2.1. Occurrence Context .................................................................. 20 1.2.2. High Frequencies Radiation ..................................................... 21 1.2.3. Origin ........................................................................................ 21
1.3. Lightning Protection .......................................................................... 22 1.4. Interaction with Wireless Communication Networks ....................... 23
1.4.1. Understanding Wireless Channel Challenges ........................... 24 1.4.2. Mitigation Techniques .............................................................. 25 1.4.3. Measurement Methods .............................................................. 26 1.4.4. Relationship between BER and SNR ........................................ 27
1.5. Objectives and Contributions ............................................................ 28
2. Measurements ....................................................................................... 31 2.1. Electric Field Measurement ............................................................... 32
2.1.1. South Malaysia in 2012 ............................................................ 32 2.2. Bit Error Rate Measurement .............................................................. 35
2.2.1. Malacca, Malaysia in 2011 ....................................................... 35 2.2.2. South Malaysia in 2012 ............................................................ 37
3. Occurrence Context and Characteristics of Narrow Bipolar Pulses observed in Malaysia and Sweden ................................................................ 39
3.1. Occurrence of NBP as Part of CG Flash (Paper I) ............................ 40 3.2. Microwave Radiation of NBP (Paper II) ........................................... 42 3.3. Occurrence of NBP observed in Sweden (Paper III) ......................... 43 3.4. Electric Field Waveform Characteristics (Papers I and III) .............. 44 3.5. Latitude Dependence of NBP Emissions (Paper IV) ........................ 46 3.6. Preliminary Result on Similarity between Initial Breakdown Pulses and NBPs (Paper V) ...................................................................... 48
4. Narrow Bipolar Pulses as the Strongest Interference Source to Multiple Antennas Wireless Communication Network ................................ 51
4.1. Performance of Audio Streaming Transmission during Thunderstorms (Paper VI) ........................................................................ 51

4.2. Interference from CG and IC Flashes (Paper VII) ............................ 53 4.2.1. Categorization of Interference Event ........................................ 54 4.2.2. Correlation Analysis ................................................................. 56
5. Conclusions ........................................................................................... 61
Svensk Sammanfattning ................................................................................ 63
Bibliography ................................................................................................. 65
Abbreviations
ACI Adjacent channel interference BER Bit error rate BLR Bit loss rate BPSK Binary phase shift keying CAPE Convective available potential energy CCI Co-channel interference CD Compact disk CDROM Compact disk read-only memory CID Compact intra-cloud discharge CG Cloud-to-ground CLD Consecutive lost datagram CP Chaotic pulse CPT Chaotic pulse train CTS Clear to send DCF Distributed coordinated function DL Dart leader DSL Dart stepped leader DSO Digital storage oscilloscope FCC Federal communications commission FCS Frame check sequence FEC Forward error checking FSK Frequency shift keying FW Fair weather FWHM Full width half maximum Gbps Giga bits per second GHz Giga Hertz GPS Global positioning system HF High frequency Hz Hertz IBP Isolated breakdown pulses IC Intra-cloud IEEE Institute of electrical and electronics engineers IP Internet protocol ITU-R International telecommunication union - radio IVG Impulse voltage generator LAN Local area network
LLN Lightning location network LOS Line-of-sight LPCR Lower positive charge region MAC Medium access control Mbps Mega bits per second MHz Mega Hertz MS/s Mega samples per second NBE Narrow bipolar event NBP Narrow bipolar pulse NLOS None line-of-sight NOAA National ocean and atmospheric administration PBP Preliminary breakdown process PD Pulse duration PDF Probability density function PER Packet error rate PMR Private mobile radio PSD Power spectral density PVC Polyvinyl chloride QAM Quadrature amplitude modulation RCT Recloser test-set RF Radio frequency RREA Relativistic runaway electron avalanche RS Return stroke RT Rise time RTP Real time protocol RTS Ready to send SL Stepped leader SMHI Swedish meteorological and hydrological institute SNR Signal-to-noise ratio UDP User datagram protocol UHF Ultra high frequency USB Universal serial bus UTM Universiti Teknologi Malaysia UTeM Universiti Teknikal Malaysia Melaka V/m Volt per meter VHF Very high frequency WLAN Wireless local area network WSN Wireless sensor network WWLLN World-wide lightning location network ZCT Zero crossing time
17
Thesis Outline
This thesis is based on seven papers and divided into five chapters. Chapter 1 gives a comprehensive introduction to the main subjects of this the-sis that are narrow bipolar pulses and wireless communication networks. At the end of this chapter, the objectives and contributions of each paper are given. Chapter 2 describes experimental setup and instrumentation used during measurements that had been conducted in Sweden and Malaysia. Chapter 3 presents a comprehensive summary of the latest results and analysis reported in Papers I, II, III, IV, and V about new observations, occurrence context and waveform characteristics of narrow bipolar pulses. Chapter 4 presents a comprehensive summary of results and analysis from experimental work in Papers VI and VII that have been conducted to study interaction between microwave radiation emitted by narrow bipolar pulses and transmission of bits by a wireless communication network. Chapter 5 provides important conclusions that can be made from the studies conducted in Papers I, II, III, IV, V, VI, and VII.

19
1. Introduction
1.1. Lightning Flash Lightning is one of the fascinating natural phenomena on earth. However, many aspects of lightning are still not really well understood mainly due to its interdisciplinary nature. Two types of lightning flashes that have been dis-cussed in great details are cloud-to-ground (CG) and cloud flashes. A thun-dercloud that produces these lightning flashes generally contains two main charge centers, one positive and the other negative, and a pocket of lower pos-itive charge region (LPCR) located at the base of the cloud.
Cloud-to-ground flash lowers down electrical charges from thundercloud to surface of earth. In the case of positive charges lowered down, the flash is known as a positive CG flash and for the opposite polarity, the flash is known as a negative CG flash. Electromagnetic field measurements show that a CG flash is initiated by a preliminary breakdown process (PBP) that takes place inside a thundercloud and followed by a process known as stepped leaders (SLs) which lower electric charges further down to the earth’s surface. The stepped leaders are followed by a return stroke; a neutralization process that takes place just soon after the downward stepped leaders make a contact with an upward connecting leader from earth’s surface. It is common to observe the occurrence of a negative CG flash with several subsequent return strokes while it is common for a positive CG flash to be observed with only one return stroke. It is typical to observe that some subsequent return strokes are pre-ceded by dart leaders (DLs) or dart stepped leaders (DSLs). In between return strokes, several processes have been observed to occur such as a chaotic pulse train (CPT), M-components, and K-changes. These processes are collectively categorized as the junction process or J-process.
A cloud flash is a lightning discharge originated inside a thundercloud that never reaches the surface of earth. When the discharge confines inside the same thundercloud, it is known as an intra-cloud (IC) flash. When the dis-charge happens between two charge centers of two different thunderclouds, such a discharge known as a cloud to cloud flash. An intra-cloud flash takes place between the main negative charge center and main positive charge cen-ter. A special category of the IC flash known as narrow bipolar pulses (NBPs) will be discussed in great details in this thesis.
20
1.2. Narrow Bipolar Pulses Narrow bipolar pulses are the electric fields produced by a distinct category of IC flashes. They were first reported by Le Vine (1980) and later described in more detail by Cooray and Lundquist (1985), Willett et al. (1989), Medelius et al. (1991) and Smith et al. (1999). Narrow bipolar pulses differ from the radiation fields produced by return strokes in several ways. The zero crossing time of these pulses are much narrower than that of the return strokes and the range normalized amplitudes are much larger than those of return strokes. A narrow bipolar pulse is also known by other names such as a narrow bipolar event (NBE) and a compact intra-cloud discharge (CID).
In this chapter and throughout the thesis, the action of positive charges low-ered down (or negative charges transported upward) produces an electric field change as shown in Figure 3.1. This NBP signature is known as positive NBP (+NBP) due to the convention used when positive charges are lowered down in a thundercloud. On the other hand, the action of negative charges lowered down (or positive charges transported upward) produces an electric field change as shown in Figure 3.2. This NBP signature is known as negative NBP (–NBP) due to the convention used when negative charges are lowered down in a thundercloud.
1.2.1. Occurrence Context Most of NBPs are found to occur in isolation, without any electrical activity immediately before or after the pulses. In the case when NBPs occur as part of an ordinary IC flash, they usually initiate the flash [Rison et al., 1999; Smith et al., 2004]. Narrow bipolar pulses have been observed with both positive and negative polarities where the occurrence of +NBPs are found to be more com-mon than −NBPs. In general, the altitude of −NBP emission is found to be higher than +NBP [Smith et al., 2004; Zhu et al., 2010; Wu et al., 2013].
Recently, NBPs are reported to occur as part of CG flash activities. Nag et al. (2010) reported about 6% of the total examined NBPs have occurred as part of a CG flash in Florida thunderstorms. Azlinda Ahmad et al. (2010) re-ported that about 2.8% of the total recorded NBPs have occurred as part of a CG flash in Malaysian thunderstorms during the southwestern monsoon sea-son. Wu et al. (2011) reported about 0.2% of the total examined NBPs have occurred as part of a CG flash in South China thunderstorms.
Narrow bipolar pulses have been observed to occur within or near the con-vective cores of thunderstorms [Jacobson and Heavner, 2005; Suszcynsky et al., 2005]. It has been inferred that NBP flash rates and emission altitudes are generally driven by the strength of the convective updraft in mid-latitude thun-derstorms [Suszcynsky and Heavner, 2003; Wiens et al., 2008; Wu et al., 2013]. In other words, as the altitude of NBP emissions increase, the NBP
21
flash rates also increase. Consequently, the NBP flash rate has been proposed to monitor thunderstorm severity [Wu et al., 2013].
1.2.2. High Frequencies Radiation In most cases, very intense high frequency (HF)/very high frequency (VHF) radiation bursts accompany NBPs. Le Vine (1980) reported observations of –NBPs at 3 MHz, 139 MHz, and 295 MHz using vertically polarized antennas. They observed that –NBP produced the strongest radio frequency (RF) radia-tion and even larger than the RF radiation of return strokes at these HF and VHF frequencies. Rison et al. (1999) reported observations of +NBPs at 63 MHz. They observed that the peak VHF radiation of +NBP was 30 dB greater than IC and CG events. Smith et al. (1999) reported observations of +NBPs recorded by broadband HF systems between 3 MHz and 30 MHz using discone antennas. The broadband noise-like HF radiation bursts associated with +NBPs have a mean duration of 2.8 µs and amplitudes ten times larger than radiation from IC and CG flashes at HF frequencies. Sharma et al. (2008) reported observations of +NBPs at 5 MHz and 10 MHz using parallel flat plate antennas. They observed that these HF radiations start with the onset of the +NBP event. Azlinda Ahmad et al. (2010) reported observations of both +NBPs and –NBPs at 3 MHz and 30 MHz using parallel flat plate antennas. They found short nanosecond scale sub pulses embedded on the rising and decaying edges of NBPs and these pulses always triggered the 3 MHz and 30 MHz narrowband receivers.
1.2.3. Origin Several researchers [Watson and Marshall, 2007; Nag and Rakov, 2009; Nag and Rakov, 2010] have proposed that a hot conductive channel exists through which currents of many kilo amperes in amplitude flow; these currents gener-ate the electric field. The estimated speed of propagation of the current pulse is from 0.3 × 10⁸ m/s to 1 × 10⁸ m/s with an estimated channel length of about 1000 m or less. Considering such very fast propagation speeds in virgin air, it is not likely that the initial breakdown will be due to the electron drift speed in the ambient electric field. That in turn suggests that the initial breakdown propagation is either photon- or fast (runaway) electron-modulated. The fact that close NBP electric field signatures appear without any detectable initial breakdown processes (pre-leader activity) preceding the event, and that HF/VHF radiations can be detected almost simultaneously with the NBP on-set, suggest that the initial breakdown processes and the formation of the hot conductive channel must occur instantaneously, i.e., at the propagation speed of light. Furthermore, frequent observations of gamma-ray glows [Dwyer and Uman, 2014] from thunderstorms suggest that the electric fields that are
22
needed to produce runaway electron avalanches are common inside thunder-storms. As relativistic runaway electron avalanches (RREAs) come into the picture, the NBP electric field signature is believed to be generated from the propagation of RREAs alone rather than from current pulse propagation along a hot conductive channel [Cooray and Cooray, 2012; Cooray et al., 2014]. The proposed simulation models fit very well with the electric field changes and HF/VHF radiation signatures. The estimated propagation speed is between 2–3 × 10⁸ m/s with estimated lengths between 400 and 600 m.
1.3. Lightning Protection There are thousands of natural lightning flashes occurring every day world-wide. Recent study estimates the global lightning flash rate to be around 300 flashes per second [Rakov and Uman, 2003]. Most of the time the occurrence of lightning flashes is hardly noticed by us due to the fact that three quarter of the flashes occur inside the cloud and are thus invisible to us. On the other hand, the remaining quarter are visible to our naked eyes in the form of optical radiation that strike the surface of earth.
Lightning research in fact, is an interdisciplinary subject with the needs of various branches of engineering, physics, and chemistry integrated. Lightning research brings together power engineers, electromagnetic specialists, tele-communication engineers, high voltage engineers, physicists, and chemistries to study lightning phenomena and investigate measures to avoid or prevent dangers caused by lightning. In general, the sources of danger caused by nat-ural lightning flashes can be categorized into three types as follows:
• Direct strikes from CG flashes. The dangers imposed by direct strikes are
usually related to human fatalities and injuries, property damages, and economy lost.
• Power surge from lightning strikes. The dangers imposed by a power
surge usually relate to devices/equipment damages and economic loss. It happens when lightning strikes a power line, telephone line, or grounding wire and creates a ‘power surge’ travelling along the lines/wires and dam-ages devices/equipment connected to the lines/wires.
• Radiation produced by both CG and IC flashes. The dangers imposed by
radiation usually relate to electromagnetic interference or disturbance to wireless systems such as television and radio broadcasting.
23
The scope of this thesis is limited to the dangers caused by the lightning radi-ation to wireless communication systems. The radiation danger is actually a major problem due to the fact that the radiation is produced by both CG and IC flashes where IC flashes constitute about three quarter of the total lightning events. Meanwhile direct strikes and power surges are only contributed by CG flashes which constitute only one quarter from the total lightning events.
1.4. Interaction with Wireless Communication Networks Wireless communication networks have evolved rapidly from the last decade and utilized a wide range of frequency bands for their operation particularly in the microwave band region. Currently, broadband wireless systems are op-erating between 2 and 6 GHz frequency bands particularly at 2.4 GHz, 5.2 GHz and 5.8 GHz. These frequency bands are chosen because they are free and open to use by anyone. Recent observations of microwave radiation from lightning flashes in [Fedorov et al., 2001; Petersen and Beasley, 2014] have triggered our interest to study its effects on wireless communication networks. Petersen and Beasley have observed strong microwave radiation at 1.63 GHz associated with CG flash events such as PBP, SLs, DLs, and return strokes. Meanwhile, Fedorov et al. have detected millimetric microwave radiation at 37.5 GHz from a return stroke within a distance less than 5 km. The signal duration was between 20-60 µs. The maximum spectral radiation intensity was more than 10-19 W/(m2·Hz) or about -180 dB.
First experimental work that studied interaction between laboratory sparks and wireless communication network is believed to be conducted for the first time by Esa et al. (2005). They have investigated the effects of interference from laboratory sparks on a private mobile radio (PMR) communication net-work by observing the bit loss rate (BLR) at ultra high frequency (UHF) band around 500 MHz. Laboratory sparks were created in two different series of measurements where in one case an impulse voltage generator (IVG) was used and in another case a recloser test-set (RCT) was used. Impulse voltage gen-erator produced sparks at breakdown voltages of 170kV and 400kV and RCT produced magnetic fields at discharge current peaks of 200A, 250A, 440A, 650A, 720A, 850A, 1500A and 2000A. A pair of Motorola Talkabout T5420 walkie-talkies was separated by 5 meters a line-of-sight (LOS) distance. These walkie-talkies were used to transmit audio packets. Each packet contains 1000 frequency shift-keying (FSK) modulated bits. The measurements were con-ducted at Universiti Teknologi Malaysia (UTM) High Voltage Lab, Malaysia. In their experiment, where an impulse voltage was applied to create the spark all bits were received successfully without losses whereas 25 bits were lost for the high-current experiment at 440A, 850A and 2kA current peak values
24
which corresponds to the BLR value of 2.5∙102. Interestingly, no losses were recorded for other current values specially at 650A, 720A and 1500A. How-ever no explanation was given for this observation. Recorded BLR at 2.5∙10-2
clearly shows a low quality audio transmission.
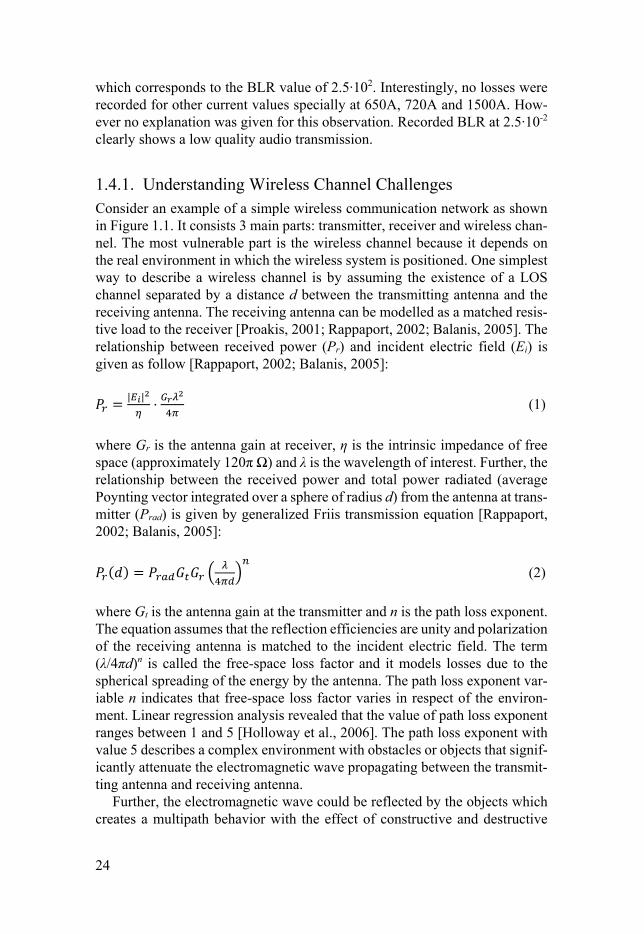
1.4.1. Understanding Wireless Channel Challenges Consider an example of a simple wireless communication network as shown in Figure 1.1. It consists 3 main parts: transmitter, receiver and wireless chan-nel. The most vulnerable part is the wireless channel because it depends on the real environment in which the wireless system is positioned. One simplest way to describe a wireless channel is by assuming the existence of a LOS channel separated by a distance d between the transmitting antenna and the receiving antenna. The receiving antenna can be modelled as a matched resis-tive load to the receiver [Proakis, 2001; Rappaport, 2002; Balanis, 2005]. The relationship between received power (Pr) and incident electric field (Ei) is given as follow [Rappaport, 2002; Balanis, 2005]: = | | ⋅ (1)
where Gr is the antenna gain at receiver, η is the intrinsic impedance of free space (approximately 120π Ω) and λ is the wavelength of interest. Further, the relationship between the received power and total power radiated (average Poynting vector integrated over a sphere of radius d) from the antenna at trans-mitter (Prad) is given by generalized Friis transmission equation [Rappaport, 2002; Balanis, 2005]: ( ) = (2)
where Gt is the antenna gain at the transmitter and n is the path loss exponent. The equation assumes that the reflection efficiencies are unity and polarization of the receiving antenna is matched to the incident electric field. The term (λ/4πd)n is called the free-space loss factor and it models losses due to the spherical spreading of the energy by the antenna. The path loss exponent var-iable n indicates that free-space loss factor varies in respect of the environ-ment. Linear regression analysis revealed that the value of path loss exponent ranges between 1 and 5 [Holloway et al., 2006]. The path loss exponent with value 5 describes a complex environment with obstacles or objects that signif-icantly attenuate the electromagnetic wave propagating between the transmit-ting antenna and receiving antenna.
Further, the electromagnetic wave could be reflected by the objects which creates a multipath behavior with the effect of constructive and destructive
25
interference. There will be variations in the received signal depending on the frequency and position of both transmitting and receiving antennas. This fac-tor is called fading (h) and is commonly described in a statistical manner due to its environment dependent nature. A smaller value of h indicates that the line-of-sight (LOS) component is still dominant and as the h value gets larger, the non-LOS (NLOS) components become dominant. The generalized Friis transmission equation includes the fading factor (h) and it can be written as: ( ) = |ℎ| (3)
In addition to attenuation and reflection factors, interference from other trans-mitters could create asimilar effect as fading that is constructive and destruc-tive interference. Two common types of interference in wireless communica-tion networks are co-channel interference (CCI) and adjacent channel inter-ference (ACI). Co-channel interference is caused by other transmitters oper-ating in the same frequency band while ACI is caused by other transmitters operating in frequency band partially overlapping with the operating fre-quency of the intended system.
Figure 1.1. Three basic components of a wireless communication network.
1.4.2. Mitigation Techniques The performance of a wireless communication network depends greatly on the wireless channel condition. The most obvious problems are deep fading and interference that contribute to serious packet error problems or even total packet loss if the packet undergoes a long deep fading period or when the size of the packet is very small [Ahmad et al., 2008; Ahmad et al., 2010]. Obvi-ously from the previous observations, the higher error or loss rates will reduce the overall performance of the wireless networks.
26
In wireless communication networks, conventional techniques to mitigate the problem of performance degradation is either by increasing the transmis-sion power of the transmitter or by designing more efficient communication protocols that could transfer the data reliably during the disturbance period. In some cases both measures are applied. However, both techniques trade off energy saving for a reliable communication link. Energy is an expensive com-modity in wireless communication networks as many wireless devices are bat-tery powered.
On the other hand, there is always a limitation in the maximum transmis-sion power. For example, in the US, Federal Communications Commission (FCC) regulates the maximum transmission power allowed for a wireless local area network (WLAN). With less than 6 dB antenna gain the power must be less than 1 Watt. In practice, the maximum transmission power allowed by vendors is much lower at around 100 mW. Another example for low power IEEE 802.15.4 wireless sensor network (WSN) operating at 2.4 GHz, the max-imum transmission power allowed is 2 mW with maximum current consump-tion is 21.5 mA.
Alternatively, a multiple antennas technology has been introduced to miti-gate the effects of deep fading and interference by exploiting a space-time property by operating within the constraint of allowed transmission power. Link reliability of multiple antennas wireless networks is obtained by increas-ing the probability of receiving bits successfully. Multiple antennas technol-ogy has demonstrated that reliable links could be maintained during data trans-mission under the influence of man-made interference for various kinds of wireless networks [Proakis, 2001; Rappaport, 2002]. However, interference due to large scale natural sources with a much higher transmission power such as lightning radiation could reduce the link reliability significantly. It could degrade the performance of all multiple antennas links at the same time.
1.4.3. Measurement Methods In general, three methods have been used extensively to measure wireless channel properties namely time domain, frequency domain and bit error rate (BER). The time domain method provides amplitude and phase information for a specific environment and is useful for study of the signal-to-noise (SNR) relationship. This method reveals the effect of reflections in the environment. The frequency domain method provides power spectrum information at a spe-cific frequency. This method reveals the effect of interference where one can identify the frequency and power spectrum information of other interferers. The bit error rate method provides information regarding performance of a wireless channel for a specific environment. This method is very useful to study interaction between wireless communication networks with environ-ments but is not really useful in identifying the effects (reflection, interference, etc.) that have affected the system.
27
1.4.4. Relationship between BER and SNR Consider a wireless communication network utilizing the binary phase shift keying (BPSK) modulation under the effect of fading with gain h and experi-encing free space losses. In a single link wireless communication network, the conditional SNR is given by [Proakis, 2001]: = |ℎ| (4)
where PN is the thermal noise power spectral density (PSD) given as No/2 dBm per Hertz and PI is the total power radiated from interference source. The prob-ability density function (PDF) of SNR is given by: ( ) = (5)
where snra is the average SNR. Consider that the fading gain is flat at least for one symbol period Tb [Larsson and Stoica, 2003], then the average SNR can be written as: = (6)
The average BER bounded by the upper bound of SNR is: ≤ = (7)
In order to estimate the total number of damaged packets, we must estimate the packet error rate (PER). Without forward error correction (FEC), the rela-tionship between PER, BER and SNR is given: = 1 − (1 − ) = 1 − 1 − (8)
where L is the packet length in bits. As the interference power increases, the average SNR decreases as shown
in Equation 6. Consequently, BER and PER values get higher and the perfor-mance of the wireless communication network degrades.
28
1.5. Objectives and Contributions This thesis covers two important subjects regarding NBPs. The first subject deals with the physics and phenomenology of NBPs. Latest results on the oc-currence context and characteristics of NBPs as observed in Uppsala, Sweden and South Malaysia are presented. The second subject falls within the scope of lightning protection. Results from a study on the interaction between mi-crowave radiations emitted by CG and IC flashes events and bits transmission in wireless communication networks are presented. The objectives and contri-butions of each paper are summarized as follow: [Paper I] Signatures of NBPs as Part of Cloud-to-Ground Flashes in Tropical Thunderstorms
In this paper, we presented new experimental results from tropical thunder-storms that may give new insights about NBP occurrence and its association with other lightning events in a CG flash. We reported new observation of NBPs occurring prior to and after the first return stroke. Further, we presented a detailed analysis and a comparison of the electric field waveform character-istics of isolated NBPs, NBPs occurring prior to the first return stroke, and NBPs occurring after the first return stroke. The motivation is to observe any similarities or/and differences in NBPs occurring at different stages of the lightning flash and to understand how the features of NBPs are connected to the events in a CG flash, particularly the return stroke. [Paper II] Narrow Bipolar Pulses and Associated Microwave Radiation
In this paper, observation of microwave radiation bursts of pulses emitted dur-ing detection of NBP event is reported. Electric field waveform characteristics of the microwave radiation bursts were analyzed. [Paper III] Electric Field Signature of NBP Observed in Sweden
In this paper, we report for the first time occurrence of NBPs as observed from thunderstorms in Sweden. A measurement conducted in Uppsala, Sweden dur-ing summer 2006 [Sharma et al., 2008] failed to record any NBPs. As NBPs are expected to be very rare in northern regions, we are motivated to examined records of lightning flash events for the 5 years period between 2009 and 2014 in order to search for NBP signatures. [Paper IV] Latitude Dependence of NBP Emissions
In this paper, we examined the occurrences of NBPs at various latitudes across different geographical regions ranging from northern regions to the tropics.
29
Specifically, we analyzed the percentage of NBP occurrences relative to the number of total lightning flashes and the percentage of occurrences for posi-tive and negative NBPs as the latitude decreases from Uppsala, Sweden (59.8°N) to South Malaysia (1.5°N). Then, we provided some insights into the charge structure of thunderstorms, the relationship between NBPs and severe storms, particularly tropical thunderstorms, and the NBP discharge mecha-nism. [Paper V] Similarity between the Initial Breakdown Pulses of Negative Ground Flash and NBPs
As put forward recently by Gurevich and Karashtin (2013) that RREAs could occur in the region between the main negative charge center and LPCR, we are motivated to investigate whether the initial electric field pulses of PBP in very close negative CG flashes are having similarity to the close NBPs. If those initial PBP pulses were a result of the RREA discharge, then it should possible to observe similar features between them and close NBPs. In this pa-per, we reported similar temporal characteristics that have been found between the initial electric field pulses of PBP from very close negative CG flashes and close NBPs recorded in South Malaysia. [Paper VI] Lightning Interference in Multiple Antennas Wireless Communi-cation Systems
In this paper, we presented an analysis of BER measurements at 2.4 GHz and 5.2 GHz to evaluate the effects of lightning interference on audio transmission for a multiple antennas communication network. The interference source was obtained directly from natural lightning and differs from laboratory sparks as conducted by Esa et al. (2005) and the BER values in our work were measured and not simulated.
[Paper VII] Interference from Cloud-to-Ground and Cloud Flashes in Wire-less Communication System
In order to know what type of CG and IC events possibly have interfered with the bits transmission in the wireless communication networks, which could not be identified in Paper VI, second experimental work was conducted in South Malaysia in 2012. Recording from the BER measurement system and electric field change recording system had been synchronized to provide com-mon time stamp information. Lightning waveforms together with BER data from 3 tropical thunderstorms were examined and analyzed. Both CG and IC flashes were observed to interfere with the wireless communication network to some degrees.

31
2. Measurements
This chapter describes the experimental setup, instrumentation, and location techniques for measurements of wideband electric field change, microwave electric field radiation, and bit error rate (BER). For this thesis work, data was based on measurements carried out at three different locations:
• Malacca, Malaysia • South Malaysia • Uppsala, Sweden
Measurements in Uppsala, Sweden had been conducted for a period of 5 years; between June and August 2009, 2010, 2011, 2012, and 2014. Measurements in South Malaysia had been conducted for a period of 2 years; between April and May 2009, and between November and December 2012. Measurements in Malacca, Malaysia had been conducted between January and March 2011.
Measurements carried out between 2009 and 2011 in Uppsala, Sweden and 2009 in South Malaysia have been explained in great details by Ahmad (2011) and Baharudin (2014) in their theses, and thus, are not repeated here. In this thesis, we explain measurements that had been carried out by us at Malacca, Malaysia in 2011 and at South Malaysia in 2012. The experimental setup and instrumentation used for measurements conducted by us in Uppsala, Sweden in 2012 and 2014 were also similar to the setup described by Ahmad and Ba-harudin in their theses, and therefore, are not repeated here.
Wideband electric field change data obtained from the measurements car-ried out at Uppsala, Sweden in 2009, 2010, 2011, 2012, and 2014 have been used for analysis in Paper III and IV. Lightning location data in Sweden were obtained from lightning location network (LLN) provided by Swedish mete-orological and hydrological institute (SMHI). Lightning location data in South Malaysia were obtained from World wide lightning location network (WWLLN).
32
2.1. Electric Field Measurement 2.1.1. South Malaysia in 2012 Twelve measurements were conducted on 23rd November, 27th to 30th Novem-ber, 3rd December, 5th December, 6th December, 10th December, 12th Decem-ber, 13th December, and 19th December. All measurements were conducted during the northeastern monsoon period at observatory station in Universiti Teknologi Malaysia (UTM), Skudai, South Malaysia (latitude 1.5°N, longi-tude 103.6°E). The measuring system was situated on a top of a hill that is 132 meters above sea level and about 30 km to the north of Singapore. Wideband electric field change data obtained in this measurement were used for analysis in Papers I, II, IV, V, and VII. Microwave radiation data obtained in this measurement were used for analysis in Paper II.
Experimental Setup and Instrumentation A diagram of the observatory station plan view showing the positions of meas-urement systems is shown in Figure 2.1. A diagram of the complete measure-ment instruments is shown in Figure 2.2.
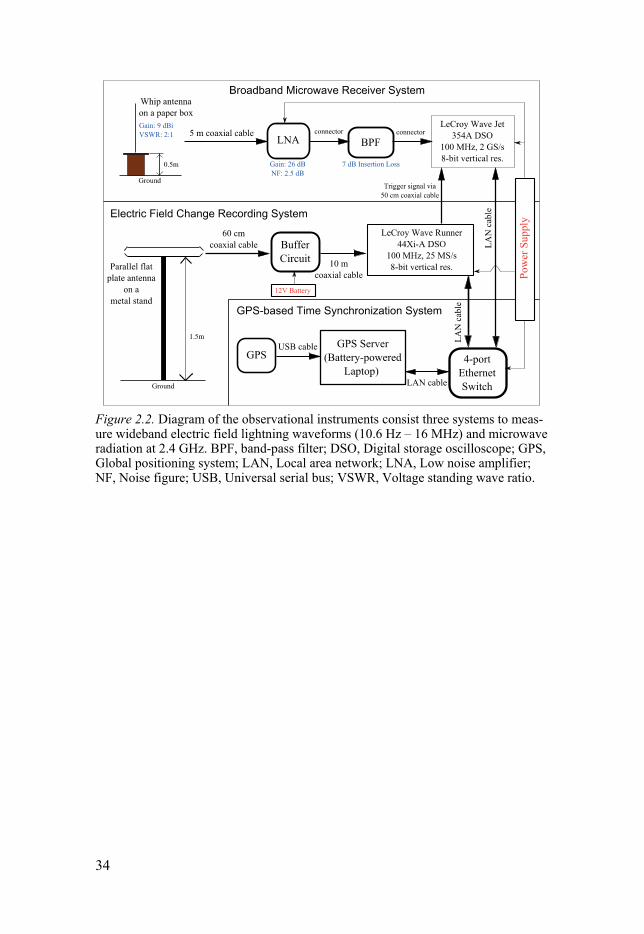
The measurement instruments consist three main systems namely wide-band electric field change recording system, broadband microwave receiver system, and global positioning system (GPS)-based time synchronization sys-tem as shown in Figure 2.2. The wideband electric field change recording sys-tem was used to record fast variation of the vertical electric field change while the broadband microwave receiver system was used to capture microwave ra-diations associated with the recorded fast electric field change waveforms. A GPS timing server was used to maintain accurate clock synchronization of the digital storage oscilloscopes (DSOs) between the two systems.
The electric field change recording system consisted of a parallel flat plate antenna placed on a metal stand 1.5 meters above ground connected via a short 60 cm shielded coaxial cable to a battery-powered buffer circuit. The parallel flat plate antennas together with the buffer circuit (shielded in a metal case as shown in Figure 2 in Paper VII) were positioned about 9 meters away from the observatory station building as shown in Figure 2.1. The top plate of the antenna was connected to the inner conductor of the coaxial cable while the bottom plate was connected to the screening conductor of the coaxial cable. Also the bottom plate was connected directly to the single point grounding system. The buffer circuit was connected to a LeCroy Wave Runner 44Xi-A DSO via 10 meters long shielded coaxial cable. The configurations of a par-allel flat plate antenna and buffer circuit were similar to the configurations used in Esa et al. (2014) with the decay time constant of 15 ms. The DSO digitized the output of the buffer circuit at 25 Mega Samples/second (20 ns time resolution with 500 ms full window size) and 8-bit vertical resolution. The DSO was triggered by either a positive edge or a negative edge of the
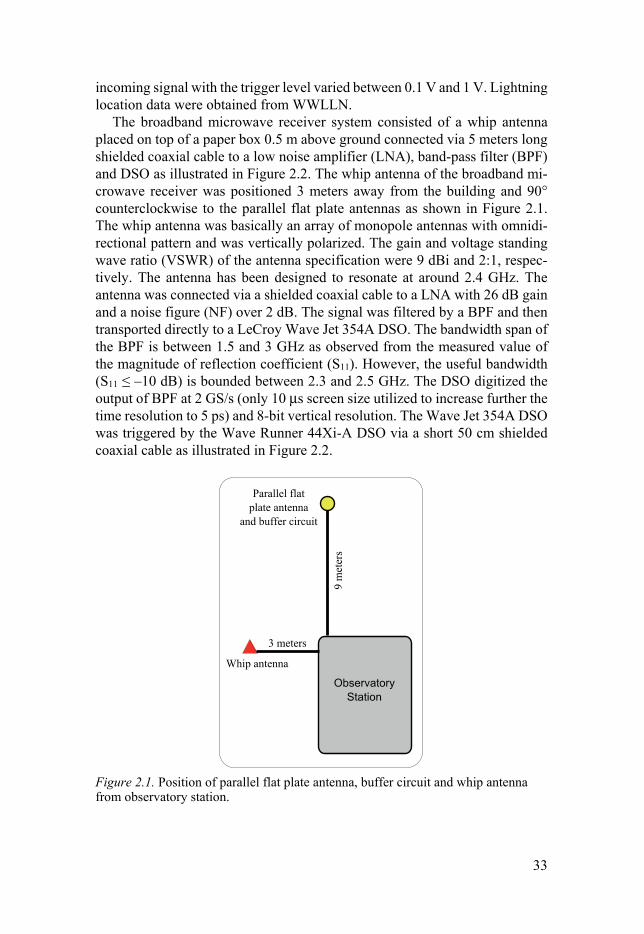
33
incoming signal with the trigger level varied between 0.1 V and 1 V. Lightning location data were obtained from WWLLN.
The broadband microwave receiver system consisted of a whip antenna placed on top of a paper box 0.5 m above ground connected via 5 meters long shielded coaxial cable to a low noise amplifier (LNA), band-pass filter (BPF) and DSO as illustrated in Figure 2.2. The whip antenna of the broadband mi-crowave receiver was positioned 3 meters away from the building and 90° counterclockwise to the parallel flat plate antennas as shown in Figure 2.1. The whip antenna was basically an array of monopole antennas with omnidi-rectional pattern and was vertically polarized. The gain and voltage standing wave ratio (VSWR) of the antenna specification were 9 dBi and 2:1, respec-tively. The antenna has been designed to resonate at around 2.4 GHz. The antenna was connected via a shielded coaxial cable to a LNA with 26 dB gain and a noise figure (NF) over 2 dB. The signal was filtered by a BPF and then transported directly to a LeCroy Wave Jet 354A DSO. The bandwidth span of the BPF is between 1.5 and 3 GHz as observed from the measured value of the magnitude of reflection coefficient (S11). However, the useful bandwidth (S11 ≤ –10 dB) is bounded between 2.3 and 2.5 GHz. The DSO digitized the output of BPF at 2 GS/s (only 10 μs screen size utilized to increase further the time resolution to 5 ps) and 8-bit vertical resolution. The Wave Jet 354A DSO was triggered by the Wave Runner 44Xi-A DSO via a short 50 cm shielded coaxial cable as illustrated in Figure 2.2.
Figure 2.1. Position of parallel flat plate antenna, buffer circuit and whip antenna from observatory station.
34
Figure 2.2. Diagram of the observational instruments consist three systems to meas-ure wideband electric field lightning waveforms (10.6 Hz – 16 MHz) and microwave radiation at 2.4 GHz. BPF, band-pass filter; DSO, Digital storage oscilloscope; GPS, Global positioning system; LAN, Local area network; LNA, Low noise amplifier; NF, Noise figure; USB, Universal serial bus; VSWR, Voltage standing wave ratio.
35
2.2. Bit Error Rate Measurement 2.2.1. Malacca, Malaysia in 2011 Seven measurements were conducted on 21st January, 25th January, 17th March, 18th March, 19th March, 20th March, and 30th March. All measurements conducted at Universiti Teknikal Malaysia Melaka (UTeM), Malacca, Malay-sia (latitude 2.3°N, longitude 102.3°E). Bit error rate data obtained in this measurement were used for analysis in Paper VI.
Baseline Measurement Two measurements were carried out in fair weather on 21st January and 30th March which provide a baseline for comparison. Fair weather measurements on 21st January were done under the influence of man-made interference with the existence of several adjacent channel interferers (ACIs) and co-channel interferers (CCIs). Three transmitters operated in the same band or the adja-cent bands contributed to CCI or ACI interferences. The locations of interfer-ing transmitters labeled as Router 1, Router 2 and Router 3 are shown by Fig-ure 3 in Paper VI. The reasons to introduce these interferences are to validate the claim that multiple antennas communication link could operate very well under the influence of both interferences compared to single antenna commu-nication link and also providing a baseline comparison for the thunderstorm measurements. The total run time for both baseline measurements was 3 hours or 10800 seconds.
Thunderstorm Measurement The other five measurements out of total seven measurements, on the other hand, were carried out during thunderstorms on 25th January, 17th March, 18th March, 19th March, and 20th March. The total run time for thunderstorm meas-urements was the same as baseline measurements with the exception on 18th and 20th March. The total run time for 18th and 20th March was 90 minutes and 130 minutes respectively. The thunderstorm measurements were free from both ACI/CCI and hidden node problems. The selected non-overlapping chan-nel was made sure to be clear before the thunderstorm measurements were conducted.
Both the transmitting and the receiving systems were set on start once heavy and dark thundercloud was observed and the both systems were set to off and the measurements were ended once the rain stopped. The total run time of the system experienced three different meteorological conditions namely thundercloud without rain, thundercloud with rain, and lightning flashes. The thundercloud without rain did always occur first followed by thundercloud with rain. Lightning flashes occurred during thundercloud with or without rain. At frequencies below 10 GHz, attenuation by atmospheric gases and rain may normally be neglected [Recommendation ITU-R P.618-9, 2009]. There-fore the communication links were affected by the thunderstorm alone.
36
Experimental Setup A Dual-band Linksys WRT610N router with multiple antennas was connected through local area network (LAN) cables to a laptop acting as a server. An-other laptop acted as a client and was connected to the router wirelessly. A Dual-band Cisco WUSB600N wireless network card with multiple antennas was attached to the client laptop through universal serial bus (USB) interface. The router and the client laptop were equipped with three and two antennas respectively to realize multiple antennas technology. The router was con-nected to a power outlet available on the outer wall of an adjacent building and other devices were battery-powered.
The transmitting system (server laptop, router and antennas) was positioned on a wooden structure two meters above ground and the receiving system (cli-ent laptop, wireless network card and antennas) was positioned on a wooden structure half a meter above ground. Both the transmitting and receiving sys-tems were covered from rain by a roof structure. The ‘ground’ in Figure 1 in Paper VI refers to Earth’s surface only. A ten meters distance separated the transmitting system from the receiving system. Both the transmitter and the receiver were operating either at 2.4 GHz or 5.2 GHz. Adaptive modulations were chosen. Taking ten meters of line-of-sight (LOS) range into considera-tion, most probably 64-quadrature amplitude modulation (QAM) was fully utilized.
Transmission of Audio Streaming Data The application layer at the server of the transmitting system emulated a Rea-lAudio application broadcasting audio content from a multimedia compact disc-read-only memory or CD-ROM. The average sending data rate was 80 Kbps. The size of the audio data was 1 Mbytes. This data was transmitted using real time protocol (RTP) over user datagram protocol/Internet protocol (UDP/IP) as shown in Figure 2 in Paper VI. The payload type of the RTP was G.729 [13]. The total overhead added to a single audio data packet was 40 bytes (from RTP, UDP and IP headers). However the datagram segmentation at the UDP layer and packet fragmentation at the IP layer could increase more the total overhead added to the audio data packet. Thus the total number of bytes sent from the server was 1 Mbytes audio data including the total over-head depending on how many datagrams was generated.
These network layer packets were transmitted to the router by using 802.3ab physical interface with a maximum sending data rate of 1 Gbps. The router forwarded these packets to the receiving system over the wireless com-munication link by using 802.11n radio interface with a maximum sending rate of 130 Mbps. The distributed coordinated function (DCF) protocol with-out the request-to-send/clear-to-send (RTS/CTS) mechanism was chosen for the operation of 802.11n radio. The handshaking mechanism was disabled af-ter the hidden node problem was eliminated completely. Also other measures
37
to eliminate hidden node problem had been taken such as providing strong LOS path, shorter Transmitter-Receiver separation and the usage of omni-di-rectional antenna.
The 802.11n radio interface at the receiving system received the transmit-ted bytes and forwarded them to the client laptop through USB interface with a maximum data rate of 480 Mbps. Forward error correction (FEC) mecha-nism was used in the 802.11n radio interface to correct any detected error in the received bytes. The Frame Check Sequence (FCS) at the end of each frame detects most of the errors that are not corrected by the FEC scheme. These errors are corrected by retransmissions at the MAC layer. Any bit that cannot be corrected by the FEC and FCS was counted as an error at the IP layer. At the UDP layer, a packet with a certain number of error bytes was considered damaged and discarded. The report of the total number of bytes and packets in error was transmitted to the server after the run time was completed.
2.2.2. South Malaysia in 2012 Three measurements were conducted on 27th, 28th, and 29th November. All measurements were conducted during the northeastern monsoon period at ob-servatory station in UTM, Skudai, South Malaysia (latitude 1.5°N, longitude 103.6°E). The measuring system was situated on a top of a hill that is 132 meters above sea level and about 30 km to the north of Singapore. Bit error rate data obtained in this measurement were used for analysis in Paper VII.
Experimental Setup A vertically polarized whip antenna was connected through radio frequency (RF) coaxial cable to a Levelone WUA-0614 wireless network card attached to a laptop acting as a server. The same laptop acted as a client and was con-nected to a Cisco WUSB600N wireless network card through a USB cable. At the same time, the laptop acted as a GPS-based time synchronization server and has been synchronized with DSO of the electric field change recording system. The laptop was battery-powered and located inside the observatory station building.
Both the transmitting (whip antenna) and receiving antennas were posi-tioned on a plastic structure (polyvinyl chloride or PVC) 1 meter above ground and 3 meters from the observatory building. The ‘ground’ refers to the Earth’s surface. A 5 m distance separated the transmitting antenna from the receiving system. Figure 1 in Paper VII illustrates these configurations. Both the trans-mitter and the receiver were operating at 2.4 GHz. Adaptive modulations were chosen. Taking 5 meters of LOS range into consideration, most probably 64-QAM was fully utilized.
38
Transmission of Audio Streaming Data The audio data packets were forwarded by the Levelone wireless network card to the receiving system over the wireless communication link by using 802.11n radio interface with a maximum sending rate of 150 Mbps. The 802.11n radio interface at the receiving system received the transmitted bytes and forwarded them to the client laptop through USB interface with a maxi-mum data rate of 480 Mbps.
39
3. Occurrence Context and Characteristics of Narrow Bipolar Pulses observed in Malaysia and Sweden
In this chapter, results, analyses, and discussions presented in Papers I, II, III, IV, and V are summarized as follow:
• [Section 3.1] A new observation of narrow bipolar pulses (NBPs) occur-
rence as part of cloud-to-ground (CG) flash from tropical thunderstorms in South Malaysia has been reported for the first time in Paper I.
• [Section 3.2] In Paper II, observation of microwave radiation bursts emit-ted during NBP event is reported.
• [Section 3.3] In Paper III, the occurrence of NBPs observed in Uppsala,
Sweden is reported for the first time. • [Section 3.4] Detailed analysis on electric field waveform characteristics
of isolated NBPs and NBPs as part of CG flash has been presented in Pa-pers I and III. The motivation is to observe any similarities or/and differ-ences in NBPs occurring at different stages of the lightning flash and to understand how the features of NBPs are connected to the events in CG flash, particularly the return stroke.
• [Section 3.5] In Paper IV, latitudinal trends in NBPs were examined. Nar-
row bipolar pulses increased as latitudes decreased towards the equator. Negative NBP emissions increased significantly as the latitude decreased. Factors involving mixed-phase region elevations and vertical extents of thundercloud tops are invoked to explain the observed results.
• [Section 3.6] In Paper V, temporal characteristics of several initial elec-
tric field preliminary breakdown process (PBP) pulses from two very close negative CG flashes (<10 km) were compared to close NBPs (10 km) to observe any similarity that may exists.
40
3.1. Occurrence of NBP as Part of CG Flash (Paper I) Previously, it was generally thought that NBPs always occur in isolation or at the beginning of intra-cloud (IC) flashes. However, recent observations by Nag et al. (2010) in Florida, Azlinda Ahmad et al. (2010) in Malaysia, and Wu et al. (2011) in South China found that NBPs also occur as part of CG flash.
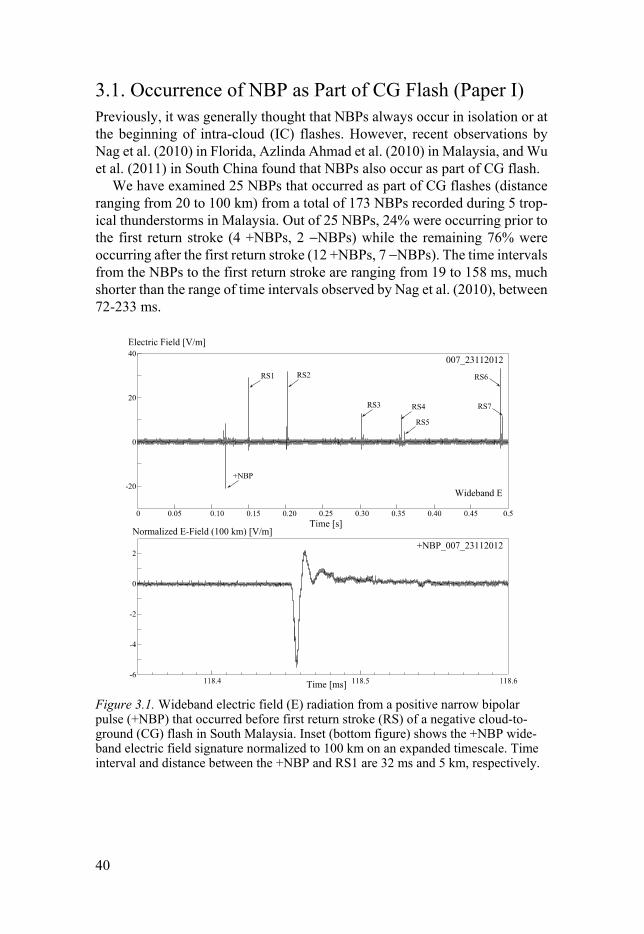
We have examined 25 NBPs that occurred as part of CG flashes (distance ranging from 20 to 100 km) from a total of 173 NBPs recorded during 5 trop-ical thunderstorms in Malaysia. Out of 25 NBPs, 24% were occurring prior to the first return stroke (4 +NBPs, 2 −NBPs) while the remaining 76% were occurring after the first return stroke (12 +NBPs, 7 −NBPs). The time intervals from the NBPs to the first return stroke are ranging from 19 to 158 ms, much shorter than the range of time intervals observed by Nag et al. (2010), between 72-233 ms.
Figure 3.1. Wideband electric field (E) radiation from a positive narrow bipolar pulse (+NBP) that occurred before first return stroke (RS) of a negative cloud-to-ground (CG) flash in South Malaysia. Inset (bottom figure) shows the +NBP wide-band electric field signature normalized to 100 km on an expanded timescale. Time interval and distance between the +NBP and RS1 are 32 ms and 5 km, respectively.
41
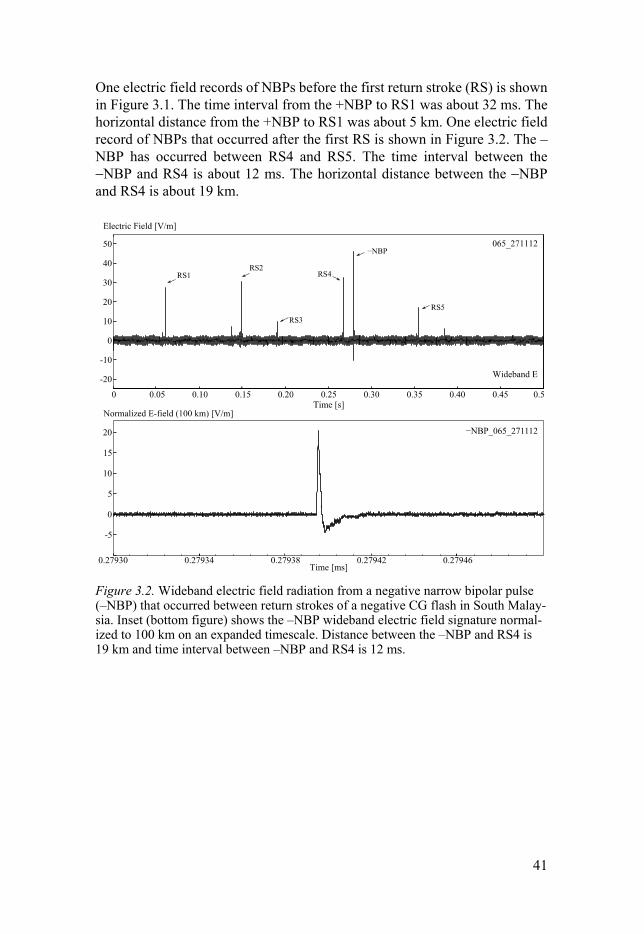
One electric field records of NBPs before the first return stroke (RS) is shown in Figure 3.1. The time interval from the +NBP to RS1 was about 32 ms. The horizontal distance from the +NBP to RS1 was about 5 km. One electric field record of NBPs that occurred after the first RS is shown in Figure 3.2. The –NBP has occurred between RS4 and RS5. The time interval between the −NBP and RS4 is about 12 ms. The horizontal distance between the −NBP and RS4 is about 19 km.
Figure 3.2. Wideband electric field radiation from a negative narrow bipolar pulse (–NBP) that occurred between return strokes of a negative CG flash in South Malay-sia. Inset (bottom figure) shows the –NBP wideband electric field signature normal-ized to 100 km on an expanded timescale. Distance between the –NBP and RS4 is 19 km and time interval between –NBP and RS4 is 12 ms.
42
3.2. Microwave Radiation of NBP (Paper II) Out of 173 NBPs, only 137 NBPs were recorded with microwave radiation bursts due to constraints in triggering method and total window size of record-ing unit. In the case of multiple NBPs detection, only one microwave radiation burst could be recorded during trigger event. In the case of NBPs occurred before the first RS, sometimes the waveform was triggered at the first RS in-stead of the NBP. In the case of NBPs occurred after the first RS, all the trigger events happened at the first RS.
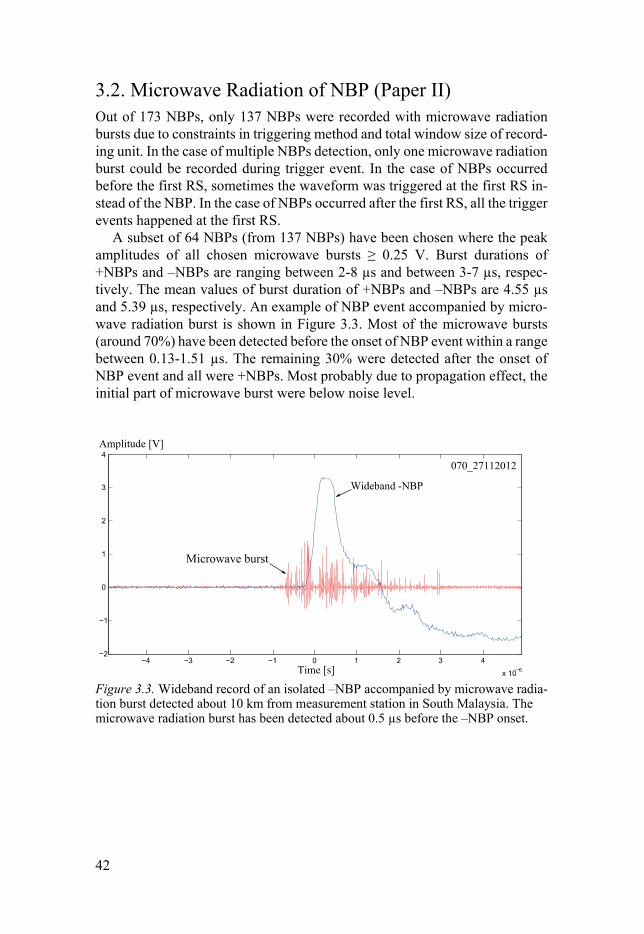
A subset of 64 NBPs (from 137 NBPs) have been chosen where the peak amplitudes of all chosen microwave bursts ≥ 0.25 V. Burst durations of +NBPs and –NBPs are ranging between 2-8 µs and between 3-7 µs, respec-tively. The mean values of burst duration of +NBPs and –NBPs are 4.55 µs and 5.39 µs, respectively. An example of NBP event accompanied by micro-wave radiation burst is shown in Figure 3.3. Most of the microwave bursts (around 70%) have been detected before the onset of NBP event within a range between 0.13-1.51 µs. The remaining 30% were detected after the onset of NBP event and all were +NBPs. Most probably due to propagation effect, the initial part of microwave burst were below noise level.
Figure 3.3. Wideband record of an isolated –NBP accompanied by microwave radia-tion burst detected about 10 km from measurement station in South Malaysia. The microwave radiation burst has been detected about 0.5 µs before the –NBP onset.
43
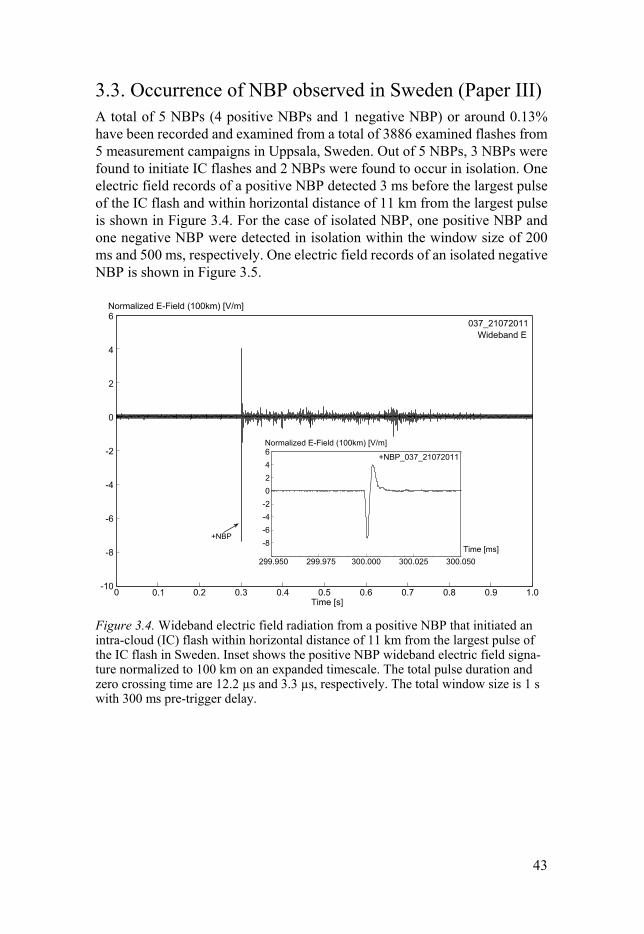
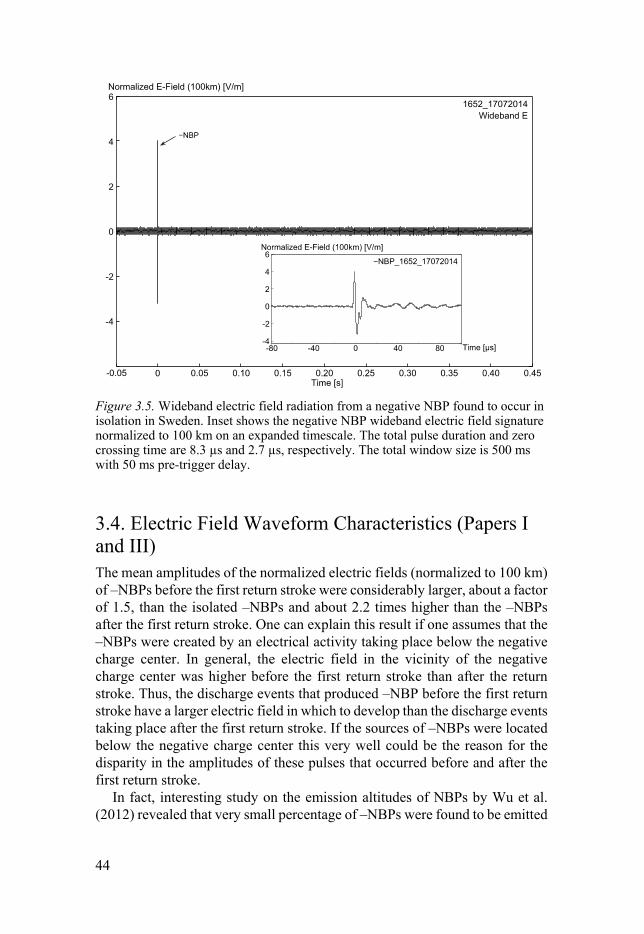
3.3. Occurrence of NBP observed in Sweden (Paper III) A total of 5 NBPs (4 positive NBPs and 1 negative NBP) or around 0.13% have been recorded and examined from a total of 3886 examined flashes from 5 measurement campaigns in Uppsala, Sweden. Out of 5 NBPs, 3 NBPs were found to initiate IC flashes and 2 NBPs were found to occur in isolation. One electric field records of a positive NBP detected 3 ms before the largest pulse of the IC flash and within horizontal distance of 11 km from the largest pulse is shown in Figure 3.4. For the case of isolated NBP, one positive NBP and one negative NBP were detected in isolation within the window size of 200 ms and 500 ms, respectively. One electric field records of an isolated negative NBP is shown in Figure 3.5.
Figure 3.4. Wideband electric field radiation from a positive NBP that initiated an intra-cloud (IC) flash within horizontal distance of 11 km from the largest pulse of the IC flash in Sweden. Inset shows the positive NBP wideband electric field signa-ture normalized to 100 km on an expanded timescale. The total pulse duration and zero crossing time are 12.2 µs and 3.3 µs, respectively. The total window size is 1 s with 300 ms pre-trigger delay.
44
Figure 3.5. Wideband electric field radiation from a negative NBP found to occur in isolation in Sweden. Inset shows the negative NBP wideband electric field signature normalized to 100 km on an expanded timescale. The total pulse duration and zero crossing time are 8.3 µs and 2.7 µs, respectively. The total window size is 500 ms with 50 ms pre-trigger delay.
3.4. Electric Field Waveform Characteristics (Papers I and III) The mean amplitudes of the normalized electric fields (normalized to 100 km) of –NBPs before the first return stroke were considerably larger, about a factor of 1.5, than the isolated –NBPs and about 2.2 times higher than the –NBPs after the first return stroke. One can explain this result if one assumes that the –NBPs were created by an electrical activity taking place below the negative charge center. In general, the electric field in the vicinity of the negative charge center was higher before the first return stroke than after the return stroke. Thus, the discharge events that produced –NBP before the first return stroke have a larger electric field in which to develop than the discharge events taking place after the first return stroke. If the sources of –NBPs were located below the negative charge center this very well could be the reason for the disparity in the amplitudes of these pulses that occurred before and after the first return stroke.
In fact, interesting study on the emission altitudes of NBPs by Wu et al. (2012) revealed that very small percentage of –NBPs were found to be emitted
45
in the region between the negative charge center and lower positive charge region (LPCR). Indeed, the percentage of –NBPs as part of CG flash over the total examined NBPs in Paper I is also small, around 5.2%.
Moreover, the mean amplitudes of the normalized electric fields of +NBPs occurred as part of CG flashes were significantly smaller, about a factor of 2.5, than isolated +NBPs but comparable to the mean amplitudes of the first return stroke. As the normalized electric field intensities of both +NBPs and –NBPs were influenced directly by the return stroke event and also deviated significantly from the average value of isolated NBPs, this is a strong indica-tion that they have occurred inside the same thunderstorm that initiated the return stroke event and not from isolated thunderstorm.
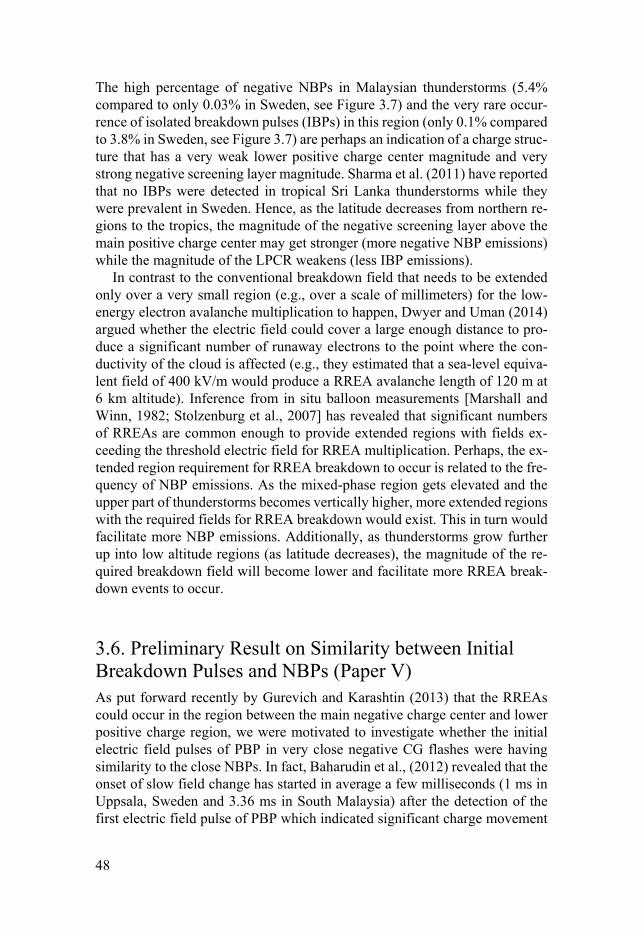
Table 3.1. Statistical data of positive narrow bipolar pulses (+NBPs) of present study and those of previous studies. CG, cloud-to-ground; IC, intra-cloud; PD, pulse dura-tion; RT, rise time; ZCT, zero crossing time.
Reference Regions Occurrence PD (µs) ZCT (µs) RT (µs)
Paper I (2014) South Malaysia Isolated 10.1 ± 6.41 4.16 ± 2.58 1.17 ± 0.67 with CG 13.9 ± 9.12 5.94 ± 3.19 2.25 ± 1.95 Paper III (2014) Uppsala, Sweden Mixed* 12.8 ± 3.45 3.96 ± 1.25 0.93 ± 0.46 Nag et al. (2010) Florida, USA Isolated 24.0 6.0 - Zhu et al. (2010) Shanghai, China Isolated 16.0 ± 1.40 4.60 ± 0.70 2.60 ± 0.50 Azlinda Ahmad et al. (2010)
South Malaysia Mixed* 30.2 ± 12.3 6.50 ± 3.20 2.70 ± 1.60
Sharma et al. (2008) Sri Lanka Isolated 13.3 ± 16.7 5.78 ± 2.10 2.60 ± 1.10 Smith et al. (1999) New Mexico &
West Texas, USAIsolated 25.8 ± 4.90 - 2.30 ± 0.80
Medelius et al. (1991) Florida, USA Isolated - - 1.54 ± 1.04 Willett et al. (1989) Florida, USA Isolated 20-30 - - Le Vine (1980) Florida &
Virginia, USAIsolated 10-20 < 10 -
* Included CG, IC and Isolated NBPs in the analysis.
Table 3.2. Statistical data of negative NBPs (–NBPs) of present study and those of previous studies.
Reference Regions Occurrence PD (µs) ZCT (µs) RT (µs)
Paper I (2014) South Malaysia Isolated 18.9 ± 5.91 3.84 ± 1.36 1.01 ± 0.69 with CG 15.5 ± 7.26 5.29 ± 4.10 1.06 ± 0.81 with IC 16.2 ± 5.80 3.84 ± 1.36 1.05 ± 0.78 Paper III (2014) Uppsala, Sweden Isolated 8.32 2.65 0.89 Zhu et al. (2010) Shanghai, China Isolated 12.1 ± 1.30 3.80 ± 0.30 2.20 ± 0.20 Azlinda Ahmad et al. (2010)
South Malaysia Mixed* 24.6 ± 17.1 9.00 ± 4.50 1.60 ± 1.00
Medelius et al. (1991) Florida, USA Isolated - - 1.82 ± 0.87 * Included CG, IC and Isolated NBPs in the analysis.
46
The normalized electric field amplitudes of NBPs found in Sweden at 100 km are in a range between 4 V/m and 24 V/m with an arithmetic mean of 10.46 ± 7.93 V/m. This mean value is comparable to the normalized electric field am-plitudes of the first return stroke and NBPs found to occur as part of CG flashes in South Malaysia (see Figure 8 in Paper I).
The temporal characteristics of NBPs found in Sweden and NBPs as part of CG flash found in South Malaysia were within the range values of those NBPs reported by previous studies from various geographical regions as tab-ulated in Table 3.1 for +NBPs and Table 3.2 for –NBPs. Similarity between the temporal characteristics of NBPs as part of CG flash and isolated NBPs suggested that their breakdown mechanisms might be similar.
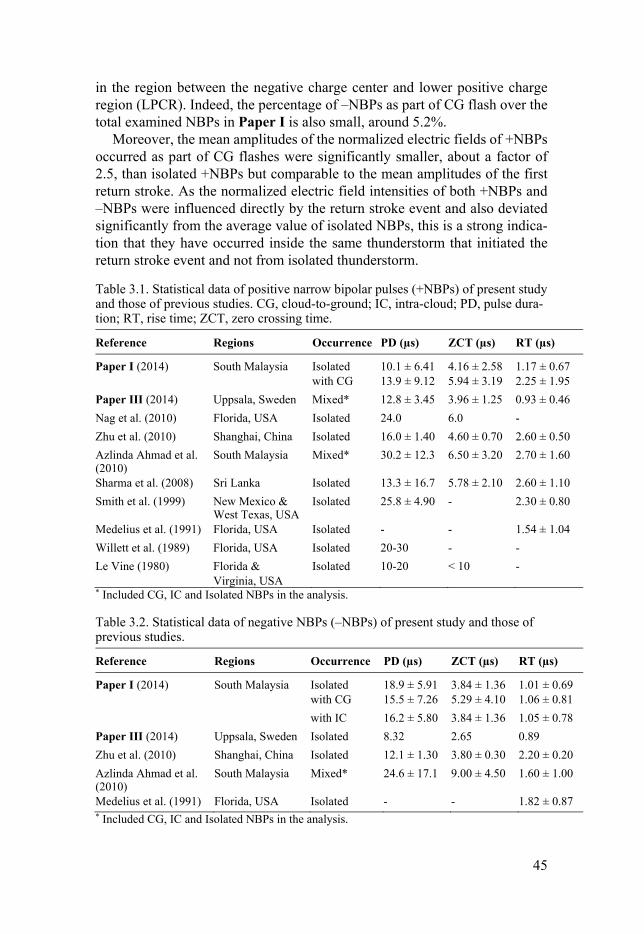
3.5. Latitude Dependence of NBP Emissions (Paper IV) Across various geographical areas ranging from northern regions to the trop-ics, the amount of NBP emissions increased significantly from 0.13% at a lat-itude of 59.8°N in Uppsala, Sweden to 12% at a latitude of 1.5°N in South Malaysia. The occurrence of positive NBPs was more common than negative NBPs at all latitudes examined. However, as the latitude decreased, negative NBP emissions became more frequent and a significant increase from 20% in Sweden to 45% in South Malaysia was observed. Factors involving mixed-phase region elevations and vertical extents of thundercloud tops were in-voked to explain the observed phenomena. These factors are latitudinally de-pendent as evidenced from the results in Figures 3.6 and 3.7. In other words, as the latitude decreases from northern regions to the tropics, thunderstorms tend to have higher cloud tops and elevated mixed-phase regions. Conse-quently, higher NBP emissions can be expected to occur in tropical thunder-storms compared to thunderstorms in mid-latitudes and northern regions.
These data suggest that the NBP emission rate is not a useful measure to monitor thunderstorm severity because regular tropical thunderstorms, where relatively high NBP emissions occur, lack suitable conditions to become se-vere (i.e., there is modest convective available potential energy, or CAPE, and a lack of baroclinity in such regions). Conversely, some of the most severe thunderstorms occur in mid-latitude regions where the clash of warm and cold synoptic scale air masses is prevalent (i.e., large CAPE and strong baroclin-ity), yet these regions are only associated with moderate NBP emission rates. These issues have been raised in other studies as well [Suszcynsky and Heavner, 2003; Wiens et al., 2008; Wu et al., 2013]. In fact, Wiens et al. (2008) has observed that even the most severe mid-latitude thunderstorms do not always produce NBPs.
47
Figure 3.6. Statistical data on the occurrence of NBPs from northern regions to the tropics. (A) Data for NBPs relative to all lightning flashes and (B) data for the per-centage of positive NBPs relative to the total number of NBP flashes.
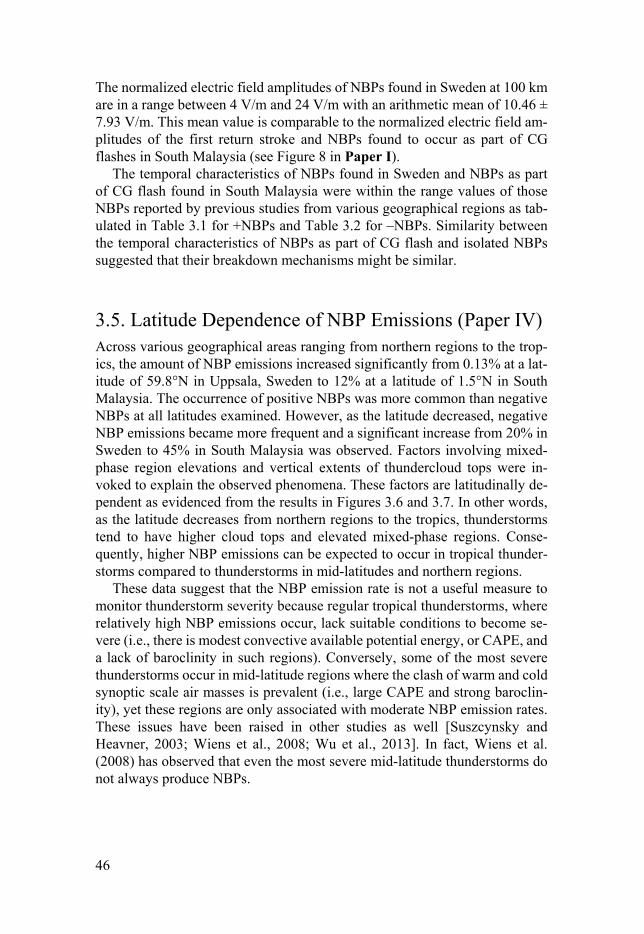
Figure 3.7. Occurrence percentage of NBPs relative to other lightning flashes in Sweden and South Malaysia. IBP, isolated breakdown pulses.
48
The high percentage of negative NBPs in Malaysian thunderstorms (5.4% compared to only 0.03% in Sweden, see Figure 3.7) and the very rare occur-rence of isolated breakdown pulses (IBPs) in this region (only 0.1% compared to 3.8% in Sweden, see Figure 3.7) are perhaps an indication of a charge struc-ture that has a very weak lower positive charge center magnitude and very strong negative screening layer magnitude. Sharma et al. (2011) have reported that no IBPs were detected in tropical Sri Lanka thunderstorms while they were prevalent in Sweden. Hence, as the latitude decreases from northern re-gions to the tropics, the magnitude of the negative screening layer above the main positive charge center may get stronger (more negative NBP emissions) while the magnitude of the LPCR weakens (less IBP emissions).
In contrast to the conventional breakdown field that needs to be extended only over a very small region (e.g., over a scale of millimeters) for the low-energy electron avalanche multiplication to happen, Dwyer and Uman (2014) argued whether the electric field could cover a large enough distance to pro-duce a significant number of runaway electrons to the point where the con-ductivity of the cloud is affected (e.g., they estimated that a sea-level equiva-lent field of 400 kV/m would produce a RREA avalanche length of 120 m at 6 km altitude). Inference from in situ balloon measurements [Marshall and Winn, 1982; Stolzenburg et al., 2007] has revealed that significant numbers of RREAs are common enough to provide extended regions with fields ex-ceeding the threshold electric field for RREA multiplication. Perhaps, the ex-tended region requirement for RREA breakdown to occur is related to the fre-quency of NBP emissions. As the mixed-phase region gets elevated and the upper part of thunderstorms becomes vertically higher, more extended regions with the required fields for RREA breakdown would exist. This in turn would facilitate more NBP emissions. Additionally, as thunderstorms grow further up into low altitude regions (as latitude decreases), the magnitude of the re-quired breakdown field will become lower and facilitate more RREA break-down events to occur.
3.6. Preliminary Result on Similarity between Initial Breakdown Pulses and NBPs (Paper V) As put forward recently by Gurevich and Karashtin (2013) that the RREAs could occur in the region between the main negative charge center and lower positive charge region, we were motivated to investigate whether the initial electric field pulses of PBP in very close negative CG flashes were having similarity to the close NBPs. In fact, Baharudin et al., (2012) revealed that the onset of slow field change has started in average a few milliseconds (1 ms in Uppsala, Sweden and 3.36 ms in South Malaysia) after the detection of the first electric field pulse of PBP which indicated significant charge movement
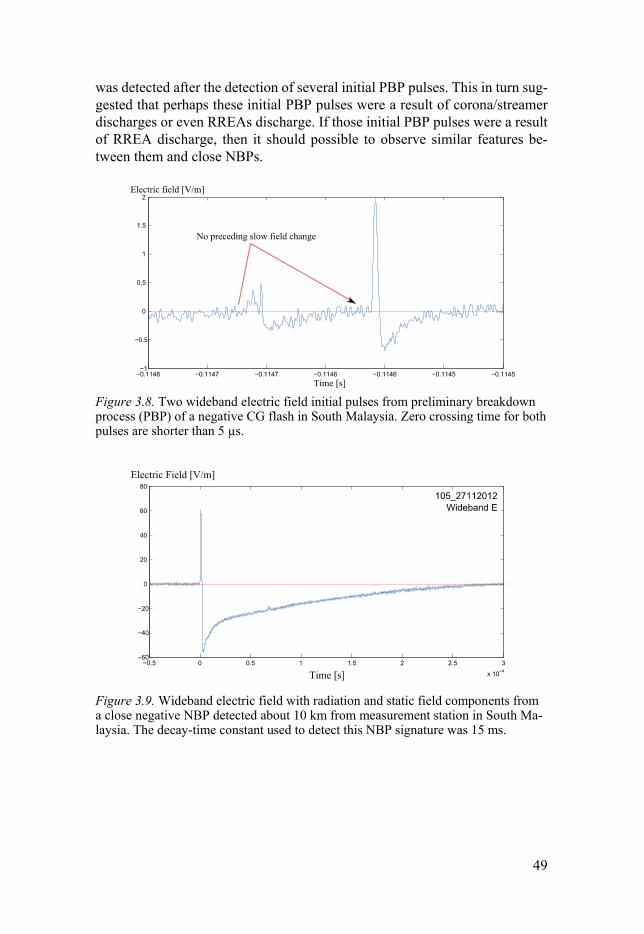
49
was detected after the detection of several initial PBP pulses. This in turn sug-gested that perhaps these initial PBP pulses were a result of corona/streamer discharges or even RREAs discharge. If those initial PBP pulses were a result of RREA discharge, then it should possible to observe similar features be-tween them and close NBPs.
Figure 3.8. Two wideband electric field initial pulses from preliminary breakdown process (PBP) of a negative CG flash in South Malaysia. Zero crossing time for both pulses are shorter than 5 µs.
Figure 3.9. Wideband electric field with radiation and static field components from a close negative NBP detected about 10 km from measurement station in South Ma-laysia. The decay-time constant used to detect this NBP signature was 15 ms.
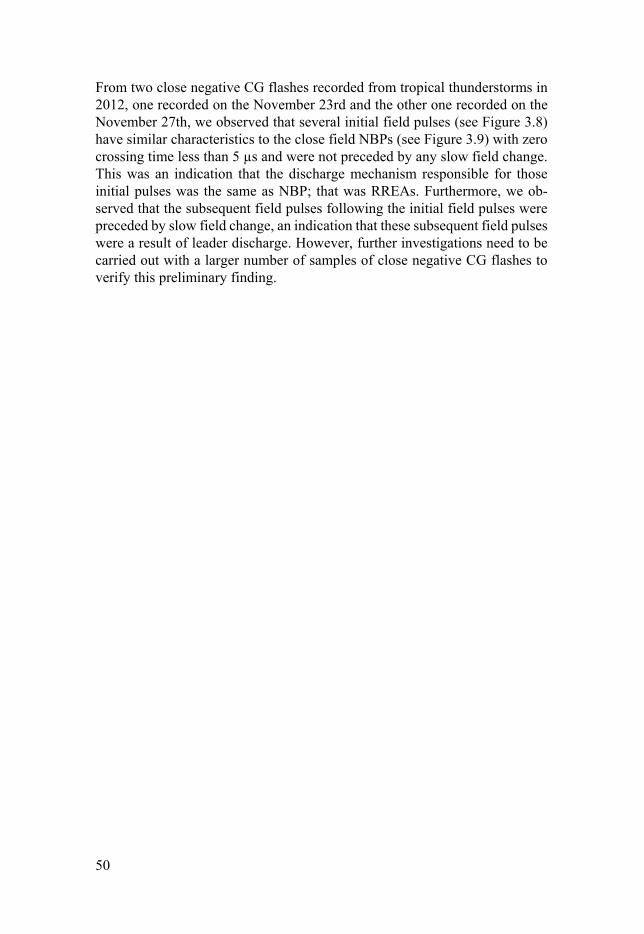
50
From two close negative CG flashes recorded from tropical thunderstorms in 2012, one recorded on the November 23rd and the other one recorded on the November 27th, we observed that several initial field pulses (see Figure 3.8) have similar characteristics to the close field NBPs (see Figure 3.9) with zero crossing time less than 5 µs and were not preceded by any slow field change. This was an indication that the discharge mechanism responsible for those initial pulses was the same as NBP; that was RREAs. Furthermore, we ob-served that the subsequent field pulses following the initial field pulses were preceded by slow field change, an indication that these subsequent field pulses were a result of leader discharge. However, further investigations need to be carried out with a larger number of samples of close negative CG flashes to verify this preliminary finding.
51
4. Narrow Bipolar Pulses as the Strongest Interference Source to Multiple Antennas Wireless Communication Network
In this chapter, results and analyses of experimental work on the effects of lightning radiation on multiple antennas wireless communication network in Papers VI and VII are summarized as follow:
• [Section 4.1] In Paper VI, we reported an analysis of bit error rate (BER)
and packet error rate (PER) measurements at 2.4 GHz and 5.2 GHz to evaluate the effects of lightning interference on audio transmission for a multiple antennas wireless system. The interference source was obtained directly from natural lightning and differs from laboratory sparks and the BER and PER values in our work were measured and not simulated.
• [Section 4.2] In Paper VII, we are motivated to investigate what type of cloud-to-ground (CG) and intra-cloud (IC) events that possibly have in-terfered the bits transmission of a wireless communication network oper-ating at 2.4 GHz, which could not be identified in Paper VI. Moreover, it is interesting to study which type of CG and IC events would interfere more severely than the others and contribute to the high BER and burst error events. Narrow bipolar pulses have been observed to be the strongest interference source to wireless communication network.
4.1. Performance of Audio Streaming Transmission during Thunderstorms (Paper VI) Bit error rate data collected from two baseline measurements under fair weather conditions was used to analyze the performance of the multiple an-tennas wireless communication network under thunderstorm conditions. The fair weather measurements provide 3-hour BER values during the normal or quiet period with the absence of thunderstorm. The BER data during thunder-storms were recorded from five different thunderstorms. Each BER point cor-responds to the number of error bits measured at the receiver for a complete transmission of a 1 Mbytes train of bits from the transmitter.
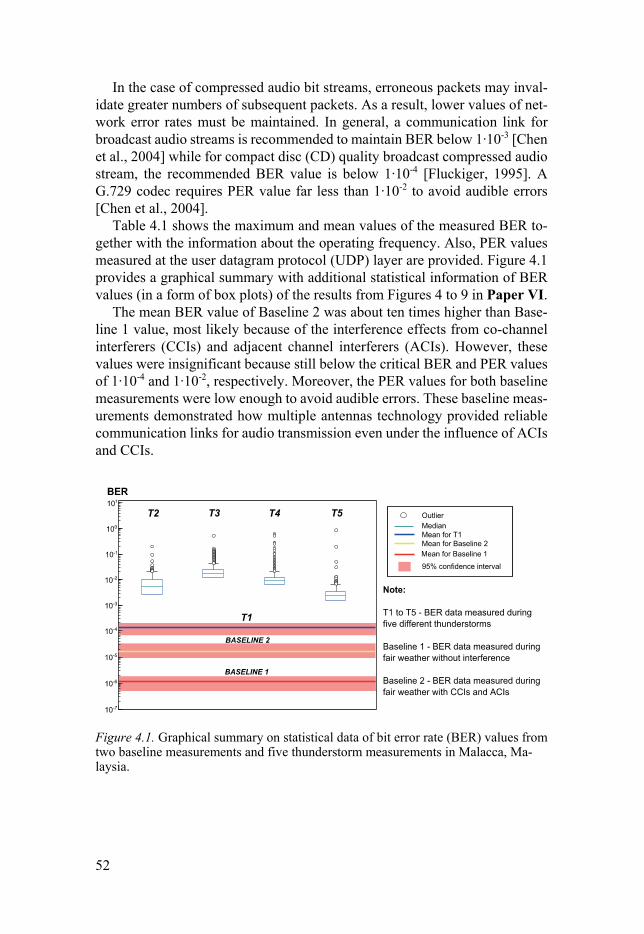
52
In the case of compressed audio bit streams, erroneous packets may inval-idate greater numbers of subsequent packets. As a result, lower values of net-work error rates must be maintained. In general, a communication link for broadcast audio streams is recommended to maintain BER below 1∙10-3 [Chen et al., 2004] while for compact disc (CD) quality broadcast compressed audio stream, the recommended BER value is below 1∙10-4 [Fluckiger, 1995]. A G.729 codec requires PER value far less than 1∙10-2 to avoid audible errors [Chen et al., 2004].
Table 4.1 shows the maximum and mean values of the measured BER to-gether with the information about the operating frequency. Also, PER values measured at the user datagram protocol (UDP) layer are provided. Figure 4.1 provides a graphical summary with additional statistical information of BER values (in a form of box plots) of the results from Figures 4 to 9 in Paper VI.
The mean BER value of Baseline 2 was about ten times higher than Base-line 1 value, most likely because of the interference effects from co-channel interferers (CCIs) and adjacent channel interferers (ACIs). However, these values were insignificant because still below the critical BER and PER values of 1∙10-4 and 1∙10-2, respectively. Moreover, the PER values for both baseline measurements were low enough to avoid audible errors. These baseline meas-urements demonstrated how multiple antennas technology provided reliable communication links for audio transmission even under the influence of ACIs and CCIs.
Figure 4.1. Graphical summary on statistical data of bit error rate (BER) values from two baseline measurements and five thunderstorm measurements in Malacca, Ma-laysia.
53
Table 4.1. Statistical data on bit error rate (BER) and packet error rate (PER) values recorded from baseline and thunderstorm measurements. BER, bit error rate; PER, packet error rate.
Measurement Frequency Maximum BER Mean BER PER
Baseline 1, 30th March 2.4 GHz 4.0∙10-4 1.27∙10-6 0 Baseline 2, 21st January 2.4 GHz 4.0∙10-3 1.75∙10-5 1.47∙10-5 Thunderstorm 1, 25th January 2.4 GHz 9.9∙10-1 1.40∙10-4 1.43∙10-2 Thunderstorm 2, 17th March 2.4 GHz 2.0∙10-1 8.90∙10-3 8.86∙10-3 Thunderstorm 3, 18th March 5.2 GHz 5.0∙10-1 4.15∙10-2 4.22∙10-2 Thunderstorm 4, 19th March 5.2 GHz 6.5∙10-1 3.20∙10-2 3.34∙10-2 Thunderstorm 5, 20th March 2.4 GHz 8.5∙10-1 2.08∙10-2 2.32∙10-2
On the other hand, the mean BER values for all the thunderstorms were higher than the Baseline values and critical BER value of 1∙10-4. It is possible to sug-gest that the transmission of audio streaming during all thunderstorms may experience audible errors because the recorded PER values were close to or higher than the critical value of 1∙10-2. Furthermore, the interference was found to be more intense at 5.2 GHz band as observed from higher recorded PER values compared to 2.4 GHz band as shown in Table 4.1. Almost all BER values at 5.2 GHz band were above 1∙10-2 while less than 50% of BER values at 2.4 GHz band were above 1∙10-2 as evidenced in Figure 4.1.
4.2. Interference from CG and IC Flashes (Paper VII) A total of 850 waveforms from the electric field change recording system were recorded and examined during this measurement campaign. Out of these, 94 waveforms of very fine structure were selected which matched perfectly with the timing information of the recorded BER. 78 out of 94 were negative CG flash waveforms and the rest were IC flash waveforms. 5 out of 16 IC wave-forms were NBPs event.
Each BER point corresponds to the number of error bits measured at the receiver for a complete transmission of a 1 Mbytes train of bits from the trans-mitter. The transmission time for a complete 1 Mbytes train of bits is 800 ms. Each maximum consecutive lost datagram (CLD) point corresponds to the number of consecutive lost datagram observed at UDP layer. It is an indicator of how severe the occurrence of burst error in a wireless communication net-work. As a lightning flash consists of events with impulsive activities, it is more likely the nature of interference will be in the form of a burst error.
The baseline measurements under the fair weather conditions in Paper VI provided a baseline mean BER value at around 1⋅10-5. In order to increase the accuracy of the analysis and following the recommendation outlined by Chen
54
et al. (2004), we have chosen a higher baseline BER value at around 1⋅10-3. Therefore, lightning waveforms which have associated BER values higher than 1⋅10-3 were regarded as the source of interference to the wireless commu-nication network. At frequencies below 10 GHz, attenuation by atmospheric gases and rain may normally be neglected [Recommendation ITU-R P.618-9, 2009]. Thus, we are convinced that the wireless communication system was affected by the thunderstorm alone.
4.2.1. Categorization of Interference Event Four categories of negative CG flashes have been observed to interfere with the wireless communication network significantly. • [Category 1] The first category of CG flashes consists of an ordinary
ground flash without the preliminary breakdown process (PBP) and comes with or without chaotic pulses (CPs). A total of 20 waveforms fell under this category with 8 waveforms consisting of CP.
• [Category 2] In addition to return stroke and chaotic pulses, the second
category of CG consists of PBP. A total of 38 waveforms were fallen un-der this category with 16 waveforms consisted CP.
• [Category 3] The third category of CG flashes consists of mixed events of
large bipolar pulses, train of unipolar and bipolar pulses, and NBP. A total of 20 waveforms fell under this category. There are two variants of Cate-gory 3: [3a] Category 3 without PBP event. [3b] Category 3 with PBP event.
• [Category 4] There are two variants as follow:
[4a] Combination of Category 1 and Category 3a, where PBP event was absent. [4b] Combination of Category 2 and Category 3b, where PBP event was present.
Two categories of IC flashes have been observed to interfere with the wireless communication network significantly. • [Category 1] Ordinary IC flashes. A total of 11 waveforms fell under this
category.
55
• [Category 2] Isolated NBPs. A total of 6 waveforms fell under this cate-gory. All the NBPs in this category were observed with a larger intensity than the largest return stroke, unlike the NBPs found to occur as part of a negative CG flash.
Figure 4.2. Nonlinear correlation between BER and electric field intensity of the largest pulse for (A) all cloud-to-ground (CG) flashes, (B) ordinary intra-cloud (IC) flashes, and (C) narrow bipolar pulses (NBPs). The BER value is given in percent-age scale, e.g. 1⋅10-3 corresponds to 1.
56
Figure 4.3. Nonlinear correlation between maximum consecutive lost datagram (CLD) and electric field intensity of the largest pulse for (A) all CG flashes, (B) or-dinary IC flashes, and (C) NBPs. The BER value is given in percentage scale, e.g. 1⋅10-3 corresponds to 1.
4.2.2. Correlation Analysis Knowing the correlation of BER and CLD with the number of return strokes and the largest amplitude intensity, one will be able to understand how signif-icant microwave radiation from the CG and IC flashes is for interfering with the transmission of bits in wireless communication networks. Furthermore, one is able to identify which category of CG and IC flashes interferes more severely with the transmission of bits and produces a higher burst error. The largest amplitude intensity here corresponds to the largest amplitude of the return stroke/IC pulse and reflects the distance to the source of radiation.
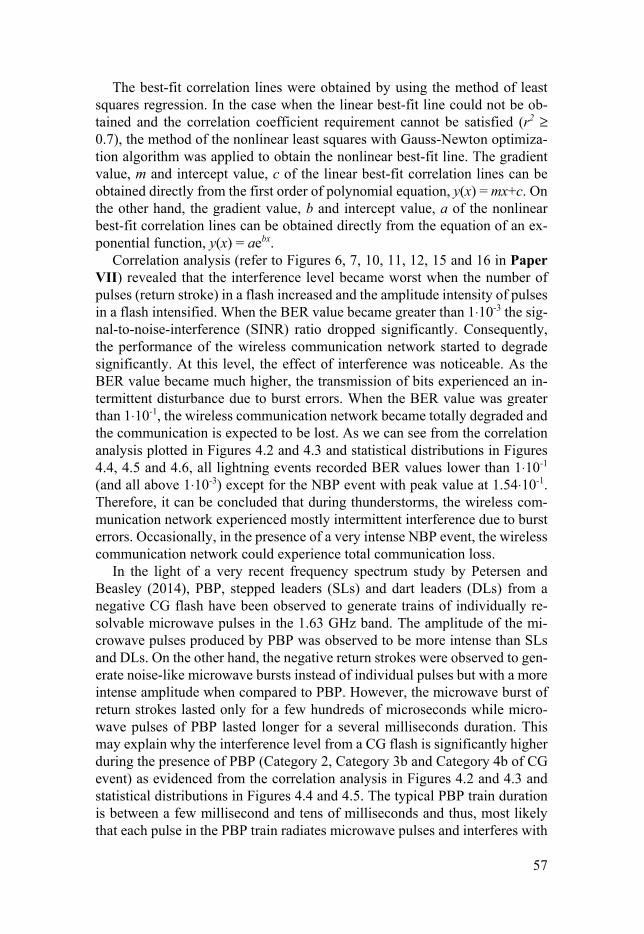
57
The best-fit correlation lines were obtained by using the method of least squares regression. In the case when the linear best-fit line could not be ob-tained and the correlation coefficient requirement cannot be satisfied (r2 ≥ 0.7), the method of the nonlinear least squares with Gauss-Newton optimiza-tion algorithm was applied to obtain the nonlinear best-fit line. The gradient value, m and intercept value, c of the linear best-fit correlation lines can be obtained directly from the first order of polynomial equation, y(x) = mx+c. On the other hand, the gradient value, b and intercept value, a of the nonlinear best-fit correlation lines can be obtained directly from the equation of an ex-ponential function, y(x) = aebx.
Correlation analysis (refer to Figures 6, 7, 10, 11, 12, 15 and 16 in Paper VII) revealed that the interference level became worst when the number of pulses (return stroke) in a flash increased and the amplitude intensity of pulses in a flash intensified. When the BER value became greater than 1⋅10-3 the sig-nal-to-noise-interference (SINR) ratio dropped significantly. Consequently, the performance of the wireless communication network started to degrade significantly. At this level, the effect of interference was noticeable. As the BER value became much higher, the transmission of bits experienced an in-termittent disturbance due to burst errors. When the BER value was greater than 1⋅10-1, the wireless communication network became totally degraded and the communication is expected to be lost. As we can see from the correlation analysis plotted in Figures 4.2 and 4.3 and statistical distributions in Figures 4.4, 4.5 and 4.6, all lightning events recorded BER values lower than 1⋅10-1 (and all above 1⋅10-3) except for the NBP event with peak value at 1.54⋅10-1. Therefore, it can be concluded that during thunderstorms, the wireless com-munication network experienced mostly intermittent interference due to burst errors. Occasionally, in the presence of a very intense NBP event, the wireless communication network could experience total communication loss.
In the light of a very recent frequency spectrum study by Petersen and Beasley (2014), PBP, stepped leaders (SLs) and dart leaders (DLs) from a negative CG flash have been observed to generate trains of individually re-solvable microwave pulses in the 1.63 GHz band. The amplitude of the mi-crowave pulses produced by PBP was observed to be more intense than SLs and DLs. On the other hand, the negative return strokes were observed to gen-erate noise-like microwave bursts instead of individual pulses but with a more intense amplitude when compared to PBP. However, the microwave burst of return strokes lasted only for a few hundreds of microseconds while micro-wave pulses of PBP lasted longer for a several milliseconds duration. This may explain why the interference level from a CG flash is significantly higher during the presence of PBP (Category 2, Category 3b and Category 4b of CG event) as evidenced from the correlation analysis in Figures 4.2 and 4.3 and statistical distributions in Figures 4.4 and 4.5. The typical PBP train duration is between a few millisecond and tens of milliseconds and thus, most likely that each pulse in the PBP train radiates microwave pulses and interferes with
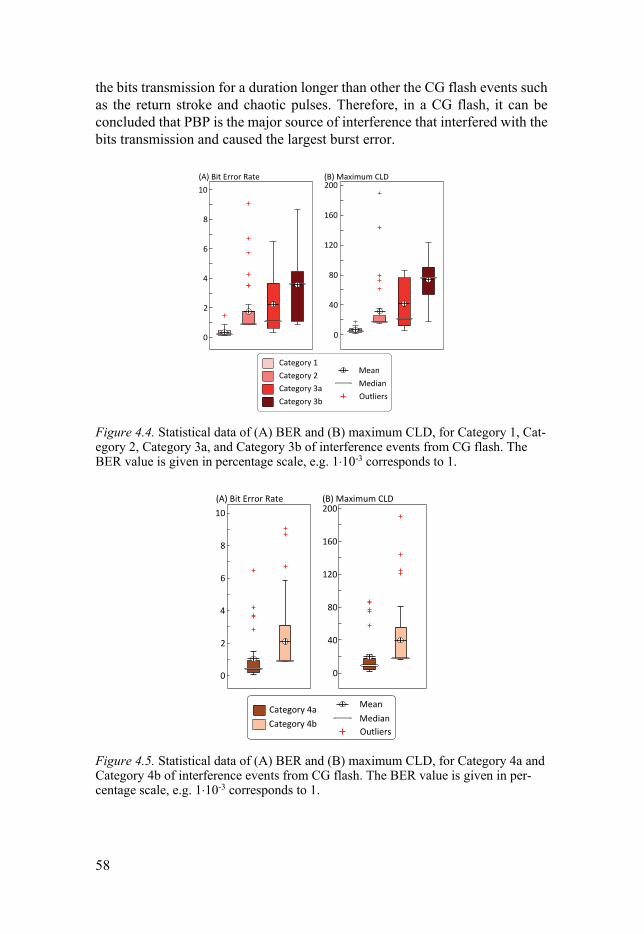
58
the bits transmission for a duration longer than other the CG flash events such as the return stroke and chaotic pulses. Therefore, in a CG flash, it can be concluded that PBP is the major source of interference that interfered with the bits transmission and caused the largest burst error.
Figure 4.4. Statistical data of (A) BER and (B) maximum CLD, for Category 1, Cat-egory 2, Category 3a, and Category 3b of interference events from CG flash. The BER value is given in percentage scale, e.g. 1⋅10-3 corresponds to 1.
Figure 4.5. Statistical data of (A) BER and (B) maximum CLD, for Category 4a and Category 4b of interference events from CG flash. The BER value is given in per-centage scale, e.g. 1⋅10-3 corresponds to 1.
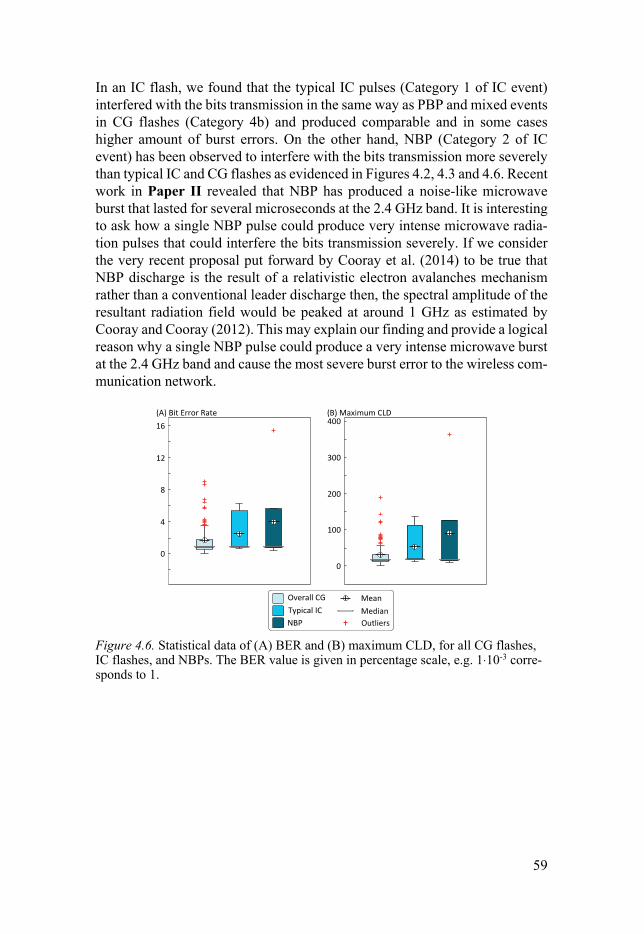
59
In an IC flash, we found that the typical IC pulses (Category 1 of IC event) interfered with the bits transmission in the same way as PBP and mixed events in CG flashes (Category 4b) and produced comparable and in some cases higher amount of burst errors. On the other hand, NBP (Category 2 of IC event) has been observed to interfere with the bits transmission more severely than typical IC and CG flashes as evidenced in Figures 4.2, 4.3 and 4.6. Recent work in Paper II revealed that NBP has produced a noise-like microwave burst that lasted for several microseconds at the 2.4 GHz band. It is interesting to ask how a single NBP pulse could produce very intense microwave radia-tion pulses that could interfere the bits transmission severely. If we consider the very recent proposal put forward by Cooray et al. (2014) to be true that NBP discharge is the result of a relativistic electron avalanches mechanism rather than a conventional leader discharge then, the spectral amplitude of the resultant radiation field would be peaked at around 1 GHz as estimated by Cooray and Cooray (2012). This may explain our finding and provide a logical reason why a single NBP pulse could produce a very intense microwave burst at the 2.4 GHz band and cause the most severe burst error to the wireless com-munication network.
Figure 4.6. Statistical data of (A) BER and (B) maximum CLD, for all CG flashes, IC flashes, and NBPs. The BER value is given in percentage scale, e.g. 1⋅10-3 corre-sponds to 1.

61
5. Conclusions
Important conclusions that can be derived from the studies done in Papers I, II, III, IV, and V are as follow:
• The occurrence of narrow bipolar pulses (NBPs) as part of a cloud-
to-ground (CG) flash has been observed across various geograph-ical areas as evidenced from the results presented in this thesis (South Malaysia) and previous studies conducted in Florida and South China. The amount of NBPs as part of a CG flash was sig-nificantly smaller than the amount of isolated NBPs. The percent-age of NBPs with a CG flash to the total NBPs was 14.5% (25/173) in South Malaysia.
• Across various geographical areas ranging from northern regions to
the tropics, the amount of NBP emissions increased significantly from 0.13% at a latitude of 59.8°N in Uppsala, Sweden to 12% at a latitude 1.5°N in South Malaysia. The occurrence of +NBPs was more common than –NBPs at all latitudes examined. However, as the latitude decreased, –NBP emissions became more frequent and a significant increase from 20% in Sweden to 45% in South Malay-sia was observed. Factors involving mixed-phase region elevations and vertical extents of thundercloud tops were invoked to explain the observed phenomena. These factors are fundamentally latitude dependent.
• Narrow bipolar pulse has been observed to occur both before and
after first return stroke. The mean normalized electric fields of –NBPs before the first return stroke were significantly larger, about a factor of 2.2 times higher than –NBPs after the first return stroke. If the emission sources of –NBPs were located below negative charge center, this very well could be the reason for the disparity in the amplitudes of these pulses that occur before and after the first return stroke.
62
• The electric field waveform characteristics of NBPs as part of a CG flash were similar to isolated NBPs observed in Sweden and South Malaysia and also to those isolated NBPs reported by previous stud-ies from various geographical regions. Therefore, it can be sug-gested that their breakdown mechanisms might be similar.
Important conclusions that can be derived from the studies done in Papers VI and VII are as follow:
• A wireless communication system experiences noise and interfer-ence even under fair weather conditions. However, the interference level is very low and hence the interference effect is negligible in fair weather conditions. We found that both CG and IC flashes in-terfered with the transmission of bits in wireless communication systems. The severity of the interference depends mainly on two factors namely the number of pulses and the amplitude intensity of the flash.
• Despite the fact that NBP consists of only a single bipolar pulse, it
has been observed to interfere with the bits transmission more se-verely than ordinary IC and CG flashes and cause the most severe burst errors to the wireless communication network. No doubt, NBPs are the strongest source of lightning interference to multiple antennas wireless communication network operating at 2.4 GHz. Consequently, NBPs are inferred to have produced the strongest microwave radiations at 2.4 GHz band.
63
Svensk Sammanfattning
Växelverkan av blixtar med trådlösa kommunikations-nätverk med special fokus på de smala bipolära elekt-riska pulserna
I denna avhandling har särdragen hos den elektriska fältsignaturen av de smala bipolära (NBPs) pulserna som genereras i molnblixtar undersökts och deras effekter på trådlösa kommunikationssystem har studerats. En handfull mängd av NBPs (14,5%) har observerats som en del av moln-till-jord blixtrar i södra Malaysia. Förekomsten av NBPs i Sverige har rapporterats för första gången i denna avhandling. Den elektriska fältegenskapen av NBPs som en del av moln-till-jord blixtrar, var väldigt lik den isolerade NBPs som setts i Sverige och södra Malaysia. Detta överensstämmer också med de iso-lerade NBPs som har rapporterats i tidigare studier för olika geografiska om-råden. Det är en stark indikation på att deras sammanbrottsmekanismer liknar varandra oberoende av breddgrad och oavsett geografiska områden. NBPs har observerats både före och efter den första huvudurladdningen. De genomsnittliga normaliserade elektriska fält rörande negativa NBPs, före den första huvudurladdningen var betydligt större, ungefär 2,2 gånger högre än det negativa NBPs som sätts efter den första huvudurladdningen. Om strålnings-källan hos de negativa NBPs var belägna nedanför det negativa laddningscen-trum, är det mycket troligt att detta kunde vara orsaken till skillnaden i ampli-tuderna hos dessa pulser. En jämförande studie om förekomsten av NBPs och andra former av blixtar över ett brett geografiskt område, från norra regionerna till tropikerna är pre-senterad. I samband med minskning av latituden, från Uppsala (59.8°N) till södra Malaysia (1.5°N), andelen NBP urladdningar i förhållande till det totala antalet blixtar ökar kraftigt från 0,13% till 12%. Förekomster av positiva NBPs var vanligare än negativa NBPs vid olika breddgrader i denna studie. Emellertid, med minskning av latituden, ökade andelen av negativa NBP ur-laddningar betydligt från 20% (Sverige) till 45% (södra Malaysia). Faktorer som exempelvis område med en upphöjd av olikartade faser samt område med större vertikala åskmolnstoppar är en del av förklaringen till de observerade resultaten. Dessa faktorer är i grunden beroende av latituden.
64
Den höga andelen negativa NBPs i Malaysiska åskväder (5,4% jämfört med bara 0,03% i Sverige) och den mycket sällsynta förekomsten av isolerade sam-manbrottspulser i denna region (endast 0,1% jämfört med 3,8% i Sverige) är kanske ett tecken på en laddningsstruktur som har: en mycket svag storleks-ordning i den lilla positivladdningsfickan i molnets bas samt mycket stark storleksordning i negativ avskärmningsskikt. Tidigare har det rapporterats att inga isolerade sammanbrottspulser (IBPs) har detekterats i de tropiska stormar som råder i Sri Lanka, medan de var övervägande i Sverige. Följaktligen, när latituden minskar från norra regionerna till tropikerna, storleken av det nega-tiva avskärmningsskiktet ovanför toppen av det positiva laddningscentret blir starkare (mer negativa NBP urladdning), medan storleken på den undre för-svagar (mindre NBP urladdning). I denna avhandling har växelverkan mellan mikrovågsstrålning från moln-till-jord blixt och molnblixt, och bits överföring i trådlösa kommunikationsnät presenteras. Så vitt vi vet, det är första gången sådana följder har undersökts i litteraturen. Ett trådlöst kommunikationssystem upplever brus och störningar även under normala väderförhållanden. Emellertid, är interferensnivån väldigt lågt och därmed är effekterna försumbara under dessa villkor. Vi fann att både CG- och IC blixtar stört överföringen av bitar i trådlösa kommunikationssy-stem. Svårighetsgraden av störningen beror huvudsakligen på två faktorer, nämligen antalet pulser och amplitudens intensitet hos blixten. Trots att NBP består endast av en enda bipolär puls, har det observerats att denna puls stör bit transmissionen i större utsträckning än de mer vanligare IC- och CG-blixtrarna och orsakar de allvarligaste komplikationer i det tråd-lösa kommunikationsnätet. Ingen tvekan att NBPs är den största källan till störningar hos de multipla antenners trådlösa kommunikationsnätverk som ar-betar vid 2,4 GHz. Följaktligen har NBPs producerat de starkaste mikrovågs-strålningarna hos 2,4 GHz-bandet. Den intressanta frågan är, hur en enstaka NBP kan producera så intensiva mikrovågsstrålning som kan störa bitars överföring så allvarligt. Om vi tar den allra senaste förslaget i betraktelse som hävdar att NBP urladdningar är resul-taten av en relativistisk elektron ansamlingsmekanism snarare än en konvent-ionell ledarurladdning, då spektralamplituden av det utfallande strålningsfältet skulle nå ett maximum på omkring 1 GHz. Detta kan förklara våra observat-ioner och ge en logisk förklaring till att en enda NBP puls kan ge så intensiv mikrovågsstrålning vid 2,4 GHz-bandet och orsaka ett sådant allvarligt hot mot det trådlösa kommunikationsnätet.
65
Bibliography
Ahmad, M.R., Dutkiewicz, E., Huang, X., 2008. MAC protocal for cooperative MIMO transmissions in asynchonous wireless sensor networks. In: proceeding of the IEEE 8th International Symposium on Communications and Information Technologies (ISCIT2008), Vientiane, Laos, October 21-23.
Ahmad, M. R., Dutkiewicz, E., Huang, X., and Suaidi, M. K., 2010. Cooperative
MIMO systems in wireless sensor networks. In: Radio communications, Ed. Ales-sandro Bazzi, InTech, Croatia, pp. 123 – 149.
Ahmad, N. A., 2011. Broadband and HF radiation from cloud flashes and narrow
bipolar pulses. PhD Thesis, Uppsala University, Uppsala. Ahmad, M. R., Rashid, M., Aziz, M. H. A., Esa, M. R. M., Cooray, V., Rahman M.,
Dutkiewicz E., 2011. Analysis of lightning-induced transient in 2.4 GHz wireless communication system. In: Proceeding of IEEE International Conference on Space Science and Communication (IconSpace), Penang, Malaysia, 225–230.
Ahmad, M. R., Esa, M. R. M., Rahman, M., Cooray, V., 2012a. Measurement of bit
error rate at 2.4 GHz due to lightning interference. In: Proceeding of International Conference on Lightning Protection (ICLP), Vienna, Austria, September 2-7, 1–4.
Ahmad, M. R., Esa, M. R. M., Cooray, V., Dutkiewicz, E., 2012b. Performance anal-
ysis of audio streaming over lightning-interfered MIMO channels, in: Proc. of International Symposium on Communications and Information Technologies (IS-CIT), Gold Coast, Australia, October 2-5, 513–518.
Ahmad, M. R., Esa, M. R. M., and Cooray, V., 2013. Narrow bipolar pulses and as-
sociated microwave radiation, in: Proceedings of PIERS2013 Stockholm, The Electromagnetics Academy, Cambridge, 1087–1090.
Ahmad, M. R., Esa, M. R. M., and Cooray, V., 2014. Occurrence of narrow bipolar
event as part of cloud-to-ground flash in tropical thunderstorms, in: Preprint of International Conference on Atmospheric Electricity (ICAE), June 15-20, Nor-man, Oklahoma, USA.
Azlinda Ahmad, N., Fernando, M., Baharudin, Z. A., Cooray, V., Ahmad, H., and
Abdul Malek, Z., 2010. Characteristics of narrow bipolar pulses observed in Ma-laysia. Journal of Atmospheric and Solar-Terrestrial Physics, vol. 72, 534–540.

66
Baharudin, Z. A., Fernando, M., Ahmad, N. A., Mäkelä, J. S., Rahman, M., and Cooray, V. 2012. Electric field changes generated by the preliminary breakdown for the negative cloud-to-ground lightning flashes in Malaysia and Sweden. Jour-nal of Atmospheric and Solar-Terrestrial Physics, vol. 84-85, 15–24.
Baharudin, Z. A., 2014. Characterization of ground flashes from tropic to northern
region. PhD Thesis, Uppsala University, Uppsala. Balanis, C. A., 2005. Antenna Theory: Analysis and Design, Third Edition, John
Wiley and Sons, Inc, Hoboken, New Jersey, p. 95. Chen, Y., Farley, T., and Ye, N., 2004. QoS requirements of network applications on
the Internet. Journal Information-Knowledge-Systems Management, vol. 4, 55–76.
Cooray, V. and Lundquist, S., 1985. Characteristics of the radiation fields from light-
ning in Sri Lanka in the tropics, Jornal of Geophysical Research, vol. 90, 6099–6109.
Cooray, V., 2007. Propagation effects on the radiation field pulses generated by cloud
flashes. Journal of Atmospheric and Solar-Terrestrial Physics, vol.69, 1397–1406.
Cooray, V. and Cooray, G., 2012. Electromagnetic radiation field of an electron ava-
lanche, Jornal of Atmospheric Research, vol. 117, 18–27, doi: 10.1016/j.at-mosres.2011.06.004.
Cooray, V., Cooray, G., Marshall, T., Arabshahi, S., Dwyer, J., and Rassoul, H., 2014.
Electromagnetic fields of a relativistic electron avalanche with special attention to the origin of lightning signatures known as narrow bipolar pulses. Journal of Atmospheric Research, vol. 149, 346–358, doi:http://dx.doi.org/10.1016/j.at-mosres.2013.12.011.
Dwyer, J.R. and Uman, M.A., 2014. The physics of lightning. Journal of Physics Re-
ports, vol. 534, 147 – 241. Esa, M. R. M., Sha'ameri, A. Z., Ahmad, H., Malik, N. N. N. A., 2005. Conceptual
implementation to access the extend of influence of lightning electromagnetic ra-diation on mobile radio communication. In: Proceeding of Asia-Pacific Confer-ence on Applied Electromagnetic (APACE), Johor Bahru, Malaysia: IEEE 2005, 179–183.
Esa, M. R. M., Ahmad, M. R., Cooray, V., 2014. Wavelet analysis of the first electric
field pulse of lightning flashes in Sweden. Journal of Atmospheric Research, vol. 138, 253–267, doi: 10.1016.j.atmosres.2013.11.019.
Fedorov, V. F., Yu, A., Shishkov, P. O., 2001. Millimetric electromagnetic radiation
of a lightning return stroke. Journal of Applied Mechanics and Technical Physics, vol. 42(3), 392–396.
Fluckiger, F., 2005. Understanding networked multimedia: applications and technol-
ogy. Prentice Hall International Ltd., Hertfordshire, UK, 242–382.
67
Guo, C. and Krider, E. P., 1982. The optical radiation field signatures produced by lightning return strokes. Journal of Geophysical Research, vol. 87, 8913–8922.
Gurevich, A. V. and Karashtin, A. N., 2013. Runaway breakdown and hydrometeors
in lightning initiation. Physical Review Letter, vol. 110, 185005, doi: 10.1103/PhysRevLett.110.185005.
Hamlin, T., Wiens, K. C., Jacobson, A. R., Light, T. E. L., and Eack, K. B., 2009.
Space- and ground-based studies of lightning signatures, in: Lightning: Princi-ples, Instruments and Application, Eds. Hans Dieter Betz, Ulrich Schumann, Pierre Laroche. Springer Science+Business Media B.V., Netherlands, pp. 287–307.
Holloway, C. L., Hill, D. A., Ladbury, J. M., Wilson, P. F., Koepke, G., Coder, J.,
2006. On the use of reverberation chambers to simulate a Rician radio environ-ment for the testing of wireless devices. IEEE Transaction on Antenna Propaga-tion, vol. 54(11), 3167–3177.
Hutchins, M. L., Holzworth, R. H., Virts, K. S., Wallace, J. M., and Heckman, S.,
2013. Radiated VLF energy differences of land and oceanic lightning, Geophys-ical Research Letter, vol. 40, 1–5.
Jacobson, A. R. and Heavner, M. J., 2005. Comparison of narrow bipolar events with
ordinary lightning as proxies for severe convection. Monthly Weather Review, vol. 133(5), 1144–1154.
Lay, E. H, 2008. Investigating Lightning-to-Ionosphere Energy Coupling Based on
VLF Lightning Propagation Characterization. PhD thesis, University of Wash-ington, Washington, USA.
Larsson, E. G., Stoica, P., 2003. Space-time block coding for wireless communica-
tions, First edition, Cambridge University Press, Cambridge, UK. Le Vine, D. M., 1980. Source of the strongest RF radiation from lightning. Journal of
Geophysical Research, vol. 85, 4091–4095. Le Vine D. M., 1987. Review of measurements of the RF spectrum of radiation from
lightning. Journal of Meteorology and Atmospheric Physics, vol. 37, 195–204. Marshall, T.C., and Winn, W.P., 1982. Measurements of charged precipitation in a
New Mexico thunderstorm: lower positive charge centers. Geophysical Research, vol. D 87, 7141–7157.
Medelius, P. J., Thomson, E. M., and Pierce, J. S., 1991. E and dE/dt waveshapes for
narrow bipolar pulses in intracloud lightning. In: Proceedings of the International Aerospace and Ground Conference on Lightning and Static Electricity, NASA Conference Publication, vol. 3106, 12-1–12-10.
Nag, A., and Rakov, V. A., 2009. Electromagnetic pulses produced by bouncing-
wave-type lightning discharges. IEEE Transaction on Electromagnetic Compati-bility, vol. 51(3), 466–471.
68
Nag, A. and Rakov, V. A., 2010. Compact Intracloud lightning discharges: 1. Mech-anism of electromagnetic radiation and modeling. Journal of Geophysical Re-search, vol. 115, D20102, doi:10.1029/2010JD014235.
Nag, A., Rakov, V. A., Tsalikis, D., and Cramer, J. A., 2010. On phenomenology of
compact intracloud discharges. Journal of Geophysical Research, vol. 115, D14115, doi: 10.1029/2009JD012957.
Petersen, D., Beasley, W.H., 2014. Microwave radio emissions of negative cloud-to-
ground lightning flashes. Journal of Atmospheric Research, vol. 135-136, 314–321.
Proakis, J. G., 2001. Digital communication, Fourth edition, McGrawHill, Singapore. Rakov, V.A., Uman, M.A., 2003. Lightning physics and effects. Cambridge Univer-
sity Press, UK, p. 44. Rappaport, T. S., 2002. Wireless communication: principles and practice, Second edi-
tion, Pearson Education International, Upper Saddle River, New Jersey. Recommendation ITU-R P.618-9, 2009. Propagation data and prediction methods re-
quired for the design of earth-space telecommunication systems. Radiocommuni-cation sector of ITU Series P: radiowave propagation. Available from: http://www.itu.int/rec/R-REC-P.618-10-200910-I/en.
Rison, W., Thomas, R. J., Krehbiel, P. R., Hamlin, T., and Harlin, J., 1999. A GPS-
based three-dimensional lightning mapping system: Initial observation in Central New Mexico. Geophysical Research Letter, vol. 26, 3573–3576.
Rust, W. D., Krehbiel, P. R., Shlanta, A., 1979. Measurements of radiation from light-
ning at 2200 MHz. American Geophysical Union Research Letters, vol. 6(2), 85–88.
Schulzrinne, H., Casner, S., Frederick, R., Jacobson, V., 2003. RTP: A transport pro-
tocol for real-time applications. IETF RFC 3550 Standard. Available from: http://tools.ietf.org/html/rfc3550.
Sharma, S. R., Fernando, M., Gomes, C., 2005. Signatures of electric field pulses gen-
erated by cloud flashes. Journal of Atmospheric and Solar-Terrestrial Physics, vol. 67, 413–422.
Sharma, S. R., Fernando, and M Cooray, V., 2008. Narrow positive bipolar pulses.
Journal of Atmospheric and Solar-Terrestrial Physics, vol. 70, 1251–1260. Sharma, S. R., Cooray, V. and Fernando, M., 2011. Unique lightning activities perti-
nent to tropical and temperate thunderstorms. Journal of Atmospheric and Solar-Terrestrial Physics, vol. 73, 483–487.
Smith, D. A., Shao, X. M., Holden, D. N., Rhodes, C. T., Brook, M., Krehbiel, P. R.,
Stanley, M., Rison, W., and Thomas, R. J., 1999. A distinct class of isolated in-tracloud lightning discharges and their associated radio emissions. Journal of Ge-ophysical Research, vol. 104, 4189–4212.
69
Smith, D. A., Eack, K. B., Harlin, J., Heavner, M. J., Jacobson, A. R., Massey, R. S., Shao, X. M., Wiens, K. C., 2002. The Los Alamos Sferic Array: A research tool for lightning investigations. Journal of Geophysical Research, vol. 107, doi: 10.1029/2001JD000502.
Smith, D. A., Heavner, M. J., Jacobson, A. R., Shao, X. M., Massey, R. S., Sheldon,
R. J., and Wiens, K. C., 2004. A method for determining intracloud lightning and ionospheric heights from VLF/LF electric field records. Radio Science, vol. 39, RS1010, doi: 10.1029/2002RS002790.
Sonnadara, U., Cooray, V., Fernando, M., 2006. The lightning radiation field spectra
of cloud flashes in the interval from 20 kHz to 20 MHz, IEEE Transaction on Electromagnetic Compatibility, vol. 48(1), 234–239.
Stolzenburg, M., Marshall, T. C., Rust, W. D., Bruning, E., MacGorman, D. R., and
Hamlin, T., 2007. Electric field values observed near lightning flash initiations. Geophysical Research Letter, vol. 34, L04804.
Suszcynsky, D. M., and Heavner, M. J., 2003. Narrow bipolar events as indicators of
convective strength. Geophysical Research Letter, vol. 30, doi 10.1029/2003GL017834.
Suszcynsky, D. M., Jacobson, A. R., Linford, J., Light, T. E. L., and Musfeldt, A.,
2005. VHF lightning detection and storm tracking from GPS orbit. In: Annual Meeting, American Meteorological Society, Abstract P2.5.
Taoka, H., Higuchi, K., Sawahashi, M., 2006. Experiments on space diversity effect
in MIMO channel transmission with maximum data rate of 1 Gbps in downlink OFDM radio access. European Transactions on Telecommunications, vol. 17, 611–622.
Watson, S. S., and Marshall, T. C., 2007. Geophysical Research Letter, vol. 34,
L04816, doi: 10.1029/2006GL027426. Weidman, C. D., Krider, E. P., Uman, M. A., 1981. Lightning amplitude spectra in
the interval from 100 kHz to 20 MHz. Geophysical Research Letter, vol. 8, 931–934.
Wiens, K. C., Hamlin, T., Harlin, J., and Suszcynsky, D. M., 2008. Relationships
among narrow bipolar events, “total” lightning, and radar-inferred convective strength in Summer 2005 Great Plains thunderstorms. Journal of Geophysical Re-search, vol. 113, D05201, doi 10.1029/2007JD009400.
Willet J. C. and Bailey, J. C., 1989. A class of unusual lightning electric field wave-
forms with very strong high-frequency radiation. Journal of Geophysical Re-search, vol. 94, 16255–16267.
Williams, E. R., and Renno, N. O., 1993. An analysis of the conditional instability of
the tropical atmosphere. Monthly Weather Review, vol. 121, 21–36.
70
Wu, T., Dong, W., Zhang, Y., and Wang, T., 2011. Comparison of positive and neg-ative intracloud discharges. Journal of Geophysical Research, vol. 116, D03111, doi: 10.1029/2010JD015233.
Wu, T., Dong, W., Zhang, Y., Funaki, T., Yoshida, S., Morimoto, T., Ushio, T., and
Kawasaki, Z., 2012. Discharge height of lightning narrow bipolar events. Journal of Geophysical Research, vol. 117, D05119, doi: 10.1029/2011JD017054.
Wu, T., Takayanagi, Y., Yoshida, S., Funaki, T., and Ushio, T., 2013. Spatial rela-
tionship between lightning narrow bipolar events and parent thunderstorms as re-vealed by phased array radar. Geophysical Research Letter, vol. 40, 618–623, doi:10.1002/grl.50112.
Zhu, B., Zhou, H., Ma, M., and Tao, S., 2010. Observations of narrow bipolar events
in East China. Journal of Atmospheric and Solar-Terrestrial Physics, vol. 72, 271–278.

Acta Universitatis UpsaliensisDigital Comprehensive Summaries of Uppsala Dissertationsfrom the Faculty of Science and Technology 1188
Editor: The Dean of the Faculty of Science and Technology
A doctoral dissertation from the Faculty of Science andTechnology, Uppsala University, is usually a summary of anumber of papers. A few copies of the complete dissertationare kept at major Swedish research libraries, while thesummary alone is distributed internationally throughthe series Digital Comprehensive Summaries of UppsalaDissertations from the Faculty of Science and Technology.(Prior to January, 2005, the series was published under thetitle “Comprehensive Summaries of Uppsala Dissertationsfrom the Faculty of Science and Technology”.)
Distribution: publications.uu.seurn:nbn:se:uu:diva-233673
ACTAUNIVERSITATIS
UPSALIENSISUPPSALA
2014
Related Documents