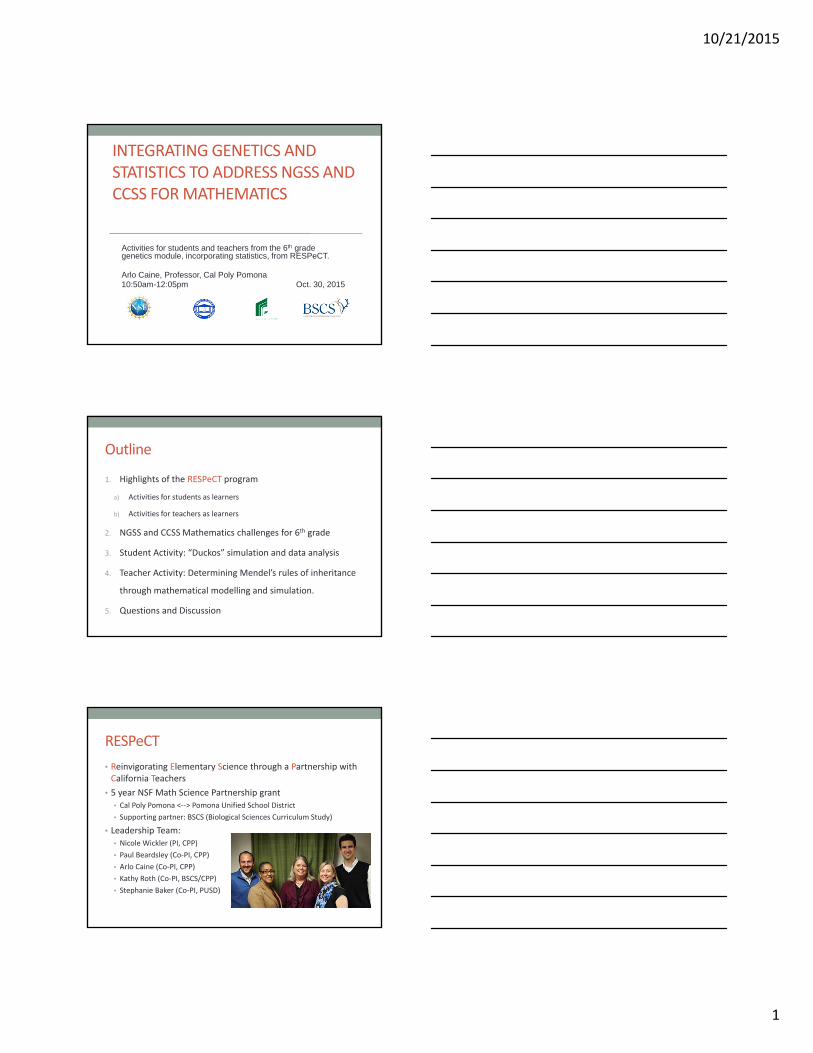
INTEGRATING GENETICS AND STATISTICS TO ADDRESS NGSS AND CCSS FOR MATHEMATICS Activities for students and teachers from the 6 th grade genetics module, incorporating statistics, from RESPeCT. Arlo Caine, Professor, Cal Poly Pomona 10:50am-12:05pm Oct. 30, 2015

Welcome message from author
This document is posted to help you gain knowledge. Please leave a comment to let me know what you think about it! Share it to your friends and learn new things together.
Transcript
INTEGRATING GENETICS AND STATISTICS TO ADDRESS NGSS AND CCSS FOR MATHEMATICS
Activities for students and teachers from the 6th grade genetics module, incorporating statistics, from RESPeCT. Arlo Caine, Professor, Cal Poly Pomona 10:50am-12:05pm Oct. 30, 2015
Outline
1. Highlights of the RESPeCT program
a) Activities for students as learners
b) Activities for teachers as learners
2. NGSS and CCSS Mathematics challenges for 6th grade
3. Student Activity: “Duckos” simulation and data analysis
4. Teacher Activity: Determining Mendel’s rules of inheritance
through mathematical modelling and simulation.
5. Questions and Discussion
RESPeCT
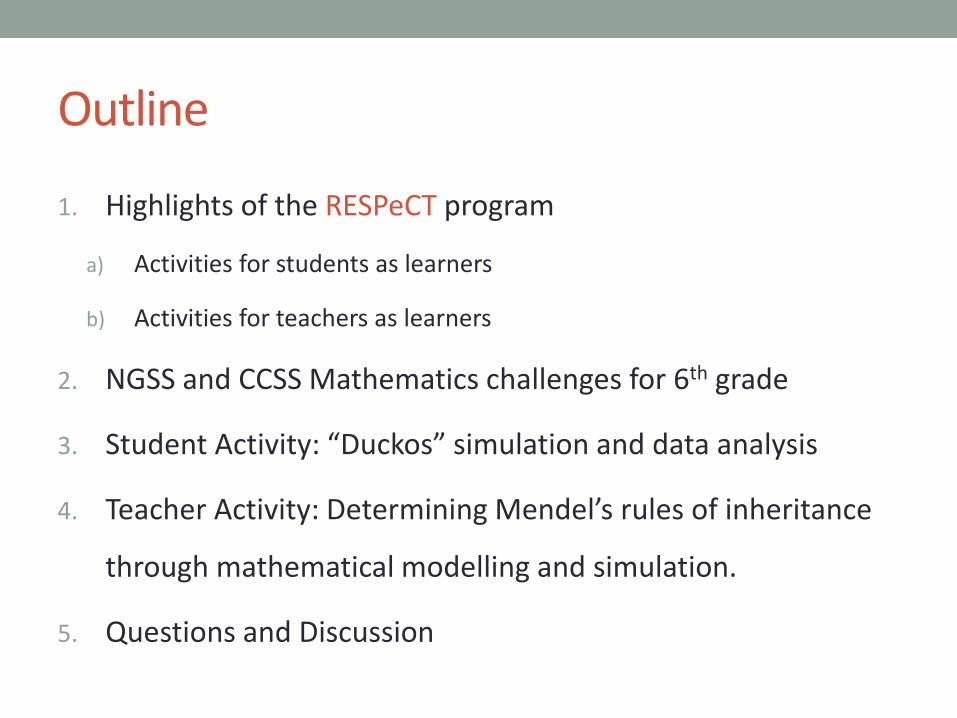
• Reinvigorating Elementary Science through a Partnership with California Teachers
• 5 year NSF Math Science Partnership grant • Cal Poly Pomona <--> Pomona Unified School District
• Supporting partner: BSCS (Biological Sciences Curriculum Study)
• Leadership Team: • Nicole Wickler (PI, CPP)
• Paul Beardsley (Co-PI, CPP)
• Arlo Caine (Co-PI, CPP)
• Kathy Roth (Co-PI, BSCS/CPP)
• Stephanie Baker (Co-PI, PUSD)

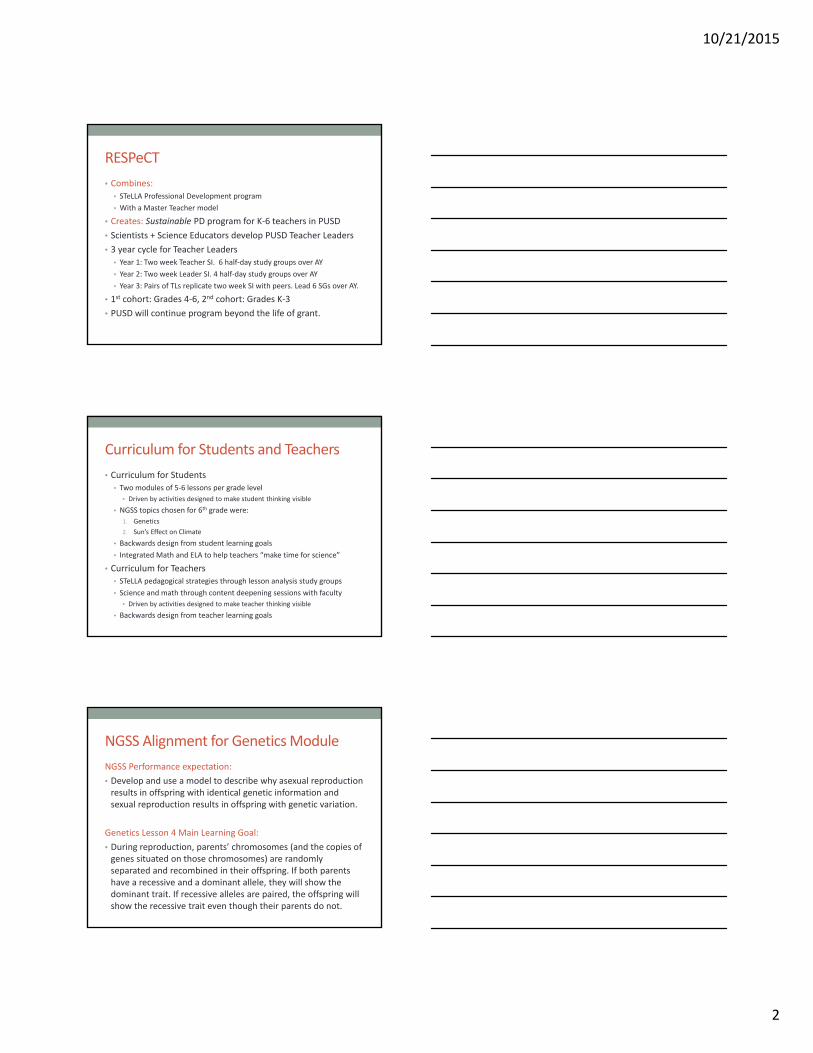
RESPeCT
• Combines: • STeLLA Professional Development program
• With a Master Teacher model
• Creates: Sustainable PD program for K-6 teachers in PUSD
• Scientists + Science Educators develop PUSD Teacher Leaders
• 3 year cycle for Teacher Leaders • Year 1: Two week Teacher SI. 6 half-day study groups over AY
• Year 2: Two week Leader SI. 4 half-day study groups over AY
• Year 3: Pairs of TLs replicate two week SI with peers. Lead 6 SGs over AY.
• 1st cohort: Grades 4-6, 2nd cohort: Grades K-3
• PUSD will continue program beyond the life of grant.
Curriculum for Students and Teachers
• Curriculum for Students • Two modules of 5-6 lessons per grade level
• Driven by activities designed to make student thinking visible
• NGSS topics chosen for 6th grade were:
1. Genetics
2. Sun’s Effect on Climate
• Backwards design from student learning goals
• Integrated Math and ELA to help teachers “make time for science”
• Curriculum for Teachers • STeLLA pedagogical strategies through lesson analysis study groups
• Science and math through content deepening sessions with faculty
• Driven by activities designed to make teacher thinking visible
• Backwards design from teacher learning goals
NGSS Alignment for Genetics Module
NGSS Performance expectation:
• Develop and use a model to describe why asexual reproduction results in offspring with identical genetic information and sexual reproduction results in offspring with genetic variation.
Genetics Lesson 4 Main Learning Goal:
• During reproduction, parents’ chromosomes (and the copies of genes situated on those chromosomes) are randomly separated and recombined in their offspring. If both parents have a recessive and a dominant allele, they will show the dominant trait. If recessive alleles are paired, the offspring will show the recessive trait even though their parents do not.
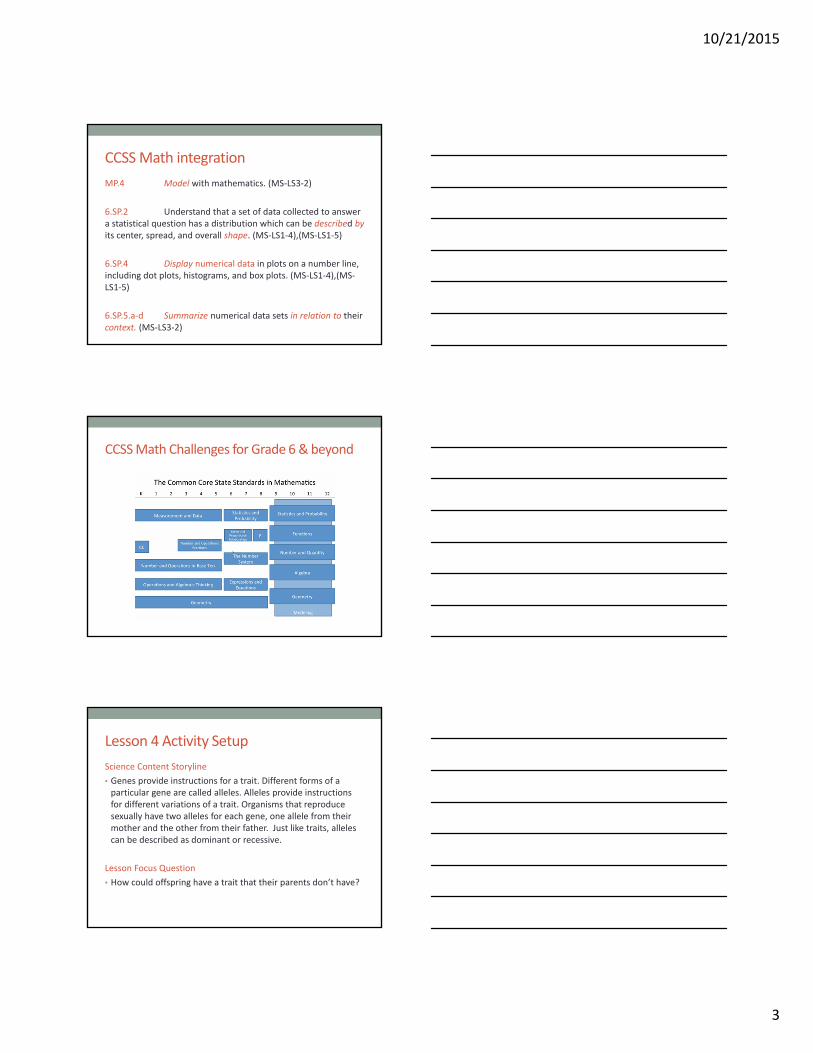
CCSS Math integration
MP.4 Model with mathematics. (MS-LS3-2)
6.SP.2 Understand that a set of data collected to answer a statistical question has a distribution which can be described by its center, spread, and overall shape. (MS-LS1-4),(MS-LS1-5)
6.SP.4 Display numerical data in plots on a number line, including dot plots, histograms, and box plots. (MS-LS1-4),(MS-LS1-5)
6.SP.5.a-d Summarize numerical data sets in relation to their context. (MS-LS3-2)
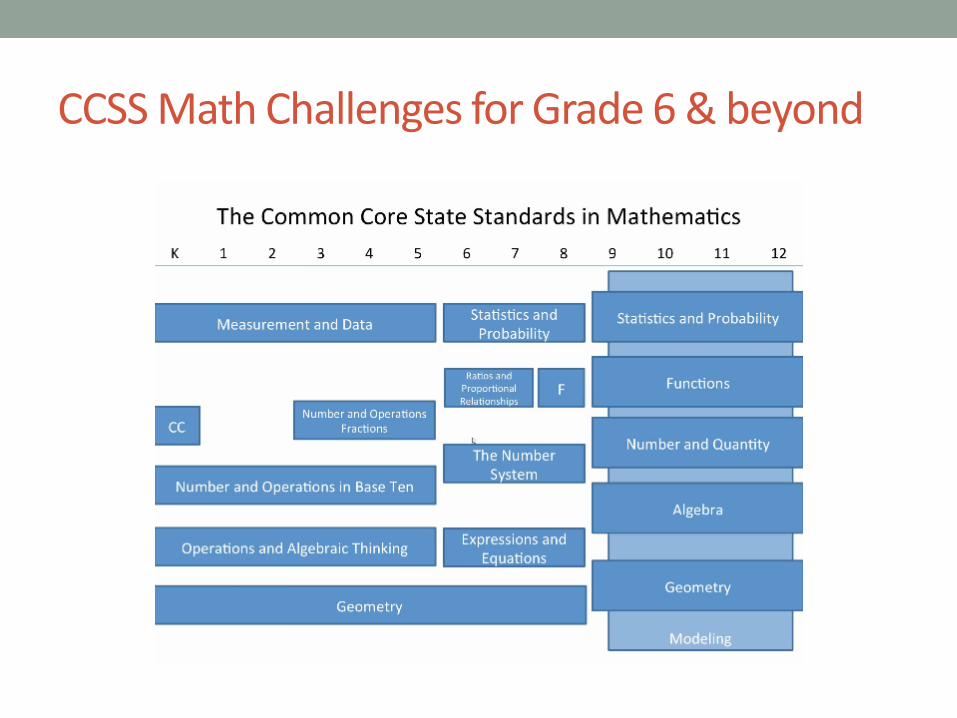
CCSS Math Challenges for Grade 6 & beyond
Lesson 4 Activity Setup
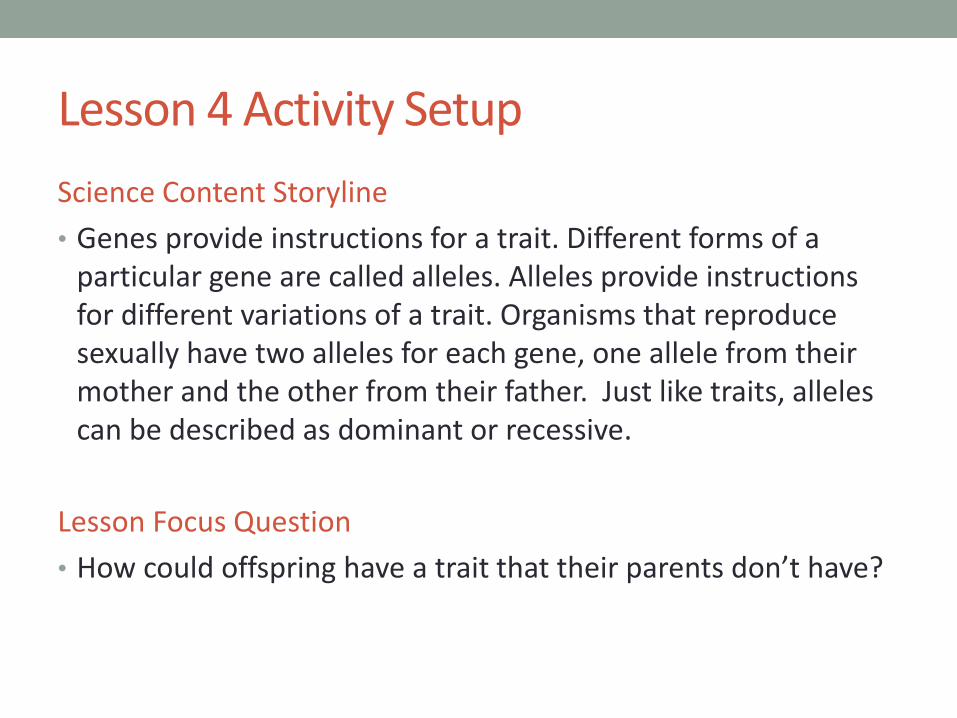
Science Content Storyline
• Genes provide instructions for a trait. Different forms of a particular gene are called alleles. Alleles provide instructions for different variations of a trait. Organisms that reproduce sexually have two alleles for each gene, one allele from their mother and the other from their father. Just like traits, alleles can be described as dominant or recessive.
Lesson Focus Question
• How could offspring have a trait that their parents don’t have?
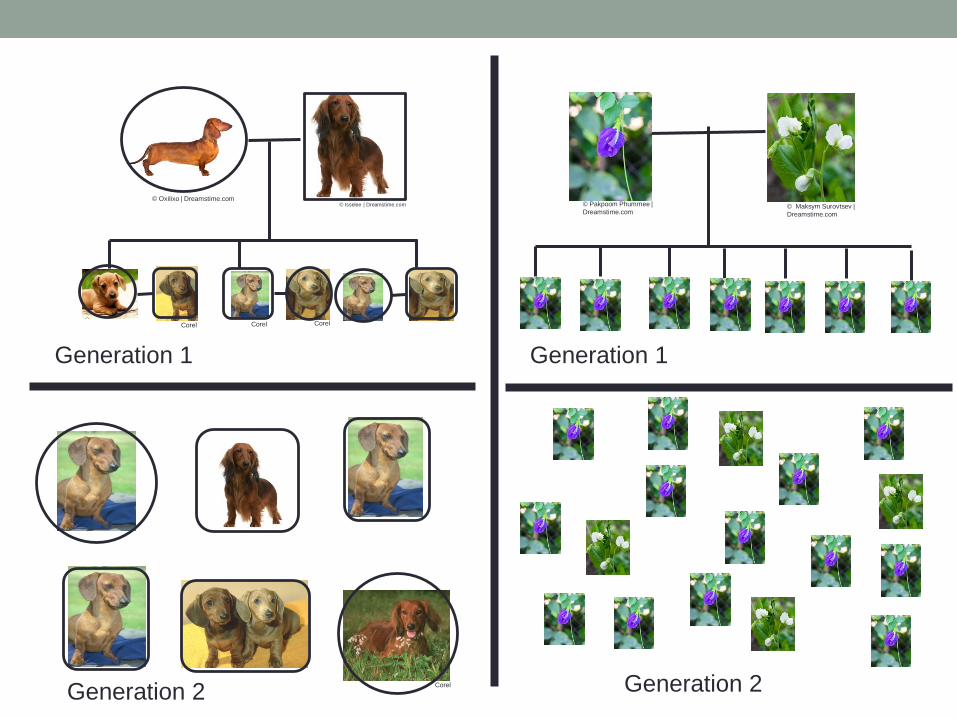
Generation 1
Generation 2
Generation 1
Generation 2
© Isselee | Dreamstime.com © Oxilixo | Dreamstime.com
Corel Corel Corel
Corel
© Pakpoom Phummee |
Dreamstime.com © Maksym Surovtsev |
Dreamstime.com
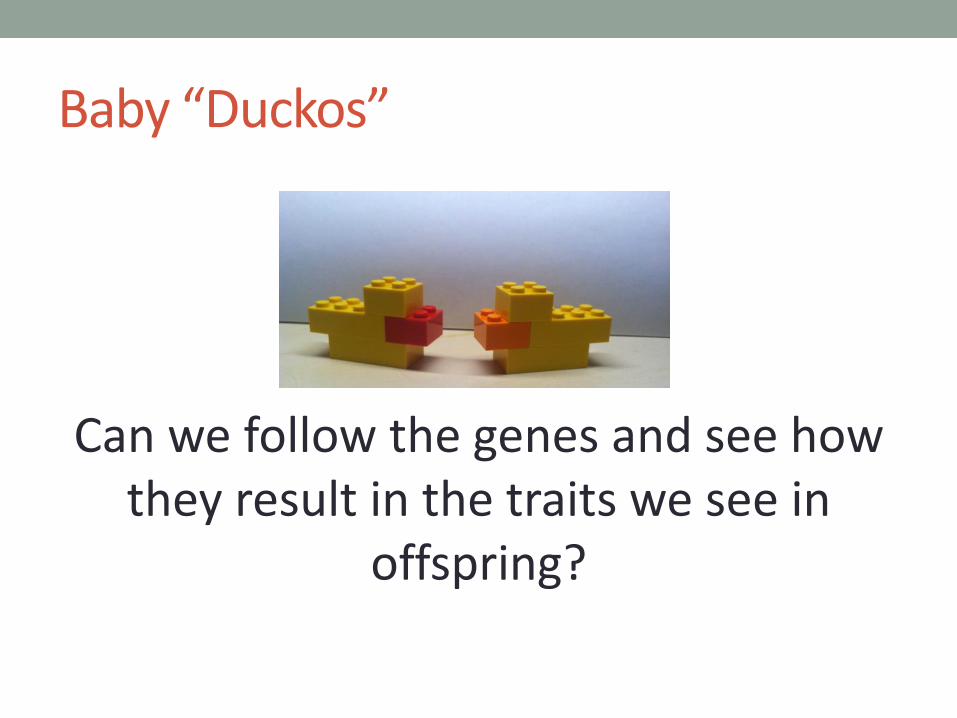
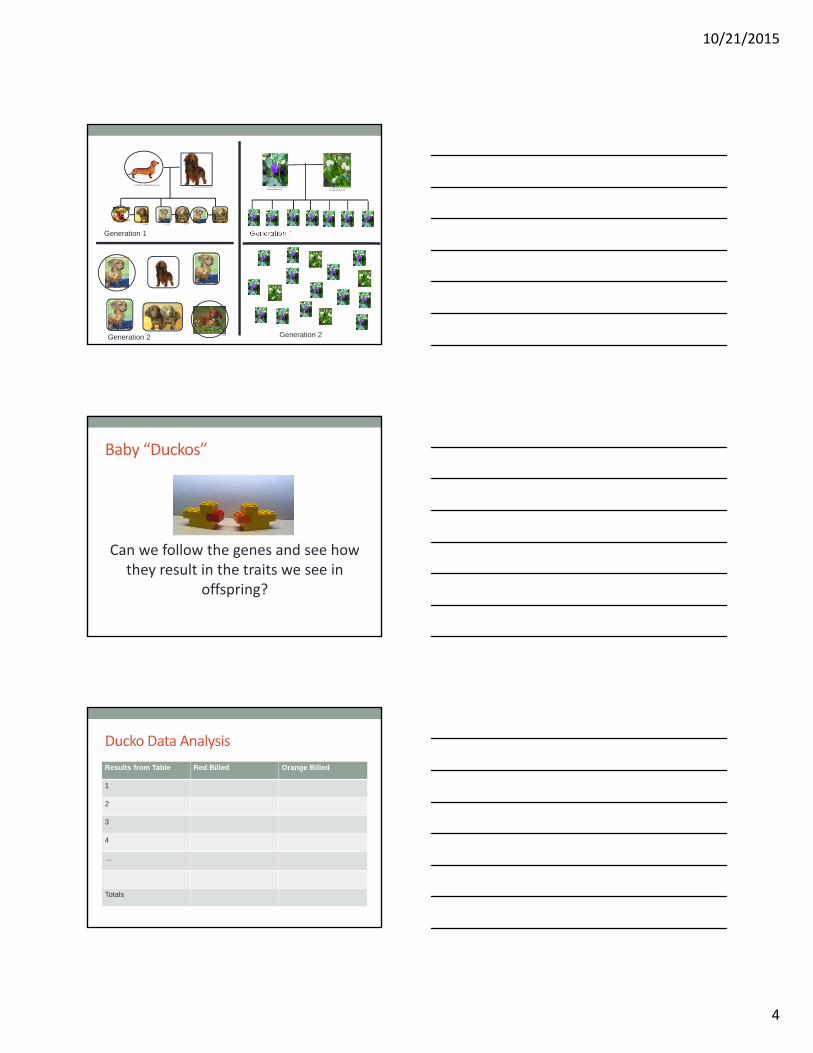
Baby “Duckos”
Can we follow the genes and see how they result in the traits we see in
offspring?
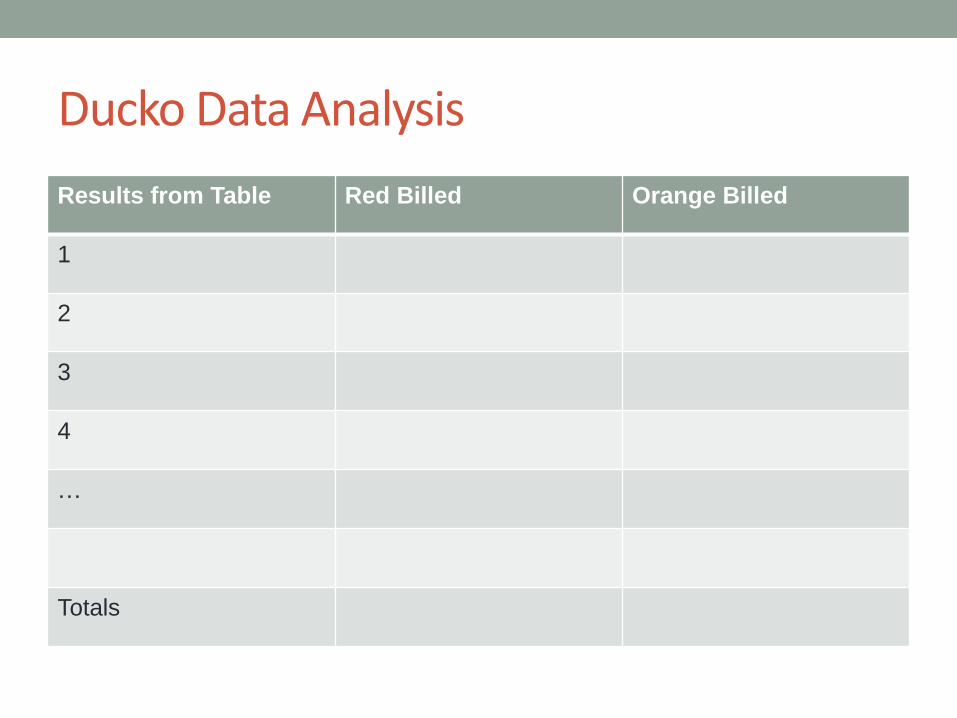
Ducko Data Analysis
Results from Table Red Billed Orange Billed
1
2
3
4
…
Totals
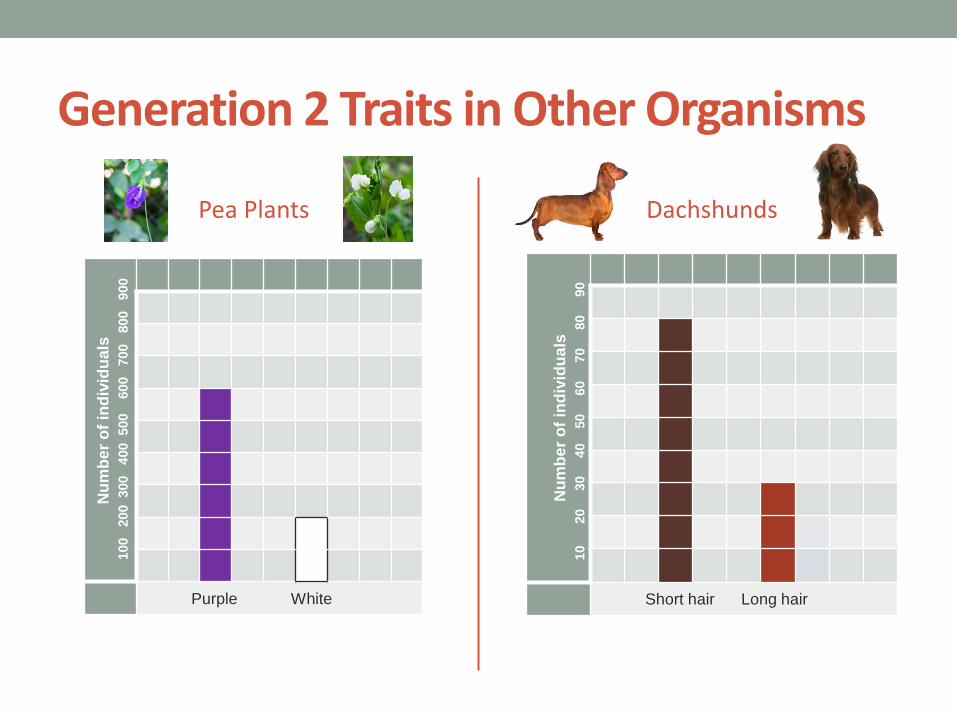
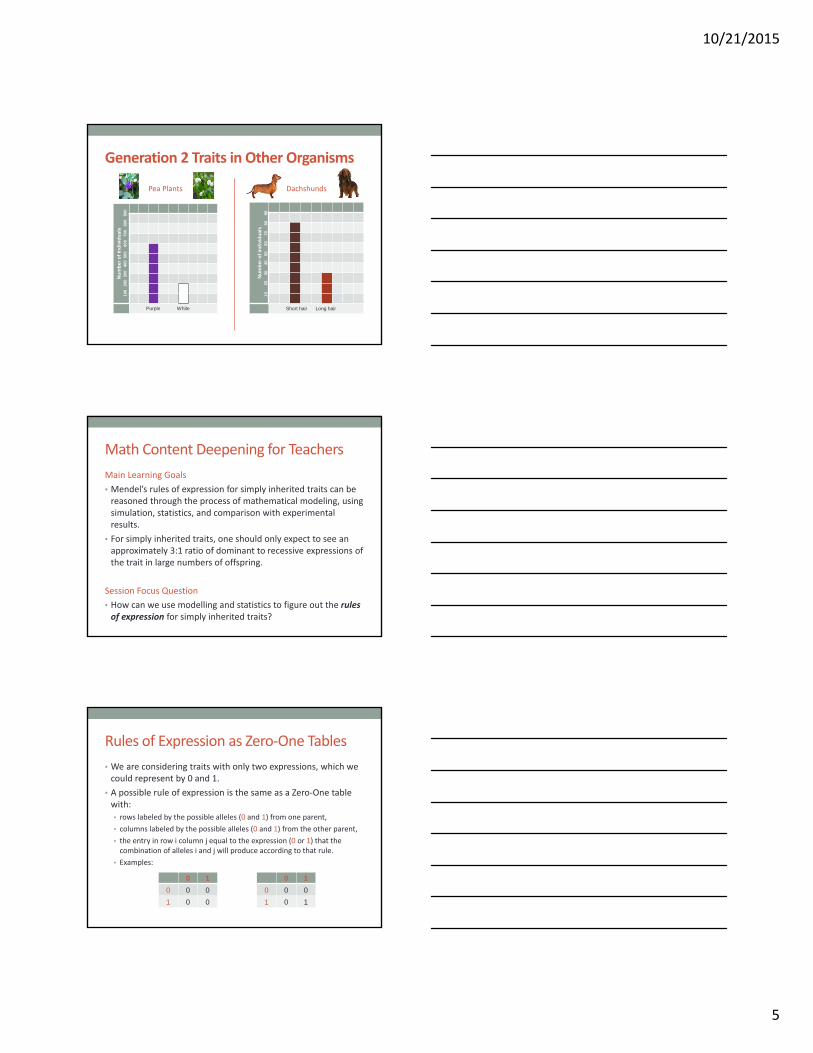
Generation 2 Traits in Other Organisms
Pea Plants
Nu
mb
er
of
ind
ivid
ua
ls
100 2
00 300 4
00 500 600 7
00 8
00 9
00
Purple White
Dachshunds
Nu
mb
er
of
ind
ivid
ua
ls
10 20 3
0 4
0 50 6
0 7
0 8
0 9
0
Short hair Long hair
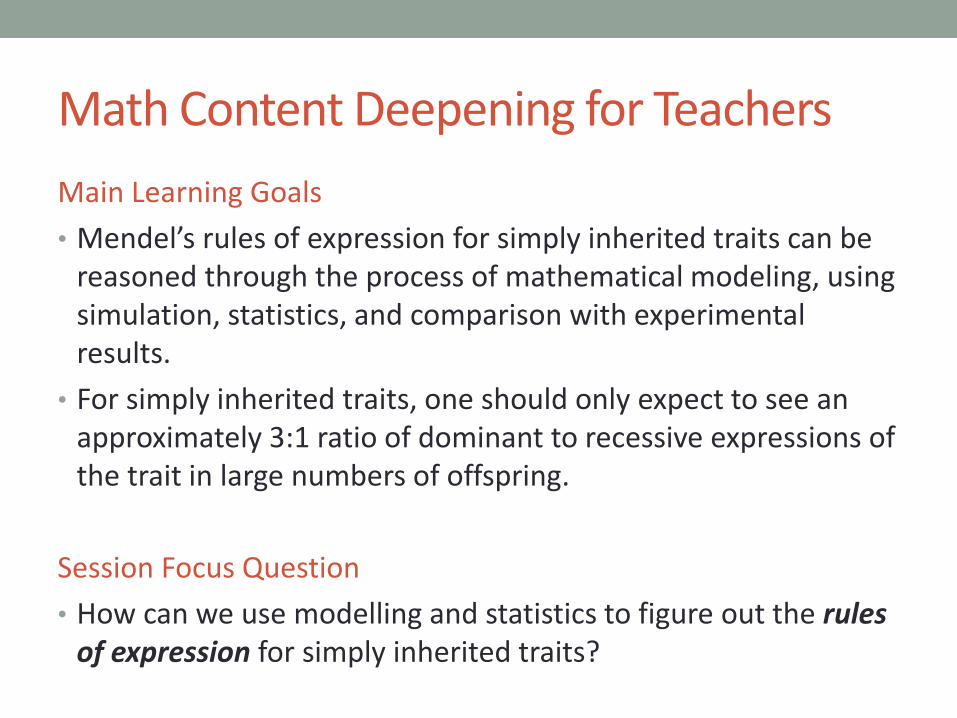
Math Content Deepening for Teachers
Main Learning Goals
• Mendel’s rules of expression for simply inherited traits can be reasoned through the process of mathematical modeling, using simulation, statistics, and comparison with experimental results.
• For simply inherited traits, one should only expect to see an approximately 3:1 ratio of dominant to recessive expressions of the trait in large numbers of offspring.
Session Focus Question
• How can we use modelling and statistics to figure out the rules of expression for simply inherited traits?
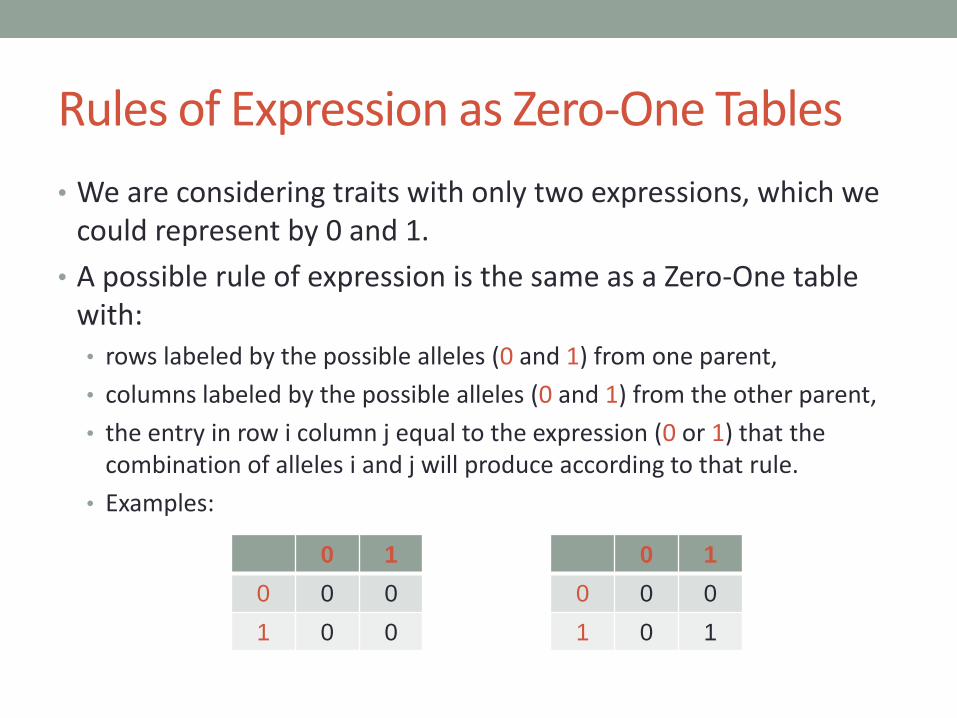
Rules of Expression as Zero-One Tables
• We are considering traits with only two expressions, which we could represent by 0 and 1.
• A possible rule of expression is the same as a Zero-One table with: • rows labeled by the possible alleles (0 and 1) from one parent,
• columns labeled by the possible alleles (0 and 1) from the other parent,
• the entry in row i column j equal to the expression (0 or 1) that the combination of alleles i and j will produce according to that rule.
• Examples:
0 1
0 0 0
1 0 0
0 1
0 0 0
1 0 1
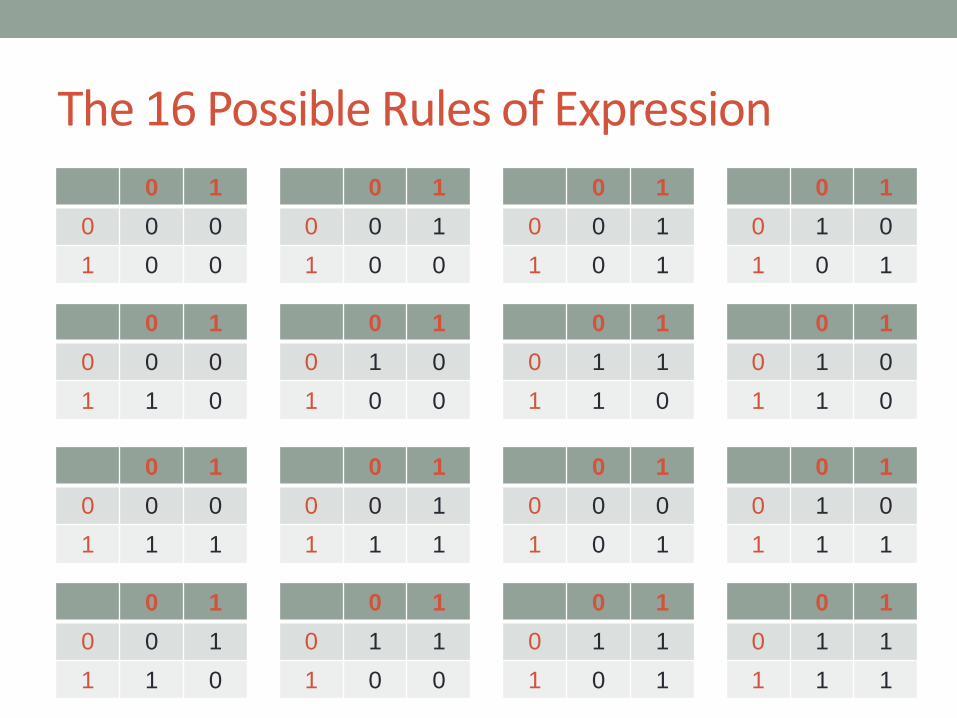
The 16 Possible Rules of Expression
0 1
0 0 0
1 0 0
0 1
0 0 1
1 0 0
0 1
0 0 1
1 0 1
0 1
0 1 1
1 1 0
0 1
0 0 0
1 1 0
0 1
0 1 0
1 0 0
0 1
0 1 0
1 0 1
0 1
0 1 0
1 1 0
0 1
0 0 0
1 1 1
0 1
0 0 1
1 1 0
0 1
0 0 0
1 0 1
0 1
0 1 0
1 1 1
0 1
0 0 1
1 1 1
0 1
0 1 1
1 0 0
0 1
0 1 1
1 0 1
0 1
0 1 1
1 1 1
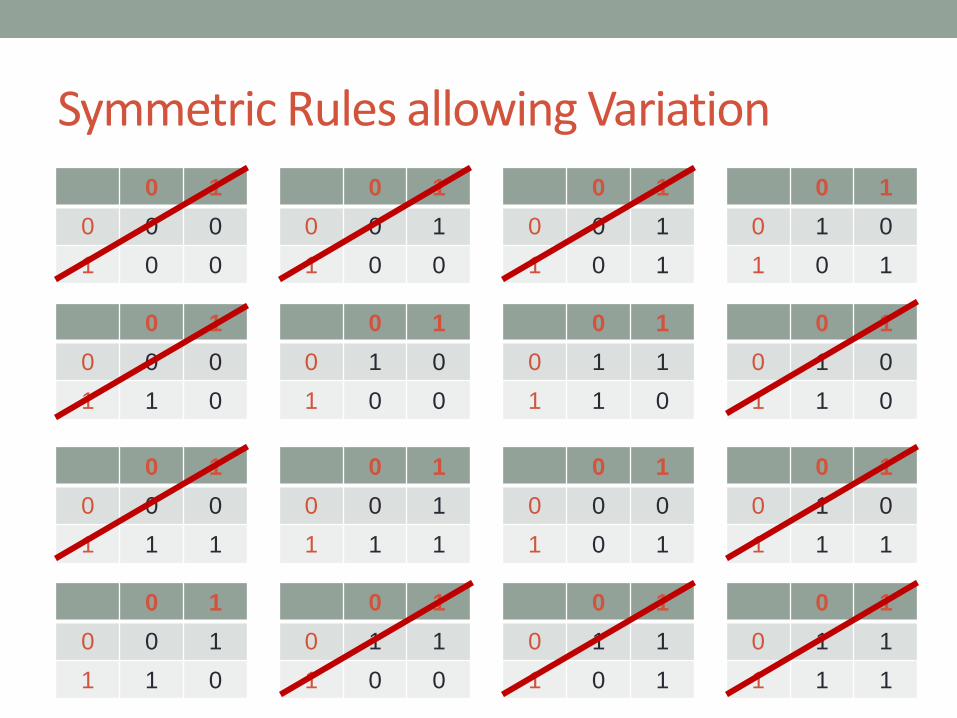
Symmetric Rules allowing Variation
0 1
0 0 0
1 0 0
0 1
0 0 1
1 0 0
0 1
0 0 1
1 0 1
0 1
0 1 1
1 1 0
0 1
0 0 0
1 1 0
0 1
0 1 0
1 0 0
0 1
0 1 0
1 0 1
0 1
0 1 0
1 1 0
0 1
0 0 0
1 1 1
0 1
0 0 1
1 1 0
0 1
0 0 0
1 0 1
0 1
0 1 0
1 1 1
0 1
0 0 1
1 1 1
0 1
0 1 1
1 0 0
0 1
0 1 1
1 0 1
0 1
0 1 1
1 1 1
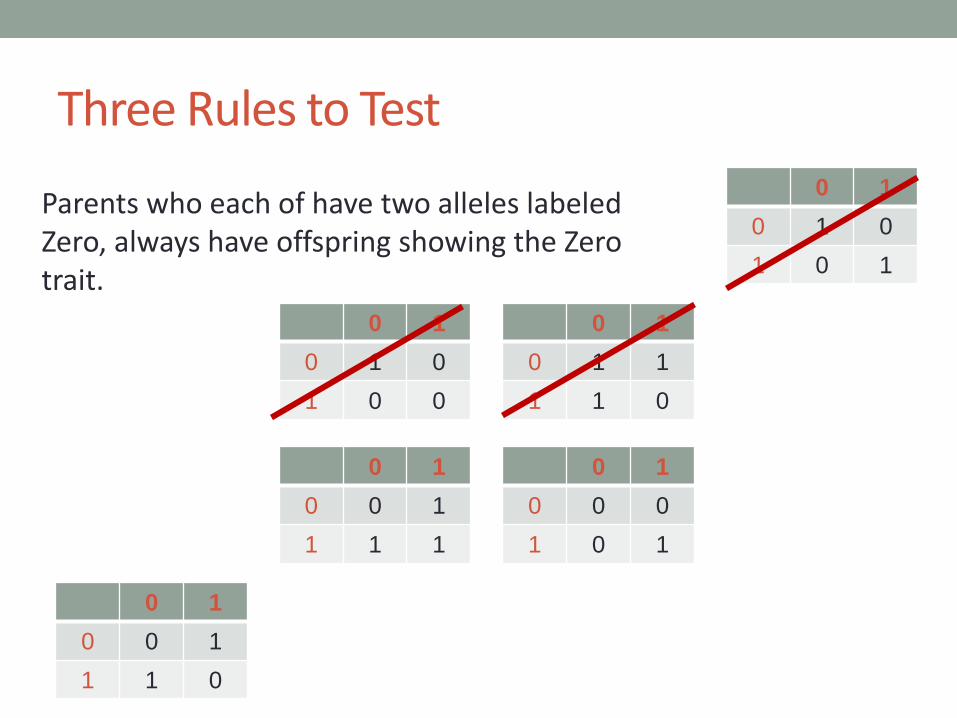
Three Rules to Test
0 1
0 1 1
1 1 0
0 1
0 1 0
1 0 0
0 1
0 1 0
1 0 1
0 1
0 0 1
1 1 0
0 1
0 0 0
1 0 1
0 1
0 0 1
1 1 1
Parents who each of have two alleles labeled Zero, always have offspring showing the Zero trait.
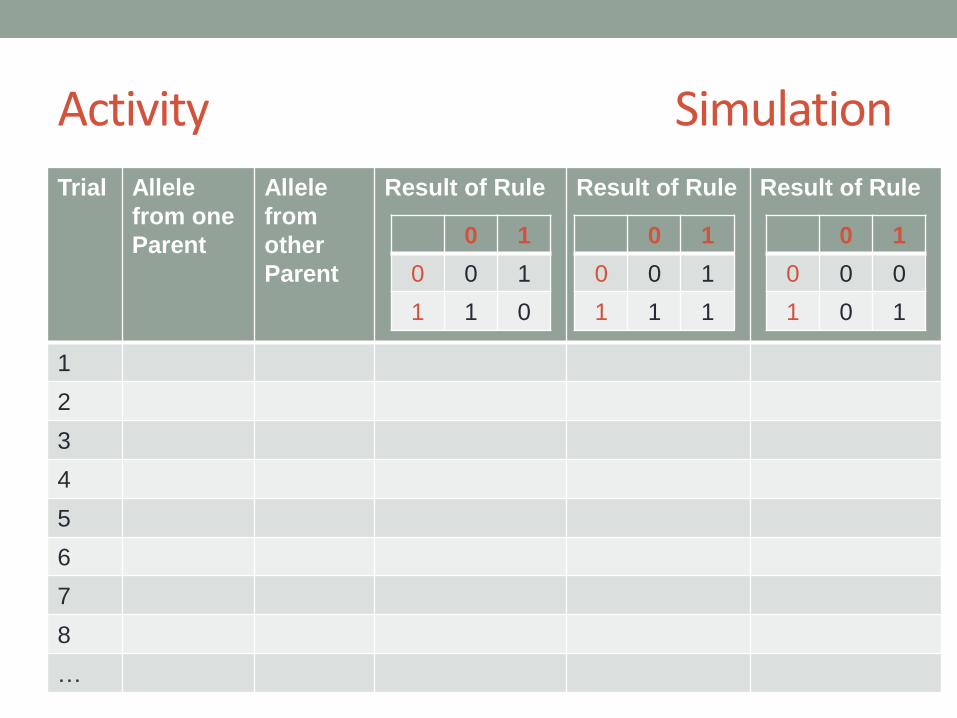
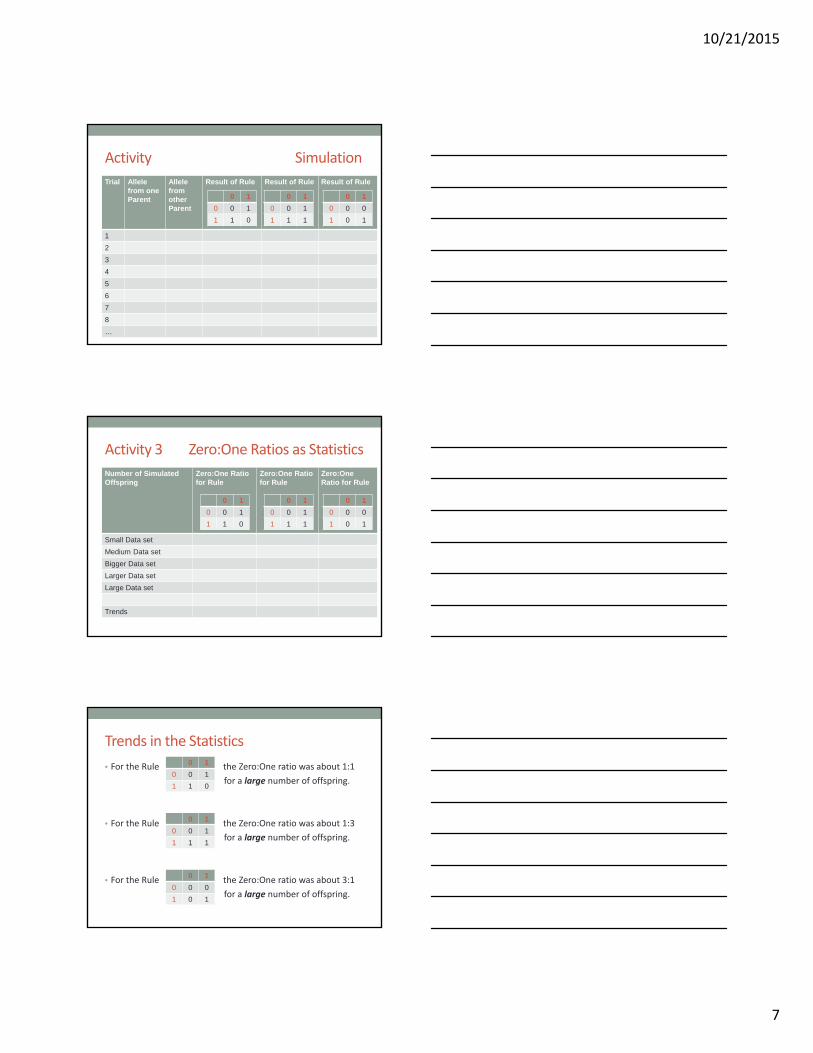
Activity Simulation
Trial Allele
from one
Parent
Allele
from
other
Parent
Result of Rule Result of Rule Result of Rule
1
2
3
4
5
6
7
8
…
0 1
0 0 1
1 1 0
0 1
0 0 1
1 1 1
0 1
0 0 0
1 0 1
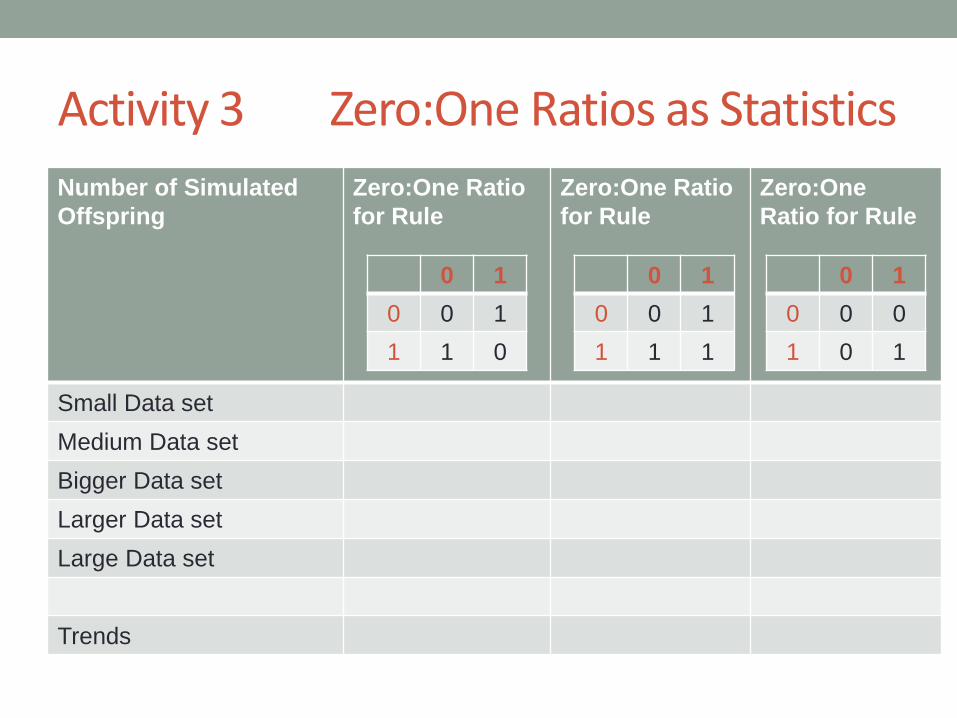
Activity 3 Zero:One Ratios as Statistics
Number of Simulated
Offspring
Zero:One Ratio
for Rule
Zero:One Ratio
for Rule
Zero:One
Ratio for Rule
Small Data set
Medium Data set
Bigger Data set
Larger Data set
Large Data set
Trends
0 1
0 0 1
1 1 0
0 1
0 0 1
1 1 1
0 1
0 0 0
1 0 1
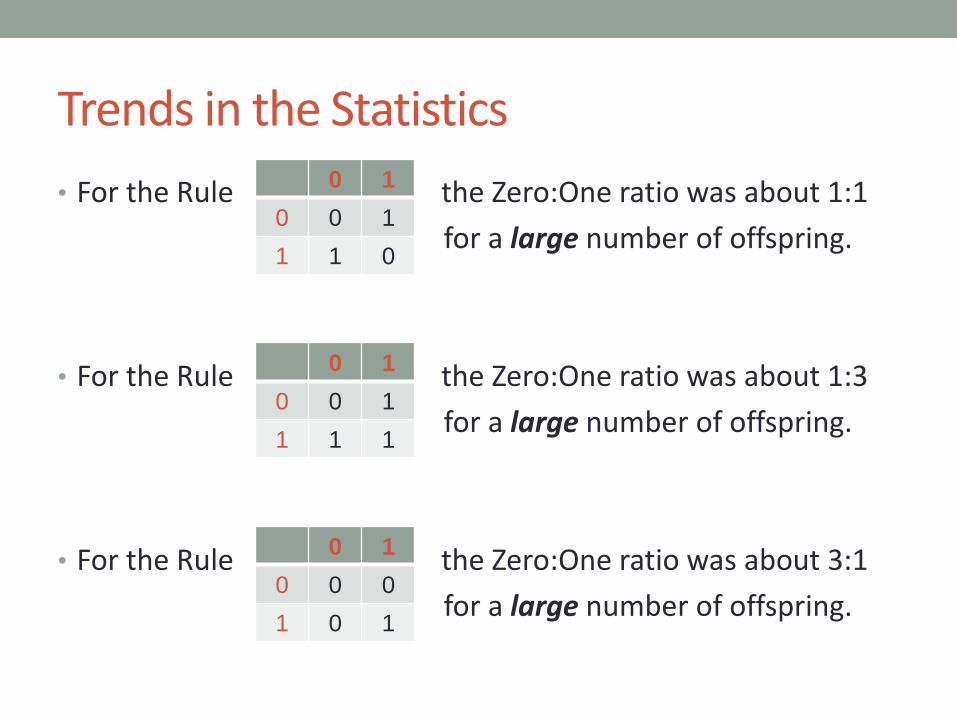
Trends in the Statistics
• For the Rule the Zero:One ratio was about 1:1
for a large number of offspring.
• For the Rule the Zero:One ratio was about 1:3
for a large number of offspring.
• For the Rule the Zero:One ratio was about 3:1
for a large number of offspring.
0 1
0 0 1
1 1 0
0 1
0 0 1
1 1 1
0 1
0 0 0
1 0 1
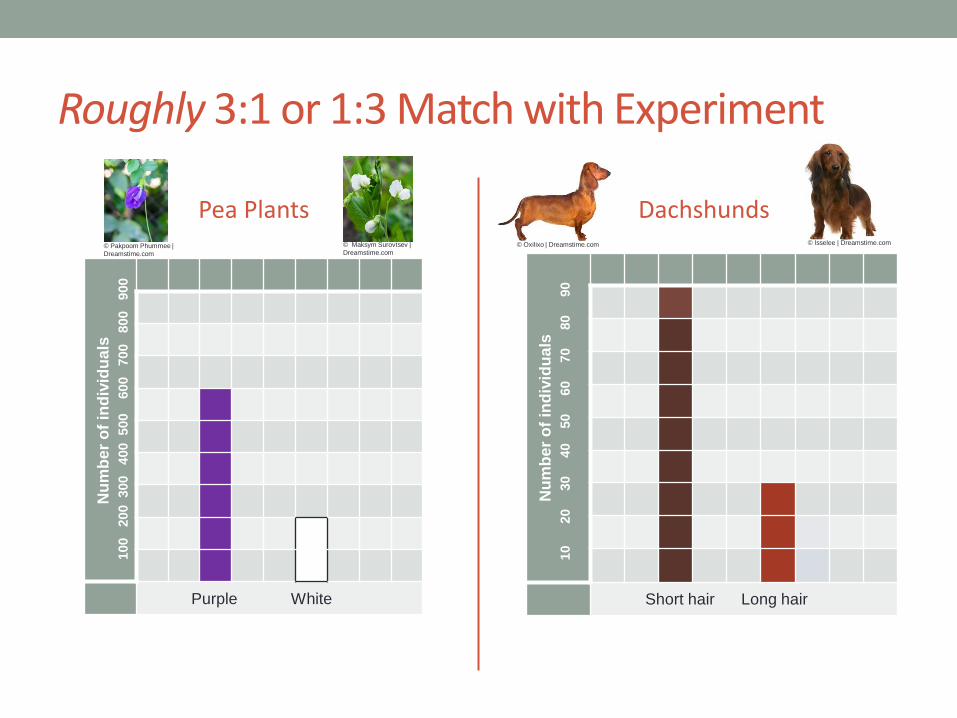
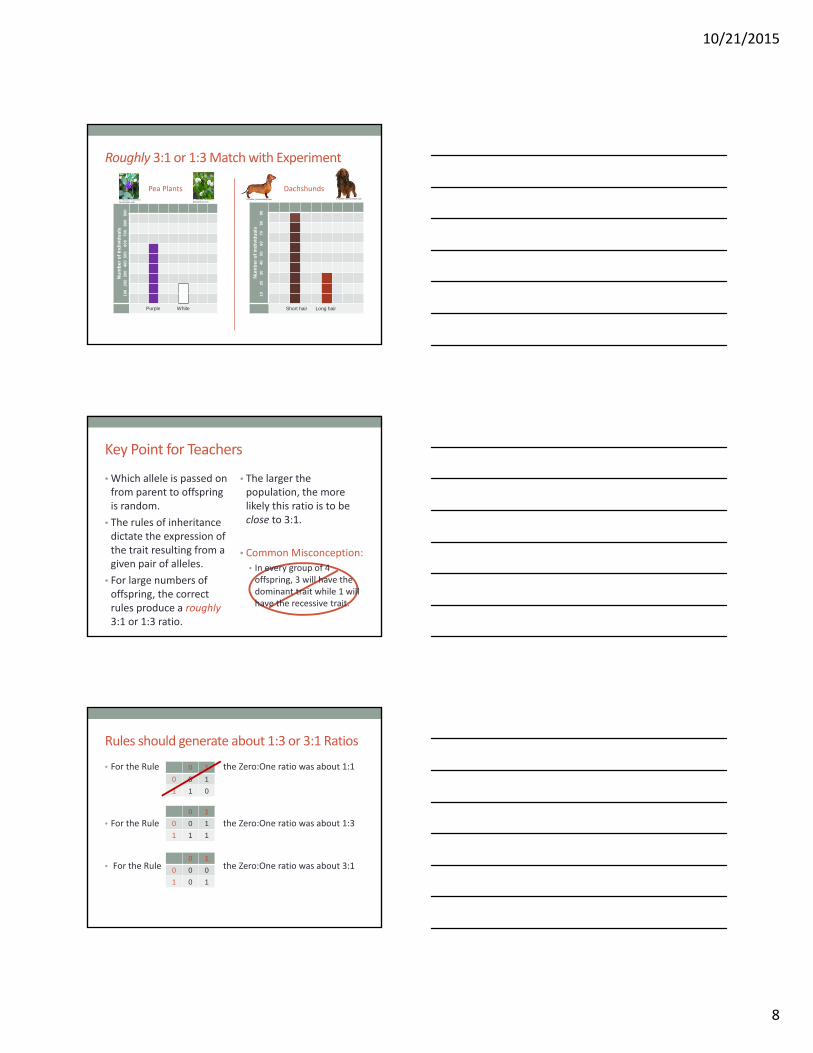
Roughly 3:1 or 1:3 Match with Experiment
Pea Plants
Nu
mb
er
of
ind
ivid
ua
ls
100 2
00 300 4
00 500 600 7
00 8
00 9
00
Purple White
Dachshunds
Nu
mb
er
of
ind
ivid
ua
ls
10 20 3
0 4
0 50 6
0 7
0 8
0 9
0
Short hair Long hair
© Pakpoom Phummee |
Dreamstime.com
© Maksym Surovtsev |
Dreamstime.com
© Oxilixo | Dreamstime.com © Isselee | Dreamstime.com
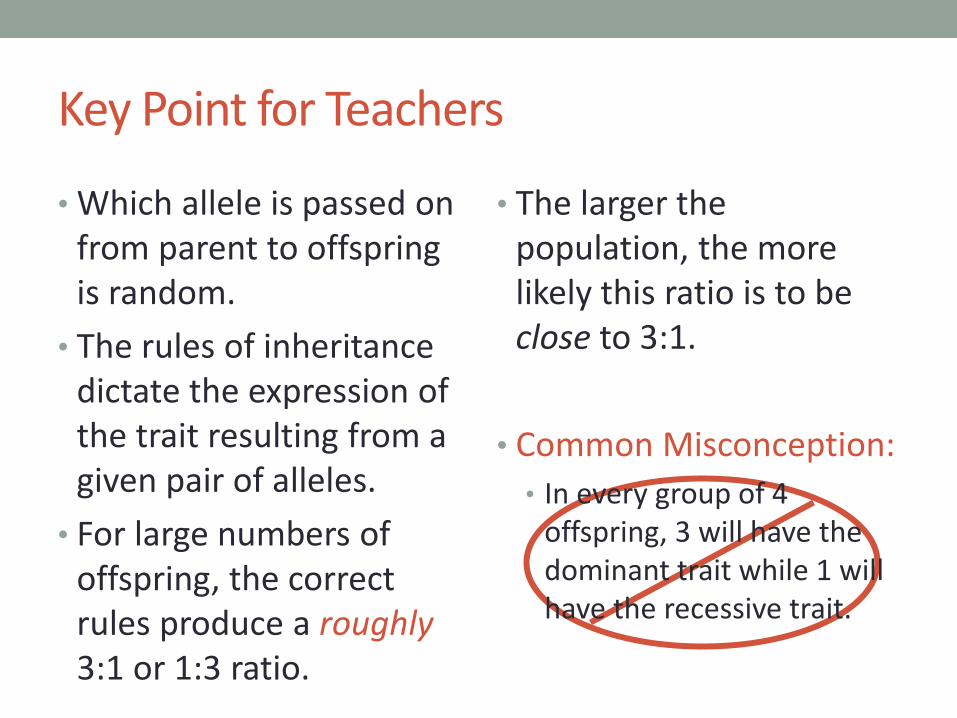
Key Point for Teachers
• Which allele is passed on from parent to offspring is random.
• The rules of inheritance dictate the expression of the trait resulting from a given pair of alleles.
• For large numbers of offspring, the correct rules produce a roughly 3:1 or 1:3 ratio.
• The larger the population, the more likely this ratio is to be close to 3:1.
• Common Misconception:
• In every group of 4 offspring, 3 will have the dominant trait while 1 will have the recessive trait.

Rules should generate about 1:3 or 3:1 Ratios
• For the Rule the Zero:One ratio was about 1:1
• For the Rule the Zero:One ratio was about 1:3
• For the Rule the Zero:One ratio was about 3:1
0 1
0 0 1
1 1 0
0 1
0 0 1
1 1 1
0 1
0 0 0
1 0 1
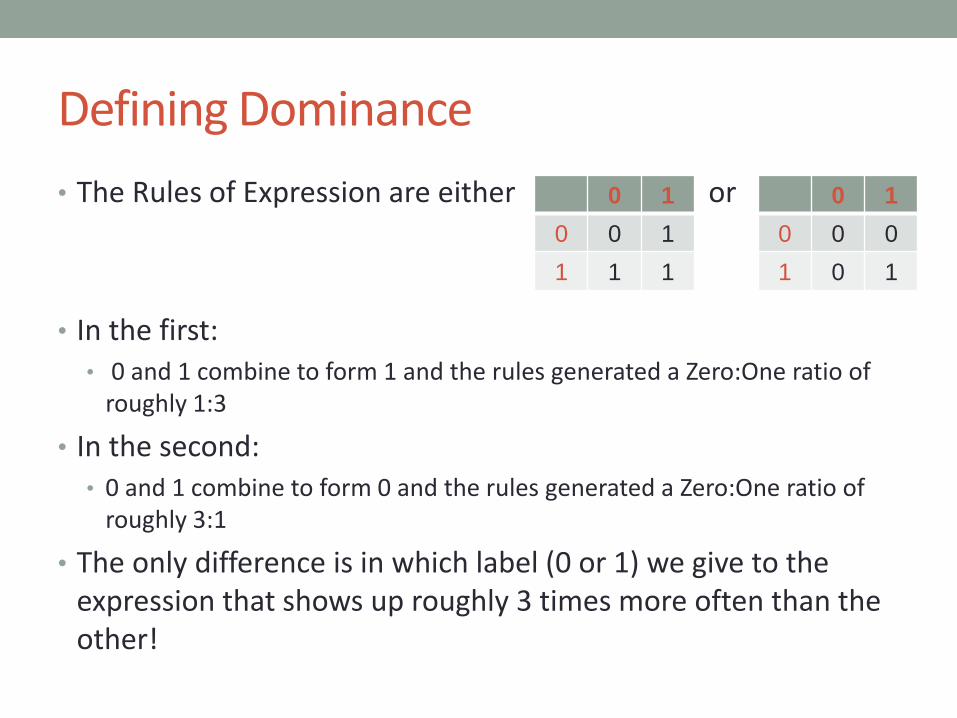
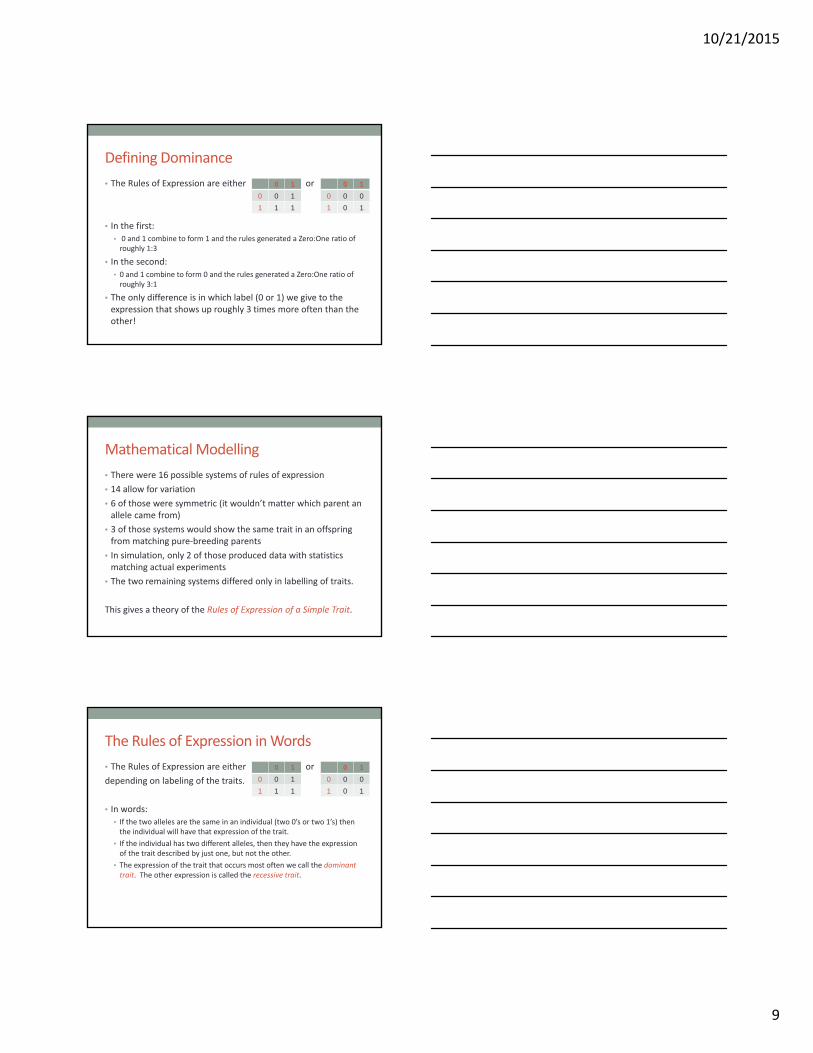
Defining Dominance
• The Rules of Expression are either or
• In the first: • 0 and 1 combine to form 1 and the rules generated a Zero:One ratio of
roughly 1:3
• In the second: • 0 and 1 combine to form 0 and the rules generated a Zero:One ratio of
roughly 3:1
• The only difference is in which label (0 or 1) we give to the expression that shows up roughly 3 times more often than the other!
0 1
0 0 1
1 1 1
0 1
0 0 0
1 0 1

Mathematical Modelling
• There were 16 possible systems of rules of expression
• 14 allow for variation
• 6 of those were symmetric (it wouldn’t matter which parent an allele came from)
• 3 of those systems would show the same trait in an offspring from matching pure-breeding parents
• In simulation, only 2 of those produced data with statistics matching actual experiments
• The two remaining systems differed only in labelling of traits.
This gives a theory of the Rules of Expression of a Simple Trait.
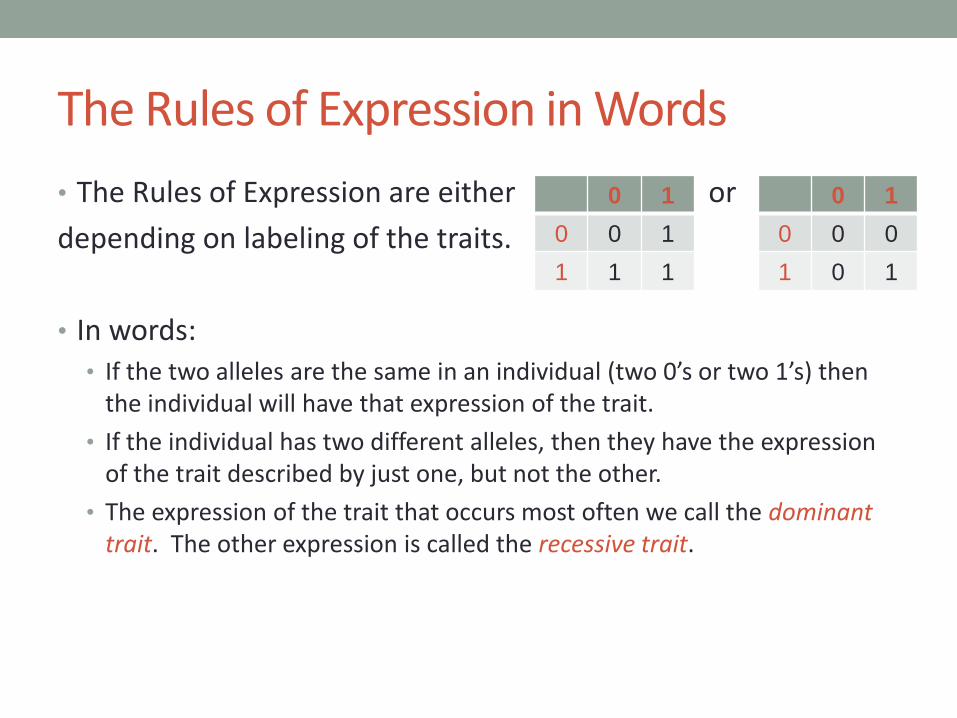
The Rules of Expression in Words
• The Rules of Expression are either or
depending on labeling of the traits.
• In words: • If the two alleles are the same in an individual (two 0’s or two 1’s) then
the individual will have that expression of the trait.
• If the individual has two different alleles, then they have the expression of the trait described by just one, but not the other.
• The expression of the trait that occurs most often we call the dominant trait. The other expression is called the recessive trait.
0 1
0 0 1
1 1 1
0 1
0 0 0
1 0 1
Reflect
Lesson Focus Question (for students)
• How could offspring have a trait that their parents don’t have?
Session Focus Question (for teachers)
• How can we use modelling and statistics to figure out the rules of expression for simply inherited traits?
QUESTIONS?
10/21/2015
1
INTEGRATING GENETICS AND STATISTICS TO ADDRESS NGSS AND CCSS FOR MATHEMATICS
Activities for students and teachers from the 6th grade genetics module, incorporating statistics, from RESPeCT.
Arlo Caine, Professor, Cal Poly Pomona10:50am-12:05pm Oct. 30, 2015
Outline
1. Highlights of the RESPeCT program
a) Activities for students as learners
b) Activities for teachers as learners
2. NGSS and CCSS Mathematics challenges for 6th grade
3. Student Activity: “Duckos” simulation and data analysis
4. Teacher Activity: Determining Mendel’s rules of inheritance
through mathematical modelling and simulation.
5. Questions and Discussion
RESPeCT
• Reinvigorating Elementary Science through a Partnership with California Teachers
• 5 year NSF Math Science Partnership grant • Cal Poly Pomona <‐‐> Pomona Unified School District
• Supporting partner: BSCS (Biological Sciences Curriculum Study)
• Leadership Team: • Nicole Wickler (PI, CPP)
• Paul Beardsley (Co‐PI, CPP)
• Arlo Caine (Co‐PI, CPP)
• Kathy Roth (Co‐PI, BSCS/CPP)
• Stephanie Baker (Co‐PI, PUSD)
10/21/2015
2
RESPeCT
• Combines:
• STeLLA Professional Development program
• With a Master Teacher model
• Creates: Sustainable PD program for K‐6 teachers in PUSD
• Scientists + Science Educators develop PUSD Teacher Leaders
• 3 year cycle for Teacher Leaders
• Year 1: Two week Teacher SI. 6 half‐day study groups over AY
• Year 2: Two week Leader SI. 4 half‐day study groups over AY
• Year 3: Pairs of TLs replicate two week SI with peers. Lead 6 SGs over AY.
• 1st cohort: Grades 4‐6, 2nd cohort: Grades K‐3
• PUSD will continue program beyond the life of grant.
Curriculum for Students and Teachers
• Curriculum for Students
• Two modules of 5‐6 lessons per grade level
• Driven by activities designed to make student thinking visible
• NGSS topics chosen for 6th grade were:
1. Genetics
2. Sun’s Effect on Climate
• Backwards design from student learning goals
• Integrated Math and ELA to help teachers “make time for science”
• Curriculum for Teachers• STeLLA pedagogical strategies through lesson analysis study groups
• Science and math through content deepening sessions with faculty
• Driven by activities designed to make teacher thinking visible
• Backwards design from teacher learning goals
NGSS Alignment for Genetics Module
NGSS Performance expectation:
• Develop and use a model to describe why asexual reproduction results in offspring with identical genetic information and sexual reproduction results in offspring with genetic variation.
Genetics Lesson 4 Main Learning Goal:
• During reproduction, parents’ chromosomes (and the copies of genes situated on those chromosomes) are randomly separated and recombined in their offspring. If both parents have a recessive and a dominant allele, they will show the dominant trait. If recessive alleles are paired, the offspring will show the recessive trait even though their parents do not.
10/21/2015
3
CCSS Math integration
MP.4 Model with mathematics. (MS‐LS3‐2)
6.SP.2 Understand that a set of data collected to answer a statistical question has a distribution which can be described byits center, spread, and overall shape. (MS‐LS1‐4),(MS‐LS1‐5)
6.SP.4 Display numerical data in plots on a number line, including dot plots, histograms, and box plots. (MS‐LS1‐4),(MS‐LS1‐5)
6.SP.5.a‐d Summarize numerical data sets in relation to their context. (MS‐LS3‐2)
CCSS Math Challenges for Grade 6 & beyond
Lesson 4 Activity Setup
Science Content Storyline
• Genes provide instructions for a trait. Different forms of a particular gene are called alleles. Alleles provide instructions for different variations of a trait. Organisms that reproduce sexually have two alleles for each gene, one allele from their mother and the other from their father. Just like traits, alleles can be described as dominant or recessive.
Lesson Focus Question
• How could offspring have a trait that their parents don’t have?
10/21/2015
4
Generation 1
Generation 2
Generation 1
Generation 2
© Isselee | Dreamstime.com© Oxilixo | Dreamstime.com
Corel Corel Corel
Corel
© Pakpoom Phummee | Dreamstime.com
© Maksym Surovtsev | Dreamstime.com
Baby “Duckos”
Can we follow the genes and see how they result in the traits we see in
offspring?
Ducko Data Analysis
Results from Table Red Billed Orange Billed
1
2
3
4
…
Totals
10/21/2015
5
Generation 2 Traits in Other Organisms
Pea Plants
Nu
mb
er o
f in
div
idu
als
100
20
0 3
00
400
50
0
600
70
0
800
900
Purple White
Dachshunds
Nu
mb
er o
f in
div
idu
als
10
2
0
30
4
0
50
60
70
8
0
90
Short hair Long hair
Math Content Deepening for Teachers
Main Learning Goals
• Mendel’s rules of expression for simply inherited traits can be reasoned through the process of mathematical modeling, using simulation, statistics, and comparison with experimental results.
• For simply inherited traits, one should only expect to see an approximately 3:1 ratio of dominant to recessive expressions of the trait in large numbers of offspring.
Session Focus Question
• How can we use modelling and statistics to figure out the rules of expression for simply inherited traits?
Rules of Expression as Zero‐One Tables
• We are considering traits with only two expressions, which we could represent by 0 and 1.
• A possible rule of expression is the same as a Zero‐One table with: • rows labeled by the possible alleles (0 and 1) from one parent,
• columns labeled by the possible alleles (0 and 1) from the other parent,
• the entry in row i column j equal to the expression (0 or 1) that the combination of alleles i and j will produce according to that rule.
• Examples:
0 1
0 0 0
1 0 0
0 1
0 0 0
1 0 1

10/21/2015
6
The 16 Possible Rules of Expression
0 1
0 0 0
1 0 0
0 1
0 0 1
1 0 0
0 1
0 0 1
1 0 1
0 1
0 1 1
1 1 0
0 1
0 0 0
1 1 0
0 1
0 1 0
1 0 0
0 1
0 1 0
1 0 1
0 1
0 1 0
1 1 0
0 1
0 0 0
1 1 1
0 1
0 0 1
1 1 0
0 1
0 0 0
1 0 1
0 1
0 1 0
1 1 1
0 1
0 0 1
1 1 1
0 1
0 1 1
1 0 0
0 1
0 1 1
1 0 1
0 1
0 1 1
1 1 1
Symmetric Rules allowing Variation
0 1
0 0 0
1 0 0
0 1
0 0 1
1 0 0
0 1
0 0 1
1 0 1
0 1
0 1 1
1 1 0
0 1
0 0 0
1 1 0
0 1
0 1 0
1 0 0
0 1
0 1 0
1 0 1
0 1
0 1 0
1 1 0
0 1
0 0 0
1 1 1
0 1
0 0 1
1 1 0
0 1
0 0 0
1 0 1
0 1
0 1 0
1 1 1
0 1
0 0 1
1 1 1
0 1
0 1 1
1 0 0
0 1
0 1 1
1 0 1
0 1
0 1 1
1 1 1
Three Rules to Test
0 1
0 1 1
1 1 0
0 1
0 1 0
1 0 0
0 1
0 1 0
1 0 1
0 1
0 0 1
1 1 0
0 1
0 0 0
1 0 1
0 1
0 0 1
1 1 1
Parents who each of have two alleles labeled Zero, always have offspring showing the Zero trait.
10/21/2015
7
Activity Simulation
Trial Allele from one Parent
Allelefrom other Parent
Result of Rule Result of Rule Result of Rule
1
2
3
4
5
6
7
8
…
0 1
0 0 1
1 1 0
0 1
0 0 1
1 1 1
0 1
0 0 0
1 0 1
Activity 3 Zero:One Ratios as Statistics
Number of Simulated Offspring
Zero:One Ratio for Rule
Zero:One Ratio for Rule
Zero:OneRatio for Rule
Small Data set
Medium Data set
Bigger Data set
Larger Data set
Large Data set
Trends
0 1
0 0 1
1 1 0
0 1
0 0 1
1 1 1
0 1
0 0 0
1 0 1
Trends in the Statistics
• For the Rule the Zero:One ratio was about 1:1
for a large number of offspring.
• For the Rule the Zero:One ratio was about 1:3
for a large number of offspring.
• For the Rule the Zero:One ratio was about 3:1
for a large number of offspring.
0 1
0 0 1
1 1 0
0 1
0 0 1
1 1 1
0 1
0 0 0
1 0 1
10/21/2015
8
Roughly 3:1 or 1:3 Match with Experiment
Pea Plants
Nu
mb
er o
f in
div
idu
als
100
20
0 3
00
400
50
0
600
70
0
800
900
Purple White
Dachshunds
Nu
mb
er o
f in
div
idu
als
10
2
0
30
4
0
50
60
70
8
0
90
Short hair Long hair
© Pakpoom Phummee | Dreamstime.com
© Maksym Surovtsev | Dreamstime.com
© Oxilixo | Dreamstime.com © Isselee | Dreamstime.com
Key Point for Teachers
• Which allele is passed on from parent to offspring is random.
• The rules of inheritance dictate the expression of the trait resulting from a given pair of alleles.
• For large numbers of offspring, the correct rules produce a roughly3:1 or 1:3 ratio.
• The larger the population, the more likely this ratio is to be close to 3:1.
• Common Misconception:
• In every group of 4 offspring, 3 will have the dominant trait while 1 will have the recessive trait.
Rules should generate about 1:3 or 3:1 Ratios
• For the Rule the Zero:One ratio was about 1:1
• For the Rule the Zero:One ratio was about 1:3
• For the Rule the Zero:One ratio was about 3:1
0 1
0 0 1
1 1 0
0 1
0 0 1
1 1 1
0 1
0 0 0
1 0 1
10/21/2015
9
Defining Dominance
• The Rules of Expression are either or
• In the first:
• 0 and 1 combine to form 1 and the rules generated a Zero:One ratio of roughly 1:3
• In the second:
• 0 and 1 combine to form 0 and the rules generated a Zero:One ratio of roughly 3:1
• The only difference is in which label (0 or 1) we give to the expression that shows up roughly 3 times more often than the other!
0 1
0 0 1
1 1 1
0 1
0 0 0
1 0 1
Mathematical Modelling
• There were 16 possible systems of rules of expression
• 14 allow for variation
• 6 of those were symmetric (it wouldn’t matter which parent an allele came from)
• 3 of those systems would show the same trait in an offspring from matching pure‐breeding parents
• In simulation, only 2 of those produced data with statistics matching actual experiments
• The two remaining systems differed only in labelling of traits.
This gives a theory of the Rules of Expression of a Simple Trait.
The Rules of Expression in Words
• The Rules of Expression are either or
depending on labeling of the traits.
• In words:
• If the two alleles are the same in an individual (two 0’s or two 1’s) then the individual will have that expression of the trait.
• If the individual has two different alleles, then they have the expression of the trait described by just one, but not the other.
• The expression of the trait that occurs most often we call the dominant trait. The other expression is called the recessive trait.
0 1
0 0 1
1 1 1
0 1
0 0 0
1 0 1
10/21/2015
10
Reflect
Lesson Focus Question (for students)
• How could offspring have a trait that their parents don’t have?
Session Focus Question (for teachers)
• How can we use modelling and statistics to figure out the rules of expression for simply inherited traits?
QUESTIONS?
Related Documents