C40 London Hyperlocal Air Quality Monitoring Project GOOGLE STREET VIEW CARS INSTRUMENTATION OPERATING PROCEDURE PREPARED BY JULY 2018

Welcome message from author
This document is posted to help you gain knowledge. Please leave a comment to let me know what you think about it! Share it to your friends and learn new things together.
Transcript

C40 London Hyperlocal Air Quality Monitoring Project
GOOGLE STREET VIEW CARS
INSTRUMENTATION OPERATING PROCEDURE
PREPARED BY
JULY 2018
1
Introduction
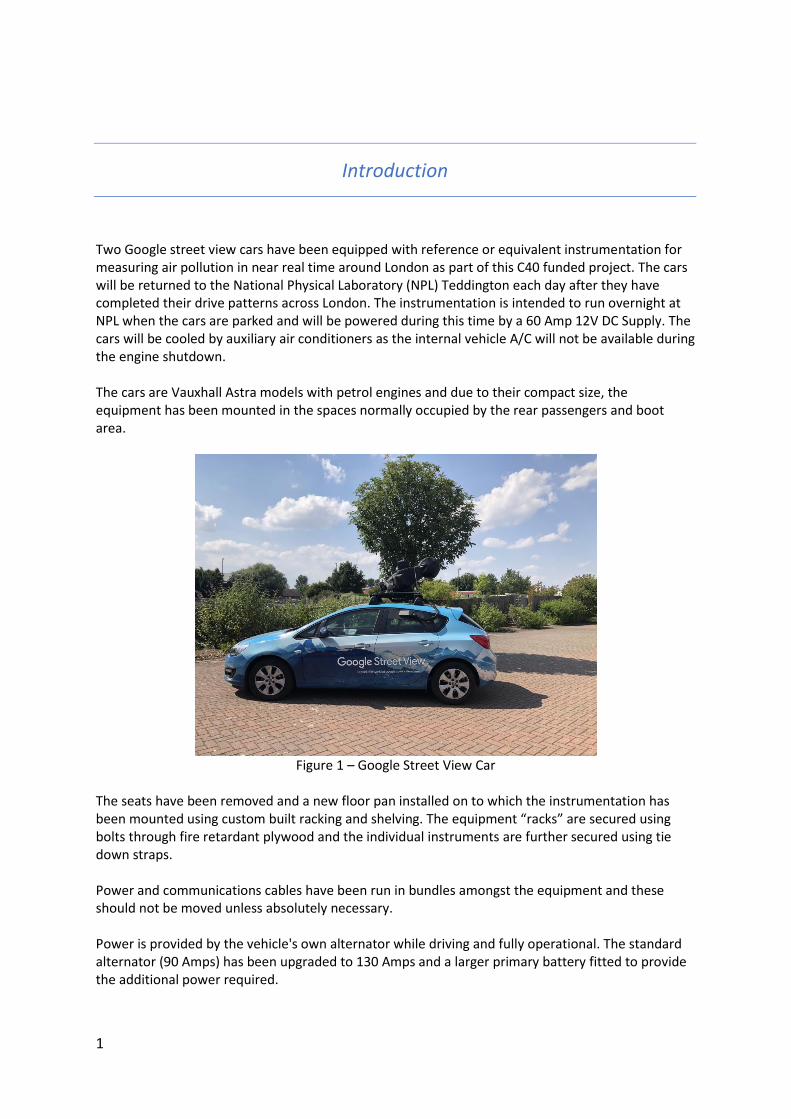
Two Google street view cars have been equipped with reference or equivalent instrumentation for measuring air pollution in near real time around London as part of this C40 funded project. The cars will be returned to the National Physical Laboratory (NPL) Teddington each day after they have completed their drive patterns across London. The instrumentation is intended to run overnight at NPL when the cars are parked and will be powered during this time by a 60 Amp 12V DC Supply. The cars will be cooled by auxiliary air conditioners as the internal vehicle A/C will not be available during the engine shutdown. The cars are Vauxhall Astra models with petrol engines and due to their compact size, the equipment has been mounted in the spaces normally occupied by the rear passengers and boot area.
Figure 1 – Google Street View Car
The seats have been removed and a new floor pan installed on to which the instrumentation has been mounted using custom built racking and shelving. The equipment “racks” are secured using bolts through fire retardant plywood and the individual instruments are further secured using tie down straps. Power and communications cables have been run in bundles amongst the equipment and these should not be moved unless absolutely necessary. Power is provided by the vehicle's own alternator while driving and fully operational. The standard alternator (90 Amps) has been upgraded to 130 Amps and a larger primary battery fitted to provide the additional power required.
2
During driver breaks or periods where the car engine is not running for short periods the instruments will be powered by an auxiliary battery located near the rear passenger’s door. This battery has the capacity to run the instruments for up to 1 to 1.5 hours and should be recharged overnight at NPL if depleted during the day. While parked at NPL the cars will be powered by regulated 12v DC power supplies, which will be located within the cabinet adjacent to the parking bays. A plug and socket arrangement will be provided to facilitate a smooth changeover of power and the cars have been equipped with circuitry to prevent loss of power between these transitions. The site cabinet at NPL will be located adjacent to the two car parking bays and will contain the power supplies for the DC and battery charging supplies, the air conditioning system and associated ducting, calibration gases complete with regulators, tubing with connectors, zero air kit and consumable items used by the instrumentation. The cabinet will be locked, with keys made available to the drivers and NPL personnel as required.
Maintenance Routines for NPL & AM Personnel
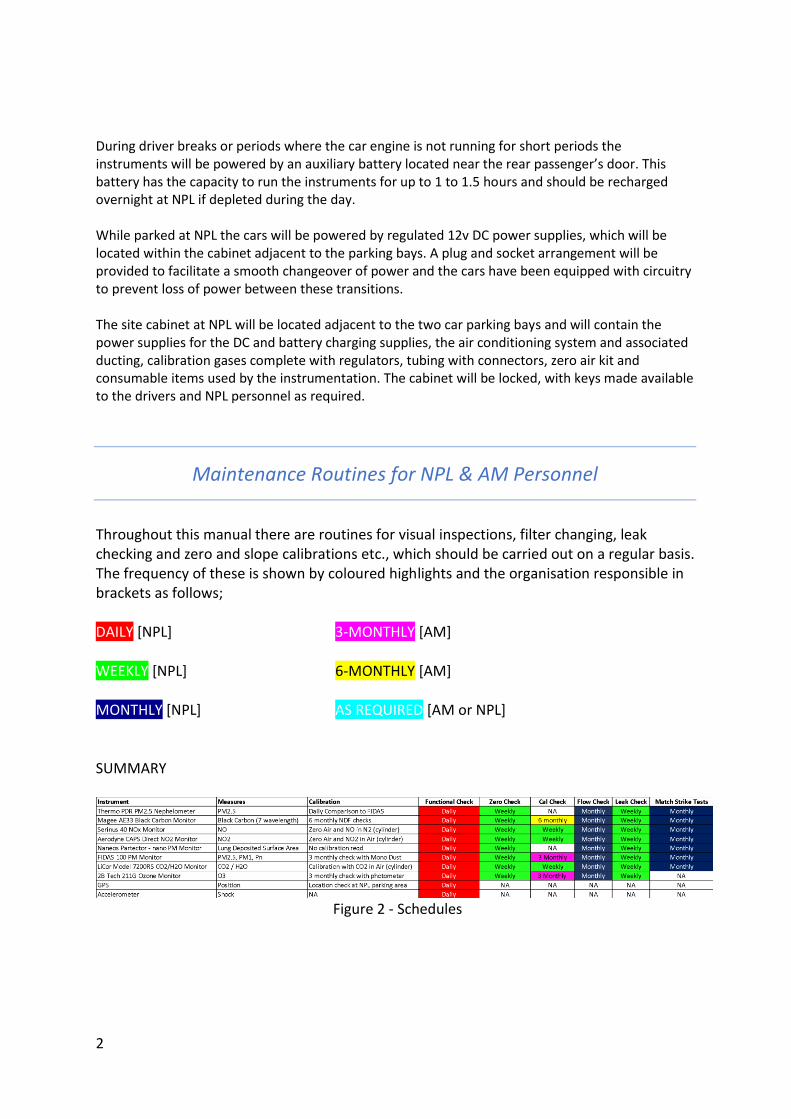
Throughout this manual there are routines for visual inspections, filter changing, leak checking and zero and slope calibrations etc., which should be carried out on a regular basis. The frequency of these is shown by coloured highlights and the organisation responsible in brackets as follows; DAILY [NPL] 3-MONTHLY [AM] WEEKLY [NPL] 6-MONTHLY [AM] MONTHLY [NPL] AS REQUIRED [AM or NPL] SUMMARY
Figure 2 - Schedules
3
Instrumentation Inventory, Layout, Power & Fluidics
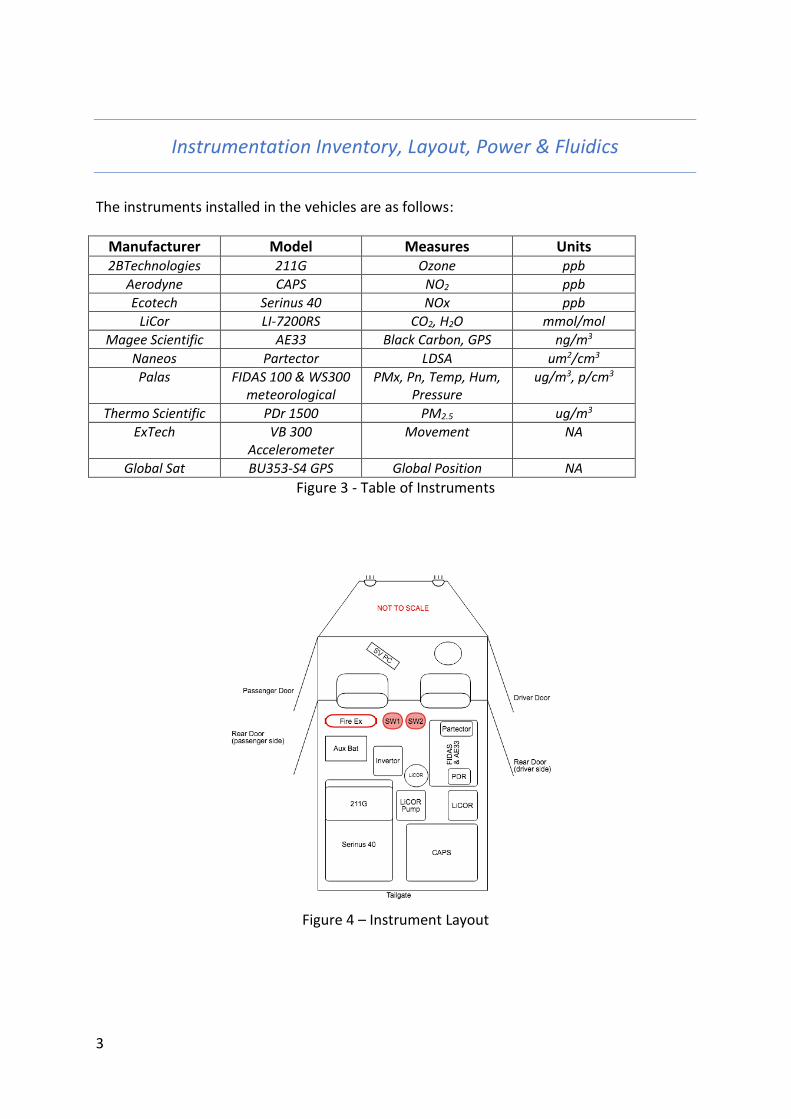
The instruments installed in the vehicles are as follows:
Manufacturer Model Measures Units 2BTechnologies 211G Ozone ppb
Aerodyne CAPS NO2 ppb
Ecotech Serinus 40 NOx ppb
LiCor LI-7200RS CO2, H2O mmol/mol
Magee Scientific AE33 Black Carbon, GPS ng/m3
Naneos Partector LDSA um2/cm3
Palas FIDAS 100 & WS300 meteorological
PMx, Pn, Temp, Hum, Pressure
ug/m3, p/cm3
Thermo Scientific PDr 1500 PM2.5 ug/m3
ExTech VB 300 Accelerometer
Movement NA
Global Sat BU353-S4 GPS Global Position NA
Figure 3 - Table of Instruments
Figure 4 – Instrument Layout
4
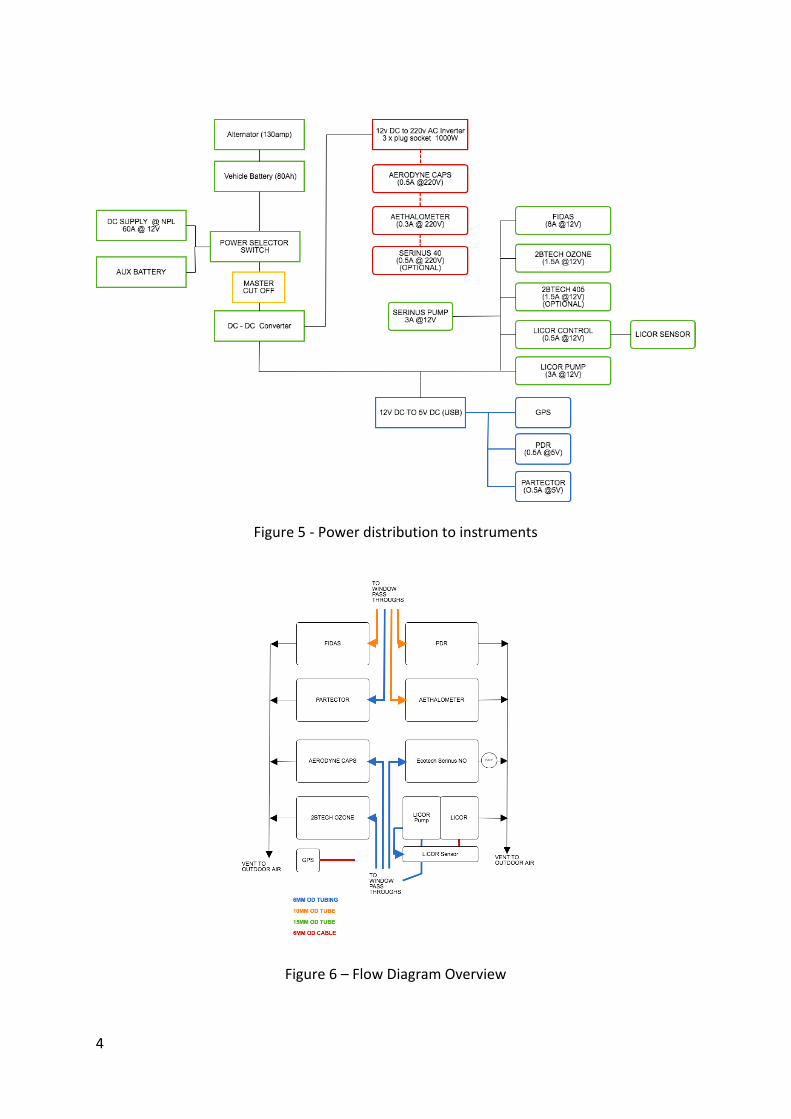
Figure 5 - Power distribution to instruments
Figure 6 – Flow Diagram Overview
5
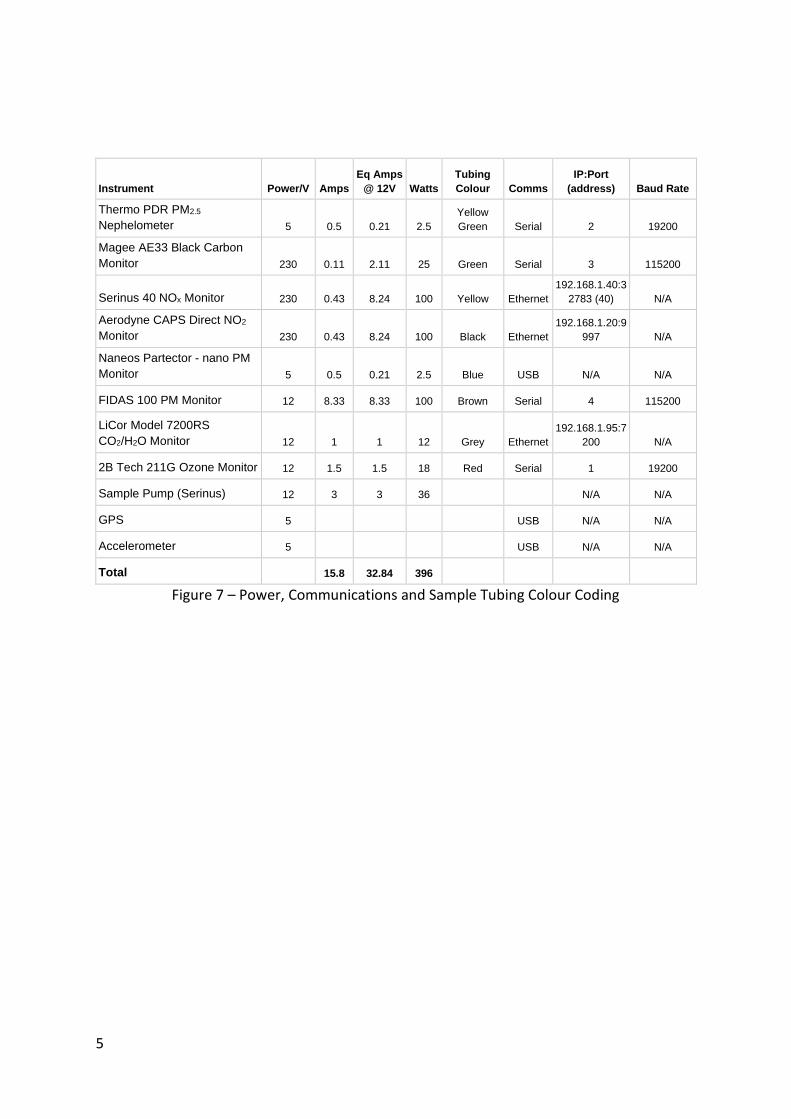
Instrument Power/V Amps
Eq Amps
@ 12V Watts
Tubing
Colour Comms
IP:Port
(address) Baud Rate
Thermo PDR PM2.5
Nephelometer 5 0.5 0.21 2.5
Yellow
Green Serial 2 19200
Magee AE33 Black Carbon
Monitor 230 0.11 2.11 25 Green Serial 3 115200
Serinus 40 NOx Monitor 230 0.43 8.24 100 Yellow Ethernet
192.168.1.40:3
2783 (40) N/A
Aerodyne CAPS Direct NO2
Monitor 230 0.43 8.24 100 Black Ethernet
192.168.1.20:9
997 N/A
Naneos Partector - nano PM
Monitor 5 0.5 0.21 2.5 Blue USB N/A N/A
FIDAS 100 PM Monitor 12 8.33 8.33 100 Brown Serial 4 115200
LiCor Model 7200RS
CO2/H2O Monitor 12 1 1 12 Grey Ethernet
192.168.1.95:7
200 N/A
2B Tech 211G Ozone Monitor 12 1.5 1.5 18 Red Serial 1 19200
Sample Pump (Serinus) 12 3 3 36 N/A N/A
GPS 5 USB N/A N/A
Accelerometer 5 USB N/A N/A
Total 15.8 32.84 396
Figure 7 – Power, Communications and Sample Tubing Colour Coding
6
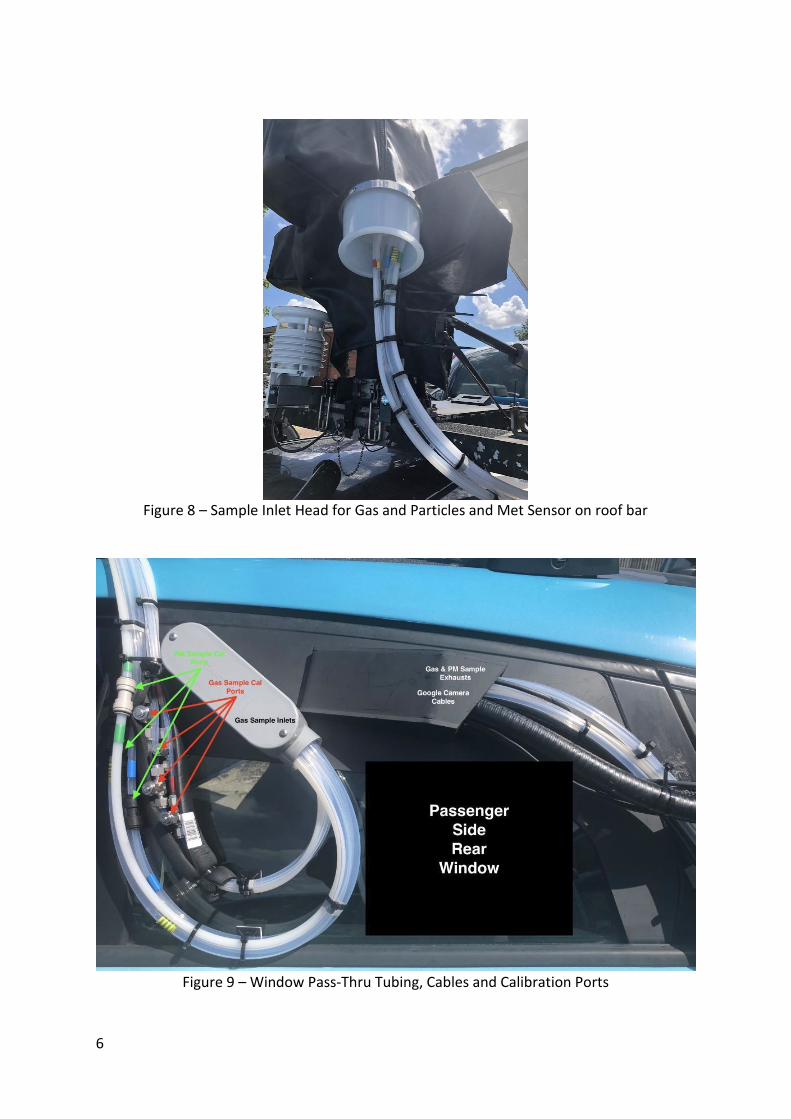
Figure 8 – Sample Inlet Head for Gas and Particles and Met Sensor on roof bar
Figure 9 – Window Pass-Thru Tubing, Cables and Calibration Ports
7
DAILY SYSTEM CHECKLIST
1. These general checks should be done either before or after each drive on a daily basis. Please refer to later sections of this manual for specific instrumentation checks which should be carried out according to the schedules.
2. Visually check each instrument to ensure they are running and showing normal screens. (See later in this manual).
3. Ensure data PC is running and all data channels are showing green on GUI. This can be done by NPL by temporarily connecting the ACER Windows PC (provided) to the Ethernet port at the rear of the car and opening the GUI in a browser. (See data logging system manual for instructions.) Google drivers can access this same page via the Jibox.
4. Check sample lines for visible signs of moisture / water, which if present will tend to pool at the bottom of the bend in Figure 9, if present, disconnect tubing at ‘T’ or at inline connector and blow out lines from the filter holders back to the ‘T’ or inline connector.
5. Check inlet cap and exhaust lines for blockages or debris and remove as necessary.
Individual Instruments - SOP
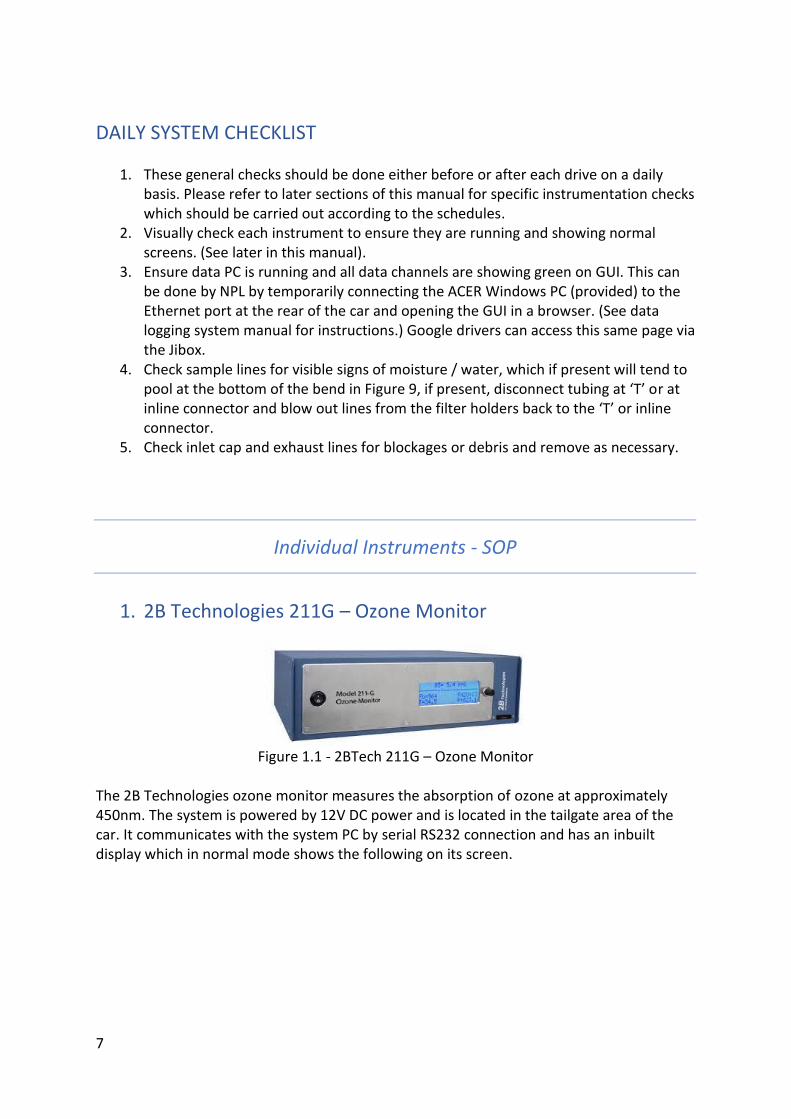
1. 2B Technologies 211G – Ozone Monitor
Figure 1.1 - 2BTech 211G – Ozone Monitor
The 2B Technologies ozone monitor measures the absorption of ozone at approximately 450nm. The system is powered by 12V DC power and is located in the tailgate area of the car. It communicates with the system PC by serial RS232 connection and has an inbuilt display which in normal mode shows the following on its screen.
8
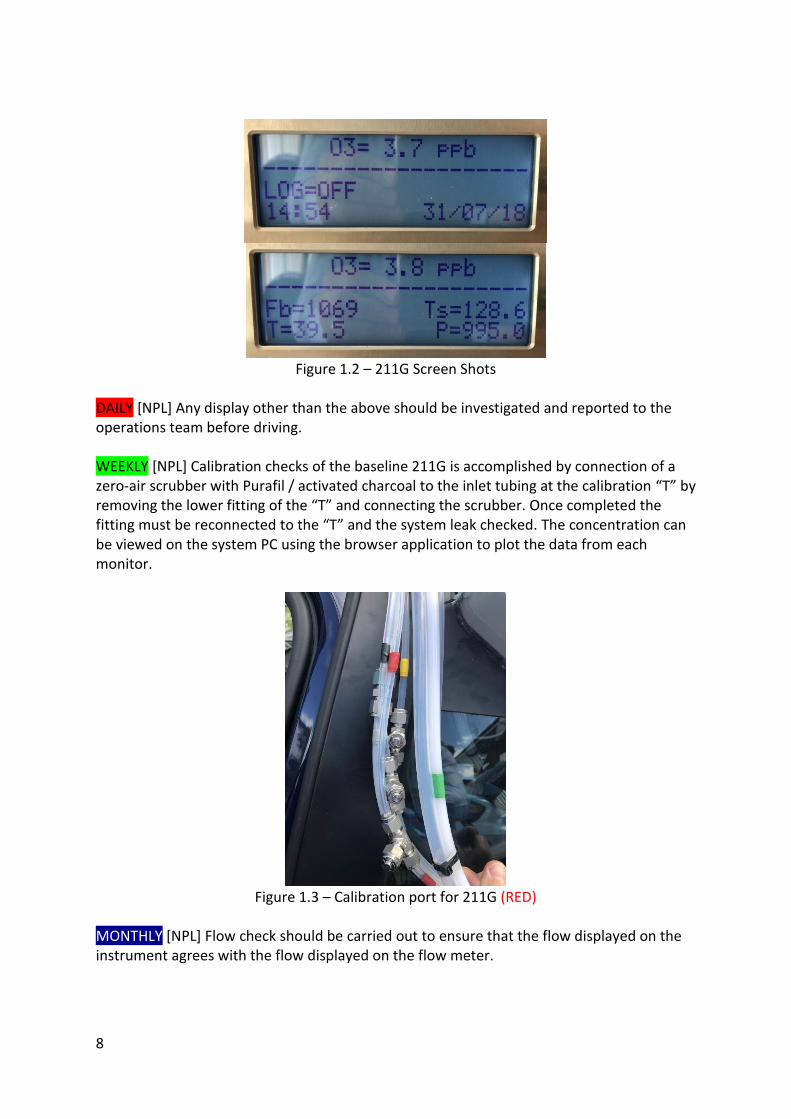
Figure 1.2 – 211G Screen Shots
DAILY [NPL] Any display other than the above should be investigated and reported to the operations team before driving. WEEKLY [NPL] Calibration checks of the baseline 211G is accomplished by connection of a zero-air scrubber with Purafil / activated charcoal to the inlet tubing at the calibration “T” by removing the lower fitting of the “T” and connecting the scrubber. Once completed the fitting must be reconnected to the “T” and the system leak checked. The concentration can be viewed on the system PC using the browser application to plot the data from each monitor.
Figure 1.3 – Calibration port for 211G (RED)
MONTHLY [NPL] Flow check should be carried out to ensure that the flow displayed on the instrument agrees with the flow displayed on the flow meter.
9
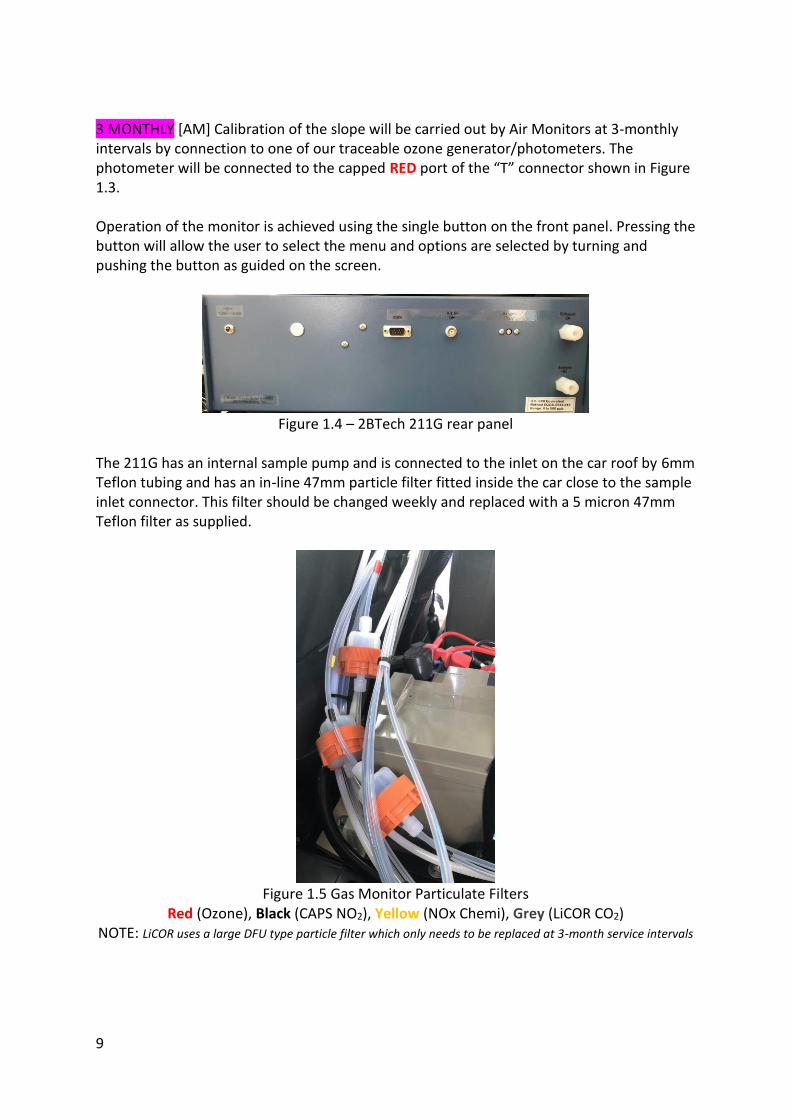
3 MONTHLY [AM] Calibration of the slope will be carried out by Air Monitors at 3-monthly intervals by connection to one of our traceable ozone generator/photometers. The photometer will be connected to the capped RED port of the “T” connector shown in Figure 1.3. Operation of the monitor is achieved using the single button on the front panel. Pressing the button will allow the user to select the menu and options are selected by turning and pushing the button as guided on the screen.
Figure 1.4 – 2BTech 211G rear panel
The 211G has an internal sample pump and is connected to the inlet on the car roof by 6mm Teflon tubing and has an in-line 47mm particle filter fitted inside the car close to the sample inlet connector. This filter should be changed weekly and replaced with a 5 micron 47mm Teflon filter as supplied.
Figure 1.5 Gas Monitor Particulate Filters
Red (Ozone), Black (CAPS NO2), Yellow (NOx Chemi), Grey (LiCOR CO2) NOTE: LiCOR uses a large DFU type particle filter which only needs to be replaced at 3-month service intervals
10
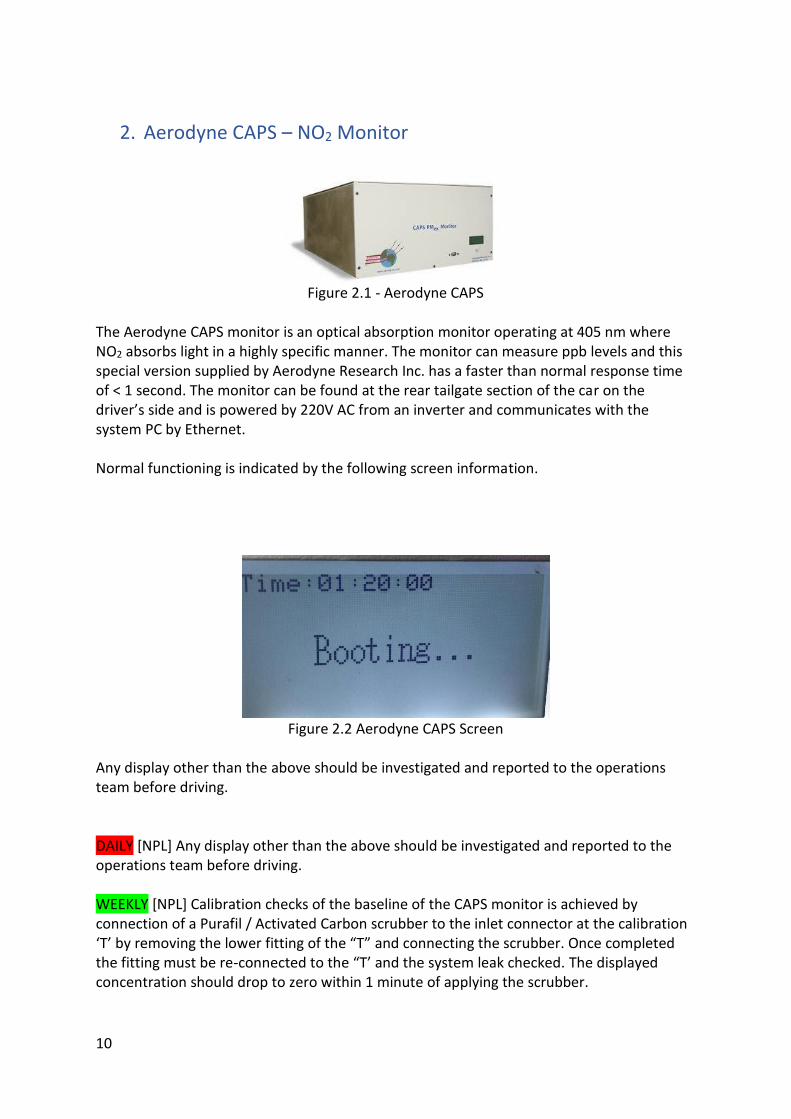
2. Aerodyne CAPS – NO2 Monitor
Figure 2.1 - Aerodyne CAPS
The Aerodyne CAPS monitor is an optical absorption monitor operating at 405 nm where NO2 absorbs light in a highly specific manner. The monitor can measure ppb levels and this special version supplied by Aerodyne Research Inc. has a faster than normal response time of < 1 second. The monitor can be found at the rear tailgate section of the car on the driver’s side and is powered by 220V AC from an inverter and communicates with the system PC by Ethernet. Normal functioning is indicated by the following screen information.
Figure 2.2 Aerodyne CAPS Screen
Any display other than the above should be investigated and reported to the operations team before driving. DAILY [NPL] Any display other than the above should be investigated and reported to the operations team before driving. WEEKLY [NPL] Calibration checks of the baseline of the CAPS monitor is achieved by connection of a Purafil / Activated Carbon scrubber to the inlet connector at the calibration ‘T’ by removing the lower fitting of the “T” and connecting the scrubber. Once completed the fitting must be re-connected to the “T’ and the system leak checked. The displayed concentration should drop to zero within 1 minute of applying the scrubber.
11
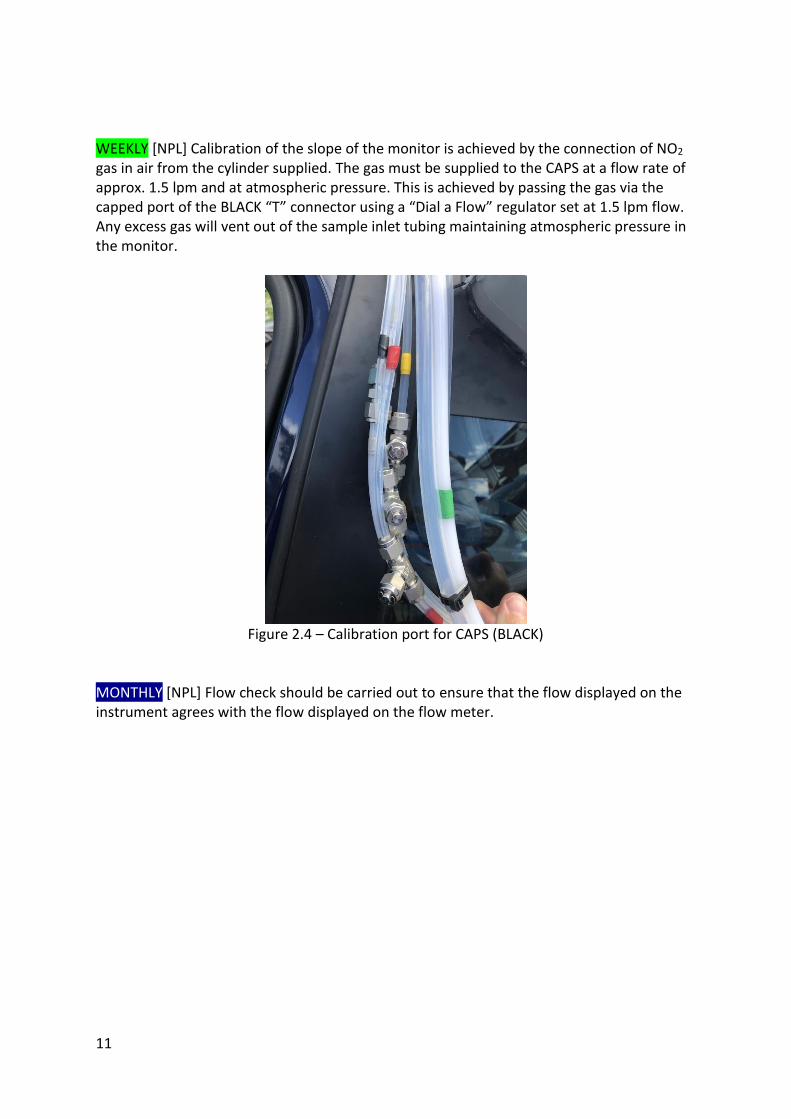
WEEKLY [NPL] Calibration of the slope of the monitor is achieved by the connection of NO2 gas in air from the cylinder supplied. The gas must be supplied to the CAPS at a flow rate of approx. 1.5 lpm and at atmospheric pressure. This is achieved by passing the gas via the capped port of the BLACK “T” connector using a “Dial a Flow” regulator set at 1.5 lpm flow. Any excess gas will vent out of the sample inlet tubing maintaining atmospheric pressure in the monitor.
Figure 2.4 – Calibration port for CAPS (BLACK)
MONTHLY [NPL] Flow check should be carried out to ensure that the flow displayed on the instrument agrees with the flow displayed on the flow meter.
12
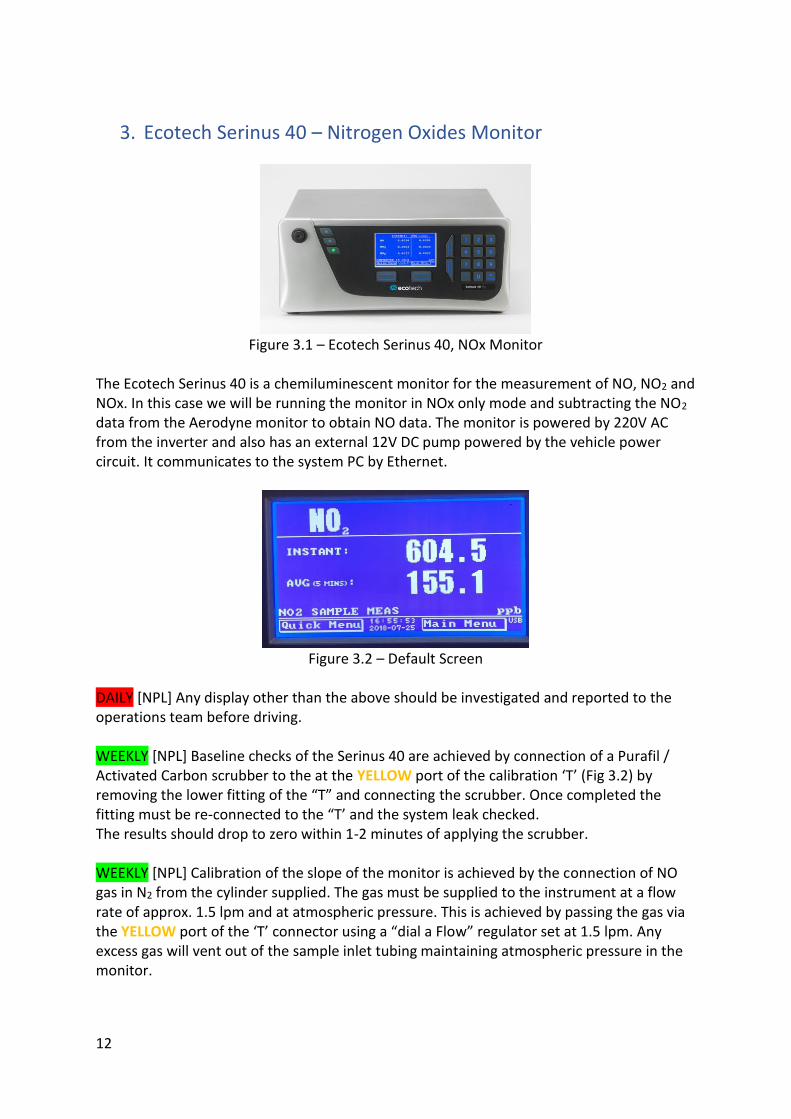
3. Ecotech Serinus 40 – Nitrogen Oxides Monitor
Figure 3.1 – Ecotech Serinus 40, NOx Monitor
The Ecotech Serinus 40 is a chemiluminescent monitor for the measurement of NO, NO2 and NOx. In this case we will be running the monitor in NOx only mode and subtracting the NO2 data from the Aerodyne monitor to obtain NO data. The monitor is powered by 220V AC from the inverter and also has an external 12V DC pump powered by the vehicle power circuit. It communicates to the system PC by Ethernet.
Figure 3.2 – Default Screen
DAILY [NPL] Any display other than the above should be investigated and reported to the operations team before driving. WEEKLY [NPL] Baseline checks of the Serinus 40 are achieved by connection of a Purafil / Activated Carbon scrubber to the at the YELLOW port of the calibration ‘T’ (Fig 3.2) by removing the lower fitting of the “T” and connecting the scrubber. Once completed the fitting must be re-connected to the “T’ and the system leak checked. The results should drop to zero within 1-2 minutes of applying the scrubber. WEEKLY [NPL] Calibration of the slope of the monitor is achieved by the connection of NO gas in N2 from the cylinder supplied. The gas must be supplied to the instrument at a flow rate of approx. 1.5 lpm and at atmospheric pressure. This is achieved by passing the gas via the YELLOW port of the ‘T’ connector using a “dial a Flow” regulator set at 1.5 lpm. Any excess gas will vent out of the sample inlet tubing maintaining atmospheric pressure in the monitor.
13
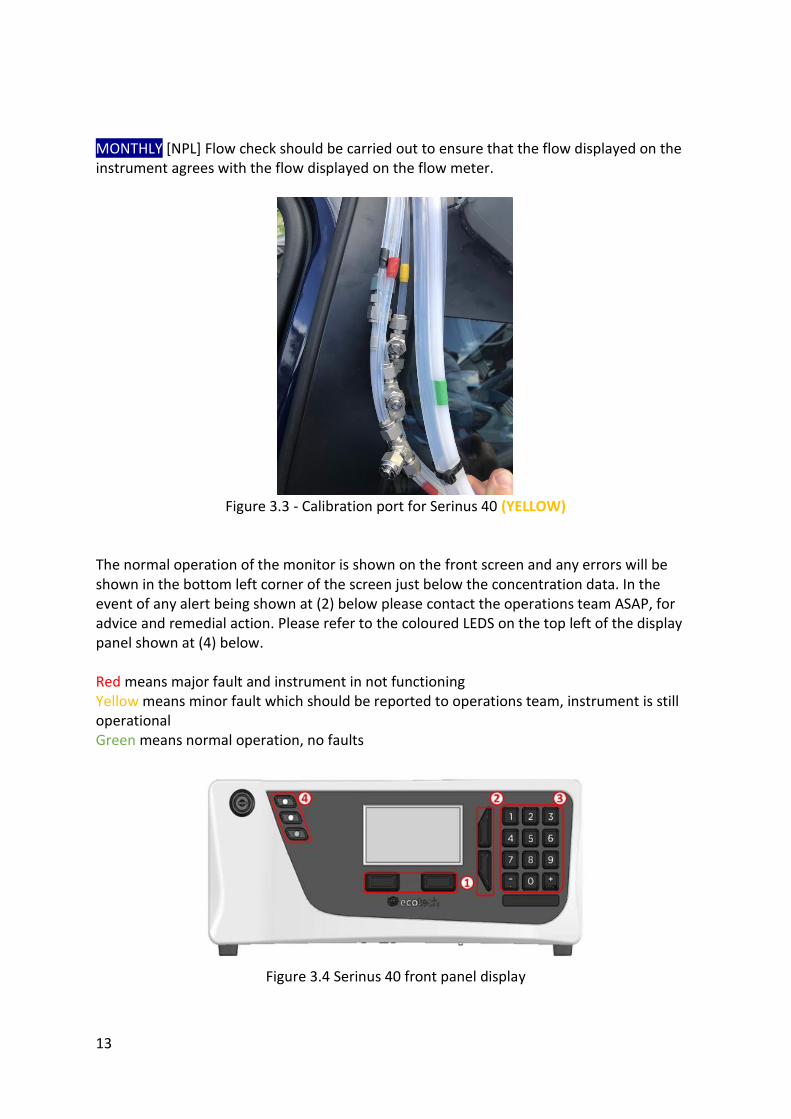
MONTHLY [NPL] Flow check should be carried out to ensure that the flow displayed on the instrument agrees with the flow displayed on the flow meter.
Figure 3.3 - Calibration port for Serinus 40 (YELLOW)
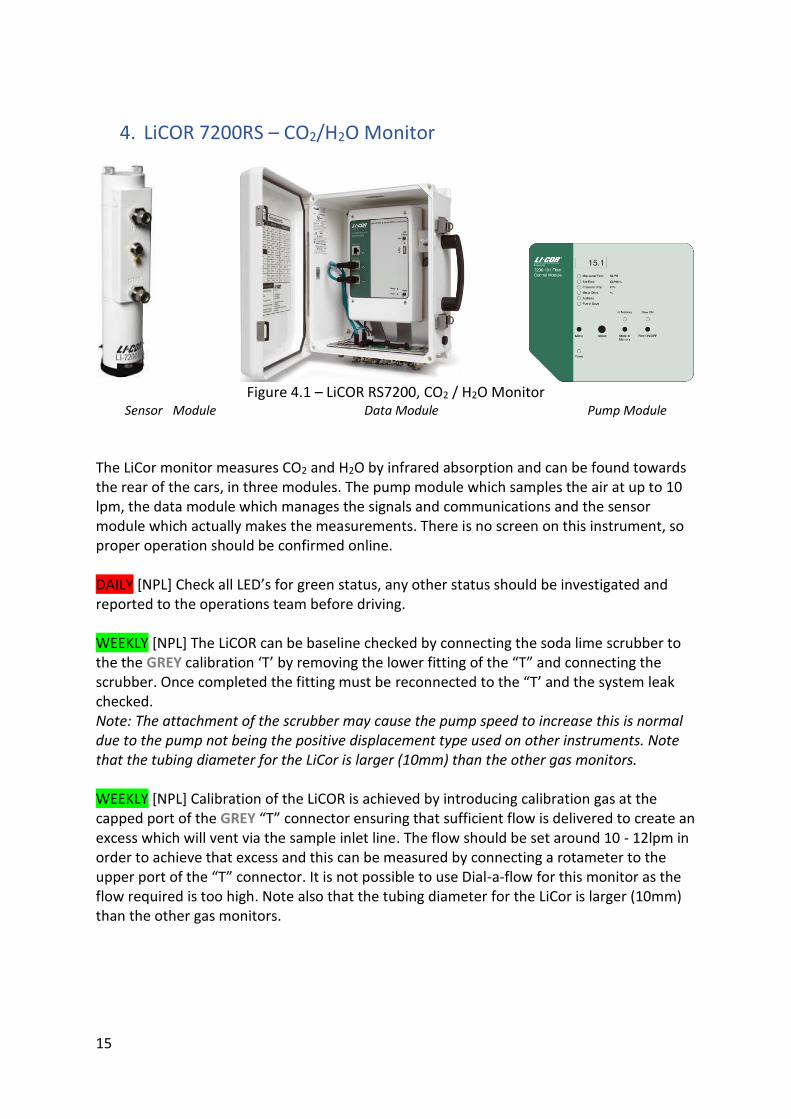
The normal operation of the monitor is shown on the front screen and any errors will be shown in the bottom left corner of the screen just below the concentration data. In the event of any alert being shown at (2) below please contact the operations team ASAP, for advice and remedial action. Please refer to the coloured LEDS on the top left of the display panel shown at (4) below. Red means major fault and instrument in not functioning Yellow means minor fault which should be reported to operations team, instrument is still operational Green means normal operation, no faults
Figure 3.4 Serinus 40 front panel display

14
The following page describes the Serinus display and menu options available from the default screen.
15
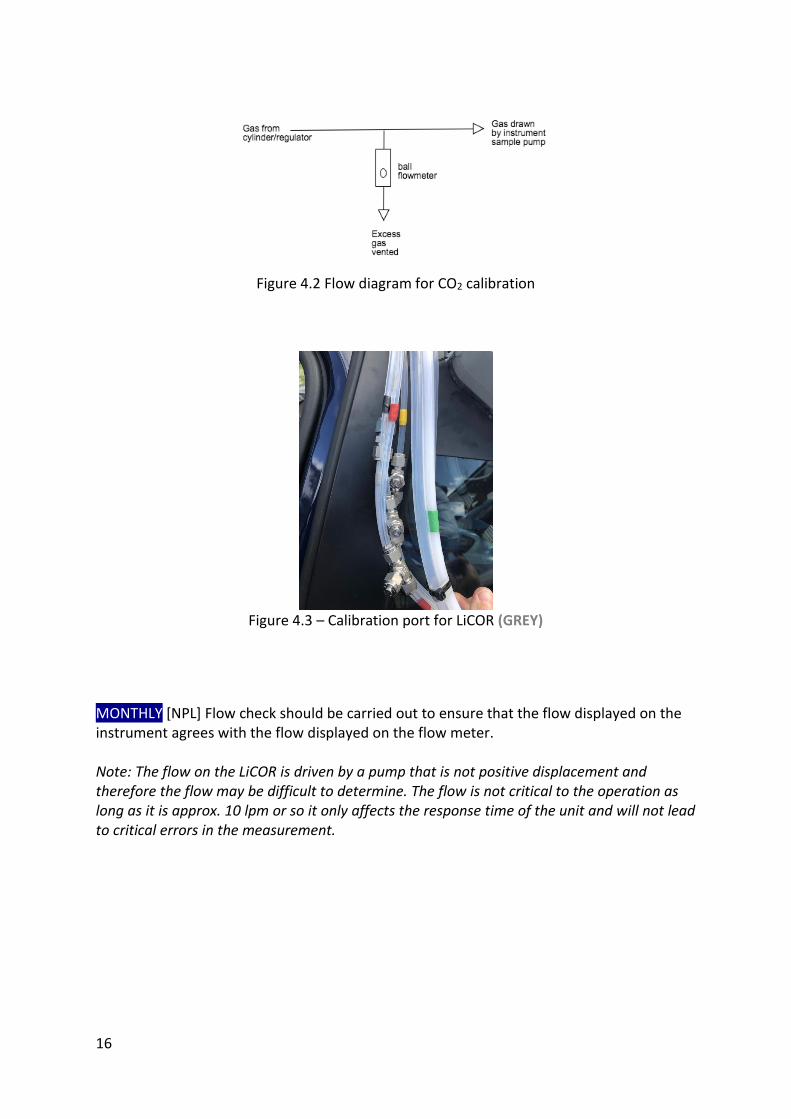
4. LiCOR 7200RS – CO2/H2O Monitor
Figure 4.1 – LiCOR RS7200, CO2 / H2O Monitor
Sensor Module Data Module Pump Module
The LiCor monitor measures CO2 and H2O by infrared absorption and can be found towards the rear of the cars, in three modules. The pump module which samples the air at up to 10 lpm, the data module which manages the signals and communications and the sensor module which actually makes the measurements. There is no screen on this instrument, so proper operation should be confirmed online. DAILY [NPL] Check all LED’s for green status, any other status should be investigated and reported to the operations team before driving. WEEKLY [NPL] The LiCOR can be baseline checked by connecting the soda lime scrubber to the the GREY calibration ‘T’ by removing the lower fitting of the “T” and connecting the scrubber. Once completed the fitting must be reconnected to the “T’ and the system leak checked. Note: The attachment of the scrubber may cause the pump speed to increase this is normal due to the pump not being the positive displacement type used on other instruments. Note that the tubing diameter for the LiCor is larger (10mm) than the other gas monitors. WEEKLY [NPL] Calibration of the LiCOR is achieved by introducing calibration gas at the capped port of the GREY “T” connector ensuring that sufficient flow is delivered to create an excess which will vent via the sample inlet line. The flow should be set around 10 - 12lpm in order to achieve that excess and this can be measured by connecting a rotameter to the upper port of the “T” connector. It is not possible to use Dial-a-flow for this monitor as the flow required is too high. Note also that the tubing diameter for the LiCor is larger (10mm) than the other gas monitors.
16
Figure 4.2 Flow diagram for CO2 calibration
Figure 4.3 – Calibration port for LiCOR (GREY)
MONTHLY [NPL] Flow check should be carried out to ensure that the flow displayed on the instrument agrees with the flow displayed on the flow meter. Note: The flow on the LiCOR is driven by a pump that is not positive displacement and therefore the flow may be difficult to determine. The flow is not critical to the operation as long as it is approx. 10 lpm or so it only affects the response time of the unit and will not lead to critical errors in the measurement.
17
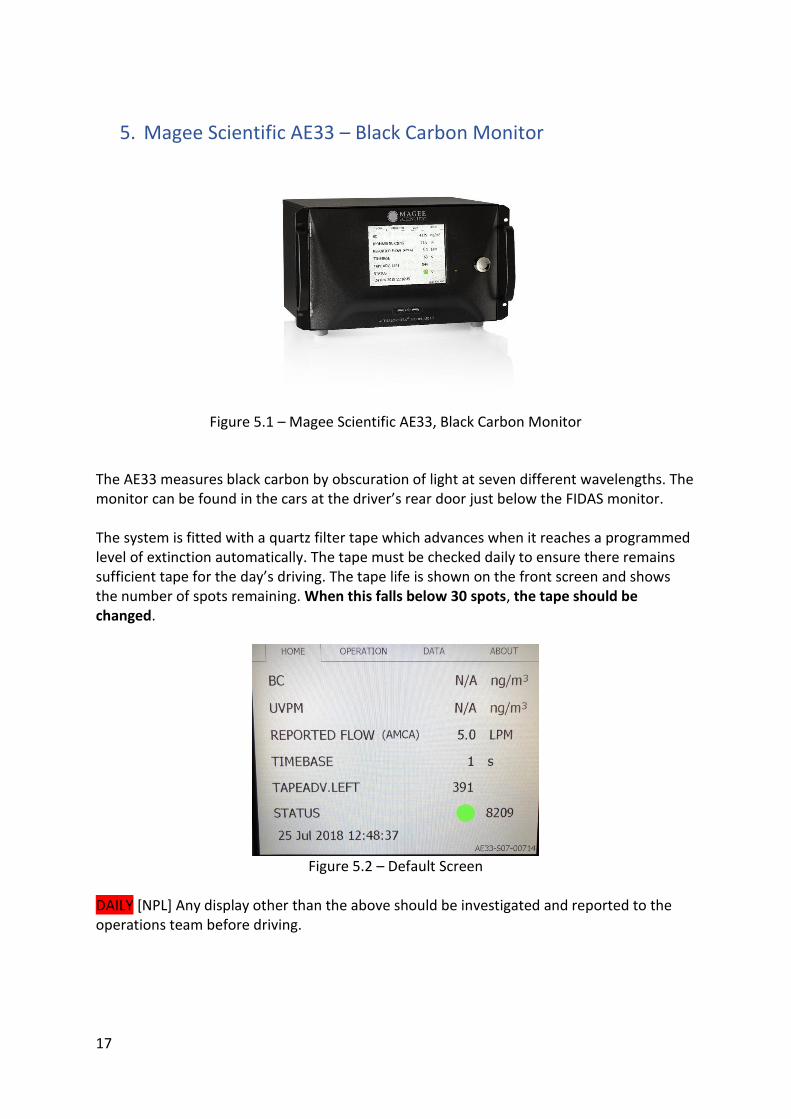
5. Magee Scientific AE33 – Black Carbon Monitor
Figure 5.1 – Magee Scientific AE33, Black Carbon Monitor
The AE33 measures black carbon by obscuration of light at seven different wavelengths. The monitor can be found in the cars at the driver’s rear door just below the FIDAS monitor. The system is fitted with a quartz filter tape which advances when it reaches a programmed level of extinction automatically. The tape must be checked daily to ensure there remains sufficient tape for the day’s driving. The tape life is shown on the front screen and shows the number of spots remaining. When this falls below 30 spots, the tape should be changed.
Figure 5.2 – Default Screen
DAILY [NPL] Any display other than the above should be investigated and reported to the operations team before driving.
18
WEEKLY [NPL] The system baseline can be checked by adding a HEPA filter to the inlet and observing the readings over a period of 5 minutes, which should be close to 0, however a certain level of signal noise may be present. Note: Leak checks on this instrument are difficult as to block the inlet will cause a small leak at the sample nozzle which will leak more when under vacuum, so the best leak method is to check the flow with the pump off and again with the pump on and with the sample line blocked and the flow readings compared to determine the rate of leak. It will not be possible to get a zero-flow reading while blocking the inlet line. MONTHLY [NPL] Flow check should be carried out to ensure that the flow displayed on the instrument agrees with the flow displayed on the flow meter.
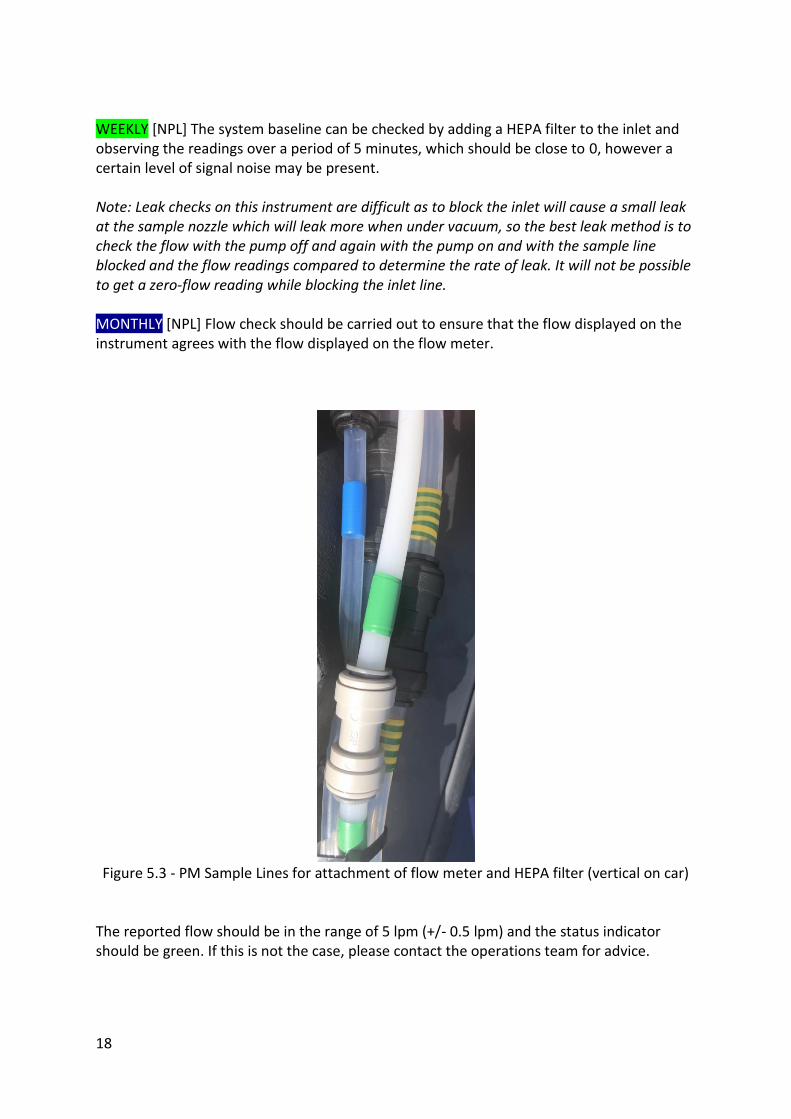
Figure 5.3 - PM Sample Lines for attachment of flow meter and HEPA filter (vertical on car)
The reported flow should be in the range of 5 lpm (+/- 0.5 lpm) and the status indicator should be green. If this is not the case, please contact the operations team for advice.
19
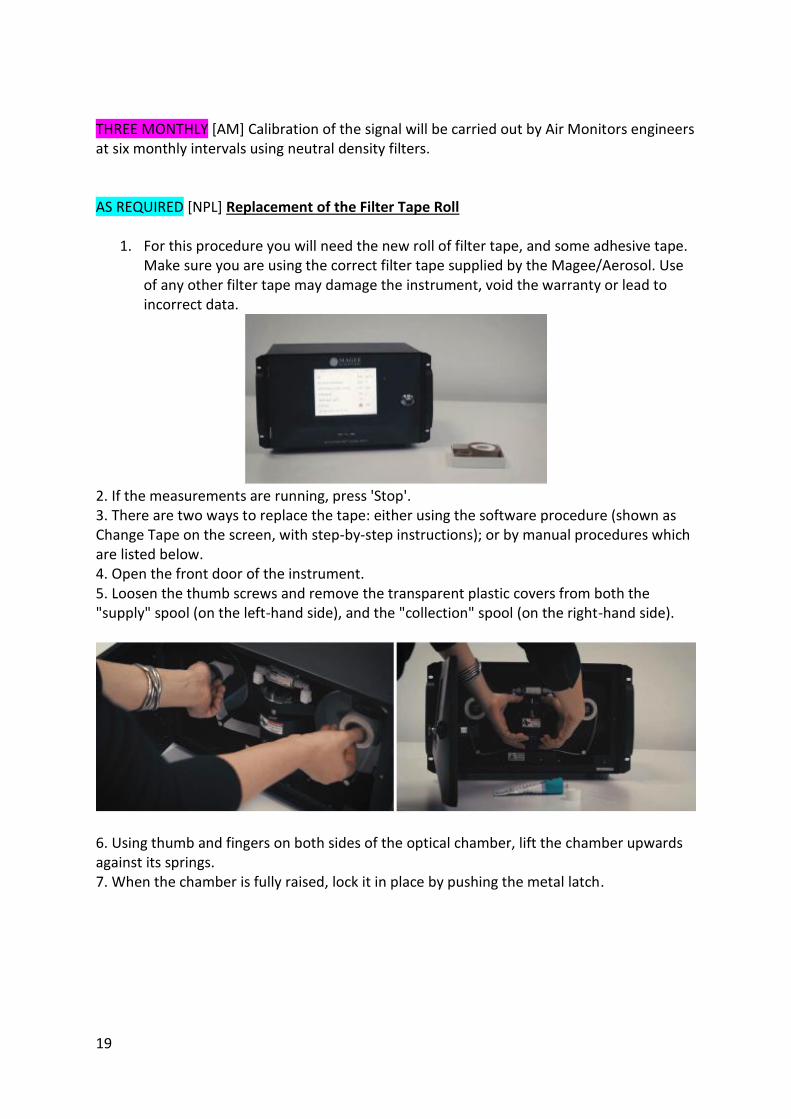
THREE MONTHLY [AM] Calibration of the signal will be carried out by Air Monitors engineers at six monthly intervals using neutral density filters. AS REQUIRED [NPL] Replacement of the Filter Tape Roll
1. For this procedure you will need the new roll of filter tape, and some adhesive tape. Make sure you are using the correct filter tape supplied by the Magee/Aerosol. Use of any other filter tape may damage the instrument, void the warranty or lead to incorrect data.
2. If the measurements are running, press 'Stop'. 3. There are two ways to replace the tape: either using the software procedure (shown as Change Tape on the screen, with step-by-step instructions); or by manual procedures which are listed below. 4. Open the front door of the instrument. 5. Loosen the thumb screws and remove the transparent plastic covers from both the "supply" spool (on the left-hand side), and the "collection" spool (on the right-hand side).
6. Using thumb and fingers on both sides of the optical chamber, lift the chamber upwards against its springs. 7. When the chamber is fully raised, lock it in place by pushing the metal latch.
20
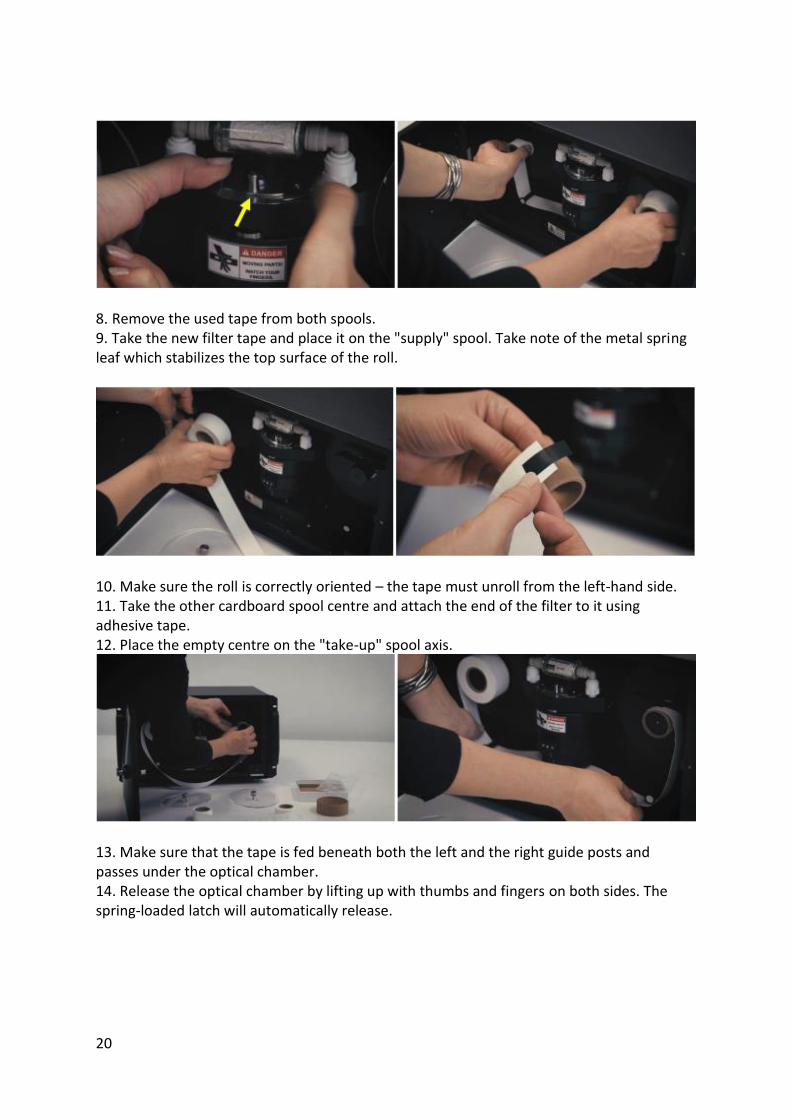
8. Remove the used tape from both spools. 9. Take the new filter tape and place it on the "supply" spool. Take note of the metal spring leaf which stabilizes the top surface of the roll.
10. Make sure the roll is correctly oriented – the tape must unroll from the left-hand side. 11. Take the other cardboard spool centre and attach the end of the filter to it using adhesive tape. 12. Place the empty centre on the "take-up" spool axis.
13. Make sure that the tape is fed beneath both the left and the right guide posts and passes under the optical chamber. 14. Release the optical chamber by lifting up with thumbs and fingers on both sides. The spring-loaded latch will automatically release.
21
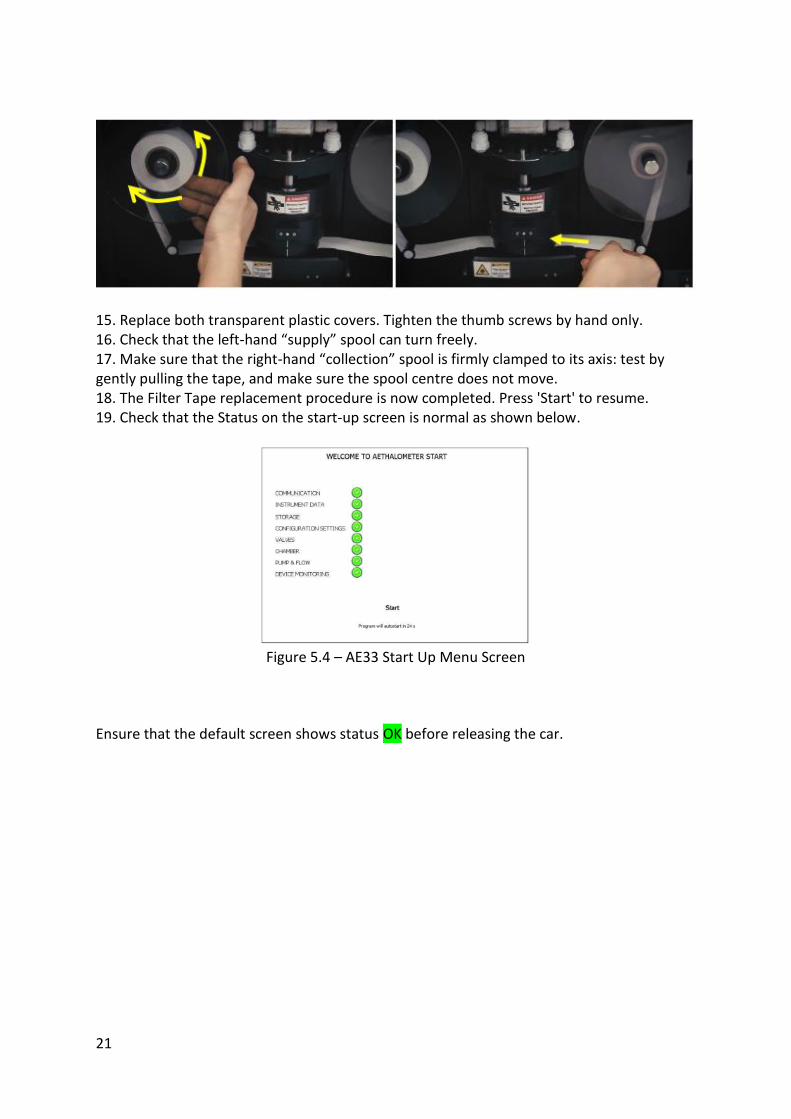
15. Replace both transparent plastic covers. Tighten the thumb screws by hand only. 16. Check that the left-hand “supply” spool can turn freely. 17. Make sure that the right-hand “collection” spool is firmly clamped to its axis: test by gently pulling the tape, and make sure the spool centre does not move. 18. The Filter Tape replacement procedure is now completed. Press 'Start' to resume. 19. Check that the Status on the start-up screen is normal as shown below.
Figure 5.4 – AE33 Start Up Menu Screen
Ensure that the default screen shows status OK before releasing the car.
22
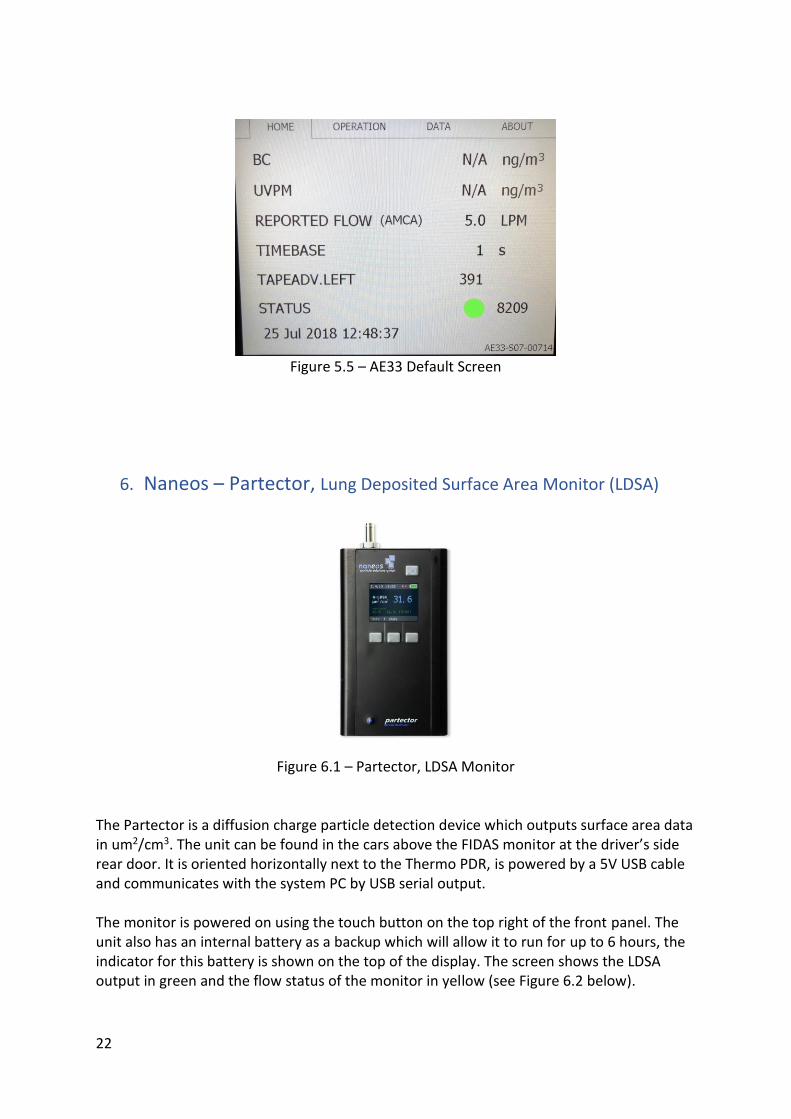
Figure 5.5 – AE33 Default Screen
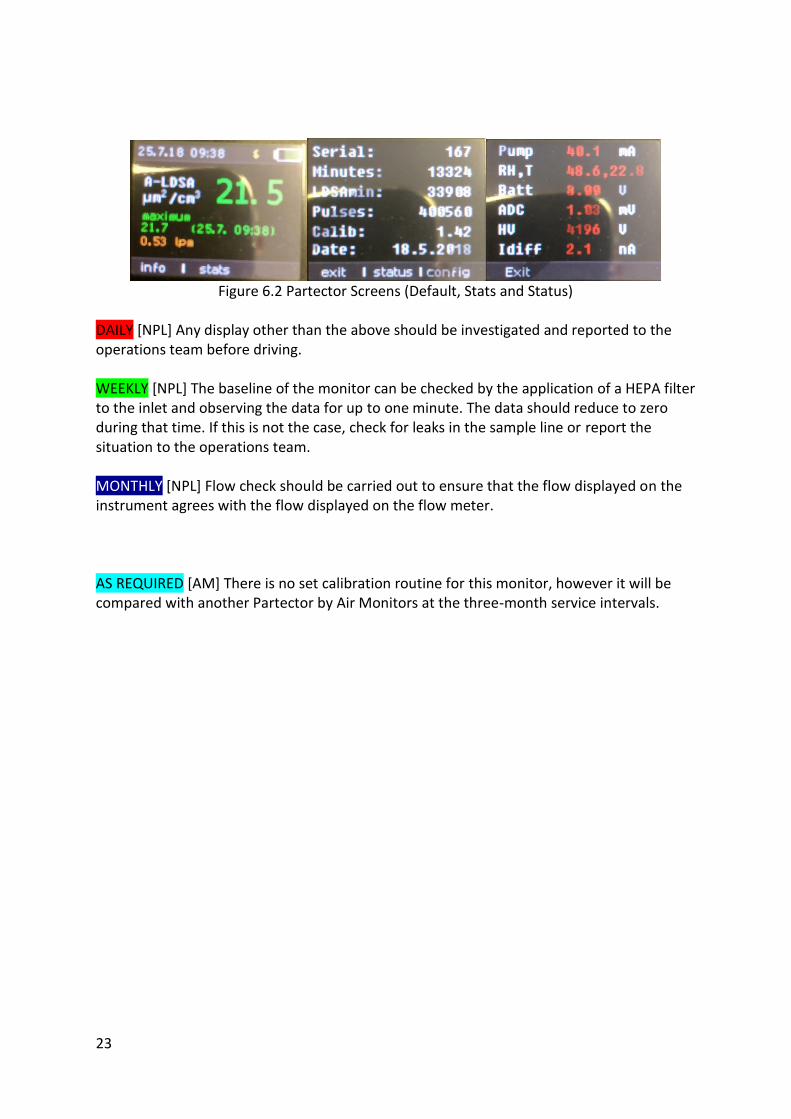
6. Naneos – Partector, Lung Deposited Surface Area Monitor (LDSA)
Figure 6.1 – Partector, LDSA Monitor
The Partector is a diffusion charge particle detection device which outputs surface area data in um2/cm3. The unit can be found in the cars above the FIDAS monitor at the driver’s side rear door. It is oriented horizontally next to the Thermo PDR, is powered by a 5V USB cable and communicates with the system PC by USB serial output. The monitor is powered on using the touch button on the top right of the front panel. The unit also has an internal battery as a backup which will allow it to run for up to 6 hours, the indicator for this battery is shown on the top of the display. The screen shows the LDSA output in green and the flow status of the monitor in yellow (see Figure 6.2 below).
23
Figure 6.2 Partector Screens (Default, Stats and Status)
DAILY [NPL] Any display other than the above should be investigated and reported to the operations team before driving. WEEKLY [NPL] The baseline of the monitor can be checked by the application of a HEPA filter to the inlet and observing the data for up to one minute. The data should reduce to zero during that time. If this is not the case, check for leaks in the sample line or report the situation to the operations team. MONTHLY [NPL] Flow check should be carried out to ensure that the flow displayed on the instrument agrees with the flow displayed on the flow meter. AS REQUIRED [AM] There is no set calibration routine for this monitor, however it will be compared with another Partector by Air Monitors at the three-month service intervals.
24
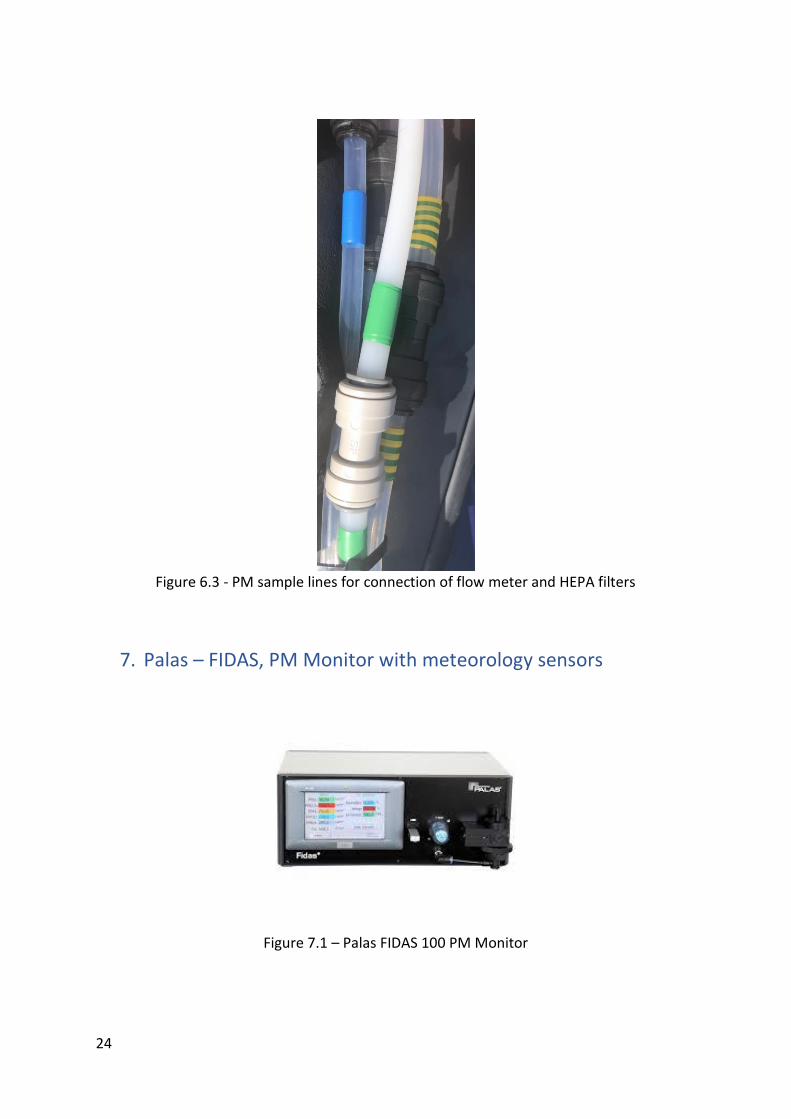
Figure 6.3 - PM sample lines for connection of flow meter and HEPA filters
7. Palas – FIDAS, PM Monitor with meteorology sensors
Figure 7.1 – Palas FIDAS 100 PM Monitor
25
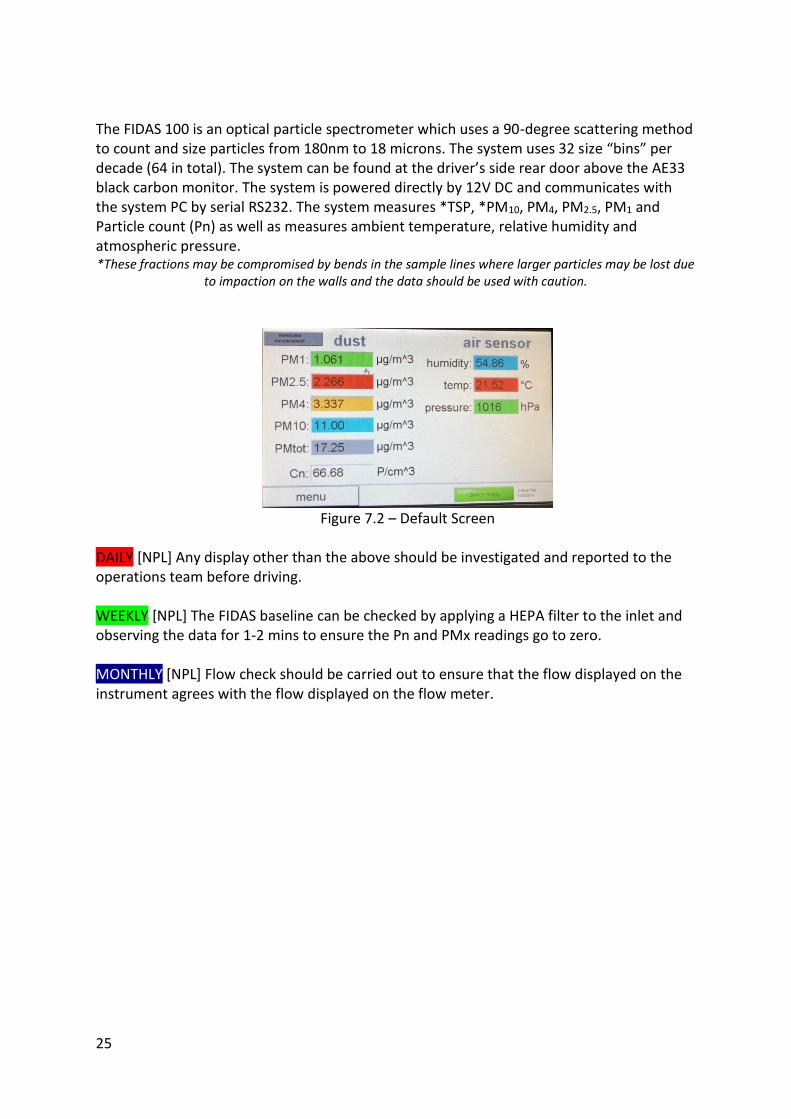
The FIDAS 100 is an optical particle spectrometer which uses a 90-degree scattering method to count and size particles from 180nm to 18 microns. The system uses 32 size “bins” per decade (64 in total). The system can be found at the driver’s side rear door above the AE33 black carbon monitor. The system is powered directly by 12V DC and communicates with the system PC by serial RS232. The system measures *TSP, *PM10, PM4, PM2.5, PM1 and Particle count (Pn) as well as measures ambient temperature, relative humidity and atmospheric pressure. *These fractions may be compromised by bends in the sample lines where larger particles may be lost due
to impaction on the walls and the data should be used with caution.
Figure 7.2 – Default Screen
DAILY [NPL] Any display other than the above should be investigated and reported to the operations team before driving. WEEKLY [NPL] The FIDAS baseline can be checked by applying a HEPA filter to the inlet and observing the data for 1-2 mins to ensure the Pn and PMx readings go to zero. MONTHLY [NPL] Flow check should be carried out to ensure that the flow displayed on the instrument agrees with the flow displayed on the flow meter.
26
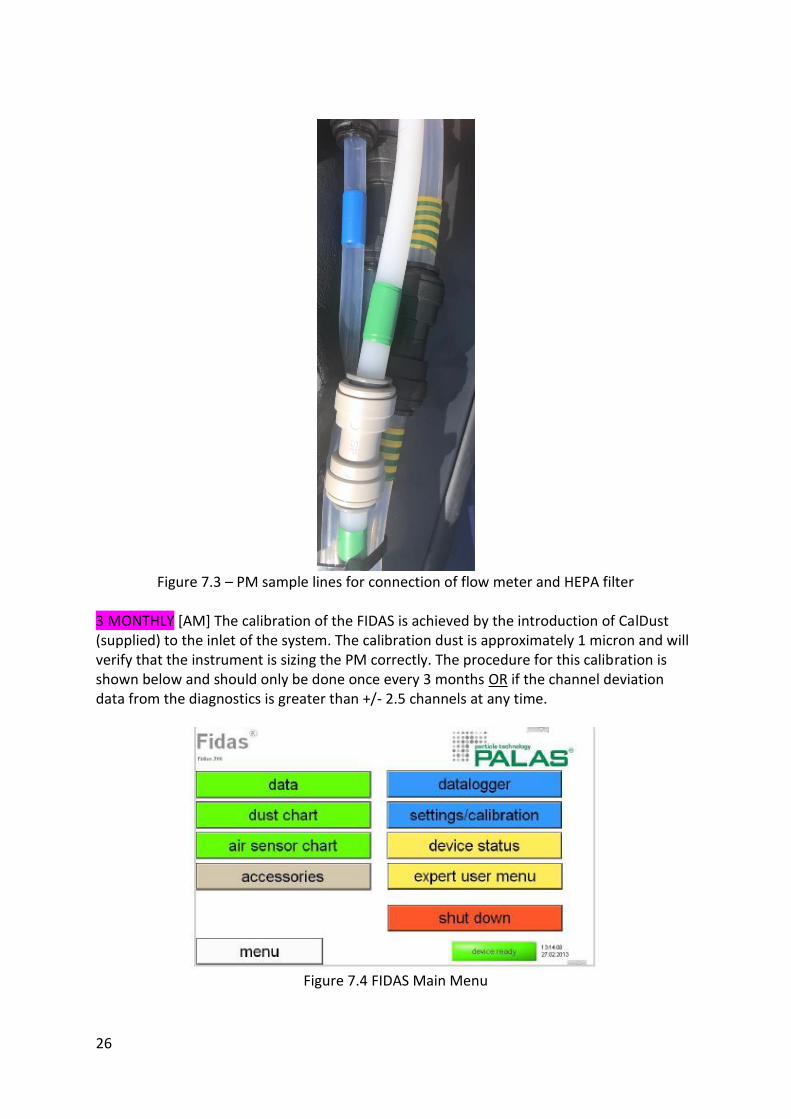
Figure 7.3 – PM sample lines for connection of flow meter and HEPA filter
3 MONTHLY [AM] The calibration of the FIDAS is achieved by the introduction of CalDust (supplied) to the inlet of the system. The calibration dust is approximately 1 micron and will verify that the instrument is sizing the PM correctly. The procedure for this calibration is shown below and should only be done once every 3 months OR if the channel deviation data from the diagnostics is greater than +/- 2.5 channels at any time.
Figure 7.4 FIDAS Main Menu
27
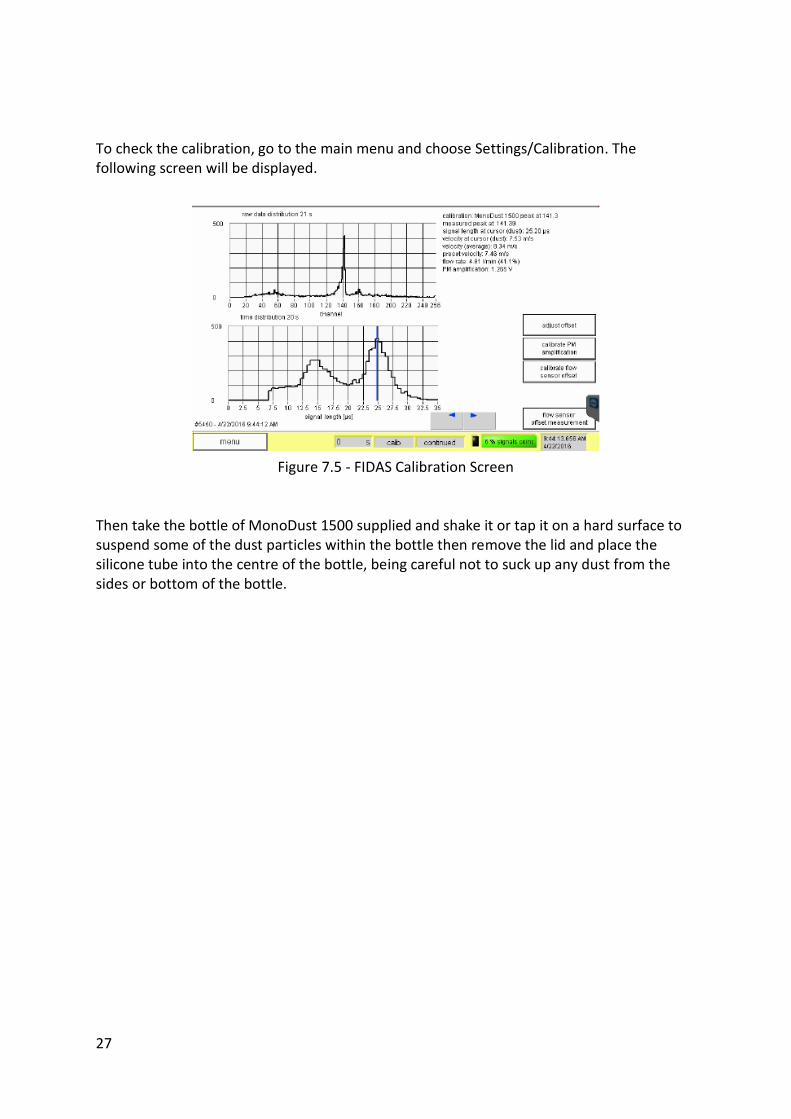
To check the calibration, go to the main menu and choose Settings/Calibration. The following screen will be displayed.
Figure 7.5 - FIDAS Calibration Screen
Then take the bottle of MonoDust 1500 supplied and shake it or tap it on a hard surface to suspend some of the dust particles within the bottle then remove the lid and place the silicone tube into the centre of the bottle, being careful not to suck up any dust from the sides or bottom of the bottle.
28
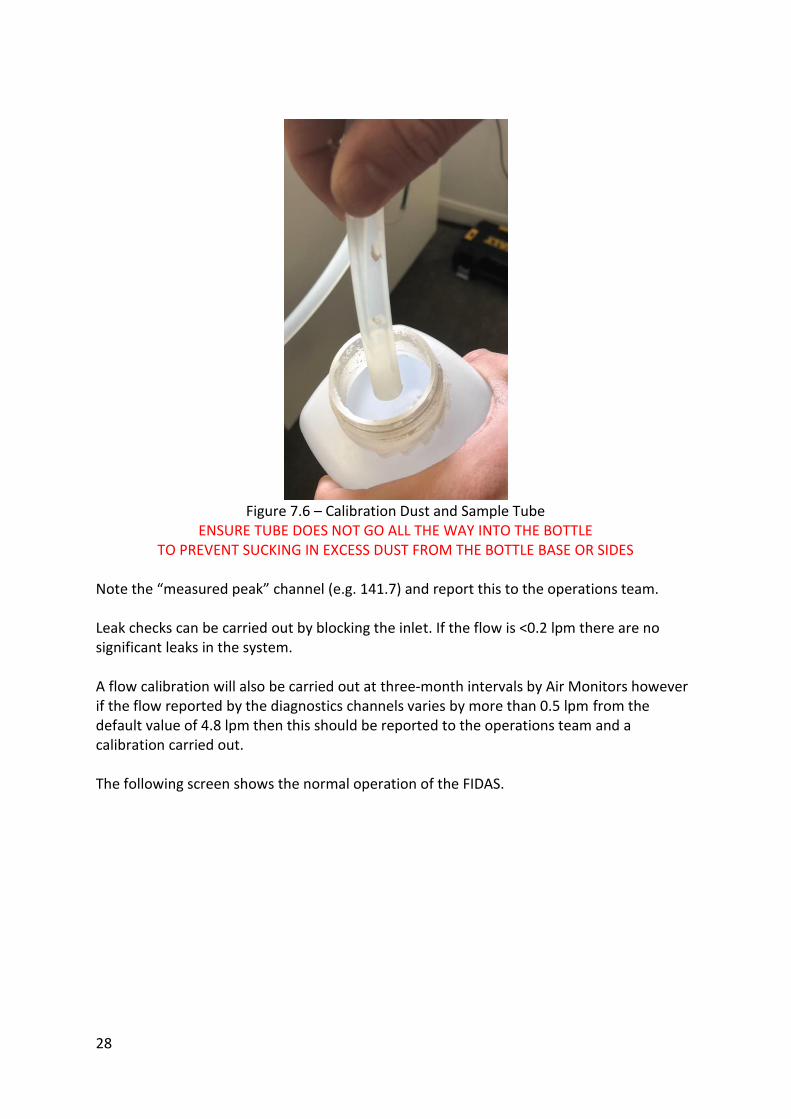
Figure 7.6 – Calibration Dust and Sample Tube
ENSURE TUBE DOES NOT GO ALL THE WAY INTO THE BOTTLE TO PREVENT SUCKING IN EXCESS DUST FROM THE BOTTLE BASE OR SIDES
Note the “measured peak” channel (e.g. 141.7) and report this to the operations team. Leak checks can be carried out by blocking the inlet. If the flow is <0.2 lpm there are no significant leaks in the system. A flow calibration will also be carried out at three-month intervals by Air Monitors however if the flow reported by the diagnostics channels varies by more than 0.5 lpm from the default value of 4.8 lpm then this should be reported to the operations team and a calibration carried out. The following screen shows the normal operation of the FIDAS.
29
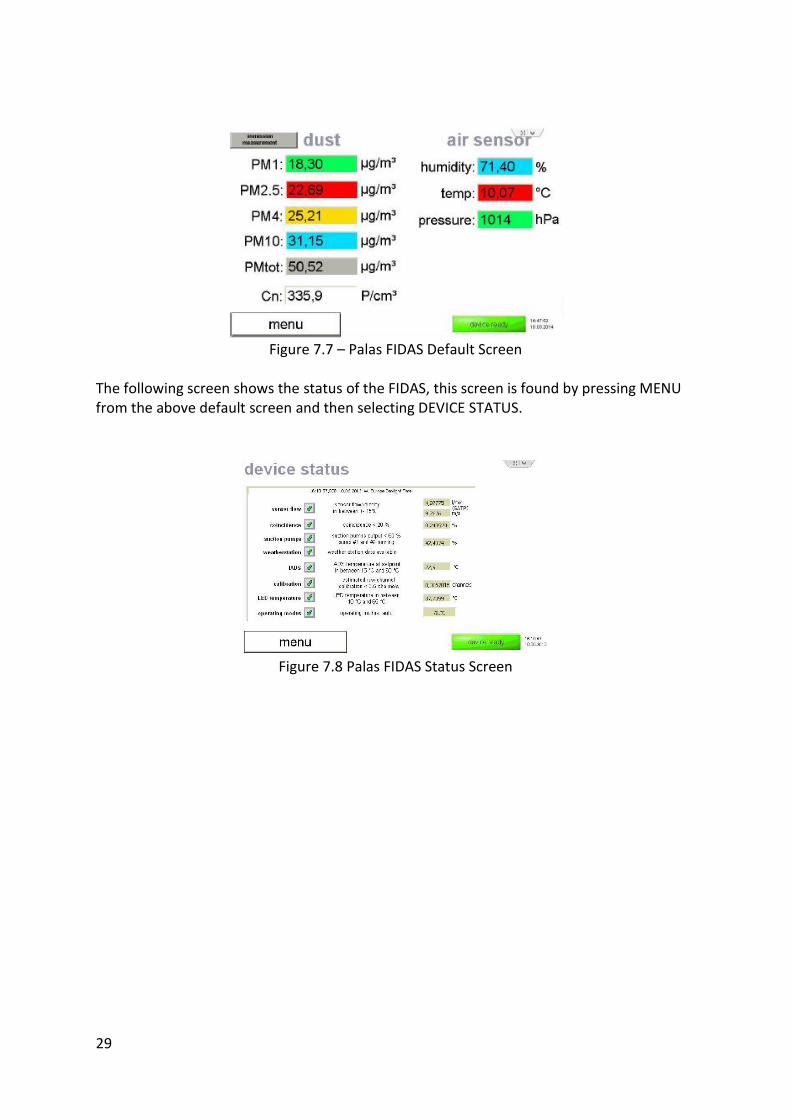
Figure 7.7 – Palas FIDAS Default Screen
The following screen shows the status of the FIDAS, this screen is found by pressing MENU from the above default screen and then selecting DEVICE STATUS.
Figure 7.8 Palas FIDAS Status Screen
30
8. Thermo PDr1500 – PM2.5 Monitor
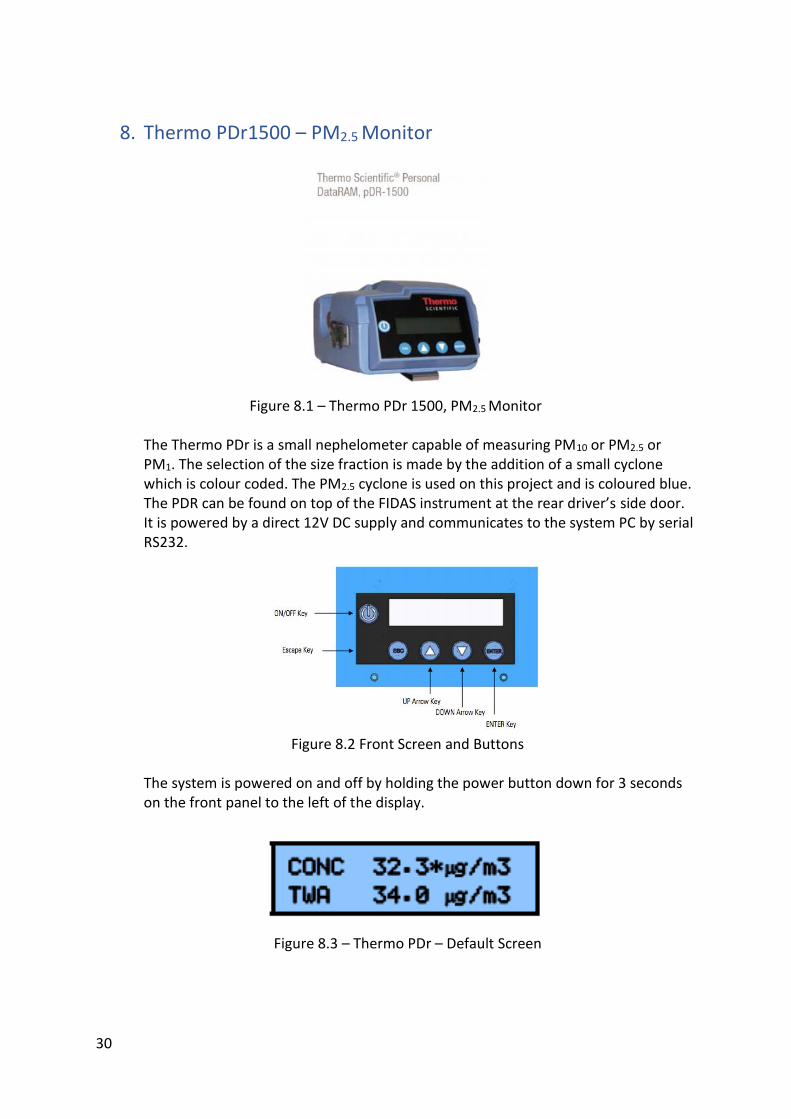
Figure 8.1 – Thermo PDr 1500, PM2.5 Monitor
The Thermo PDr is a small nephelometer capable of measuring PM10 or PM2.5 or PM1. The selection of the size fraction is made by the addition of a small cyclone which is colour coded. The PM2.5 cyclone is used on this project and is coloured blue. The PDR can be found on top of the FIDAS instrument at the rear driver’s side door. It is powered by a direct 12V DC supply and communicates to the system PC by serial RS232.
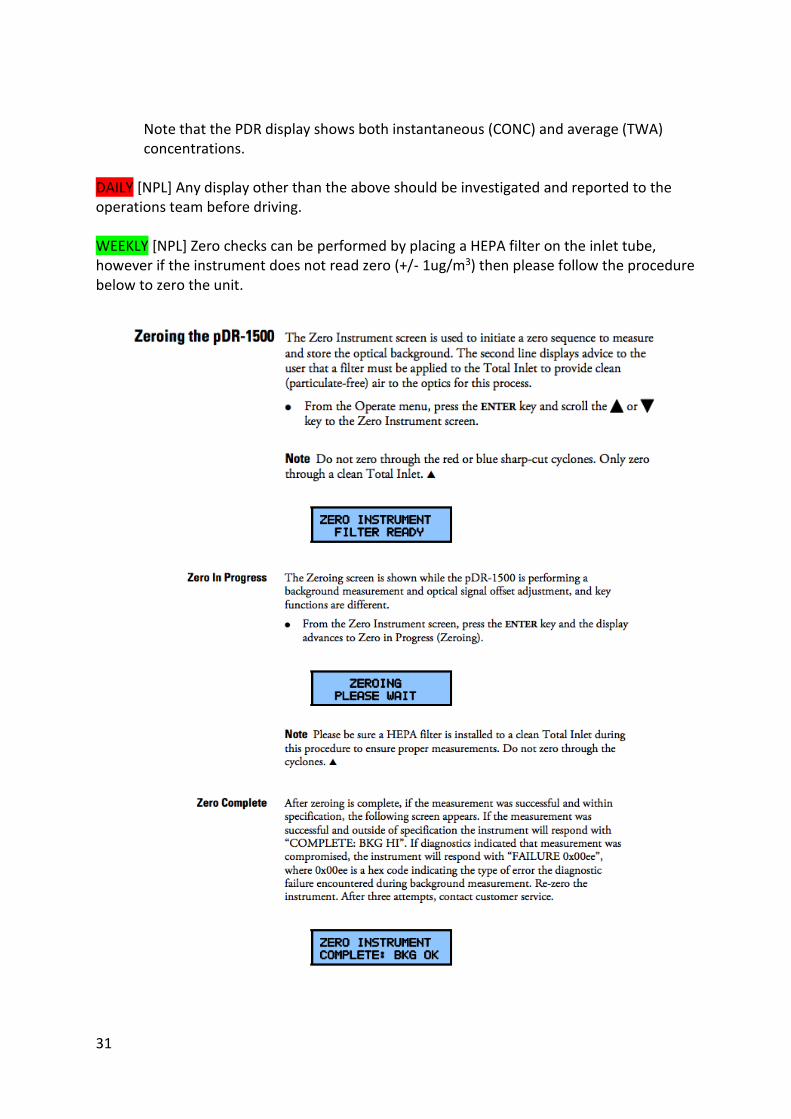
Figure 8.2 Front Screen and Buttons
The system is powered on and off by holding the power button down for 3 seconds on the front panel to the left of the display.
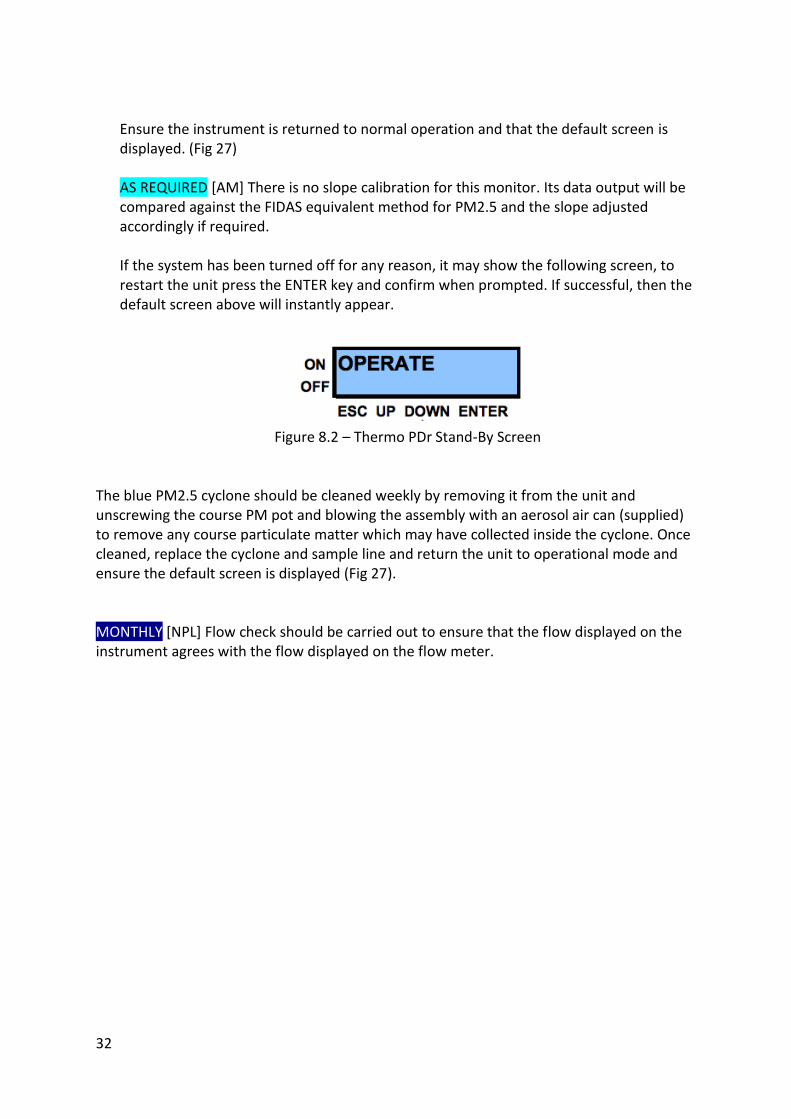
Figure 8.3 – Thermo PDr – Default Screen
31
Note that the PDR display shows both instantaneous (CONC) and average (TWA) concentrations.
DAILY [NPL] Any display other than the above should be investigated and reported to the operations team before driving.
WEEKLY [NPL] Zero checks can be performed by placing a HEPA filter on the inlet tube, however if the instrument does not read zero (+/- 1ug/m3) then please follow the procedure below to zero the unit.
32
Ensure the instrument is returned to normal operation and that the default screen is displayed. (Fig 27) AS REQUIRED [AM] There is no slope calibration for this monitor. Its data output will be compared against the FIDAS equivalent method for PM2.5 and the slope adjusted accordingly if required. If the system has been turned off for any reason, it may show the following screen, to restart the unit press the ENTER key and confirm when prompted. If successful, then the default screen above will instantly appear.
Figure 8.2 – Thermo PDr Stand-By Screen
The blue PM2.5 cyclone should be cleaned weekly by removing it from the unit and unscrewing the course PM pot and blowing the assembly with an aerosol air can (supplied) to remove any course particulate matter which may have collected inside the cyclone. Once cleaned, replace the cyclone and sample line and return the unit to operational mode and ensure the default screen is displayed (Fig 27). MONTHLY [NPL] Flow check should be carried out to ensure that the flow displayed on the instrument agrees with the flow displayed on the flow meter.
33
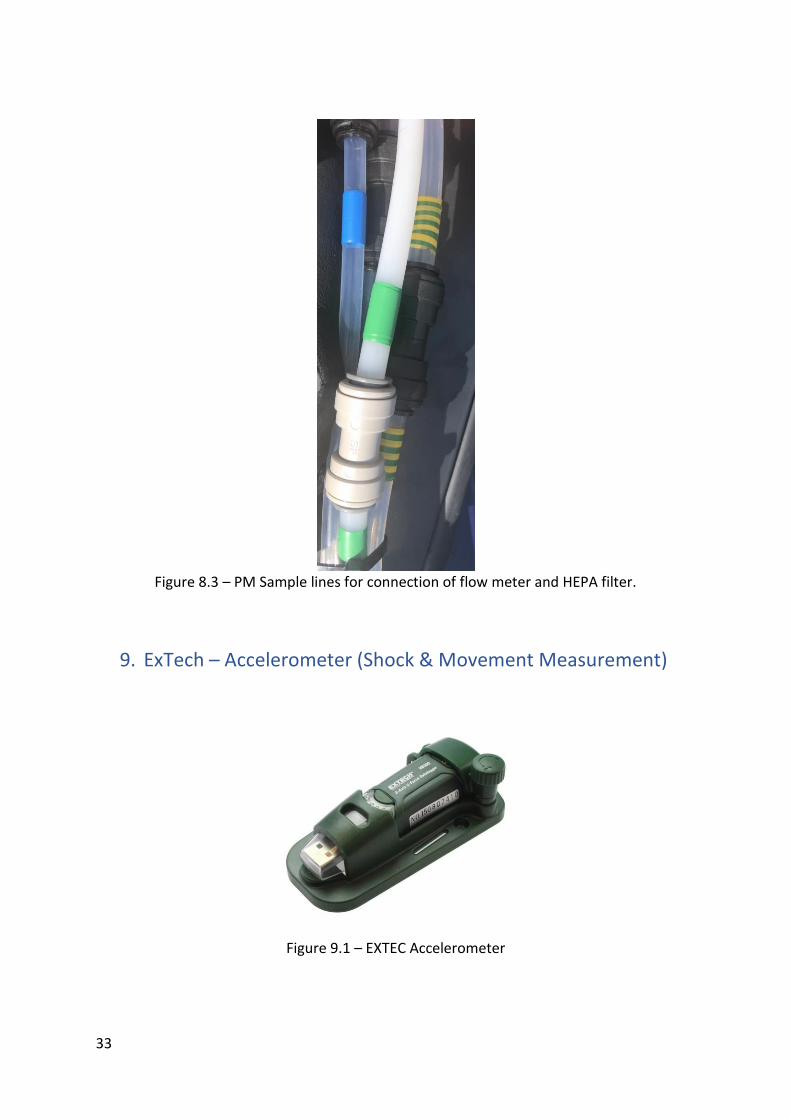
Figure 8.3 – PM Sample lines for connection of flow meter and HEPA filter.
9. ExTech – Accelerometer (Shock & Movement Measurement)
Figure 9.1 – EXTEC Accelerometer
34
The ExTech accelerometer is installed to detect any shocks that may affect the scientific monitoring equipment installed in the cars. It is capable of taking 2 measurements per second in three planes and reporting any sudden movement or shocks to the system PC. This data will be used to possibly invalidate data from the other instruments in the event of a serious shock. The sensor is powered by a USB 5V DC supply and communicates to the system PC by a USB 2.0 cable. There is no visual display on this instrument, so proper operation must be verified online.
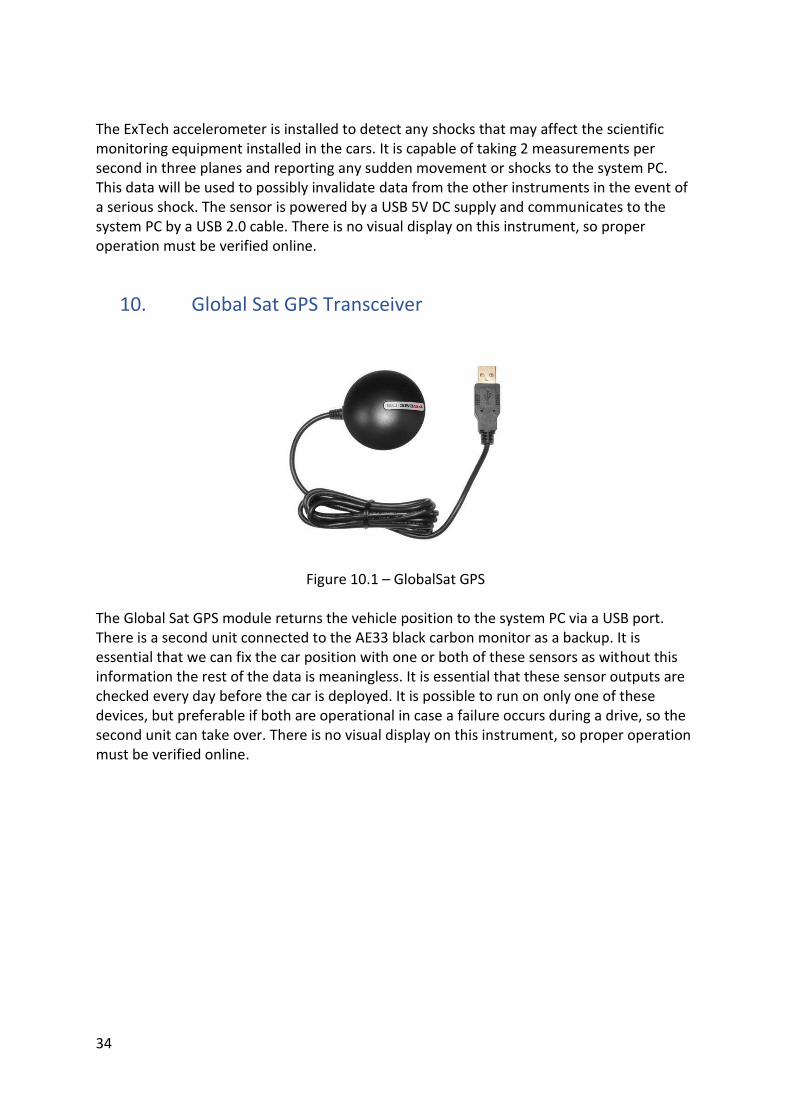
10. Global Sat GPS Transceiver
Figure 10.1 – GlobalSat GPS
The Global Sat GPS module returns the vehicle position to the system PC via a USB port. There is a second unit connected to the AE33 black carbon monitor as a backup. It is essential that we can fix the car position with one or both of these sensors as without this information the rest of the data is meaningless. It is essential that these sensor outputs are checked every day before the car is deployed. It is possible to run on only one of these devices, but preferable if both are operational in case a failure occurs during a drive, so the second unit can take over. There is no visual display on this instrument, so proper operation must be verified online.

35
Project Cabinet
The project cabinet at NPL will be located adjacent to the parking spaces and will supply DC power, cooling air and battery charging capability to the two cars when parked. It will also contain the calibration gases and consumables required to support the operation of the cars throughout the project.
Project Cabinet
Project Cabinet Dimensions and Weight
PT6 1750mm 825mm 1600mm 1560mm(w) x 1450mm(h) 120kg
The cabinet is constructed of GRP and is fitted with a plywood backboard onto which a domestic electrical distribution unit will be fitted compete with RCB protection. The power feed to the cabinet comes from the power distribution cabinet shown below which is located between the car park and the air quality reference station.
36
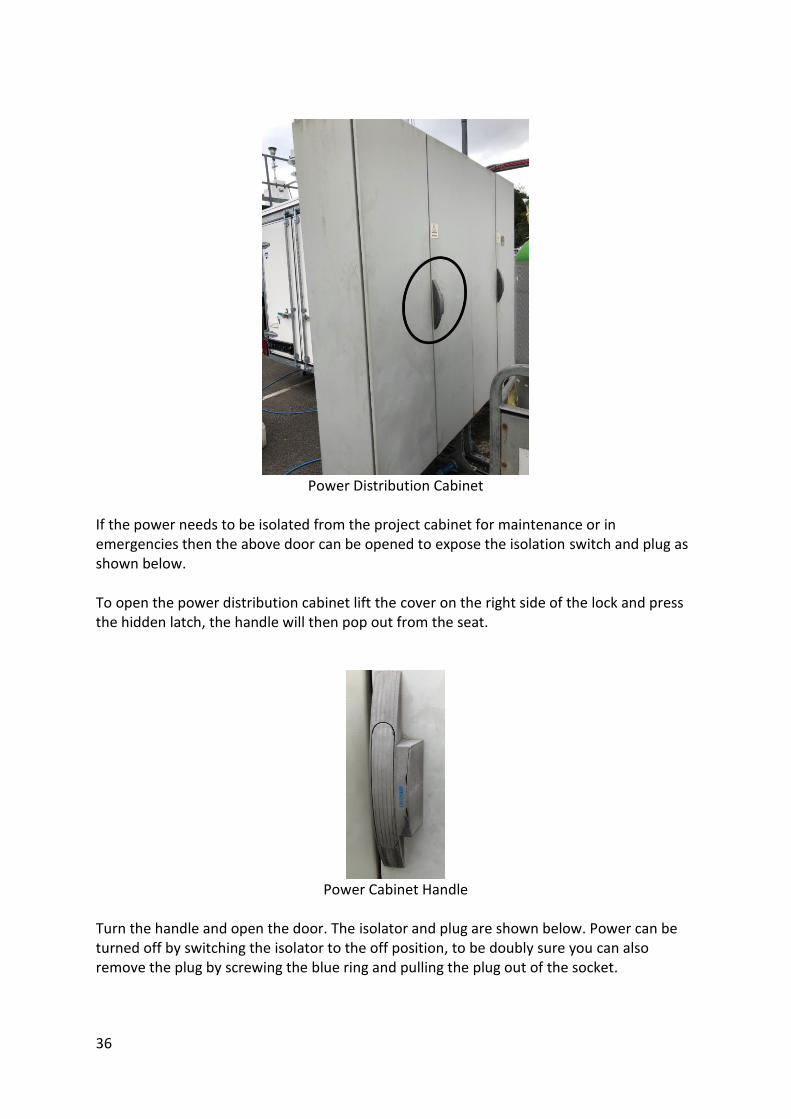
Power Distribution Cabinet
If the power needs to be isolated from the project cabinet for maintenance or in emergencies then the above door can be opened to expose the isolation switch and plug as shown below. To open the power distribution cabinet lift the cover on the right side of the lock and press the hidden latch, the handle will then pop out from the seat.
Power Cabinet Handle
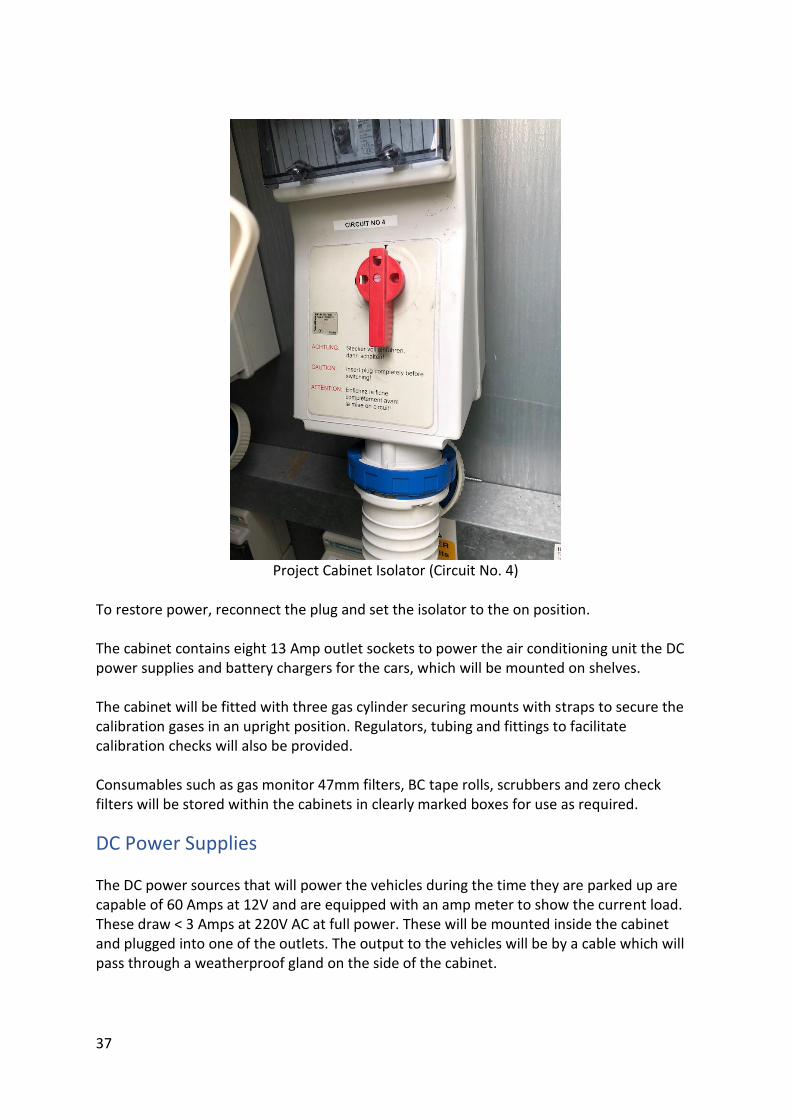
Turn the handle and open the door. The isolator and plug are shown below. Power can be turned off by switching the isolator to the off position, to be doubly sure you can also remove the plug by screwing the blue ring and pulling the plug out of the socket.
37
Project Cabinet Isolator (Circuit No. 4)
To restore power, reconnect the plug and set the isolator to the on position. The cabinet contains eight 13 Amp outlet sockets to power the air conditioning unit the DC power supplies and battery chargers for the cars, which will be mounted on shelves. The cabinet will be fitted with three gas cylinder securing mounts with straps to secure the calibration gases in an upright position. Regulators, tubing and fittings to facilitate calibration checks will also be provided. Consumables such as gas monitor 47mm filters, BC tape rolls, scrubbers and zero check filters will be stored within the cabinets in clearly marked boxes for use as required.
DC Power Supplies The DC power sources that will power the vehicles during the time they are parked up are capable of 60 Amps at 12V and are equipped with an amp meter to show the current load. These draw < 3 Amps at 220V AC at full power. These will be mounted inside the cabinet and plugged into one of the outlets. The output to the vehicles will be by a cable which will pass through a weatherproof gland on the side of the cabinet.
38
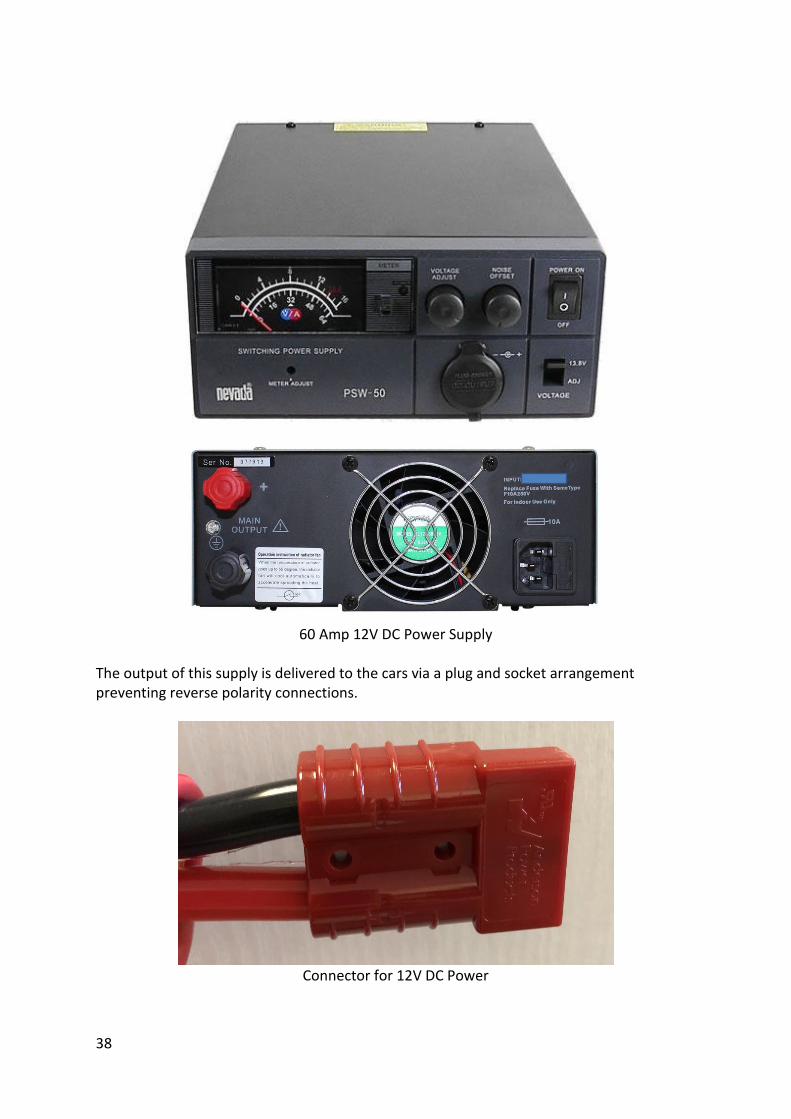
60 Amp 12V DC Power Supply
The output of this supply is delivered to the cars via a plug and socket arrangement preventing reverse polarity connections.
Connector for 12V DC Power
39
The cars must be connected to these power supplies prior to switching over the power selection switches in the car, so that the power is provided for overnight running. The matching connector is located behind the driver’s rear window and can pass through the window fitting for connection overnight. The cables will pass through the holes on the right side of the cabinet under the rain covers and will reach to each of the parked cars. PLEASE ENSURE THERE ARE NO TRIP HAZARDS BY RUNNING THE CABLES ALONG THE SPACE MARKERS WHERE NO PEDESTRIANS WILL NEED TO WALK.
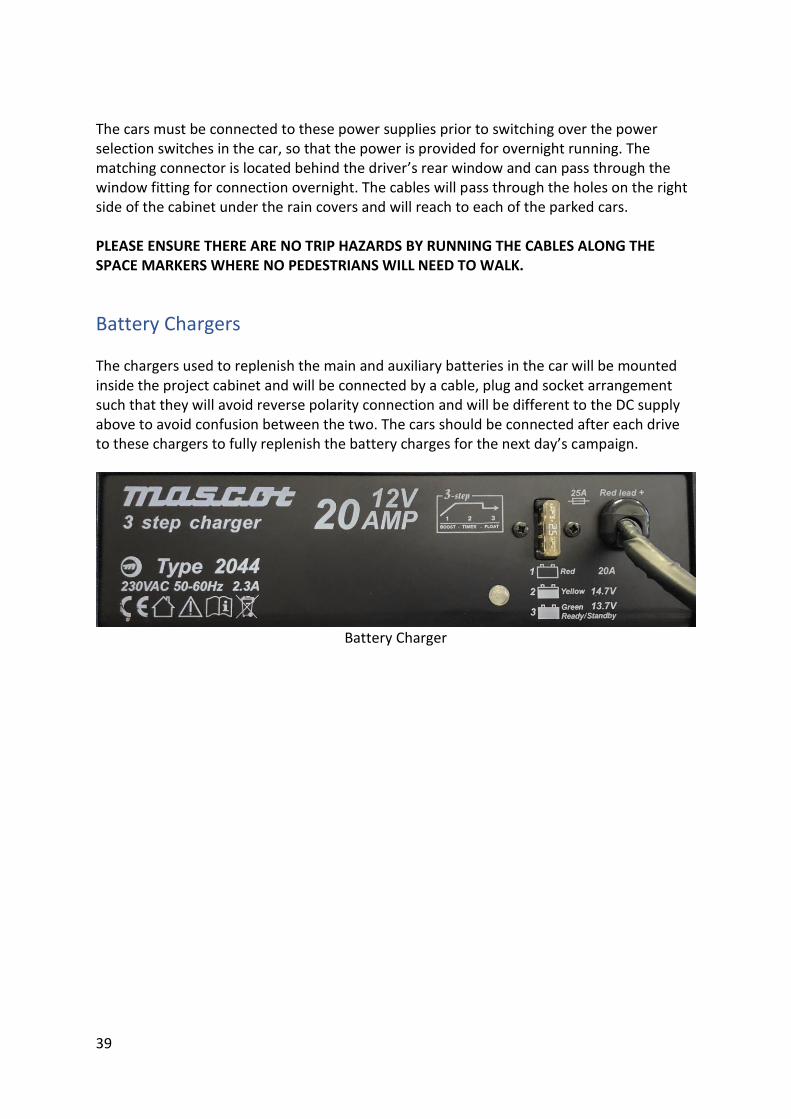
Battery Chargers The chargers used to replenish the main and auxiliary batteries in the car will be mounted inside the project cabinet and will be connected by a cable, plug and socket arrangement such that they will avoid reverse polarity connection and will be different to the DC supply above to avoid confusion between the two. The cars should be connected after each drive to these chargers to fully replenish the battery charges for the next day’s campaign.
Battery Charger
40
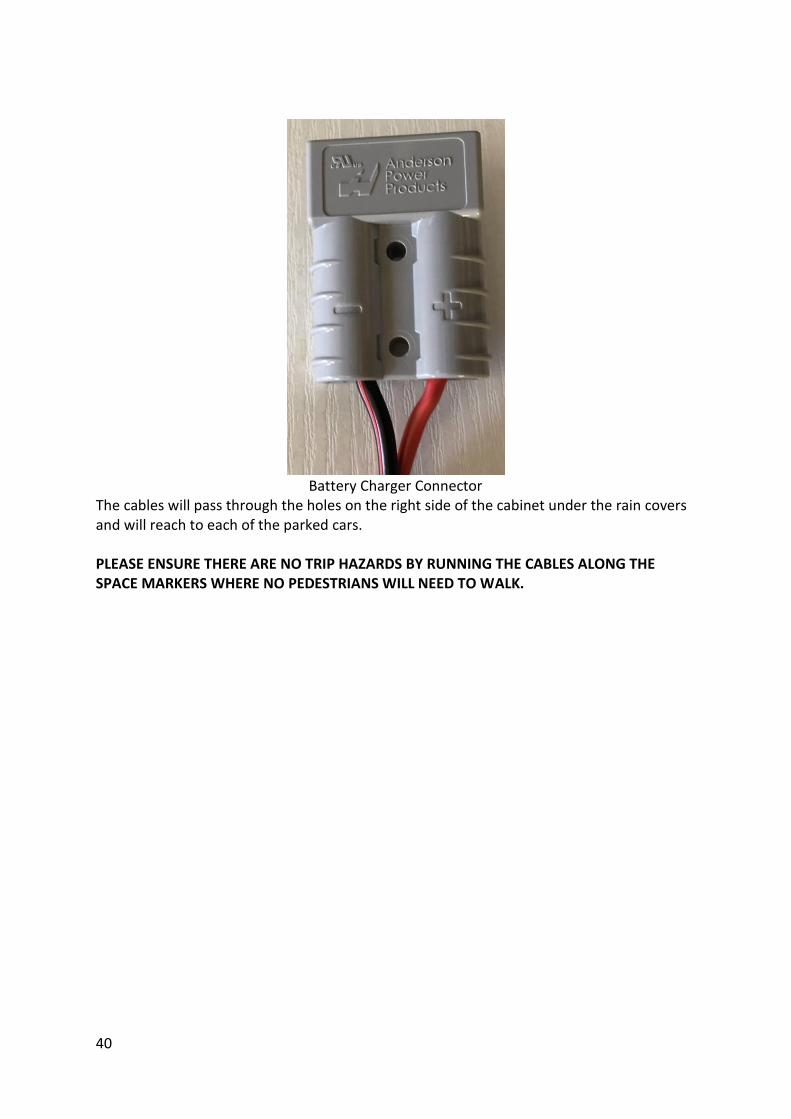
Battery Charger Connector
The cables will pass through the holes on the right side of the cabinet under the rain covers and will reach to each of the parked cars. PLEASE ENSURE THERE ARE NO TRIP HAZARDS BY RUNNING THE CABLES ALONG THE SPACE MARKERS WHERE NO PEDESTRIANS WILL NEED TO WALK.
41
Air Conditioner for Overnight Cooling of Equipment
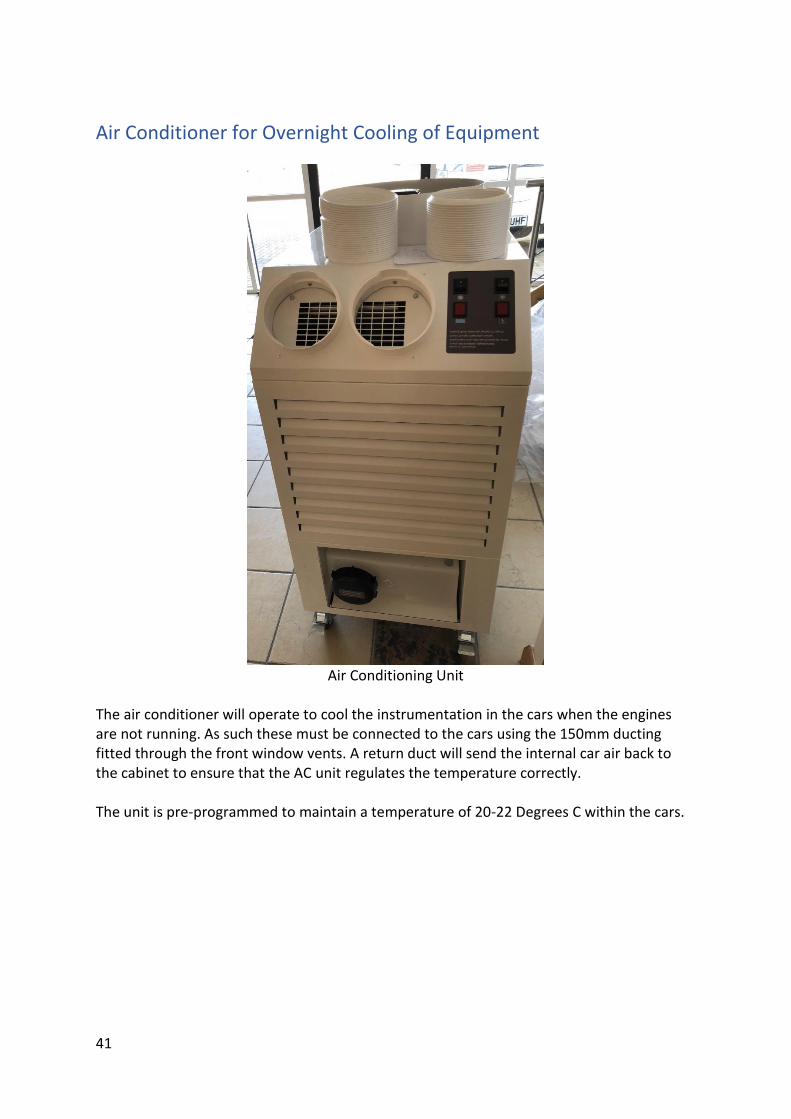
Air Conditioning Unit
The air conditioner will operate to cool the instrumentation in the cars when the engines are not running. As such these must be connected to the cars using the 150mm ducting fitted through the front window vents. A return duct will send the internal car air back to the cabinet to ensure that the AC unit regulates the temperature correctly. The unit is pre-programmed to maintain a temperature of 20-22 Degrees C within the cars.
Related Documents